the genetics of basal cell carcinoma of … sally de zwaan mbbs (hons), ... dhplc denaturing high...
TRANSCRIPT

1
THE GENETICS OF BASAL CELL CARCINOMA OF THE SKIN
Thesis
Submitted in fulfilment of the requirements for the degree of
Doctor of Philosophy in the Faculty of Medicine, University of Sydney
Dr Sally de Zwaan MBBS (Hons), BSc
Westmead Institute for Cancer Research at the
Westmead Millennium Institute, University of Sydney
Westmead NSW 2145 Australia

2
Statement of Originality
I hereby declare that this submission is my own work. To the best of my knowledge and
belief, no data presented in this dissertation has been previously published or reported,
other than the oral presentations that carry my name as co-author; experiments and
statistical analyses presented in this thesis were performed by myself, except in the
instances where due acknowledgement has been made in the text.
Sally de Zwaan
August 2007

3
Acknowledgements
I would like to thank all the research subjects who so kindly volunteered their time and
energy to make this research possible.
I also thank my supervisor Associate Professor Graham Mann for all his patience and for
the numerous hours he has spent in meetings with me while negotiating my sometimes
obsessive approach to work and research. The project coordinator Helen Schmid has been
a fantastic resource and friend to me and I thank her for her skills and boundless energy.
My associate supervisor Dr Margaret Stewart kindly took me under her wing and gave
me much needed advice on this project and also my career.
Dr Karen Byth was an endless source of knowledge and reassurance with regards to
statistical analyses and I am forever indebted to her for her assistance. I am very grateful
to Jenny Leary for all her education and assistance with my dHPLC screening. I would
like to thank all the other staff at the Westmead Millennium Institute who have given
their skills, time and friendship to me over the years, and without whom I would not have
been able to conduct my laboratory work. I wish to thank the Westmead Millennium
Institute and the National Health and Medical Research Council for their financial
assistance in the form of scholarships. I also thank the Skin and Cancer Foundation
Australia and Westmead Hospital for providing the infrastructure necessary for this
project.
I also wish to thank my husband Kirk Brown for his continued love and support, and for
his unwavering faith in me. This thesis is dedicated to him.
4
List of Abbreviations
A Adenine
a red-green reflectance
ACTH Corticotropin
b yellow-blue reflectance
BCC Basal Cell Carcinoma
BMPs Bone Morphogenic Proteins
bp Base pair
C Cytosine
CCR Coriell Cell Repository
CDKN2A Cyclin Dependent Kinase N2A
CHIP Children’s Hospital Informatics Program
ci Cubitus Interruptus
CI Confidence Interval
CIE Commission International de l’Eclairage 1976
CMV Cytomegalovirus
CYP Cytochrome P450
dHPLC Denaturing High Performance Liquid Chromatography
DMSO Dimethyl Sulfoxide
DNA Deoxyribonucleic acid
dNTP 2’-deoxynucleoside 5’-triphosphate
EBV Epstein Barr Virus
EDTA Ethylenediaminetetraacetic acid
EV Epidermodysplasia Verruciformis
G Guanine
Gli Glioma Associated Oncogene
GST Glutathione-S-Transferase
H20 Water
HapMap International HapMap Project
hh Hedgehog
5
HLA Human Leukocyte Antigen
HPV Human Papillomavirus
IVS Intronic variance sequence
KCl Potassium Chloride
L luminance
Leu Leucine
MAPK MAP Kinase gene
MC1R Melanocortin 1 Receptor gene
MgCl2 Magnesium Chloride
MM Malignant Melanoma
mM millimoles
µL Microlitres
MPP Multiple Presentation Phenotype
NBCCS Nevoid Basal Cell Carcinoma Syndrome
NIHPDR National Institute of Health Polymorphism Discovery Resource
NMSC Nonmelanoma Skin Cancer
NSW New South Wales
OR Odds Ratio
p14ARF p14 alternate reading frame
PCR Polymerase Chain Reaction
POMC Proopiomelanocortin
Pro Proline
PTCH Patched 1 gene
QLD Queensland, Australia
RCT Randomised Controlled Trial
RHC Red Hair Colour
RR Relative Risk
RTRs Renal Transplant Recipients
SCC Squamous Cell Carcinoma
SCFA Skin and Cancer Foundation Australia
SD Standard Deviation

6
SE Standard Error
smo smoothened
SNP Single Nucleotide Polymorphism
T Thymine
TGFβ Tumour Growth Factor β
Tris-HCL Tris (hydroxymethyl) aminomethane Hydrochloride
UK United Kingdom
USA United States of America
UVA Ultraviolet A radiation
UVB Ultraviolet B radiation
UVR Ultraviolet Radiation
VIC Victoria, Australia
WA Western Australia, Australia
WICVAR Centre for Genome Resarch at the Whitehead Institute, Cambridge MA
XP Xeroderma Pigmentosum
α Alpha
β Beta
γ Gamma
7
List of Figures Chapter 1
Figure 1.1 Observed rates and age-specific incidence curves with 95% confidence
intervals for BCC and SCC for males and females from 1995 Australia. ........................ 28
Chapter 2
Figure 2.1 Predicted dHPLC melting curve for PTCH exon 15, wild type. .................... 82
Chapter 3
Figure 3.1 Fitted curves for incidence rates for BCC and SCC in men and women in
Australia in 1996 (re-analysis of data provided from Staples et al (1)) .......................... 102
Figure 3.2 Estimated prevalence (with 95% CI) of SCC (A) and BCC (B) in Australian
men and women in 1996 (re-analysis of data provided from Staples et al (1)) .............. 104
Figure 3.3. Pedigrees for families 28840, 28816, and 29022 ......................................... 111
Chapter 4
Figure 4.1 Proband and sibling groups’ date of skin examination by month ................. 139
Figure 4.2 Date of skin examination by month for case-control pairs ............................ 140
Figure 4.3 Outer and inner arm luminance (A), red-green reflectance (B) and yellow-blue
reflectance (C) as measured by spectrophotometry, by season of examination ............. 142
Chapter 7
Figure 7.1 dHPLC elution profiles for PTCH exons 3, 7, 9, 13, 16, 17, 18, 20, 21, 22, and
23b s. 218
Figure 7.2 A-B dHPLC elution profile for PTCH exon 6, wild type (A) and variant (B).
218
Figure 7.3 A-B Reverse sequence exon 6 wild type (A) and variant (B) ....................... 219
Figure 7.4 A-B dHPLC elution profile for PTCH exon 8, wild type (A) and variant (B).
220

8
Figure 7.5 A-B dHPLC elution profile for PTCH exon 11, wild type (A) and variant (B)
220
Figure 7.6 A-B Reverse sequence exon 11 wild type (A) and variant (B) ..................... 221
Figure 7.7 A-D dHPLC elution profiles for PTCH exon 12, wild type (A), variant 1(B),
variant2 (C), and variant 3 (D) ........................................................................................ 222
Figure 7.8 A-E Forward sequence exon 12 wild type (A, C) and variants (B,D,E) ....... 224
Figure 7.9 A-B dHPLC elution profile for PTCH exon 23a, wild type (A) and variant (B)
224
Figure 7.10 A-B. Forward sequence exon 23a, wild type (A) and variant (B) ............... 225
Figure 7.11 A-B dHPLC profile for PTCH exon 2, wild type (A) and variant (B) ........ 226
Figure 7.12 A-B. Forward sequence exon 2, wild type (A) and variant (B) .................. 226
Figure 7.13 A-B dHPLC elution profiles for AMFS controls PTCH exon 2; wild type (A)
and variant (B) ................................................................................................................ 227
Figure 7.14 Forward sequence exon 2 AMFS control, variant ....................................... 227
Figure 7.15 A-B dHPLC elution profiles for PTCH exon 5, wild type (A) and variant(B)
228
Figure 7.16 A-B dHPLC elution profiles for AMFS controls PTCH exon 5; wild type (A)
and variant (B) ................................................................................................................ 229
Figure 7.17 Forward sequence exon 5 AMFS control, variant ....................................... 229
Figure 7.18 A-B Forward sequence exon 5, wild type (A) and variant (B) ................... 229
Figure 7.19 A-B dHPLC profile for PTCH exon 14, wild type (A) and variant (B) ...... 230
Figure 7.20 A-B Forward sequence exon 14, wild type (A) and variant (B) ................. 231
Figure 7.21 A-B dHPLC elution profiles for AMFS controls PTCH exon 14; wild type
(A) and variant (B) .......................................................................................................... 231
Figure 7.22 Forward sequence exon 14 AMFS control, variant ..................................... 231
Figure 7.23 A-D dHPLC elution profile for PTCH exon 15, wild types (A, B) and
variants (C, D) ................................................................................................................. 233
Figure 7.24 A-B. Forward sequence exon 15, wild type (A) and variant (B) ................ 233

9
List of Tables
Chapter 1
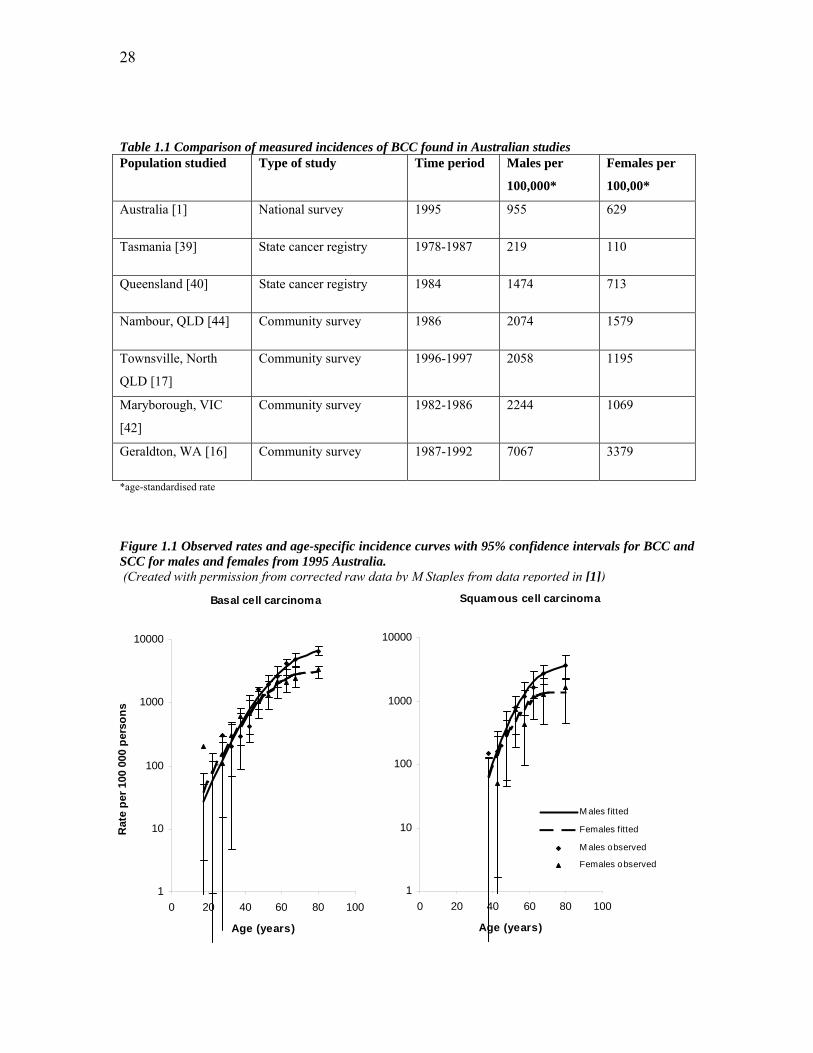
Table 1.1 Comparison of measured incidences of BCC found in Australian studies ....... 28
Table 1.2 Comparison of incidence BCC worldwide per 100,000 * ................................ 29
Table 1.3 Studies reporting HPV prevalence in NMSC lesions of immunocompetent
people 60
Chapter 2
Table 2.1 Primer sequences to amplify PTCH exons ....................................................... 76
Table 2.2 PCR Cocktail (52.8 µl total) ............................................................................. 77
Table 2.3 Family history of BCC, SCC, and MM (proband and first degree relatives) for
high risk subjects included for two temperatures of dHPLC screening ........................... 80
Table 2.4 Amplicon size and DHPLC conditions for PTCH fragments ........................... 81
Table 2.5 SNPs seen in probands that have previously been identified in SNP databases
with their identification numbers ...................................................................................... 83
Chapter 3
Table 3.1 Number of family members with BCC, SCC, and MM (proband and first
degree relatives) for each proband .................................................................................... 94
Table 3.2 Number of skin cancers in first degree relatives of early-onset BCC probands 95
Table 3.3 Number of BCCs in families affected by BCC alone (ie without any members
affected by MM or SCC) .................................................................................................. 96
Table 3.4 Maximum likelihood estimates for incidence of BCC and SCC in data from
Staples et al (2) using a Poisson regression routine ........................................................ 101
Table 3.5 Estimated prevalence (with 95% CI) of SCC and BCC in Australian men in
1996 (re-analysis of data provided from Staples et al (2)) .............................................. 103
Table 3.6 Estimated prevalence (with 95% CI) for SCC and BCC in Australian women in
1996 (re-analysis of data provided from Staples et al (2)) .............................................. 106
Table 3.7 Observed and expected prevalence of skin cancers in siblings and parents ... 108
of proband subjects by gender ........................................................................................ 108

10
Table 3.8 Relative risk of MM in first degree relatives of early-onset BCC probands .. 109
Table 3.9 All cancer diagnoses (excluding skin cancers) in first degree relatives of
probands 110
Chapter 4
Table 4.1. Age, Height, Weight paired t-tests ................................................................. 121
Table 4.2 Case control comparison of hair colour by self report and by identification of a
swatch of hair colour (from subjects’ answers to questionnaire) ................................... 122
Table 4.3 Case control comparison of eye colour (from subjects’ answers to
questionnaire) .................................................................................................................. 124
Table 4.5 Case control comparison of self- reported skin pigmentation (from subjects’
answers to questionnaire) ................................................................................................ 127
Table 4.6 Case control comparison of spectrophotometric measurements of outer and
inner arm skin colour ...................................................................................................... 127
Table 4.7 Case- control comparison of skin reactions to single, repeated, and general
exposure to the sun (from subjects’ answers to questionnaire) ...................................... 130
Table 4.8 Case-control comparison of presence of actinic keratoses, solar elastosis and
pterygium (as measured by skin examination) ............................................................... 132
Table 4.9 Case-control comparison of numbers of solar lentigines on the face, forehead,
upper limbs, and back and shoulders (as measured by skin examination) .................... 133
Table 4.10 Case-control comparison of freckling (from questionnaire answers and from
skin examination) ............................................................................................................ 135
Table 4.11 Case-control comparison of numbers of seborrhoeic keratoses (from skin
examination) ................................................................................................................... 137
Chapter 5
Table 5.1 PTCH SNPs observed and comparison of relative frequencies with database
population data ................................................................................................................ 153
Table 5.2 PTCH SNP frequency data comparison with Australian population sample . 157
Chapter 7

11
Table 7.1. Subjects excluded from analysis of comparison with population prevalence
(due to death or age>70 years) ........................................................................................ 200
Table 7.2 Self reported hair colour crosstabulation: by questionnaire and hair swatch
selection 210
Table 7.3 Single exposure to the sun (“sun sensitivity”) raw data ................................ 210
Table 7.4 Repeated exposure to the sun (“ability to tan”) raw data ............................... 210
Table 7.5 General reaction to the sun (“phototype”) raw data ....................................... 211
Table 7.6 Actinic Keratoses (AK’s) raw data ................................................................. 211
Table 7.7. Solar elastosis raw data .................................................................................. 211
Table 7.8 Solar lentigines raw data ................................................................................. 212
Table 7.9 Freckling raw data .......................................................................................... 212
Table 7.10 Seborrhoeic keratoses raw data ..................................................................... 213
Table 7.11 Month of examination crosstabulation (all subjects) .................................... 213
Table 7.12 Season of examination of case-control pairs ................................................ 213
Table 7.13 Comparison of Minolta Spectrophotometer and BYK Gardner
spectrophotometer L*a*b* readings on three subjects ................................................... 214

12
Table of Contents Statement of Originality ................................................................................................... 2
Acknowledgements ........................................................................................................... 3
List of Abbreviations ........................................................................................................ 4
List of Figures .................................................................................................................... 7
List of Tables ..................................................................................................................... 9
Table of Contents ............................................................................................................ 12
Publications arising from this thesis ............................................................................. 15
Reports in preparation for submission and publication ............................................. 15
Abstract 16
Chapter 1: Introduction and Background .................................................................... 19 1.1. Introduction ............................................................................................................................... 19 1.2. BCC and its management .......................................................................................................... 21 1.2.1. Cell of origin ............................................................................................................................. 21 1.2.2. Body sites affected .................................................................................................................... 21 1.2.3. BCC classification ..................................................................................................................... 22 1.2.4. BCC treatment ........................................................................................................................... 23 1.2.4.1. Treatment options ................................................................................................................. 23 1.2.4.2. Surgical treatments ............................................................................................................... 23 1.2.4.3. Non-surgical treatments ........................................................................................................ 24 1.3.1. World burden of NMSC ............................................................................................................ 25 1.3.2. Australian incidence and prevalence data.................................................................................. 25 1.3.2.1. Methods of data collection .................................................................................................... 25 1.3.2.2. Comparison of Australian incidence data ............................................................................. 27 1.3.3. International incidence and prevalence data .............................................................................. 29 1.3.3.1. International cancer registry data .......................................................................................... 29 1.3.3.2. Differences between Australian and International incidence data ........................................ 29 1.3.3.3. Similarities between Australian and international incidence data ........................................ 30 1.4. Epidemiology and Risk Factors ................................................................................................. 32 1.4.1. Ultraviolet radiation .................................................................................................................. 32 1.4.1.1. Aetiological role in skin cancer ............................................................................................ 32 1.4.1.2. Effects on DNA .................................................................................................................... 34 1.4.1.3. Effects on immune system .................................................................................................... 34 1.4.1.4. Pattern of UVR exposure ...................................................................................................... 35 1.4.1.5. Population differences in UVR and skin cancer risk ............................................................ 38 1.4.1.6. Sensitivity to UVR ................................................................................................................ 38 1.4.1.7. Personal sun protection ......................................................................................................... 40 1.4.2. Phenotypic subtypes .................................................................................................................. 41 1.4.3. Previous BCC ............................................................................................................................ 42 1.4.4. BCC risk and other malignancies .............................................................................................. 42 1.4.5. Other risk factors ....................................................................................................................... 42 1.4.6. Association with other UVR-associated lesions ........................................................................ 43 1.5. PTCH gene ................................................................................................................................ 43 1.5.1. PTCH as a tumour suppressor gene ........................................................................................... 44 1.5.2. The Hedgehog pathway ............................................................................................................. 44 1.5.3. Target genes .............................................................................................................................. 46

13
1.5.4. Naevoid Basal Cell Carcinoma (Gorlin) Syndrome - NBCCS .................................................. 46 1.5.5. Discovery of PTCH mutations as cause of NBCCS ................................................................. 47 1.5.6. PTCH inactivation in sporadic BCC ......................................................................................... 48 1.5.7. PTCH involvement in other tumorigenesis ............................................................................... 49 1.5.8. PTCH pathway in future therapies ............................................................................................ 50 1.5.9. PTCH polymorphisms and BCC ............................................................................................... 50 1.6. Familial Cancer Syndromes ...................................................................................................... 52 1.7. MC1R ........................................................................................................................................ 53 1.7.1. Melanin and pigmentation ......................................................................................................... 53 1.7.2. MC1R receptor .......................................................................................................................... 54 1.7.3. Forms of Melanin ...................................................................................................................... 54 1.7.4. MC1R variants .......................................................................................................................... 55 1.7.5. Red Hair Colour variants of MC1R ........................................................................................... 55 1.7.6. MC1R associations with skin cancer ......................................................................................... 56 1.8. p53 ............................................................................................................................................. 57 1.9. HPV ........................................................................................................................................... 58 1.10. Other Genetic Influences On BCC Susceptibility And Development ....................................... 61 1.11. Family and Twin Studies ........................................................................................................... 64 1.12. Aims and scope of this thesis .................................................................................................... 66
Chapter 2: Methods ........................................................................................................ 68 2.1. Patients and recruitment ............................................................................................................ 68 2.1.1. Ascertainment ............................................................................................................................ 68 2.1.2. Recruitment ............................................................................................................................... 68 2.2. Interviews and histological confirmation of cancers ................................................................. 69 2.3. Phenotyping ............................................................................................................................... 70 2.3.1. Skin examination ....................................................................................................................... 70 2.3.2. Skin examination recoding variables ......................................................................................... 71 2.3.3. Skin colour assessment .............................................................................................................. 73 2.4. DNA extraction ......................................................................................................................... 74 2.5. Genotyping of PTCH ................................................................................................................. 74 2.5.1. Exon and primer selection ......................................................................................................... 74 2.5.2. PCR protocol for amplification of PTCH exons ........................................................................ 77 2.5.3. Agarose gel electrophoresis ....................................................................................................... 77 2.6. dHPLC analysis of the PTCH gene ........................................................................................... 78 2.7. DNA sequencing of PTCH exons .............................................................................................. 83 2.8. PTCH gene SNP identification numbers ................................................................................... 83 2.9. Estimating Australian population prevalence of NMSC ........................................................... 84 2.9.1. Estimating prevalence from incidence ...................................................................................... 84 2.9.2. Comparison of the observed and expected prevalences within a sample .................................. 87 2.10. Estimating expected prevalence of malignant melanoma .......................................................... 89
Chapter 3: Incidence of skin cancer in families of BCC probands ............................ 90 3.1. Introduction ............................................................................................................................... 90 3.2. Results ....................................................................................................................................... 91 3.2.1. Subject selection and characteristics ......................................................................................... 91 3.2.1.1. Probands ............................................................................................................................... 91 3.2.1.2. Family members ................................................................................................................... 92 3.2.2. Skin cancer prevalence .............................................................................................................. 93 3.3. Comparison of NMSC prevalence in relatives with that in the Australian population .............. 99 3.3.1. Comparison of observed and expected prevalence of NMSC in first degree relatives .............107 3.3.2. Comparison of observed and expected MM in first degree relatives .......................................108 3.4. Other cancer diagnoses .............................................................................................................109 3.5. Pedigrees of affected families ..................................................................................................111 3.6. Discussion ................................................................................................................................113
Chapter 4: Case-control analysis: phenotypic risk factors for early-onset BCC .... 119

14
4.1. Introduction ..............................................................................................................................119 4.2. Results ......................................................................................................................................120 4.2.1. General characteristics..............................................................................................................120 4.2.2. Pigmentary factors ....................................................................................................................122 4.2.2.1. Hair Colour ..........................................................................................................................122 4.2.2.2. Eye Colour ...........................................................................................................................124 4.2.2.3. Skin Colour ..........................................................................................................................124 4.2.3. Propensity to burn, ability to tan, and phototype ......................................................................128 4.2.4. Sun exposure ............................................................................................................................132 4.2.5. Skin characteristics that are influenced by sun exposure .........................................................133 4.2.5.1. Solar lentigines ....................................................................................................................133 4.2.5.2. Freckling ..............................................................................................................................135 4.2.6. Seborrhoeic keratoses ...............................................................................................................137 4.3. Effect of date of examination on measurements .......................................................................138 4.4. Discussion ................................................................................................................................144
Chapter 5: Analysis of patched for germline mutations in clusters of BCC cases .. 151 5.1. Introduction ..............................................................................................................................151 5.2. Results ......................................................................................................................................152 5.2.1. dHPLC and sequencing analysis of the PTCH gene .................................................................152 5.2.2. Comparison with Australian population SNP frequency ..........................................................156 5.3. Limits on PTCH mutation frequency in early-onset BCC probands ........................................158 5.4. Discussion ................................................................................................................................158
Chapter 6: Discussion ................................................................................................... 163 6.1. Introduction ..............................................................................................................................163 6.1.1. Context .....................................................................................................................................163 6.2. Hypothesis 1: First degree relatives of people with BCC are at increased risk of NMSC compared with the general population, with a differentially greater risk of BCC than SCC ..................164 6.2.1. Estimation of population prevalence ........................................................................................165 6.3. Increased cancer risk in these families: possible causes? .........................................................167 6.3.1. Hypothesis 2: Identifiable pigmentary and sun exposure related risk factors are present in people with early-onset BCC compared with their unaffected siblings ..................................................168 6.3.2. Possible environmental causes .................................................................................................170 6.3.3. Hypothesis 3: Mutation in PTCH is responsible for some of the increased risk in early-onset non-syndromic BCC probands ................................................................................................................171 6.3.4. Other possible genetic causes ...................................................................................................172 6.4. Clinical relevance .....................................................................................................................173 6.5. Future research .........................................................................................................................174
Chapter 7: Appendices ................................................................................................. 175 7.1. Appendix: Clinical Protocol for Questionnaire and Examination ............................................175 7.2. Appendix: Protocol for DNA extraction from whole blood .....................................................186 7.3. Appendix: Nucleotide sequences of PTCH exons ....................................................................187 7.4. Appendix: DHPLC melting profiles .........................................................................................192 7.5. Appendix: Protocol for PCR-product purification....................................................................199 7.6. Appendix: subjects excluded from analysis .............................................................................200 7.7. Appendix: Pedigrees for all families with cancer affected first degree relatives ......................202 7.8. Appendix: Raw data .................................................................................................................210 7.9. Elution profiles PTCH exons without variants (exons 3, 7, 9, 20, 13, 16, 17, 18, 20, 21, 22, 23b) 215 7.10. Elution profiles and sequences for PTCH exons with variants .................................................218 7.10.1. Elution profiles and sequences for exons with Australian control data ...............................225
Chapter 8: References .................................................................................................. 234

15
Publications arising from this thesis
de Zwaan, SE, Mann, GJ “Familial Clustering of Early-Onset Basal Cell Carcinoma of the Skin”, Journal of Investigative Dermatology (In press) Oral Presentation and in Press, Proceedings of the Australasian Society for Dermatology Research, Annual Scientific Meeting, May 14, 2005 Journal of Investigative Dermatology (December 2005) Vol 125, 6:A1-A12
Reports in preparation for submission and publication de Zwaan, SE, Mann, GJ “A Review: The Genetics of Basal Cell Carcinoma of the Skin” Awaiting postgraduate supervisor review for submission to JID

16
Abstract BCC is the commonest cancer in European-derived populations and Australia has the
highest recorded incidence in the world, creating enormous individual and societal cost in
management of this disease. The incidence of this cancer has been increasing
internationally, with evidence of a 1 to 2% rise in incidence in Australia per year over the
last two decades.
The main four epidemiological risk factors for the development of BCC are ultraviolet
radiation (UVR) exposure, increasing age, male sex, and inability to tan. The pattern and
timing of UVR exposure is important to BCC risk, with childhood and intermittent UVR
exposure both associated with an increased risk. The complex of inherited characteristics
making up an individual’s ‘sun sensitivity’ is also important in determining BCC risk.
Very little is known about population genetic susceptibility to BCC outside of the rare
genodermatosis Gorlin syndrome. Mutations in the tumour suppressor gene patched
(PTCH) are responsible for this BCC predisposition syndrome and the molecular
pathway and target genes of this highly conserved pathway are well described.
Derangments in this pathway occur in sporadic BCC development, and the PTCH gene is
an obvious candidate to contribute to non-syndromic susceptibility to BCC.
The melanocortin 1 receptor (MC1R) locus is known to be involved in pigmentary traits
and the cutaneous response to UVR, and variants have been associated with skin cancer
risk. Many other genes have been considered with respect to population BCC risk and
include p53, HPV, GSTs, and HLAs. There is preliminary evidence for specific familial
aggregation of BCC, but very little known about the causes.
56 individuals who developed BCC under the age of 40 in the year 2000 were recruited
from the Skin and Cancer Foundation of Australia’s database. This represents the
youngest 7 – 8% of Australians with BCC from a database that captures approximately
10% of Sydney’s BCCs. 212 of their first degree relatives were also recruited, including
89 parents and 123 siblings of these 56 probands.

17
All subjects were interviewed with respect to their cancer history and all reports of cancer
verified with histopathological reports where possible. The oldest unaffected sibling for
each proband (where available) was designated as an intra-family control. All cases and
control siblings filled out a questionnaire regarding their pigmentary and sun sensitivity
factors and underwent a skin examination by a trained examiner. Peripheral blood was
collected from these cases and controls for genotyping of PTCH. All the exons of PTCH
for which mutations have been documented in Gorlin patients were amplified using PCR.
PCR products were screened for mutations using dHPLC, and all detectable variants
sequenced.
Prevalence of BCC and SCC for the Australian population was estimated from incidence
data using a novel statistical approach. Familial aggregation of BCC, SCC and MM
occurred within the 56 families studied here. The majority of families with aggregation of
skin cancer had a combination of SCC and BCC, however nearly one fifth of families in
this study had aggregation of BCC to the exclusion of SCC or MM, suggesting that BCC-
specific risk factors are also likely to be at work. Skin cancer risks for first-degree
relatives of people with early onset BCC were calculated: sisters and mothers of people
with early-onset BCC had a 2-fold increased risk of BCC; brothers had a 5-fold increased
risk of BCC; and sisters and fathers of people with early-onset BCC had over four times
the prevalence of SCC than that expected. For melanoma, the increased risk was
significant for male relatives only, with a 10-fold increased risk for brothers of people
with early-onset BCC and 3-fold for fathers.
On skin examination of cases and controls, several phenotypic factors were significantly
associated with BCC risk. These included increasing risk of BCC with having fair, easy-
burning skin (ie decreasing skin phototype), and with having signs of cumulative sun
damage to the skin in the form of actinic keratoses. Signs reflecting the combination of
pigmentary characteristics and sun exposure - in the form of arm freckling and solar
lentigines - also gave subjects a significantly increased risk BCC. Constitutive red-green
reflectance of the skin was associated with decreased risk of BCC, as measured by
spectrophotometery. Other non-significant trends were seen that may become significant
in larger studies including associations of BCC with propensity to burn, moderate tanning
18
ability and an inability to tan. No convincing trend for risk of BCC was seen with the
pigmentary variables of hair or eye colour, and a non-significant reduced risk of BCC
was associated with increasing numbers of seborrhoeic keratoses.
Twenty PTCH exons (exons 2, 3, 5 to 18, and 20 to 23) were screened, accounting for
97% of the coding regions with published mutations in PTCH. Nine of these 20 exons
were found to harbour single nucleotide polymorphisms (SNPs), seen on dHPLC as
variant melting curves and confirmed on direct sequencing. SNPs frequencies were not
significantly different to published population frequencies, or to Australian general
population frequencies where SNP database population data was unavailable. Assuming a
Poisson distribution, and having observed no mutations in a sample of 56, we can be
97.5% confident that if there are any PTCH mutations contributing to early-onset BCC in
the Australian population, then their prevalence is less than 5.1%.
Overall, this study provides evidence that familial aggregation of BCC is occurring, that
first-degree relatives are at increased risk of all three types of skin cancer, and that a
combination of environmental and genetic risk factors are likely to be responsible. The
PTCH gene is excluded as a major cause of this increased susceptibility to BCC in
particular and skin cancer in general. The weaknesses of the study design are explored,
the possible clinical relevance of the data is examined, and future directions for research
into the genetics of basal cell carcinoma are discussed.

19
Chapter 1: Introduction and Background
1.1. Introduction
Basal cell carcinoma (BCC) is the commonest cancer in fair-skinned populations. Non-
melanoma skin cancers (NMSC) make up 80% of all new cancers in Australia, presenting
an enormous individual and financial cost to Australians: treating these cancers
accounted for 42% of cancer related medical costs in 1993 and cost the Australian
community $280 million that year. Great gains have been made over recent decades
regarding the understanding of epidemiological associations and risks for BCC, with
much of this research based in Australia where the incidence is the highest in the world.
Yet, unlike other common cancers such as breast and colon cancer, very little is known
about population genetic susceptibility to BCC outside one rare familial syndrome. This
project studies early-onset cases and their relatives in an attempt to further elucidate the
causes of BCC, the commonest of cancers.
The term NMSC encompasses both BCC and squamous cell carcinoma (SCC): both are
common tumours derived from the same keratinocyte cell population in the skin,
although they have distinct biological and pathological features. There are other NMSCs
apart from these including Merkel’s cell carcinoma and atypical fibroxanthoma, however
as these are so rare, the term NMSC is usually used to refer to BCC and SCC only.
BCC is more than twice as common as SCC in Australia [1], and although very locally
destructive, rarely metastasizes. SCC does metastasize, usually after a long latency, and is
responsible for nearly all the 400 deaths per year attributable to NMSC. Neither cancer
has any direct biological relationship with malignant melanoma (MM), which arises
instead from neural crest-derived pigment producing cells that migrate into the skin
during early development.
Sunlight is known to be one of the major causes of all three types of skin cancer, through
the mutagenic effects of ultraviolet radiation (UVR). Other major epidemiological
associations include advancing age, male sex (especially in older groups), and a

20
decreased ability to tan. Pigmentary characteristics such as skin, hair, and eye colour also
contribute to risk. The timing and pattern of sun exposure are known to be important for
BCC risk: exposure in childhood and teenage years increase an individual’s later risk, and
intermittent exposure such as that received on summer holidays increases risk more than
continuous exposure such as that encountered in an outdoor occupation. Knowledge of
these important epidemiological associations allowed the Australian government to
mount an important public health preventative campaign in the early 1980’s called ‘slip,
slop, slap’ that encouraged awareness of the dangers of sun exposure, and the importance
of preventative measures (‘slip on a t-shirt, slop on some sunscreen and slap on a hat’).
This message appears to have permeated the community’s consciousness over the last
few decades: some attribute the decline of skin cancer in younger age groups to the
success of such campaigns [1].
Most chronic diseases are found to have both genetic and environmental aetiological
components, with multiple factors interacting in complex ways and often expressed as
risk phenotypes. There is no reason to believe why BCC would not be subject to the same
aetiological forces. Familial aggregation studies have been important bases to explore the
combination of inherited and exogenous risk factors in cancer [2]. Historically, there
seems to have been a reluctance to approach family studies of NMSC. Perhaps the
obvious importance of sun exposure in the aetiology of BCC has discouraged interest in
additional genetic influences, or it has been assumed that any familial aggregation of
BCC would merely reflect sharing of high-risk skin types. There are also methodological
difficulties in such studies. First, the high burden of disease makes mandatory reporting
of NMSC to cancer registries cumbersome, and makes it harder to demonstrate increased
incidence in relatives. Second, the fact that NMSC are often destructively treated reduces
the available data from histological confirmation, which is important in verifying cancer
reports in probands and relatives.
Although much work has been done on rare genodermatoses involving BCC, very little is
known about genetic susceptibility to BCC outside these settings. A small Australian
study looking at familial clustering of NMSC that noted apparent differences in
susceptibility to BCC versus SCC between NMSC pedigrees, suggesting differing genetic
21
influences [3]. However, there have been no larger-scale studies of this phenomenon.
Gorlin syndrome is one of the rare familial syndromes that has received research
attention, and involves autosomal dominant inheritance of marked susceptibility to BCC
and a range of developmental defects. Mutations in the cell growth regulatory gene
patched (PTCH), when present in the germline are responsible for this disorder. They
have also been found in a high percentage of sporadic tumours, suggesting a critical
involvement of this pathway in BCC tumour development generally. Furthermore, mice
with Gorlin syndrome-like knockouts of one copy of PTCH develop BCCs if exposed to
UVR, mimicking the human situation [4]. No studies have yet investigated whether
germline mutations or less highly penetrant variants of this gene might account for part of
non-syndromic BCC susceptibility in the general population.
1.2. BCC and its management
1.2.1. Cell of origin
BCCs are composed of lobules of basaloid cells with hyperchromatic nuclei and scant
cytoplasm that are pluripotential cells derived, or closely related to, basal keratinocytes
and follicular or epidermal stem cells [5]. The cell of origin of the basal cell carcinoma
has been contentious however typing of cytokeratins within tumour cells suggests a
follicular origin [6, 7]. Metastasis occurs rarely, at a rate of 1 in 1000 to 35000 and this
infrequency is probably due in part to the dependency of the tumour for a specific dermal
connective tissue stroma for its growth [8, 9].
1.2.2. Body sites affected
BCC virtually never arises in stratified squamous epithelium other than the skin and only
extremely rarely affects the mucosal surfaces of the body [10, 11]. All over the world,
BCC is most commonly seen on the skin of the head and neck [12, 13] and is almost
always more common in men than in women [14]. In fact, in light-skinned European-
derived populations the rate is between 18% and 40% higher in men than women [15,
16]. Recent studies in Australia have shown that rates of BCC may be higher in women
of younger age groups and in men of older age groups [1]. Detailed body-site specific

22
rates of BCC incidences are usually adjusted for the actual surface proportion covered by
the site to allow comparison and are thus also called ‘relative body densities’ [14]. The
relative body densities of BCC incidences in Australia can be seen in a large series from a
population based study in Townsville in Northern Queensland [17]. Highest densities of
BCC for both genders in this series were on the lip, orbit, and nasolabial fold. The next
highest were on the ear, nose, and cheek, then forehead, eyebrow, chin, jaw and pre-
auricular region. Following these regions, the neck and shoulders showed high densities
as did the posterior trunk in men and the sun-exposed surface of the arms in women. For
both genders the less sun-exposed body sites such as heels and thighs showed the lowest
incidence rates. For all body sites except buttocks and genital region, incidence rates for
women were lower than for men. Male preponderance was especially noticeable for the
scalp which may be reasonably attributed to hair loss in men giving rise to increased
exposure of the scalp to solar radiation. The near absence of BCC from the backs of the
hands has generally assumed to be due to the nature of the skin rather than to complex
effects of sun exposure.
1.2.3. BCC classification
There is no generally agreed classification of BCC in Australia however the commonest
subtypes reported are grouped by histological growth pattern [18]; nodular, superficial,
and morpheaform/sclerosing. BCCs are more likely to be nodular on the head and neck
and superficial spreading on the trunk and upper limbs [19, 20]. The most common is the
nodular type which appears as a dome-shaped shiny transluscent (pearly) papule with a
telangiectatic surface, often with surrounding actinic damage. It may become crusted,
ulcerated or pigmented, and usually has a firm consistency. Superficial BCC presents as
a bright pink, shiny, usually well defined erythematous scaly plaque, with a rolled edge
that shows slow centrifugal growth; areas of erosion or crusting may also arise in these
lesions. Morpheaform or sclerosing BCC tends to be more aggressive with a whitish
colour, poorly defined margins and an indurated consistency. It is often more difficult to
detect clinically and therefore more extensive upon diagnosis, often with wide subclinical
extension [21].
23
1.2.4. BCC treatment
1.2.4.1. Treatment options
BCCs often become more aggressive with recurrence and therefore the first priority in the
treatment of BCC is complete eradication of the tumour. This is done with the additional
goals of restoration of function and optimal cosmetic result. Shave or punch biopsies may
be obtained for a tissue diagnosis prior to destructive or excisional therapy, however in
practice, a prior tissue diagnosis is often not obtained. Surgical excision remains the gold
standard treatment against which other treatments are judged, and may be done with or
without Moh’s micrographic surgery. Other surgical treatments include curettage and
diathermy, and cryotherapy. Non-surgical treatment options include radiotherapy, topical
treatments such as 5-fluorouracil, photodynamic therapy, laser therapy, imiquimod 5%
cream, and intralesional/perilesional cytokines. The choice of therapy depends on the
characteristics of the individual tumour, patient preference, and the resources available
[19, 21].
1.2.4.2. Surgical treatments
Surgical excision can often be done by excising a simple ellipse around the tumour under
local anaesthetic with a margin of 3-4mm. Moh’s microscopically controlled excision is
considered the treatment of choice if the tumour is very large, recurrent, poorly defined,
or displays an aggressive histological pattern. It is also indicated for tumours in locations
associated with a high risk of recurrence such as the periorbital and facial areas, and for
those in areas of cosmetic importance. In this technique, frozen sections of the lesion
undergo histopathological examination during surgery allowing the entire excision
margin to be visualised. These are interpreted by the operator to better allow for complete
excision and to minimise removal of normal surrounding tissue [21]. Curettage and
diathermy give good results when reserved for small, well-defined, relatively superficial
tumours and its success is highly operator-dependent. Cryotherapy also tends to be used
on small superficial tumours. These destructive treatments are simpler than excision
however they prevent the histopathological verification of these cancers and also
verification of the adequacy of excision by visualization of tumour margins. Furthermore,

24
destructive treatments and the concomitant uncertainty of diagnosis make the estimation
of true incidence of this type of cancer very difficult. The resulting wound can take
longer to heal from curettage or cryotherapy than wounds resulting from excision. Five
year cure rates for primary BCC with surgical techniques are in the order of 95% [22,
23], and closer to 99% for Moh’s micrographic surgery on a primary tumour [24].
1.2.4.3. Non-surgical treatments
Non-surgical techniques are increasingly employed for the treatment of BCC.
Radiotherapy has been used on all stages of BCC with results comparable to surgery [25-
27]. It requires a number of weeks for receiving then healing, and is associated with some
long term sequelae including scarring and increased neoplasia risk. It is therefore usually
reserved for either: (a) extensive lesions where major surgery is not appropriate, or (b)
elderly patients in sites that are difficult to reconstruct and would be associated with
considerable morbidity, as the concerns regarding long term sequelae of radiotherapy are
small [28]. Radiotherapy can be also be used to complement surgery for cases of
persistent, recurrent or advanced tumours [5]. Topical treatments for BCC can give good
cosmetic results and can be effective treatment in superficial BCCs. 5-fluorouracil cream
is useful in the management of multiple superficial BCCs on the trunk and limbs [29].
Imiquimod functions as an immune system modulator and has recently shown to be
efficacious in the treatment of superficial BCC [27, 30, 31]. Its antitumour properties are
related to its stimulation of interferons and other cytokines, and of antigen presenting cell
function. Intralesional injection of recombinant interferon-α has been only partially
successful with reported cure rates varying between greatly [5, 31, 32]. Topical
photodynamic treatment may be useful for the treatment of superficial BCC where
standard surgical intervention poses difficulties, for example in patients who have
bleeding disorders or pacemakers. It involves the application of a systemic or topical
photsensitising chemical which leads to photodestruction when the skin is subsequently
exposed to light [33]. Laser therapy may offer some advantages in the precision of tissue
removal; however the majority of tumours are better managed by the less expensive
commonly available techniques. Intralesional interferon, photodynamic therapy, and laser
25
therapy should be considered investigational until confirmed and reproducible outcomes
are established in prospective trials [5].
1.3. Incidence
1.3.1. World burden of NMSC
Basal cell carcinoma of the skin is the most common malignancy in populations of
European origin including North America and Australia. The world burden of
nonmelanoma skin cancer (NMSC; BCC and squamous cell carcinoma or SCC) is
enormous: worldwide, NMSC is three times more common than lung cancer, the next
most common cancer [34]; the incidence of NMSC alone in the United States is
approximately equal to that of all non-cutaneous cancers combined [35]. Nonmelanoma
skin cancer is by far the most common cancer in Australia where it outnumbers all other
forms of cancer by 3 to 1. We spend more on treating NMSC than any other cancer,
costing the Australian health sector $280 million in 1993/1994 [36]. Australia has the
highest incidence of NMSC in the world with Western Australia having the highest ever
recorded incidence [16].
1.3.2. Australian incidence and prevalence data
1.3.2.1. Methods of data collection
Data on the prevalence and incidence of NMSC in Australia has been collected using a
variety of methodologies and with different subsections of the Australian population,
making the results very difficult to compare directly. These include national surveys,
state-based surveys, analysis of state-based cancer registry data, and smaller regional
community studies. One of the most important differences in methodology between
studies is the decision to include lesions treated destructively prior to histopathological
confirmation. The inclusion of lesions treated destructively reduces the risk of
underestimation of incidence figures, but it does so at an increased risk of inclusion of
misdiagnosed lesions; the misdiagnosis rate by experienced Australian dermatologists has
been estimated at as high as 41% for BCC and even higher for SCC [37, 38].

26
Periodic surveys such as the Australia-wide survey of NMSC by Staples [1] can provide
good estimates of incidence and prevalence in broad groupings of histological type and
population characteristics. The series by Staples et al [1] is the most recent and extensive
national survey of NMSC incidence in Australia giving figures for the incidence of BCC
and SCC age-adjusted to the World standard population. This series also allows data
analysis by individual States and by three zones of latitude. It looked at all cancers
reported over one year including those with a clinical diagnosis only. National telephone
surveys of households randomly selected by the electoral roll were performed in 1985,
1990, and 1995, and reports of treated skin cancer in the previous 12 months were
verified clinically and histopathologically if possible.
Cancer registries provide a sufficient sample size over extended time periods to permit a
detailed description of skin cancer patterns and time trends at specific body sub sites,
within narrow demographic categories and at different latitudes. Unfortunately, NMSC is
unsuitable for routine cancer registration in Australia due to the sheer numbers of them
within the Australian community, the way that many lesions are treated destructively
without histopathological confirmation, and the fact that this often occurs outside a
hospital setting. The only cancer registries to have recorded NMSC in Australia were
State based and have since ceased recording these cancers [39-41]. The Tasmanian
Cancer Registry collected data between 1978 and 1987 [39]. It only included
histopathologically confirmed lesions or those referred for radiotherapy, and only the first
BCC treated per year. The Queensland state-based study involved reporting all treated
NMSCs during a six month period in 1984 by general practitioners and hospital
outpatient departments in four representative areas of the State [40]. Cancers that were
confirmed histopathologically as well as those treated destructively were included.
Studies of small communities such as those performed in Townsville in Queensland [17],
Maryborough in Victoria [42], and Geraldton in Western Australia [16] have the
advantage of allowing longitudinal assessment including detailed skin examination and
risk factor assessments. Individuals can be screened and then followed up over time to
detect any incident malignant lesions. This method may give a more accurate assessment
of the incidence within that population than relying on subjects’ recall of treated lesions

27
because it less likely to miss unreported or undiagnosed tumours. It is an expensive and
time consuming method of data collection and therefore impractical for larger studies.
1.3.2.2. Comparison of Australian incidence data
Important information about the incidence, epidemiology and risk factors for BCC have
been obtained by combining information from all of these studies. A comparison of the
figures can be seen in table 1.1, with a summary of the national survey data in figure 1.1.
These incidence figures are alarmingly high and differ quite dramatically according to
location, sex, and methodology of the study. The figures from the carefully-screened
community studies include the largest reported incidence for BCC in the world to date
from Geraldton in Western Australia. Where incidence was measured over time it is clear
that incidence figures of both BCC and SCC in Australia have been increasing, with a
rise of 1 to 2% per year over the periods studies. Interestingly, the national survey
showed a slight decrease in incidence of BCC in people under 40 years of age which may
reflect changes in attitude and behaviour towards sun exposure, perhaps due in part to
extensive public health campaigns operating in Australia for the last 20 years [43].
All of the Australian studies show increasing incidence with age and higher incidences
for men than for women with the exception of a slightly larger incidence in women than
men in the under-40s. This sex difference may be influenced by differences in ultraviolet
radiation (UVR) exposure between younger men and women and/or by differences in rate
of presentation for medical treatment. All studies also showed higher incidence of BCC
than SCC, with incidence of BCC ranging from between 2.5 and 4 times the incidence of
SCC. A latitudinal gradient emerged within the national survey and between the State-
based surveys where incidence is clearly greater for populations closer to the equator.
28
Table 1.1 Comparison of measured incidences of BCC found in Australian studies Population studied Type of study Time period Males per
100,000*
Females per
100,00*
Australia [1] National survey 1995 955 629
Tasmania [39] State cancer registry 1978-1987 219 110
Queensland [40] State cancer registry 1984 1474 713
Nambour, QLD [44] Community survey 1986 2074 1579
Townsville, North
QLD [17]
Community survey 1996-1997 2058 1195
Maryborough, VIC
[42]
Community survey 1982-1986 2244 1069
Geraldton, WA [16] Community survey 1987-1992 7067 3379
*age-standardised rate
Figure 1.1 Observed rates and age-specific incidence curves with 95% confidence intervals for BCC and SCC for males and females from 1995 Australia. (Created with permission from corrected raw data by M Staples from data reported in [1])
Basal cell carcinoma
1
10
100
1000
10000
0 20 40 60 80 100
Age (years)
Rat
e pe
r 100
000
per
sons
Squamous cell carcinoma
1
10
100
1000
10000
0 20 40 60 80 100
Age (years)
M ales fitted
Females fitted
M ales observed
Females observed
29
1.3.3. International incidence and prevalence data
1.3.3.1. International cancer registry data
There are more cancer registries that include NMSC in countries other than Australia
which is likely to be due to the lower incidence and therefore reduced burden of
diagnosis and reporting. Despite this reduced burden, these registries sometimes still have
difficulty obtaining accurate records for NMSC [45]. The incidence figures for NMSC
determined internationally are universally lower than those seen in Australian populations
although a trend towards increasing incidence is also seen in these disparate populations.
Cancer registries that include data on NMSC have operated in Nordic countries[46],
Southern European regions [47], Slovakia [13], New Hampshire [48] and Southeastern
Arizona [49]in the United States, the Swiss canton of Vaud [50], Singapore[51], and the
Netherlands [52]. Smaller population based incidence studies have also been performed
on populations in every continent.
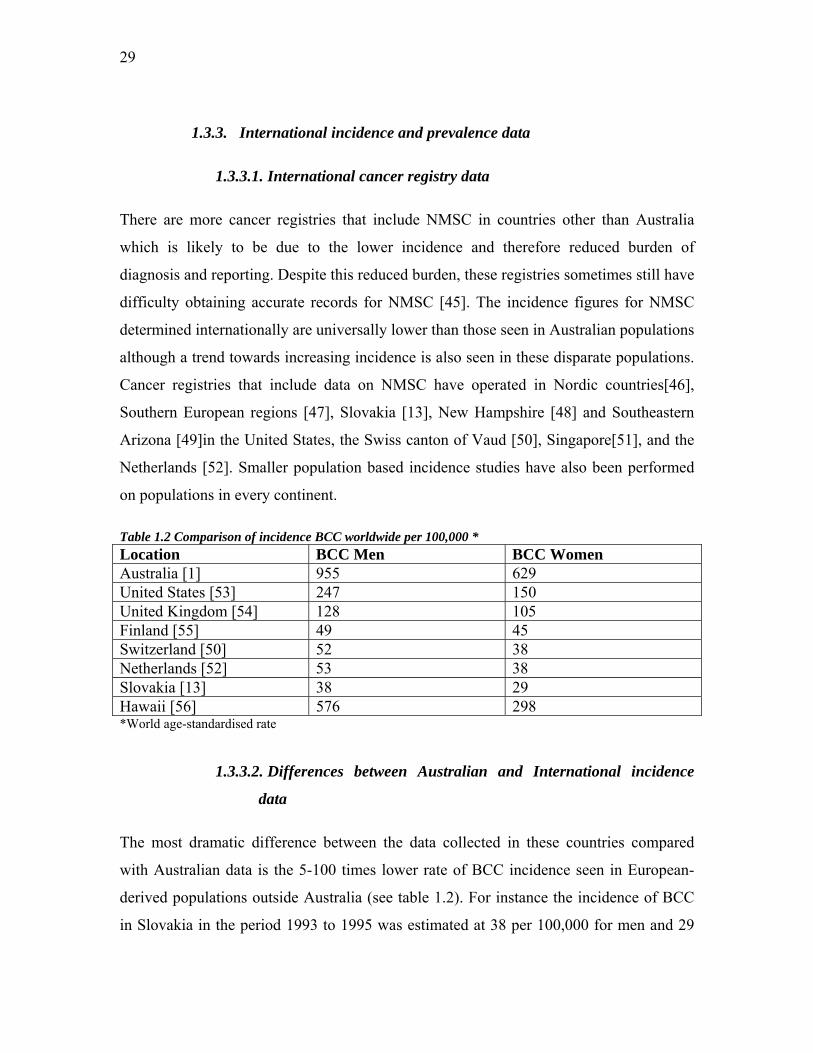
Table 1.2 Comparison of incidence BCC worldwide per 100,000 * Location BCC Men BCC Women Australia [1] 955 629 United States [53] 247 150 United Kingdom [54] 128 105 Finland [55] 49 45 Switzerland [50] 52 38 Netherlands [52] 53 38 Slovakia [13] 38 29 Hawaii [56] 576 298 *World age-standardised rate
1.3.3.2. Differences between Australian and International incidence
data
The most dramatic difference between the data collected in these countries compared
with Australian data is the 5-100 times lower rate of BCC incidence seen in European-
derived populations outside Australia (see table 1.2). For instance the incidence of BCC
in Slovakia in the period 1993 to 1995 was estimated at 38 per 100,000 for men and 29
30
for women [13]. In Finland from 1991 to 1995 it was 49 per 100,000 for men and 45 for
women [55]. We can compare this to the national Australian survey which reported a
combined (men and women) figure of 788 for the same time period. The Australian
national survey figures are likely to be larger than Australian cancer registry figures by a
factor of three. For BCC in 1985 Staples et al [1] report an overall age-standardised
incidence of 333 per 100,000 for greater than 37°S latitude. Tasmania lies in a region
entirely greater than 40°S latitude and the registry’s comparable total incidence figure
from a similar time in history was 111, exactly one third the nationally estimated figure.
We should therefore reduce the survey figure from 788 to 263 to make it comparable to
any cancer registry estimate. This estimate still remains at least five-fold larger than those
seen in Northern Europe.
Another difference between the Australian and international data on incidence is the
variation in male to female ratios. Most studies conducted on Australian populations
show greater male than female incidence, although there is evidence that this ratio is
reversing in younger cohorts [1, 57]. The only populations to record incidences greater in
women than in men are in Asia, and include studies on Korean [58] and Japanese
populations [12]. This may be due to differences in genetic or environmental risk factors
between the different populations, or more likely, a combination of both.
1.3.3.3. Similarities between Australian and international incidence data
Similarities also exist between Australian and international studies, the most striking of
which is a trend towards increasing incidence of BCC. Annual percentage increases of
three to 6% have been reliably recorded across a number of studies of European-derived
populations, with similar rates of increase for BCC and SCC [59]. The New Hampshire
Skin Cancer Study Group from the United States of America report an increase of more
than 80% in incidence from 1979 to 1994 in both men and women [60]. Incidence data
from the Eindhoven Cancer Registry in the Netherlands collected between 1973 and 2000
also show a rapid increase in incidence for both sexes with figures doubling over this
period [61]. Over these last few decades, figures have doubled in Sweden [62], increased
by 70% in men and 65% in women in Slovakia [13], and increased steadily in Singapore
at a rate of 3% per year for nearly 30 years [63].
31
It is clear that people with darker pigmentation have a lower incidence of BCC than
lighter-skinned people living in the same environment. For example, in Kenya the
incidence of BCC is 0.65 per 100,000 for residents with darkly pigmented skin and 585
per 100,000 for the European-derived Africans living in the same community, indicating
a substantially increased risk in the fairer-skinned residents [64]. In Qatar in the Middle
East, the incidence of BCC is also higher in Europeans living in there compared with
locally born residents [65]. Non-Hispanic whites in Southeastern Arizona have 11 times
the incidence of BCC compared with Hispanic whites [49].
An obvious trend that emerges from incidence studies is that the risk of BCC increases as
one gets closer to the equator. Within Australia, the nationwide survey by Staples et al [1]
gives the most conclusive evidence of this as it samples population from the entire
continent of Australia and looks specifically at this question. Over the decade studied, a
latitudinal gradient in incidence of BCC remains evident with a trend to significantly
higher BCC incidence as latitude decreases. Incidence in latitudes less than 29°S
remained approximately three times higher than those greater than 37°S, and in 1995 this
difference was 3.1:1 for men and 4.2:1 for women. Other within-study latitudinal trends
are evident in the Queensland state-based study [40] which shows a significantly
increased incidence of BCC in the Northern as opposed to the Southern parts of the State.
The only exception to this is the Gold Coast which has been estimated to have an
incidence similar to that of the Northern part of the State. This is likely to be due to the
complex nature of the Gold Coast population which is affected by the selective migration
of sun-lovers and by year-round tourism with the sun and beach the main attractions. The
differences in incidences quoted in the separate community studies also display a
latitudinal gradient although these studies are not ideally suited to looking at such
relationships due to the vast differences in collection and measurement between them.
This inverse relationship between latitude and BCC incidence is also evident overseas,
with greater incidences reported with lower latitudes in Sweden, Norway and Finland
[66]. The incidence in Southeastern Arizona is estimated to be between three and six
times higher than that in Northern parts of the country [49]. Japanese studies also show a
latitudinal difference however the numbers here are small [67]. Very convincing data
from the United States in the 1970s show a latitudinal gradient of NMSC incidence
32
across the country [53]. The study involved ten USA metropolitan populations from
47.5°N (Seattle) to 30.0°N (New Orleans) with a statistically significant gradient of
incidence rates inversely related to latitude across the cities studied.
NMSC is an immensely common and costly tumour to European-derived populations,
and incidence is increasing internationally at an alarming rate. A better understanding the
complex causes of these cancers should translate into valuable gains in the quality of life
of millions of people worldwide.
1.4. Epidemiology and Risk Factors
Much has been learned about epidemiological risk factors for BCC in the last few
decades. The main four epidemiological risk factors for the development of skin cancers
(including basal cell carcinomas) are ultraviolet radiation exposure, increasing age, male
sex, and inability to tan. Increasing age is one of the strongest risk factors for the
development of BCC, and as with other cancers, the risk of developing the disease each
year of life combines to give a rising cumulative risk. Increasing age could be considered
an indicator of cumulative exposure to environmental risk factors [39, 68-71]. In addition
to the the likely effect of cumulative UV exposure, increasing risk with age may reflect
the normal decline in DNA-repair capacity [72] and the effect of age on the ability of
immune surveillance to eliminate micro-tumours [73]. It is evident from international
incidence data already described, that in most countries at most points in time measured,
men have a greater incidence of BCC than women, but that in younger persons (< 40
years old) with BCC there may be a reversal of this sex ratio [1, 57, 74], a phenomenon
also seen in measures of melanoma incidence [75]. It is possible that the reduction in
incidence in the younger age groups has been influenced by public health campaigns on
skin cancer prevention.
1.4.1. Ultraviolet radiation
1.4.1.1. Aetiological role in skin cancer
Exposure to ultraviolet radiation (UVR) is associated with the incidence of all three
major types of skin cancer; BCC, SCC, and melanoma. As an aetiological factor in skin
33
cancer initiation, its role is inferred indirectly from a variety of sources. One of the first to
associate BCC with UVR exposure was Molesworth [76], a Sydney Dermatologist at
Royal Prince Alfred Hospital in 1927 who noticed that there was a much greater
incidence of “rodent disease” (as BCC was also known) in Australia as compared with
England. He noted that the Australian “loves the sunshine and glories in it and is very
liable to regard any precaution against sunburn as womanish and ridiculous”. He
suggested that sun exposure, not heat, dust, or trauma as previously hypothesized, was
the primary reason for this difference in incidence. He also put forward the hypothesis
that it is the ionizing radiation in sunlight that is responsible for causing these tumours.
There are abundant epidemiological associations between UVR and BCC linking them
aetiologically. Genetic diseases involving a greater sensitivity to UVR and a concomitant
risk of early onset NMSC include the autosomal recessive disorder xeroderma
pigmentosum [77]. People who live in areas of greater UVR exposure have a much
greater risk of developing skin cancers than those living in areas of lower UVR as can be
seen in the change of incidence with latitudinal gradients. BCC is commonest on
regularly exposed skin sites such as the head, neck and face, and there is a correlation
between BCC and sun-exposure-related conditions including; presence of actinic
keratoses, solar elastosis of the neck [78], solar lentigines [79] and degree of sun damage
to the backs of the hands as measured by cutaneous microtopography [80]. Actinic
keratoses are premalignant lesions occurring on chronically sun exposed sites that rarely
may progress to SCC if left untreated. Solar elastosis is a degenerative change in the
dermis on chronic sun exposed sites. It is characterized by thickened skin with yellow
discolouration and well-defined furrows. Solar lentigines are permanent macular areas of
brown pigmentation occurring after either acute or chronic sun exposure. There is
frequently a history of acute sunburn followed by the sudden appearance of large
numbers of these lesions. Childhood freckling is also associated with all three types of
skin cancer, however as this phenotypic characteristic is both genetically and
environmentally determined, it is difficult to determine whether one or both of these
factors are responsible for the association [78, 81]. Freckles also appear on sun exposed
sites but differ from lentigines by fading during periods without sun exposure.

34
1.4.1.2. Effects on DNA
While animal models exist for the capacity of UV radiation to cause SCC and melanoma,
there are no comparable models for BCC, other than a knockout mouse model for Gorlin
syndrome. Unfortunately, there is also no practical way that the action spectrum for skin
cancer can be measured directly in humans. There is however, direct evidence that UVB
wavelengths produce ‘UV signature’ mutations in certain genes in BCC lesions,
providing biological evidence to support the epidemiological observations. These are C to
T or CC to TT mutations at dipyrimidine sites and peak at around 300nm, suggesting that
this wavelength of UV (in the UVB range) may be effective in causing skin cancers in
humans [82]; this does not exclude a role for UVA light in causing BCC. The type of
DNA damage induced by UVA seems to differ from UVB in the proportion of nondimer
damage induced, such as DNA strand breaks which increase 100-1000 fold in UVA
compared to UVB irradiated cells [83, 84]. This is likely to be due to the important role
that reactive oxygen species play in UVA related damage to cells as opposed to the dimer
induction in UVB damage that follows direct DNA absorption [85]. The latitude gradient
seen in skin cancer incidence data around the world tends to be higher for SCC incidence
than melanoma, with the latitudinal gradient of BCC incidence between the two. There is
a correspondingly higher latitude gradient for UVB radiation than UVA radiation, an
association suggesting that melanoma and BCC may be more influenced by UVA than is
SCC [86]. Artificial sources of UV used for tanning primarily use UVA as this has been
thought to be the safer part of the UV spectrum. These devices have recently been shown
to be associated with increased risk of melanoma and SCC, but there is equivocal
evidence regarding the risk of BCC [87-90]. Recent studies in mice have contradicted this
earlier work with reports of UVA having no role in the initiation of melanoma [91].
1.4.1.3. Effects on immune system
UVR is likely to have an effect on the immune system that results in defective immune
surveillance. Animal studies show that multiple exposures to UVR have systemic effects
on the immune system with increased tolerance to transplanted UV-induced skin tumours
[92]. This susceptibility to tumour growth was explained by the action of suppressor T-

35
cells which arose in UVR treated animals and prevented immunological rejection of the
tumour [93, 94]. Localised, low-dose UVB radiation impairs the induction of contact
hypersensitivity in humans and susceptibility to this immune impairment may be
associated with skin cancer risk, as persons with a history of NMSC have been shown to
be more likely to display this UV-associated impairment than normal controls [95]. UVR
also has an effect on CD4/CD8 T-lymphocyte ratios in a study following high sun
exposure in the previous 18 months, although this ratio had no predictive ability for
development of BCC once sun exposure and previous BCC were accounted for [96]. The
overall increased incidence of BCC and SCC seen in immunosuppressed transplant
recipients is evidence for a role of the immune system in tumour surveillance and
development [97]. In a follow up study in Queensland of renal transplant patients with no
skin cancer prior to transplantation, over a 25 year period, 50% developed both BCCs and
SCCs with a cumulative incidence of BCCs approximately 25% at 10 years and 54% at
20 years [98]. Studies showing that transplant recipients develop more BCCs on the trunk
and arms than non-immunosuppressed patients supports suggestions that immune
surveillance has a role in determining tumour site [20].
1.4.1.4. Pattern of UVR exposure
It had long been believed that risk of NMSC was solely related to total cumulative dose
of UV. While the latitudinal gradient of risk would suggest this, the smaller gradient for
BCC compared with SCC suggests a differing relationship with amount of UV exposure.
Also, although BCC is commonest on the heavily exposed head and neck it also favours
sites such as the trunk which are not regarded as continuously exposed. It has emerged
that BCC has a complex non-linear relationship with sunlight exposure, the
characteristics of which have only begun to be unravelled over the last two decades. It is
apparent that the amount, timing and pattern of sun exposure causing BCC is quite
different from that causing SCC and more similar to that associated with melanoma.
Patterns of personal sun exposure are usually described with reference to total/cumulative
lifetime exposure, occupational/continuous exposure, or recreational/intermittent
exposure. Each of these may be estimated over the whole or part of life and new
validated questionnaires have evolved to enable this. One such questionnaire links recall

36
of sun exposure to a lifetime residence and work history calendar that subjects complete
[38, 80]. Creating a link with personal history has proven to be a useful tool, but does not
necessarily completely prevent differential recall bias.
The timing of sun exposure appears to be particularly important in BCC and melanoma
risk. In particular, childhood exposure to UVR seems to be more closely associated with
adult risk of BCC and melanoma than adult exposure. The link between BCC and
childhood exposure has been demonstrated with evidence that migration to Australia
before ten years of age is associated with the same risk of BCC as Australian-born
persons, and that this risk decreases three-fold with arrival to Australia at ten years or
older [78]. Also, there is evidence that having had two or more painful sunburns in
childhood or adolescence increases risk of BCC in later life more significantly than
sunburns in adulthood [81, 99]. International studies confirm these observations [47,
100]. Furthermore, there is good evidence that occupational UVA exposure after the age
of twenty years does not increase risk of BCC [81].
The pattern of personal sun exposure is also now known to be an important determinant
of a person’s risk to different types of skin cancer. Intermittent, recreational sun exposure
has emerged as the most important pattern of exposure for risk of BCC as compared with
continuous or occupational exposure, with a complex interaction of UV dose and
response. This was first suggested in a report on NMSC in Maryland watermen by
Strickland et al in 1989 [101] and subsequently by Hunter et al [102]. Both studies found
little evidence for increasing risk of BCC with increasing cumulative UV exposure,
suggesting a possible plateau in risk at higher total doses. This effect has been repeated in
a number of studies since these seminal studies [81, 99, 103]. Instead, risk of BCC has
been positively associated with intermittent sun exposure (especially in the teenage
years), hours of reported sun exposure on holidays or during water sports, and painful
sunburn, especially in childhood [81, 99, 103]. It has been speculated that the target
epithelial cells maybe highly mitotic and may require a relatively low threshold of total
solar radiation for malignant transformation [103]. BCCs tend to be of the superficial
subtype on the less exposed trunk and upper limbs [19, 20, 104] and occur at a younger
average age, suggesting that there also may also be a lower threshold for UV
carcinogenesis of the superficial subtype. People that tan poorly may have an increased

37
risk of BCC that plateaus with increasing intermittency of sun exposure while people
who tan well have a constant linearly increasing risk with increasing intermittent
exposure [81, 103, 105]. This supports a hypothesis of a plateau in the dose-reponse
curve for BCC in relation to UVR exposure. For those who tan well, the effect of tanning
and epidermal thickening protects their basal cells so that the effective dose received at
the basal cell level is on the rising part of the dose-response curve. Thus further exposure
correlates with increasing risk. For those who tan poorly, their basal cells receive a higher
effective dose with the same actual hours in the sun, placing them on the hypothesised
plateau of the dose-response curve.
Public education ‘skin cancer control’ programs have been operating in Australia for over
25 years and have focused on the importance of reducing sunlight exposure. A fall in
incidence of malignant melanoma and NMSC in younger people may be evidence that
these programs are starting to take effect [1, 106]. Despite these probable gains, the
prevalence of potentially risky amounts and patterns of sun exposure remains high in
Australia, with studies showing 10-20% of the population having had multiple blistering
sunburns, frequent sunbathing/intermittent exposure [99], or skin changes suggesting a
high cumulative amount of exposure [78]. Armstrong and Kricker [14] performed a
metanalysis of the studies published that have looked at different types of sun exposure
and sunburn (at any age) in relation to risk for the three types of skin cancer. Relative
risks (RR) for BCC with different types and amounts of sun exposure remained in the
low range, but was highest with sunburn (RR 1.40; 95% CI 1.29-1.51) and intermittent
sun exposure (RR 1.38; 95% CI 1.24- 1.54). Occupational exposure also had a low-range
association with risk (RR 1.19; 95% CI 1.07-1.32). Cumulative exposure was not
associated with any increased risk of BCC in this metaanalysis, supporting other evidence
of the lack of importance of this factor. Melanoma showed a somewhat higher risk
association with sun exposure than BCC but still in the low range: for intermittent
exposure the RR is 1.71 (95% CI 1.54- 1.90) and for sunburn it approaches a doubling of
risk (RR 1.91; 95% CI 1.69-2.17). SCC was the only type of skin cancer in this
metanalysis that displayed a strong association with cumulative sun exposure and
occupational exposure. Together these results suggest that a history of sunburn generally

38
reflects an intermittent pattern of sun exposure, and that intermittent exposure and
sunburn are risk factors for BCC development.
1.4.1.5. Population differences in UVR and skin cancer risk
The difference in incidence of NMSC between white populations (see section 1.3.3.1)
may intuitively be simply attributed to differences in UV exposure; however the reality is
likely to be more complex. Models relating BCC risk to increases in UV exposure
suggest that an increase of 1% of UV exposure increases the risk of BCC by 1.7% [107].
Hawaii has a climate similar to that of Australia, but the rates of BCC in white
populations in Hawaii remain much lower than in genetically similar populations in
Australia [44]. The differences in incidence seen between these varying populations
internationally are likely to be due to a complex interplay of different factors including
differences in UV exposure, genetic heterogeneity, skin types, and behaviour; in other
words, different combinations of genotype, phenotype and environmental risk factors.
This inconsistency in incidence underlies the urgency in further evaluating the genetic
susceptibility to NMSC.
It has been suggested that continued depletion of stratospheric ozone and climate change
may be involved in increased international skin cancer rates (see section 1.3.3.3) [108-
110]. However, the increases in incidence are not uniform internationally and cannot be
entirely explained by the depletion of the ozone layer. For instance, Norway has seen a
steady increase in skin cancer incidence over the last five decades with no concomitant
change in measured ozone levels [66]. The observed international increase in BCC
incidence is likely to be due to a complex interplay of a variety of factors including ozone
depletion, increased detection rates, change in type of clothing, increased mobility of
populations between countries and climates, and increase in outdoor recreation and sports
[111].
1.4.1.6. Sensitivity to UVR
Studies have found that the complex of inherited characteristics defining a person’s ‘sun
sensitivity’ (often measured by the ability to tan) is more important in mediating skin
39
cancer risk than the colour of the person’s skin. Of the three types of skin cancer, the
weakest evidence for an increase in risk with increasing fairness of the skin is seen for
BCC and the strongest for melanoma. It is important to note however, that there have
been difficulties in accurately measuring skin colour in an objective way, and that these
problems with measurement bias should affect the interpretation of associations found
through such studies [14]. Kricker et al [78] found that when sun sensitivity and skin
colour were analysed in a single logistic regression model with hair colour and eye
colour, only the ability to tan remained a significant predictor of risk for BCC. Most other
studies that have found an association between skin colour and skin cancer have not
controlled for the ability to tan [81, 112-114]. The seminal study by Kricker et al [78]
shows that the relative risk for BCC in persons with no ability to tan is 3.7 (95% CI 1.9-
7.3) times that of persons with the capacity for a deep tan, and that there is a gradient to
increasing risk with increasing sensitivity; meaning that ‘ability to tan’ is a moderate-
range risk factor, and more significant than that seen for sun exposure history. A gradient
of risk with sun sensitivity also exists for SCC and melanoma [115, 116]. All of these sun
sensitivity gradients were steeper than the corresponding gradients in risk with decreasing
skin colour, supporting a greater importance of the former with respect to skin cancer
risk. The poor association of risk of NMSC with density of pigmentation is also
supported by the similarly low rate of skin cancer amongst USA blacks and the lighter-
skinned Chinese people living in the same environment [14]. Many other studies confirm
that skin that burns easily and tans poorly is a risk factor for BCC [42, 47, 102, 117, 118].
Early studies on pigmentary traits such as hair colour and eye colour were contradictory
and suffered from methodological weaknesses relating to ascertainment, use of
inappropriate controls, and subjective measurements. Blond or red hair and light eye
colour were reported to increase the risks of skin cancer in several studies [47, 102, 117];
subsequently two Australian studies [112, 119] and an Irish study [120] found no
associations of skin cancer with hair or eye colour. Studies that have controlled for other
factors such as the ability to tan found that hair colour and eye colour were no longer
independent risk factors for BCC [78, 81].

40
Evidence that Southern European ancestry is protective for BCC is seen in a study where
any Southern European grandparent greatly reduces the risk of BCC (OR 0.05, 95% CI
0.01-0.42) [78], and this is likely to indicate the protection associated with the complex
combination of genetic, pigmentary and sun sensitivity traits of people of this ethnic
background. Celtic origin has been reported to be associated with skin cancer in limited
studies [121, 122] and has been refuted by others [78] who found no evidence of this as a
risk factor per se.
1.4.1.7. Personal sun protection
It is intuitively appealing to assume that personal sun protection measures such as the use
of hats, clothing and sunscreens should decrease skin cancer risk. Personal sun protection
is difficult to measure for several reasons; it is difficult to separate sun protection and sun
sensitivity as those with more sensitive skin are more likely to employ greater sun
protection measures, and in addition, it would be impossible to ethically support a
placebo sun protective measure given the strong inferential data suggesting that
appropriate sunscreen use protects the individual from skin cancer. Several randomised
controlled trials (RCTs) confirm the ability of sunscreen use to reduce the risk of SCC
precursors and probably also to reduce the risk of SCC [123-126]. The effect of
sunscreen use on BCC risk is more contentious: daily sunscreen use has been shown in a
randomized controlled trial to have no effect on the risk of BCC compared with the
discretionary use of sunscreen [126]. One observational study indicates a probable effect
of sun protection measures in adults in reducing risk of BCC in the short term [96]:
patients were determined to be in either a high or low sun exposure group based on their
personal protection measures, and this level of sun exposure over 18 months significantly
predicted the number of new BCCs independently of the number of previous BCCs.
Other large population-based prospective case-control studies have found that sunscreen
use is associated with an increased risk of BCC; also that BCC risk is higher on the head
and neck for those who had worn a hat compared with those who had not [99, 102, 121].
That sunscreen use in that study showed a similar within-study pattern of risk to hat use
suggests that any increased risk found was not due to any specific harmful effect of
sunscreens (such as chemical mutagenicity or increased exposure to longwave UV

41
radiation). These results should be interpreted with the awareness that protective
behaviours may be adopted after high risk subjects become aware of their risk status, and
that the risk of BCC may be associated with sun exposure behaviour prior to this
awareness. Firm conclusions cannot be made with respect to personal sun protection
measures.
The reported associations between melanoma and personal sun protection have also been
controversial with several studies showing increased risks of melanoma associated with
sunscreen use and ascribing this to the increased duration of UV exposure permitted by
the use of sunscreen. A population based case-control study in Sweden reported a slightly
increased risk of melanoma associatied with sunscreen use [127] and a retrospective
study on sunscreen use and naevus counts in children concluded that sunscreen use
increases the risk of melanoma [128]. A well designed RCT found that sunscreen use
may reduce the incidence of new naevi in children [129]. Following much debate [130]
[131-133] and criticism over the methodological weaknesses of the studies showing
associations between sunscreen use and melanoma [132, 134], the answer is still unclear.
1.4.2. Phenotypic subtypes
One research group has looked at BCC risk with respect to measurable phenotypic
differences within populations of individuals affected by BCC. They describe subgroups
of patients with BCC that fall into two major phenotypic classifications; the multiple
presentation phenotype (MPP) characterized by the presence of clusters of 2-10 new,
primary BCC tumours at any presentation [135]; and the truncal phenotype characterized
by an initial presentation with a BCC on the less sun exposed trunk as opposed to the
more frequently affected head and neck region [136]. Initial presentation with a truncal
tumour has been shown by this group to be associated with the development of
significantly more BCC lesions (0.13 per year) on this site compared with patients who
presented initially with head and neck lesions (0.03 per year) . The mean age of
presentation in patients with initial truncal lesions is younger (59.6 years) than those first
presenting with head and neck lesions (64.9 years), and these patients are also more likely
to have multiple BCCs at presentation. Together these results could point towards a

42
predisposition to BCC, and the authors propose that this predisposition is likely to be due
to a combination of genetic factors [137] and a reduction in immune surveillance [135].
1.4.3. Previous BCC
One of the strongest known risk factors for developing BCC is a history of one or more
previous BCC [39, 96, 138-141]. The highest risk period for a second BCC is within one
year of the previous BCC [141], and the three year cumulative risk is between 33 and
77% (depending on the number and type of lesions present), at least a 10-fold increase in
incidence compared with the rate in a comparable general population [142].
1.4.4. BCC risk and other malignancies
The association of BCC with the risk of other malignancies remains unclear, with some
studies showing no association and others showing inconsistent and small increased risks
of several internal cancers eg lung, thyroid, breast, testicular, cervix, and non-Hodgkin’s
lymphoma [143-148]. Patients diagnosed with BCC at an earlier age (before 60 years)
have been shown to be at greater risk of breast, testicular and non-Hodgkin’s lymphoma
[145]. An increased risk of malignant melanoma has been shown more consistently in
patients with prior BCC, and varies from 2.2 to 17-fold [144, 146, 149]. Shared risk
factors such as exposure to the same carcinogens eg UVR, and increased surveillance of
patients with prior BCC may contribute to this overlap in risk. Overall cancer mortality of
people with a history of NMSC may also be increased, with reported relative risks of 1.30
for men (95% CI 1.23- 1.36) and 1.26 for women (95% CI 1.17- 1.35) [150].
1.4.5. Other risk factors
Other well established risk factors for BCC include exposure to therapeutic ionizing
radiation [151-153], and arsenic [154-156] and scars [157, 158]. Smoking has been
identified as a risk factor for BCC however reports have been inconsistent and no firm
conclusions can currently be made [88, 100, 159, 160]. Dietary factors such as
antioxidant vitamin and fat intake may also play a role in risk [161, 162], although large
prospective studies have refuted this evidence [163, 164].
43
1.4.6. Association with other UVR-associated lesions
Numbers of melanocytic naevi are unlikely to be associated with individual risk of BCC
development. Melanocytic naevi are known to be caused by a combination of genetic
factors and environmental UV exposure, especially in childhood [129, 165] and are not a
good direct surrogate measure of the sun exposure required for BCC development. One
study suggested that numbers of larger moles (greater than 5mm in diameter) is
associated with an increased risk of BCC however the authors note that as subjects
performed their own mole counts, that there may have been some problems with
misclassification of solar lentigines as moles [78]. Studies from Australia and
internationally have noted the poor concordance between patients’ and doctors’ mole
counts [166, 167] further discounting the relevance of these results.
Seborrhoeic keratoses are probably related to sun exposure and so it is intuitive that their
presence may be associated with risk of skin cancer. This question has not yet been
adequately addressed and despite their frequency, very little is known about the nature or
causes of these benign cutaneous tumours. What is known is that seborrhoeic keratoses
may occur on any site of the body except palms and soles; occur more commonly in
populations with lighter skin than more darkly pigmented populations [168]; seem to
increase in frequency with age; and are more common on sun exposed areas of the body
[169]. The incidence of these lesions may have increased in Australian populations over
the last couple of decades, and seems to be greater in Australia than the UK [170, 171].
Together this data gives circumstantial evidence that UVR is involved in the aetiology of
these lesions, and does not discount the possiblility of genetic predisposition to these
lesions.
It is obvious that despite the growth in evidence of important epidemiological
associations with development of SCC and BCC, studies have not looked at this evidence
in the context of population-based family studies, and very little is known about the
probable complex interaction of these epidemiological risk factors with genetic factors.
1.5. PTCH gene

44
1.5.1. PTCH as a tumour suppressor gene
Much of the current understanding of the molecular genetics of BCC comes from the
identification of causative mutations in genes involved in familial cancer syndromes.
Perhaps the most significant of these to our understanding of BCC is the discovery of the
molecular basis of naevoid basal cell carcinoma syndrome (NBCCS), also known as
Gorlin syndrome. In the last decade, disruptions to the hedgehog signalling pathway have
been inextricably linked to human tumorigenesis, most notably in the pathogenesis of
BCC. It has long been known that this pathway is pivotal to embryonic development
[172, 173]. More recently it has been shown that this pathway also has a role in tumour
suppression, a function that is not surprising considering that many developmental genes
continue to function in regulation of cell growth and differentiation after embryogenesis.
Tumour suppressor genes are recessive oncogenes (or anti-oncogenes) whose
homozygous inactivation is required for their carcinogenic expression. In NBCCS
individuals are born with an inherited or germline mutation of one allele of the PTCH
gene. This causes an autosomal dominant syndrome of cancer predisposition, because the
remaining allele is likely to be lost in a proportion of susceptible cells through somatic
events. This is explained by the Knudson ‘two-hit hypothesis’ [174] which suggests that
the first ‘hit’, or mutation, is inherited; the second hit is the loss of the remaining allele
(or loss of heterozygosity) due to random somatic events causing mitotic nondisjuction,
deletion, or mitotic recombination. In NBCCS, each cell in the body carries the mutation,
so that only the one additional hit (eg mutations following UV radiation) is needed. The
same mutation is seen in sporadic BCCs, where both hits come from the somatic type of
mutation [175-178]. Individuals with NBCCS get a head start on the mutation of the
PTCH gene alleles so that BCCs occur earlier than in their non-syndromic counterparts.
1.5.2. The Hedgehog pathway
What is known about the Hedgehog pathway in vertebrates has largely been inferred
from studies in Drosophila melanogaster. The importance of this pathway is displayed by
its high degree of conservation through evolution [179]. Drosophila hedgehog works in
concert with other molecules to lay down the basic framework of the embryo,

45
determining anterior-posterior relationships (segment polarity) in developing structures.
A number of proteins are recognized to be important for the function of this pathway, and
in most cases a single gene encoding one of these proteins in Drosophila corresponds to a
family of related homologues in vertebrates.
The model for hedgehog signaling in vertebrates involves a receptor complex at the cell
surface made up of two transmembrane proteins PTCH and smoothened (smo) [180,
181]. While in Drosophila there is one hedgehog protein, in vertebrates there are three
homologues, named Sonic, Desert and Indian, although Sonic is the most commonly
expressed. There are also several PTCH homologs in vertebrates, with PTCH1 (PTCH)
likely to act as the major receptor molecule for all three forms of human hedgehog.
PTCH2 is a close homolog of PTCH [182] and its normal function is not known,
although there is evidence for its involvement in a medulloblastoma and also a BCC
tumour, and thus it may rarely act as a tumour suppressor gene in these tumours [183].
PTCH is a 12-pass protein that binds the protein hedgehog, whilst smoothened is
responsible for transducing the hedgehog signal, promoting transcription of downstream
target genes. In the absence of hedgehog binding, PTCH holds smoothened in an inactive
state, thus inhibiting signalling to downstream genes. When hedgehog (hh) binds to the
receptor complex (via PTCH), PTCH inhibition of smoothened is released and the signal
is transduced. It is unclear how these two surface molecules interact with each other;
directly (eg. via a conformational change), or indirectly (eg. via a catalytic mechanism
[184]).
Downstream mediation of the hedgehog signal in Drosophila occurs via a zinc finger
transcription factor, cubitus interruptus (ci). In the absence of a hedgehog signal, this
molecule forms a tetrameric complex at the microtubules with three proteins; fused,
suppressor of fused, and costal-2, causing cleavage of ci to generate a smaller fragment
that enters the nucleus and prevents transcriptional activation. In the presence of a
hedgehog signal, the tetrameric complex dissociates and inhibits the cleavage of ci
causing a full length ci to enter the nucleus and activate target genes [185]. Once again
the vertebrate has three homologues of the Drosophila ci, and these are named Gli1, Gli2
and Gli3 after their role in human gliomas [186].
46
1.5.3. Target genes
Studies have uncovered many possible target genes of the hedgehog pathway and these
are mostly genes involved in cell cycling, cell adhesion, signal transduction and
regulation of apoptosis [187, 188]. Hedgehog signaling has been shown to oppose cell
cycle arrest and increase the replicative capacity of cultured epithelial cells [189].
Extrapolation from target genes of Drosophila PTCH implicates several possible target
genes for humans: PTCH itself, signaling-protein members of the Wnt family (wingless
in Drosophila) and members of the TGFβ family (decapentaplegic in Drosophila)
encoding the bone morphogenetic proteins (BMPs) [190]. The upregulation of PTCH
expression is thought to cause the sequestration of hedgehog within the cells that it is
produced, thus limiting its further movement [191]. The Wnt and TGFβ family proteins
may be the main mediators of the hedgehog effect by both autocrine effects and paracrine
effects on surrounding tissues [192]. An expected consequence of Wnt overexpression in
BCC is increased levels of intracellular β-catenin, a protein that interacts with E-cadherin
and is important in cell adhesion [193, 194]. The TGFβ superfamily members have
diverse functions with effects on cell proliferation, expression of extracellular matrix
proteins, morphogenic movements, apoptosis, and differentiation [195]. BMPs in
particular play an important role at sites of epithelial-mesenchymal interaction and may
be important in mediating tumour invasion [196]. There is also some evidence that Gli1
and Gli2 may mediate the carcinogenic effect. The Gli1 gene has been previously shown
to act as an oncogene in brain tumours including medulloblastomas [186]. More specific
to its role in the hedgehog pathway, mouse models overexpressing Gli1 or Gli2 in the
epidermis develop skin tumours that resemble BCCs [197, 198].
1.5.4. Naevoid Basal Cell Carcinoma (Gorlin) Syndrome - NBCCS
NBCCS was first described in 1960 [199] and is a rare autosomal dominant disorder
characterized by three ‘major’ features - multiple basal cell carcinomas, dyskeratotic
palmar and plantar pitting, and odontogenic keratocysts. Many other developmental and
skeletal anomalies constitute ‘minor’ features and include overgrowth, epidermal scysts,
calcified falx cerebri, rib anomalies such as bifid ribs, cleft lip and palate, and spina

47
bifida occulta. Other tumours also occur with increased frequency in this disorder and
these include medulloblastoma, ovarian fibromas, meningioma, and rhabdomyoma [200].
The most common and debilitating of all the effects of this syndrome are the BCCs that
appear much earlier than in the normal population and can number more than 500 in a
lifetime [201].
As with other cancer susceptibility genes, a proportion of those carrying the mutation do
not actually develop the disease, and it is likely that the actual manifestation of tumours
depends on the constellation of gene and environmental risk factors particular to the
family and individual. For example, Australian sufferers develop BCCs at an earlier age
than their English counterparts, which is likely to be due to genetic susceptibility
interacting with risk due to ultraviolet light exposure in the different environments [201,
202]. In Australia, nearly 50% of Gorlin syndrome patients will have at least one BCC
removed prior to the age of 20, a rate 900- fold higher than the Australian population of
that age. By the age of 40, 95% of Australian Gorlin syndrome sufferers will have had a
BCC, some 300- fold higher than the rate of the general population [1, 201]. In the UK
Gorlin sufferers also have a 900- fold increased risk of developing BCC eventually,
however they do so at an older age, with only 4% having had a BCC removed by the age
of 20, a 50- fold increase compared with the population [54, 202, 203]. Some 15% of
Gorlin syndrome sufferers internationally do not manifest basal cell carcinomas at all,
and this figure is even higher for individuals from darker skinned races. The BCCs in
NBCCS may appear as early as two years of age, especially on the nape and most often
proliferate between puberty and 35 years of age [200]. The syndrome’s prevalence is now
agreed to be around 1 in 60,000 [204].
1.5.5. Discovery of PTCH mutations as cause of NBCCS
An interesting gene-hunting detective story unfolded over the last decade, finally
culminating in the discovery of the PTCH gene as the gene responsible for NBCCS.
Tumour suppressor genes are regulators of cell growth and differentiation, and murine
knockout models support their role in normal development [205] [206, 207]. The clinical
features and behaviour of neoplasms in NBCCS suggested that the underlying defect may

48
have been a tumour suppressor gene: tumours are multiple and occur relatively early
compared with sporadic tumours of the same type, and the syndrome also features
derangements in normal development. If the Gorlin syndrome gene functioned as a
classical tumour suppressor, then it should be homozygously inactivated in BCCs and the
other tumour types in this syndrome. Since we know that inactivation of a tumour
suppressor gene often occurs through mutation of the first allele (the first hit) and loss of
the second allele (the second hit) then we would expect to see loss of heterozygosity
(LOH) for polymorphisms surrounding the tumour suppressor gene.
Linkage analysis placed the gene on chromosome 9q22-31 [176, 208-212]; [213]. As part
of a collaborative positional candidate search, Hahn et al [213] then found as many genes
as possible that mapped to that area and searched for submicroscopic rearrangements in
patients. The PTCH gene was found to lie in the correct region of the chromosome and
patients were screened for mutations in this gene using single strand conformation
polymorphism analysis (SSCP) and DNA sequencing. Inactivating mutations within the
PTCH gene were found in six unrelated NBCCS patients. At almost the same time,
Johnson et al [214] postulated PTCH as a candidate for NBCCS and found two affected
individuals with inactivating mutations by SSCP. Furthermore, both of these seminal
studies also found the PTCH gene to be mutated in sporadic BCCs, implicating this gene
as a possible aetiologal necessity in the development of non-syndromic BCCs as well.
There is wide phenotypic variation in NBCCS-affected families, and screening of the
PTCH coding region also reveals a wide spectrum of mutations in NBCCS patients. The
majority of the mutations found are predicted to result in premature protein truncation
[175, 215], but the phenotypic variability does not seem to correlate with the nature or
location of the mutations in PTCH. Interestingly, even kindreds with identical mutations
differ markedly in their clinical features, suggesting that other genetic or environmental
factors may be important modifiers of developmental and neoplastic traits [215].
1.5.6. PTCH inactivation in sporadic BCC
Further evidence has since been found for the inactivation of PTCH as a major factor in
sporadic BCC formation. LOH has been found in over 50% of BCCs suggesting that in
49
many tumours one of the alleles is inactivated by deletion [176]. In some tumours
without LOH, direct sequencing reveals inactivating mutations in PTCH that have not
resulted in loss of the allele, suggesting that mutation of PTCH may be a necessary step
for tumour formation of sporadic BCCs [216]. It is likely that in tumours not showing
allelic loss, both copies of the gene have undergone point mutation. As with NBCCS
PTCH mutations, where mutations are found, most lead to premature protein termination,
and a number of them are C-to-T substitutions typical of ultraviolet B irradiation (UVB)
involvement. UVB radiation mainly produces DNA lesions between adjacent pyrimidines
(TT, CT, TC, CC) – the ‘UVB signature’ – and two types of lesions are produced; the
cyclobutane pyrimidine dimers and the 6-4 photoproducts [217-219]. However, more
than 50% of the PTCH mutations in sporadic BCCs do not have the UVB signature [216],
suggesting that environmental factors other than UVB exposure may be important in the
pathogenesis of BCCs (eg. UVA exposure). Mutations in PTCH have also been detected
in BCCs associated with Xeroderma Pigmentosum (XP) and in contrast to sporadic
tumours, XP tumours show a high rate of UVB signature mutations [77]. This is
consistent with the mechanism of XP whereby sufferers are unable to repair DNA lesions
such as mutations caused by UVB.
Despite an absence of an animal model for BCCs, tumours that closely resemble BCCs
have been demonstrated in PTCH1 +/- knockout mice, and exposure to UVR increases
the size and number of these tumours and shifts their histological features so that they
more closely resemble human BCCs [4]. Studies also show that sonic hedgehog signaling
is a component of T-cell responses to mediate CD4+ T-cell effector function and that
response varies in individuals, suggesting that PTCH alleles may be involved in the
effectiveness of immune surveillance [220].
1.5.7. PTCH involvement in other tumorigenesis
A number of key members of the hedgehog signaling pathway are involved in
tumorigenesis of a range of tumours. These include medulloblastoma, meningioma [221],
squamous cell carcinomas of the oesophagus [222], transitional cell carcinomas of the
bladder [223], and the benign skin lesions trichoepitheliomas [224]. Several of these
50
sporadic tumours are not involved in NBCCS therefore suggesting a wider role for PTCH
mutation in cancer pathogenesis. Other members of the hedgehog pathway have been
investigated for their role in tumorigenesis. Activating mutations of smoothened have the
same downstream effects as inactivating mutations of PTCH, and a number of
independent studies have detected activating mutations of smoothened in 10 to 20% of
BCCs [225, 226]. Mice overexpressing downstream members of the hedgehog pathway,
Gli1 or Gli2, develop BCC-like lesions [197, 198]. The Hh gene has also been
implicated, and overexpression in transgenic human and mouse skin leads to tumours that
are morphologically indistinguishable from BCCs [227, 228]. The induction of BCC with
the activation of this pathway alone in the absence of deliberate mutagenesis suggests
that activation of the hedgehog signaling pathway initiates BCC formation. The exact
mechanism of dysregulated hh signaling and increased risk of cancer development
remains to be elucidated. Interestingly, hedgehog pathway target-gene overexpression is
seen in all BCC subtypes suggesting that this dysregulation is an early rate-limiting step
in BCC carcinogenesis [177].
1.5.8. PTCH pathway in future therapies
A better understanding of the molecular processes underlying the pathogenesis of BCCs
may allow improvements in therapeutic success in its management. Therapies involving
inhibition of hedgehog signaling might be expected to suppress tumour growth.
Cyclopamine from the Veratrum lily species is know to inhibit hedgehog signaling and
reverse the effects of oncogenic smoothened and PTCH mutations [229]. There appears
to be no adverse effects of exposure of adults to this compound, and it is therefore
interesting as a basis for a possible therapeutic agent for tumours resulting from
dysregulation in hedgehog signaling.
1.5.9. PTCH polymorphisms and BCC
Some important preliminary work has been performed to investigate PTCH
polymorphisms in relation to BCC susceptibility. The consequences of polymorphisms of
exons of PTCH are unknown, and they may have functional implications. There is
increasing evidence that even silent substitution of nucleotides (effecting no amino acid

51
change) could influence mRNA processes, including affecting splicing accuracy or
efficiency [230]. This may be the case for the PTCH intronic SNP IVS 15+9 which may
form part of an intronic enhancer region, as the adjacent sequence conforms to a splicing
enhancer sequence identified in the growth hormone gene [231, 232]. Haplotypes may
confer increased risk through encoding of a protein with less efficient function by the
combination of the individual effects of the SNPs involved; alternatively they may be in
linkage disequilibrium with other significant variants.
One research group have found significant associations between certain PTCH
haplotypes and rate of development of further BCCs/year in English subjects who
initially developed a head/neck BCC [233]. Subjects were genotyped for two exonic
SNPs (exon 12: C>T 84 and exon 23: T>C 140) and one intronic SNP (exon 15: IVS
15+9). They found no association between rate of BCC accrual and these genotypes
individually, but did find an association with the haplotype of the exon 12/exon 23
variant, giving a relative risk of increased BCC accrual (BCCs/year for one year
following presentation) of 2.46 (95% CI 1.27- 3.97). The exon 23 variant causes a proline
to leucine change (Pro>Leu), and has been linked with breast cancer risk in women using
the oral contraceptive pill [234], suggesting that there is possibly an as-yet-
uncharacterised functional significance to this SNP. The haplotype association with BCC
accrual remained significant when controlled for UVR-exposure parameters, skin type,
gender and age at first presentation. These researchers also found an association between
the exon 15 variant/exon 23 wild type haplotype and decreased risk of BCC in a case
control analysis (OR 0.44, p=0.009), with significance unaffected by adult UVR
exposure. It should be noted that despite a claim to control for UVR-exposure
parameters, childhood and adolescent exposure were not included in the UVR-exposure
questionnaire for either study; and as it is evident that UVR exposure at these ages is
likely to affect later risk of BCC [78] and omission of this may overestimate the effect of
the genetic association in these analyses. Nevertheless, the importance of further
investigation into the significance of PTCH polymorphisms with respect to risk of BCC
is highlighted by these studies.

52
The exon 23 Pro>Leu SNP has been investigated further in a pilot study that examined
the association with populations of differing pigmentary characteristics and risk of
NMSC [235]. The Pro>Pro genotype was significantly less common in populations with
characteristically lighter skin colour (eg. Swedes) compared with populations with darker
skin colour (eg. African-Americans), suggesting a possible association between the
eumelanin-to-phaeomelanin shift and a shift from the Pro>Pro genotype to Leu-
containing genotypes. There was a non-significant trend for increasing Pro>Pro
frequency with increasing BCC severity (early-onset or multiple tumours). The authors
suggest that the failure to replace Pro in phaeomelanin-prevalent populations may be
associated with an increased population risk for BCC, and an increased individual risk for
multiple BCC.
No studies have investigated the involvement of other hedgehog pathway genes or indeed
any other possible BCC susceptibility genes in the general population outside of the
context of NBCCS.
1.6. Familial Cancer Syndromes
Several other familial cancer syndromes involve a predisposition to the development of
multiple BCCs. Bazex-Dupre-Christol syndrome was first described in 1966 [236] and is
a rare X-linked dominant syndrome characterized by congenital generalized
hypotrichosis, follicular atrophoderma and multiple early-onset BCCs occurring in the
second or third decade of life that have an aggressive course and are prone to relapse
[237, 238].
Rombo syndrome was first described in 1981 and is a rare familial disorder for which
inheritance is likely to be autosomal dominant [239-241]. This rare familial disorder has
skin changes that become evident at seven to 10 years of age with cyanotic redness and
follicular atrophy of the sun exposed skin, and later milia-like papules and telangectasias.
The skin changes become more pronounced with age and lead to a “worm-eaten”
appearance of the skin known as atrophoderma vermiculatum. BCCs develop around the
age of 35, depending on the exposure to other risk factors such as UVR.

53
The recessively inherited diseases; xeroderma pigmentosum (XP), albinism and
epidermo-dysplasia verruciformis, are also associated with the development of multiple
BCCs in association with a predisposition to NMSC in general. Patients with XP are
deficient in the repair of UV-induced DNA lesions and are characterized by their
predisposition to early-onset NMSC (average age 10) on sun-exposed skin [77, 242]. XP
cells are deficient in those gene-products required for catalyzing the incision step in
nucleotide-excision repair of damaged DNA [243, 244]. Albinos also develop BCC at an
increased rate compared with normally-pigmented persons, although SCCs are more
common in this group [245]. Epidermo-dyplasia verruciformis is a rare multifactorial
disorder involving genetic, actinic, and immunologic factors, with a susceptibility to
NMSC (mostly SCC) associated with the development of multiple pityriasis versicolor-
like lesions as well as flat wart-like lesions [246].
There have been several unrelated reports of non-syndromic hereditary BCC [3, 247]
suggesting the possibility of a genetic predisposition to BCC in addition to the rarer
familial syndromes described: these include cases exhibiting unilateral distribution
suggesting mosaicism [248-250]. The PTCH gene is an obvious candidate to contribute
to non-syndromic susceptibility to BCC, either via a different mutation spectrum or in the
absence of modifiers that are essential for the full Gorlin phenotype. The reports of
polymorphisms in this gene associated with number of BCCs per year and their possible
association with pigmentary factors have given weight to this possibility [231, 233, 235].
1.7. MC1R
1.7.1. Melanin and pigmentation
Cutaneous pigmentation results from the synthesis and distribution of melanin in the skin.
Melanin is a pigmented heteropolymer produced by melanocytes in the complex process
of melanogenesis, the regulation of which involves more than 80 genetic loci [251].
Melanocytes are specialized dendritic cells that reside at the dermoepidermal junction
and synthesise and package melanin within membrane bound organelles called
melanosomes. The melanosomes are distributed to the keratinocytes and the growing hair
shaft through the dendritic processes of the melanocytes. The keratinocytes then

54
differentiate, mature and migrate to the epithelial surface where the melanin creates light-
absorbing and light-scattering effects depending on its quantity and chemical composition
[252].
1.7.2. MC1R receptor
The MC1R receptor is one of five forms of melanocortin receptors (MC1R - MC5R) that
have distinctive tissue distribution and physiologic roles. All are activated by the
melanocortins, a family of structurally-related peptide hormones derived from one
precursor protein, proopiomelanocortin (POMC). These include corticotropin (ACTH)
and the α (alpha), β (beta), and γ (gamma) melanocyte stimulating hormones (MSHs)
[253, 254]. The melanocortin-1 receptor (MC1R) is a G-protein coupled receptor with 7
transmembrane spanning domains. Although melanocytes have the highest density of
these receptors, it is expressed in many other cell types in the skin including
keratinocytes, fibroblasts, endothelial cells and antigen presenting cells [255]. Ligand
binding activates the enzyme tyrosinase gene expression and activity, melanocyte
proliferation and melanocyte dendricity [256-258].
1.7.3. Forms of Melanin
Melanin exists in two differing forms within human skin, brown-black eumelanin and
yellow-red pheomelanin. These forms have differing unique biochemical and
ultrastructural properties within melanosomes. The eumelanosomes are large and
elliptical with a highly organized matrix, containing high molecular weight, poorly
soluble melanin. The pheomelanosomes in contrast are small and spherical with an
unstructured particulate matrix containing low molecular weight, soluble pheomelanin
[259]. MC1R expression appears to be centrally important to the regulation of
melanocytes, including induction of photoprotective melanisation in response to UV
exposure.
The ratio of eumelanin to pheomelanin as well as total melanin content is higher in
persons with more darkly pigmented skin compared with those of lighter pigmented skin
[260]. Pheomelanin levels are generally highest in very red hair, while eumelanin

55
predominates in the hair of most other colours [261 review]. Eumelanin is thought to be
more photoprotective than phaeomelanin because it is more resistant to degradation by
UV and more efficient at scavenging reactive oxygen radicals produced by exposure to
UV [262]. Eumelanosomes also form supranuclear caps that shield the nuclei of cells
from UV radiation therefore conferring additional photoprotection [263]. Pheomelanin, in
addition to absorbing a narrower range of wavelengths than eumelanin, is photolabile and
generates oxidative stress on irradiation, leading to less efficient photoprotection and
increased photosensitivity [251].
1.7.4. MC1R variants
Following the first report of an association between germline variant MC1R alleles and
red hair [264], human MC1R variants have been found to occur in more than 50% of
individuals in white populations [265-267]. There are over 30 variant alleles reported in
European-derived populations [264, 266-273], with several of these found to be
associated with red hair and fair skin. There is in fact, such a great deal of MC1R coding
diversity that it is difficult to identify a wild type. Several groups have looked at a
combination of gene sequences to deduce a consensus sequence [266, 268, 273], using
phylogenetic analysis of MC1R gene sequences in geographically diverse populations
[272].
1.7.5. Red Hair Colour variants of MC1R
The three most common red hair colour variants account for 60% of all cases of red hair-
Arg151Cys, Arg160Trp, and Asp294His, with individuals carrying two of these alleles
almost always having red hair [266]. The frequency of these variants differs according to
the population; studies show the allele frequency of these three types together is
approximately 20% in Australians [252, 274] and nearly 50% in an Irish cohort [266].
These three Red Hair Colour (RHC) alleles give rise to loss-of-function mutations
although some studies suggest that they may retain some function and that red hair is not
the null phenotype [275, 276]. The RHC alleles also contribute to fair skin and poor
tanning response to UV, giving rise to the ‘RHC phenotype’. These phenotypic features
are explained by increased phaeomelanin in the skin and hair and/or decreased capacity

56
to produce eumelanin, creating a red colour in the hair shaft and reduced skin
photoprotectivity [264]. There is also evidence that RHC alleles impart a heterozygote
effect: one study shows that presence of one allele increases the odds of having red hair
nine- to 16-fold and fair skin five- to seven-fold [266]. The weaker association with skin
colour in this study may have been due to the limitations imposed by the use of the
Fitzpatrick classification of skin type used in its determination.
It is clear that MC1R variant-allele presence is necessary for the RHC phenotype but not
sufficient. Individuals with identical MC1R variants may nevertheless display different
hair colour (eg auburn, red or strawberry blonde): even monozygotic twins (sharing the
same genotype) have been found to differ in their hair colour [266] [268, 277]. Similarly,
the exact relationship between skin phototype and pheomelanin/eumelanin production in
the human epidermis is not straightforward [260, 278], although it appears that activation
of MC1R is involved in switching between eumelanogenesis and pheomelanogenesis
[279]. Thus other loci must be involved in creating the RHC phenotype, perhaps by
moderating the expressivity of MC1R variants or masking of the trait.
1.7.6. MC1R associations with skin cancer
The involvement of the MC1R locus in pigmentary traits and the cutaneous response to
UVR makes it an intuitively relevant candidate gene for susceptibility to cutaneous
malignant melanoma and nonmelanoma skin cancer. MC1R gene variants have been
shown to be associated with melanoma independent of their association with
pigmentation phenotype giving two- to four-fold increased risk [274, 280, 281]. The large
number and low frequency of MC1R alleles make assessment of this gene in the
pathogenesis of skin cancer difficult, and initial explorations of a possible link with
NMSC yielded inconsistent results [266] [282]..
More convincing evidence for associations between MC1R genotype and NMSC has
since been demonstrated. Box et al [283] demonstrated an association between higher
NMSC risk individuals and the nine commonly reported MC1R variants, an association
that persisted after adjusting for pigmentation phenotype. A larger case-control study
[267] replicated these findings and extended them to include most of the other known

57
MC1R variants. Carriers of any two variant alleles in this study were at increased risk of
BCC and SCC. Carriers of one variant allele had half the risk, confirming the
heterozygote effect of this gene. Unfortunately, the MC1R studies involving NMSC to
date have suffered from a lack of reliable and objective consensus measure of measuring
constitutive skin colour [284, 285]. These results do however indicate that MC1R variant
status may be an independent risk factor for the development of BCC: this needs to be
further explored. Also, other genes and proteins may be involved in modifying the
expression of MC1R variants. For example, it is possible that PTCH polymorphisms such
as exon 23 Pro>Leu (see section 1.5.9) or mutations in this gene could interact with
MC1R variant status to affect NMSC risk.
1.8. p53
The gene P53 encodes the protein p53 which has been termed “guardian of the genome”.
The gene is located on chromosome 17 band p13, and the protein is a 53 kd nuclear
phosphoprotein [286, 287]. Mutations of this gene occur in a wide variety of tumour
types and are in fact the most commonly detected genetic abnormality in human cancer
[288]. The protein is known to be associated with malignant melanoma susceptibility
through its association with the protein p14ARF and the CDKN2A locus [289]. The p53
protein functions to sense genotoxic injury and arrest cell division in late G1 of the cell
cycle, allowing DNA repair to occur before replication. In the case of extensive DNA
damage, it induces apoptosis in an effort to eliminate defective and potentially malignant
cells. Mutated p53 can act in one of two ways to contribute to malignancy; as a dominant
negative oncogene by affecting normal p53 activity [290] or as a tumour suppressor gene
by creating a nonfunctioning p53 protein in the presence of further mutational events
[291].
A study by Rady et al was the first to identify P53 mutations in BCC, finding 50% of 14
tumours carrying a P53 mutation, and was the first to give evidence that these are likely
to be UV induced mutations [292]. Studies following this found mutations from between
44% and 100% of tumours [8, 84, 291, 293-296], and showed that the UVB portion of the
spectrum is likely to be more important than UVA in p53 mutations [84]. Mutations in

58
NMSC occur at several hotspots that are much less frequently mutated in internal
cancers, and most of them contain the dipyrimidine transition mutation that indicates UV
induced origin [293, 297, 298]. Most of these hotspots are localized in an area of the gene
that is evolutionarily conserved [299], suggesting that the mutations are likely to have
functional significance and therefore act as causative mutations. Skin-cancer-specific
hotspots have been seen to be repaired more slowly by nucleotide excision repair than
those at surrounding positions on the same strand, supporting a role in tumour induction
[300] [72]. There are however, likely to be other mechanisms at work in BCC to
inactivate P53, some tumours without P53 coding sequence mutations have been found
to harbor aberrant p53 protein stability [293].
BCC case subjects have been reported as three times more likely to have a P53 mutation
in normal skin taken from the mirror-image site to the cancer site, suggesting that P53
mutation is an early occurrence that may predict the risk of BCC development [301]. P53
point mutations may occur in cells during sun exposure early in life, which then over
many years acquire other genetic alterations required for BCC [293]. This multiple-
mutation concept is supported by the finding that multiple samples from individual
tumours have at least one P53 mutation in common, suggesting that the tumour is derived
form a single cell with a unique P53 mutation as an early event.
It is also possible that there is a genetic interaction in tumour suppression between PTCH
and P53, with evidence from PTCH +/- mice that concomitant loss of P53 dramatically
accelerated tumorigenesis in medulloblastomas [302]. A germ line polymorphism in P53
has also been noted and its contribution to HPV induced skin cancer remains
controversial: polymporphisms may lead to increased susceptibility of the p53 protein to
HPV-mediated degradation [303, 304].
1.9. HPV
While the aetiologic role of HPV in anogenital cancer is well established, the
epidemiological, molecular and functional data required to fulfill the World Health
Organisation criteria for viral carcinogenesis have yet to be met in NMSC [305]. Fifteen
epidemiologically defined high risk mucosal HPV types have been found to cause a

59
persistent infection of the cervix as a necessary risk factor for the development of cervical
cancer [306]. An association between papillomaviruses and NMSC pathogenesis was first
seen in an animal model whereby SCCs of the skin developed reproducibly following
experimental infection from virus-induced warts in rabbits [307]. Unlike HPV
involvement in cervical cancer, HPV may not be necessary for NMSC pathogenesis but
simply act as a cofactor along with UV radiation exposure. Complicating all deductions
made with regard to HPV in NMSCs is the fact that HPV is detected with varying
prevalence in normal skin: the prevalence ranges from 4.7% [308] to 35% [309].
The earliest evidence for an association between HPV and NMSC in humans originated
in studies on patients suffering from epidermo-dysplasia verruciformis (EV), a rare
hereditary disease. The genetic basis of this disorder is not understood, however EV
patients have increased susceptibility to a group of HPV types (differing from the
mucosal types) and develop multiple skin warts; multifocal NMSC (mostly SCC) also
occur on sun exposed skin at a young age [246]. EV HPV types have been detected in
over 90% of skin cancers in EV patients. It is clear that genetic and immunologic factors
combine with HPV infection and UVR exposure in EV patients to contribute to their
NMSC susceptibility. The suggestion of an association between HPV and NMSC is also
inferred from the susceptibility of renal transplant recipients (RTRs) to both viral warts
and NMSC (mostly SCCs), suggesting a pathogenic role of HPV in tumour development
[310] [310] [97]. The long term immunosuppression needed to support a renal transplant
is associated with an increased risk for certain forms of malignancies including that of the
skin [311]. HPV has been found in high prevalence and of a similar spectrum in both
BCCs and SCCs of RTRs prompting some investigators to suggest a differing role of
HPV in the different tumour types, leading to preferential development of SCCs [312].
Most studies of the association between HPV and NMSC are small case series without
control groups. Early studies employed laboratory methods that caused variability in
prevalence and spectrum of HPV types found. Despite increasingly sensitive laboratory
methods, no specific subset of HPV types has been consistently associated with either
BCC or SCC in immunosuppressed or immunocompetent populations [308, 312-316].

60
Studies on HPV prevalence in NMSC lesions of immunocompetent subjects from the
general population report lower figures than those found in RTRs with lower potential for
mixed HPV infection [308, 312, 315, 317]. With newer laboratory techniques however,
studies have found HPV infection in over 25% of lesions (see table 1.3).
Table 1.3 Studies reporting HPV prevalence in NMSC lesions of immunocompetent people NMSC type Iftner et al.
[308] Harwood [312] Shamanin
[315] Biliris [317]
BCC 27.8% 36.7% 60%# 30.5% SCC 59.7% 27.2% 65% 13.0% # Note: only 3 BCCs included in this study
Recently there has been one report of high risk genital type HPV infection of both BCC
and SCC with significantly greater prevalence seen in malignant lesions compared with
warts or precancers, supporting an aetiological role of the high risk genital types in skin
cancer [308]. Patients who were DNA-positive for the high risk types HPV-16, 31, 35
and 51 were nearly sixty times more likely to have NMSC as compared with unaffected
controls. This greatly increased risk was calculated after adjusting for age, gender, and
sun exposure, and despite proving an association only, provokes important questions
regarding the possible role of specific HPV subtypes in the pathogenesis of skin cancer.
This evidence is supported by earlier studies that have found mucosal HPV types in skin
cancers [315, 317-319]. A role for high risk genital types in the aetiology of NMSC
makes biological sense considering their link already with skin cancer in EV patients and
to cervical cancer. In addition, three of these types have also been shown to posses
transforming activity in tissue culture [320, 321].
Papillomavirus has been detected in the long-living epithelial root sheath and bulb of hair
follicles in rabbits, [322], which may be relevant to the development of NMSC, as the
hair follicle plays an important role in this process. The bulge region of the hair follicle is
considered an immune-privileged site that may contain the reservoir from which HPV
infection spreads [323]. Recent studies have examined the prevalence of HPV in eyebrow
61
hairs and the association with NMSC, but no firm associations with NMSC have been
found so far [324] [323, 325].
E6 and E7 gene products of mucosal HPVs bind to and degrade p53 via the ubiquitin
pathway and the retinoblastoma protein (pRb) respectively [326]. It was recently
discovered that certain EV HPV types may bind pRb as efficiently as the mucosal types,
and that they show transforming properties in human keratinocytes [327]. Other
cutaneous HPV types from RTRs may mediate p53 carcinogenesis following exposure to
UVB [328]. Clearly further work is also needed in this area to delineate the involvement
of HPV and UV light in NMSC carcinogenesis.
1.10. Other Genetic Influences On BCC Susceptibility And Development
A number of members the human herpes virus family contribute to human cancer
pathogenesis: Epstein Barr Virus (EBV) has been implicated in nasopharyngeal
carcinoma and African Burkitt’s lymphoma [329]; and cytomegalovirus (CMV) has been
associated with cervical carcinoma [330] and adenocarcinomas of the prostate [331] and
colon [332]. Because of the ubiquity of CMV and the high seroconversion rates, it has
been difficult to establish an association between this virus and human cancer, and has
only been looked at recently with respect to NMSC. A recent study demonstrated a
frequency of CMV infection in NMSC lesions that suggests a possible role for this herpes
virus in both SCC and BCC development and this warrants further exploration [333].
UVR constitutes an oxidative stress on the skin, generating radical oxygen species such
as hydroxyl and superoxide radicals, hydrogen peroxide and singlet oxygen, that lead to
protein, lipid, DNA, and gene mutation [334, 335]. It is intuitive to assume that the way
individuals deal with this oxidative stress may contribute to their susceptibility to
cutaneous carcinogenesis. The glutathione-S-transferases (GSTs) are involved in the
protection against this stress as they are critically involved in detoxification of
electrophilic compounds such as carcinogens and cytotoxic drugs, and they act to protect
DNA from damage and adduct formation through conjugation [336-338]. GSTs are a
large family of isoenzymes that comprise five classes: alpha (GST A), mu (GST M), pi
(GST P), theta (GST T) and zeta (GST Z) [339, 340]. Polymorphic loci have been

62
identified in all GST gene families, but the pathological consequences of these remain
largely unknown [341]. The polymorphism displayed by these genes makes them
obvious candidates for cancer susceptibility: reduced ability to remove potential
carcinogens may result in mutations in key tumour suppressor genes. This has already
been shown for GST polymorphisms in association with p53 in lung [342] and ovarian
tumours [343].
In relation to skin carcinogenesis, interest has focused on polymorphisms in GST T1 and
GST M1 as both are expressed in skin [341]. It should be noted however that only a
proportion of the GST enzyme have been studied: it is possible that the genes with the
greatest effects on skin carcinogenesis have not been investigated. GST polymorphisms
appear to have a greater influence on outcome within different BCC subgroups rather
than on susceptibility to BCC overall: variants may affect BCC tumour number and
accrual. Both GST M1 and GST M3 in combination with skin type I appear to influence
BCC number [344, 345]. Tumour accrual has been shown to be influenced by male
gender, number of BCCs at presentation and presence of GST T1 null [345, 346]. GST
T1 null also appears to be associated with the truncal phenotype compared with patients
with no truncal lesions [347, 348]. An interesting and poorly understood interaction
between the GST M1 A and B alleles has been found with GST M1 A/B protective
against multiple BCC, but not the homozygous state of GST M1 AA or GST M1 BB
[349]. GST polymorphisms have also been associated with MM [350] and SCC [351]
susceptibility.
Cytochrome P450 (CYP) enzymes are also genetically polymorphic and have been
studied with respect to BCC susceptibility and development. They are also involved in
detoxification of numerous xenobiotics including carcinogenic components of tobacco
smoke [352] [341]. Again, associations of polymorphisms of CYP loci have been found
only with respect to subgroups of patient with BCC rather than overall risk for these
cancers. Associations are seen with increased numbers of BCCs [344], with truncal
tumours in association with GST T1 null and with increased no of primary lesions,
increased accrual [344] and reduced time to next tumour presentation [347].
63
DNA repair systems are complex and include mismatch repair, photolyases, base
excision and post-replication repair. The maximum rate of pyrimidine dimer repair in
normal skin cells is reportedly barely sufficient to cope with the rate at which damage is
imposed on skin in full sunlight [353]. DNA repair capcity (DRC) was looked at by a
group who used a plasmid/host-cell reactivation assay in which a UV-damaged
expression vector plasmid is transfected into peripheral blood T cells from a subject. The
host cellular repair enzymes repair the photochemical damage in the plamid and it is
possible to measure the end amount of repair [72]. DRC measured in this way in controls
shows an age related decline from the age of 20 at a rate of about 0.61% per year, adding
up to a 25% loss in repair ability over 40 years [72]. This is consistent with the age
related decline in DNA repair seen in other studies although results have not been
repeatable [354] [355-357]. This apparent decline in DNA repair activity of normal
lymphocytes has also been seen in repair of UV [358], x-ray [359], and gamma
irradiation [360]. Subjects with early onset of BCC (< 44 years) and those with a family
history of BCC have been shown to have a significantly lower DRC than control subjects
[72]; DRC has also been linked to MM with a lower DRC seen in those with MM on sun-
exposed areas than unexposed [361]. It has been suggested by the authors of these
studies that the normal decline in DRC with age may account for the increased risk of
skin cancer that begins in middle age, and that skin cancer in the young may represent
precocious ageing.
Several investigators have noted a weak association of multiple BCCs with the HLA
immunoregulatory loci. An initial study investigated HLA class II antigens with respect
to ethnic groups found an association between multiple BCCs and HLA-DR1 in non-Irish
and non-Ashkenazi patients, however the sample size of this group (14 subjects) may
have been too small to detect a real difference [362]. Other studies supported this
association in other populations however they were no longer significant once corrected
for multiple testing [363, 364] or were contradictory [365-368]. A small significant
negative association between HLA-DR4 and multiple BCC has been seen in two studies
[364, 365] however this same HLA type was later shown to be positively associated with
the development of both multiple BCC and malignant melanoma in the same individual

64
[366]. Overall, the role of HLA types in the development of multiple BCCs appears likely
to be small.
The Ras gene family has also been implicated in the development of skin cancer however
appear to have greater links to the aetiology of malignant melanoma [369] and SCC [370,
371] than BCC. Ras mutations are relatively infrequently seen in BCCs [370, 372, 373],
however there is evidence that PDGFRα is upregulated in BCC with associated activation
of the Ras/MAPK pathway [374]. It may be that this pathway is activated in BCCs in an
analogous way to breast cancer [375] due to a number of factors including
overexpression of tyrosine kinases.
1.11. Family and Twin Studies
The discovery of familial aggregation is a “universal signal for geneticists to begin
investigation of genetic causes” [376] alongside classical environmental causes that also
may be shared in families. Systematic study of the patterns of clustering of both common
and rare cancers has been successful in this aim. In some cases it has led to the
identification of specific susceptibility genes of strong effect, for example, in the study of
breast cancer [377, 378] through segregation and linkage analysis. Understanding of
genetic susceptibility to prostate cancer [379], colon cancer [380], pancreatic cancer
[381], endometrial cancer [382], and nasopharyngeal cancer [383], have also been
enriched from this type of research. In the case of melanoma, for example, genetic causes
of familial aggregation are now understood to include, in a small proportion of cases, rare
high-penetrance (high lifetime risk) mutations in the genes CDKN2A and CDK4, and
much more prevalent low-penetrance (mildly elevated lifetime risk) variants in the
pigment control gene MC1R [384].
Twin studies enable the contributions of genetic and environmental factors to the
aetiology of a disease to be directly examined by comparing the similarity of
monozygotic and dizygotic twins. Finland has a nationwide Central Population Register
that includes data on twins, and also a nationwide cancer registry with compulsory
reporting of all cancers including non-melanoma skin cancers. Case reports of BCC in
monozygotic twins and in twins of unknown zygosity emerged from this Finnish twin

65
cohort in the 1970s [385]. A more recent study looked at the difference in prevalence
associated with zygosity by identifying 335 twin pairs of known zygosity in which at
least one twin had BCC diagnosed between 1953 and 1996 [386]. The co-twin of a twin
with BCC was found to have an increased risk of BCC (RR 7.0: 95% CI 3.7-1.3),
suggesting familial aggregation of this cancer. With only 11 concordant pairs for BCC in
the data from 1976 to 1996, and a total of 16 concordant pairs if the retrospective (1953-
1975) data was included, there was very little power with which to make conclusions
regarding the contributions of genetic and environmental effects. The proportion of
phenotypic variance in susceptibility due to genetic factors was estimated at 8%, however
the 95% confidence limits were 0-56%.
There have been very few other studies of familial clustering of BCC outside the context
of Gorlin syndrome. One Australian study [3] described 1108 consecutive cases of
histologically confirmed nonmelanoma skin cancers in a single Melbourne clinic over an
18 month period in the early 1990s. Among these patients, 12 families were identified in
which more than one member had a nonmelanoma skin cancer and in which the known
inherited predisposition syndromes were excluded. Because of potentially biased
ascertainment of cases with a positive family history of skin cancer to the clinic it is not
possible to conclude whether or not this proportion of family history positive cases is
greater than would have been expected by chance. However the patterns of family history
seen are instructive. In 11 of these families skin cancer had occurred in more than one
generation, and in nine multiple skin cancers had developed in two or more generations.
Most of the affected members developed BCCs only; there were some with both BCCs
and SCCs, and a few with only SCCs. This suggests that familial forms of NMSC
predisposition may exist, that they may genetic and cancer type-specific. The vertical
patterns of ‘inheritance’ seen indicate that they may be an autosomal dominant trait.
Case reports also support the existence of familial aggregation of BCC with case reports
of multiple superficial BCC in twins [387] or in two generations, including instances of
male-to-male transmission [247, 388]. There have also been three reports of unilateral
manifestations of superficial BCC [250], in which familial cancer syndromes were
excluded by examination and in one case also by radiography. The phenomenon of

66
lateralisation is difficult to explain without the assumption that non-syndromic hereditary
multiple BCC can occur as a distinct Mendelian trait, with the apparent mosaicism likely
to have occurred as an early postzygotic mutational event. Thus, a separate phenotype of
hereditary non-syndromic mulitiple BCC may exist, characterized by the presence of
multiple superficial BCC and by the absence of other anomalies (as per the MPP
described in section 1.4.2). One author [250] suggests that this possibly polygenic trait
has a clinical appearance that differs from those observed in Gorlin, Bazex-Dupre-
Christol and Rombo syndromes because the BCCs are stereotypically of a superficial
type and preponderantly involve the trunk. There is already preliminary evidence that
BCC has differential genetic susceptibility to SCC and MM, as suggested by the different
HLA associations for these tumours [366, 389].
In summary, there is preliminary evidence for specific familial aggregation of BCC, but
no knowledge of its causes. Based on the sum of research on other common cancers, it
would be expected that a small proportion of such aggregation might be due to rare, high-
penetrance alleles such as PTCH, and the majority due to common, low- to medium-
penetrance factors such as pigmentation genotypes (e.g. MC1R), and sharing of the major
environmental risk factor, sun exposure. However, it is clear that much further research is
needed to understand the genetic epidemiology of this common and burdensome cancer.
1.12. Aims and scope of this thesis
Although much work has been done on rare genodermatoses involving BCC, very little is
known about genetic susceptibility to BCC outside these settings. A small Australian
study looking at familial clustering of NMSC that noted apparent differences in
susceptibility to BCC versus SCC between NMSC pedigrees, suggesting differing genetic
influences [3]. However, there have been no larger-scale studies of this phenomenon.
Gorlin syndrome is one of the rare familial syndromes that has received research
attention, and involves autosomal dominant inheritance of marked susceptibility to BCC
and a range of developmental defects. Mutations in the cell growth regulatory gene
patched (PTCH), when present in the germline are responsible for this disorder. They
have also been found in a high percentage of sporadic tumours, suggesting a critical

67
involvement of this pathway in BCC tumour development generally. Furthermore, mice
with Gorlin syndrome-like knockouts of one copy of PTCH develop BCCs if exposed to
UVR, mimicking the human situation [4]. No studies have yet investigated whether
germline mutations or less highly penetrant variants of this gene might account for part of
non-syndromic BCC susceptibility in the general population.

68
Chapter 2: Methods
2.1. Patients and recruitment
2.1.1. Ascertainment
The subjects of this analysis are part of a larger study of familial aggregation of non melanoma
skin cancer, which involves cases of early-onset of both BCC and SCC occurring in the greater
Sydney metropolitan area, and their relatives. This geographical area is defined by the borders
of Wollongong to the South, Gosford to the North, and the Blue Mountains to the West. These
cases were identified through the database of the Dermatopathology Division of the Skin &
Cancer Foundation Australia (SCFA). This academically affiliated service receives pathology
from a significant proportion of dermatologists practising in New South Wales (NSW), as well
as from those working at the SCFA’s two large Sydney clinics in Darlinghurst and Westmead.
Patients are referred to these dermatologists from their general practitioners for assessment and
treatment of skin conditions including skin cancer, and to make use of the dermatopathology
service of the SCFA. Referrals to these services are unlikely to have been biased towards
people with a family history of NMSC. Neither BCC nor SCC are registrable in Australia, but
their combined incidence has been estimated by population-based surveys to be 2200 per 100
000 in 1997 in Australia [390]. This figure is likely to also represent the incidence in Sydney
because NSW has melanoma rates (a surrogate for sun-related skin cancer) that are close to the
national average, and greater Sydney includes more than two thirds of the State’s population.
The incidence of melanoma in NSW in the year 2001 was 42.4 and 31.6 per 100,000 for males
and females respectively, age standardised to the 2001 world population. The national average
was 53.7 and 38.0 per 100,000 for males and females respectively in the year 2000, age
standardised to the 2001 world population (from the Australian Bureau of Statistics,
www.abs.gov.au). Preliminary searches of the SCFA database for BCC and SCC showed that it
had captured 8200 individuals histologically-verified as having NMSC from 1994- 1999, of
whom 80% were residents of the Sydney metropolitan area. This equates to 200 per 100,000
cases per year in Sydney (ie 8200/4,000,000 x 100,000), which is 10% of the total estimated
incidence. The SCFA database can thus be considered a quasi-population-based register of
biopsy proven NMSC in the Sydney metropolitan area.
2.1.2. Recruitment
69
Eligible subjects (probands) were those of either sex, with histologically verified primary
cutaneous BCC, diagnosed at forty years of age or younger during the 12 month period from
January to December 2000, or SCC diagnosed at fifty years or younger, during the 24 month
period from January 1999 to December 2000. These age thresholds were selected so that the
youngest 7-8% of the total number of BCC and SCC-affected individuals per year were
captured, and the longer period of SCC eligibility was required because SCC is significantly
less common than BCC in these age groups [1]. Only the BCC arm of the study will be
reported here.
A letter was sent to the referring doctors of 257 BCC cases asking permission to contact their
patients regarding this project. Once consent was given, and information pack was sent from
SCFA to the patient, containing information on the research project, consent forms to
participate in the study and a form to release this consent from SCFA to the research team. . If
there was no response to this information, SCFA attempted to contact the subjects by telephone
for a response. For subjects that were unable to be contacted by these methods, a ‘Yes-No’
response form was sent out asking them to simply tick a box and return the form, to let us
know that they were actively refusing participation. If there was still no response a second Yes-
No form was sent. For all correspondence that was ‘returned to sender’ by the postal service,
the referring doctor was asked for updated contact details. For all subjects whose current
address or telephone numbers were unable to be discovered by these methods, ‘Marketing Pro’
software was used to attempt to obtain current details. If new details were discovered by any of
these means, the process began again with a new information pack sent to the new address
and/or a telephone call from SCFA to the new telephone number to follow up on information
packs sent. The team only contacted the subjects once their consent was returned, which
included 56 BCC affected individuals, and 48 SCC affected individuals.
Twenty-three of 201 eligible subjects were denied consent by their treating doctor. Of the
remaining 178 early-onset BCC cases approached, 56 consented, 50 actively or passively
refused, 13 were not contactable after exhausting the methods detailed above, and for 59 it was
unclear whether or not the patient had received the information or not. Thus the actual
percentage of eligible contactable subjects consented is between: 56/165 (34%) and 56/106
(53%), depending on how many of the not-contactable subjects were actually passive refusals.
2.2. Interviews and histological confirmation of cancers

70
Each family stucture was determined by interviewing probands about their first and second
degree relatives. Each first degree relative was then approached, and if they consented to
participate in the study, they were interviewed about their cancer history. Cancer history
information on deceased first degree family members was also obtained where possible
through proxy interviews with a consented family member. Attempts were made to verify all
reports of cancer with histopathological records if possible or alternatively through medical
records. This was done through contacting the treating doctor or relevant pathology service
for BCCs and SCCs, and through the cancer registry for registrable cancers. If the registry
could not verify the reported cancer then the treating doctor was contacted for these records.
The earliest reported cancer of each type was the priority for verification. Where multiple
reports were received, they were all followed up until at least one confirmation of NMSC was
received. Where more than one NMSC was confirmed, the earliest dates of BCC and SCC
diagnoses were used for subsequent analysis. The information was coded according to the
level of confirmation (self-report alone/ clinical diagnosis alone/ histological confirmation).
In situ SCC was accepted as equivalent to invasive SCC because recent data indicate that the
prospective risk of further SCC is similar in these two conditions. Relatives were only
labelled ‘unaffected’ if they never had any potential NMSC lesions treated, and if they had no
NMSC or premalignant lesions present on examination. The oldest unaffected sibling for each
proband (if available) was designated as an intra-family control.
In all subsequent analyses, the word ‘relatives’ refers to the consented first-degree relatives of
probands in this study.
2.3. Phenotyping
2.3.1. Skin examination
All probands and their sibling controls were invited to attend skin examinations at SCFA in
Westmead or Darlinghurst, at Westmead hospital, or at outer metropolitan or rural hospitals
for a few subjects who could not attend a city venue. The same measurement equipment was
used at each site, and the same lights were used to enable standardized illumination. The
candidate, a medical graduate, was trained to assess premalignant and malignant lesions and
the markers of sun damage on subjects, according to a standard protocol as, described below.
Height and weight were recorded. Subjects were asked to identify the hair colour that was
closest to their natural colour at age 18, using synthetic hair swatches (Clairol, USA) designed

71
for wig-making. Colours used in this study included: High-Lift golden blonde HL-G, Sable
Brown 48D, Dusk Blonde 93D-N, Nightfall Brown 95D-N, Sunberry 72R, Reddest Fire Red
206RR, Golden Apricot 41G, Black Azure 52D. Skin colour was recorded using a reflectance
spectrophotometer, as described in 2.3.3.
All subjects were tested for features of Gorlin Syndrome, including mandibular keratocysts
(through the questionnaire) and examination of the palms for pitting. Each of these features
would be expected to be seen in over 80% of patients with Gorlin syndrome [200].
Markers of sun exposure and damage were then assessed on a semi-quantitative scale and
included: ephelides (freckles), solar lentigines, actinic keratoses, actinic damage/elastosis,
seborrhoeic keratoses, and presence of any new skin cancers noted. If a lesion was suspicious
of malignancy, the subject was referred to their local GP or dermatologist. Results were
recorded on a patient data sheet and entered into a password-protected database in secure
facilities. Data for analysis were deidentified.
All subjects undergoing skin examination also filled out a questionnaire (see section 7.1 for
clinical protocol) regarding their skin type, hair colour, eye colour, childhood and adult
freckling, and history of dental cysts.
The candidate undertook an informal audit of examining technique with an experienced
dermatologist after the examinations were complete. Her technique was considered adequate
for all variables except seborrhoeic keratoses, where fainter lesions were missed. Absolute
values for this variable should be regarded as underestimates and were not interpreted,
whereas categorisation of individuals with respect to number of these lesions was regarded as
suitable for analysis.
2.3.2. Skin examination recoding variables
All skin phenotype variables, from examination and questionnaire, were subjected to an initial
analysis to determine their distribution and informativeness. The number of categories was
reduced by recoding in many cases in order to maximise the number of individuals in each
recoded category. All recoded variables are described here.
Only one subject (1.1%) reported having black hair when asked to name their hair colour at
age 21, and this subject chose a brown hair swatch when asked to select a representative hair

72
swatch colour visually: the category of ‘black’ was therefore combined with the category
‘dark brown’ for the analysis.
Few people (3.4% or 3/88) reported that they ‘go brown without any sunburn’ when asked
“which statement best describes what would happen if your skin were exposed to bright
sunlight for the first time in summer for one hour in the middle of the day without any
protection?” (see section 7.1). Therefore the answers for the ‘no sunburn/tanning’ were
combined with the ‘mild sunburn’ category for analysis.
No subject out of 88 reported that they ‘never burn’ as a response to the question “in general,
how does your skin react to the sun?” and therefore this phototype category was removed
from the analysis.
Examination for presence of actinic keratoses (AKs) revealed that most subjects did not have
many of these lesions on the regions of the body included (see section 4.2.4). The categories
of ‘sparse’ and ‘moderate’ were therefore collapsed to the single category of ‘present’ or
‘absent’ for presence of any AK on the regions head/neck, chest, dorsum arms and dorsum
hands examined. A large proportion of subjects had a high amount of solar elastosis, skewing
the results. Therefore the score for each body region (Head/neck/anterior chest, periorbital,
lips, dorsa forearms, and dorsa hands) were added up with a score of 0 for ‘absent’, 1 for
‘mild’ and 2 for ‘severe’. This was added up across all categories and each subject was given
a score of ‘low’for a total body score between 0 and 9, and a score of ‘high’ for a total body
score of 10.
Semi-quantitative counts of solar lentigines were skewed across the 88 subjects examined
with a disproportionate number falling into a low or high count category (see table 7.8 for raw
scores). Therefore the median count category for each body region was determined and
subjects re-categorised into ‘low’ or ‘high’ solar lentigines groups. For the face this meant
that raw scores of 0 – 2 were recoded as ‘low’ with the remainder of scores 3 – 10 recoded as
‘high’. Similarly, the raw scores for solar lentigines on the forehead were recoded 0 – 1 ‘low’
and 2 – 10 ‘high’. For the upper limb raw scores, 0 – 4 became ‘low’ and 5 – 9 became ‘high’.
For the upper back and shoulders, 0 – 6 became ‘low’ and 7 – 9 became ‘high’.
Reporting of freckling in childhood and adulthood was skewed to include a greater proportion
in the category ‘very few’ than the other positive freckling categories (see table 7.9 for raw
scores). ‘Very few’ was therefore renamed ‘some’, and the ‘few’, ‘some’, and ‘many’
73
categories were collapsed into the single category of ‘many’. As with the analysis of semi-
quantitative examination results for solar lentigines, subjects’ ephiledes (freckling) scores
were skewed or biphasic (see table 7.9) and so the median (if skewed) or the score between
the two peaks (if biphasic) for each region was taken, and subjects reclassified into high and
low numbers of freckles based on this median division. For ephilides on the face, raw scores
of 0 – 3 were recoded as ‘low’ and 4 – 10 as ‘high’. For raw scores of ephilides on the
forehead, 0 – 3 were re-classified as ‘low’ and 4 – 10 as ‘high’. For the upper limbs, raw
scores of 0 – 7 were scored as ‘low’ and 8 – 10 as ‘high’. For the upper back and shoulders, 0
– 6 raw scores were recoded as ‘low’ and 7 – 10 as ‘high’.
Examination results for numbers of seborrhoeic keratoses were skewed with many subjects
scoring ‘nil’ on this variable for several of the body regions (see table 7.10). The results were
reclassified into an absent/present dichotomy for each region examined to allow any real
associations to be seen. The score for all the body regions examined (head/neck, upper limbs,
chest, abdomen, back, lower limbs) were then summed to give a total body score, and this was
also divided into ‘low’ (score of 0 – 1) and ‘high’ (score of 2 – 8) categories based on the
median score.
2.3.3. Skin colour assessment
The apparent colour of a person’s skin is due to the aggregate of reflected light, the
wavelengths of which depend on four biochromes: melanin, carotenoids, oxyhaemoglobin and
reduced haemoglobin. Melanin and the carotenoids are brown and yellow respectively, and
are found in the epidermis, the uppermost layer of the skin. Oxyhaemoglobin is bright red and
found in the arterioles and capillaries of the upper dermis of the skin, just deep to the
epidermis. Reduced haemoglobin is bluish-red and is found in the venous plexus of the
dermis, just deep to the arterioles and capillaries [21].
Skin colour of each subject examined was assessed with a BYK Gardner spectrophotometer; a
portable instrument that measures reflected colour and the colour difference using the
Commission International de l’Eclairage (CIE; 1976) L*a*b* standard colour system. The L*
value (luminance) represents the relative lightness ranging from total black to total white; the
a* value represents the balance between red and green; and the b* value the balance between
yellow and blue. This instrument uses the same wavelengths of light (400 to 700nm at 20nm
intervals) to measure skin reflectance as the Minolta 508, a spectrophotometer with

74
measurement of skin colour that correlates highly (r = 0.68) with melanin density seen
histologically on biopsied skin from the site measured [391]. The Minolta does not separate
the reflected light into the L, a and b axes, giving a single reading of reflected light for each
20nm interval of reflected light. Based on best correlation with melanin density over the
spectrum of light used, researchers using the Minolta generally use the difference between the
reflectance measurements at 400nm and 420nm of incident light as a single parameter.
The Minolta and BYK Gardner instruments are regarded as equivalent in commercial colour
measurement applications. However, there are no published data on correlates between 420-
400nm reflectance and L*a*b* measurements, or between L*a*b* measurements and
melanisation. In this thesis, the raw L*a*b* measurements were used without further
manipulation in order that all available information on skin colour should be used.
The spectrophotometer was recalibrated prior to each skin examination session to ensure
comparable readings between subjects, and the mean of 6 consecutive readings was recorded.
The measurements were taken on the medial axillary wall (constitutional skin colour) and
upper outer arm (sun exposed skin colour) of each subject examined. The mean L*a*b*
values was recorded on the subject’s data sheet.
2.4. DNA extraction
Blood (20 ml EDTA) was collected from the probands, sibling controls and parents of
probands by standard venipuncture. DNA was extracted from whole blood as described in
appendix 7.2. The total concentration of the DNA was checked by spectrophotometry at 260
nm and 320 nm (Genequant Pro; Amersham Pharmacia Biotech, England). The DNA quality
was estimated by running the DNA samples on a 1% agarose gel, stained with ethidium
bromide (final concentration of 0.5µg/ml). Gels were photographed under UV light (NovaLine
Gel Documentation System; Sweden).
2.5. Genotyping of PTCH
2.5.1. Exon and primer selection
The exons chosen for amplification and analysis were exons 2, 3, 5 to 18, and 20 to 23. Exon
23 was split into 23a and 23b to allow for easier amplification and dHPLC (exon numbering
of the PTCH exons is as described by Johnson et al [214]. The priorities for exon choice were
based on those for which PTCH mutations have been documented in Gorlin subjects. The

75
genbank accession number for the PTCH gene is U59464. Exons 1 and 4 were excluded
because no mutations have been seen in these exons in previous studies, and exon 19 was
excluded due to repeated difficulties with PCR amplification. Primer pairs used are according
to Hahn et al (exons 6, 7, 8, 9, 10, 11, 15, 17 and 18) [213], Fujii et al (exon 2) [392] and Xie
et al (exons 12, 13, 14, and 21) [221]. Primer pairs for exons 3, 5, 16, 20, 22, 23a, and 23b
were provided by BJ Wainwright (personal communication). Primer sequences for all exons
amplified are listed in table 2.1 and have been used extensively for dHPLC analysis of Gorlin
syndrome patients and somatic mutations in non-familial BCC in the laboratory of Prof BJ
Wainwright, University of Queensland; Brisbane, Australia.

76
Table 2.1 Primer sequences to amplify PTCH exons Exon Primer sequence
2 F 5’-ACTCCTCCCTTCTGCTTCGT-3’ R 5’-GCGCTGGCGAATATCTCTAT-3’
3 F 5’-CTATTGTGTATCCTATGGCAGGTAGTCAGATAACAGAT-3’ R 5’-ATTAGTAGGTGGACGCGGCGGGCCT-3’
5 F 5’-GCAAAAATTTCTC AGGAACACC-3’ R 5’-GGAACAAACAATGATAAGCAA
6 F 5’-CCTACAAGGTGGATGCAGTG-3’ R 5’-TTTGCTCTCCACCCTTCTGA-3’
7 F 5’-GTGACCTGCCTACTAATTCCC-3’ R 5’- GGCTAGCGAGGATAACGGTTTA- 3’
8 F 5’- GAGGCAGTGGAAACTGCTTC -3’ R 5’- TTGCATAACCAGCGAGTCTG-3’
9 F 5’-GTGCTGTCGAGGCTTGTG-3’
R 5’-AGAAGCAGGAGCAGTCATGG-3’
10 F 5’-TTCGGCTTTTGTTCTGTGC-3’ R 5’-CCGGTGGCATTTGTCAAC-3’
11 F 5’-CTGTTAGGTGCTGGTGGCA-3’ R 5’-CTTAGGAACAGAGGAAGCTG-3’
12 F 5’- GACCATGTCCAGTGCAGCTC-3’ R 5’- CGTTCAGGATCACCACAGCC-3’
13 F 5’- AGTCCTCTGATTGGGCGGAG-3’ R 5’- CCATTCTGCACCCAATCAAAAG-3’
14 F 5’-AAAATGGCAGAATGAAAGCACC-3’ R 5’-CTGATGAACTCCAAAGGTTCTG-3’
15 F 5’-GACAGCTTCTCTTTGTCCAG-3’ R 5’-ACGCAAAAGACCGAAAGGACGA-3’
16 F 5’-CGCTAGGACCAGGGTCCTTCTGGCTGCGAGTTATA-3’ R 5’-TCAGTGCCCAGCAGCTGGA-3’
17 F 5’-AACCCCATTCTCAAAGGCCTCTGTTC-3’ R 5’-CACCTCTGTAAGTTCCCAGACCT-3’
18 F 5’-AACTGTGATGCTCTTCTACCCTGG-3’ R 5’-AAACTTCCCGGCTGCAGAAAGA-3’
20 F 5’- CATTTAGGACAGAGCTGAGCA-3’ R 5’- GGCCCAATCACAATGATTTC-3’
21 F 5’-TGTTCCCGTTTCCTCTTG-3’ R 5’-GCACAGGAAACACAGCATTC-3’
22 F 5’-AGTGTGGCCAGCAGGTAAAT-3’ R 5’-CTCCAGGCCCACTACCAC-3’
23a F 5’-AAACCCAAGGAGGGAAGTGT-3’ R 5’-CCGAGGGTTGTGAGAACG-3’
23b F 5’-GCATTCTGGCCCTAGCAATA-3’ R 5’- TCTTTGCCTGGCTCTAGGTC-3’
Forward (F) and reverse (R) primer sequences of exons 2 to 4 and 5 to 23b of the PTCH gene. The primer pairs of exons 15, 17 and 18 correspond to primer pairs 14, 16 and 17 respectively as described by Hahn et al. [213]

77
2.5.2. PCR protocol for amplification of PTCH exons
PCR reactions were performed in a total volume of 52.8µl. The reaction contained 5µl of PCR
buffer (1.5 mM MgCl2; 10mM Tris-HCl, pH 8.5; 50mM KCl), 1 µl DMSO, 1µl dNTP 10mM
(Fisher Biotec, Australia), 1µl of each primer 50µM (forward and reverse), 0.3µ of AmpliTaq
Gold 5U/µl (Roche Applied Biosystems, USA), 3µl DNA 25ng/µl, and 40.5 µl dH2O (table
2.2). The same PCR protocol suited the amplification of exons 2, 5- 20, 22, and 23a (and
19?). For exons 3 and 21, 2.5 mM MgCl2 was used, and for exon 23b, 2.0 MgCl2 was used.
Each reaction contained a negative control that contained all the stock ingredients with water,
to ensure that the reagents were not contaminated. A positive control was not available. All
PCR reactions were done using sterile techniques, working in a laminar flow hood.
The annealing temperature for exon 2, 3, 5, 7, 8, 9, 10, 12, 13, 15, 17, 18, and 20 was 55ºC,
for exons 6, 11, and 14 it was 57ºC, for exons 16, 21, 22, and 23a it was 59ºC and for exon
23b it was 60ºC. The thermocycling parameters included an initial denaturing step at 95º for
30 minutes, followed by 95º for 45 seconds, the specific annealing temperature for 50
seconds, 72º for 50 seconds for 35 cycles, and a final elongation cycle of 72º for 7 minutes
(Palm-Cycler version 2.2; Corbett Research, Australia). The PCR tubes were stored at -20ºC
until required for denaturing High Performance Liquid Chromatography (dHPLC) or
sequence analysis.
Table 2.2 PCR Cocktail (52.8 µl total) Reagent (conc) Volume (µl) Final concentration dH2O 40.5 - PCR Buffer (MgCl2, Tris-HCl, KCl) 5.0 MgCl2: 1.5mM; Tris-HCl: 10mM (pH 8.5); KCl: 50mM DMSO 1.0 - dNTP’s (10 mM) 1.0 0.19 mM PTCH F primer (50 µM) 1.0 0.95 µM PTCH R primer (50 µM) 1.0 0.95 µM AmpliTaq Gold (5U/µl) 0.3 1.5 U DNA (25 ng/µl) 3.0 75 ng Total 49.8 + 3.0 µl
2.5.3. Agarose gel electrophoresis
All PCR products were checked for purity and correct sizing on a 1.5% agarose gel (1.5g
agarose in 100 ml 0.5x TBE), stained with ethidium bromide (final concentration of 0.5

78
µg/ml). For all samples, 3 µl of each PCR product was mixed with 2 µl of loading dye and
pipetted into successive wells of the gel, running them next to 2µl of low DNA mass ladder
(4µl/appl; Invitrogen Life Technologies, Australia) and the negative control. The gels were
electrophoresed at 80V for approximately 30 minutes at room temperature and subsequently
photographed under UV light (NovaLine Gel documentation system; Sweden). It was always
ascertained that the negative control did not show any bands on the gel. If the negative control
did show a band in a particular experiment, the resultant samples were discarded, the reagents
replaced, and the reaction repeated until the negative control did not show a band on the gel.
2.6. dHPLC analysis of the PTCH gene
The PCR products were denatured at 95ºC for 5 minutes, followed by slow renaturing at -1ºC
per minute, from 94º to 60ºC (Palm-Cycler version 2.2; Corbett Research, Australia) and
subsequently stored at -20ºC until dHPLC analysis. Denatured PCR products (5-20µl) were
analyzed for heteroduplexes by dHPLC (WAVE® DNA Fragment Analysis System;
Transgenomic Inc, Omaha, Nebraska, USA) at the dHPLC Fragment Analysis Facility,
Westmead Millennium Institute, Sydney, Australia. The PCR product was eluted from a
temperature-equilibrated DNASep® analytical column (Transgenomic Inc, Omaha, Nebraska,
USA) using a gradient of 0.1 M triethylammonium acetate buffer (TEAA) (A) and 0.1 M
TEAA/25% acetonitrile (B), pH 7.0, at a constant flow rate of 0.9 ml/min. The gradient was
predicted by the WAVEMakerTM software (Transgenomic) (table 2.4). Eluted DNA fragments
were detected with ultraviolet absorption at wavelength 260 nm. Temperatures used for
dHPLC were based on temperatures used by the University of Queensland, Brisbane (kindly
provided by Wainwright BJ; personal communication) and predictions determined by the
WAVEMakerTM software (table 2.4). The sequence of the wild type PTCH amplicon used for
predictions is Genbank sequence U59464 (see section 7.3).
For the eight exons most likely to harbour mutations based on previous research (exons 2, 3,
6, 8, 14, 15, 17 and 18), two temperatures were used to screen each exon, in an attempt to
detect all variations in the majority of the exon. These eight exons have been found to have
the highest mutation rate of all the coding regions of the PTCH gene, and mutations in these
exons account for approximately 60% of the total mutations cited in the literature.
Unfortunately, exons 6 and 8 were able to be screened at one temperature only, due to
procedural difficulties and time constraints. Thus mutation in the exons screened at two
temperatures accounted for approximately 50% of the total mutations cited in the literature.

79
The two temperatures were used to screen 19 of the 58 probands, including all of those
probands for whom there was histopathological confirmation of a family history of BCC at
the time that laboratory work was practicable. This included 17 probands from the BCC arm
of the study and 2 from the SCC arm. See table 2.3 for a summary of family cancer
prevalence in the 19 probands chosen to have extra screening for higher risk exons. For the
remainder of the 39 probands for these seven exons and the remaining exons screened, one
dHPLC temperature only was used. The melting profiles for the temperatures used as
predicted by the WAVEMaker TM software can be found in appendix 7.4; one example is
given in figure 2.1.

80
Table 2.3 Family history of BCC, SCC, and MM (proband and first degree relatives) for high risk subjects included for two temperatures of dHPLC screening
aDNA unavailable at time of laboratory work for screening at two dHPLC temperatures # Underlined age indicates that the subject is deceased *Indicates proband age of diagnosis
Proband ID Total number of family members recruited
Number of BCC-affected family members
Age of onset of BCC# Number of SCC-affected family members
Age of onset of SCC
Number of NMSC-affected family members
Number of MM-affected family members
Age of onset of MM
BCC probands 8755 5 2 31, 34* 1 55 3 8761 4 2 34*, 62 1 65 2 8763 8 2 36*, 43, 2 41, 71 4 1 42 8768 4 2 20*, 48 0 - 2 8770 5 3 39*, 69, 70 1 75 3 2 33, 78 8773 6 2 39*, 52 0 - 2 8781 3 2 35*, 51 1 51 2 8797 9 2 35*, 53 2 53, 42 3 8800 10 4 26, 38*, 43, 69 1 70 4 8815 5 2 19*, 58 0 - 2 8816 9 6 39*, 44, 50, 50, 53, 76 2 53, 76 6 2 38, 49 8840 6 6 23, 23, 25, 28*, 49, 54 2 42, 46 6 3 23,
37, 47 8846 4 3 26*, 55, 56 0 - 3 8857 4 2 35*, 63 0 - 2 9022 9 6 35*, 36, 44, 54, 58, 74 0 - 6 9125 6 3 25, 37, 38* 2 43, 67 4 9194 4 2 33*, 62 1 64 2 9242a 7 2 30*, 50 0 - 2 SCC probands 8701 7 6 29*, 30, 39, 54, 69, 75 3 40*, 51,
84 6 1 69
8001 6 3 37, 37, 53 1 41* 4 8196a 7 3 34,43, 45 3 34, 41*,
53 4
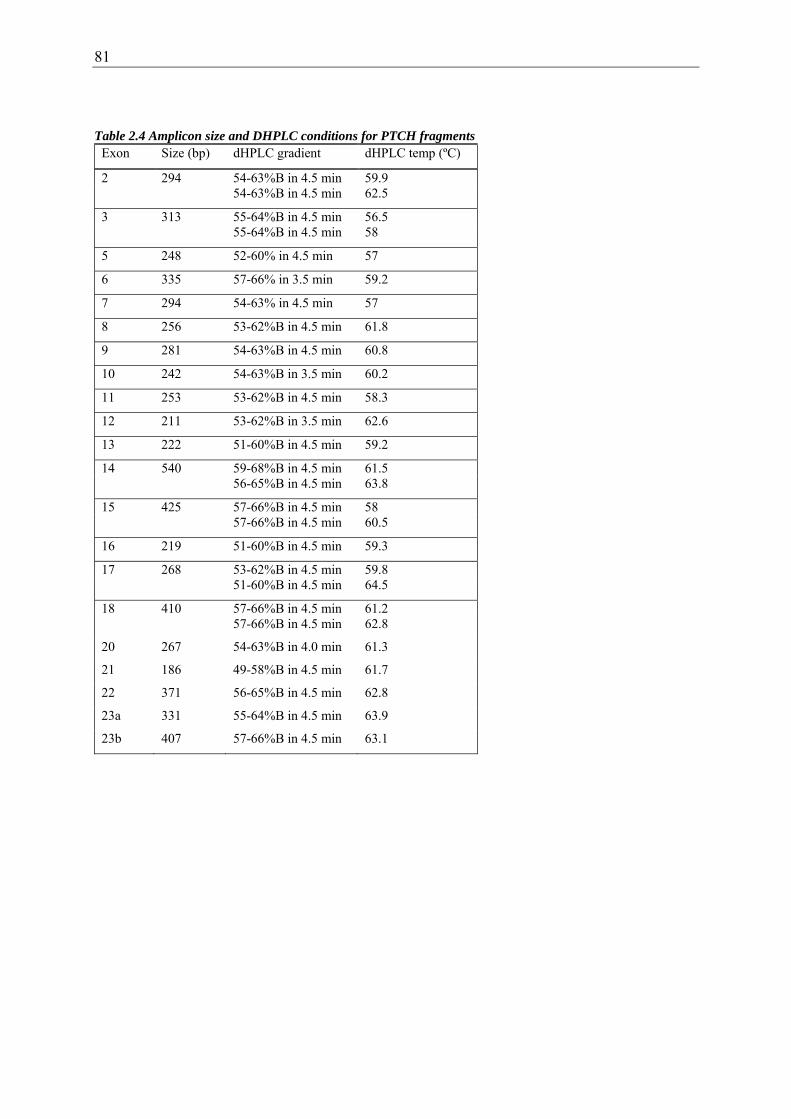
81
Table 2.4 Amplicon size and DHPLC conditions for PTCH fragments Exon Size (bp) dHPLC gradient dHPLC temp (ºC)
2 294 54-63%B in 4.5 min 59.9 54-63%B in 4.5 min 62.5
3 313 55-64%B in 4.5 min 56.5 55-64%B in 4.5 min 58
5 248 52-60% in 4.5 min 57
6 335 57-66% in 3.5 min 59.2
7 294 54-63% in 4.5 min 57
8 256 53-62%B in 4.5 min 61.8
9 281 54-63%B in 4.5 min 60.8
10 242 54-63%B in 3.5 min 60.2
11 253 53-62%B in 4.5 min 58.3
12 211 53-62%B in 3.5 min 62.6
13 222 51-60%B in 4.5 min 59.2
14 540 59-68%B in 4.5 min 61.5 56-65%B in 4.5 min 63.8
15 425 57-66%B in 4.5 min 58 57-66%B in 4.5 min 60.5
16 219 51-60%B in 4.5 min 59.3
17 268 53-62%B in 4.5 min 59.8 51-60%B in 4.5 min 64.5
18 410 57-66%B in 4.5 min 61.2 57-66%B in 4.5 min 62.8
20 267 54-63%B in 4.0 min 61.3
21 186 49-58%B in 4.5 min 61.7
22 371 56-65%B in 4.5 min 62.8
23a 331 55-64%B in 4.5 min 63.9
23b 407 57-66%B in 4.5 min 63.1

82
0
50
100
0 50 100 150 200 250 300 350 400 450
B ase P osition
58 ºC
60.5 ºC
Figure 2.1 Predicted dHPLC melting curve for PTCH exon 15, wild type. Helical fraction (%) of the DNA (Y-axis) versus base position in the amplicon (X-axis). The helical fraction ranges from 0% (completely denatured DNA; single stranded DNA) to 100% (double stranded DNA). dHPLC can detect mutations in partially denatured DNA, optimally 30-80% helical fraction (Leary J, Manager dHPLC Fragment Analysis Facility, Westmead Millennium Institute; Personal Communication).
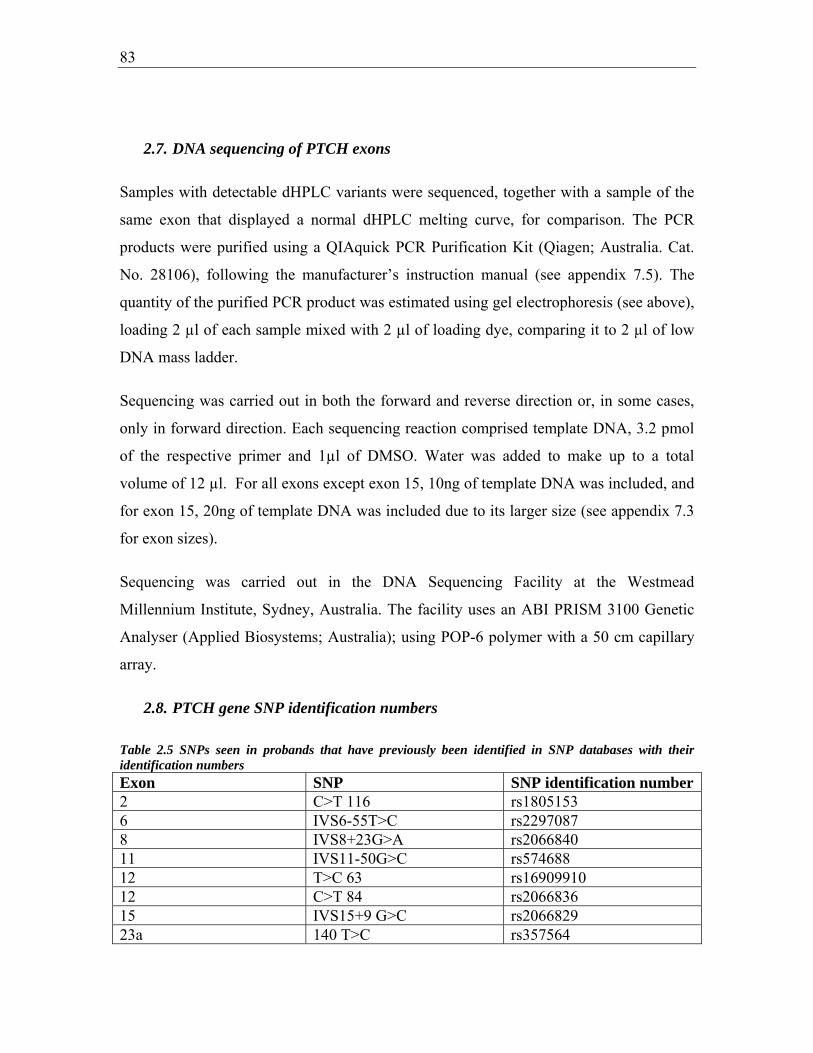
83
2.7. DNA sequencing of PTCH exons
Samples with detectable dHPLC variants were sequenced, together with a sample of the
same exon that displayed a normal dHPLC melting curve, for comparison. The PCR
products were purified using a QIAquick PCR Purification Kit (Qiagen; Australia. Cat.
No. 28106), following the manufacturer’s instruction manual (see appendix 7.5). The
quantity of the purified PCR product was estimated using gel electrophoresis (see above),
loading 2 µl of each sample mixed with 2 µl of loading dye, comparing it to 2 µl of low
DNA mass ladder.
Sequencing was carried out in both the forward and reverse direction or, in some cases,
only in forward direction. Each sequencing reaction comprised template DNA, 3.2 pmol
of the respective primer and 1µl of DMSO. Water was added to make up to a total
volume of 12 µl. For all exons except exon 15, 10ng of template DNA was included, and
for exon 15, 20ng of template DNA was included due to its larger size (see appendix 7.3
for exon sizes).
Sequencing was carried out in the DNA Sequencing Facility at the Westmead
Millennium Institute, Sydney, Australia. The facility uses an ABI PRISM 3100 Genetic
Analyser (Applied Biosystems; Australia); using POP-6 polymer with a 50 cm capillary
array.
2.8. PTCH gene SNP identification numbers
Table 2.5 SNPs seen in probands that have previously been identified in SNP databases with their identification numbers Exon SNP SNP identification number2 C>T 116 rs1805153 6 IVS6-55T>C rs2297087 8 IVS8+23G>A rs2066840 11 IVS11-50G>C rs574688 12 T>C 63 rs16909910 12 C>T 84 rs2066836 15 IVS15+9 G>C rs2066829 23a 140 T>C rs357564

84
2.9. Estimating Australian population cumulative risk (prevalence of a prior
diagnosis) of NMSC
2.9.1. Estimating cumulative risk from incidence
NMSC are not notifiable to cancer registries in most of Australia, so verification of self-
reported past diagnoses is not as feasible as it is for other cancers. Cumulative risk
(prevalence of a prior diagnosis) of SCC and BCC was estimated from the most recent
Australian general population incidence data available [1]. Five-year incidence data was
obtained for men and women separately from survey data collected in 1995. Although
lifetime prevalence of skin cancer was surveyed in this study, only the previous 12
months of skin cancer incidence data had been validated, and therefore only this data was
suitable for analysis. Although the numbers of non-melanoma skin cancers were provided
for five year age groups beyond 69 years (ie. 70-74, 75-79, 80-84, 85+), the number of
people at risk for these age groups was only provided as a single group (70+). Therefore,
incidence and prevalence was able to be estimated only for individuals up to 70 years of
age.
Estimating prevalence and cumulative risk from incidence data has been discussed by
other researchers [393] [394]. Most approaches require registry data which are not
available in this instance. These models allow for the effects of competing risks.
Statistician collaborators, Dr Karen Byth and Ms Peta Forder constructed estimates by
making simplifying assumptions, and adapting existing epidemiological methods to
incidence and cumulative risk estimation for BCC and SCC. The general population
cumulative risk was estimated via a suitable model for the incidence. This novel approach
is described below. All references to “prevalence” after this point mean prevalence of a
prior diagnosis of skin cancer (ie cumulative risk).
Assume for the moment that the incidence of the particular cancer of interest at age i is
independent of year (period) and of year of birth (cohort). Let the incidence of this cancer
at age i be denoted by iλ and note that iλ <<1. Suppose that there are iN individuals of

85
age i. Assume that the probability distribution of the number of individuals who develop
the cancer of interest at age i can be approximated by a Poisson distribution with
parameter i iN λ . Inspection of the observed incidences for ages <70 years in the Staples
et al (1998) data suggested a log-linear model for iλ of the form
( )0 1ln( )i iageλ β β= + ×
so that
( )0 1 iagei eβ βλ + ×= .
Assume further that any immigration or emigration processes operating on the general
population occur independently of the cancer incidence process. Since we are interested
in non-melanoma skin cancers, also assume that the death process operating on the
general population is independent of the cancer incidence process. These assumptions
and their implications are discussed in detail later.
Let iP denote the probability that an individual has a first cancer of the prescribed type
diagnosed at age i. Using conditional probability arguments, this is the product of the
probabilities that no cancer of that type was diagnosed at any earlier age multiplied by the
probability of this cancer diagnosis at age i. Therefore,
0
1
0
0
.
j i
j
i
jj
i
i ij
i
ij
i
P e e
e
e
λ λ
λ
λ
λ
λ
λ =
−− −
=
−
=
−
⎧ ⎫= ×⎨ ⎬⎩ ⎭⎧ ⎫
= ⎨ ⎬⎩ ⎭
∑=
∏
∏
The ‘prevalence’ of first cancer by age i is then :
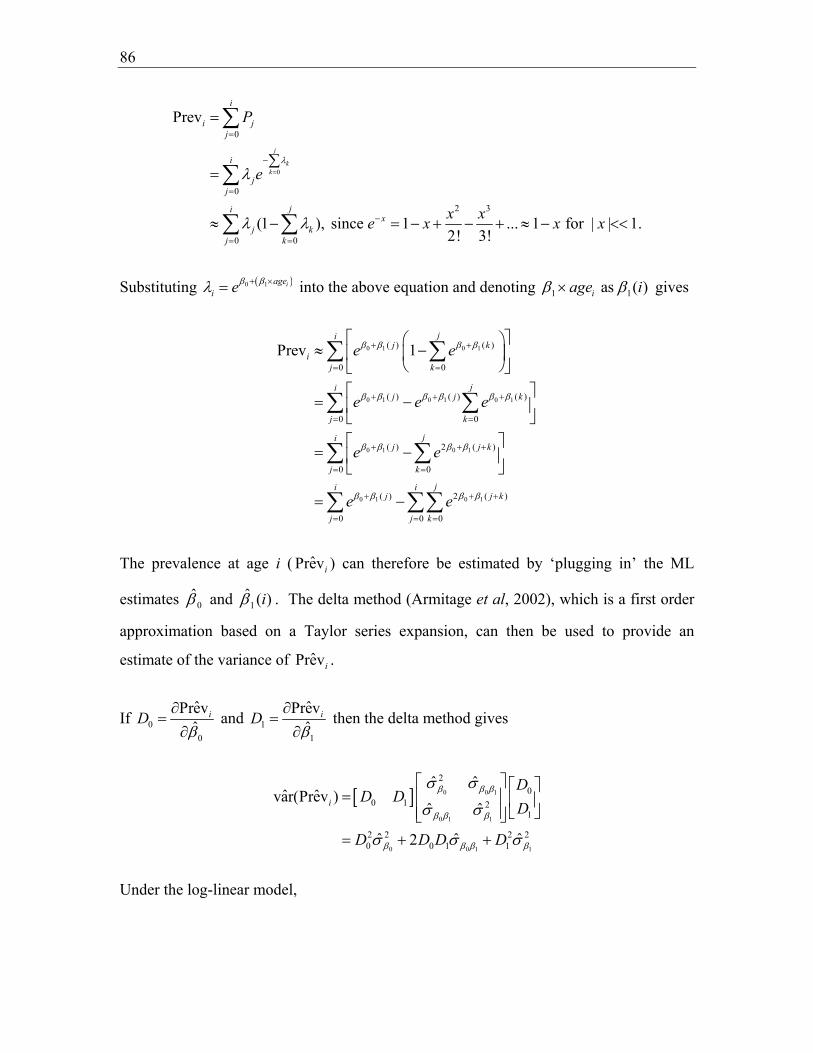
86
0
0
0
2 3
0 0
Prev
(1 ), since 1 ... 1 for | | 1.2! 3!
j
kk
i
i jj
i
jj
jix
j kj k
P
e
x xe x x x
λ
λ
λ λ
=
=
−
=
−
= =
=
∑=
≈ − = − + − + ≈ − <<
∑
∑
∑ ∑
Substituting ( )0 1 iagei eβ βλ + ×= into the above equation and denoting 1 1 as ( )iage iβ β× gives
0 1 0 1
0 1 0 1 0 1
0 1 0 1
0 1 0 1
( ) ( )
0 0
( ) ( ) ( )
0 0
( ) 2 ( )
0 0
( ) 2 ( )
0 0 0
Prev 1ji
j ki
j k
jij j k
j k
jij j k
j k
ji ij j k
j j k
e e
e e e
e e
e e
β β β β
β β β β β β
β β β β
β β β β
+ +
= =
+ + +
= =
+ + +
= =
+ + +
= = =
⎡ ⎤⎛ ⎞≈ −⎢ ⎥⎜ ⎟
⎝ ⎠⎣ ⎦⎡ ⎤
= −⎢ ⎥⎣ ⎦⎡ ⎤
= −⎢ ⎥⎣ ⎦
= −
∑ ∑
∑ ∑
∑ ∑
∑ ∑∑
The prevalence at age i ( ˆPrevi ) can therefore be estimated by ‘plugging in’ the ML
estimates 0β̂ and )(ˆ1 iβ . The delta method (Armitage et al, 2002), which is a first order
approximation based on a Taylor series expansion, can then be used to provide an
estimate of the variance of ˆPrevi .
If 00
ˆPrevˆ
iDβ
∂=
∂ and 1
1
ˆPrevˆ
iDβ
∂=
∂ then the delta method gives
[ ] 0 0 1
0 1 1
0 0 1 1
20
0 1 21
2 2 2 20 0 1 1
ˆ ˆˆ ˆvar(Prev )
ˆ ˆ
ˆ ˆ ˆ2
i
DD D
D
D D D D
β β β
β β β
β β β β
σ σ
σ σ
σ σ σ
⎡ ⎤ ⎡ ⎤= ⎢ ⎥ ⎢ ⎥
⎣ ⎦⎢ ⎥⎣ ⎦= + +
Under the log-linear model,

87
0 1 0 1
0 1 0 1
0 1 0 1
( ) 2 ( )
0 00
( ) 2 ( )
0 0 0
( ) ( )
0 0
Prev 2
2
1 2
jij j ki
j k
ji ij j k
j j k
jij k
j k
e e
e e
e e
β β β β
β β β β
β β β β
β+ + +
= =
+ + +
= = =
+ +
= =
⎧ ⎫∂≈ −⎨ ⎬∂ ⎩ ⎭
= −
⎛ ⎞= −⎜ ⎟
⎝ ⎠
∑ ∑
∑ ∑∑
∑ ∑
and
0 1 0 1
0 1 0 1
( ) 2 ( )
0 01
( ) 2 ( )
0 0 0
Prev ( )
( )
jij j ki
j k
ji ij j k
j j k
je j k e
je j k e
β β β β
β β β β
β+ + +
= =
+ + +
= = =
⎧ ⎫∂≈ − +⎨ ⎬∂ ⎩ ⎭
= − +
∑ ∑
∑ ∑∑
The 95% confidence bounds for prevalence at each age i can be estimated as
( )ˆ ˆ ˆPrev 1.96 var(Prev )i i± × .
2.9.2. Comparison of the observed and expected prevalences within a sample
Finally, we must estimate the expected number of cancers amongst the proband relatives
under the null hypothesis H0 that the relatives are a random sample of particular ages and
genders from the general population. Consider a single individual and suppose that the
prevalence in the general population for that individual’s age and gender is π .
0, if the individual has no cancerLet X=
1, if the individual has cancer. ⎧⎨⎩
Then, under H0, X has a Bernoulli distribution with parameter π . In particular, under H0,
E(X) , and
var(X) (1 ).
π
π π
=
= −

88
Suppose that π is estimated by π̂ , calculated from a random sample of the general
population. (In our study, π̂ = ˆPrev , the prevalence estimate for the individual based on
the random 1995 National Survey). Using a variance decomposition result based on the
conditional variance of X (see, for example, Lindgren, 1976), we know that
[ ] [ ][ ]
ˆ ˆvar(X) E var(X| = ) var(E X| = )
ˆ ˆ ˆ=E (1 ) var( )ˆ ˆ ˆPrev(1-Prev) var(Prev)
π π
π π π
= Π + Π
− +
≈ +
For a sample of individuals, the observed number of cancers is simply 1
Xn
ii
O=
=∑ .
The expected number of cancers (E) under H0 can therefore be estimated by
O
O
H1
H1
1
E ( X )
E (X )
ˆPrev
n
ii
n
ii
n
ii
E=
=
=
=
=
≈
∑
∑
∑
which is the sum of the estimated gender and age-specific prevalences for each individual
in the sample.
Furthermore,
( )
{ }
O OH H O1 1
1
var X var X because X are independent under H
ˆ ˆ ˆPrev (1-Prev ) var(Prev )
V
n n
i i ii i
n
i i ii
= =
=
⎛ ⎞ =⎜ ⎟⎝ ⎠
≈ +
=
∑ ∑
∑
It is therefore possible to estimate an approximate 95% confidence interval for the
expected number of cancers in the sample under H0 by calculating

89
( )1
ˆPrev 1.96 Vn
ii=
± ×∑
This allowed the observed prevalences of NMSC from the proband relatives to be
compared with the 95% confidence intervals of the estimated Australian population
prevalence.
The difference between observed and expected prevalences for each cancer was deemed
to be significant if the observed prevalence fell outside of the 95% confidence intervals of
the expected prevalence for that cancer.
2.10. Estimating expected prevalence of malignant melanoma
Malignant Melanoma is notifiable and as such we have cancer registry records of the
incidence and prevalence of this disease in the Australian general population. Cancer
registry prevalence of MM was calculated from cancer registry data from 1996, to enable
it to be comparable to the data used in the calculations for BCC and SCC expected
prevalences. Statistician collaborators determined 95% confidence limits for the 1996
Australian registry incidence data using world standardised population data from that
year [395]. The number of expected MMs with 95% confidence intervals was then
estimated from this data for each gender and relative type. For MM, calculations could be
made on all live subjects, as the registry included data on all agre groups by five years to
80 – 84 years. This allowed the observed prevalences of MM from the proband relatives
to be compared with the 95% confidence intervals of the estimated Australian population
prevalence of MM.

90
Chapter 3: Incidence of skin cancer in families of BCC probands
3.1. Introduction
Despite being the most common of all cancers, almost nothing is known about the
patterns and causes of familial aggregation of basal cell carcinoma in the population.
Studies of susceptibility to this disease to date have either focussed on the specific, rare
familial syndrome NBCCS (see section 1.5.4), in which features other than BCC must be
present, or have assessed risk factors without making use of the information that family
history can provide (section 1.4).
Systematic study of the patterns of clustering of other common tumour types has given
completely new insights into their causes. They have led to successful mapping of new
susceptibility loci and the development of genetic models incorporating rare high-
penetrance gene mutations and common medium- and low-penetrance genetic variants.
This complex genetic aetiology, coupled with the influence of the environment has
furthermore led to the recognition that risks caused by even classic susceptibility gene
mutations are highly dependent on an individual’s and a family’s overall risk profile
(section 1.11). There is no reason why BCC ought not to be subject to the same
complexities.
One major BCC susceptibility gene, PTCH, is well known to cause familial BCC
susceptibility in the context of Gorlin syndrome; its alleles are probably very rare, but
confer risks of up to 900- fold, depending on the baseline incidence in the population (see
section 1.5.4). It is not known to what extent familial BCC susceptibility occurs other
than in association with Gorlin syndrome, and if it does, whether it could be accounted
for in part by high-penetrance mutations in PTCH or other genes. No genome-wide
linkage studies have been performed on familial clusters of non-Gorlin-associated BCC;
indeed no such cohorts have been reported.
91
One critically important low-medium genetic risk factor for both BCC and SCC has been
identified: the red hair-associated variant alleles of the pigmentation control gene MC1R
(see section 1.7). In Australian populations these variants have a frequency of around
20% and relative risks of two to four, and are likely to contribute strongly to familial
aggregation of BCC and SCC in European-derived populations. Finally, high-risk
patterns of sun exposure are a ubiquitous risk factor for all forms of skin cancer, with
frequency in the 15-25% range and relative risks of 1.2 -1.9, i.e. in the low range (see
section 1.4.1.4).
The high prevalence of susceptible skin phototypes ie MC1R variants, and of high-risk
sun exposures in Australia suggests that a large proportion of cases of BCC and SCC in
the population will be due to these two risk factors alone. They are both commonly
shared in families and are risk factors for SCC and melanoma, so it would be predicted
that these two skin cancers would also co-aggregate strongly with BCC in families.
The present study sought to test this hypothesis by focussing on a cohort of individuals
that had developed BCC much earlier than average, and therefore might be enriched for
BCC risk factors; examining the incidence of skin cancer among their relatives, and
conducting a preliminary study of the factors associated with BCC by comparing these
cases with unaffected siblings. The incidence of BCC and SCC was confirmed separately
in relatives of probands, and this may establish whether there is a differential risk in
relatives of people with early-onset BCC with respect to these two forms of NMSC. A
greater risk of BCC than SCC in relatives may suggest the influence of BCC-specific risk
factors on this group. In this chapter the patterns of aggregation and incidence of skin
cancers are described in a series of 56 individuals who developed BCC under the age of
40, and in their close relatives.
3.2. Results
3.2.1. Subject selection and characteristics
3.2.1.1.Probands
92
The primary subjects ascertained for the study were individuals diagnosed with
histologically-confirmed BCC at the Skin and Cancer Foundation in the year 2000, who
were under the age of 40 at the time of diagnosis (see section 2.1.2). After obtaining
treating doctors’ consent, subjects were approached first by mail and then by telephone
with information about the study and an invitation to participate. 56 of the 201 eligible
subjects consented to the study. 23 of 201 were refused contact by their treating doctor,
50 actively or passively refused, 13 were not contactable after multiple attempts, and for
59 it was unclear whether or not the patient had received the information or not. The
percentage of eligible, contactable subjects consented is between 56/165 (34%) and
56/103 (53%) depending on how many ‘not contactable’ subjects actually received the
invitation.
The probands were 18 men and 38 women aged 22 to 44 years (at recruitment) who
together had a median age of 40 years. Both the female and the male probands had a
median age of 40 years at recruitment.
3.2.1.2.Family members
The family structures for the 56 families were determined by interviewing probands
about their first degree relatives; permission was sought to contact all of these individuals
which included 260 parents and siblings. Of these 260 eligible first-degree relatives, 17
were denied contact by probands including 12 siblings and five parents. For two of these
relatives the reason given by probands was that it was due to mental or medical illness,
for six it was due to intra-family discord, for four it was because it was felt that they
would not be interested in participating, and for five no reason was given. Interviewers
contacted all of those relatives for whom permission was granted for contact by the
proband. Overall, 82% (212/260) of the eligible first-degree relatives consented to
participate in the study. Excluding those for whom no proband consent for contact was
given, there was an 87% (243/260) overall participation rate. This included 86% (89/103)
of the available parents and 88% (123/140) of the siblings. Two probands were adopted
and had no knowledge of their biological relatives; this meant that approximately four

93
(212/54) first-degree relatives were recruited for participation per proband where
biological relatives were available to approach.
Overall, 212 first-degree relatives of probands participated in the study, of which 50%
(107/212) were men and 50% (105/212) were women. Of the 123 recruited siblings of
probands, 53% (65/123) were men and 47% (58/123) were women. Included in this
group were two half-siblings (sharing one biological parent), and one who was deceased.
Of the 89 parents recruited, 47% (42/123) were men and 53% (47/89) were women,
including 17 who were deceased. Consent and cancer histories for deceased relatives
were obtained by proxy interview with another recruited family member.
3.2.2. Skin cancer prevalence
Each subject was asked whether they had been diagnosed with any form of cancer, and
all self-reports were followed up with an attempt at histopathological verification (see
section 2.2). In the case of NMSC reports, the treating doctor was approached, and if this
contact was unsuccessful then the local pathology service was contacted. Where multiple
reports were received, they were all followed up until at least one confirmation of NMSC
was received. Where more than one NMSC was confirmed, the earliest dates of BCC and
SCC diagnoses were used for subsequent analysis.
Table 3.1 describes for each proband the total number of subjects that were recruited in
each family; the number of them who have had histologically confirmed BCC, SCC, and
melanoma (MM), and the age of onset for each affected family member.

94
Table 3.1 Number of family members with BCC, SCC, and MM (proband and first degree relatives) for each proband Proband ID
Total number of family members affected
Number of BCC-affected family members
Age of onset of BCC#
Number of SCC-affected family members
Age of onset of SCC
Number of NMSC-affected family members
Number of MM-affected family members
Age of onset of MM
8755 5 2 31, 34* 1 55 3 8756 2 1 38* 0 - 1 8759 4 1 37* 2 38, 60 3 8761 4 2 34*, 62 1 65 2 8762 6 1 31* 0 - 1 8763 8 2 36*, 43 2 41, 71 4 1 42 8764 6 1 36* 0 - 1 8766 4 1 39* 0 - 1 8767 4 1 40* 0 - 1 8768 4 2 20*, 48 0 - 2 8769 5 1 27* 0 - 1 8770 5 3 39*, 69,
70 1 75 3 2 33, 78
8771 5 1 36* 1 71 2 8772 3 1 37* 0 - 1 8773 6 2 39*, 52 0 - 2 8774 3 1 22* 0 - 1 8775 7 1 39* 1 81 2 8776 5 1 29* 0 - 1 8778 2 1 37* 0 - 1 8779 5 1 33* 0 - 1 8781 3 2 35*, 51 1 51 2 8794 6 1 39* 0 - 1 8797 9 2 35*, 53 2 53, 42 3 8800 10 4 26, 38*,
43, 69 1 70 4
8810 4 1 32* 0 - 1 8815 5 2 19*, 58 0 - 2 8816 9 6 39*, 44,
50, 50, 53, 76
2 53, 76 6 2 38, 49
8818 7 2 37*, 44 0 - 2 8825 3 2 34*, 73 1 67 3 1 60 8826 2 1 35* 0 - 1 8832 2 1 35* 0 - 1 8840 6 6 23, 23,
25, 28*, 49, 54
2 42, 46 6 3 23, 37, 47
8846 4 3 26*, 55, 56
0 - 3
8857 4 2 35*, 63 0 - 2 8928 4 1 27* 0 - 1 9022 9 6 35*, 36, 0 - 6

95
44, 54, 58, 74
9094 5 1 39* 1 65 2 9125^ 6 3 25, 37,
38* 2 43, 67 4
9167 4 1 32* 0 - 1 9168 5 1 38* 0 - 1 9194 4 2 33*, 62 1 64 2 9207 2 1 36* 0 - 1 9208 1 1 38* 0 - 1 9240 3 1 33* 0 - 1 9241 7 1 28* 0 - 1 9242 7 2 30*, 50 0 - 2 9273 1 1 31* 0 - 1 9274 4 3 34*, 38,
59 1 59 4 1 59
9275 5 3 30*, 45, 45
0 - 3
9334 1 1 36* 0 - 1 9445 5 5 38*, 50,
51, 68, 75
1 78 5 1 53
9446 9 1 35* 1 83 2 9459 5 1 37* 1 70 2 9465 6 1 31* 0 - 1 9491 4 3 30, 31*,
52 0 - 3
9527 4 1 39* 0 - 1 *indicates the age of onset for the proband, the person first entering the study and the person screened for mutations in the PTCH gene # Underlined age indicates that the subject is deceased ^ Gorlin syndrome reported in family
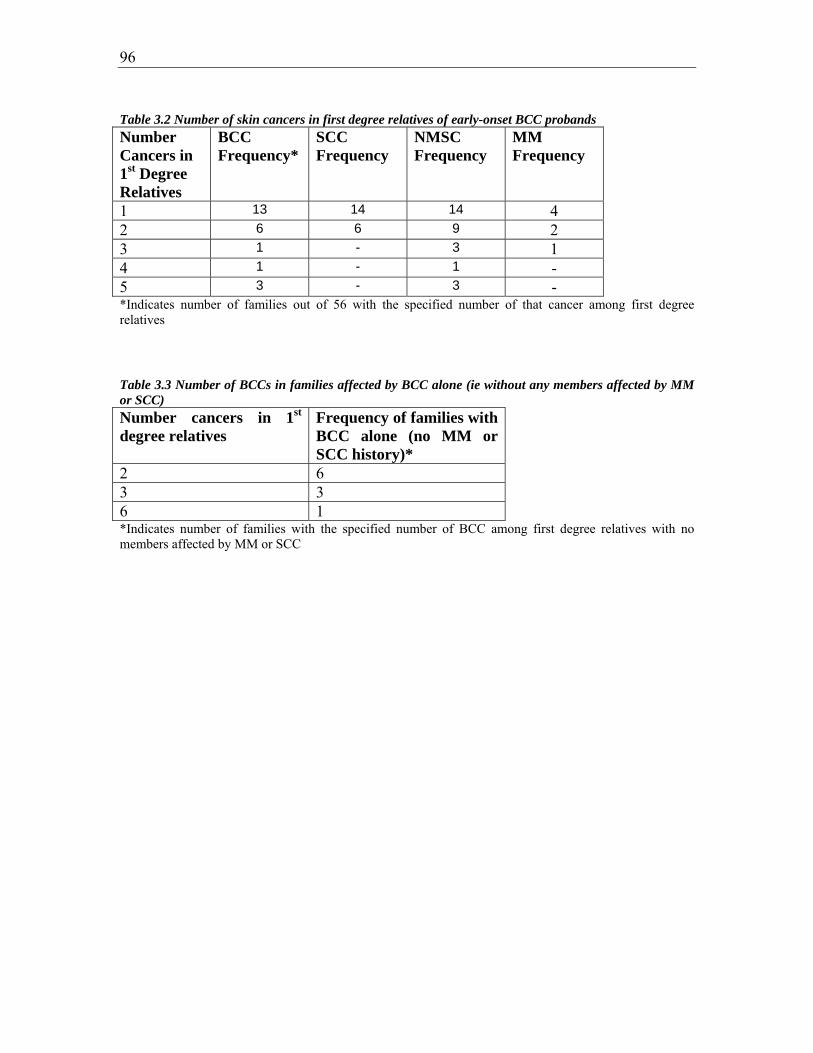
96
Table 3.2 Number of skin cancers in first degree relatives of early-onset BCC probands
Number Cancers in 1st Degree Relatives
BCC Frequency*
SCC Frequency
NMSC Frequency
MM Frequency
1 13 14 14 4 2 6 6 9 2 3 1 - 3 1 4 1 - 1 - 5 3 - 3 - *Indicates number of families out of 56 with the specified number of that cancer among first degree relatives
Table 3.3 Number of BCCs in families affected by BCC alone (ie without any members affected by MM or SCC) Number cancers in 1st degree relatives
Frequency of families with BCC alone (no MM or SCC history)*
2 6 3 3 6 1 *Indicates number of families with the specified number of BCC among first degree relatives with no members affected by MM or SCC

97
The 56 probands had developed BCC at a median age of 36. None of them had developed
either SCC or MM.
Overall, 28% (60/212) of the first-degree relatives had been affected by NMSC, including
20% (25/123) of the siblings and 40% (36/89) of the parents. Taking the pool of relatives
as a whole, the earliest confirmed age of onset of NMSC for each affected individual
ranged from 23.0 to 83.0 years, with a median age of 53.0 years. As is expected from
ascertainment bias in family studies, ages of onset for siblings (median 42.0, range 23.0 –
54.0) were earlier than for parents (median 62.0, range 46.0 – 84.0) because, as a
generation, the siblings have lived through fewer years at risk. The median age of
diagnosis for mothers (58.5 years) was non-significantly earlier than for fathers (65.0
years)(Χ2 = 56, p=0.229), and the median age of diagnosis for brothers (41.0 years) was
earlier than for sisters (43.0 years) (X2 = 20, p=0.220).
More than half the probands (30/56, 54%) had at least one first-degree relative with
NMSC, more than one quarter (16/56, 29%) had two or more, and in three cases (3/56,
5%) five relatives were affected by NMSC. These affected relatives included 23 siblings
and 24 parents affected by BCC, and five siblings and 22 parents affected with SCC.
Three siblings and ten parents had been affected by both cancer types.
Overall, 22% (47/212) of the first-degree relatives had been affected by BCC, including
19% (23/123) of the siblings and 27% (24/89) of the parents. When considering the pool
of relatives as a whole, the earliest confirmed age of onset of BCC for each affected
individual ranged from 23.0 to 76.0 years, with a median age of 51.0 years. The earliest
confirmed age of onset of BCC among the siblings ranged from 23.0 to 54.0 years, with a
median age of 43.0. The earliest confirmed age of onset of BCC among the parents
ranged from 48.0 to 76.0 years with a median age of 58.5 years. The median age of
diagnosis for mothers (57.0 years) was earlier than for fathers (62.0 years) (X2 = 6,
p=0.199), whereas the median age of diagnosis for brothers (50.0 years) was earlier than
for sisters (57.0 years) (X2 = 12, p=0.213).

98
Nearly one half of the probands (24/56, 43%) had at least one first-degree relative with
BCC, one fifth (11/56, 20%) had two or more, and in three cases (3/56, 5%) five relatives
were affected by BCC.
Overall, 13% (27/212) of first-degree relatives had been confirmed to be affected by
SCC, including 4% (5/123) of the siblings and 25% (22/89) of the parents. When
considering the pool of relatives as a whole, the earliest confirmed age of onset of SCC
for each affected individual ranged from 38.0 to 83.0 years, with a median age of 64.5
years. The earliest confirmed age of onset of SCC among the siblings ranged from 38.0 to
53.0 years, with a median age of 42.0 years. The earliest confirmed age of onset of SCC
among the parents ranged from 42.0 to 83.0 years with a median age of 67.0 years. The
median age of diagnosis of SCC for fathers (66.0 years) was slightly earlier than for
mothers (67.0 years), and the median age for brothers (41.0 years) was slightly earlier
than for sisters (42.5 years).
More than one third of the probands (20/56, 36%) had at least one first-degree relative
with SCC, and in six cases (6/56, 11%) two relatives were affected by SCC. There were
no cases where more than two relatives within a family were affected by SCC. In first-
degree relatives of probands, there were nearly twice as many BCC-affected relatives as
SCC-affected ones, with a BCC-affected: SCC-affected ratio of 1.7:1.
Overall, 5% (11/56) of first-degree relatives had been confirmed to be affected by MM,
including 4% (5/123) of the siblings and 7% (6/89) of the parents. When considering the
pool of relatives as a whole, the earliest confirmed age of onset of MM for each affected
individual ranged form 23.0 to 78.0 years, with a median age of 47.0 years. The earliest
confirmed age of onset of MM among the siblings ranged from 23.0 to 53.0 years with a
median age of 38.0 years. The earliest confirmed age of onset of MM among the parents
ranged from 37.0 to 78.0 years, with a median age of 53.0 years.
More than one tenth (7/56, 12.5%) of the probands had at least one first-degree relative
with MM; in two cases (2/56, 4%) two relatives were affected by MM and for one case
(1/56, 2%) there were three relatives affected by MM.

99
It can be hypothesised that increased susceptibility to BCC primarily reflects a general
increase in risk of skin cancer, as might be related to high sun exposure or a sun-
vulnerable skin type. This hypothesis predicts that BCC, SCC and possibly melanoma
would co-aggregate in families. The incidence of NMSC in the cohort of relatives is
formally compared with incidence data from the general population in the next section.
However a survey of the patterns of aggregation gives evidence both for and against this
hypothesis. Among 30 probands with a positive family history of NMSC in first-degree
relatives, 20 had at least one relative affected by SCC; so the majority of family clusters
included both BCC and SCC. However, of the other ten probands there were four who
had at least two first-degree relatives affected by BCC and none affected by SCC, one
being part of a six-case cluster of BCC (see table 3.3). This amounts to nearly one fifth of
families affected by BCC alone, and suggests that a subset of the probands shares a
specific susceptibility to BCC, rather than to NMSC generally, with their relatives.
One proband (ID 9125) out of 56 (2%) reported a personal history of clinically diagnosed
Gorlin syndrome. Two of her three siblings had histologically confirmed BCC, with both
of these affected siblings having had an early-onset of their tumours; her sister at 37 years
and her brother at 25 years of age. Two of her first-degree relatives also had a history of
SCC with her father having been affected at 67 years of age and her sister at 43 years of
age (see appendix 7.7 family ID 29125 for pedigree). Clinically, her mother did not have
Gorlin syndrome and her father was deceased at the time of her diagnosis. From a review
of his records a diagnosis could not be made conclusively. Mutation analysis of the
PTCH gene in several family members at the Queensland Institute of Medical Research
had revealed no PTCH mutation in this family (participant’s medical record).
3.3. Comparison of NMSC prevalence in relatives with that in the Australian
population
As described in section 2.9.1, the term “prevalence” used here refers to prevalence of a
prior diagnosis of NMSC. In order to address whether the prevalence of previous NMSC
in this cohort of relatives differed from that expected for this group, it was necessary to
make use of data from the most recent Australian survey of the population incidence of
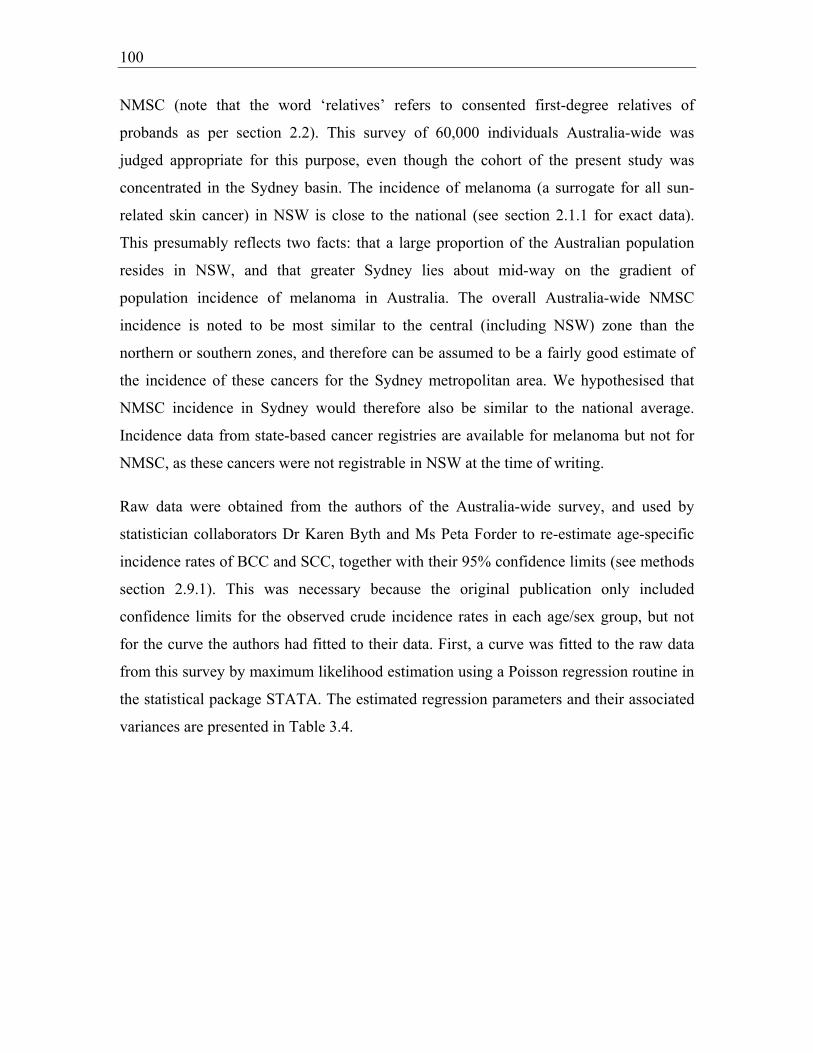
100
NMSC (note that the word ‘relatives’ refers to consented first-degree relatives of
probands as per section 2.2). This survey of 60,000 individuals Australia-wide was
judged appropriate for this purpose, even though the cohort of the present study was
concentrated in the Sydney basin. The incidence of melanoma (a surrogate for all sun-
related skin cancer) in NSW is close to the national (see section 2.1.1 for exact data).
This presumably reflects two facts: that a large proportion of the Australian population
resides in NSW, and that greater Sydney lies about mid-way on the gradient of
population incidence of melanoma in Australia. The overall Australia-wide NMSC
incidence is noted to be most similar to the central (including NSW) zone than the
northern or southern zones, and therefore can be assumed to be a fairly good estimate of
the incidence of these cancers for the Sydney metropolitan area. We hypothesised that
NMSC incidence in Sydney would therefore also be similar to the national average.
Incidence data from state-based cancer registries are available for melanoma but not for
NMSC, as these cancers were not registrable in NSW at the time of writing.
Raw data were obtained from the authors of the Australia-wide survey, and used by
statistician collaborators Dr Karen Byth and Ms Peta Forder to re-estimate age-specific
incidence rates of BCC and SCC, together with their 95% confidence limits (see methods
section 2.9.1). This was necessary because the original publication only included
confidence limits for the observed crude incidence rates in each age/sex group, but not
for the curve the authors had fitted to their data. First, a curve was fitted to the raw data
from this survey by maximum likelihood estimation using a Poisson regression routine in
the statistical package STATA. The estimated regression parameters and their associated
variances are presented in Table 3.4.

101
Table 3.4 Maximum likelihood parameters and associated variances for incidence of BCC and SCC in data from Staples et al [1] using a Poisson regression routine
Cancer Group 0β̂ 1̂β Var( 0β̂ ) Var( 1̂β ) Cov( 0β̂ , 1̂β )
SCC Male -11.5525 0.113261 0.468784 0.000129 -0.00768
Female -11.8153 0.1082343 0.722557 0.000203 -0.011942
BCC Male -9.112422 0.0865304 0.122610 0.000037 -0.00208
Female -8.058947 0.0608958 0.109614 0.000037 -0.001963
The incidence rates for BCC and SCC are shown in Figure 3.1, from Staples et al. (1)
together with the curve newly fitted to the data.

102
Figure 3.1 Fitted curves for incidence rates for BCC and SCC in men and women in Australia in 1996 (re-analysis of data provided from Staples et al [1])
10 20 30 40 50 60Age
0
500
1000
1500
2000
2500
SCC Incidence
FemaleMaleFemaleMale
10 20 30 40 50 60Age
0
500
1000
1500
2000
2500
BCC Incidence

103
Cumulative risk (prevalence of a prior diagnosis) of BCC and SCC in Australia was then
calculated for men and women of various ages, together with their associated 95%
confidence limits, from the fitted data. These results are summarized in tables 3.5 and 3.6
and shown graphically in Figure 3.2.
Table 3.5 Estimated prevalence (with 95% CI) of SCC and BCC in Australian men in 1996 (re-analysis of data provided from Staples et al [1]) Age Estimated Prevalence (cases per 100,000 people)
SCC (95% CI) BCC (95% CI)
15 41 (0,87) 364 (154,575)
20 78 (0,160) 627 (293,961)
25 144 (8,280) 1030 (529,1531)
30 260 (40,480) 1648 (927,2368)
35 464 (118,810) 2592 (1589,3594)
40 821 (293,1350) 4028 (2680,5375)
45 1448 (665,2232) 6196 (4448,7944)
50 2542 (1423,3662) 9431 (7259,11603)
55 4438 (2908,5967) 14160 (11593,16728)
60 7677 (5678,9675) 20844 (17961,23727)
65 13074 (10446,15703) 29703 (26577,32829)
70 21622 (17700, 25546) 39931 (36771, 43091)

104
Figure 3.2 Estimated prevalence (with 95% CI) of SCC (A) and BCC (B) in Australian men and women in 1996 (re-analysis of data provided from Staples et al [1]) A.
SCC prevalence
0
5000
10000
15000
20000
25000
30000
15 20 25 30 35 40 45 50 55 60 65 70
Age (years)
Prev
alen
ce (p
er 1
00,0
00)
Male95% CI FemaleFemale95% CI Male

105
B.
BCC prevalence
0
5000
10000
15000
20000
25000
30000
35000
40000
45000
50000
15 20 25 30 35 40 45 50 55 60 65 70
Age (years)
Prev
alen
ce (p
er 1
00,0
00)
Male95% CI FemaleFemale95% CI Male
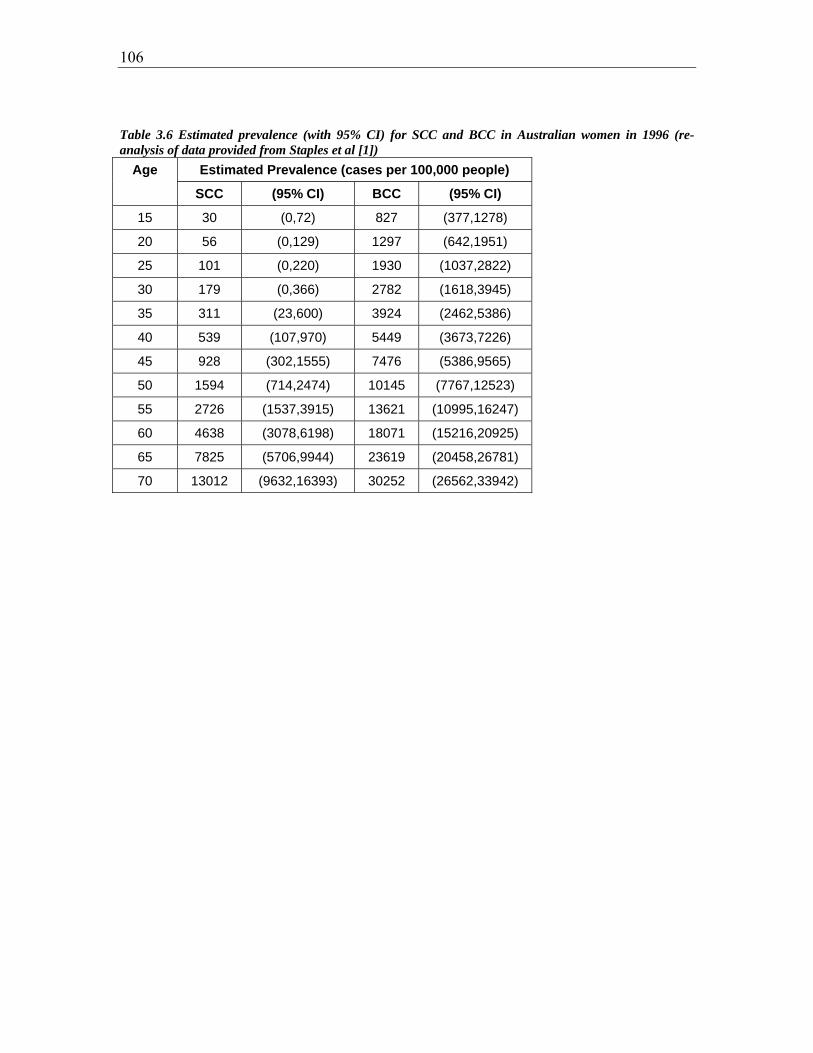
106
Table 3.6 Estimated prevalence (with 95% CI) for SCC and BCC in Australian women in 1996 (re-analysis of data provided from Staples et al [1])
Age Estimated Prevalence (cases per 100,000 people)
SCC (95% CI) BCC (95% CI)
15 30 (0,72) 827 (377,1278)
20 56 (0,129) 1297 (642,1951)
25 101 (0,220) 1930 (1037,2822)
30 179 (0,366) 2782 (1618,3945)
35 311 (23,600) 3924 (2462,5386)
40 539 (107,970) 5449 (3673,7226)
45 928 (302,1555) 7476 (5386,9565)
50 1594 (714,2474) 10145 (7767,12523)
55 2726 (1537,3915) 13621 (10995,16247)
60 4638 (3078,6198) 18071 (15216,20925)
65 7825 (5706,9944) 23619 (20458,26781)
70 13012 (9632,16393) 30252 (26562,33942)
107
3.3.1. Comparison of observed and expected prevalence of NMSC in first
degree relatives
The population data from Staples et al. were only age-stratified to the age of 70 yr, so
analysis of the cohort of relatives in the present study was restricted to data from the
siblings and parents of the BCC proband cases who were alive and aged less than 70
years. Of the 123 siblings for whom data was obtained, one deceased subject was
removed from analysis, leaving 122 sibling individuals (63 men, 59 women). Of the 89
parents for whom data was available, 17 subjects were deceased and 29 subjects were
removed because they were aged 70 years or older. Thus, the parental group for analysis
included only 43 subjects (18 men, 25 women). The subjects whose data was removed
because they were deceased are identified in table 3.1 by underlining of the age of onset
of their cancers.
For each group, the observed prevalence of a prior diagnosis of BCC and SCC was
calculated. The method outlined above was then used to calculate the expected number of
BCC and SCC in that group of relatives, taking into account their current age, and their
95% CIs, under the null hypothesis that the subjects had the same prevalence distribution
as the general population. The observed and expected prevalences are presented in table
3.7 below.

108
Table 3.7 Observed and expected prevalence of skin cancers in siblings and parents of proband subjects by gender
Group Gender Cancer Type
Observed prevalence
Expected prevalence
(95% C.I.)
Relative Risk
Siblings Men SCC 1 0.70 (0.00, 2.32) 1.43
BCC 15 2.87 (0.00, 6.05) 5.23*
Women SCC 3 0.55 (0.00, 1.99) 5.45*
BCC 8 4.05 (0.27, 7.82) 1.98*
Parents Men SCC 7 1.69 (0.00, 4.09) 4.14*
BCC 5 4.16 (0.70, 7.63) 1.20
Women SCC 1 1.18 (0.00, 3.24) 0.85
BCC 9 4.22 (0.61, 7.84) 2.13*
*indicates result was significant at 0.05 level (non-overlapping 95% confidence limits of expected and observed prevalences, as per section 2.9.2)
Significantly more BCC cases were observed among the siblings, both brothers and
sisters (relative risks 5.23 and 1.98 respectively), and in the mothers of probands (RR
2.13), than expected. Significantly more SCC cases were observed among the sisters (RR
5.45) and fathers (RR 4.14) of probands than expected.
The degree of familial aggregation of NMSC therefore differed by sex, relative and
cancer type. In brothers, only BCC risk was elevated, whereas sisters had increased risks
of both BCC and SCC. Among mothers only BCC risk was elevated, and among fathers
only SCC risk was increased. Taken together, these data show that being a first-degree
relative of a case of early-onset BCC was associated with marked increases in risk of
NMSC, both BCC and SCC.
3.3.2. Comparison of observed and expected MM in first degree relatives
The expected number of malignant melanomas for the group of first degree relatives was
calculated directly from the 1996 Australian Cancer Registry data (see methods section
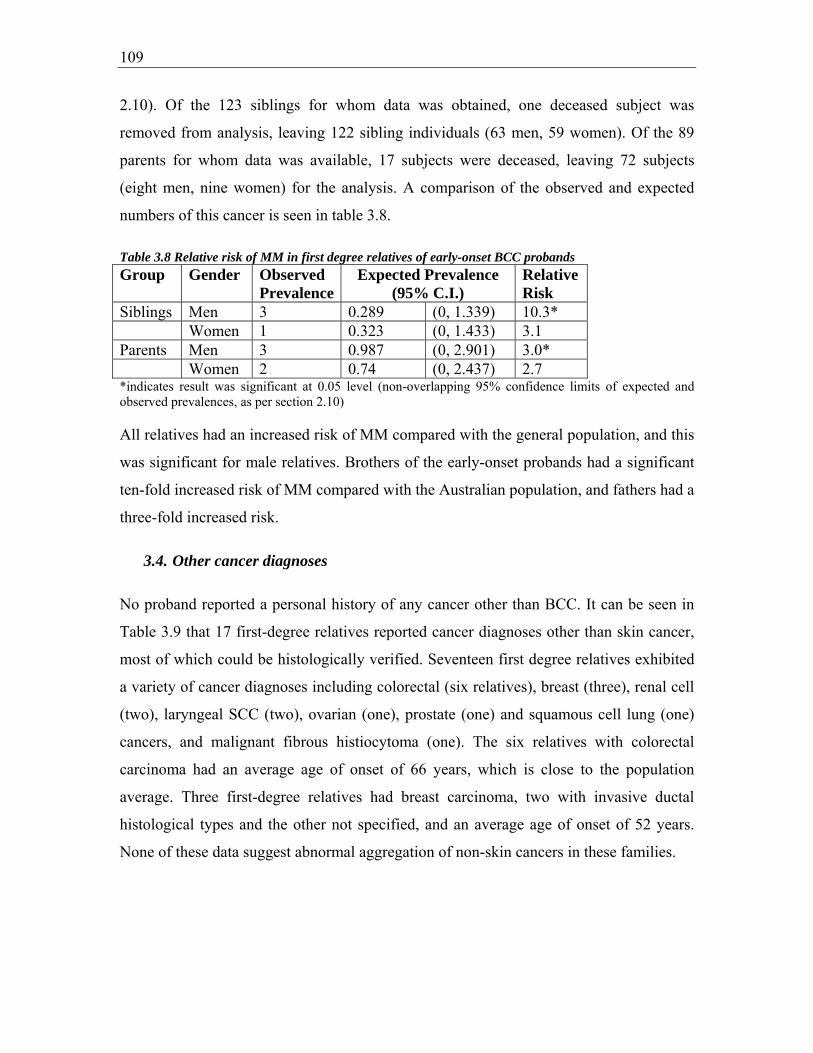
109
2.10). Of the 123 siblings for whom data was obtained, one deceased subject was
removed from analysis, leaving 122 sibling individuals (63 men, 59 women). Of the 89
parents for whom data was available, 17 subjects were deceased, leaving 72 subjects
(eight men, nine women) for the analysis. A comparison of the observed and expected
numbers of this cancer is seen in table 3.8.
Table 3.8 Relative risk of MM in first degree relatives of early-onset BCC probands Group Gender Observed
PrevalenceExpected Prevalence
(95% C.I.) Relative Risk
Siblings Men 3 0.289 (0, 1.339) 10.3* Women 1 0.323 (0, 1.433) 3.1 Parents Men 3 0.987 (0, 2.901) 3.0* Women 2 0.74 (0, 2.437) 2.7 *indicates result was significant at 0.05 level (non-overlapping 95% confidence limits of expected and observed prevalences, as per section 2.10)
All relatives had an increased risk of MM compared with the general population, and this
was significant for male relatives. Brothers of the early-onset probands had a significant
ten-fold increased risk of MM compared with the Australian population, and fathers had a
three-fold increased risk.
3.4. Other cancer diagnoses
No proband reported a personal history of any cancer other than BCC. It can be seen in
Table 3.9 that 17 first-degree relatives reported cancer diagnoses other than skin cancer,
most of which could be histologically verified. Seventeen first degree relatives exhibited
a variety of cancer diagnoses including colorectal (six relatives), breast (three), renal cell
(two), laryngeal SCC (two), ovarian (one), prostate (one) and squamous cell lung (one)
cancers, and malignant fibrous histiocytoma (one). The six relatives with colorectal
carcinoma had an average age of onset of 66 years, which is close to the population
average. Three first-degree relatives had breast carcinoma, two with invasive ductal
histological types and the other not specified, and an average age of onset of 52 years.
None of these data suggest abnormal aggregation of non-skin cancers in these families.

110
Table 3.9 All cancer diagnoses (excluding skin cancers) in first degree relatives of probands Family ID Relationship to
Proband Gender Cancer diagnosis Age of
Onset 28775 Sibling Female Breast (invasive
ductal) 47
28770 Parent Male Laryngeal SCC 77 29779 Parent Female Ovarian 45 28781 Parent Male Colorectal 65 28797 Parent Female Colorectal 65 28816 Parent Male Renal Cell
Carcinoma 68
28818 Parent Female Breasta 49 28825 Parent Male Colorectal 69 28857 Parent Male Laryngeal SCC 55 29094 Parent Male Colorectal 58 29168 Parent Female Colorectal 73 29168 Parent Male Squamous Cell
Lung 69
29240 Parent Male Malignant fibrous histiocytoma (sarcoma)
62
29275 Parent Female Breast (invasive ductal)
60
28767 Parent Male Renal Cell Carcinoma
61
28762 Parent Female Colorectal 67 28762 Parent Male Prostate 70 aClinical information only for this patient (not histologically verified)

111
3.5. Pedigrees of affected families
Of the 56 probands included in this study, three had histopathologically-verified
clustering of 6 cases of BCC among first-degree relatives. As is implied by the analysis in
section 3.3, and shown in Figure 3.3, most families with more than one NMSC exhibited
a combination of both types of skin cancer. However some families’ cancer histories
included only BCC (e.g. see pedigree for family ID 29022).
Figure 3.3. Pedigrees for families 28840, 28816, and 29022
28840
23
46
2528m
49m47 42
54m
37m
23m
23
8842 8841 7/8/1945
BCC 22/6/2000 SCC 19/2/1988 MM 22/10/1992
28/4/1941 BCC 11/11/1990
SCC 4/5/1987 MM 22/6/1978
8843 8840 8844 8845
14/8/1969 BCC 15/9/1992
22/11/1971 BCC 21/3/2000
22/6/1976 BCC 7/1/2002
22/8/78 BCC 14/12/2001 MM 14/12/2001
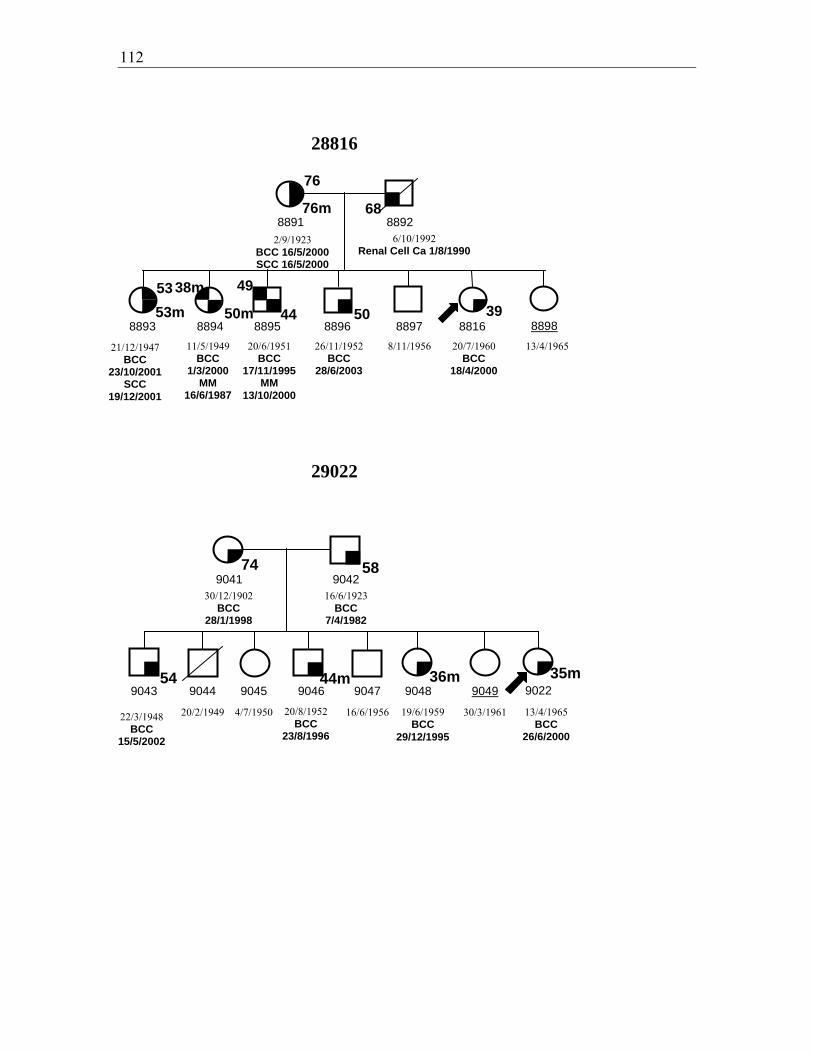
112
28816
29022
54 36m
74
44m 35m
9041 9042
9043 9044 9045 9046 9047 9048 9049 9022
30/12/1902 BCC
28/1/1998
16/6/1923 BCC
7/4/1982
20/2/1949 4/7/1950 16/6/1956 30/3/1961
58
76m
44
8891 8892
8893 8894 8895 8896 8897 8816 8898
2/9/1923 BCC 16/5/2000 SCC 16/5/2000
11/5/1949 BCC
1/3/2000 MM
16/6/1987
20/6/1951 BCC
17/11/1995 MM
13/10/2000
26/11/1952 BCC
28/6/2003
8/11/1956
20/7/1960 BCC
18/4/2000
13/4/1965
76
68
6/10/1992 Renal Cell Ca 1/8/1990
4953
53m 50 3950m
38m
21/12/1947 BCC
23/10/2001 SCC
19/12/2001
22/3/1948 BCC
15/5/2002
20/8/1952 BCC
23/8/1996
19/6/1959 BCC
29/12/1995
13/4/1965 BCC
26/6/2000
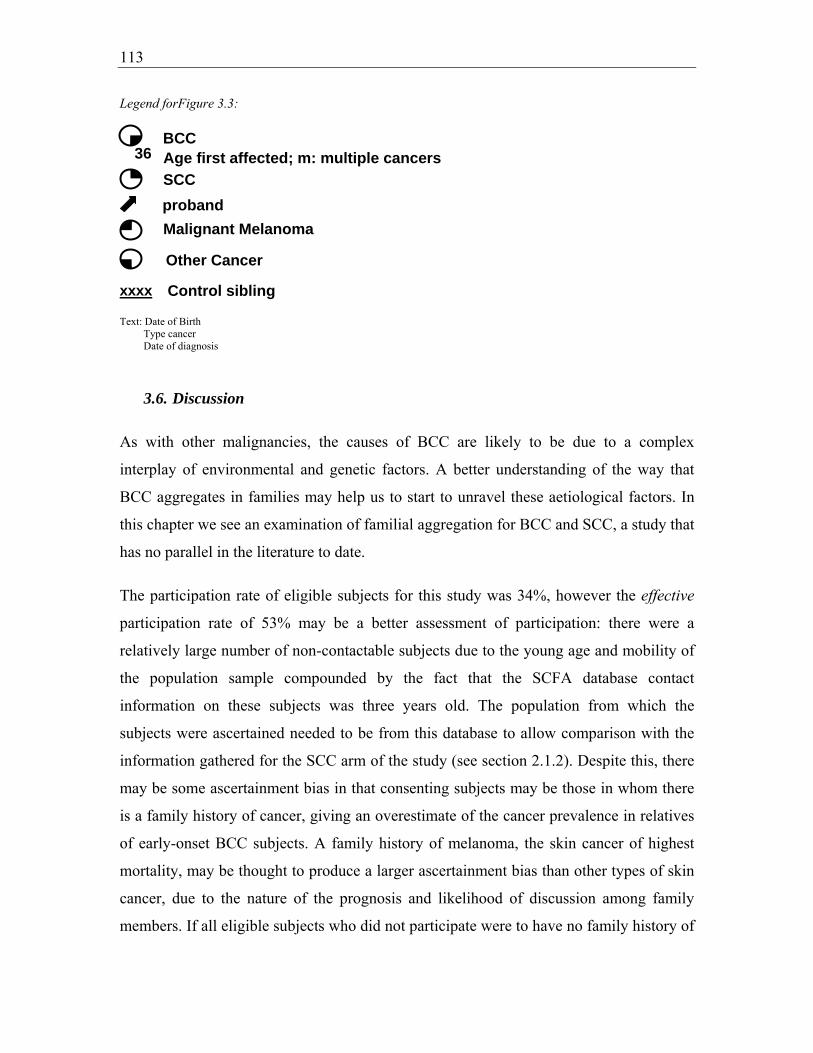
113
Legend forFigure 3.3:
Text: Date of Birth Type cancer Date of diagnosis
3.6. Discussion
As with other malignancies, the causes of BCC are likely to be due to a complex
interplay of environmental and genetic factors. A better understanding of the way that
BCC aggregates in families may help us to start to unravel these aetiological factors. In
this chapter we see an examination of familial aggregation for BCC and SCC, a study that
has no parallel in the literature to date.
The participation rate of eligible subjects for this study was 34%, however the effective
participation rate of 53% may be a better assessment of participation: there were a
relatively large number of non-contactable subjects due to the young age and mobility of
the population sample compounded by the fact that the SCFA database contact
information on these subjects was three years old. The population from which the
subjects were ascertained needed to be from this database to allow comparison with the
information gathered for the SCC arm of the study (see section 2.1.2). Despite this, there
may be some ascertainment bias in that consenting subjects may be those in whom there
is a family history of cancer, giving an overestimate of the cancer prevalence in relatives
of early-onset BCC subjects. A family history of melanoma, the skin cancer of highest
mortality, may be thought to produce a larger ascertainment bias than other types of skin
cancer, due to the nature of the prognosis and likelihood of discussion among family
members. If all eligible subjects who did not participate were to have no family history of
BCC
SCCproband
36
Malignant Melanoma
Other Cancer
Age first affected; m: multiple cancers
Control sibling
xxxx

114
cancer, then our overestimates would be between 1.9-fold and 2.9-fold at worst (based on
the inverse of the participation rates calculated above).
The participation rate of eligible relatives of this study was very high at over 85% in both
parents and siblings. There was a female preponderance of proband subjects with a F:M
ratio of 2.1:1. As this does not affect the sex distribution of their relatives, and as the sex
ratio of relatives was equal, the bias towards female sex in probands should not affect the
interpretation of cancer prevalence in relatives.
From examination of histopathologically-verified prevalence of NMSC in these 56
families of people with early-onset BCC, it is evident that familial aggregation of NMSCs
is occurring. Over half of the families studied display aggregation of either BCC or SCC
with two thirds of these including a history of both types of NMSC. Significantly, the
other one-third of these families include family members with a history of BCC but not
SCC, and in nearly half of these, clusters of three first-degree relatives or more affected
relatives exist. There are also three families in whom two or more first-degree relatives
were affected by melanoma. Together these results indicate that families of people with
early-onset BCC may be at increased risk for skin cancer in general, and also for BCC in
particular.
Here for the first time, relative risks of BCC, SCC, and MM for first-degree relatives of
early-onset BCC cases have been determined. The computed relative risks confirm
suspicions that arise when looking at the aggregation seen in the pedigrees in these
families: first-degree relatives of people with early-onset BCC have an increased risk of
NMSC. The expected prevalence of NMSCs in the subjects was calculated from data on
the Australian population, and a significantly increased risk of BCC, SCC and melanoma
occurred for first-degree relatives, with differential risks for different relative, sex and
cancer type. Sisters and mothers of probands had a two-fold increased risk of BCC, and
brothers had a 5-fold increased risk of BCC compared with that estimated for the general
population. Sisters and fathers of people with early-onset BCC had over four times the
prevalence of SCC than expected. For melanoma, the increased risk was significant for
male relatives only, with a 10-fold increased risk for brothers of people with early-onset

115
BCC and three-fold for fathers. In general, the relative risks of cancers were greater in
siblings than parents, which is not surprising given the larger baseline risk of parents due
to their more advanced age.
These estimates should be interpreted with the understanding that they are based on some
strong underlying assumptions. Cumulative risk of NMSC was estimated from validated
Australian population annual incidence data (see section 2.9.1). This annual incidence
data was used despite unvalidated lifetime data being available from this survey, as only
validated data was deemed suitable for such an analysis. It was assumed that the period-
and cohort-specific incidence rates for a given age and gender were constant. This
assumption may not be correct especially given the recorded increase in incidence seen in
Australia and internationally over the last few decades (see section 1.3). The national
survey from which the incidence figures were obtained for the estimation of prevalence
suggest that SCC age-specific incidence rates have increased between 1985 and 1995,
while BCC rates have fallen for those aged under 50 years and have risen in those aged
older than 50 years during this same 10-year period [1]. Thus it is possible that estimates
of expected prevalence for SCC are in fact overestimates, such that the risk ratio based on
observed prevalences could be slightly underestimated. Thus the SCC relative risks
calculated are likely to be conservative estimates. If BCC incidence has actually declined
by 10% in people under 50 years of age from 1985 to 1995 as suggested by the latest
national survey, then the BCC relative risk in siblings may be a slight overestimate.
Changes of this magnitude in the younger age group, even if real, cannot fully account
for the two- to five-fold excess of observed to expected BCCs seen in siblings and
mothers of the probands.
Empirical evidence supporting the Poisson model assumptions is illustrated in the close
agreement between the observed and fitted incidence rates provided in figure 3.1. Death
from NMSC is known to be extremely rare in Australia [396]. Although the occurrence
of malignant melanoma is known to be associated with the presence of NMSC, death
from malignant melanoma as an overall cause of death in Australia is also rare.
Therefore, it is reasonable to approximate the incidence processes for SCC and BCC as
acting independently of the overall death process on the Australian population. If
116
probands’ relatives are more prone to death from malignant melanoma which in turn is
associated with increased rates of NMSC, then those relatives with NMSC who died of
melanoma have not been counted amongst the observed cases. This is because only those
relatives who were alive contributed to this observed total. There is, therefore, a
conservative effect on risk assessment due to any association between NMSC incidence
and melanoma death in the probands’ relatives.
It has been observed that the risk of NMSC is lower for immigrants (arriving after the age
of 10 years) than native-born Australians [78]. Consequently, the SCC and BCC
incidence processes do not act independently of the immigration process, as assumed in
our mathematical derivation of estimated prevalences. It is not clear whether the
emigration process acts independently of the SCC and BCC incidence processes.
Unfortunately, using the available data, it is impossible to quantify these effects and those
of other related variables, such as ethnicity and lifetime latitude of residence.
The mean age of diagnosis of BCC in the Australian population has been estimated at 63
for men and 59 for women, and for SCC it is 66 years for men and 64 years for women
[1]. Although these figures cannot be directly compared with those from the subjects of
this study due to differences in ascertainment and measurement; it is evident that mean
ages of onset in the family members of this study were younger for the siblings (as
expected due to ascertainment bias), and of a similar magnitude for parents.
Since the majority of families with aggregation of skin cancer have a combination of
SCC and BCC, and it is likely that general risks for skin cancer are increased in relatives
of people with early-onset BCC. These general risk factors are likely to include
environmental, genetic, and phenotypic risks that are common to UVR-related skin
cancers in general. Environmental risk factors that may to be common to all three types
of skin cancer include sun exposure levels, sun protection measures employed, HPV or
other viral infection, and increased surveillance in family members. Inherited, genetic
characteristics that may cause increased risk to all three types of skin cancer may include
those which relate to pigmentary traits such as MC1R, HPV susceptibility eg through
polymorphism p53Arg, and probably multiple as-yet unidentified genetic susceptibilities.

117
Phenotypic risk factors for all three types of skin cancer include sun sensitivity,
pigmentary characteristics, signs of sun exposure such as actinic keratoses, and
phenotypic results of a combination of higher risk skin pigmentation and sun exposure
such as freckling.
Given that nearly one fifth of families in this study had aggregation of BCC to the
exclusion of SCC or MM, BCC-specific risk factors are also likely to be at work. BCC-
specific factors probably include environmental risks such as the pattern of sun exposure,
with childhood and intermittent exposure affecting BCC risk to a greater degree than
SCC risk [47, 78, 81]. Toxins such as arsenic are also specific risk factors for BCC.
Genetic factors such as PTCH polymorphisms or mutations within the germlines of these
families could also affect risk of BCC. This tumour-suppressor gene causes increased risk
of BCC to those with the rare genodermatosis Gorlin syndrome, but beyond some
preliminary haplotyping studies, has not been examined as a potential contributor to BCC
susceptibility in the general population (considered in chapter 5). Presence of Gorlin
Syndrome would also cause an increased risk of BCC differentially compared with SCC,
and one proband reported a prior clinical diagnois of this syndrome.
Further information about the origins of skin cancer risk may be obtained through
phenotypic examination of probands and their unaffected siblings who can act as intra-
family controls. Environmental risk factors are assumed to be similar for siblings within a
family, meaning that observed phenotypic differences are likely to be attributable to
genetic causes. Questionnaires to ascertain exposure to environmental risk factors would
be useful and could be employed in future studies. These issues will be explored further
in the next chapter.
Sources of error in comparing this study’s subject prevalence with population prevalence
include the differences in latitude of the people involved, and differences in sibling
numbers of the people measured. However, as discussed in section 2.1.1, the Sydney
basin is likely to have a similar incidence of skin cancer to the general population.

118

119
Chapter 4: Case-control analysis: phenotypic risk factors for early-onset BCC
4.1. Introduction
The subjects of this study are 56 people who have developed BCC under 40 yr, i.e. earlier
than 93% of Australians who are affected by this type of skin cancer. It was hypothesised
that they would exhibit increased risk factors for BCC. In the previous chapter their
relatives were shown to have increased prevalence of not only BCC, but also SCC and
melanoma. Importantly, in a proportion of these families there were multiple cases
affected by BCC in the absence of SCC, in one family this included six first-degree
affected relatives. Exploration of underlying causative factors therefore needs to address
both susceptibility to skin cancer in general and also susceptibility factors that might be
unique to BCC.
Particular skin phenotypes are known to be associated with skin cancer risk. The complex
of inherited characteristics defining a person’s ‘sun sensitivity’ has a moderate
association with BCC. Pigmentary characteristics such as skin colour and tanning ability
are key features of this complex and may play a causative role, with eye colour and hair
colour surrogate markers (see section 1.4). Genetic variation in MC1R is largely
responsible for these individual differences in pigmentary characteristics, in combination
with other as yet unknown genes, and acts as an independent risk factor for BCC (see
section 1.7).
Risk of BCC is increased by sun exposure, with acute intermittent exposure rather than
cumulative total dose the more important pattern of exposure for determining risk of this
tumour (see section 1.4). Signs of high total cumulative sun exposure such as presence of
pterygium on the sclera of the eye, and solar elastosis or actinic keratoses on the
chronically sun exposed regions of the body have been associated with SCC, and to a
lesser extent BCC. However it is difficult to disentangle these phenotypes from varying
individual susceptibility to sun-related skin damage: they are not uncontaminated markers
of solar radiation dose. Some commonly occurring skin lesions that are the result of
120
combinations of pigmentary traits and sun exposure include solar lentigines and
freckling. More poorly understood are the presence of seborrhoeic keratoses; these
benign lesions may be associated with sun exposure and are very prevalent in Australian
populations. They do not have any known associations with skin cancer. In this chapter,
the causes of BCC in the probands are explored by comparing their skin phenotype with
that of their unaffected siblings. Siblings are similar genetically and are even more likely
to have shared a common early environment. Differences seen between affected-
unaffected sibling pairs can therefore not be confounded by population admixture and, if
not due to chance, are more likely to have a genetic than an environmental basis.
Several skin characteristics were measured, using both self-reports and physical
examination by a trained examiner under standardised conditions (see section 2.3).
Pigmentary characteristics of the skin were measured along with sun sensitivity factors,
characteristics relating to previous sun exposure, and characteristics due to a combination
of sun sensitivity and sun exposure. All tests of association described in this chapter were
carried out using logistic regression, either unconditionally or conditioning on family
membership (i.e. taking into account their membership of a proband-sibling pair).
Differences in skin colour, skin phototype, signs of sun sensitivity and sun exposure were
seen between the sibling pairs, indicating identifiable phenotypic risk factors for early-
onset BCC.
The following chapter (section 5) describes analysis of genetic factors that may explain
the clustering of skin cancer within these families.
4.2. Results
4.2.1. General characteristics
A nested case-control analysis was performed by selecting the oldest NMSC-unaffected
sibling as a control for each proband where available. Examinations were performed on
88 subjects, including assessments of pigmentary characteristics and semi-quantitative
analysis of various sun exposure-related lesions on their skin. Of these 88 subjects, 73%

121
(64/88) were part of proband-sibling case-control pairs, with the 27% (24/88) remaining
subjects undergoing examination unpaired.
Table 4.1. Age, Height, Weight paired t-tests Measurement Mean Case-Control SD Sig (2-tailed) Age (years) -1.8 6.0 .101 Height (cm) -1.3 9.3 .449 Weight (kg) -2.9 14.7 .266 There were no significant differences between probands and siblings with respect to age,
height, or weight (see table 4.1). The siblings chosen as a control for the probands were
selected to be the oldest NMSC-unaffected sibling. The average age of the siblings was
1.8 years older than the probands, or one year and 10 months (SD 6.0 years). The sibling
controls were also on average slightly taller than their proband pair by 1.3 cm (SD: 9.3
cm) and heavier by 2.9 kg (SD: 14.7 kg).
All subjects were investigated for evidence of Gorlin syndrome, through history of
mandibular keratocysts and presence of palmar pitting (see section 2.3.1). These features
are both pathognomonic of Gorlin syndrome, and presence of both features occurred in
one patient only (proband ID 9125) who had previously been clinically diagnosed with
this syndrome.
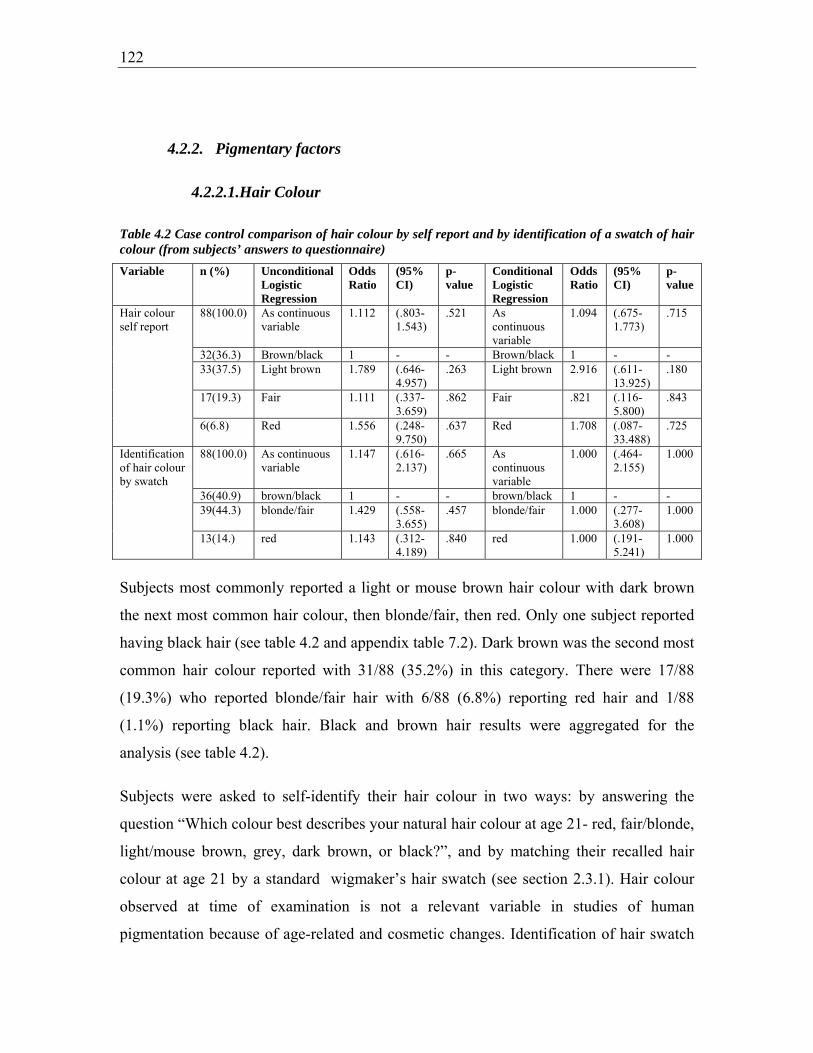
122
4.2.2. Pigmentary factors
4.2.2.1.Hair Colour
Table 4.2 Case control comparison of hair colour by self report and by identification of a swatch of hair colour (from subjects’ answers to questionnaire)
Subjects most commonly reported a light or mouse brown hair colour with dark brown
the next most common hair colour, then blonde/fair, then red. Only one subject reported
having black hair (see table 4.2 and appendix table 7.2). Dark brown was the second most
common hair colour reported with 31/88 (35.2%) in this category. There were 17/88
(19.3%) who reported blonde/fair hair with 6/88 (6.8%) reporting red hair and 1/88
(1.1%) reporting black hair. Black and brown hair results were aggregated for the
analysis (see table 4.2).
Subjects were asked to self-identify their hair colour in two ways: by answering the
question “Which colour best describes your natural hair colour at age 21- red, fair/blonde,
light/mouse brown, grey, dark brown, or black?”, and by matching their recalled hair
colour at age 21 by a standard wigmaker’s hair swatch (see section 2.3.1). Hair colour
observed at time of examination is not a relevant variable in studies of human
pigmentation because of age-related and cosmetic changes. Identification of hair swatch
Variable n (%) Unconditional Logistic Regression
Odds Ratio
(95% CI)
p-value
Conditional Logistic Regression
Odds Ratio
(95% CI)
p-value
Hair colour self report
88(100.0) As continuous variable
1.112 (.803-1.543)
.521 As continuous variable
1.094 (.675-1.773)
.715
32(36.3) Brown/black 1 - - Brown/black 1 - - 33(37.5) Light brown 1.789 (.646-
4.957) .263 Light brown 2.916 (.611-
13.925) .180
17(19.3) Fair 1.111 (.337-3.659)
.862 Fair .821 (.116-5.800)
.843
6(6.8) Red 1.556 (.248-9.750)
.637 Red 1.708 (.087-33.488)
.725
Identification of hair colour by swatch
88(100.0) As continuous variable
1.147 (.616-2.137)
.665 As continuous variable
1.000 (.464-2.155)
1.000
36(40.9) brown/black 1 - - brown/black 1 - - 39(44.3) blonde/fair 1.429 (.558-
3.655) .457 blonde/fair 1.000 (.277-
3.608) 1.000
13(14.) red 1.143 (.312-4.189)
.840 red 1.000 (.191-5.241)
1.000

123
is a more objective measure because it removes the subjectivity of naming the colour and
is therefore probably a more objective measure of the subjects’ true hair colour.
The subjects showed reasonably high correlation between these two self-reported
measures, with Spearman’s rank correlation of 0.71 (significant correlation at the 0.01
level), indicating 71% agreement between the measures (see appendix table 7.2). All
subjects who self-reported red hair also identified their hair as red visually by hair
swatch. Only one person reported having black hair, and this individual identified their
hair colour as brown by selection of hair swatch. Nearly all (94.1%, 16/17) self-reported
blondes also identified this colour by hair swatch, with one (5.9%) selecting a red hair
swatch. Most (87.1%, 27/31) self-reported brunettes identified a brown swatch, with
three (9.7%) selecting a fair/blonde swatch and one (3.2%) a red hair swatch. A ‘light or
mouse brown’ self-report was less specific, with most selecting a fair/blonde swatch
(20/33 or 60.6%), and the remainder either a brown swatch (8/33, 24.2%) or red (5/33,
15.2%) swatch. If the ‘light or mouse brown’ named category is combined with the ‘dark
brown’ named category to allow an analysis of agreement with the self-report by swatch,
the agreement between the two measures is 0.43 (Kronbach’s Kappa). If instead, the
‘light or mouse brown’ named category is combined with the ‘fair/blonde’ named
category for a comparison with the swatch self-reports, agreement improves to a measure
of 0.65 (Kronbach’s Kappa).
No consistent or significant trend between hair colour and history of BCC was seen in the
subjects examined, whether determined by self report or identification of hair swatch
colour (see table 4.1). Subjects with self-reported lighter pigmented hair than dark
brown/black were more likely to have had BCC; however the odds did not increase
consistently with increasing fairness. When the groups were compared as matched pairs,
the odds of BCC were still raised for light-brown (OR= 2.92, 95% CI 0.61 -13.93) or red-
heads by self report (OR = 1.71, 95% CI 0.09 – 33.49), but was the relationship was
completely lost for the more reliable measure of hair colour by hair swatch. Overall, there
is little evidence for an association of hair colour and BCC risk in this group.

124
4.2.2.2.Eye Colour
Table 4.3 Case control comparison of eye colour (from subjects’ answers to questionnaire) Variable n (%) Unconditional
Logistic Regression
Odds Ratio
(95% CI)
p-value Conditional Logistic Regression
Odds Ratio
(95% CI)
p-value
Eye colour
88(100) As continuous variable
1.700 (.759-2.404)
.306 As continuous variable
1.155 (.547-2.433)
.706
17(19.3) brown/black 1 - - brown/black 1 - - 34(38.6) green/hazel .887 (.273-
2.884) .842 green/hazel .825 (.211-
3.225) .782
37(42.0) blue 1.655 (.500- 5.470)
.409 blue 1.337 (.298- 6.001)
.704
Blue (37/88 or 42.0%) or green eyes (34/88 or 38.6%) were more commonly reported by
subjects with only 19.3% (17/88) reporting brown/black eyes (see table 4.3).
No significant relationship between eye colour and history of BCC was evident, with
slightly increased odds of BCC in subjects with lighter eye colour, a relationship that was
weakened by comparing matched proband-sibling pairs (OR = 1.16, 95% CI 0.55- 2.43),
reducing the likelihood of a real association. There was also no trend for consistently
increasing risk with decreasing eye pigmentation, as the odds of BCC were decreased for
green/hazel eyes (OR = 0.83, 95% CI 0.21- 3.23) and increased for blue eyes (OR =
1.33, 95% CI 0.30- 6.00). Together, these results provide no evidence for an association
between eye colour and BCC risk in these subjects.
4.2.2.3.Skin Colour
The commonest reported skin colour among all subjects was fair (47/88 or 53.4%) with
39.8% (35/88) reporting very fair skin, and only 6.8% subjects overall (6/88) reporting
olive or brown skin colour (see table 4.4).
The odds of BCC was higher for people reporting a lighter skin colour, and this
relationship strengthened in the case-control analysis (OR = 2.04, 95% CI 0.67- 6.29) but
remained non-significant. There was a trend for increasing risk of BCC with
progressively increased fairness of skin, with ORs of 1.47 (95% CI 0.27- 8.10) for fair
skin and 2.18 (95% CI 0.38- 12.58) for very fair skin compared with the whole unpaired
group of control siblings. Given that there were so few subjects reporting olive/brown

125
skin, odds ratios were unable to be determined for categories of increasing fairness of the
skin for case-control pairs.
People with BCC had very slightly lighter overall constitutive skin colour as measured by
luminance (see 2.3.3 for detailed explanation of skin colour parameters as determined by
reflectance spectrophotometry), which also strengthened with case-control matching but
did not reach significance (OR = 1.20, 95% CI 0.93- 1.55; see table 4.6). Inner arm
(constitutive, non-sun exposed) skin colour was slightly less red on a red-green
reflectance scale in probands compared with the group of siblings (OR = 0.91, 95% CI
0.76- 1.08), with cases on average having nearly one unit lower readings on reflectance
spectrophotometry on this variable. This association became significant when case-
control pairs were matched (OR = 0.59, 95% CI 0.36 – 0.98, with paired t-test 2-tailed
significance =0.019), suggesting that constitutive red-green reflectance of the skin is
associated with a lower risk of BCC compared with those whose skin is made up of less
of this pigment. People with BCC also had less yellow in their skin pigment as measured
by the yellow-blue reflectance parameter, and although this relationship strengthened
with matching of probands with their siblings in the analysis (OR = 0.83, 95% CI 0.64-
1.07), it remained small and not significant.
None of the outer arm (a sun-exposed skin area) measurements of skin colour were
significantly different between cases and controls. There was very little difference in
exposed skin colour, with essentially no difference between exposed skin in overall
fairness (OR = 1.08, 95% CI 0.94- 1.24), and little difference seen before case-control
pairing in red-green reflectance or yellow-blue reflectance. In an analysis with case-
control pairing, there was a trend for a small association with outer arm red-green
reflectance (OR = 0.83, 95% CI 0.62- 1.11) and yellow-blue reflectance (OR = 0.85, 95%
CI 0.69- 1.07) with BCC, with an increasing degree of either measure decreasing the
odds of BCC slightly.
The measures L (‘luminance’), a (‘red-green reflectance’) and b (‘yellow-blue
reflectance’) are independent dimensions of colour, but skin types are likely to be
expressed as recurring combinations of these measures, due to the effect of a small
126
number of skin structures contributing to colour in a limited number of ways (see section
2.3.3 for a discussion on the main contributors to skin colour). Correlations between the
measures were examined using linear regression; Spearman’s correlation coefficient for
the outer arm measure L was R2=0.81, i.e. 81% of the variance in the measure L is
explained by the outer arm measures a and b. Inner arm measure L had a Spearman’s
correlation coefficient of R2=0.72, suggesting that 72% of the variance in inner arm L is
explained by the inner arm a and b measures. When the a and b measures for the outer
arm and the inner arm are combined in a linear regression analysis, inner arm red-green
reflectance was the only independent predictor of BCC risk.

127
Table 4.5 Case control comparison of self- reported skin pigmentation (from subjects’ answers to questionnaire) Variable n (%) Unconditional Logistic
Regression Odds Ratio
(95% CI) p-value Conditional Logistic Regression
Odds Ratio
(95% CI)
p-value
Self reported skin pigmentation
88(100) As continuous variable 1.479 (.714-3.058)
.292 As continuous variable 2.044 (.665-6.289)
.212
6(6.8) Olive/Brown 1 - - Olive/Brown 1 - - 47(53.4) Fair 1.474 (.268-
8.091) .655 Fair 2085.670 ? .899
35(39.8) Very Fair 2.182 (.378- 12.583)
.383 Very Fair 3649.923 ? .892
Table 4.6 Case control comparison of spectrophotometric measurements of outer and inner arm skin colour Variable Paired t test Mean
difference case - control
(95% CI) Sig (2-tailed)
Unconditional Logistic Regression
Odds Ratio (95% CI) p-value Conditional Logistic Regression
Odds Ratio
(95% CI)
p-value
Observed exposed skin colour
Outer arm luminance
1.02452 (-.97464-3.02367)
.304 Continuous variable
1.019 (.955-1.088)
.563 Continuous variable
1.076 (.935-1.238)
.309
Outer arm red-green reflectance
-.66129 (-1.66190-.33932)
.187 Continuous variable
.963 (.842-1.101)
.582 Continuous variable
.828 (.621-1.105)
.200
Outer arm yellow-blue reflectance
-.89097 (-2.13435-.35242)
.154 Continuous variable
.975 (.886-1.073)
.607 Continuous variable
.854 (.685-1.065)
.162
Observed constitutive skin colour
Inner arm luminance
1.06194 (-.34603-2.46990)
.134 Continuous variable
1.041 (.947-1.144)
.404 Continuous variable
1.197 (.925-1.548)
.171
Inner arm red-green reflectance
-.99484 (-1.81555--.17413)
.019* Continuous variable
.906 (.757-1.083)
.278 Continuous variable
.591 (.356-.980)
.041*
Inner arm yellow-blue reflectance
-.88742 (-2.04297-.26813)
.127 Continuous variable
.952 (.855-1.060)
.372 Continuous variable
.826 (.639-1.068)
.145

128
4.2.3. Propensity to burn, ability to tan, and phototype
Overall, only nine (10.2%, 9/88) subjects reported severe sunburn with blistering
following a single exposure to bright sunlight for one hour for the first time in summer.
Most subjects reported mild or no sunburn (29.5%, 26/88) or painful (60.2%, 53/88)
sunburn (see section 2.3.2 for recoding of variable information and appendix table 7.3 for
raw data).
There was a trend for progressively increased risk of BCC for people with increasing
propensity to burn, and this effect was magnified by analysis by case-control pairs. A
painful burn increased risk of BCC slightly (OR = 1.21, 95% CI 0.47 – 3.15) and a severe
burn increased the risk more than two-fold (OR = 2.57, 95% CI 0.44 – 14.82). Analysis
by case-control pairs increased this relationship, with a greater than three-fold risk of
BCC for a painful burn after their first summer exposure to sunlight (OR = 3.50, 95% CI
0.73- 16.85), and a seven-fold risk if reporting severe sunburn with blistering (OR = 7.00,
95% CI 0.70- 70.74); this trend did not quite reach significance (p for trend = 0.08).
However, only 6.8% (6/88) of persons reported a response of deep tanning following
repeated exposure to the sun (‘ability to tan’), with 18.2% (16/88) of people at the other
end of the spectrum, reporting no tanning/freckling only. The remainder fell nearly
equally into the groups of ‘moderately tanned’ (38.6% or 34/88) or ‘mildly/occasionally
tanned’ (36.4% or 32/88) (see appendix table 7.3).
There was an effect of increased risk of BCC in people with reduced ability to tan
although significance was not achieved: there was a small increased risk of OR 1.61
(95% CI 0.28- 9.23) for moderate tanning, OR 1.46 (95% CI 0.25- 8.40) for mild tanning
and a larger effect of OR 3.00 (95% CI 0.42- 21.30) for no tan or freckling only (p for
trend = 0.33). This effect was increased by case-control analysis, with the odds of BCC
2.15 (95% CI 0.19- 24.93) for moderate tanning, 1.74 (95% CI 0.13- 22.75) for mild
tanning, and six-fold increased odds of BCC (OR = 5.97; 95% CI 0.33- 107.26) for those
reporting no tan or freckling only (p for trend = 0.25). These results are consistent with a
protective effect of the ability to tan on risk of BCC.
129
Only 9.1% (8/88) reported ‘always burning/never tanning’, with the remainder reporting
‘usually burning/sometimes tanning’ (52.3%, 46/88), or ‘sometimes burning/usually
tanning’ (38.6%, 34/88) (see appendix table 7.4).
The trend for risk of BCC with lower skin phototype was present but small (OR = 1.72,
95% CI 0.84 – 3.56) but became larger and statistically significant (p for trend = 0.045)
in the case-control analysis, with a more than three-fold increased risk of BCC with
decreasing phototype (OR = 3.56; 95% CI 1.03 – 12.35); the risk of BCC was greater
than four-fold for phototype II (usually burn/sometimes tan; OR = 4.24; 95% CI 0.91 –
19.81), and nearly ten-fold for people with phototype I as compared with phototype III
(always burn/never tan; OR = 9.79; 95% CI 0.668 – 143.42), although remained non-
significant.
In summary, effects of these measures were only weakly discernible in these data due to
limited power of the study, and the intrinsic limitation of a sibling-control design in
which many risk factors will be shared by cases and controls. However the directions of
the trend data are all consistent with effects observed in population-based studies of BCC.
The trend was for increased risk of BCC with increased propensity to burn, decreased
ability to tan, and lower skin phototype, with this latter variable the only one to reach
significance (p = 0.045.)
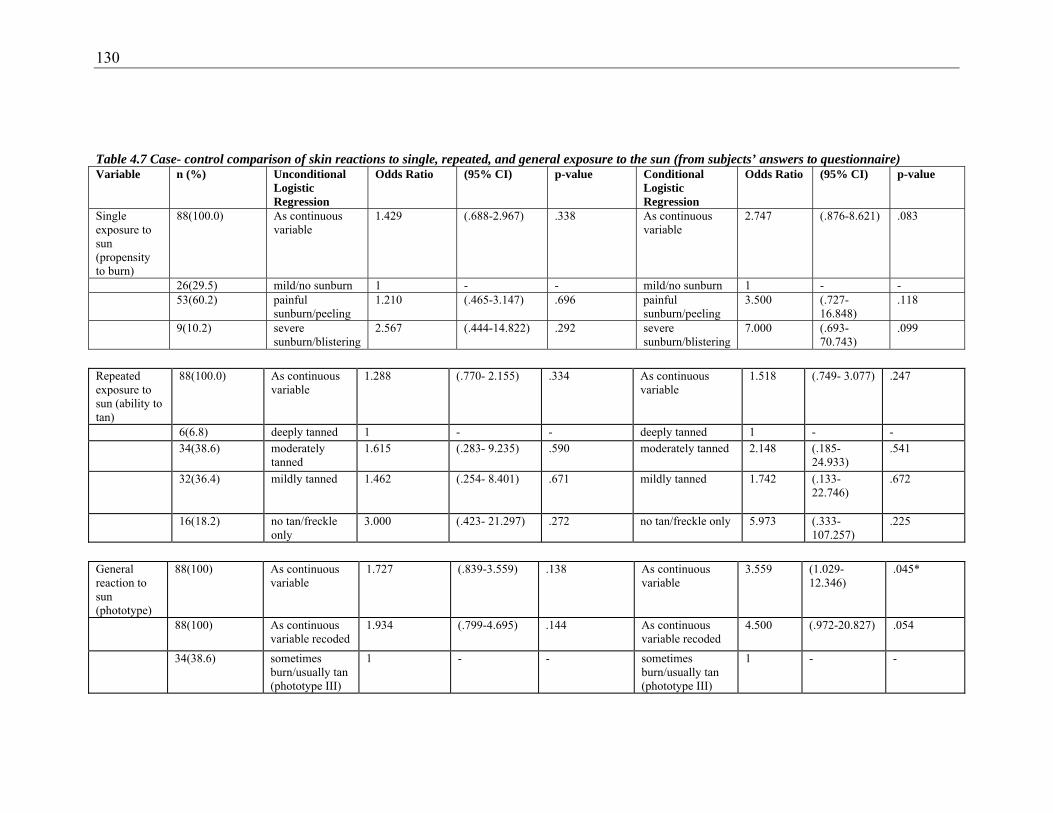
130
Table 4.7 Case- control comparison of skin reactions to single, repeated, and general exposure to the sun (from subjects’ answers to questionnaire) Variable n (%) Unconditional
Logistic Regression
Odds Ratio (95% CI) p-value Conditional Logistic Regression
Odds Ratio (95% CI) p-value
Single exposure to sun (propensity to burn)
88(100.0) As continuous variable
1.429 (.688-2.967) .338 As continuous variable
2.747 (.876-8.621) .083
26(29.5) mild/no sunburn 1 - - mild/no sunburn 1 - - 53(60.2) painful
sunburn/peeling 1.210 (.465-3.147) .696 painful
sunburn/peeling 3.500 (.727-
16.848) .118
9(10.2) severe sunburn/blistering
2.567 (.444-14.822) .292 severe sunburn/blistering
7.000 (.693- 70.743)
.099
Repeated exposure to sun (ability to tan)
88(100.0) As continuous variable
1.288 (.770- 2.155) .334 As continuous variable
1.518 (.749- 3.077) .247
6(6.8) deeply tanned 1 - - deeply tanned 1 - - 34(38.6) moderately
tanned 1.615 (.283- 9.235)
.590
moderately tanned 2.148 (.185- 24.933)
.541
32(36.4) mildly tanned 1.462 (.254- 8.401) .671 mildly tanned 1.742 (.133- 22.746)
.672
16(18.2) no tan/freckle only
3.000 (.423- 21.297) .272 no tan/freckle only 5.973 (.333- 107.257)
.225
General reaction to sun (phototype)
88(100) As continuous variable
1.727 (.839-3.559) .138 As continuous variable
3.559 (1.029-12.346)
.045*
88(100) As continuous variable recoded
1.934 (.799-4.695) .144 As continuous variable recoded
4.500 (.972-20.827) .054
34(38.6) sometimes burn/usually tan (phototype III)
1 - - sometimes burn/usually tan (phototype III)
1 - -

131
46(52.3) usually burn/sometimes tan (phototype II)
1.837 (.737- 4.577) .192 usually burn/sometimes tan (phototype II)
4.243 (.909-19.811) .066
8(9.1) always burn/never tan (phototype I)
2.667 (.470-15.136) .268 always burn/never tan (phototype I)
9.787 (.668-143.415)
.096
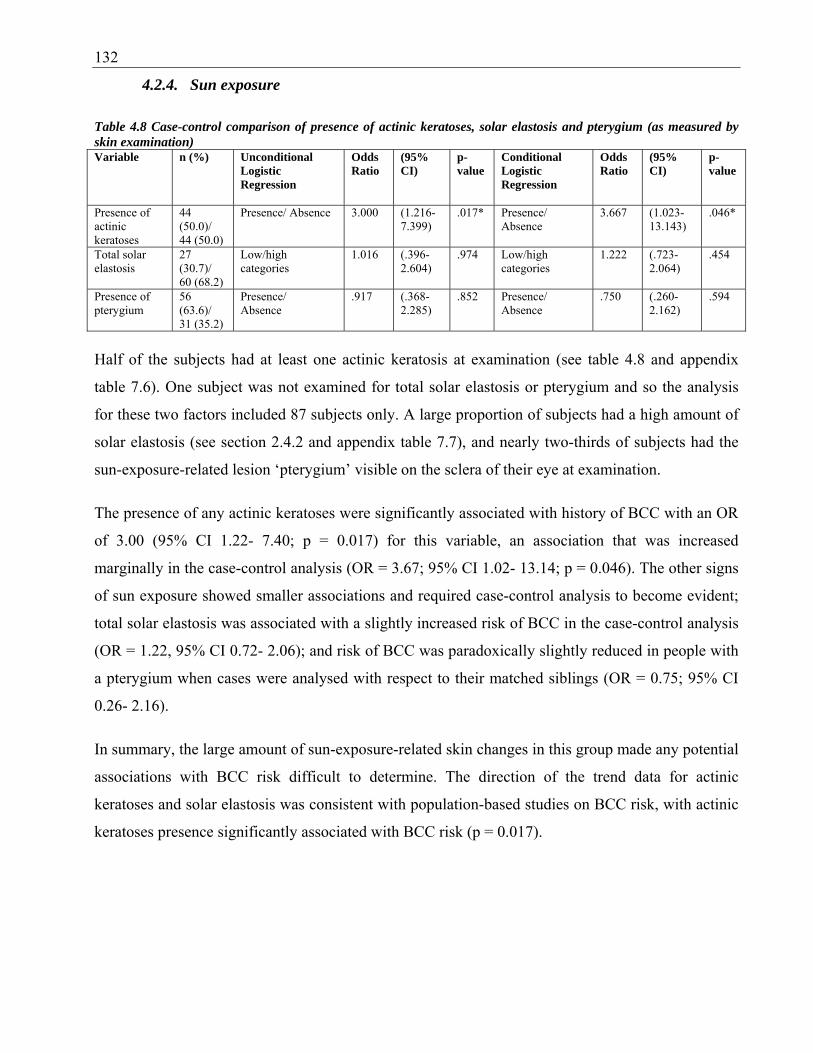
132
4.2.4. Sun exposure
Table 4.8 Case-control comparison of presence of actinic keratoses, solar elastosis and pterygium (as measured by skin examination) Variable n (%) Unconditional
Logistic Regression
Odds Ratio
(95% CI)
p-value
Conditional Logistic Regression
Odds Ratio
(95% CI)
p-value
Presence of actinic keratoses
44 (50.0)/ 44 (50.0)
Presence/ Absence 3.000 (1.216-7.399)
.017* Presence/ Absence
3.667 (1.023-13.143)
.046*
Total solar elastosis
27 (30.7)/ 60 (68.2)
Low/high categories
1.016 (.396- 2.604)
.974 Low/high categories
1.222 (.723-2.064)
.454
Presence of pterygium
56 (63.6)/ 31 (35.2)
Presence/ Absence
.917 (.368- 2.285)
.852 Presence/ Absence
.750 (.260-2.162)
.594
Half of the subjects had at least one actinic keratosis at examination (see table 4.8 and appendix
table 7.6). One subject was not examined for total solar elastosis or pterygium and so the analysis
for these two factors included 87 subjects only. A large proportion of subjects had a high amount of
solar elastosis (see section 2.4.2 and appendix table 7.7), and nearly two-thirds of subjects had the
sun-exposure-related lesion ‘pterygium’ visible on the sclera of their eye at examination.
The presence of any actinic keratoses were significantly associated with history of BCC with an OR
of 3.00 (95% CI 1.22- 7.40; p = 0.017) for this variable, an association that was increased
marginally in the case-control analysis (OR = 3.67; 95% CI 1.02- 13.14; p = 0.046). The other signs
of sun exposure showed smaller associations and required case-control analysis to become evident;
total solar elastosis was associated with a slightly increased risk of BCC in the case-control analysis
(OR = 1.22, 95% CI 0.72- 2.06); and risk of BCC was paradoxically slightly reduced in people with
a pterygium when cases were analysed with respect to their matched siblings (OR = 0.75; 95% CI
0.26- 2.16).
In summary, the large amount of sun-exposure-related skin changes in this group made any potential
associations with BCC risk difficult to determine. The direction of the trend data for actinic
keratoses and solar elastosis was consistent with population-based studies on BCC risk, with actinic
keratoses presence significantly associated with BCC risk (p = 0.017).

133
4.2.5. Skin characteristics that are influenced by sun exposure
Solar lentigines and freckling are pigmentary lesions with complex aetiology (see 1.4.1.1).
Lentigines have their strongest associations with prior sunburn and occur in sites of previous
burning, freckles are influenced by sun exposure more broadly. Freckling is strongly geneticly
determined whereas the genetics of solar lentigo formation, if any, are not understood.
4.2.5.1.Solar lentigines
Table 4.9 Case-control comparison of numbers of solar lentigines on the face, forehead, upper limbs, and back and shoulders (as measured by skin examination) Variable n (%) Unconditional
Logistic Regression
Odds Ratio
(95% CI)
p-value
Conditional Logistic Regression
Odds Ratio
(95% CI)
p-value
Solar lentigines face
88 (100) Continuous variable
1.088 (.856-1.382)
.491 Continuous variable
1.146 ( .873- 1.503)
.326
43 (48.9)/ 45 (51.1)
low/high categories
1.185 (.500-2.811)
.700 low/high categories
1.667 (.606-4.586)
.323
Solar lentigines forehead
88 (100) Continuous variable
.949 (.757-1.190)
.653 Continuous variable
1.010 ( .771- 1.322)
.945
47 (53.4)/ 41 (46.6)
low/high categories
.729 (.306-1.732)
.474 low/high categories
1.167 (.392-3.471)
.782
Solar lentigines dorsal upper limbs
88 (100) Continuous variable
1.254 (1.026-1.532)
.027* Continuous variable
1.424 ( 1.075- 1.886)
.014*
46 (52.3)/ 42 (47.7)
low/high categories
2.583 (1.052-6.346)
.038* low/high categories
3.250 (1.060-9.967)
.039*
Solar lentigines upper back/shoulders
88 (100) Continuous variable
1.074 (.878-1.313)
.487 Continuous variable
1.384 ( .958- 2.000)
.084
43 (48.9)/ 45 (51.1)
low/high categories
1.440 (.605-3.426)
.410 low/high categories
2.000 (.602-6.642)
.258
Table 4.9 shows a trend for increased risk of BCC for people who have had a high number of solar
lentigines (see section 2.3.2 for recoding and appendix table 7.8 for raw data). Having a high
number of solar lentigines on the upper arms increased risk of BCC significantly (OR = 2.58; 95%
CI 1.05- 6.35), and this association was strengthened to a 3-fold risk of BCC in the case-control
analysis (OR = 3.25, 95% CI 1.06- 9.97). There was a smaller, non-significant risk with high
numbers of solar lentigines on the face (OR = 1.19, 95% CI 0.50- 2.81) and this increased
marginally in the case-control analysis (OR = 1.67, 95% CI 0.61- 4.59). Solar lentigines on the
forehead had essentially no effect on risk, with an odds ratio approaching unity. High numbers of

134
solar lentigines on the upper back and shoulders was associated with a small increased BCC risk,
and this increased to a two-fold risk (OR = 2.00; 95% CI 0.60 – 6.64) in the paired case-control
analysis.

135
4.2.5.2.Freckling
Table 4.10 Case-control comparison of freckling (from questionnaire answers and from skin examination) Variable n (%) Unconditional
Logistic Regression
Odds Ratio
(95% CI)
p-value
Conditional Logistic Regression
Odds Ratio
(95% CI)
p-value
Reported freckling in childhood
88 (100.0)
As continuous variable
1.455 (.757-2.798)
.261 As continuous variable
1.752 (.749- 4.097)
.196
8 (9.1) None 1 - - None 1 - - 31 (35.2) Some 1.385 (.291-
6.581) .682 Some .250 (.016-
3.997) .327
49 (55.6) Many 2.062 (.456-9.328)
.347 Many 1.500 (.251- 8.977)
.657
Reported freckling in adulthood
88 (100.0)
As continuous variable
1.177 (.632-2.191)
.607 As continuous variable
1.472 (1.472- 3.038)
.296
15 (17.0) None 1 - - None 1 - - 43 (48.9) Some 1.633 (.496-
5.383) .420 Some 3.000 (.555-
16.208) .202
30 (34.0) Many 1.511 (.430-5.313)
.520 Many 3.000 (.555- 16.208)
.202
Clinical freckling face
88 (100.0)
Continuous variable
.975 (.802-1.186)
.803 Continuous variable
1.012 ( .746- 1.374)
.938
60 (68.2)/ 28 (31.8)
low/high categories
1.000 (.420-2.379)
1.000 low/high categories
1.333 (.298-5.957)
.706
Clinical freckling forehead
88 (100.0)
Continuous variable
1.099 (.906-1.334)
.338 Continuous variable
1.249 ( .932- 1.674)
.137
66 (75.0)/ 22 (25.0)
low/high categories
.975 (.407-2.337)
.956 low/high categories
1.750 (.512-5.978)
.372
Clinical freckling dorsal upper limbs
88 (100.0)
Continuous variable
1.160 (.909-1.480)
.233 Continuous variable
1.903 ( 1.068- 3.391)
.029*
78 (88.6)/ 10 (11.4)
low/high categories
1.815 (.749-4.396)
.187 low/high categories
4.000 (.849-18.836)
.080
Clinical freckling upper back/shoulders
88 (100.0)
Continuous variable
1.112 (.884-1.398)
.365 Continuous variable
1.221 ( .883- 1.688)
.228
43 (48.9)/ 45 (51.1)
low/high categories
1.105 (.460-2.654)
.823 low/high categories
1.400 (.444-4.411)
.566
Reported freckling in childhood was not consistently associated with BCC risk, as seen in table 4.10
(see section 2.3.2 for recoding of variables and appendix table 7.9 for raw scores). Reporting of
some freckles in childhood was associated with a small increased risk of BCC (OR = 1.39, 95% CI
0.29- 6.58); many freckles were associated with a higher risk (OR = 2.06, 95% CI 0.46- 9.32);
neither association was significant. The validity of these predictions are questioned when
considering the marked decrease in predicted risk resulting from the case-control analysis (some
freckles; OR = 0.25, 95% CI 0.02- 4.00, many freckles; OR = 1.50, 95% CI 0.25- 8.98).

136
Freckling in adulthood showed a more consistent but still non-significant association with more
evidence for a trend, with a slightly elevated risk that increased to 3-fold in the case-control analysis
(OR = 3.00; 95% CI 0.55- 16.21 for both).
As with examination of solar lentigines, the dorsal upper limbs were the only region of the body
examined to show a significant association of freckling with BCC risk. Here, there was a four-fold
risk (OR = 4.00, 95% CI 0.85- 18.84) of BCC with high numbers of freckles seen on the upper
limbs, with a p value approaching significance at 0.08. The p value drops to significance at the 0.05
level when all categories on the semi-quantitative scale are included in the analysis, giving a 2-fold
risk of BCC associated with upper arm freckling (OR = 1.90, 95% CI 1.07- 3.39, p = 0.029).
Observed freckling on the face and forehead both had no effect on BCC risk without the case-
control analysis, but was associated with slightly increased odds of BCC with the case-control
analysis (face freckling; OR = 1.33; 95% CI 0.30- 5.96; forehead freckling; OR = 1.75; 95% CI
0.51- 5.96). Upper back and shoulder freckling also showed a small non-significant association with
BCC risk with odds of 1.40 (95% CI 0.44- 4.41) with case-control matching.
In summary, the trends seen in this case-control data reflect those seen in population studies on
BCC. Risk of BCC was increased by the presence of sun-exposure-related lesions including solar
lentigines and freckling. The most significant associations were seen for both variables on the
chronically sun-exposed region of the arm (p = 0.014 and p = 0.029 respectively). The amounts of
solar lentigines were more consistently associated with BCC risk than freckling, which may reflect
their relatively simple relationship to sun-exposure. The measures of freckling included both self-
reported variables and clinically measured ones. The self-reported measure of childhood freckling
showed the most inconsistent associations with risk of BCC, which may reflect the difficulties
associated with reliance on subjects’ memory of the variable.

137
4.2.6. Seborrhoeic keratoses
Table 4.11 Case-control comparison of numbers of seborrhoeic keratoses (from skin examination) Variable n (%) Unconditional
Logistic Regression
Odds Ratio
(95% CI)
p-value
Conditional Logistic Regression
Odds Ratio
(95% CI)
p-value
Seborrhoeic Keratoses head and neck
88 (100.0) Continuous variable
.456 (.148-1.402)
.170 Continuous variable
.429 ( .111- 1.657)
.220
15 (17.0)/ 73 (83.0)
Present/Absent categories
.456 (.148-1.402)
.170 Present/Absent categories
.429 (.111-1.657)
.220
Seborrhoeic Keratoses upper limbs
88 (100.0) Continuous variable
1.283 (.530-3.108)
.581 Continuous variable
1.000 ( .351- 2.851)
1.000
29 (33.0)/ 59 (67.0)
Present/Absent categories
1.214 (.480-3.069)
.682 Present/Absent categories
1.000 (.351-2.851)
1.000
Seborrhoeic Keratoses chest
88 (100.0) Continuous variable
.500 (.188-1.332)
.166 Continuous variable
.286 ( .059- 1.375)
.118
22 (25.0)/ 66 (75.0)
Present/Absent categories
.500 (.188-1.332)
.166 Present/Absent categories
.286 (.059-1.375)
.118
Seborrhoeic Keratoses abdomen
88 (100.0) Continuous variable
.919 (.412-2.051)
.837 Continuous variable
.667 ( .188- 2.362)
.530
25 (28.4)/ 63 (71.6)
Present/Absent categories
.683 (.266-1.756)
.429 Present/Absent categories
.500 (.125-1.999)
.327
Seborrhoeic Keratoses back
88 (100.0) Continuous variable
.778 (.350-1.730)
.538 Continuous variable
.625 ( .204- 1.910)
.410
34 (38.6)/ 54(61.4)
Present/Absent categories
.776 (.321-1.874)
.572 Present/Absent categories
.714 (.227-2.251)
.566
Seborrhoeic Keratoses lower limbs
88 (100.0) Continuous variable
.841 (.373-1.896)
.676 Continuous variable
.857 ( .288- 2.550)
.782
30 (34.1)/ 58 (65.9)
Present/Absent categories
.688 (.279-1.697)
.417 Present/Absent categories
.857 (.288-2.550)
.782
Seborrhoeic keratoses total body (sum)
88 (100.0) Continuous variable
.884 (.680-1.150)
.358 Continuous variable
.717 (.461-1.117)
.141
40 (45.5)/ 48 (54.5)
Low/high categories
.551 (.228-1.335)
.187 Low/high categories
.500 (.171-1.463)
.206
Overall, scores for seborrhoeic keratoses were low and found to be absent for many subjects on
different regions of their bodies (see section 2.3.2 for recoding and appendix table 7.10 for raw
scores). There were no significant associations between BCC and seborrhoeic keratoses. The overall
summed score of total body seborrhoeic keratoses for proband-sibling pairs gave an odds ratio of
0.72 (95% CI 0.46 – 1.12) when assessed as a continuous variable, and 0.50 (95% CI 0.17 – 1.46)
when divided into high and low categories; these results did not quite reach significance. In addition,
odds ratios of association between seborrhoeic keratoses in the various body sites were less than 1.0,
suggesting that presence of seborrhoeic keratoses may be associated with a reduced risk of BCC.

138
The decreased risk of BCC for presence of seborrhoeic keratoses on the chest approached
significance for the case-control paired analysis, with an OR of 0.27 (95% CI 0.06- 1.38, p = 0.118).
In summary, the data trend is for lower BCC risk with increased seborrhoeic keratoses. Little
literature exists on the risks associated with these benign lesions (see section 1.4.6) although these
trends contradict the suggested relationship of seborrhoiec keratoses to sun exposure.
4.3. Effect of date of examination on measurements
Sun exposure-related variables and skin pigmentary measurements are likely to be affected by the
time of year that examination took place, due to variation in the amount of UVR exposure according
to season. The dates of examination for all probands and siblings were compared (see figure 4.1 and
4.2). It is evident that the date of examination was not significantly different between the proband
and control groups for both the unconditional and conditional logistic regression analyses and it is
therefore unlikely that measurements were systematically biased by this variable.
The number of subjects from the whole group of 88 probands and siblings is sufficient to allow
analysis by month of examination (see figures 4.1 and appendix table 7.11). As seen in figure 4.1,
there is no significant difference between the month of examination in the proband compared with
the sibling groups (Fisher’s Exact Test p= 0.860).

139
Figure 4.1 Proband and sibling groups’ date of skin examination by month
Case-control pairs were also compared by month of skin examination in a scatterplot that shows no
correlation between the two measures (see figure 4.2), meaning that there is no systematic difference
between the two groups on this variable.
Sibling Proband
Proband or Sibling
Dec
Feb Apr Jun Aug
Oct Dec
Month of exam

140
Figure 4.2 Date of skin examination by month for case-control pairs
The 66 subjects in the case-control sample were best compared for significance by the season of
examination, as there were too few subjects to allow enough power for a comparison by month (see
appendix table 7.12). There was also no significant difference between the season of examination of
the probands compared with their matched sibling pairs (McNemar Test p = 0.267).
Among all of the variables measured in the skin examinations, the ‘L* a* b*’ spectrophotometric
measurements of the skin (see section 2.3.3) are the parameters most likely to have been affected by
the date of examination. Other sun exposure variables measured reflect the cumulative effects of sun
exposure as well as acute effects, while pigment of skin in general, and the outer aspect of the arm in
particular, is affected more acutely by changes in melanin density and distribution due to recent
UVR exposure. Outer arm measures of luminance (L) were smaller than on the inner arm, reflecting
the constitutive lightness of pigment overall on the less exposed skin. Outer arm red-green
reflectance (a) and yellow-blue reflectance (b) was greater than inner arm, reflecting greater
Dec Feb Apr Jun Aug Oct Dec Dec Feb
Apr
Jun
Aug
Oct
Dec
Exam month - sibling
Exam month - proband

141
amounts of pigment on the exposed area compared with the less exposed area. L can be seen as a
measure of whiteness of the skin and an overall average increase in this measure was seen among all
subjects on the outer arm in winter as compared with summer, when UVR exposure is assumed to
be reduced. Inner arm (constitutive) L varied slightly also, but predictably not as much as the outer
arm measure. Overall, outer arm a in subjects showed an increase over the warmest season, with
inner arm a decreasing slightly over this same period. Outer and inner arm b both increased in the
warmest months (see figure 4.3). In figure 4.3, the variance of results for spring are larger than
results for the other seasons due to the smaller number of subjects examined in this season (n = 4
examined in spring).
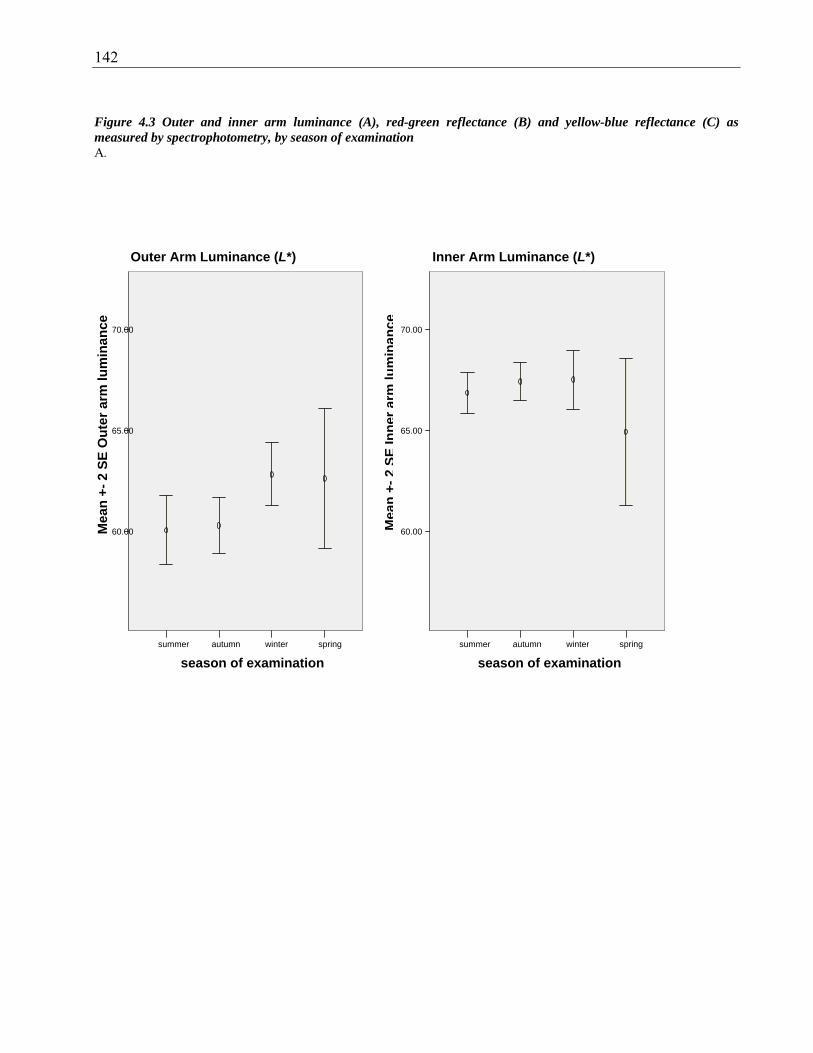
142
Figure 4.3 Outer and inner arm luminance (A), red-green reflectance (B) and yellow-blue reflectance (C) as measured by spectrophotometry, by season of examination A.
spring winterautumnsummer
season of examination
70.00
65.00
60.00Mea
n+-
2SE
Inne
rarm
lum
inan
ce
Inner Arm Luminance (L*)
springwinterautumn summer season of examination
70.00
65.00
60.00
Outer Arm Luminance (L*)
Mea
n +-
2 S
E O
uter
arm
lum
inan
ce
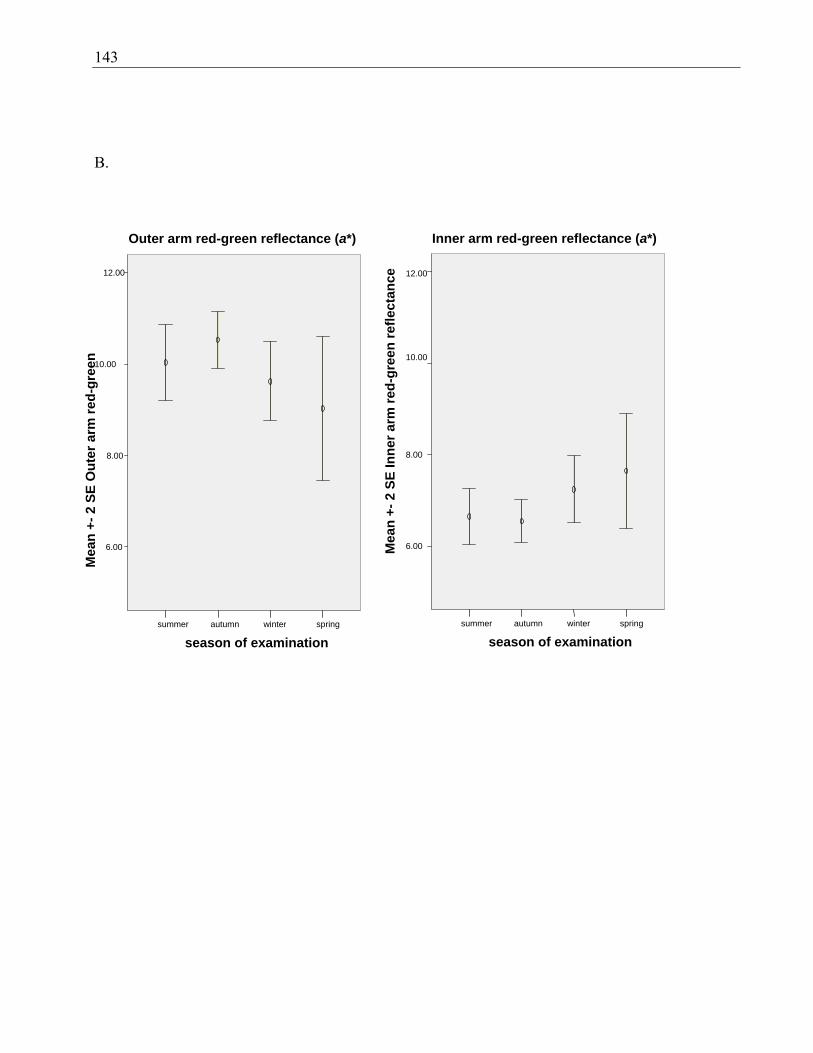
143
B.
springwinterautumn summer season of examination
12.00
10.00
8.00
6.00
Outer arm red-green reflectance (a*)
spring winterautumnsummer
season of examination
12.00
10.00
8.00
6.00Mea
n +-
2 S
E In
ner a
rm re
d-gr
een
refle
ctan
ce
Inner arm red-green reflectance (a*)
Mea
n +-
2 S
E O
uter
arm
red-
gree
n

144
C.
4.4. Discussion
Probands and their unaffected siblings were examined for phenotypic differences in skin, eye, and
hair pigmentation; as well as differences in sensitivity to the sun and signs of the amount of previous
sun exposure. Of the pigmentary variables, only constitutive red-green reflectance was significantly
associated with BCC risk, and this occurred in the direction opposite to that expected, in that red-
green reflectance of the skin associated with a decreased risk of early-onset BCC. Of the sun
sensitivity factors, decreasing skin phototype was significantly associated with an increasing risk of
BCC. A marker of cumulative sun exposure - presence of actinic keratoses - was associated with
significantly increased risk of BCC. Signs reflecting the combination of pigmentary characteristics
springwinter autumn summer season of examination
18.00
16.00
14.00
12.00
10.00
Outer arm yellow-blue reflectance (b*)
spring winter autumnsummer
season of examination
18.00
16.00
14.00
12.00
10.00
Mea
n +-
2 S
E In
ner a
rm y
ello
w-b
lue
refle
ctan
ce
Inner arm yellow-blue reflectance (b*)
Mea
n +-
2 S
E O
uter
arm
yel
low
-blu
e re
flect
ance

145
and sun exposure - in the form of arm freckling and solar lentigines - also gave subjects a
significantly increased risk of this tumour.
There were no significant differences detected in height or weight of the two groups, and no
systematic differences in the date of examination that may have skewed results that depend on
effects of recent ambient UVR. The tendency towards older age in the sibling group is not surprising
given that the oldest unaffected sibling was selected where available. Since the age difference was
only 1.8 years on average, the difference did not reach significance. An older sibling was chosen as
the control to ensure that the sibling would have attained at least the same age as the probands, as
age is such a strong predictor of skin cancer. This ensured that the sibling pair was as discordant as
possible with respect to skin cancer phenotype.
This group of subjects was fairly ‘sun sensitive’ in that most (96.6%) reported some burning in
response to their first exposure to summer sun, and very few (6.8%) reported an ability to build up a
‘deep tan’. In addition, nearly a fifth of the subjects overall (18.2%) reported a total inability to tan.
There was a trend for an association of the propensity to burn with risk of BCC, with non-significant
odds ratios reaching the moderate to high range (highest OR for affected-unaffected pairs 7.0) for
people with a high propensity to burn. It is likely that with a larger sample size a significant
association of BCC risk with propensity to burn may be seen. The ability to tan displayed a
relationship with BCC risk that could be interpreted as due to a complex interplay of pigmentary
factors and sun exposure behaviours. Despite no significant associations, the risk of BCC showed a
tendency toward an association with moderate tanning ability and also with the total inability to tan;
the risk was still positive in those with a mild ability to tan but lower than for the other two
categories. The literature shows that ability to tan interacts with exposure so that if a person tans
well, there is a linearly increased risk with intermittent exposure; whereas for those that tan poorly,
risk plateaus with increasing intermittent exposure [81, 103]. Measurement of patterns and amount
of sun exposure by interview would be necessary to help disentangle these effects but were beyond
the scope of the present study.
It is unsurprising that there were no probands or siblings of the darker skinned skin phototypes IV,
V or VI. Most people self categorised themselves as skin phototype II (usually burn/sometimes tan)
or III (sometimes burn/usually tan). For the more sensitive measure of analysis by case-control
pairs, a significant relationship was seen for risk of BCC with decreasing phototype, with an overall
OR of 3.6. When broken down to assess the contributors to the risk in this figure, phototype II was

146
associated with a more than 4-fold risk, and phototype I a nearly 10-fold risk compared with people
of phototype III. When looked at separately, these categories did not quite reach significance
although given the significance of the relationship when looked at together, this relationship is likely
to hold up with greater sample numbers. There is extensive evidence in the literature that skin that
burns easily and tans poorly (ie skin of lower phototype) is at increased skin cancer risk, and this
finding is replicated in the present study [42, 102, 117].
Actinic keratoses can be viewed as a surrogate measure of cumulative exposure and are
premalignant lesions. Between 1:100 and 1:1000 will develop into an SCC and for this reason they
are always treated or removed. Half of the subjects had at least one of these premalignant lesions,
and there was a significant association of the presence of any actinic keratosis with a 3-fold
increased risk of BCC, reflecting previous findings [78]. Solar elastosis was so common among the
subjects that there was little power to detect an association: more specific measures of this variable,
if developed, may be of more value. Presence of a pterygium was also common among the subjects
with nearly two-thirds of them displaying this surrogate marker cumulative of sun exposure.
Paradoxically, the presence of a pterygium was associated with a decreased risk for BCC, although
the effect was small and not significant.
Both childhood and adult freckling have been associated with BCC and SCC risk and this effect is
replicated here [78]. Pigmentary characteristics and sun exposure combine to cause freckling
(ephelides) and solar lentigines (larger freckles that don’t disappear in winter). All subjects had
evidence of some of these lesions. Most subjects (91.9%) reported having freckles in childhood.
Although 17% of subjects reported a lack of freckles in adulthood (on the face), most had some
freckles present at the time of examination. Risk of BCC was moderately increased for people with
increased numbers of both freckles and solar lentigines on their arms. The arms are a commonly sun
exposed area and accessible to the clinician as a quick and easy addition to the assessment of a
person’s risk of skin cancer. For these lesions elsewhere on the body risks of BCC were mostly also
elevated, with the highest risks (although still in the low range of OR 2.0 or less) seen in the most
sensitive case-control analysis analysis ie people with a low versus a high number of the lesion.
These trends of increased risk of BCC with freckling and solar lentigines on other parts of the body
require confirmation in a larger study of early-onset BCC.
More than half the subjects had no evidence of seborrhoeic keratoses on each body site examined.
These poorly-studied benign lesions are also known as ‘senile warts’ and have been associated with
147
sun exposure, but not with skin cancer to date (see section 1.4). No significant associations with
BCC risk were found, and there was a consistent and paradoxical reduced risk of BCC with presence
of seborrhoeic keratoses: risk was halved with higher overall body numbers of these lesions.
Similarly, lesions on the chest, abdomen, head and neck, back and lower limbs were all associated
with small but not significantly decreased risks. The arms were the only body site where risk of
BCC was not reduced, although it showed no evidence of giving an increased risk. Numbers of
seborrhoeic keratoses found in this study were far lower than those seen in a comparable Australian
population [169] (see section 2.3.1). Fainter lesions that would be assessed as seborrhoeic keratoses
by an experienced examiner may have been missed in the proband and sibling examinations. If
undercounting of these lesions occurred, it is likely that they would have occurred across all body
areas and for all subjects examined, and therefore does not account for the paradoxical reduced risk
of BCC seen. The possibility that any genetic predisposition leading to BCCs in these subjects also
suppresses the development of seborrhoeic keratoses needs further exploration. The trends of
decreased risk of BCC with these lesions require confirmation in a larger study of early-onset BCC.
Hair colour and eye colour reflected the general fairness of skin pigmentation with few subjects
reporting dark hair or brown eyes. It was evident by the two measures employed to estimate
constitutive hair pigmentation that reporting by naming of hair colour is subjective and probably
unreliable. Self-reported hair colour by naming differed from self-report by identification of hair
swatch, with the term ‘light or mouse brown’ associated with the most variation in selection of
swatch; more of these individuals selected a fair/blonde hair swatch than a brown one. Neither eye
colour nor hair colour emerged as convincing predictors of BCC risk: green eye colour was
associated with a small non-significantly decreased risk and blue with a small non-significantly
increased risk compare with darker eyes. Thus there was no clear trend of an effect with for this
variable on the risk of BCC. Similarly, hair colour associations were inconsistent although mostly
tended towards increased risk of BCC with fairer hair. The most reliable measure to detect a
difference in risk with hair colour - if one was indeed present - was from the hair swatch selection
by case-control pairs. No effect of hair colour was seen in this study. This is not a surprising finding
given the variability in predictive value of these traits in the literature [47, 112]. They may act as
surrogate markers for pigmentary characteristics or sun sensitivity, but seem to be relatively
unreliable ones.

148
Overall, these early-onset BCC probands and their siblings were relatively fair-skinned, with 93.2%
describing themselves as fair- or very fair-skinned, and the remainder olive/brown. Significant
differences in skin pigmentation were detected between the two groups as measured by
spectrophotometer, suggesting that constitutive red-green reflectance of the skin decreases the risk
of BCC (OR 0.6). Constitutive luminance was associated with a slightly (but non-significantly)
increased risk of BCC, however much of the variance of this measure was explained by the
measures of yellow-blue reflectance and red-green reflectance. Constitutive yellow-blue reflectance
tended towards a decreased risk of BCC but was also not significant. Red-green reflectance was the
only independent predictor of BCC risk.
The red-yellow pigment phaeomelanin prevalent in lighter skinned persons probably causes
decreased skin photoprotectivity [251, 264] compared with the darker, more photoprotective
eumelanin [262]. Although lighter, easy-burning skin is likely to have more phaeomelanin and less
eumelanin than darker skin, the exact relationship between skin phototype and
pheomelanin:eumelanin production in the epidermis is not straightforward or directly predictable
[260, 278]. MC1R variants are thought to contribute to individual differences in pigmentation, and
in particular, to eumelanogenesis and pheomelanogenesis; MC1R variants also contribute to risk of
BCC, independently of their effect on pigmentation [283]. Individuals with the same MC1R variants
may display differences in hair pigmentation; for example, auburn or strawberry blonde [266]. Thus
other loci are likely to be involved in the creation of pigmentary characteristics. It has been
hypothesised that MC1R variants may be involved in the switching between eumalanogenesis and
pheomelanogenesis [279].
Skin colour has shown less association with risk of BCC in the literature than sun sensitivity has;
however the lack of access to or use of objective measurement techniques for skin colour may have
contributed to this. Skin colour is not only dependent on melanin pigmentation, but is also
influenced by the presence of superficial capillaries (increases redness), collagen content (increases
yellowness), body hair, thickness, and moisture [397]. The BYK Gardner spectrophotometry
readings are not calibrated to melanin content of the skin or a suitable surrogate such as MC1R
variant status, and this analysis is urgently necessary to allow better interpretation of
spectrophotometric measures. Nevertheless, it is evident from the changes in pigmentation on the
outer arm seen over the seasons (see figure 4.3) that yellow-blue reflectance and red-green
reflectance are greater on the outer than the inner arm, suggesting a relationship with sun exposure

149
that is likely to be related to melanin in the skin. Yellow-blue reflectance and red-green reflectance
also increase slightly in the hotter months (summer) compared with the cooler months (winter),
suggesting that these two variables do increase concomitantly with the tanning response; of the
possible contributors to skin colour, melanin pigmentation is the only one that is likely to change
skin colour acutely in this way. Constitutive skin colour also changes with the season although not
as markedly as the outer arm, with a small increase of yellow-blue reflectance and decrease of red-
green reflectance with summer as compared with winter.
Constitutive red-green reflectance was associated with a significantly decreased risk of BCC in our
subjects. It was seen in these data that outer arm a* (red-green) values increased in the summer, so it
is a reasonable inference that high a* values are positively correlated with skin melanisation. The
simplest interpretation of these data is that high constitutive pigmentation, as seen in the inner arm
measurements, is associated with reduced risk of early-onset BCC. However further studies are
required to establish the relationship of the L*a*b* parameters with biological parameters such as
skin melanin content and changes due to tanning.
We used the BYK Gardner spectrophotometer to measure skin pigmentation (see section 2.3.3),
whereas the few other studies that have used full-spectrum spectrophotometry for objective
measurement of skin colour have used other insturments such as the Minolta 508 spectrophotometer,
and recorded the measurements differently. Using the Minolta, one group found that risk of BCC in
men and women had a small positive association with spectrophotometric readings [398]. These two
instruments use the same wavelengths of incident light to measure reflected light which may be
recorded in different ways: using the L*a*b* system or through a measure at each wavelength in
20nm increments across all or part of the spectrum measured (400nm to 700nm). Both machines
were tested on the upper arm of three human subjects and the L*a*b* readings were found to be
almost identical (see appendix 4.23). Researchers using the Minolta have chosen to use the
difference between readings at 400nm and 420nm for measurements of skin pigmentation; some of
the information on the spectrum of reflected light is lost by the use of only two wavelengths of light.
We have chosen to use the L*a*b* measure as it may capture more information about the reflected
light across wavelengths of relevance to the perception of the human eye, and therefore probably
provides more information about the skin’s colour than a difference between two wavelengths. This
difference in recording affects the ability to compare the results of research using both instruments.
A study has shown that presence of hair may overestimate pigmentation readings, although this was

150
seen using a different measure of reflected light, and on a different part of the body: it is difficult to
know how this would apply to our results [399]. It may be worthwhile to test this on the outer arm in
future to determine whether subjects should be shaved at the test site.
MC1R variant analysis was not carried out in this project and will be essential to elucidate the
relationships between the L*a*b reflectance measures and risk. A first step would be analysis of
associations between the MC1R red hair-associated (RHC) variants and L*a*b* measures in a large
cohort of controls, examined at different times of the year, in both sun-exposed and non-sun-
exposed sites.
Together these results suggest that skin colour, sun sensitivity, and sun exposure are associated with
an increased risk of BCC.
151
Chapter 5: Analysis of patched for germline mutations in clusters of BCC cases
5.1. Introduction
BCC, SCC and MM all showed significant increases among the first-degree relatives of cases of
early-onset BCC, as shown in chapter three. Sun sensitivity, skin pigmentary characteristics, and
evidence of sun exposure all showed associations with BCC when the cases were compared with
unaffected sibling controls. These data are most consistent with the increase in BCC risk to these
probands being largely due to causes that increase the risk of all forms of skin cancer.
Nevertheless, some striking family clusters of only BCC, to the exclusion of SCC and MM, were
observed. The hypothesis therefore remained that at least some proportion of the observed clusters
of BCC cases, or at least some part of their aggregation, was due to a genetic factor or factors
specific to BCC risk.
Inactivating germline mutations of PTCH cause Gorlin Syndrome, a rare and usually familial
genodermatosis comprising early-onset BCC and developmental abnormalities (section 1.5.4).
Mutation of this gene is associated with a 900-fold increased risk of BCC in Australia. Recently, a
common single nucleotide polymorphism (SNP) in PTCH exon 23 (Pro>Leu) has been associated
with degree of skin pigmentation [235], and combinations of polymorphisms (ie certain haplotypes)
in this gene have been associated with rate of BCC accrual [233].
The melanocortin-1 receptor (MC1R) is involved in individual variation in the type of melanin
synthesized and the way it is distributed in the skin, and variations in this receptor contribute to
individual differences in pigmentary characteristics. MC1R variants are very common in light
skinned populations including Australians of European origin, and red hair-associated variant alleles
of this gene have been associated with a two- to four-fold risk of BCC [267, 283]. No other germline
mutations have been consistently associated with BCC risk, although p53(Arg72) has been linked
with NMSC risk. This chapter addresses the question of whether mutations in PTCH are
contributing significantly to the higher risk of BCC in these individuals. Probands from 56 families
with early-onset BCC were included for genetic analysis. In addition, two probands from a related
cohort of early-onset SCC cases was analysed; these had three or more BCC-affected first degree
family members (see section 2.6 and table 2.3).

152
DNA from peripheral blood from all 58 probands was screened for mutations of the PTCH gene
using PCR, dHPLC and direct sequencing. Twenty of the 23 exons of the PTCH gene were
amplified by PCR and screened in this way. Two dHPLC temperatures were used to screen the
subjects with the highest probability of carrying a PTCH mutation, for the eight exons that most
commonly bear PTCH mutations in Gorlin syndrome (see section 2.6). The remaining subjects were
screened at a single dHPLC temperature for all 20 exons.
No mutations were found in the exons screened for these 58 subjects with personal or family history
of high risk BCC. The SNPs observed were present at frequencies similar to those in the literature.
Where population frequency data for a SNPs were lacking, they were determined in a comparable
Australian cohort without BCC; the frequencies for these SNPs were also similar to the probands’.
Therefore no evidence was found to implicate either PTCH inactivating mutations or SNPs in risk of
BCC in these early-onset cases.
5.2. Results
5.2.1. dHPLC and sequencing analysis of the PTCH gene
Twenty of the 23 PTCH exons were screened for mutations by dHPLC as described in Section 2.5.1
and 2.6. These covered 97% of the coding sequence of PTCH, in which also 97% of all Gorlin
syndrome-associated mutations have been found. The equipment and protocols used were identical
to those used by a collaborating reference laboratory that has been screening Gorlin syndrome
subjects for germline PTCH mutations by this method for several years. In six of the eight exons (2,
3, 14, 15, 17, 18) that most commonly bear PTCH mutations in Gorlin syndrome two dHPLC
temperatures were used to screen the 19 subjects with the highest probability of carrying a patched
mutation. A single temperature was used for the other 14 exons and for screening the other 39
subjects. All products were run with sequence proven wild-type controls and any test sample that
gave a profile different from the control was submitted to bi-directional DNA sequencing. One
variant-negative test sample at random from each exon analysed was sequenced in the forward
direction to confirm presence of the wild type sequence.
Exons 3, 7, 9, 13, 16, 17, 18, 20, 21, 22, and 23b did not show any variant elution profiles in any of
the 58 subjects screened. In the other nine exons (2, 5, 6, 8, 11, 12, 14, 15 and 23a), dHPLC variants
were seen in some of the samples. All these samples were confirmed to be heterozygous for

153
previously described single nucleotide polymorphisms (SNPs) as shown in table 5.1. dHPLC and
sequence appearances of each SNP may be seen in appendix 7.9 and 7.10.
Table 5.1 PTCH SNPs observed and comparison of relative frequencies with database population data Exon SNPa Amino acid
change Proband heterozygote relative frequency (n=58)
Population heterozygote relative frequency
Source of population datac
2 116C>T Leu>Leu 0.034 No data n/a 5 80A>G Thr>Thr 0.103 No data n/a 6 IVS6-55T>Cb N/A 0.450 0.267 HapMap
project: USA European descent n=30
0.500 CCRd: USA European descent n=24
0.125 CCR: USA Han Chinese n=24
0.261 CCR: USA African American n=23
8 IVS8+23G>A N/A 0.017 0.029 NIHPDRe: USA mixed descent n=450
11 IVS11-50G>Cb N/A 0.431 0.468 CCR: USA Caucasians n=95
0.250 CCR: USA European descent n=24
0.267 NIHPDR: USA mixed descent n=450
0.167 CCR: USA Han Chinese n=24
0.087 CCR: USA African American n=23
12 63T>Cb Asn>Asn 0.224 0.167 CCR: USA European descent n=24
0.250 CCR: USA Han Chinese n=24
0.304 CCR: USA African American n=23
84C>T Ala>Ala 0.362 0.458 CCR: USA European descent n=24
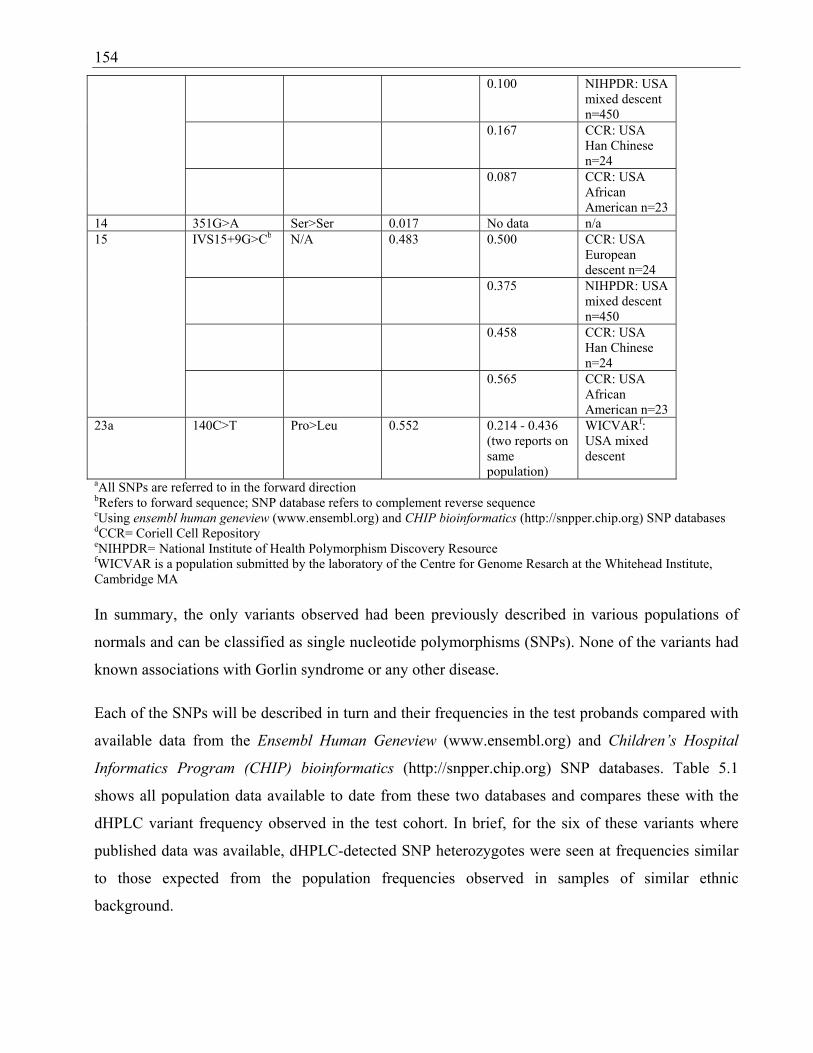
154 0.100 NIHPDR: USA
mixed descent n=450
0.167 CCR: USA Han Chinese n=24
0.087 CCR: USA African American n=23
14 351G>A Ser>Ser 0.017 No data n/a 15 IVS15+9G>Cb N/A 0.483 0.500 CCR: USA
European descent n=24
0.375 NIHPDR: USA mixed descent n=450
0.458 CCR: USA Han Chinese n=24
0.565 CCR: USA African American n=23
23a 140C>T Pro>Leu 0.552 0.214 - 0.436 (two reports on same population)
WICVARf: USA mixed descent
aAll SNPs are referred to in the forward direction bRefers to forward sequence; SNP database refers to complement reverse sequence cUsing ensembl human geneview (www.ensembl.org) and CHIP bioinformatics (http://snpper.chip.org) SNP databases dCCR= Coriell Cell Repository eNIHPDR= National Institute of Health Polymorphism Discovery Resource fWICVAR is a population submitted by the laboratory of the Centre for Genome Resarch at the Whitehead Institute, Cambridge MA In summary, the only variants observed had been previously described in various populations of
normals and can be classified as single nucleotide polymorphisms (SNPs). None of the variants had
known associations with Gorlin syndrome or any other disease.
Each of the SNPs will be described in turn and their frequencies in the test probands compared with
available data from the Ensembl Human Geneview (www.ensembl.org) and Children’s Hospital
Informatics Program (CHIP) bioinformatics (http://snpper.chip.org) SNP databases. Table 5.1
shows all population data available to date from these two databases and compares these with the
dHPLC variant frequency observed in the test cohort. In brief, for the six of these variants where
published data was available, dHPLC-detected SNP heterozygotes were seen at frequencies similar
to those expected from the population frequencies observed in samples of similar ethnic
background.
155
In the exon 2 assay, a C>T SNP was observed at position 116, synonymous Leu>Leu at the amino
acid level. The heterozygote relative frequency in the early-onset BCC probands was 2/58 (0.034)
and no population data were available for comparison.
In the exon 5 assay, a A>G SNP was observed at position 80, synonymous Thr>Thr at the amino
acid level. The heterozygote relative frequency in the early-onset BCC probands was 6/58 (0.103)
and no population data were available for comparison.
In the exon 6 assay, a SNP was observed at intron 6, position -55 (IVS6-55 T>C) in 26/58 probands
(frequency of heterozygosity 0.45). A similar frequency of this SNP (12/24, 0.50) in healthy adults
was seen among North Americans of European descent sampled in the Coriell Cell Repository.
Population heterozygosity varies between samples of assumed similar genetic background, as the
frequency of heterozygosity among another group of European descent was 0.267 (see table 5.1).
Frequencies of this SNP in Chinese and African American groups have been lower than in the
European samples.
In the exon 8 assay, a G>A SNP was observed at intron 8, position 23 (IVS8+23 G>A), in 1/58
probands (frequency of heterozygosity 0.017). This frequency was similar to that found in a
population from North America of mixed descent (0.029).
In the exon 11 assay, a G to C base substitution was found at intron 11, position -50 (IVS11-50
G>C) in 25/58 probands (frequency of heterozygosity 0.431). The frequency of this SNP varied
widely in other populations, ranging from 0.087 to 0.468. The frequency found in a North American
population sample of 95 ‘Caucasians’ was 0.468, which differed little from our proband group who
are mostly also of European descent.
Two SNPs were seen in the exon 12 assays. A base substitution of T to C occurred at position 63 (63
T>C) in 13/58 probands (frequency 0.224) and a C to T substitution occurred at position 84 (84
C>T) in 21/58 probands (frequency 0.362). Neither of these SNPs changes the amino acid sequence.
Five probands harboured both variants (see appendix 7.10 for sequence). SNP 63 T>C occurred at
similar heterozygote frequencies of between 0.167 and 0.304 in mixed populations from the USA,
with the most similar frequency seen in a group of 24 Han Chinese from North America. The SNP
84 C>T was seen in varying rates of between 0.087 and 0.458 in populations of differing genetic
backgrounds from the US. The most similar frequency of heterozygosity to that seen in our group of
probands was seen in 24 North Americans of European descent.

156
In the exon 14 assay, a G>A SNP was observed at position 351, synonymous Ser>Ser at the amino
acid level. The relative frequency of heterozygosity in the early-onset BCC probands was 1/58
(0.017) and no population data were available for comparison.
In the exon 15 assays a G>C SNP was commonly seen at intron 15, position 9 (IVS15+9 G>C), at a
rate of 0.483. A similar frequency of heterozygosity was evident among populations previously
studied (ranging from 0.375 to 0.565) from varied ethnic backgrounds.
In exon 23a, a SNP was observed at position 140 (140 C>T) occurred commonly, with a base
substitution of C for T in 32/58 probands (frequency of heterozygosity 0.552). This SNP alters
proline to leucine at amino acid position 1315 of the protein. It has been reported to occur at a
similar frequency in North American populations of mixed racial background, albeit at two different
heterozygosity frequencies, 0.214 and 0.436.
In summary, none of the SNPs observed in these exons, for which published population data existed,
showed frequencies in this cohort that deviated from published values. Where there was no relevant
data from other populations, control data was obtained from an Australian sample.
5.2.2. Comparison with Australian population SNP frequency
For the three exonic, synonymous SNPs observed in exons 2, 5, and 14, there was no population
data available with which to compare the frequencies seen in the probands. In order to seek
preliminary evidence as to whether these SNPs were associated with early-onset BCC, a
‘convenience’ control group was sought. The set of control siblings would only have been suitable
for this purpose in a much larger study, given the low frequencies observed in the probands.
Age- and sex-matched controls (n=110) were selected from subjects in an Australian population-
based study of melanoma [410]. They were relatives of the probands (who were cases of early-onset
melanoma in Sydney, Melbourne or Brisbane). The protocol of that study does not include
collection of data from relatives as to previous diagnoses of NMSC, so their status with respect to
BCC is unknown. However they are known to have 91% Anglo-Celtic ethnicity, a frequency similar
to that expected in this cohort of BCC-affected probands.
One hundred and ten control samples were screened for the exon 2, 5 and 14 SNPs and the results
are shown in table 5.2. In addition, data are shown for the exon 15 SNP, which was screened (in an
earlier, preliminary project) in 30 controls from this group age- and sex-matched to the 19 initial

157
probands that had been screened at two dHPLC temperatures for exon 15. Published data existed for
this SNP, but this comparison was to rule out any possible large differences in frequency of PTCH
SNPs between these Australian controls and other populations previously tested.
Table 5.2 PTCH SNP frequency data comparison with Australian population sample Exon SNP Amino
acid change
Relative frequency early-onset BCC probands
Relative frequency Australian population sample
p value: Fisher’s exact test (2-sided)
2 116C>T Leu/Leu 0.034 (2/58 )
0.028 (3/105)
1.000
5 80A>G Thr/Thr 0.103 (6/58)
0.047 (5/106)
0.197
14 351G>A Ser/Ser 0.017 (1/58)
0.020 (2/102)
1.000
15 IVS15+9 G>C
N/A 0.483 (28/58)
0.519 (14/27)*
0.818
*population frequency range 0.375 – 0.565 (see table 5.1)
None of these SNPs were novel, but no data on their prevalence in the population was available. The
purpose of the comparison of heterozygote frequencies in the BCC probands and a comparable,
though not strictly controlled, Australian population sample was to rule out the possibility that these
were otherwise rare SNPs with a potential association with BCC. This would have remained a
possibility if they had not been observed in the ‘control’ sample, however all three were observed at
similar frequencies in both samples (see table 5.2).
The exon 2 116C>T SNP was observed with a relative frequency of 3.4% in the Australian controls
(p=1.000, Fisher’s Exact Test for comparison with BCC proband sample). The exon 5 80A>G
substitution (A>G 80) was observed with a relative frequency of 4.7% of the Australian controls (p=
0.197, Fisher’s Exact Test). The exon 14 351G>A SNP was observed in 1.9% of controls (p=1.000,
Fisher’s Exact Test). For the exon 15, IVS15+9G>C SNP, its frequency in the Australian population
sample (51.9%), was similar to that in the BCC proband group (p=0.818, Fisher’s Exact Test), as
well as within the range of published values (population frequency range 0.375 – 0.565, table 5.1).

158
5.3. Limits on PTCH mutation frequency in early-onset BCC probands
Given that no mutations were found in this group of 56 early-onset probands, what can we infer
about the general population from which this sample was drawn?
We assume a Poisson distribution because PTCH mutation is considered to be a rare event and
calculate the upper 95% confidence limit:
P(X) = e-λλx
X! Where P = 95%, X = 0, λ= rate of mutation
0.95 = e-λλ0
0!
0.95 = e-λ
-λ = ln(0.95)
λ = - 0.051
The upper 95% confidence rate of the mutation frequency is 5.1%, meaning there is a 97.5% chance
that PTCH mutations occur in fewer than 5.1% of Australians with early-onset BCC.
5.4. Discussion
Nine of the 20 exons screened were found to harbour single nucleotide polymorphisms (SNPs), seen
on dHPLC as variant melting curves and confirmed on direct sequencing. In eight exons, only one
SNP was seen, and in one, two SNPs were apparent. All SNPs produced non-coding variants except
for one, the T>C 140 SNP on exon 23a causing a proline to leucine change, seen in 46% of the
subjects screened. This SNP was seen in a similar frequency (43.6%) in a SNP database (CHIP)
comprised of persons of European background who were likely to be of similar racial mix to this
sample. Five more of the 9 exons harbouring SNPs had population SNP data for comparison, and in
each, the proband SNP frequency was similar to the population SNP frequency. For the remaining
three exons harbouring SNPs there were no population SNP data available. For these three exons, a
control group was chosen from the Australian population for comparison of these exons in the
PTCH gene. The frequency of SNPs in this group for each of the three exons lacking comparable
population SNP frequency data was not significantly different to that found in the proband group
159
(see table 5.2). A subset of these controls was compared with the SNP frequency of one of the exons
for which population SNP data was available (exon 15). This confirmed that Australian SNP
frequency for PTCH is likely to be similar to that from international data on European-derived
populations.
The familial aggregation of BCC in nearly a fifth of all the families screened is suggestive of genetic
susceptibility as a contributing factor to its cause. The tumour suppressor gene PTCH is a candidate
as a contributor to genetic susceptibility. Gorlin syndrome is caused by the autosomal dominant
inheritance of a gene that leads to marked susceptibility to BCC and a range of developmental
defects. PTCH is the cell growth regulatory gene responsible for this disorder, and mice with
knockouts of one copy of PTCH develop BCCs when exposed to UVR [4]. In addition, PTCH
mutations are found very commonly within sporadic tumours suggesting a possible necessary
involvement of this pathway in tumours outside of Gorlin syndrome. Importantly, it appears that no
studies have previously looked at possible germline mutations of this gene in non-Gorlin families
with susceptibility to BCC. Thus it is obligatory that this gene be examined when investigating
possible genetic causes of familial aggregation of this tumour.
Twenty PTCH exons (exons 2, 3, 5 to 18, and 20 to 23) were screened for mutations in this study.
Together these exons account for 4196 coding base pairs (97% of the total of the 4345 coding base
pairs) and for 97% (199/206) of the published mutations in PTCH. The only exon with published
mutations not to be screened was exon 19, and this was excluded due to technical problems with
amplification of the exon by PCR. The primers used amplified the full coding segment and the
splice junctions next to each exon. dHPLC screening found variants in the introns adjacent to exons
6, 8, 11 and 15, which confirms that those assays were effective.
dHPLC identifies DNA variants mainly through detection of the altered affinity and mobility of any
heteroduplexes formed between mismatched nucleotides in double stranded DNA during the
reannealing phase at the end of PCR. The sensitivity of dHPLC to detect these heteroduplexes in
amplicons sized 100 to 732 base pairs is estimated to be between 92-100% [400-402] and is
increased by performing dHPLC at multiple temperatures. [402]. Thus for single temperature
screening, the sensitivity is 92% at worst. Generally, dHPLC is a reliable technique to screen for
single nucleotide substitutions, deletions and insertions [403].
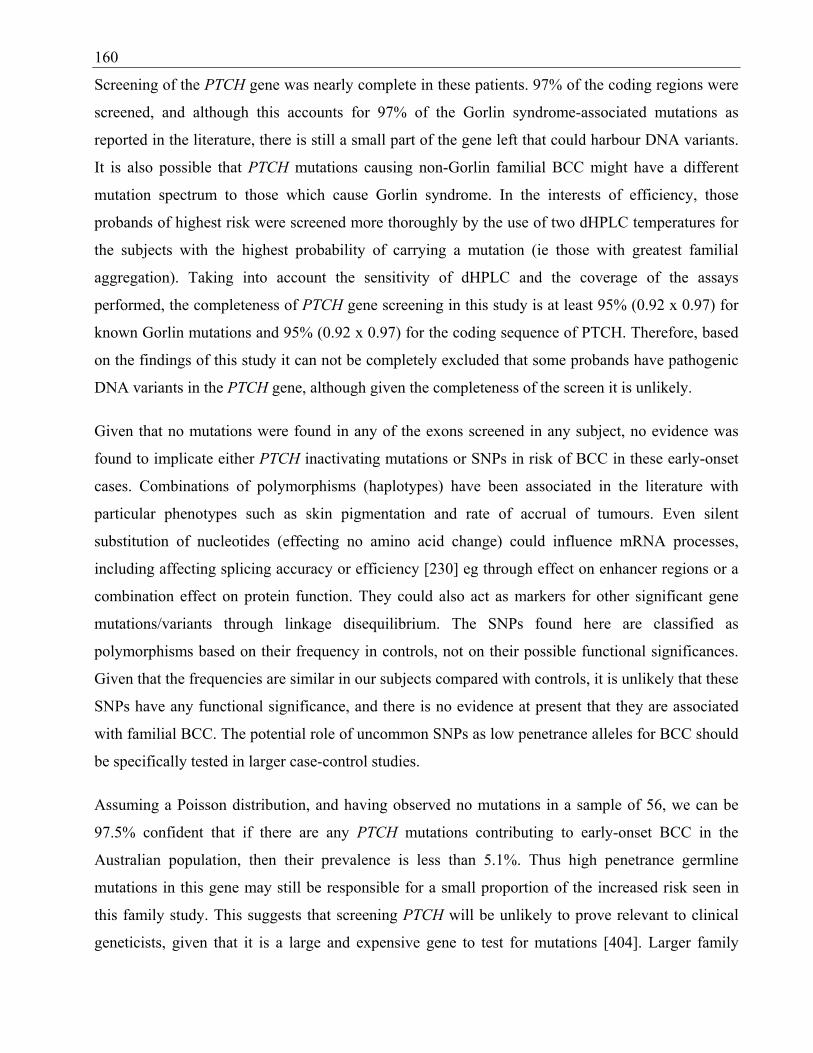
160
Screening of the PTCH gene was nearly complete in these patients. 97% of the coding regions were
screened, and although this accounts for 97% of the Gorlin syndrome-associated mutations as
reported in the literature, there is still a small part of the gene left that could harbour DNA variants.
It is also possible that PTCH mutations causing non-Gorlin familial BCC might have a different
mutation spectrum to those which cause Gorlin syndrome. In the interests of efficiency, those
probands of highest risk were screened more thoroughly by the use of two dHPLC temperatures for
the subjects with the highest probability of carrying a mutation (ie those with greatest familial
aggregation). Taking into account the sensitivity of dHPLC and the coverage of the assays
performed, the completeness of PTCH gene screening in this study is at least 95% (0.92 x 0.97) for
known Gorlin mutations and 95% (0.92 x 0.97) for the coding sequence of PTCH. Therefore, based
on the findings of this study it can not be completely excluded that some probands have pathogenic
DNA variants in the PTCH gene, although given the completeness of the screen it is unlikely.
Given that no mutations were found in any of the exons screened in any subject, no evidence was
found to implicate either PTCH inactivating mutations or SNPs in risk of BCC in these early-onset
cases. Combinations of polymorphisms (haplotypes) have been associated in the literature with
particular phenotypes such as skin pigmentation and rate of accrual of tumours. Even silent
substitution of nucleotides (effecting no amino acid change) could influence mRNA processes,
including affecting splicing accuracy or efficiency [230] eg through effect on enhancer regions or a
combination effect on protein function. They could also act as markers for other significant gene
mutations/variants through linkage disequilibrium. The SNPs found here are classified as
polymorphisms based on their frequency in controls, not on their possible functional significances.
Given that the frequencies are similar in our subjects compared with controls, it is unlikely that these
SNPs have any functional significance, and there is no evidence at present that they are associated
with familial BCC. The potential role of uncommon SNPs as low penetrance alleles for BCC should
be specifically tested in larger case-control studies.
Assuming a Poisson distribution, and having observed no mutations in a sample of 56, we can be
97.5% confident that if there are any PTCH mutations contributing to early-onset BCC in the
Australian population, then their prevalence is less than 5.1%. Thus high penetrance germline
mutations in this gene may still be responsible for a small proportion of the increased risk seen in
this family study. This suggests that screening PTCH will be unlikely to prove relevant to clinical
geneticists, given that it is a large and expensive gene to test for mutations [404]. Larger family

161
studies may be able to determine if this gene does contribute at all to increased risk of BCC, and
multiple large studies showing a lack of association will be needed to exclude PTCH as a
contributory factor to BCC.
One proband (9125) was affected with Gorlin syndrome, although the clinical features of this family
were atypical for Gorlin’s syndrome: the proband had pathognomonic Gorlin syndrome features
(multiple early-onset BCC, palmar pitting, characteristic facies and calcification of the falx cerebri),
but there were no typically affected first degree relatives. Clinical records show that the proband’s
father had falx cerebri calcification, but no BCC. PTCH gene screening for this subject was also
done in a clinical setting and this showed that no DNA variants were present in the PTCH gene of
either individual. This confirms our finding (of no mutation in PTCH for this proband), and suggests
a contribution to the disease of other genes in this family, most likely genes coding for proteins
involved in the hedgehog signalling pathway (see section 1.5.2). To thoroughly exclude other
members of the hedgehog pathway from involvement in population risk of BCC, other genes in this
pathway should be screened for high risk families in the same way (eg smoothened, Gli1, Gli2, and
Gli3).
Functional studies of the SNP variants found could be performed to determine whether or not they
are truly benign polymorphisms, although this is very unlikely as no associations with BCC
susceptibility were seen here. Since all of the SNPs seen here except one are intronic or synonymous
variants, the protein sequence will not be affected. To rule out an effect on the function of the
protein however, a bioinformatics analysis of the relevant sequence should be undertaken. The
involved regions of the gene would be examined to determine whether they are in evolutionarily
conserved domains indicating a possible important role in the function of RNA processing or
trafficking, for example altering splice junctions to cause a false splice site. If the involved domains
are highly conserved, a study of mRNA splicing should be undertaken in cell lines from carriers and
non-carriers of a similar genetic background.
Examination of MC1R variant frequency is the next priority when considering genes that could be
contributing to the BCC-specific aggregation occurring in this family study. This polymorphic gene
codes for a receptor that is involved in individual differences in pigmentary characteristics such as
skin, hair and eye colour. Studies have shown that variants of MC1R are also associated with BCC
risk, and that this occurs independently of pigmentation phenotype (see section 1.7.6): it would be
interesting to see the correlation between variants of this gene and phenotypes of patients in family

162
studies. As discussed in the previous chapter, correlation of MC1R genotype with skin colour
parameters recorded by the BYK Gardner, or other full-spectrum reflectance, spectrophotometer
will be necessary for their full interpretation (see sections 2.3.3 and 4.2.2.3).
163
Chapter 6: Discussion
6.1. Introduction
This family study aims to investigate the causes of BCC. People who had BCC before the
age of 40 were recruited in order to study people who are enriched for risk factors: these
are the youngest 7% of the population to have this disease. A study of 56 families of
people with early-onset BCC has enabled an investigation into the causes of BCC and has
confirmed the hypothesis that first degree relatives of people with early-onset BCC are at
greater risk of NMSC and MM than the general Australian population. Despite no
differential overall risk to relatives of BCC over SCC, there were nevertheless a subgroup
of families with aggregation of BCC alone (to the exclusion of SCC), suggesting the
existence of BCC-specific risk in some families.
Examination of the probands and their unaffected siblings confirmed the hypothesis that
identifiable phenotypic risk factors for early-onset BCC exist. These were found to be a
mixture of pigmentary and sun-exposure-related risk factors and suggest that
combinations of genetic and environmental factors are involved in BCC susceptibility. A
study of the PTCH gene failed to find any mutations and does not support the hypothesis
that mutations in this gene are responsible for the increased risk of BCC seen in the
probands. Polymorphisms in this gene were found in a similar proportion to the general
population, the significance of which to BCC risk is unclear.
6.1.1. Context
This family study is the first of its kind to look at familial aggregation of NMSC in any
general non-syndromic population, and shows that this kind of research is an important
addition to current cancer research in NMSC. Given the enormous burden of disease that
BCC and SCC present to the Australian and international communities, it is surprising
that this is the first time familial aggregation of NMSC has been examined in this way.
NMSC does aggregate in families of probands with early-onset BCC, showing that some
families exist that are enriched for risk factors to these tumours. These risk factors are
made up of genetic and environmental factors, both of which have been examined to
164
some extent here, and that should be examined in further detail in future studies. A bank
of DNA from these multiple-case BCC-affected families has been created for the first
time by this project, and may be used and expanded upon for further studies on the
genetics of skin cancer.
Important additions to the understanding of the aetiology, prevention and treatment of
other cancers such as breast cancer and colon cancer have been gathered from this type of
research; in some cases the identification of high and medium-penetrance susceptibility
genes. Despite its limited scale, this project has demonstrated the feasibility and
efficiency of a strategy of recruitment of early-onset BCC cases. Further work with larger
samples need to be done; this will allow for segregation and linkage analysis for further
characterisation of the way this disease may be inherited.
The current study also uses a novel approach to determining prevalence from recent
nationwide Australian incidence data on NMSC, in lieu of cancer registry data on these
cancers. The resulting estimate is not perfect, but is the best approximation to
calculations performed using cancer registry data in other cancer studies. The success of
this approach leads to several important conclusions: that such incidence studies on the
Australian population are important for family studies in NMSC; that regular collection
of this rapidly changing data will be important for genetic epidemiological studies
involving NMSC in the future; and that prevalence may be estimated from incidence data
for cancers not on cancer registries to allow comparison of sample populations with the
general population.
6.2. Hypothesis 1: First degree relatives of people with BCC are at increased risk of
NMSC compared with the general population, with a differentially greater risk
of BCC than SCC
We have shown that first-degree relatives of people with early-onset BCC are at
increased risk of BCC, SCC and malignant melanoma. The exact risk seen in this study
varies by cancer, gender, and relative type. The risk of BCC was elevated in all relatives,
but significantly elevated in brothers, sisters, and mothers of people with early-onset
BCC, with the greatest risk seen to brothers who had a greater than five-fold increased
165
risk of also having this tumour. The risk of SCC to relatives of people with early-onset
BCC was elevated in brothers, sisters and fathers of people with early-onset BCC, and
significantly elevated in sisters and fathers. The greatest risk seen was in sisters of
probands who had a greater than five-fold risk of having this tumour. The risk of
malignant melanoma was also raised in all first-degree relatives, but significantly
elevated for male relatives, the greatest risk seen to brothers who had over ten-fold
increased risk of having this tumour.
These figures should be interpreted with the knowledge that the cases were ascertained
from the SCFA database which is not a statewide registry (see section 2.1.1) and as with
all family cancer studies, there may be an ascertainment bias whereby people who have a
history of cancer in the family may be more likely to consent to participate in cancer
studies. As calculated in section 3.6, any overestimation due to this potential bias is likely
to be less than two- to three-fold, and therefore the observed increased risk to relatives of
all three types of skin cancer is likely to be true of early-onset BCC cases as a whole.
However, given these limitations the results cannot be generalised to an estimation of
prevalence of NMSC in the families of people in the general population with early-onset
BCC.
The hypothesis of a differentially increased overall risk of BCC specifically as compared
with SCC in relatives of people with early-onset BCC was not supported by this study.
Instead, risks for both types of NMSC were increased. Nevertheless, in one third of
families affected by NMSC, clusters of BCC alone (to the exclusion of other skin cancer
types) did occur. This suggests the possibility of BCC-specific risk factors operating in
some families, despite the absence of a differentially increased risk for BCC overall in
the whole sample of 56 families. This concept needs to be explored further with larger
family studies that are likely to identify more families with clusters of BCC. Further
genotypic and phenotypic analysis could be done on identified BCC-specific families.
6.2.1. Estimation of population prevalence
To determine how the subjects’ risk of skin cancer compares to the Australian population,
we would ideally compare the incidence per year of each cancer in each subject with that

166
of the incidence of cancer in the same age and sex of the Australian population at the
same period in time. This data is not available and instead we have estimated the risks for
the Australian population based on a national incidence survey for NMSC from the year
1995 [1] and cancer registry data for melanoma data, from the year 1996.
The incidence figures from the nationwide survey used as a representative of Australian
population cancer figures may not truly represent the current population incidence, as
discussed in section 3.6. The Poisson model used to fit a curve to the incidence figures
from the survey suggest that it provides a reasonable approximation to the whole
population incidence. We have used the incidence figures from the year 1996 to estimate
the expected prevalence of disease in our subjects and there are inherent problems in
doing this.
The estimated incidences relate to the risk of skin cancer in the population in 1996, and
may differ from the risk in other years. It is clear that the incidence of both melanoma
and nonmelanoma skin cancers in Australia have been increasing over the last several
decades, at least in older persons, meaning that this “snapshot” of risk for skin cancers
from 1996 may be an overestimate of the total risk of individual subjects in this study
who have lived through many years where the risk was likely to have been significantly
smaller. Consequently it is also likely that the overestimate will be smaller for younger
persons as there has been less time in which to expect a change in the population’s
incidence. In addition, incidence of BCC may actually be decreasing in younger people
(under the age of 50 years), meaning that for siblings of probands, our population
estimates could be slight underestimates [1].
Inferring individual risk of skin cancer from this data also assumes that the data is taken
from a homogeneous population, that is, one where each member of the population’ risk
is equal. The Australian population is obviously heterogenous with risks likely to be
associated with skin phototype, other genetic influences, and environmental exposures of
the individual. This data is likely to include individuals with multiple skin cancers who
will represent a larger proportion of this risk than others. It will also include persons of
skin phototype III or IV who are likely to contribute relatively little to the overall risk to

167
the population. As the subjects of the current study are largely of European background
and born in Australia, the estimates of population incidence could provide an
underestimate of the actual risk to the subjects of this study.
Despite these possible biases, our approach to the estimation of population prevalence of
NMSC provided a reasonable basis with which to compare subject cancer prevalence,
and could be used as a model for determining population prevalence in future studies.
6.3. Increased cancer risk in these families: possible causes?
Overall, susceptibility to NMSC and MM is increased in these 56 families compared with
the general population: this fact needs some explanation and warrants further investment
into family studies in the area of NMSC. The fact that a proportion of families have a
cluster of multiple BCC also suggests a susceptibility to this cancer specifically,
separately to NMSC susceptibility. The root of all this increased susceptibility is to be
found in a combination of environmental and genetic risks, some of which may be
reflected in the phenotypic risk factors identified in probands. Family members usually
share very similar environments and therefore environmental risks; they also share very
common genetic backgrounds making differences in either easier to identify than simply
among unrelated members of the same cohort in the general population.
The possible causes of the familial aggregation of skin cancer seen in this study are due
to a complex interaction of environmental and genetic risk factors. By looking at
phenotypic differences between sibling pairs, the variance in environmental influences
seen between members of the general population is reduced as siblings generally share
similar environmental influences. This means that any differences between the
individuals in the pairs are more likely to have a genetic basis. We looked at the
phenotypic differences between affected probands and their oldest unaffected siblings
(where available) in order to find out more about the possible basis for their increased
risk of cancer.

168
6.3.1. Hypothesis 2: Identifiable pigmentary and sun exposure related risk
factors are present in people with early-onset BCC compared with their
unaffected siblings
Differences seen on examination between people with early-onset BCC and their
unaffected siblings suggest that genetic differences in combination with high risk sun
exposure behaviours have contributed to the increased risk of BCC in probands. It is very
difficult to disentangle the environmental from the genetic causes of these differences, as
these risk factors are interactive. The term ‘sun sensitivity’ encompasses a mixture of
inherited characteristics that make up a person’s skin colour, propensity to burn and
ability to tan. Skin ‘phototype’ predicts BCC risk in our subjects and this confirms
previous research: people with very fair skin (phototype I = always burn/never tan) have
almost 10 times the risk of BCC compared with people with darker skin (phototype III =
sometimes burn/usually tan). Phototype is relatively uncontaminated by environmental
exposure as a risk and suggests a difference in genetic susceptibility. However, phototype
is likely to affect sun exposure behaviour to some degree, although a lower phototype
individual is likely to reduce their sun exposure and therefore cause an underestimation
of risk at best.
A similar effect with increased BCC risk for a decreased ‘ability to tan’ and increased
‘propensity to burn’ was seen although significance was not achieved with this group. As
seen in section 1.7, pigmentary characteristics are influenced by, but not directly related
to an individual’s MC1R variant status: MC1R expression may be modified by other as-
yet-unknown genes and proteins to result in phototype. It is also possible that PTCH
polymorphisms interact with MC1R variant status to affect NMSC risk as suggested by
one research group [235]. MC1R variant status would be the next priority in genetic
candidates to examine in such a group, and correlation with sun sensitivity factors and
PTCH haplotype would be of interest as potential predictors of risk.
Actinic keratoses are related to cumulative sun exposure and are both precancerous and a
marker of SCC risk. Our study confirms other work [78] showing that they may also be
considered a marker for BCC risk, with a three-fold risk for BCC seen with presence of
169
any actinic keratoses. As BCC seems to be associated more with intermittent exposure
than cumulative, and SCC more to cumulative than intermittent [14], we would expect
actinic keratoses to be better markers for SCC than BCC. Freckling and solar lentigines
were also associated with small increased risks, and although significant only on the
arms, given the trends seen here are likely to act as markers for BCC risk elsewhere on
the body in larger samples. Presence of these lesions probably reflects a high risk level of
intermittent or cumulative sun exposure in combination with high risk skin pigmentary
types. Questionnaires indexed to lifetime residential and work history used by other
research groups [38, 80] would be valuable in this context, and we would expect to see
increased intermittent sun exposure in this group, and perhaps, but not necessarily,
increased cumulative exposure compared with unaffected relatives. Administration of
such questionnaires should take high priority in sufficiently-funded future family studies
on NMSC, for the information on interaction of environmental, genetic, and phenotypic
risk factors that this would provide.
Red-green reflectance in constitutive skin colour was associated with decreased BCC
risk, and this may be interpreted as a decreased risk of BCC with increased skin
melanisation. Skin colour has shown less association with BCC risk than sun sensitivity
in the literature, although firm conclusions have been difficult due to the lack of
consistent and reliable measures of skin colour used to date. Few research groups have
used the BYK Gardner spectrophotometer, and studies using similar instruments have
reported single readings only, making comparisons with the present study’s results
difficult [398].
The BYK Gardner spectrophotometer needs to be calibrated to melanin content and
perhaps a suitable marker such as MC1R variant status, and this correlation would be
relatively simple in future studies where both measures are performed. This would allow
important interpretation of spectrophotometer measurements with respect to genotype
and phenotype. The influence of hair on the readings of this instrument should also be
examined to ensure that systematic bias is not being introduced by the hairiness of the
test site, as seen with the Minolta spectrophotometer [399].
170
Hair and eye colour were not good measures of BCC risk in this study, reflecting
previous trends [103, 112]. Importantly, it is noted that self-report of hair colour by
naming the colour may be an unreliable and subjective measure, and that the use of hair
swatches may allow a more objective assessment of this variable. Seborrhoeic keratoses
were paradoxically associated with a trend towards decreased risk of BCC. Many
probands and siblings were scored as having no seborrhoeic keratoses, and this is an
unlikely result in an Australian population based on previous studies. This indicates that
faint lesions were probably missed by the examiner. The validity of the examination for
these lesions is questioned, and highlights the need for adequate training of the examiner
in identification of all lesions. It is unclear whether faint seborrhoeic keratosis lesions
and pigmented seborrhoeic keratosis lesions are in a relatively constant proportion to
each other between body sites and also between patients. Any undercounting is likely to
have occurred systematically for all subjects and all body regions and therefore the
unexpected paradoxical association with decreased risk of BCC would still require
explanation. It should be considered that any genetic predisposition to early onset BCC in
these subjects also in some way suppresses the development of these benign lesions.
Solar elastosis and pterygium were so common as to lose sensitivity as markers, and
broader spectra may be required in coding these variables in future.
6.3.2. Possible environmental causes
Environmental risks that are likely to increase risks of all three types of skin cancer
include general sun exposure, with intermittent sun exposure probably predisposing more
to BCC [101, 102] and MM, and cumulative exposure predisposing more to SCC [14].
Studies show that childhood and adolescent exposure may also contribute more to BCC
and MM risk than later exposure, whereas for SCC risk the cumulative dose may be more
important [81, 99, 103]. Questionnaires regarding sun exposure over the individuals’
lifetime may help to support or refute these hypotheses. Despite the known risk of UVR,
other factors must be operating to give the 5- to 10-fold increased skin cancer risks seen
in these family members, as sun exposure contributes relative risks in the low 1.0 to 2.0
range, and cannot account entirely for the figures seen here.

171
Other environmental risk factors that may increase risks of NMSC include HPV infection
or possibly other as-yet-unidentified viral agents. Infectious agents such as viruses may
cluster in families. HPV is a common viral infection, and high risk genital types have
recently been identified as possible risk factors for both BCC and SCC [308]. Several
studies have shown that hair follicle reservoirs of HPV infection exist [323, 324, 405],
and eyebrow hairs are a convenient source of these [324]. It is unclear if eyebrow hairs
are an adequate marker of HPV infections elsewhere on the body or of the HPV-type
within epidermal lesions. Collection of eyebrow hairs during examination of subjects is a
reasonably non-invasive way of measuring sub-clinical HPV infection and conducting
investigations into the possible association with skin cancer susceptibility. Several
members the human herpes virus family contribute to human cancer pathogenesis, and
CMV needs further investigation as a possible co-factor for NMSC [333].
Exposure to therapeutic ionising radiation also increases the risk of NMSC [151-153].
Surveillance of individuals and their families for all forms of skin cancer may also
increase following the diagnosis of one member with any type of skin cancer. Arsenic
exposure and sites of scars from physical trauma have also been reported to increase risk
of BCC specifically. Theoretically these environmental predispositions could be shared
by family members and contribute to their increased susceptibility.
6.3.3. Hypothesis 3: Mutation in PTCH is responsible for some of the
increased risk in early-onset non-syndromic BCC probands
Candidate cancer susceptibility genes for NMSC and MM are likely to include MC1R:
preliminary studies show that variants in this gene may increase risk of skin cancers
independently of their effect on pigmentary characteristics [267, 274, 283]. It is possible
that certain variant alleles negate the UVR protection usually afforded to people of higher
phototype (darker skin) by their pigmentation.
The tumour suppressor gene PTCH is an obvious candidate for BCC-specific cancer
susceptibility given its role in Gorlin syndrome, a rare familial genodermatosis involving
predisposition to multiple early-onset BCC (see section 1.5.4). The current study is the
first to examine this gene in the context of non-syndromic population susceptibility to

172
BCC. We found no mutations in the PTCH gene in 58 early-onset probands with BCC,
indicating that if PTCH mutations are causing population susceptibility to this tumour,
then they are not a major contributing factor. Almost all of the coding sequence of PTCH
in which Gorlin syndrome-associated mutations have been found was thoroughly
screened and found to harbour no mutations. Given the numbers of subjects involved and
the completeness of screening of this gene, we can be sure that if PTCH mutations are
causing population susceptibility to BCC, that this is affecting less than 5% of the high
risk non-syndromic early-onset cases in the community. This important result needs to be
confirmed in larger studies. It does give preliminary evidence that PTCH is unlikely to be
a major susceptibility gene to BCC outside the context of Gorlin syndrome. As the
prevalence of any mutations causing general population BCC is likely to be less than 5%,
this result also indicates that screening PTCH will be unlikely to prove relevant to clinical
geneticists, given that it is a large and expensive gene to test for mutations of such a low
yield.
Single nucleotide polymorphisms in PTCH in these 58 subjects were seen at a similar
frequency to that reported in other studies in SNP databases (see section 5.4). Most of the
other studies are from small groups in the USA and all have different ethnic mixes to that
seen in Australia, and as they have obviously been ascertained in different ways, are not
an ideal comparison for the Australian sample examined here. The current polymorphism
heterozygosity results for PTCH will add useful data to this bank of polymorphism data
for comparison in the future for other studies on this gene in Australia and
internationally. Given their similar frequency to that seen in controls, these SNPs are
unlikely to be contributing to the BCC susceptibility seen in these families. However,
functional studies of these SNPs would be required to rule out a role in susceptibility to
BCC.
6.3.4. Other possible genetic causes
Other genes in the Hedgehog signalling pathway are still candidates for susceptibility
genes for BCC, and should be further investigated in susceptible people. Activating
smoothened mutations have been found in human BCC tumours themselves, and mice
173
overexpressing Gli1 or Gli2 develop BCC-like tumours. Overexpression of the hedgehog
gene itself in human and mouse skin leads to BCC-like tumours also. Potential
interactions of PTCH polymorphisms with other gene variants (eg MC1R) mutations
would also be of interest before ruling out possible PTCH involvement in susceptibility
to BCC.
Germline mutations or variants that may be involved in NMSC susceptibility also include
p53Arg, whereby a polymorphism at codon 72 of P53 replaces proline with arginine and
results in a protein with increased susceptibility to HPV-mediated degradation. Since
UVR-mediated mutation of p53 is known to occur commonly in BCC tumours
themselves [292], this variant of p53 may be contributing to population susceptibility to
BCC and SCC through infection with HPV. Conflicting evidence has been provided
regarding this possibility [406-409]. The genetically polymorphic glutathione s-
transferase genes and cytochrome P450 enzyme genes are attractive candidates for cancer
susceptibility because of the roles they play in metabolizing toxins. They have been
studied with respect to NMSC susceptibility and again, no firm conclusions can be made.
Further studies are needed to map and identify BCC susceptibility genes. These should
include genome-wide linkage studies of dense family clusters in which PTCH mutations
have been excluded, in order to exclude the presence of as yet undetected hign-
penetrance susceptibility gene mutations. It is likely that these will be more efficient if
restricted to clusters with early median age of onset. In addition, genome-wide
association studies are needed on large cohorts of cases and controls, and again it would
seem prudent to restrict these to early age of onset in order to increase their sensitivity to
genetic as opposed to environmental causes..
6.4. Clinical relevance
We can now be more certain that when an individual in Australia is treated for BCC at an
early age, their close relatives are more likely to get all three types of skin cancer than
others in their community. This could have implications for general practitioners and
dermatologists who may be able to advise patients and their relatives of a need for
increased preventative measures and surveillance. Patients who have the phenotypic

174
features that are associated with an increased risk of BCC may also be identified by their
treating doctor: large degrees of freckling or solar lentigines on the arms could indicate
the need for a closer examination for early tumours, or reduce the threshold to investigate
or biopsy suspicious lesions in younger people.
6.5. Future research
The probability of familial aggregation of BCC and other skin cancers seen in this study
suggest that large-scale familial aggregation studies are needed on BCC affecting the
general population (outside of rare hereditary syndromes): to enable an understanding of
gene/environment interactions, and to allow genome-wide linkage studies to identify as-
yet unknown markers that may cosegregate with the disease. This could be followed by
segregation analysis and linkage studies which could lead to the development of complex
genetic models incorporating rare high-penetrance gene mutations, and common
medium- and low- penetrance genetic variants.
The design of future familial aggregation studies could mirror the current study with
larger numbers of probands with early-onset BCC and their first-degree relatives. Subject
questionnaires could include history of lifetime sun exposure linked to work history to
better quantify the amount of sun exposure in probands and their relatives. Skin
examinations for pigmentary and sun exposure characteristics could be repeated in a
similar manner to the current study. The MC1R gene would be the next priority when
screening genes likely to be responsible for any familial aggregation seen. As this is a
relatively small gene, screening could be done with direct sequencing rather than dHPLC
and sequencing. Eyebrow hairs could be plucked from subjects for examination of HPV
presence, subtyping, and correlation with BCC risk.
BCC is a very common human cancer that is likely to have complex interacting genetic
and environmental causes that are as-yet poorly understood. Further investigation into
these interactions are desperately needed to improve future monitoring, treatment and
prevention of this incredibly burdensome disease.
175
Chapter 7: Appendices
7.1. Appendix: Clinical Protocol for Questionnaire and Examination
Westmead Institute for Cancer Research
Westmead Hospital, Westmead NSW 2145 Australia Basal Cell Carcinoma Genetics Project Surname ___________________ Given Name ________________ Date of Birth ________________ Identification no ______________ Date of Examination ___________

176
Genotype/Phenotype studies in Non-melanoma skin cancer
Clinical Protocol
SECTION A
Demographic Data
i. Sex: M F ii. Age: ____ years Body Surface Area = 71.84 x (h) 0.725 x (w) 0.425
iii. Height: _______ cm (h)
iv. Weight: _______ kg (w) v. Skin Reflectance

177
L a b
Outer upper arm
Lateral wall axilla (inner upper arm)

178
SECTION B COLOURING, SKIN TYPE.
Please circle one answer for each question below.
1. Which colour best describes your natural hair colour at age 21?
Red (including Auburn) ............................................................................................ 1
Fair or Blonde (including White) ............................................................................. 2
Light or mouse brown ............................................................................................... 3
Grey .......................................................................................................................... 4
Dark brown ............................................................................................................... 5
Black ......................................................................................................................... 6
2. Which colour best describes the colour of your eyes?
Blue or Grey ............................................................................................................. 1
Green or Hazel .......................................................................................................... 2
Brown or Black ......................................................................................................... 3
3. Which colour type best describes your skin before tanning or on areas never exposed to the sun, such as the inside of your upper arm?
Very fair ...................................................................................................................... 1
Fair .............................................................................................................................. 2
Olive or Brown ........................................................................................................... 3
Asian ........................................................................................................................... 4
Black ........................................................................................................................... 5
Other (specify) ........................................................................................................... 6
Which statement best describes what would happen if your skin were exposed to bright sunlight for the first time in summer for one hour in the middle of the day without any protection?
Get a severe sunburn with blistering? ......................................................................... 1
Have a painful sunburn for a few days followed by peeling? .................................... 2
Get mildly burnt followed by some tanning? ............................................................. 3
Go brown without any sunburn?................................................................................. 4

179
Which of the following best describes what would happen to your skin if it were repeatedly exposed to bright sunlight in summer without any protection?
Go very brown and deeply tanned ............................................................................ 1
Get moderately tanned .............................................................................................. 2
Get mildly or occasionally tanned ............................................................................ 3
Get no suntan at all or only get freckled ................................................................... 4
In general, how does your skin react to the sun ?
Always burns, never tans 1
Usually burns, sometimes tans 2
Sometimes burns, usually tans 3
Never burns, always tans 4
Please look at the faces below. Each of the faces shows some degree of freckling, from none to many.
Which of these faces best describes how many freckles you would have had at the end of summer during childhood?
None ......................................................................................................................... 1
Very few ................................................................................................................... 2
Few ........................................................................................................................... 3
Some ......................................................................................................................... 4
Many ......................................................................................................................... 5
Very many ................................................................................................................ 6

180
Which one of these faces best describes how many freckles you would have at the end of
summer as an adult?
None ......................................................................................................................... 1
Very few ................................................................................................................... 2
Few ........................................................................................................................... 3
Some ......................................................................................................................... 4
Many ......................................................................................................................... 5
Very many ................................................................................................................ 6 Have you ever had dental surgery for a cyst (or cysts) in your upper or lower jaw?
Yes □ No □
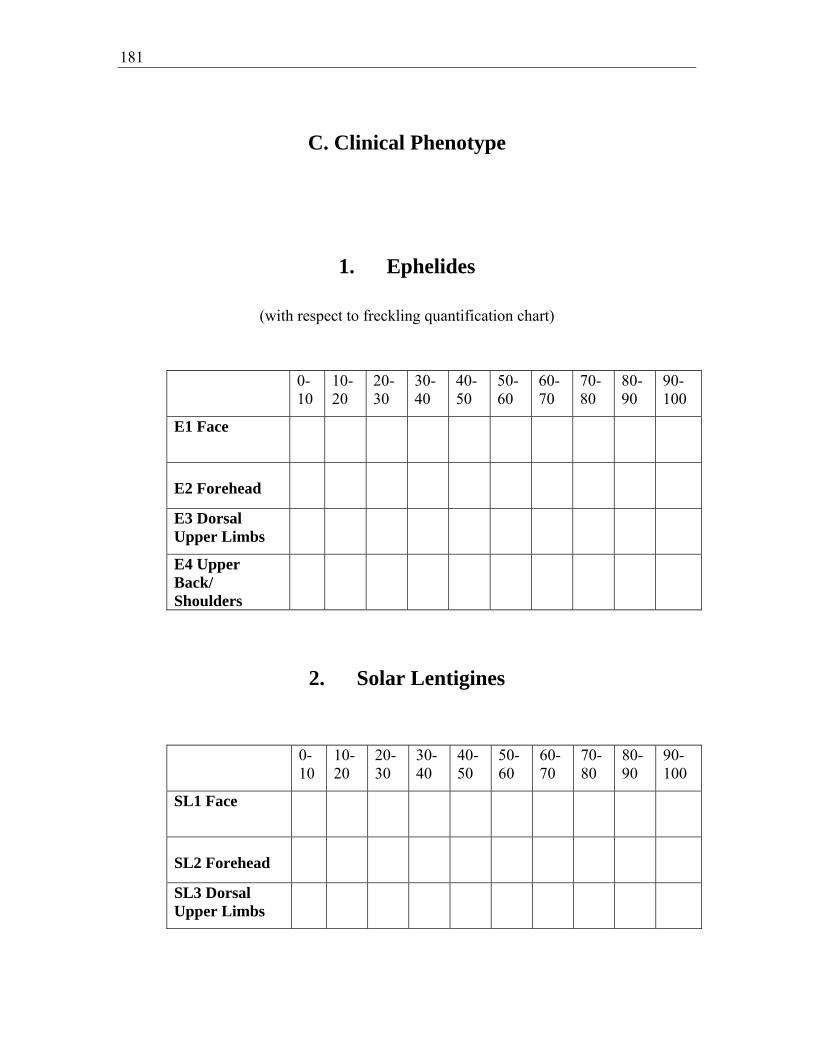
181
C. Clinical Phenotype
1. Ephelides
(with respect to freckling quantification chart)
0-
10 10-20
20-30
30-40
40-50
50-60
60-70
70-80
80-90
90-100
E1 Face
E2 Forehead E3 Dorsal Upper Limbs
E4 Upper Back/ Shoulders
2. Solar Lentigines
0-10
10-20
20-30
30-40
40-50
50-60
60-70
70-80
80-90
90-100
SL1 Face
SL2 Forehead SL3 Dorsal Upper Limbs

182
SL4 Upper Back/ Shoulders
3. Actinic Keratoses
Nil
Sparse (0-10)
Moderate (10-60)
Extensive/confluent >60
AK1 Head/Neck
AK2 Chest
AK3 Dorsum Arms
AK4 Dorsum Hands
4. Actinic Damage/ Elastosis
Absent
Mild
Severe
Present
AD1 Head, neck, Anterior Chest
AD2 Periorbital

183
AD3 Lips
AD4 Dorsa Forearms
AD5 Dorsa hands
P1 Pterygium
5. Seborrhoeic Keratoses
Nil
Sparse (0-10)
Moderate (10-60)
Confluent (>60)
SK1 Head & Neck
SK2 Upper Limbs
SK3 Chest
SK4 Abdomen
SK5 Back
SK6 Lower limbs
6. Skin Cancers

184
Body Site
Number
SCC
BCC
Melanoma

185
7. Palmar Pitting
Absent Equivocal Present
PP1 Palmar pitting
8. Hair Colour
Hair colour at 21 years use swatches provided
Red ………………………………………………………………..1 Blonde/fair ....................................................................................... 2 Brown …………………………………………………………….3 Black ……………………………………………………………....4
9. Notes

186
7.2. Appendix: Protocol for DNA extraction from whole blood
Take ~3-5 mL blood and add 5x the volume of QIAGEN Buffer EL. Vortex to mix. Place on ice for 15 min, vortexing after 10 min then again after a further 5 min. Centrifuge at 1400 rpm for 10 min at room temperature. Discard supernatant appropriately. Wash pellet with 2x the original volume of blood with Buffer EL and place on ice for 5 min. Centrifuge at 1400 rpm for 10 min at room temperature. Discard supernatant appropriately. Repeat step 4 and 5 if the samples have been frozen. Rinse pellet with Buffer EL to remove all remaining red blood cells, using a transfer pipette. Resuspend the pellet in 5 mL Enzyme solution (after aliquoting the desired amount under sterile conditions) and add 50 μL Proteinase K (150 U/mg). Incubate at 55°C for at least 3 h, or 37°C overnight. Transfer digest to a 15 mL Falcon tube and add 3.5 mL 3M NaCl (1.2M final concentration) and shake vigorously 15 times. Centrifuge at 2500 rpm for 15 min at room temperature. Inverting only once, remove supernatant to a second 15 mL tube and repeat centrifugation. Again, inverting only once, remove the supernatant to a new tube and precipitate the DNA with 2 volumes of absolute EtOH. If no precipitate is present, spin the sample in a high-speed centrifuge at ~10 000rpm (_g) for 10-15 min. Remove the supernatant and reconstitute in 1 mL 70% ethanol (EtOH). Continue from step 15. Spool the DNA from the EtOH using a 1 mL pipette tip and carefully transfer to an eppendorf tube containing 70% EtOH and mix. Briefly centrifuge the sample to pellet the DNA and remove the EtOH by inverting only once then remove the remaining EtOH carefully with a suction line. Briefly air dry and resuspend in 200-600 μL sterile T10E1 (for 2 x 10⁷ cells initial dilution should be ~300 μL) and place in a heating block at 50°C for 15 min to aid help dissolve the pellet. Leave at 4°C for at least one week to dissolve before quantitation and electrophoresis.
(Adapted from: kCkonFab; Agha-Hamilton C, Biospecimen Manager at the Westmead Millennium Institute, Sydney; Personal communication)

187
7.3. Appendix: Nucleotide sequences of PTCH exons
Nucleotide sequence of wild type PCR product of exons 2 to 4, and 5 to 23 of the PTCH gene. Forward and reverse primers are underlined. Exonic sequences are in capital letters, intronic sequences in small letters. The size of the amplicon is given between ( ). Sequence is from GenBank accession number U59464. Exon 2 PTCH (294 basepairs) actcctcccttctgcttcgtccccagGGGAAGGCTACTGGCCGGAAAGCGCCGCTGTGGCTGAGAGCGAAGTTTCAGAGACTCTTATTTAAACTGGGTTGTTACATTCAAAAAAACTGCGGCAAGTTCTTGGTTGTGGGCCTCCTCATATTTGGGGCCTTCGCGGTGGGATTAAAAGCAGCGAACCTCGAGACCAACGTGGAGGAGCTGTGGGTGGAAGgtaagagcgcccgccgcggcgcccgcgcccccggcccggtccctcctcgcggttgatagagatattcgccagcgc Exon 3 PTCH (313 basepairs) ctattgtgtatcctatggcaggtagtcagataacagataaaacatgagtttgcagtgattttgctattctaattaaacctgtacatatttgtcagTTGGAGGACGAGTAAGTCGTGAATTAAATTATACTCGCCAGAAGATTGGAGAAGAGGCTATGTTTAATCCTCAACTCATGATACAGACCCCTAAAGAAGAAGGTGCTAATGTCCTGACCACAGAAGCGCTCCTACAACACCTGGACTCGGCACTCCAGGCCAGCCGTGTCCATGTATACATGTACAACAGgtaaggcccgccgcgtccacctactaat Exon 5 PTCH (248 basepairs) gcaaaaatttctcaggaacaccccagtagtgtgccttaacctaacgcatggcctcttctttttaactttgacagATAATAGAATATCTTTACCCTTGTTTGATTATTACACCTTTGGACTGCTTCTGGGAAGGGGCGAAATTACAGTCTGGGACAGCATACCTCCTgtaagtgtgtgatcatgctttctgatgtctgtgacttctctaggactcagtgtttctaatgttgcttatcattgtttgttcc Exon 6 PTCH (335 basepairs) cctacaaggtggatgcagtgggcgcagccgtgttactttacgatgcgtttagaaggctcttttcatggtctcgtctcctaatttcttttgcagAGGTAAACCTCCTTTGCGGTGGACAAACTTCGACCCTTTGGAATTCCTGGAAGAGTTAAAGAAAATAAACTATCAAGTGGACAGCTGGGAGGAAATGCTGAATAAGGCTGAGGTTGGTCATGGTTACATGGACCGCCCCTGCCTCAATCCGGCCGATCCAGACTGCCCCGCCACAGCCCCCAACAAAAATTCAACCAAAgtgagtaccagcagtgagcgctctcagaagggtggagagcaaa Exon 7 PTCH (294 basepairs)
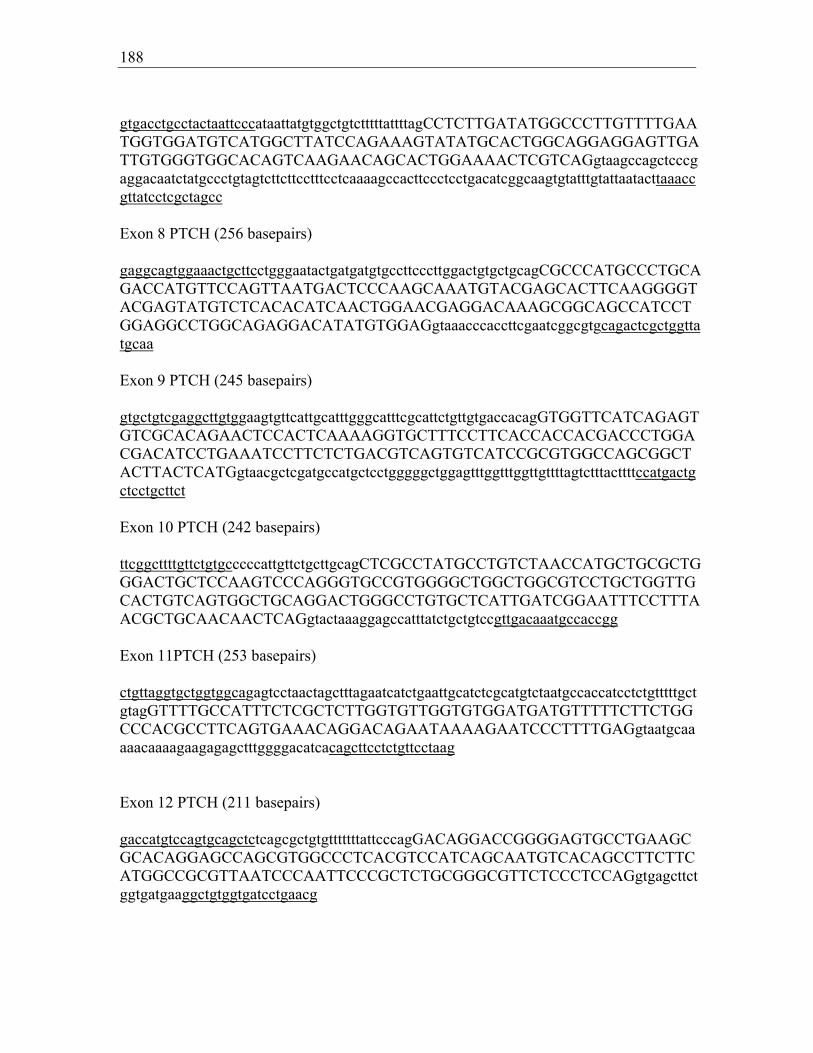
188
gtgacctgcctactaattcccataattatgtggctgtctttttattttagCCTCTTGATATGGCCCTTGTTTTGAATGGTGGATGTCATGGCTTATCCAGAAAGTATATGCACTGGCAGGAGGAGTTGATTGTGGGTGGCACAGTCAAGAACAGCACTGGAAAACTCGTCAGgtaagccagctcccgaggacaatctatgccctgtagtcttcttcctttcctcaaaagccacttccctcctgacatcggcaagtgtatttgtattaatacttaaaccgttatcctcgctagcc Exon 8 PTCH (256 basepairs) gaggcagtggaaactgcttcctgggaatactgatgatgtgccttcccttggactgtgctgcagCGCCCATGCCCTGCAGACCATGTTCCAGTTAATGACTCCCAAGCAAATGTACGAGCACTTCAAGGGGTACGAGTATGTCTCACACATCAACTGGAACGAGGACAAAGCGGCAGCCATCCTGGAGGCCTGGCAGAGGACATATGTGGAGgtaaacccaccttcgaatcggcgtgcagactcgctggttatgcaa Exon 9 PTCH (245 basepairs) gtgctgtcgaggcttgtggaagtgttcattgcatttgggcatttcgcattctgttgtgaccacagGTGGTTCATCAGAGTGTCGCACAGAACTCCACTCAAAAGGTGCTTTCCTTCACCACCACGACCCTGGACGACATCCTGAAATCCTTCTCTGACGTCAGTGTCATCCGCGTGGCCAGCGGCTACTTACTCATGgtaacgctcgatgccatgctcctgggggctggagtttggtttggttgttttagtctttacttttccatgactgctcctgcttct Exon 10 PTCH (242 basepairs) ttcggcttttgttctgtgcccccattgttctgcttgcagCTCGCCTATGCCTGTCTAACCATGCTGCGCTGGGACTGCTCCAAGTCCCAGGGTGCCGTGGGGCTGGCTGGCGTCCTGCTGGTTGCACTGTCAGTGGCTGCAGGACTGGGCCTGTGCTCATTGATCGGAATTTCCTTTAACGCTGCAACAACTCAGgtactaaaggagccatttatctgctgtccgttgacaaatgccaccgg Exon 11PTCH (253 basepairs) ctgttaggtgctggtggcagagtcctaactagctttagaatcatctgaattgcatctcgcatgtctaatgccaccatcctctgtttttgctgtagGTTTTGCCATTTCTCGCTCTTGGTGTTGGTGTGGATGATGTTTTTCTTCTGGCCCACGCCTTCAGTGAAACAGGACAGAATAAAAGAATCCCTTTTGAGgtaatgcaaaaacaaaagaagagagctttggggacatcacagcttcctctgttcctaag Exon 12 PTCH (211 basepairs) gaccatgtccagtgcagctctcagcgctgtgtttttttattcccagGACAGGACCGGGGAGTGCCTGAAGCGCACAGGAGCCAGCGTGGCCCTCACGTCCATCAGCAATGTCACAGCCTTCTTCATGGCCGCGTTAATCCCAATTCCCGCTCTGCGGGCGTTCTCCCTCCAGgtgagcttctggtgatgaaggctgtggtgatcctgaacg

189
Exon 13 PTCH (222 basepairs) agtcctctgattgggcggaggcatgttggtgacctctgaattttttttctgctcccagGCAGCGGTAGTAGTGGTGTTCAATTTTGCCATGGTTCTGCTCATTTTTCCTGCAATTCTCAGCATGGATTTATATCGACGCGAGGACAGGAGACTGGATATTTTCTGCTGTTTTACAAGgtacattttcagactgctgtggccttttgattgggtgcagaatgg Exon 14 PTCH (540 basepairs) aaaatggcagaatgaaagcaccatttccctgtttcagcataacattgcaacatgtttcccctcctttcagCCCCTGCGTCAGCAGAGTGATTCAGGTTGAACCTCAGGCCTACACCGACACACACGACAATACCCGCTACAGCCCCCCACCTCCCTACAGCAGCCACAGCTTTGCCCATGAAACGCAGATTACCATGCAGTCCACTGTCCAGCTCCGCACGGAGTACGACCCCCACACGCACGTGTACTACACCACCGCTGAGCCGCGCTCCGAGATCTCTGTGCAGCCCGTCACCGTGACACAGGACACCCTCAGCTGCCAGAGCCCAGAGAGCACCAGCTCCACAAGGGACCTGCTCTCCCAGTTCTCCGACTCCAGCCTCCACTGCCTCGAGCCCCCCTGTACGAAGTGGACACTCTCATCTTTTGCTGAGAAGCACTATGCTCCTTTCCTCTTGAAACCAAAAGCCAAGgtaatctgccacaacttaaggctcttcctgtcttcaaaaaaataacagaacctttggagttcatcag Exon 15 PTCH (425 basepairs) gacagcttctctttgtccaggaagagtcagtggtgctccctggggtctgaccttgtgcctcttctgttccagGTAGTGGTGATCTTCCTTTTTCTGGGCTTGCTGGGGGTCAGCCTTTATGGCACCACCCGAGTGAGAGACGGGCTGGACCTTACGGACATTGTACCTCGGGAAACCAGAGAATATGACTTTATTGCTGCACAATTCAAATACTTTTCTTTCTACAACATGTATATAGTCACCCAGAAAGCAGACTACCCGAATATCCAGCACTTACTTTACGACCTACACAGGAGTTTCAGTAACGTGAAGTATGTCATGTTGGAAGAAAACAAACAGCTTCCCAAAATGTGGCTGCACTACTTCAGAGACTGGCTTCAGGgtaagacggcgtgggaggctctcgtcctttcggtcttttgcgt Exon 16 PTCH (219 basepairs) agggtccttctggctgcgagttataatgtgttacaatcatttgccatttctagGACTTCAGGATGCATTTGACAGTGACTGGGAAACCGGGAAAATCATGCCAAACAATTACAAGAATGGATCAGACGATGGAGTCCTTGCCTACAAACTCCTGGTGCAAACCGGCAGCCGCGATAAGCCCATCGACATCAGCCAGgtactccagctgctgggcactga Exon 17 PTCH (268 basepairs) aaccccattctcaaaggcctctgttcttcccgtttttgtagTTGACTAAACAGCGTCTGGTGGATGCAGATGGCATCATTAATCCCAGCGCTTTCTACATCTACCTGACGGCTTGGGTCAGCAACGACCCCGTCGCGTATGCTGCCTCCCAGGCCAACATCCGGCCACACCGACCAG

190
AATGGGTCCACGACAAAGCCGACTACATGCCTGAAACAAGGCTGAGAAgtaagtagcgttttatcgggaggtctgggaacttacagaggtg Exon 18 PTCH (410 basepairs) aactgtgatgctcttctaccctgggctgctcctaacctgtgcccttctctgtccagTCCCGGCAGCAGAGCCCATCGAGTATGCCCAGTTCCCTTTCTACCTCAACGGCTTGCGGGACACCTCAGACTTTGTGGAGGCAATTGAAAAAGTAAGGACCATCTGCAGCAACTATACGAGCCTGGGGCTGTCCAGTTACCCCAACGGCTACCCCTTCCTCTTCTGGGAGCAGTACATCGGCCTCCGCCACTGGCTGCTGCTGTTCATCAGCGTGGTGTTGGCCTGCACATTCCTCGTGTGCGCTGTCTTCCTTCTGAACCCCTGGACGGCCGGGATCATTgtgagtgtattataaggggctttgtggaagtcaaattcctttcagcatagctctttctgcagccgggaagttt Exon 19 PTCH (305 basepairs) tttgatctgaaccgaggacaccttagccctctggcgacctcccttgtgggcagccccagagggtgacctgcccgcccactgaccactgtgtgccctgctccagGTGATGGTCCTGGCGCTGATGACGGTCGAGCTGGCATAGGAGTGGAGTTCACCGTTCACGTTGCTTTGTTCGGCATGATGGGCCTCATCGGAATCAAGCTCAGTGCCGTGCCCGTGGTCATCCTGATCGCTTCTGTTGgtatgggagacatttgaagcaaaaactttgtgaaaaaacaacccatttcctctggctctgtttg Exon 20 PTCH (214 basepairs) catttaggacagagctgagcatttaccaggtgaagtccagcaacctgatcttgtgaacatcctcattgcacagGCCTTTCTGACGGCCATCGGCGACAAGACCGCAGGGCTGTGCTTGCCCTGGAGCACATGTTTGCACCCGTCCTGGATGGCGCCGTGTCCACTCTGCTGGGAGTGCTGATGCTGGCGGGATCTGAGTTCGACTTCATTGTCAGGTAAGCAGGCGTGTGCAAGGAGACATGTTTTAGAAATCATTGTGATTGGGCC Exon 21 PTCH (187 basepairs) tgttcccgtttcctcttgatctcccagGTATTTCTTTGCTGTGCTGGCGATCCTCACCATCCTCGGCGTTCTCAATGGGCTGGTTTTGCTTCCCGTGCTTTTGTCTTTCTTTGGACCATACCTGAGgtcagtagtgacacggggatgtcccacgtgtaggccggctgaatgctgtgtttcctgtgc Exon 22 PTCH ( 371 basepairs) agtgtggccagcaggtaaatggacaagaacacttttaacatggaatccccttaaatagGTGTCTCCAGCCAACGGCTTGAACCGCCTGCCCACACCCTCCCCTGAGCCACCCCCCAGCGTGGTCCGCTTCGCCATGCCGCCCGGCCACACGCACAGCGGGTCTGATTCCTCCGACTCGGAGTATAGTTCCCAGACGACAGTGTCAGGCCTCAGCGAGGAGCTTCGGCACTACGAGGCCCAGCAGGCGCGGGAGGCCCTGCCCACCAAGTGATCGTGGAAGCCACAGAAAACCCCGTCTTCGCCCACTCCACTgtaagtgactctgcagaaccagggggaggggtcttcccaccgtggtagtgggcctggag

191
Exon 23a PTCH (331 basepairs) aaacccaaggagggaagtgtgggagctgcggggaccatgcccagcctgggataccacccttctaacccaccctcaccctctgcagGTGGTCCATCCCGAATCCAGGCATCACCCACCCTCGAACCCGAGACAGCAGCCCCACCTGGACTCAGGGTCCCTGCCTCCCGGACGGCAAGGCCAGCAGCCCCGCAGGGACCCCCCCAGAGAAGGCTTGTGGCCACCCCTCTACAGACCGCGCAGAGACGCTTTTGAAATTTCTACTGAAGGGCATTCTGGCCCTAGCAATAGGGCCCGCTGGGGCCCTCGCGGGGCCCGTTCTCACAACCCTCGG Exon 23b PTCH (406 basepairs) GCATTCTGGCCCTAGCAATAGGGCCCGCTGGGGCCCTCGCGGGGCCCGTTCTCACAACCCTCGGAACCCAACGTCCACTGCCATGGGCAGCTCCGTGCCCGGCTACTGCCAGCCCATCACCACTGTGACGGCTTCTGCCTCCGTGACTGTCGCCGTGCACCCGCCGCCTGTCCCTGGGCCTGGGCGGAACCCCCGAGGGGGACTCTGCCCAGGCTACCCTGAGACTGACCACGGCCTGTTTGAGGACCCCCACGTGCCTTTCCACGTCCGGTGTGAGAGGAGGGATTCGAAGGTGGAAGTCATTGAGCTGCAGGACGTGGAATGCGAGGAGAGGCCCCGGGGAAGCAGCTCCAACTGAGgtgagtgccactgacaagggcagcaagggacctagagccaggcaaaga

192
7.4. Appendix: DHPLC melting profiles
0
50
100
0 50 100 150 200 250 300
B ase P osition
59.9 ºC
62.5 ºC
Predicted dHPLC melting profile for PTCH exon 2, wild type
0
50
100
0 50 100 150 200 250 300 350
B ase P osition
56.5 ºC
58 ºC
Predicted dHPLC melting profile for PTCH exon 3, wild type
0
50
100
0 50 100 150 200 250
Bas e Pos ition
57 ºC
Predicted dHPLC melting profile for PTCH exon 5, wild type

193
0
50
100
0 50 100 150 200 250 300 350
Bas e Pos ition
59.2 ºC
Predicted dHPLC melting profile for PTCH exon 6, wild type
0
50
100
0 50 100 150 200 250 300
Bas e Pos ition
57 ºC
Predicted dHPLC melting profile for PTCH exon 7, wild type
0
50
100
0 50 100 150 200 250 300
B ase P osition
61.8 ºC
Predicted dHPLC melting profile for PTCH exon 8, wild type
0
50
100
0 50 100 150 200 250 300
Bas e Pos ition
60.8 ºC
Predicted dHPLC melting profile for PTCH exon 9, wild type

194
0
50
100
0 50 100 150 200 250
Bas e Pos ition
60.2 ºC
Predicted dHPLC melting profile for PTCH exon 10, wild type
0
50
100
0 50 100 150 200 250 300
Bas e Pos ition
58.3 ºC
Predicted dHPLC melting profile for PTCH exon 11, wild type
0
50
100
0 50 100 150 200 250
Bas e Pos ition
62.6 ºC
Predicted dHPLC melting profile for PTCH exon 12, wild type

195
0
50
100
0 50 100 150 200 250
Bas e Pos ition
59.2 ºC
Predicted dHPLC melting profile for PTCH exon 13, wild type
0
50
100
0 100 200 300 400 500 600
B ase P osition
61.5 ºC
63.8 ºC
Predicted dHPLC melting profile for PTCH exon 14, wild type
0
50
100
0 50 100 150 200 250 300 350 400 450
B ase P osition
58 ºC
60.5 ºC
Predicted dHPLC melting curve for PTCH exon 15, wild type
0
50
100
0 50 100 150 200 250
Bas e Pos ition
59.3 ºC

196
Predicted dHPLC melting curve for PTCH exon 16, wild type
0
50
100
0 50 100 150 200 250 300
B ase P osition
59.8 ºC
64.5 ºC
Predicted dHPLC melting curve for PTCH exon 17, wild type
0
50
100
0 50 100 150 200 250 300 350 400 450
B ase P osition
61.2 ºC
62.8 ºC
Predicted dHPLC melting curve for PTCH exon 18, wild type
0
50
100
0 50 100 150 200 250 300
Bas e Pos ition
61.3 ºC
Predicted dHPLC melting curve for PTCH exon 20, wild type

197
0
50
100
0 20 40 60 80 100 120 140 160 180 200
Bas e Pos ition
61.7 ºC
Predicted dHPLC melting curve for PTCH exon 21, wild type
0
50
100
0 50 100 150 200 250 300 350 400
Bas e Pos ition
62.8 ºC
Predicted dHPLC melting curve for PTCH exon 22, wild type
0
50
100
0 50 100 150 200 250 300 350 400 450
Bas e Pos ition
63.1 ºC
Predicted dHPLC melting curve for PTCH exon 23, wild type

198
0
50
100
0 50 100 150 200 250
Bas e Pos ition
63.9 ºC
Predicted dHPLC melting profile for PTCH exon 23a, wild type

199
7.5. Appendix: Protocol for PCR-product purification
Using QIAquick PCR Purification Kit and a conventional tabletop microcentrifuge, at 13,000 rounds per minute: Suck up the total volume of PCR product using a pipette. Add 5 volumes of Buffer PB to 1 volume of PCR sample and mix. Place a QIAquick spin column in a provided 2 ml collection tube. To bind DNA, apply the sample to the QIAquick column and centrifuge for 30-60 sec. Discard the flow-through. Place the QIAquick column back into the same tube. To wash, add 0.75 ml Buffer PE (with added ethanol) to the QIAquick column and centrifuge for 30-60 sec. Discard flow-through and place the QIAquick column back in the same tube. Centrifuge the column for an additional 1 min at maximum speed. Place QIAquick column in a clean 1.5 ml microcentrifuge tube. To elute DNA from the column, add 50 µl elution buffer (EB) (10 mM Tris-CL, pH 8.5) or H2O to the center of the QIAquick membrane and centrifuge the column for 1 min. Alternatively, for increased DNA concentration, add 30 µl elution buffer to the center of the QIAquick membrane, let the column stand for 1 min, and then centrifuge. The average eluate volume is 48 µl from 50 µl elution buffer volume, and 28 µl from 30 µl elution buffer. Store DNA at -20ºC until use, as DNA may degrade otherwise.
(Adapted from: Qiagen. QIAquick Spin Handbook. USA: Instructions manual; 07/2002. p11-8)

200
7.6. Appendix: subjects excluded from analysis
Table 7.1. Subjects excluded from analysis of comparison with population prevalence (due to death or age>70 years) ID Family ID Cancers 9129 29125 - 8838 28762 Colorectal 8827 28763 MM 8930 28767 Renal Cell 9331 28775 - 9332 28775 SCC 9411 28779 Ovarian 9115 28797 Colorectal, SCC, BCC 8892 28816 Renal Cell 8823 28818 Breast 8824 28818 - 8859 28857 Laryngeal SCC 9042 29022 BCC 9128 29125 SCC 9169 29168 Colorectal 9170 29168 Squamous Cell Lung 9430 29240 Malignant fibrous
histiocytoma (sarcoma) 9289 29275 Breast 8817 28762 Prostate 8801 28763 SCC 8811 29764 - 8765 28764 - 8867 28776 - 8929 28767 - 8796 28770 BCC, SCC, MM 8793 28771 - 8792 28771 SCC 8985 28773 BCC 8986 28773 - 9066 28794 - 9067 28794 - 9116 28797 - 9303 28800 - 9304 28800 BCC, SCC 8891 28816 BCC, SCC 8829 28825 SCC, MM 8830 28825 Colorectal, BCC

201
9041 29022 BCC 9096 29094 SCC 9127 29125 - 9429 29240 - 9455 29445 BCC 9456 29445 BCC, SCC 9447 29446 - 9448 29446 SCC 9461 29459 SCC 9530 29527 - Note: all deceased parents except two had a cancer diagnosis (likely to be bias of inclusion in study of people with family history of cancer?)

202
7.7. Appendix: Pedigrees for all families with cancer affected first degree relatives
25
67
38m
29125
37m
9127 9128 16/2/1932 11/6/1928
SCC 7/11/1995
9126 9129 9125 9130 19/3/1956 BCC 5/2/1994
SCC24/8/1999
6/8/1957 12/8/1961 BCC 1/2/2000
3/8/1964 BCC 2/12/1989
43
28770
69
39m
8795 8796
8770 8807
29/6/1933 BCC
11/03/2003
23/4/1963
77m
2/4/1922 BCC 8/9/1992
SCC 19/11/1997 MM 7/7/2000 Laryngeal SCC 22/09/1999
880622/9/1944
70m
75m 78
33
28846
56
26m
8847 8848
8846 8849
28/12/1944 BCC
1/5/2001
11/2/1974 BCC 17/2/2000
30/12/1976
10/12/1943 BCC 27/11/1999
55m

203
65
34m
8919 8920 1/10/1939 22/2/1937
BCC 9/9/1999 SCC 14/8/2002
8761 8922 14/10/1960 BCC 15/6/1995
19/6/1963
62
55
28755
39m
8758 8760 9/8/1942 21/9/1939
SCC 20/4/1995
8755 9008 30/1/1960 BCC 30/4/2000
9/11/1970
9007
11/6/1968 BCC 29/10/1999
31m
43
8827 8801
8814 8802 8803 8763 8870 9001
17/12/1936 MM 1/2/1979
21/3/1958 7/5/1960 BCC
25/2/2004 SCC
12/2/2002
6/3/1963 BCC
1/3/2000
25/2/1967
11/3/1977
42 71
17/2/1932 SCC 24/7/2003
41 36
28763
28761
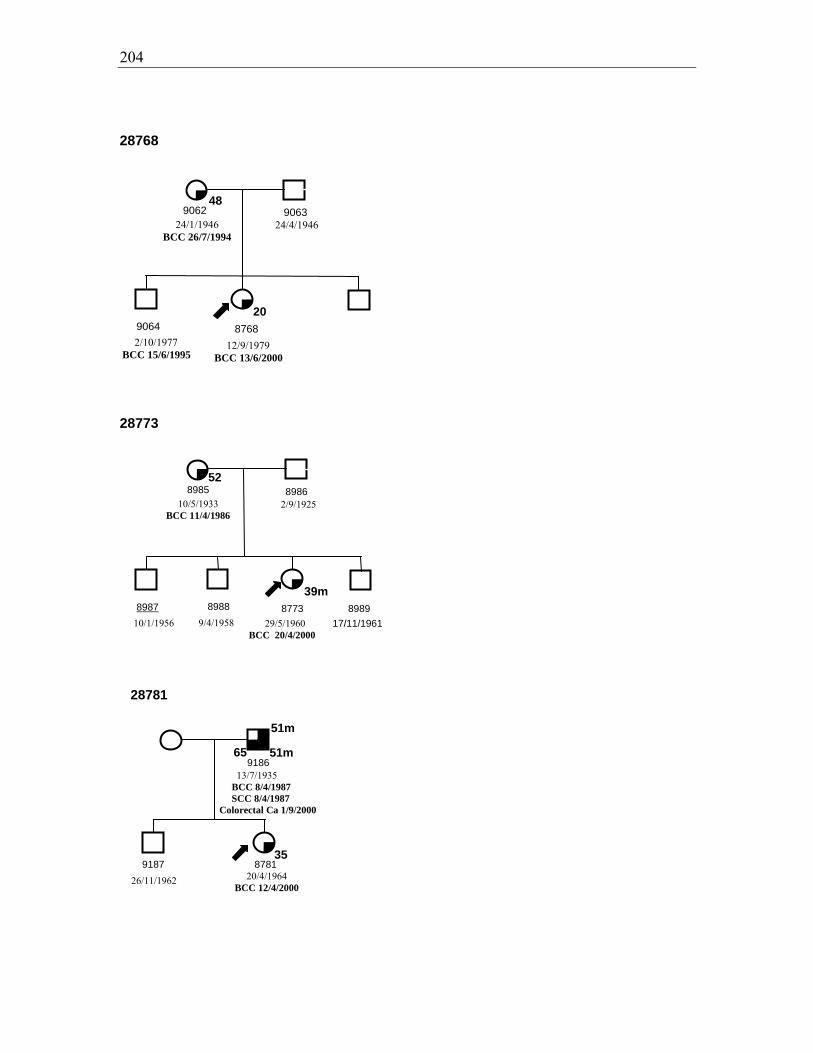
204
48
28768
20
9062 9063 24/1/1946
BCC 26/7/1994 24/4/1946
9064 2/10/1977 BCC 15/6/1995
8768 12/9/1979 BCC 13/6/2000
52
39m
28773
8985 8986 10/5/1933
BCC 11/4/1986 2/9/1925
8987 8988 8773 8989 10/1/1956 9/4/1958 29/5/1960
BCC 20/4/2000
17/11/1961
28781
35
9186
9187 8781 26/11/1962 20/4/1964
BCC 12/4/2000
13/7/1935 BCC 8/4/1987 SCC 8/4/1987
Colorectal Ca 1/9/2000
51m
51m
65

205
42
28797
53m
35m
9115 9116
9118 9119 9120 9122 9123 8797
26/6/1926 BCC 11/12/1979 SCC 11/12/1979 Colorectal Ca 1/10/1991
11/10/1927
3/7/1953 29/5/1956 17/12/1957 5/5/1959 SCC
9/4/2002
11/8/1964BCC
5/4/2000
9117
10/11/1950 4/1/1948
53m
65
69m9303 9304
9306 9307 8800 9309 9310 9311
26/10/1933 10/12/1927 BCC 28/5/1997SCC 28/8/1998
2/10/1959 BCC
29/9/2003
1/8/1961 BCC
10/4/2000
23/9/1965 14/9/1969 22/11/1973 BCC
16/8/2000
9305
11/3/1958 2/8/1956
930843 38m 26
15/2/1963
70
28800
58
28815
19
8903 8904 17/3/1945
BCC 26/6/2003 28/9/1946
8905 8906 4/8/1977 17/1/1979
8815
27/8/1980 BCC 29/5/2000
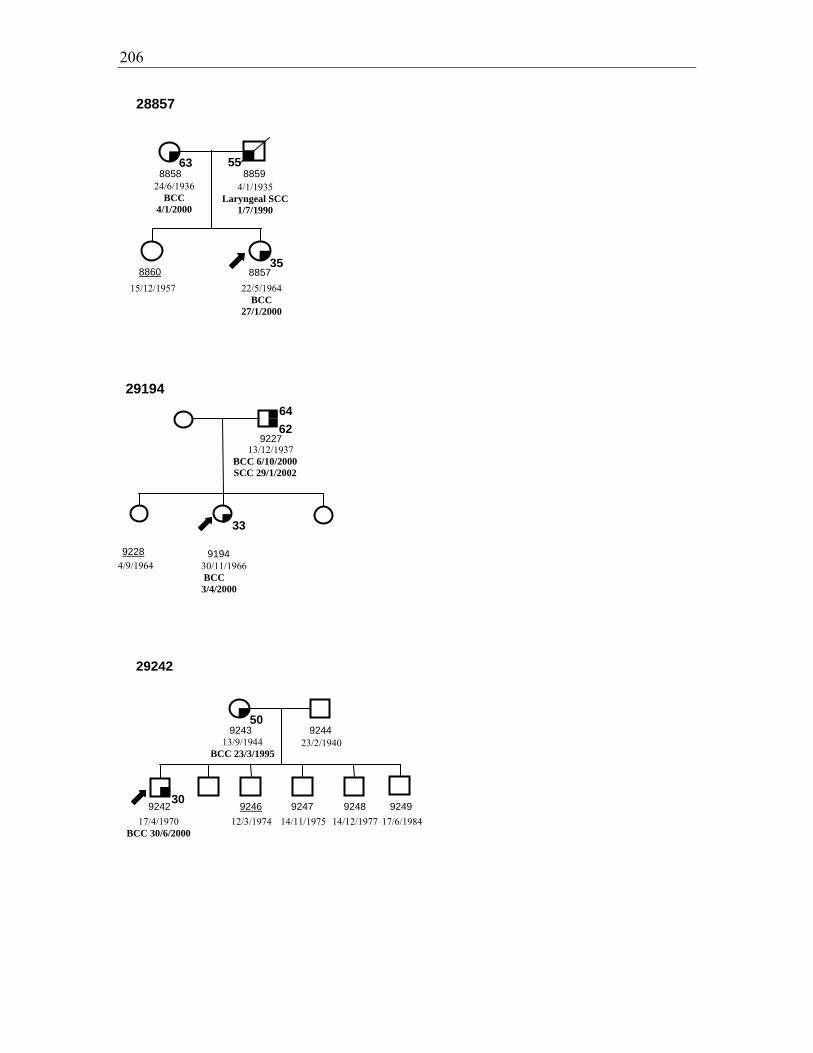
206
28857
63
35
8858 8859
8857 8860
24/6/1936 BCC
4/1/2000
15/12/1957 22/5/1964 BCC
27/1/2000
4/1/1935 Laryngeal SCC
1/7/1990
55
62
29194
33
9227 13/12/1937
BCC 6/10/2000 SCC 29/1/2002
9228
9194
30/11/1966 BCC 3/4/2000
64
29242
9243 9244
9242 9246 9247 9248 9249
13/9/1944 BCC 23/3/1995
17/4/1970 BCC 30/6/2000
12/3/1974 14/11/1975 14/12/1977 17/6/1984
50
23/2/1940
30
4/9/1964
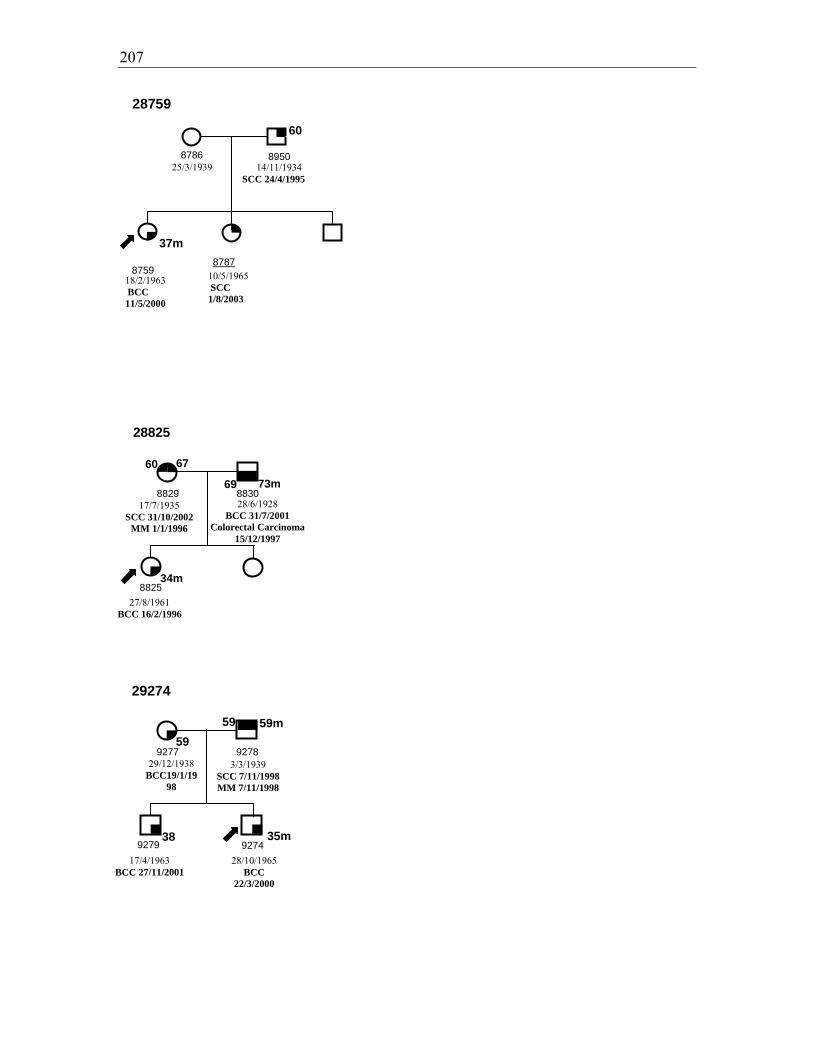
207
28759
37m
8786 8950 25/3/1939 14/11/1934
SCC 24/4/1995
8787
10/5/1965 SCC 1/8/2003
8759
18/2/1963 BCC 11/5/2000
60
28825
67
34m
8829 8830
8825
17/7/1935 SCC 31/10/2002
MM 1/1/1996
28/6/1928 BCC 31/7/2001
Colorectal Carcinoma 15/12/1997
73m
60
69
29274
59
35m
9277 9278
9274 9279
29/12/1938 BCC19/1/19
98
28/10/1965 BCC
22/3/2000
3/3/1939 SCC 7/11/1998 MM 7/11/1998
59
38
59m
27/8/1961 BCC 16/2/1996
17/4/1963 BCC 27/11/2001

208
60
30
29275
9289 9290 16/10/1929
Breast Cancer 1/5/1990
19/9/1928
9291 9292 927518/12/1957
BCC 28/5/2003
9/1/1970
BCC 16/3/2000
45m 45m
65m
29445
51
9455 9456 15/11/1929
BCC 13/5/1998 23/5/1923
BCC 6/11/1998 SCC 27/6/2001
9457 9445 21/8/1950 BCC 18/10/2001 MM 24/3/2004
25/8/1961 BCC 25/1/2000SCC 31/5/2000
75m
38m
38m
68m
53
9458
8/5/1953 BCC 17/12/2003
11/11/1954 BCC 20/4/2000

209
29491
52
31
9492
9494 9495
27/11/1946 BCC
15/12/1998
25/1/1967 BCC
23/6/1997
16/3/1971 9491
29/12/1968 BCC
23/3/2000
30
71
28771
8793 8792 6/7/1926 10/12/1924
SCC 6/3/1996
8965 8771 23/3/1953 15/1/1963
BCC 13/1/2000
36 8966
21/6/1954
44m 37
28818
8824 8823
8819 8820 8821 8818 8822
26/3/1963 BCC 3/12/2000
19/4/1959 20/10/1960 7/8/1964
11/7/1926 18/12/1920
30/7/1957 BCC 16/6/2000

210
7.8. Appendix: Raw data
Raw, semi-quantitative data collected on each variable is displayed below as referred to
in the text.
Table 7.2 Self reported hair colour crosstabulation: by questionnaire and hair swatch selection Hair colour by swatch Red Fair/Blonde Brown Total Hair colour by questionnaire
Red 6 0 0 6 Fair/Blonde 1 16 0 17 Light or mouse brown
5 20 8 33
Dark Brown 1 3 27 31 Black 0 0 1 1
Total 13 39 36 88
Table 7.3 Single exposure to the sun (“sun sensitivity”) raw data Self-reported category
n (%)
Severe sunburn/blistering
9 (10.2)
Painful sunburn/peeling
53 (60.2)
Mild sunburn/tanning 23 (26.1) No sunburn/tanning 3 (3.4%) Total 88 (100)
Table 7.4 Repeated exposure to the sun (“ability to tan”) raw data Self-reported category
n (%)
Very brown/deeply tanned
6 (6.8)
Moderately tanned 34 (38.6)
Mildly/occasionally tanned
32 (36.4)
No tan/only freckled
16 (18.2)
Total 88 (100)

211
Table 7.5 General reaction to the sun (“phototype”) raw data Self-reported category
n (%)
Always burns, never tans
8 (9.1)
Usually burns, sometimes tans
46 (52.3)
Sometimes burns, usually tans
34 (38.6)
Total 88 (100)
Table 7.6 Actinic Keratoses (AK’s) raw data Number lesions Head/Neck
n (%) Chest n (%)
Dorsum Arms n (%)
Dorsum Hands n (%)
Nil 59 (67) 84 (95.5) 70 (79.5) 73 (83) Sparse (0-10) 27 (30.7) 3 (3.4) 16 (18.2) 13 (14.8) Moderate (10- 60) 2 (2.3) 1 (1.1) 2 (2.3) 2 (2.3)
Total 88 88 88 88
Table 7.7. Solar elastosis raw data Actinic Damage/Elastosis Score
Head/Neck/ Anterior Chest n (%)
Periorbital n (%)
Lips n (%)
Dorsa Forearms n (%)
Dorsa Hands n (%)
Absent - - - - - Mild - moderate 6 (6.9) 6 (6.9) 18 (20.7) 17 (19.5) 15 (17.2)
Severe 81 (93.1) 81 (93.1) 69 (79.3) 70 (80.5) 72 (82.8) Total 87 (100) 87 (100) 87 (100) 87 (100) 87 (100)

212
Table 7.8 Solar lentigines raw data Solar lentigines semi-quantitative score
Face n (%)
Forehead n (%)
Dorsal Upper Limbs n (%)
Upper back/shoulders n (%)
0-10 10 (11.4) 16 (18.2) 5 (5.7) - 10-20 19 (21.6) 31 (35.2) 5 (5.7) 3 (3.4) 20-30 14 (15.9) 9 (10.2) 9 (10.2) 4 (4.5) 30-40 17 (19.3) 10 (11.4) 11 (12.5) 5 (5.7) 40-50 14 (15.9) 10 (11.4) 16 (18.2) 8 (9.1) 50-60 6 (6.8) 7 (8.0) 11 (12.5) 5 (5.7) 60-70 7 (8.0) 3 (3.4) 12 (13.6) 18 (20.5) 70-80 - 1 (1.1) 9 (10.2) 14 (15.9) 80-90 1 (1.1) 1 (1.1) 9 (10.2) 22 (25.0) 90-100 - - 1 (1.1) 9 (10.2) Total 88 (100) 88 (100) 88 (100) 88 (100)
Table 7.9 Freckling raw data Self-reported childhood freckling
Proband n (%)
Sibling n (%)
Total n (%)
None 4 (12.1) 4 (7.3) 8 (9.1) Very Few 13 (39.4) 18 (32.7) 31 (35.2) Few 8 (24.2) 10 (18.2) 18 (20.5) Some 2 (6.1) 13 (23.6) 15 (17.0) Many 6 (18.2) 10 (18.2) 16 (18.2) Total 33 (100.0) 55 (100.0) 88 (100.0) Self-reported adult freckling
Proband n (%)
Sibling n (%)
Total n (%)
None 7 (21.2) 8 (14.5) 15 (17.0) Very Few 15 (45.5) 28 (50.9) 43 (48.9) Few 6 18.2) 7 (12.7) 13 (14.8) Some 3 (9.1) 8 (14.5) 11 (12.5) Many 2 (6.1) 4 (7.3) 6 (6.8) Total 33 (100.0) 55 (100.0) 88 (100.0) Freckling semi-quantitative score
Face n (%)
Forehead n (%)
Dorsal Upper Limbs n (%)
Upper back/shoulders n (%)
0-10 9 (10.2) 8 (9.1) - - 10-20 17 (19.3) 16 (18.2) 1 (1.1) 3 (3.4) 20-30 11 (12.5) 15 (17.0) 2 (2.3) 1 (1.1) 30-40 11 (12.5) 12 (13.6) 3 (3.4) 2 (2.3) 40-50 12 (13.6) 10 (11.4) 7 (8.0) 6 (6.8) 50-60 15 (17.0) 12 (13.6) 6 (6.8) 7 (8.0) 60-70 5 (5.7) 5 (5.7) 15 (17.0) 17 (19.3) 70-80 5 (5.7) 4 (4.5) 14 (15.9) 19 (21.6) 80-90 3 (3.4) 6 (6.8) 37 (42.0) 24 (27.3) 90-100 - - 3 (3.4) 9 (10.2) Total 88 (100) 88 (100) 88 (100) 88 (100)

213
Table 7.10 Seborrhoeic keratoses raw data Seborrhoeic Keratoses semi-quantitative score
Head/Neck n (%)
Upper Limbs n (%)
Chest n (%)
Abdomen n (%)
Back n (%)
Lower Limbs n (%)
Nil 73 (83.0) 59 (67.0) 66 (75.0) 63 (71.6) 54 (61.4) 58 (65.9) Sparse (0 – 10) 15 (17.0) 28 (31.8) 22 (25.0) 22 (25.0) 32 (36.4) 28 (31.8)
Moderate (10 – 60) - 1 (1.1) - 3 (3.4) 2 (2.3) 2 (2.3) Confluent - - - - - -
Total 88 (100.0) 88 (100.0) 88 (100.0) 88 (100.0) 88 (100.0) 88 (100.0)
Table 7.11 Month of examination crosstabulation (all subjects) Month No. siblings examined No. probands
examined Total
January 4 6 10 February 4 4 8 March 3 6 9 April 2 4 6 May 6 12 18 June 2 4 6 July 2 7 9 August 6 4 10 September 2 2 4 October - - - November - - - December 2 6 8 Total 33 55 88
Table 7.12 Season of examination of case-control pairs Examination season proband Total Summer Autumn Winter Spring Examination season sibling
Summer 6 2 1 0 9 Autumn 2 8 1 0 11 Winter 5 1 4 0 10 Spring 0 1 0 1 2
Total 13 12 6 1 32 Note: number of pairs examined in different seasons compared by taking number pairs below and above the diagonal (where season matched) and comparing these two numbers (4 above, 9 below) by McNemar Test.

214
Table 7.13 Comparison of Minolta Spectrophotometer and BYK Gardner spectrophotometer L*a*b* readings on three subjects Subject Minolta CM-508d BYK Gardner CGSS n=10 Mean SD Mean SD A L* 60.099 1.284 60.931 0.263 a* 10.473 0.718 11.026 0.297 b* 18.719 0.96 19.43 0.158 B L* 61.192 0.205 62.516 0.261 a* 9.451 0.087 9.123 0.093 b* 15.966 0.241 16.105 0.357 C L* 62.504 0.211 64.354 0.26 a* 9.408 0.45 8.834 0.349 b* 15.102 0.263 15.659 0.148

215
7.9. Elution profiles PTCH exons without variants (exons 3, 7, 9, 20, 13, 16, 17, 18,
20, 21, 22, 23b)
w ild type exon 3PTCH exon 3 w ild type at 56.5º
Time (Minutes)109876543210
Abso
rban
ce (m
V)
20181614121086420
w ild type exon 7PTCH exon 7 w ild type at 57.0º
Time (Minutes)109876543210
Abso
rban
ce (m
V)
20181614121086420
w ild type exon 9PTCH exon 9 w ild type at 60.8º
Time (Minutes)109876543210
Abso
rban
ce (m
V)
12
10
8
6
4
2
0
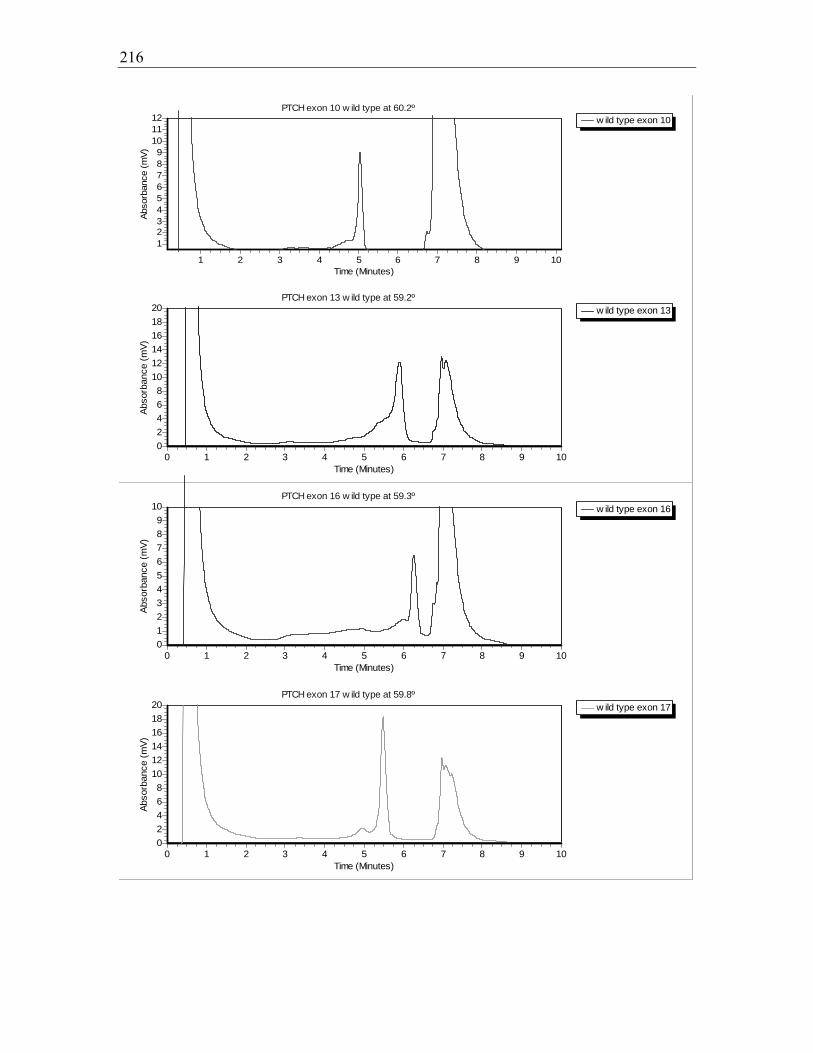
216
w ild type exon 10PTCH exon 10 w ild type at 60.2º
Time (Minutes)10987654321
Abso
rban
ce (m
V)
121110987654321
w ild type exon 13PTCH exon 13 w ild type at 59.2º
Time (Minutes)109876543210
Abso
rban
ce (m
V)
20181614121086420
w ild type exon 16PTCH exon 16 w ild type at 59.3º
Time (Minutes)109876543210
Abso
rban
ce (m
V)
109876543210
w ild type exon 17PTCH exon 17 w ild type at 59.8º
Time (Minutes)109876543210
Abso
rban
ce (m
V)
20181614121086420
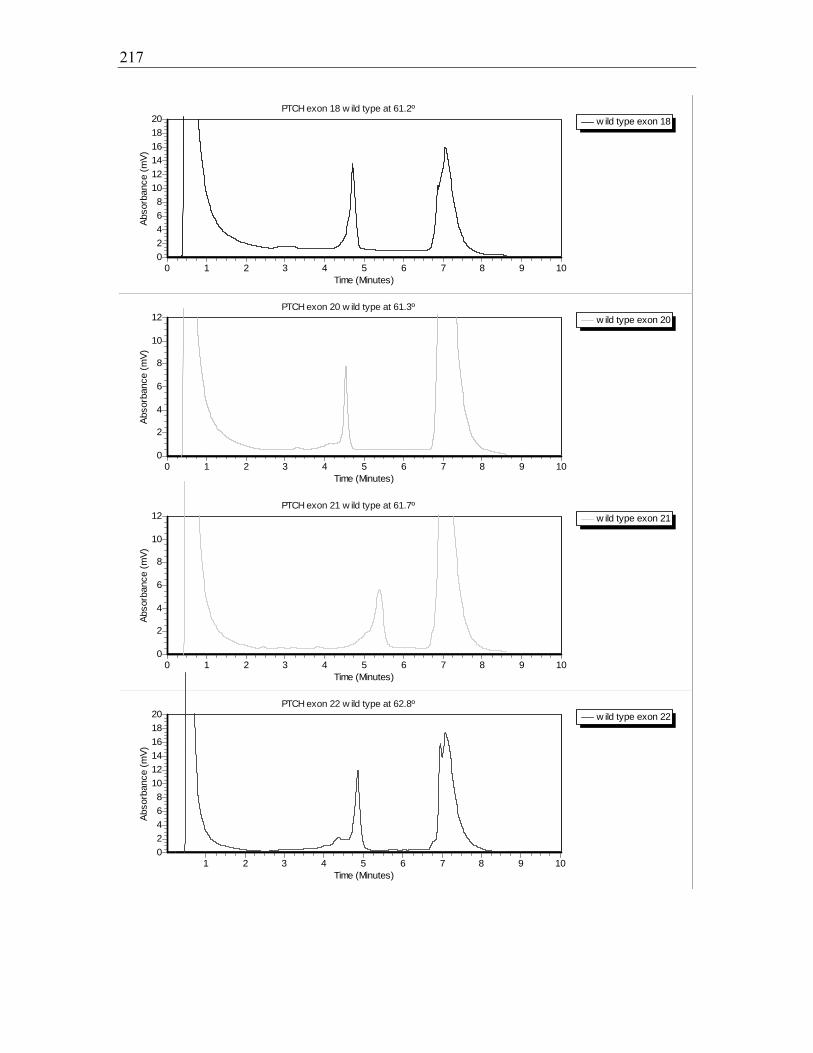
217
w ild type exon 18PTCH exon 18 w ild type at 61.2º
Time (Minutes)109876543210
Abso
rban
ce (m
V)
20181614121086420
w ild type exon 20PTCH exon 20 w ild type at 61.3º
Time (Minutes)109876543210
Abso
rban
ce (m
V)
12
10
8
6
4
2
0
w ild type exon 21PTCH exon 21 w ild type at 61.7º
Time (Minutes)109876543210
Abso
rban
ce (m
V)
12
10
8
6
4
2
0
w ild type exon 22PTCH exon 22 w ild type at 62.8º
Time (Minutes)10987654321
Abso
rban
ce (m
V)
20181614121086420
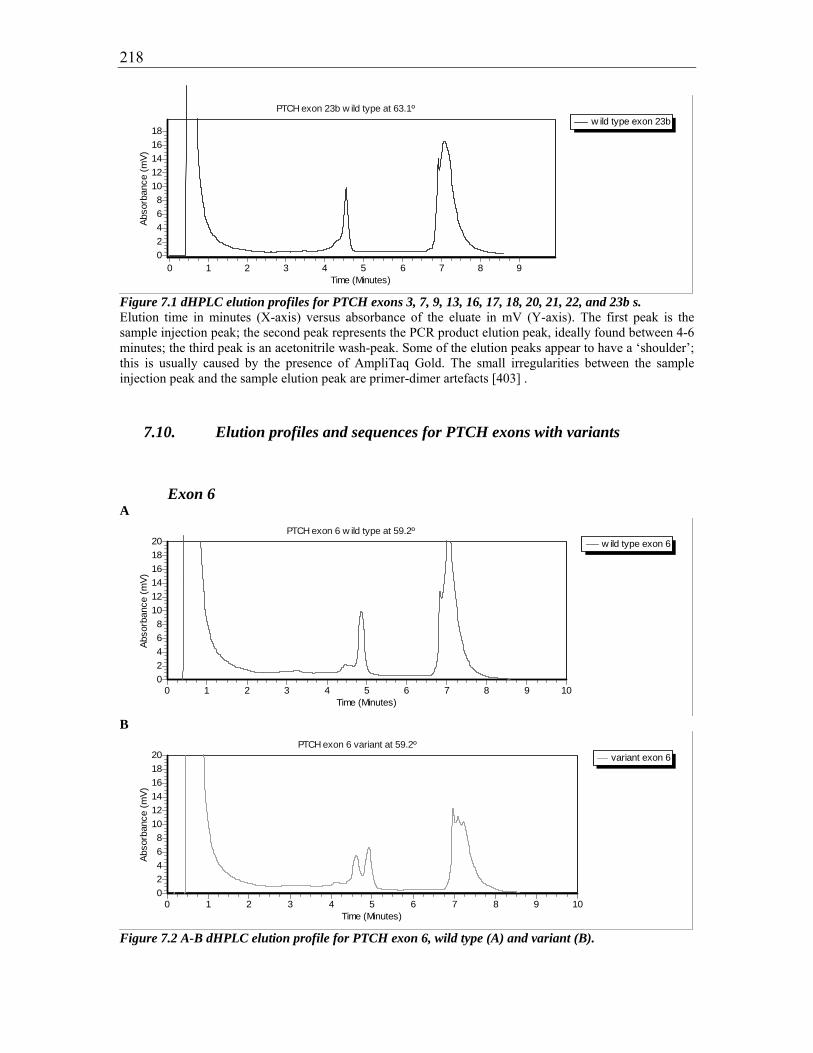
218
w ild type exon 23bPTCH exon 23b w ild type at 63.1º
Time (Minutes)9876543210
Abso
rban
ce (m
V)181614121086420
Figure 7.1 dHPLC elution profiles for PTCH exons 3, 7, 9, 13, 16, 17, 18, 20, 21, 22, and 23b s. Elution time in minutes (X-axis) versus absorbance of the eluate in mV (Y-axis). The first peak is the sample injection peak; the second peak represents the PCR product elution peak, ideally found between 4-6 minutes; the third peak is an acetonitrile wash-peak. Some of the elution peaks appear to have a ‘shoulder’; this is usually caused by the presence of AmpliTaq Gold. The small irregularities between the sample injection peak and the sample elution peak are primer-dimer artefacts [403] .
7.10. Elution profiles and sequences for PTCH exons with variants
Exon 6 A
w ild type exon 6PTCH exon 6 w ild type at 59.2º
Time (Minutes)109876543210
Abso
rban
ce (m
V)
20181614121086420
B
variant exon 6PTCH exon 6 variant at 59.2º
Time (Minutes)109876543210
Abso
rban
ce (m
V)
20181614121086420
Figure 7.2 A-B dHPLC elution profile for PTCH exon 6, wild type (A) and variant (B).
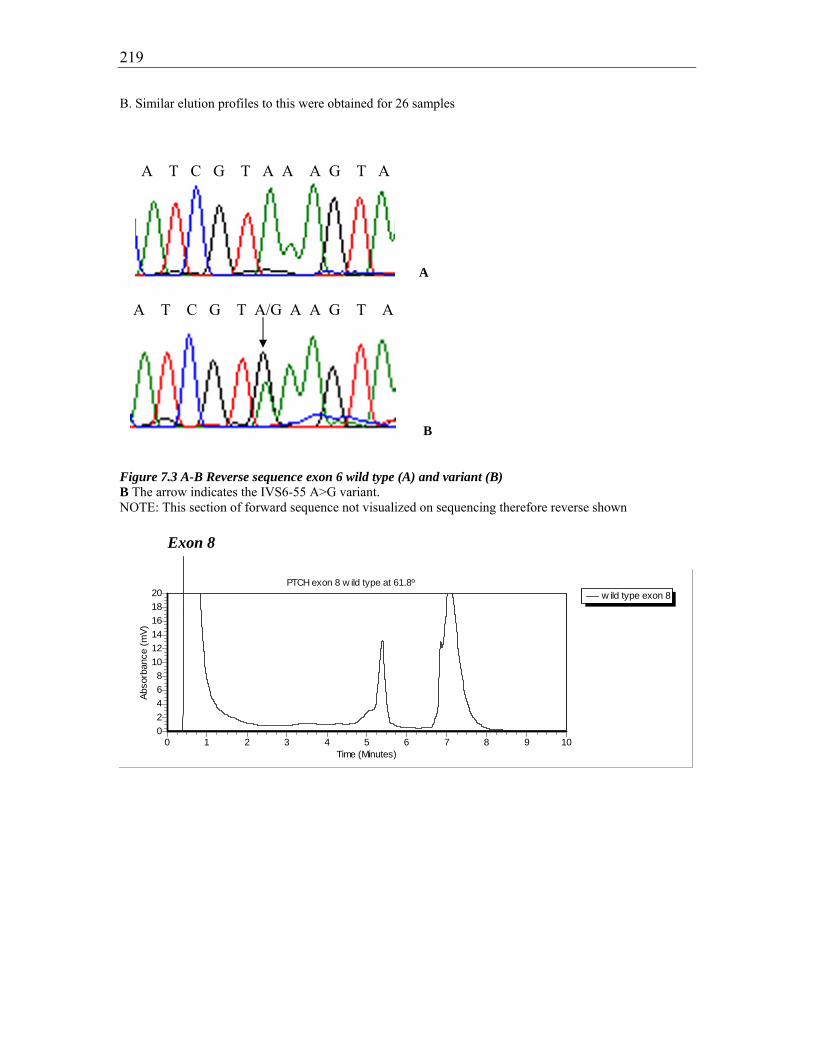
219
B. Similar elution profiles to this were obtained for 26 samples
A
B Figure 7.3 A-B Reverse sequence exon 6 wild type (A) and variant (B) B The arrow indicates the IVS6-55 A>G variant. NOTE: This section of forward sequence not visualized on sequencing therefore reverse shown
Exon 8
w ild type exon 8PTCH exon 8 w ild type at 61.8º
Time (Minutes)109876543210
Abso
rban
ce (m
V)
20181614121086420
A T C G T A A A G T A
A T C G T A/G A A G T A
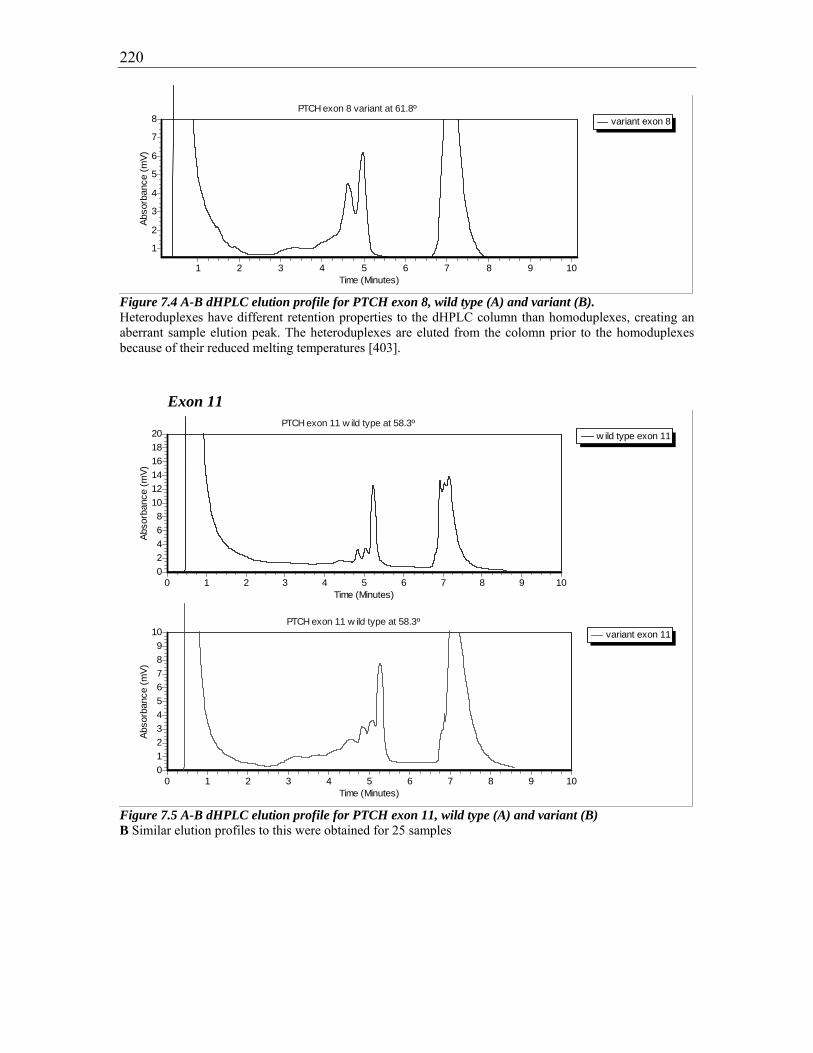
220
variant exon 8PTCH exon 8 variant at 61.8º
Time (Minutes)10987654321
Abso
rban
ce (m
V)
8
7
6
5
4
3
2
1
Figure 7.4 A-B dHPLC elution profile for PTCH exon 8, wild type (A) and variant (B). Heteroduplexes have different retention properties to the dHPLC column than homoduplexes, creating an aberrant sample elution peak. The heteroduplexes are eluted from the colomn prior to the homoduplexes because of their reduced melting temperatures [403].
Exon 11
w ild type exon 11PTCH exon 11 w ild type at 58.3º
Time (Minutes)109876543210
Abso
rban
ce (m
V)
20181614121086420
variant exon 11PTCH exon 11 w ild type at 58.3º
Time (Minutes)109876543210
Abso
rban
ce (m
V)
109876543210
Figure 7.5 A-B dHPLC elution profile for PTCH exon 11, wild type (A) and variant (B) B Similar elution profiles to this were obtained for 25 samples
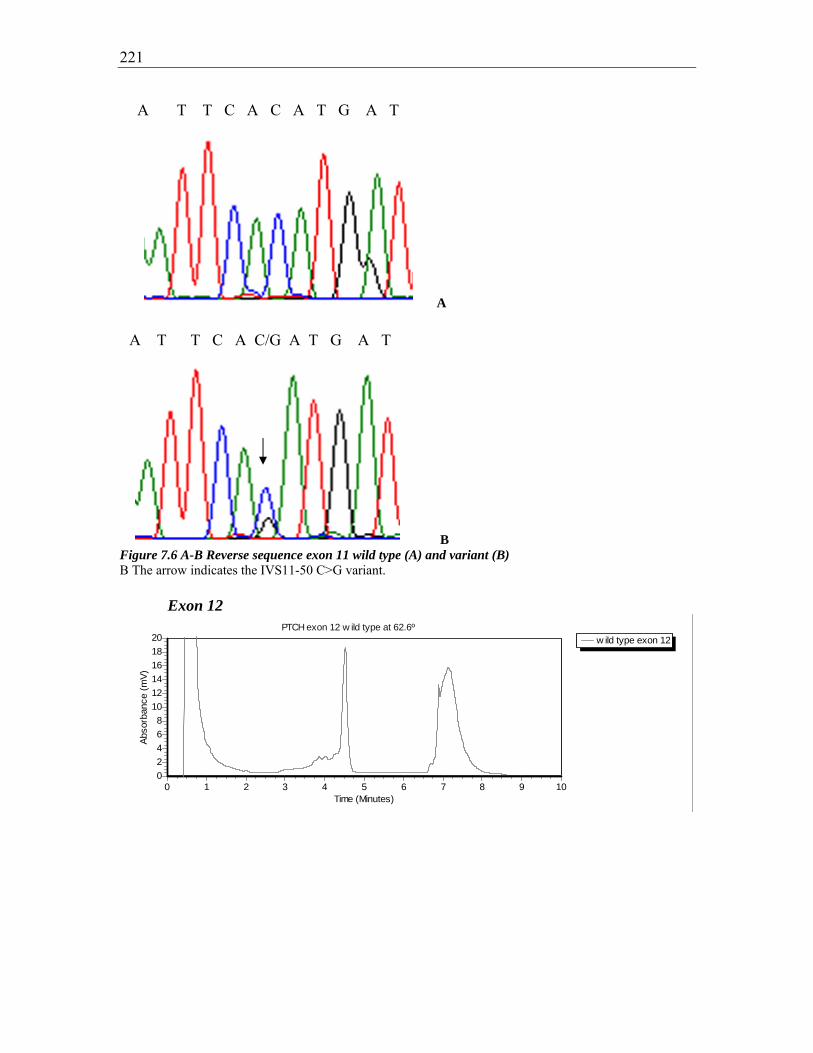
221
A
B Figure 7.6 A-B Reverse sequence exon 11 wild type (A) and variant (B) B The arrow indicates the IVS11-50 C>G variant. Exon 12
w ild type exon 12PTCH exon 12 w ild type at 62.6º
Time (Minutes)109876543210
Abso
rban
ce (m
V)
20181614121086420
A T T C A C/G A T G A T
A T T C A C A T G A T

222
variant 1 exon 12PTCH exon 12 variant 1 at 62.6º
Time (Minutes)109876543210
Abso
rban
ce (m
V)
109876543210
variant 2 exon 12PTCH exon 12 variant 2 at 62.6º
Time (Minutes)109876543210
Abso
rban
ce (m
V)
12
10
8
6
4
2
0
variant 3 exon 12PTCH exon 12 variant 3 at 62.6º
Time (Minutes)10987654321
Abso
rban
ce (m
V)
20181614121086420
Figure 7.7 A-D dHPLC elution profiles for PTCH exon 12, wild type (A), variant 1(B), variant2 (C), and variant 3 (D) B Similar elution profiles to this were obtained for 8 samples [give all ID numbers?] C Similar elution profiles to this were obtained for 16 samples D Similar elution profiles to this were obtained for 5 samples

223
A
B
C
D
A G C A A T/C G T C A C
A T G G C C/T G C G T T
A G C A A T G T C A C
A T G G C C G C G T T

224
E Figure 7.8 A-E Forward sequence exon 12 wild type (A, C) and variants (B,D,E) B The arrow indicates T>C 63. D The arrow indicates C>T 84 E The arrows indicate a combination of T>C 63 and C>T 84 within the same sequence. This occurred in 5 proband samples Exon 23a
w ild type exon 23aPTCH exon 23a w ild type at 63.9º
Time (Minutes)109876543210
Abso
rban
ce (m
V)
109876543210
variant exon 23aPTCH exon 23a variant at 63.9º
Time (Minutes)109876543210
Abso
rban
ce (m
V)
109876543210
Figure 7.9 A-B dHPLC elution profile for PTCH exon 23a, wild type (A) and variant (B) B Similar elution profiles to this were obtained for 26 samples
A G C A A T/C G T C A C A G C C T T C T T C A T G G C C/T G C G T T

225
A
B Figure 7.10 A-B. Forward sequence exon 23a, wild type (A) and variant (B) B The arrow indicates the T>C 140 variant
7.10.1. Elution profiles and sequences for exons with Australian control data
Exon 2 A
w ild type exon 2PTCH exon 2 w ild type at 59.9º
Time (Minutes)109876543210
Abso
rban
ce (m
V)
20181614121086420
B
A C C C C T/C C T A C A
A C C C C T C T A C A

226
variant exon 2PTCH exon 2 variant at 59.9º
Time (Minutes)109876543210
Abso
rban
ce (m
V)
20181614121086420
Figure 7.11 A-B dHPLC profile for PTCH exon 2, wild type (A) and variant (B) B Similar elution profiles to this were obtained for both 8784 and 9208
A
B Figure 7.12 A-B. Forward sequence exon 2, wild type (A) and variant (B) B The arrow indicates the C>T 116 variant A
G G C C T C/T C T C A T
G G C C T C C T C A T
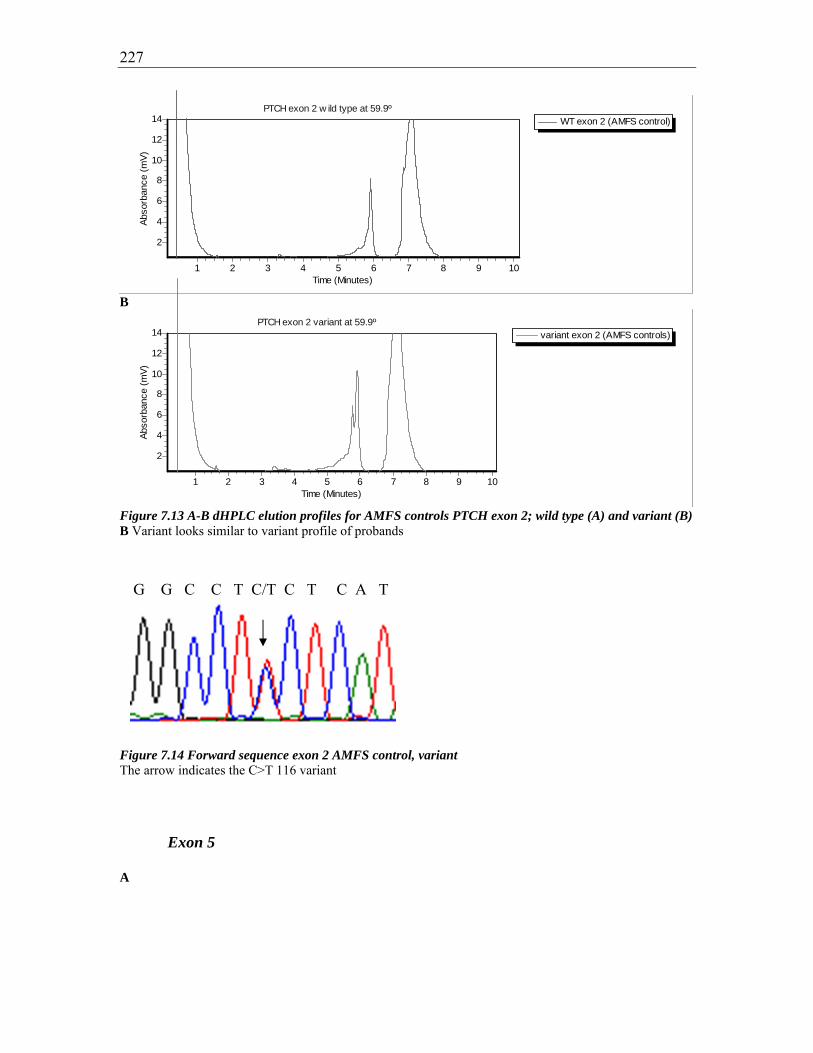
227
WT exon 2 (AMFS control)PTCH exon 2 w ild type at 59.9º
Time (Minutes)10987654321
Abso
rban
ce (m
V)
14
12
10
8
6
4
2
B
variant exon 2 (AMFS controls)PTCH exon 2 variant at 59.9º
Time (Minutes)10987654321
Abso
rban
ce (m
V)
14
12
10
8
6
4
2
Figure 7.13 A-B dHPLC elution profiles for AMFS controls PTCH exon 2; wild type (A) and variant (B) B Variant looks similar to variant profile of probands
Figure 7.14 Forward sequence exon 2 AMFS control, variant The arrow indicates the C>T 116 variant Exon 5 A
G G C C T C/T C T C A T

228
w ild type exon 5PTCH exon 5 w ild type at 57.0º
Time (Minutes)109876543210
Abso
rban
ce (m
V)
12
10
8
6
4
2
0
B
variant exon 5PTCH exon 5 variant at 57.0º
Time (Minutes)109876543210
Abso
rban
ce (m
V)
20181614121086420
Figure 7.15 A-B dHPLC elution profiles for PTCH exon 5, wild type (A) and variant(B) B Similar elution profiles as this were obtained for samples with ID numbers 8781, 8825, 9094, 9273, 9274, and 8779 A
WT exon 5 (AMFS control)PTCH exon 5 w ild type at 57.0º
Time (Minutes)10987654321
Abso
rban
ce (m
V)
14
12
10
8
6
4
2
B

229
variant exon 5 (AMFS control)PTCH exon 5 variant at 57.0º
Time (Minutes)10987654321
Abso
rban
ce (m
V)
14
12
10
8
6
4
2
Figure 7.16 A-B dHPLC elution profiles for AMFS controls PTCH exon 5; wild type (A) and variant (B) B Similar elution profiles to this were obtained for samples with ID numbers 11089, 21027, 7877, 6658, and 310
Figure 7.17 Forward sequence exon 5 AMFS control, variant The arrow indicates the A>G 80 variant
A
B Figure 7.18 A-B Forward sequence exon 5, wild type (A) and variant (B)
G G G A C A/G G C A T A
G G G A C A/G G C A T A
G G G A C A G C A T A

230
B The arrow indicates the A>G 80 variant Exon 14 A
w ild type exon 14PTCH exon 14 w ild type at 61.5º
Time (Minutes)109876543210
Abso
rban
ce (m
V)
20181614121086420
B
variant exon 14PTCH exon 14 variant at 61.5º
Time (Minutes)109876543210
Abso
rban
ce (m
V)
2220181614121086420
Figure 7.19 A-B dHPLC profile for PTCH exon 14, wild type (A) and variant (B) B Elution profile for sample ID 9465
A
C T C T C A T C T T T

231
B Figure 7.20 A-B Forward sequence exon 14, wild type (A) and variant (B) B The arrow indicates the A>G 351 variant A
WT exon 14 (AMFS control)PTCH exon 14 w ild type at 61.5º
Time (Minutes)10987654321
Abso
rban
ce (m
V)
2018161412108642
B
variant exon 14 (AMFS control)PTCH exon 14 variant at 61.5º
Time (Minutes)10987654321
Abso
rban
ce (m
V)
2018161412108642
Figure 7.21 A-B dHPLC elution profiles for AMFS controls PTCH exon 14; wild type (A) and variant (B) B Similar elution profiles to this were obtained for samples with ID numbers 12835 and 12836
Figure 7.22 Forward sequence exon 14 AMFS control, variant The arrow indicates the G>A 351 variant
C T C T C A/G T C T T T
C T C T C A/G T C T T T
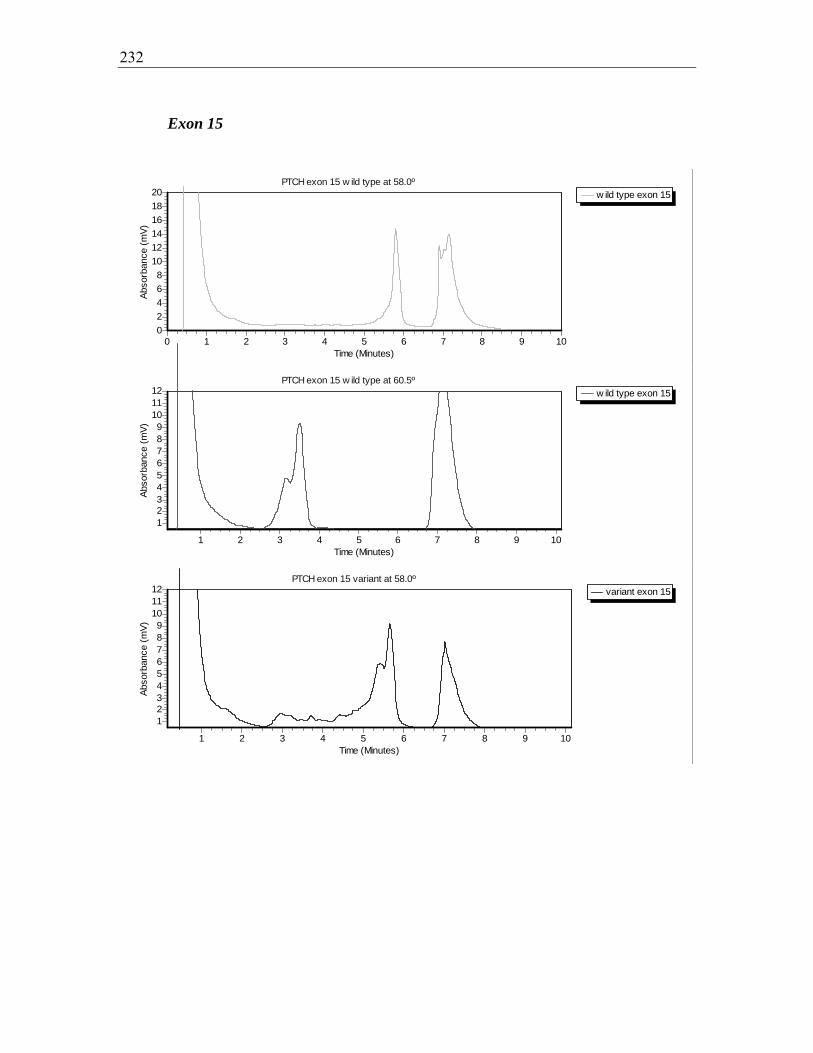
232
Exon 15
w ild type exon 15PTCH exon 15 w ild type at 58.0º
Time (Minutes)109876543210
Abso
rban
ce (m
V)
20181614121086420
w ild type exon 15PTCH exon 15 w ild type at 60.5º
Time (Minutes)10987654321
Abso
rban
ce (m
V)
121110987654321
variant exon 15PTCH exon 15 variant at 58.0º
Time (Minutes)10987654321
Abso
rban
ce (m
V)
121110987654321

233
variant exon 15PTCH exon 15 variant at 60.5º
Time (Minutes)10987654321
Abso
rban
ce (m
V)
8
7
6
5
4
3
2
1
Figure 7.23 A-D dHPLC elution profile for PTCH exon 15, wild types (A, B) and variants (C, D) C, D Same sample seen at two temperatures. Similar elution profiles seen at both temperatures for all 8 variants.
A
B Figure 7.24 A-B. Forward sequence exon 15, wild type (A) and variant (B) B The arrow indicates the IVS15+9 G>C variant
A G A C G G/C C G T G G
A G A C G G C G T G G
234
Chapter 8: References
[1] Staples M, Marks R, Giles G. Trends in the incidence of non-melanocytic skin cancer (NMSC) treated in Australia 1985-1995: are primary prevention programs starting to have an effect? Int J Cancer. 1998 Oct 5;78(2):144-8. [2] Hopper JL, Southey MC, Dite GS, Jolley DJ, Giles GG, McCredie MR, et al. Population-based estimate of the average age-specific cumulative risk of breast cancer for a defined set of protein-truncating mutations in BRCA1 and BRCA2. Australian Breast Cancer Family Study. Cancer Epidemiol Biomarkers Prev. 1999;8(9):741-7. [3] Czarnecki D, Zalcberg J, Meehan C, O'Brien T, Leahy S, Bankier A, et al. Familial occurrence of multiple nonmelanoma skin cancer. Cancer Genet Cytogenet. 1992;61(1):1-5. [4] Aszterbaum M, Epstein J, Oro A, Douglas V, LeBoit PE, Scott MP, et al. Ultraviolet and ionizing radiation enhance the growth of BCCs and trichoblastomas in patched heterozygous knockout mice. Nat Med. 1999;5(11):1285-91. [5] NHMRC ACNMoN-MSCWp. Clinical Practice Guidelines Non-melanoma skin cancer: Guidelines for treatment and management in Australia. 2002. [6] Asada M, Schaart FM, de Almeida HL, Jr., Korge B, Kurokawa I, Asada Y, et al. Solid basal cell epithelioma (BCE) possibly originates from the outer root sheath of the hair follicle. Acta Derm Venereol. 1993 Aug;73(4):286-92. [7] Kurzen H, Esposito L, Langbein L, Hartschuh W. Cytokeratins as markers of follicular differentiation: an immunohistochemical study of trichoblastoma and basal cell carcinoma. Am J Dermatopathol. 2001 Dec;23(6):501-9. [8] Ponten F, Berg C, Ahmadian A, Ren ZP, Nister M, Lundeberg J, et al. Molecular pathology in basal cell cancer with p53 as a genetic marker. Oncogene. 1997;15(9):1059-67. [9] von Domarus H, Stevens PJ. Metastatic basal cell carcinoma. Report of five cases and review of 170 cases in the literature. J Am Acad Dermatol. 1984;10(6):1043-60. [10] Franceschi S, Levi F, Randimbison L, La Vecchia C. Site distribution of different types of skin cancer: new aetiological clues. Int J Cancer. 1996 Jul 3;67(1):24-8. [11] Del Rosario RN, Barr RJ, Jensen JL, Cantos KA. Basal cell carcinoma of the buccal mucosa. Am J Dermatopathol. 2001 Jun;23(3):203-5. [12] Chuang TY, Reizner GT, Elpern DJ, Stone JL, Farmer ER. Nonmelanoma skin cancer in Japanese ethnic Hawaiians in Kauai, Hawaii: an incidence report. J Am Acad Dermatol. 1995 Sep;33(3):422-6. [13] Plesko I, Severi G, Obsitnikova A, Boyle P. Trends in the incidence of non-melanoma skin cancer in Slovakia, 1978-1995. Neoplasma. 2000;47(3):137-42. [14] Armstrong BK, Kricker A. The epidemiology of UV induced skin cancer. J Photochem Photobiol B. 2001 Oct;63(1-3):8-18. [15] Wong CS, Strange RC, Lear JT. Basal cell carcinoma. Bmj. 2003 Oct 4;327(7418):794-8. [16] English DR, Kricker A, Heenan PJ, Randell PL, Winter MG, Armstrong BK. Incidence of non-melanocytic skin cancer in Geraldton, Western Australia. Int J Cancer. 1997 Nov 27;73(5):629-33. [17] Buettner PG, Raasch BA. Incidence rates of skin cancer in Townsville, Australia. Int J Cancer. 1998 Nov 23;78(5):587-93.
235
[18] Strutton GM. Pathological variants of basal cell carcinoma. Australas J Dermatol. 1997 Jun;38 Suppl 1:S31-5. [19] Yeatman J, Marks R. Non-melanoma skin cancer. Med J Aust. 1996 Apr 15;164(8):492-6. [20] Bastiaens MT, Hoefnagel JJ, Bruijn JA, Westendorp RG, Vermeer BJ, Bouwes Bavinck JN. Differences in age, site distribution, and sex between nodular and superficial basal cell carcinoma indicate different types of tumors. J Invest Dermatol. 1998;110(6):880-4. [21] Fitzpatrick T. Dermatology in General Medicine. 5th ed. New York: McGraw-Hill 1999. [22] Silverman MK, Kopf AW, Grin CM, Bart RS, Levenstein MJ. Recurrence rates of treated basal cell carcinomas. Part 2: Curettage-electrodesiccation. J Dermatol Surg Oncol. 1991 Sep;17(9):720-6. [23] Silverman MK, Kopf AW, Bart RS, Grin CM, Levenstein MS. Recurrence rates of treated basal cell carcinomas. Part 3: Surgical excision. J Dermatol Surg Oncol. 1992 Jun;18(6):471-6. [24] Kuflik EG, Gage AA. The five-year cure rate achieved by cryosurgery for skin cancer. J Am Acad Dermatol. 1991 Jun;24(6 Pt 1):1002-4. [25] Petrovich Z, Parker RG, Luxton G, Kuisk H, Jepson J. Carcinoma of the lip and selected sites of head and neck skin. A clinical study of 896 patients. Radiother Oncol. 1987;8(1):11-7. [26] Mazeron JJ, Chassagne D, Crook J, Bachelot F, Brochet F, Brune D, et al. Radiation therapy of carcinomas of the skin of nose and nasal vestibule: a report of 1676 cases by the Groupe Europeen de Curietherapie. Radiother Oncol. 1988;13(3):165-73. [27] Beutner KR, Geisse JK, Helman D, Fox TL, Ginkel A, Owens ML. Therapeutic response of basal cell carcinoma to the immune response modifier imiquimod 5% cream. J Am Acad Dermatol. 1999;41(6):1002-7. [28] Silverman MK, Kopf AW, Gladstein AH, Bart RS, Grin CM, Levenstein MJ. Recurrence rates of treated basal cell carcinomas. Part 4: X-ray therapy. J Dermatol Surg Oncol. 1992;18(7):549-54. [29] Goette DK. Topical chemotherapy with 5-fluorouracil. A review. J Am Acad Dermatol. 1981 Jun;4(6):633-49. [30] Drehs MM, Cook-Bolden F, Tanzi EL, Weinberg JM. Successful treatment of multiple superficial basal cell carcinomas with topical imiquimod: case report and review of the literature. Dermatol Surg. 2002 May;28(5):427-9. [31] Greenway HT, Cornell RC, Tanner DJ, Peets E, Bordin GM, Nagi C. Treatment of basal cell carcinoma with intralesional interferon. J Am Acad Dermatol. 1986;15(3):437-43. [32] Cornell RC, Greenway HT, Tucker SB, Edwards L, Ashworth S, Vance JC, et al. Intralesional interferon therapy for basal cell carcinoma. J Am Acad Dermatol. 1990 Oct;23(4 Pt 1):694-700. [33] Morton CA, Whitehurst C, McColl JH, Moore JV, MacKie RM. Photodynamic therapy for large or multiple patches of Bowen disease and basal cell carcinoma. Arch Dermatol. 2001;137(3):319-24. [34] Kricker AaA, B. International Trends in Skin Cancer. Cancer Forum. 1996;20(3):192- 5.

236
[35] Miller DL, Weinstock MA. Nonmelanoma skin cancer in the United States: incidence. J Am Acad Dermatol. 1994;30(5 Pt 1):774-8. [36] Government C. Priority Issues Discussion Paper: An interim report to the Commonwealth Department of Health and Family Services; An Overview of Direct Health System Costs of Cancer in Australia 1993-1994: National Cancer Control Initiative; 1997. [37] Green A, Leslie D, Weedon D. Diagnosis of skin cancer in the general population: clinical accuracy in the Nambour survey. Med J Aust. 1988 May 2;148(9):447-50. [38] Kricker A, English DR, Randell PL, Heenan PJ, Clay CD, Delaney TA, et al. Skin cancer in Geraldton, Western Australia: a survey of incidence and prevalence. Med J Aust. 1990 Apr 16;152(8):399-407. [39] Kaldor J, Shugg D, Young B, Dwyer T, Wang YG. Non-melanoma skin cancer: ten years of cancer-registry-based surveillance. Int J Cancer. 1993 Apr 1;53(6):886-91. [40] Stenbeck KD, Balanda KP, Williams MJ, Ring IT, MacLennan R, Chick JE, et al. Patterns of treated non-melanoma skin cancer in Queensland--the region with the highest incidence rates in the world. Med J Aust. 1990 Nov 5;153(9):511-5. [41] Honari M, and Saint-Ives, I. The Northern Territory Cancer Report. Darwin: Northern Territory Department of Health 1987. [42] Marks R, Jolley D, Dorevitch AP, Selwood TS. The incidence of non-melanocytic skin cancers in an Australian population: results of a five-year prospective study. Med J Aust. 1989 May 1;150(9):475-8. [43] Hill D, White V, Marks R, Borland R. Changes in sun-related attitudes and behaviours, and reduced sunburn prevalence in a population at high risk of melanoma. Eur J Cancer Prev. 1993 Nov;2(6):447-56. [44] Green A, Battistutta D, Hart V, Leslie D, Weedon D. Skin cancer in a subtropical Australian population: incidence and lack of association with occupation. The Nambour Study Group. Am J Epidemiol. 1996 Dec 1;144(11):1034-40. [45] Navarro C, Perez-Flores D, Coleman MP. Cancer incidence in Murcia, Spain, in 1982: first results from a population-based cancer registry. Int J Cancer. 1986 Jul 15;38(1):1-7. [46] Magnus K. The Nordic profile of skin cancer incidence. A comparative epidemiological study of the three main types of skin cancer. Int J Cancer. 1991 Jan 2;47(1):12-9. [47] Zanetti R, Rosso S, Martinez C, Navarro C, Schraub S, Sancho-Garnier H, et al. The multicentre south European study 'Helios'. I: Skin characteristics and sunburns in basal cell and squamous cell carcinomas of the skin. Br J Cancer. 1996 Jun;73(11):1440-6. [48] Karagas MR, Greenberg ER, Spencer SK, Stukel TA, Mott LA. Increase in incidence rates of basal cell and squamous cell skin cancer in New Hampshire, USA. New Hampshire Skin Cancer Study Group. Int J Cancer. 1999 May 17;81(4):555-9. [49] Harris RB, Griffith K, Moon TE. Trends in the incidence of nonmelanoma skin cancers in southeastern Arizona, 1985-1996. J Am Acad Dermatol. 2001 Oct;45(4):528-36. [50] Levi F, Franceschi S, Te VC, Randimbison L, La Vecchia C. Trends of skin cancer in the Canton of Vaud, 1976-92. Br J Cancer. 1995 Oct;72(4):1047-53.

237
[51] Koh D, Wang H, Lee J, Chia KS, Lee HP, Goh CL. Basal cell carcinoma, squamous cell carcinoma and melanoma of the skin: analysis of the Singapore Cancer Registry data 1968-97. Br J Dermatol. 2003 Jun;148(6):1161-6. [52] Coebergh JW, Neumann HA, Vrints LW, van der Heijden L, Meijer WJ, Verhagen-Teulings MT. Trends in the incidence of non-melanoma skin cancer in the SE Netherlands 1975-1988: a registry-based study. Br J Dermatol. 1991 Oct;125(4):353-9. [53] Scotto F, Fraumeni. Incidence of Nonmelanoma Skin Cancer. Washington: US Dept of Health and Human Services; 1983. [54] Holme SA, Malinovszky K, Roberts DL. Changing trends in non-melanoma skin cancer in South Wales, 1988-98. Br J Dermatol. 2000;143(6):1224-9. [55] Hannuksela-Svahn A, Pukkala E, Karvonen J. Basal cell skin carcinoma and other nonmelanoma skin cancers in Finland from 1956 through 1995. Arch Dermatol. 1999 Jul;135(7):781-6. [56] Reizner GT, Chuang TY, Elpern DJ, Stone JL, Farmer ER. Basal cell carcinoma in Kauai, Hawaii: the highest documented incidence in the United States. J Am Acad Dermatol. 1993;29(2 Pt 1):184-9. [57] Czarnecki D, Meehan C, O'Brien T, Leahy S, Nash C. The changing face of skin cancer in Australia. Int J Dermatol. 1991;30(10):715-7. [58] Cho S, Kim MH, Whang KK, Hahm JH. Clinical and histopathological characteristics of basal cell carcinoma in Korean patients. J Dermatol. 1999 Aug;26(8):494-501. [59] Kricker A, Armstrong BK, English DR. Sun exposure and non-melanocytic skin cancer. Cancer Causes Control. 1994 Jul;5(4):367-92. [60] Karagas MR, Greenberg ER, Spencer SK, Stukel TA, Mott LA. Increase in incidence rates of basal cell and squamous cell skin cancer in New Hampshire, USA. New Hampshire Skin Cancer Study Group. Int J Cancer. 1999;81(4):555-9. [61] de Vries E, Louwman M, Bastiaens M, de Gruijl F, Coebergh JW. Rapid and continuous increases in incidence rates of basal cell carcinoma in the southeast Netherlands since 1973. J Invest Dermatol. 2004;123(4):634-8. [62] Dahl E, Aberg M, Rausing A, Rausing EL. Basal cell carcinoma. An epidemiologic study in a defined population. Cancer. 1992;70(1):104-8. [63] Koh D, Wang H, Lee J, Chia KS, Lee HP, Goh CL. Basal cell carcinoma, squamous cell carcinoma and melanoma of the skin: analysis of the Singapore Cancer Registry data 1968-97. Br J Dermatol. 2003;148(6):1161-6. [64] Munyao TM, Othieno-Abinya NA. Cutaneous basal cell carcinoma in Kenya. East Afr Med J. 1999 Feb;76(2):97-100. [65] Mahmoud SF, Azadeh B. Basal cell carcinoma in Qatar. Int J Dermatol. 1996 Oct;35(10):704-6. [66] Moan J, Dahlback A. The relationship between skin cancers, solar radiation and ozone depletion. Br J Cancer. 1992 Jun;65(6):916-21. [67] Nagano T, Ueda M, Suzuki T, Naruse K, Nakamura T, Taguchi M, et al. Skin cancer screening in Okinawa, Japan. J Dermatol Sci. 1999 Apr;19(3):161-5. [68] Gilbody JS, Aitken J, Green A. What causes basal cell carcinoma to be the commonest cancer? Aust J Public Health. 1994 Jun;18(2):218-21.

238
[69] Magnus K. The Nordic profile of skin cancer incidence. A comparative epidemiological study of the three main types of skin cancer. Int J Cancer. 1991;47(1):12-9. [70] Levi F, La Vecchia C, Te VC, Mezzanotte G. Descriptive epidemiology of skin cancer in the Swiss Canton of Vaud. Int J Cancer. 1988;42(6):811-6. [71] Osterlind A, Hou-Jensen K, Moller Jensen O. Incidence of cutaneous malignant melanoma in Denmark 1978-1982. Anatomic site distribution, histologic types, and comparison with non-melanoma skin cancer. Br J Cancer. 1988;58(3):385-91. [72] Wei Q, Matanoski GM, Farmer ER, Hedayati MA, Grossman L. DNA repair and aging in basal cell carcinoma: a molecular epidemiology study. Proc Natl Acad Sci U S A. 1993;90(4):1614-8. [73] Ramachandran S, Fryer AA, Lovatt T, Smith A, Lear J, Jones PW, et al. The rate of increase in the numbers of primary sporadic basal cell carcinomas during follow up is associated with age at first presentation. Carcinogenesis. 2002;23(12):2051-4. [74] Czarnecki D, Collins N, Meehan C, O'Brien T, Leahy S, Nash C. Basal-cell carcinoma in temperate and tropical Australia. Int J Cancer. 1992;50(6):874-5. [75] Tucker MA, Goldstein AM. Melanoma etiology: where are we? Oncogene. 2003;22(20):3042-52. [76] Molesworth E. Rodent Ulcer. Med J Aust. 1927 June 18, 1927;1(1):878-95. [77] Bodak N, Queille S, Avril MF, Bouadjar B, Drougard C, Sarasin A, et al. High levels of patched gene mutations in basal-cell carcinomas from patients with xeroderma pigmentosum. Proc Natl Acad Sci U S A. 1999;96(9):5117-22. [78] Kricker A, Armstrong BK, English DR, Heenan PJ. Pigmentary and cutaneous risk factors for non-melanocytic skin cancer--a case-control study. Int J Cancer. 1991 Jul 9;48(5):650-62. [79] Neale RE, Davis M, Pandeya N, Whiteman DC, Green AC. Basal cell carcinoma on the trunk is associated with excessive sun exposure. J Am Acad Dermatol. 2007;56(3):380-6. Epub 2006 Oct 13. [80] Holman CD, Armstrong BK. Cutaneous malignant melanoma and indicators of total accumulated exposure to the sun: an analysis separating histogenetic types. J Natl Cancer Inst. 1984 Jul;73(1):75-82. [81] Gallagher RP, Hill GB, Bajdik CD, Fincham S, Coldman AJ, McLean DI, et al. Sunlight exposure, pigmentary factors, and risk of nonmelanocytic skin cancer. I. Basal cell carcinoma. Arch Dermatol. 1995 Feb;131(2):157-63. [82] Wikonkal NM, Brash DE. Ultraviolet radiation induced signature mutations in photocarcinogenesis. J Investig Dermatol Symp Proc. 1999;4(1):6-10. [83] Rosenstein BS, Ducore JM. Induction of DNA strand breaks in normal human fibroblasts exposed to monochromatic ultraviolet and visible wavelengths in the 240-546 nm range. Photochem Photobiol. 1983;38(1):51-5. [84] Rosenstein BS, Phelps RG, Weinstock MA, Bernstein JL, Gordon ML, Rudikoff D, et al. p53 mutations in basal cell carcinomas arising in routine users of sunscreens. Photochem Photobiol. 1999;70(5):798-806. [85] Kielbassa C, Roza L, Epe B. Wavelength dependence of oxidative DNA damage induced by UV and visible light. Carcinogenesis. 1997;18(4):811-6.
239
[86] Moan J, Dahlback A, Setlow RB. Epidemiological support for an hypothesis for melanoma induction indicating a role for UVA radiation. Photochem Photobiol. 1999;70(2):243-7. [87] Autier P. Perspectives in melanoma prevention: the case of sunbeds. Eur J Cancer. 2004;40(16):2367-76. [88] Boyd AS, Shyr Y, King LE, Jr. Basal cell carcinoma in young women: an evaluation of the association of tanning bed use and smoking. J Am Acad Dermatol. 2002 May;46(5):706-9. [89] Karagas MR, Stannard VA, Mott LA, Slattery MJ, Spencer SK, Weinstock MA. Use of tanning devices and risk of basal cell and squamous cell skin cancers. J Natl Cancer Inst. 2002;94(3):224-6. [90] Westerdahl J, Ingvar C, Masback A, Jonsson N, Olsson H. Risk of cutaneous malignant melanoma in relation to use of sunbeds: further evidence for UV-A carcinogenicity. Br J Cancer. 2000;82(9):1593-9. [91] De Fabo EC, Noonan FP, Fears T, Merlino G. Ultraviolet B but not ultraviolet A radiation initiates melanoma. Cancer Res. 2004;64(18):6372-6. [92] Kripke ML, Fisher MS. Immunologic parameters of ultraviolet carcinogenesis. J Natl Cancer Inst. 1976;57(1):211-5. [93] Fisher MS, Kripke ML. Systemic alteration induced in mice by ultraviolet light irradiation and its relationship to ultraviolet carcinogenesis. Proc Natl Acad Sci U S A. 1977;74(4):1688-92. [94] Fisher MS, Kripke ML. Suppressor T lymphocytes control the development of primary skin cancers in ultraviolet-irradiated mice. Science. 1982;216(4550):1133-4. [95] Yoshikawa T, Rae V, Bruins-Slot W, Van den Berg JW, Taylor JR, Streilein JW. Susceptibility to effects of UVB radiation on induction of contact hypersensitivity as a risk factor for skin cancer in humans. J Invest Dermatol. 1990;95(5):530-6. [96] Robinson JK, Rademaker AW. Relative importance of prior basal cell carcinomas, continuing sun exposure, and circulating T lymphocytes on the development of basal cell carcinoma. J Invest Dermatol. 1992 Aug;99(2):227-31. [97] Ramsay HM, Fryer AA, Hawley CM, Smith AG, Harden PN. Non-melanoma skin cancer risk in the Queensland renal transplant population. Br J Dermatol. 2002;147(5):950-6. [98] Bouwes Bavinck JN, Hardie DR, Green A, Cutmore S, MacNaught A, O'Sullivan B, et al. The risk of skin cancer in renal transplant recipients in Queensland, Australia. A follow-up study. Transplantation. 1996;61(5):715-21. [99] Kricker A, Armstrong BK, English DR, Heenan PJ. Does intermittent sun exposure cause basal cell carcinoma? a case-control study in Western Australia. Int J Cancer. 1995 Feb 8;60(4):489-94. [100] Corona R, Dogliotti E, D'Errico M, Sera F, Iavarone I, Baliva G, et al. Risk factors for basal cell carcinoma in a Mediterranean population: role of recreational sun exposure early in life. Arch Dermatol. 2001 Sep;137(9):1162-8. [101] Strickland PT, Vitasa BC, West SK, Rosenthal FS, Emmett EA, Taylor HR. Quantitative carcinogenesis in man: solar ultraviolet B dose dependence of skin cancer in Maryland watermen. J Natl Cancer Inst. 1989 Dec 20;81(24):1910-3.
240
[102] Hunter DJ, Colditz GA, Stampfer MJ, Rosner B, Willett WC, Speizer FE. Risk factors for basal cell carcinoma in a prospective cohort of women. Ann Epidemiol. 1990 Oct;1(1):13-23. [103] Rosso S, Zanetti R, Martinez C, Tormo MJ, Schraub S, Sancho-Garnier H, et al. The multicentre south European study 'Helios'. II: Different sun exposure patterns in the aetiology of basal cell and squamous cell carcinomas of the skin. Br J Cancer. 1996 Jun;73(11):1447-54. [104] McCormack CJ, Kelly JW, Dorevitch AP. Differences in age and body site distribution of the histological subtypes of basal cell carcinoma. A possible indicator of differing causes. Arch Dermatol. 1997;133(5):593-6. [105] Kricker A, Armstrong BK, English DR, Heenan PJ. A dose-response curve for sun exposure and basal cell carcinoma. Int J Cancer. 1995 Feb 8;60(4):482-8. [106] Giles GT, V. Trends in skin cancer in Australia. Cancer Forum. 1996;20:188-91. [107] Urbach F. Ultraviolet radiation and skin cancer of humans. J Photochem Photobiol B. 1997 Aug;40(1):3-7. [108] Jones RR. Ozone depletion and cancer risk. Lancet. 1987;2(8556):443-6. [109] Mettlin CJ. Skin cancer and ozone depletion: the case for global action. J Surg Oncol. 2001;77(2):76-8. [110] de Gruijl FR, Longstreth J, Norval M, Cullen AP, Slaper H, Kripke ML, et al. Health effects from stratospheric ozone depletion and interactions with climate change. Photochem Photobiol Sci. 2003;2(1):16-28. [111] Diffey B. Climate change, ozone depletion and the impact on ultraviolet exposure of human skin. Phys Med Biol. 2004;49(1):R1-11. [112] Green A, Beardmore G, Hart V, Leslie D, Marks R, Staines D. Skin cancer in a Queensland population. J Am Acad Dermatol. 1988;19(6):1045-52. [113] Hogan DJ, To T, Gran L, Wong D, Lane PR. Risk factors for basal cell carcinoma. Int J Dermatol. 1989;28(9):591-4. [114] Green A, Battistutta D. Incidence and determinants of skin cancer in a high-risk Australian population. Int J Cancer. 1990 Sep 15;46(3):356-61. [115] English DR, Armstrong BK, Kricker A, Winter MG, Heenan PJ, Randell PL. Demographic characteristics, pigmentary and cutaneous risk factors for squamous cell carcinoma of the skin: a case-control study. Int J Cancer. 1998;76(5):628-34. [116] Holman CD, Armstrong BK. Pigmentary traits, ethnic origin, benign nevi, and family history as risk factors for cutaneous malignant melanoma. J Natl Cancer Inst. 1984;72(2):257-66. [117] Gellin GA, Kopf AW, Garfinkel L. BASAL CELL EPITHELIOMA. A CONTROLLED STUDY OF ASSOCIATED FACTORS. Arch Dermatol. 1965;91:38-45. [118] Giles GG, Marks R, Foley P. Incidence of non-melanocytic skin cancer treated in Australia. Br Med J (Clin Res Ed). 1988;296(6614):13-7. [119] Marks R, Rennie G, Selwood T. The relationship of basal cell carcinomas and squamous cell carcinomas to solar keratoses. Arch Dermatol. 1988;124(7):1039-42. [120] O'Loughlin C, Moriarty MJ, Herity B, Daly L. A re-appraisal of risk factors for skin carcinoma in Ireland. A case control study. Ir J Med Sci. 1985;154(2):61-5. [121] Silverstone H, Searle JH. The eqpidemilogy of skin cancer in Queensland: the influence of phenotype and environment. Br J Cancer. 1970;24(2):235-52.
241
[122] Gordon D, and Silverstone, H. Worldwide epidemiology of premalignant and malignant cutaneous lesions. In: Andrade R, Gumport, G., Popkin G., Rees, T., ed. Cancer of the skin. London: Saunders 1976:405- 34. [123] Thompson SC, Jolley D, Marks R. Reduction of solar keratoses by regular sunscreen use. N Engl J Med. 1993;329(16):1147-51. [124] Naylor MF, Boyd A, Smith DW, Cameron GS, Hubbard D, Neldner KH. High sun protection factor sunscreens in the suppression of actinic neoplasia. Arch Dermatol. 1995;131(2):170-5. [125] Vainio H, Miller AB, Bianchini F. An international evaluation of the cancer-preventive potential of sunscreens. Int J Cancer. 2000;88(5):838-42. [126] Green A, Williams G, Neale R, Hart V, Leslie D, Parsons P, et al. Daily sunscreen application and betacarotene supplementation in prevention of basal-cell and squamous-cell carcinomas of the skin: a randomised controlled trial. Lancet. 1999 Aug 28;354(9180):723-9. [127] Westerdahl J, Olsson H, Masback A, Ingvar C, Jonsson N. Is the use of sunscreens a risk factor for malignant melanoma? Melanoma Res. 1995;5(1):59-65. [128] Autier P, Dore JF, Cattaruzza MS, Renard F, Luther H, Gentiloni-Silverj F, et al. Sunscreen use, wearing clothes, and number of nevi in 6- to 7-year-old European children. European Organization for Research and Treatment of Cancer Melanoma Cooperative Group. J Natl Cancer Inst. 1998;90(24):1873-80. [129] Gallagher RP, Rivers JK, Lee TK, Bajdik CD, McLean DI, Coldman AJ. Broad-spectrum sunscreen use and the development of new nevi in white children: A randomized controlled trial. Jama. 2000;283(22):2955-60. [130] Garland CF, Garland FC, Gorham ED. Could sunscreens increase melanoma risk? Am J Public Health. 1992;82(4):614-5. [131] Autier P, Dor JF, Severi G. RESPONSE: more about: sunscreen use, wearing clothes, and number of nevi in 6- to 7-year-Old european children. J Natl Cancer Inst. 1999;91(13):1165-6. [132] Rigel DS, Naylor M, Robinson J. What is the evidence for a sunscreen and melanoma controversy? Arch Dermatol. 2000;136(12):1447-9. [133] Christensen D. Data still cloudy on association between sunscreen use and melanoma risk. J Natl Cancer Inst. 2003;95(13):932-3. [134] Bastuji-Garin S, Diepgen TL. Cutaneous malignant melanoma, sun exposure, and sunscreen use: epidemiological evidence. Br J Dermatol. 2002;146(Suppl 61):24-30. [135] Ramachandran S, Fryer AA, Smith AG, Lear JT, Bowers B, Griffiths CE, et al. Basal cell carcinoma. Cancer. 2000;89(5):1012-8. [136] Ramachandran S, Fryer AA, Smith A, Lear J, Bowers B, Jones PW, et al. Cutaneous basal cell carcinomas: distinct host factors are associated with the development of tumors on the trunk and on the head and neck. Cancer. 2001 Jul 15;92(2):354-8. [137] Ramachandran S, Fryer AA, Strange RC. Genetic factors determining cutaneous basal cell carcinoma phenotype. Med Pediatr Oncol. 2001;36(5):559-63. [138] Karagas MR, Stukel TA, Greenberg ER, Baron JA, Mott LA, Stern RS. Risk of subsequent basal cell carcinoma and squamous cell carcinoma of the skin among patients with prior skin cancer. Skin Cancer Prevention Study Group. Jama. 1992;267(24):3305-10.
242
[139] Epstein E. Value of follow-up after treatment of basal cell carcinoma. Arch Dermatol. 1973;108(6):798-800. [140] Bergstresser PR, Halprin KM. Multiple sequential skin cancers. The risk of skin cancer in patients with previous skin cancer. Arch Dermatol. 1975;111(8):995-6. [141] Schreiber MM, Moon TE, Fox SH, Davidson J. The risk of developing subsequent nonmelanoma skin cancers. J Am Acad Dermatol. 1990;23(6 Pt 1):1114-8. [142] Marcil I, Stern RS. Risk of developing a subsequent nonmelanoma skin cancer in patients with a history of nonmelanoma skin cancer: a critical review of the literature and meta-analysis. Arch Dermatol. 2000;136(12):1524-30. [143] Moller R, Nielsen A, Reymann F. Multiple basal cell carcinoma and internal malignant tumors. Arch Dermatol. 1975;111(5):584-5. [144] Lindelof B, Sigurgeirsson B, Wallberg P, Eklund G. Occurrence of other malignancies in 1973 patients with basal cell carcinoma. J Am Acad Dermatol. 1991;25(2 Pt 1):245-8. [145] Frisch M, Hjalgrim H, Olsen JH, Melbye M. [Risk of cancer among patients with cutaneous basal cell carcinoma]. Ugeskr Laeger. 1998;160(19):2882-7. [146] Friedman GD, Tekawa IS. Association of basal cell skin cancers with other cancers (United States). Cancer Causes Control. 2000;11(10):891-7. [147] Bower CP, Lear JT, Bygrave S, Etherington D, Harvey I, Archer CB. Basal cell carcinoma and risk of subsequent malignancies: A cancer registry-based study in southwest England. J Am Acad Dermatol. 2000;42(6):988-91. [148] Milan T, Pukkala E, Verkasalo PK, Kaprio J, Jansen CT, Koskenvuo M, et al. Subsequent primary cancers after basal-cell carcinoma: A nationwide study in Finland from 1953 to 1995. Int J Cancer. 2000 Jul 15;87(2):283-8. [149] Marghoob AA, Slade J, Salopek TG, Kopf AW, Bart RS, Rigel DS. Basal cell and squamous cell carcinomas are important risk factors for cutaneous malignant melanoma. Screening implications. Cancer. 1995;75(2 Suppl):707-14. [150] Kahn HS, Tatham LM, Patel AV, Thun MJ, Heath CW, Jr. Increased cancer mortality following a history of nonmelanoma skin cancer. Jama. 1998;280(10):910-2. [151] Karagas MR, McDonald JA, Greenberg ER, Stukel TA, Weiss JE, Baron JA, et al. Risk of basal cell and squamous cell skin cancers after ionizing radiation therapy. For The Skin Cancer Prevention Study Group. J Natl Cancer Inst. 1996;88(24):1848-53. [152] Lichter MD, Karagas MR, Mott LA, Spencer SK, Stukel TA, Greenberg ER. Therapeutic ionizing radiation and the incidence of basal cell carcinoma and squamous cell carcinoma. The New Hampshire Skin Cancer Study Group. Arch Dermatol. 2000;136(8):1007-11. [153] Yamada M, Kodama K, Fujita S, Akahoshi M, Yamada S, Hirose R, et al. Prevalence of skin neoplasms among the atomic bomb survivors. Radiat Res. 1996;146(2):223-6. [154] Yeh S, How SW, Lin CS. Arsenical cancer of skin. Histologic study with special reference to Bowen's disease. Cancer. 1968;21(2):312-39. [155] Maloney ME. Arsenic in Dermatology. Dermatol Surg. 1996;22(3):301-4. [156] Boonchai W, Green A, Ng J, Dicker A, Chenevix-Trench G. Basal cell carcinoma in chronic arsenicism occurring in Queensland, Australia, after ingestion of an asthma medication. J Am Acad Dermatol. 2000;43(4):664-9.

243
[157] Ewing MR. The significance of a single injury in the causation of basal-cell carcinoma of the skin. Aust N Z J Surg. 1971;41(2):140-7. [158] Castrow FF, Williams TE. Basal-cell epithelioma occurring in a smallpox vaccination scar. J Dermatol Surg. 1976;2(2):151-2. [159] Freedman DM, Sigurdson A, Doody MM, Mabuchi K, Linet MS. Risk of basal cell carcinoma in relation to alcohol intake and smoking. Cancer Epidemiol Biomarkers Prev. 2003;12(12):1540-3. [160] Milan T, Verkasalo PK, Kaprio J, Koskenvuo M. Lifestyle differences in twin pairs discordant for basal cell carcinoma of the skin. Br J Dermatol. 2003;149(1):115-23. [161] Wei Q, Matanoski GM, Farmer ER, Strickland P, Grossman L. Vitamin supplementation and reduced risk of basal cell carcinoma. J Clin Epidemiol. 1994;47(8):829-36. [162] Black HS, Thornby JI, Wolf JE, Jr., Goldberg LH, Herd JA, Rosen T, et al. Evidence that a low-fat diet reduces the occurrence of non-melanoma skin cancer. Int J Cancer. 1995;62(2):165-9. [163] van Dam RM, Huang Z, Giovannucci E, Rimm EB, Hunter DJ, Colditz GA, et al. Diet and basal cell carcinoma of the skin in a prospective cohort of men. Am J Clin Nutr. 2000;71(1):135-41. [164] Fung TT, Hunter DJ, Spiegelman D, Colditz GA, Speizer FE, Willett WC. Vitamins and carotenoids intake and the risk of basal cell carcinoma of the skin in women (United States). Cancer Causes Control. 2002;13(3):221-30. [165] Easton DF, Cox GM, Macdonald AM, Ponder BA. Genetic susceptibility to naevi--a twin study. Br J Cancer. 1991;64(6):1164-7. [166] Buettner PG, Garbe C. Agreement between self-assessment of melanocytic nevi by patients and dermatologic examination. Am J Epidemiol. 2000;151(1):72-7. [167] Carli P, De Giorgi V, Nardini P, Mannone F, Palli D, Giannotti B. Melanoma detection rate and concordance between self-skin examination and clinical evaluation in patients attending a pigmented lesion clinic in Italy. Br J Dermatol. 2002;146(2):261-6. [168] Kwon OS, Hwang EJ, Bae JH, Park HE, Lee JC, Youn JI, et al. Seborrheic keratosis in the Korean males: causative role of sunlight. Photodermatol Photoimmunol Photomed. 2003;19(2):73-80. [169] Yeatman JM, Kilkenny M, Marks R. The prevalence of seborrhoeic keratoses in an Australian population: does exposure to sunlight play a part in their frequency? Br J Dermatol. 1997;137(3):411-4. [170] Memon AA, Tomenson JA, Bothwell J, Friedmann PS. Prevalence of solar damage and actinic keratosis in a Merseyside population. Br J Dermatol. 2000;142(6):1154-9. [171] Gunther WW. Seborrhoeic keratoses. Australas J Dermatol. 1966;8(3):179-82. [172] Forbes AJ, Nakano Y, Taylor AM, Ingham PW. Genetic analysis of hedgehog signalling in the Drosophila embryo. Dev Suppl. 1993:115-24. [173] Bejsovec A, Wieschaus E. Segment polarity gene interactions modulate epidermal patterning in Drosophila embryos. Development. 1993;119(2):501-17. [174] Knudson AG, Jr. Mutation and cancer: statistical study of retinoblastoma. Proc Natl Acad Sci U S A. 1971;68(4):820-3. [175] Aszterbaum M, Rothman A, Johnson RL, Fisher M, Xie J, Bonifas JM, et al. Identification of mutations in the human PATCHED gene in sporadic basal cell

244
carcinomas and in patients with the basal cell nevus syndrome. J Invest Dermatol. 1998;110(6):885-8. [176] Gailani MR, Bale SJ, Leffell DJ, DiGiovanna JJ, Peck GL, Poliak S, et al. Developmental defects in Gorlin syndrome related to a putative tumor suppressor gene on chromosome 9. Cell. 1992;69(1):111-7. [177] Unden AB, Zaphiropoulos PG, Bruce K, Toftgard R, Stahle-Backdahl M. Human patched (PTCH) mRNA is overexpressed consistently in tumor cells of both familial and sporadic basal cell carcinoma. Cancer Res. 1997;57(12):2336-40. [178] Wolter M, Reifenberger J, Sommer C, Ruzicka T, Reifenberger G. Mutations in the human homologue of the Drosophila segment polarity gene patched (PTCH) in sporadic basal cell carcinomas of the skin and primitive neuroectodermal tumors of the central nervous system. Cancer Res. 1997;57(13):2581-5. [179] Goodrich LV, Johnson RL, Milenkovic L, McMahon JA, Scott MP. Conservation of the hedgehog/patched signaling pathway from flies to mice: induction of a mouse patched gene by Hedgehog. Genes Dev. 1996;10(3):301-12. [180] Stone DM, Hynes M, Armanini M, Swanson TA, Gu Q, Johnson RL, et al. The tumour-suppressor gene patched encodes a candidate receptor for Sonic hedgehog. Nature. 1996;384(6605):129-34. [181] Marigo V, Davey RA, Zuo Y, Cunningham JM, Tabin CJ. Biochemical evidence that patched is the Hedgehog receptor. Nature. 1996;384(6605):176-9. [182] Motoyama J, Takabatake T, Takeshima K, Hui C. Ptch2, a second mouse Patched gene is co-expressed with Sonic hedgehog. Nat Genet. 1998;18(2):104-6. [183] Smyth I, Narang MA, Evans T, Heimann C, Nakamura Y, Chenevix-Trench G, et al. Isolation and characterization of human patched 2 (PTCH2), a putative tumour suppressor gene inbasal cell carcinoma and medulloblastoma on chromosome 1p32. Hum Mol Genet. 1999;8(2):291-7. [184] Kalderon D. Transducing the hedgehog signal. Cell. 2000;103(3):371-4. [185] Robbins DJ, Nybakken KE, Kobayashi R, Sisson JC, Bishop JM, Therond PP. Hedgehog elicits signal transduction by means of a large complex containing the kinesin-related protein costal2. Cell. 1997;90(2):225-34. [186] Kinzler KW, Bigner SH, Bigner DD, Trent JM, Law ML, O'Brien SJ, et al. Identification of an amplified, highly expressed gene in a human glioma. Science. 1987;236(4797):70-3. [187] Yoon JW, Kita Y, Frank DJ, Majewski RR, Konicek BA, Nobrega MA, et al. Gene expression profiling leads to identification of GLI1-binding elements in target genes and a role for multiple downstream pathways in GLI1-induced cell transformation. J Biol Chem. 2002;277(7):5548-55. Epub 2001 Nov 21. [188] Teh MT, Wong ST, Neill GW, Ghali LR, Philpott MP, Quinn AG. FOXM1 is a downstream target of Gli1 in basal cell carcinomas. Cancer Res. 2002;62(16):4773-80. [189] Fan H, Khavari PA. Sonic hedgehog opposes epithelial cell cycle arrest. J Cell Biol. 1999;147(1):71-6. [190] Cohen MM, Jr. The hedgehog signaling network. Am J Med Genet. 2003;123A(1):5-28. [191] Chen Y, Struhl G. Dual roles for patched in sequestering and transducing Hedgehog. Cell. 1996;87(3):553-63.
245
[192] Bale AE, Yu KP. The hedgehog pathway and basal cell carcinomas. Hum Mol Genet. 2001;10(7):757-62. [193] Jankowski JA, Bruton R, Shepherd N, Sanders DS. Cadherin and catenin biology represent a global mechanism for epithelial cancer progression. Mol Pathol. 1997;50(6):289-90. [194] Boonchai W, Walsh M, Cummings M, Chenevix-Trench G. Expression of beta-catenin, a key mediator of the WNT signaling pathway, in basal cell carcinoma. Arch Dermatol. 2000;136(7):937-8. [195] Hoodless PA, Wrana JL. Mechanism and function of signaling by the TGF beta superfamily. Curr Top Microbiol Immunol. 1998;228:235-72. [196] Saldanha G. The Hedgehog signalling pathway and cancer. J Pathol. 2001;193(4):427-32. [197] Nilsson M, Unden AB, Krause D, Malmqwist U, Raza K, Zaphiropoulos PG, et al. Induction of basal cell carcinomas and trichoepitheliomas in mice overexpressing GLI-1. Proc Natl Acad Sci U S A. 2000;97(7):3438-43. [198] Grachtchouk M, Mo R, Yu S, Zhang X, Sasaki H, Hui CC, et al. Basal cell carcinomas in mice overexpressing Gli2 in skin. Nat Genet. 2000;24(3):216-7. [199] Gorlin RJ, Goltz RW. Multiple nevoid basal-cell epithelioma, jaw cysts and bifid rib. A syndrome. N Engl J Med. 1960;262:908-12. [200] Gorlin RJ. Nevoid basal cell carcinoma syndrome. Dermatol Clin. 1995;13(1):113-25. [201] Shanley S, Ratcliffe J, Hockey A, Haan E, Oley C, Ravine D, et al. Nevoid basal cell carcinoma syndrome: review of 118 affected individuals. Am J Med Genet. 1994;50(3):282-90. [202] Evans DG, Ladusans EJ, Rimmer S, Burnell LD, Thakker N, Farndon PA. Complications of the naevoid basal cell carcinoma syndrome: results of a population based study. J Med Genet. 1993;30(6):460-4. [203] Stern RS. The mysteries of geographic variability in nonmelanoma skin cancer incidence. Arch Dermatol. 1999;135(7):843-4. [204] Gorlin RJ. Nevoid basal cell carcinoma (Gorlin) syndrome: unanswered issues. J Lab Clin Med. 1999;134(6):551-2. [205] Jacks T, Fazeli A, Schmitt EM, Bronson RT, Goodell MA, Weinberg RA. Effects of an Rb mutation in the mouse. Nature. 1992;359(6393):295-300. [206] Kreidberg JA, Sariola H, Loring JM, Maeda M, Pelletier J, Housman D, et al. WT-1 is required for early kidney development. Cell. 1993;74(4):679-91. [207] Brannan CI, Perkins AS, Vogel KS, Ratner N, Nordlund ML, Reid SW, et al. Targeted disruption of the neurofibromatosis type-1 gene leads to developmental abnormalities in heart and various neural crest-derived tissues. Genes Dev. 1994;8(9):1019-29. [208] Reis A, Kuster W, Linss G, Gebel E, Hamm H, Fuhrmann W, et al. Localisation of gene for the naevoid basal-cell carcinoma syndrome. Lancet. 1992;339(8793):617. [209] Farndon PA, Del Mastro RG, Evans DG, Kilpatrick MW. Location of gene for Gorlin syndrome. Lancet. 1992;339(8793):581-2. [210] Chenevix-Trench G, Wicking C, Berkman J, Sharpe H, Hockey A, Haan E, et al. Further localization of the gene for nevoid basal cell carcinoma syndrome (NBCCS) in

246
15 Australasian families: linkage and loss of heterozygosity. Am J Hum Genet. 1993;53(3):760-7. [211] Wicking C, Berkman J, Wainwright B, Chenevix-Trench G. Fine genetic mapping of the gene for nevoid basal cell carcinoma syndrome. Genomics. 1994;22(3):505-11. [212] Goldstein AM, Stewart C, Bale AE, Bale SJ, Dean M. Localization of the gene for the nevoid basal cell carcinoma syndrome. Am J Hum Genet. 1994;54(5):765-73. [213] Hahn H, Wicking C, Zaphiropoulous PG, Gailani MR, Shanley S, Chidambaram A, et al. Mutations of the human homolog of Drosophila patched in the nevoid basal cell carcinoma syndrome. Cell. 1996;85(6):841-51. [214] Johnson RL, Rothman AL, Xie J, Goodrich LV, Bare JW, Bonifas JM, et al. Human homolog of patched, a candidate gene for the basal cell nevus syndrome. Science. 1996;272(5268):1668-71. [215] Wicking C, Shanley S, Smyth I, Gillies S, Negus K, Graham S, et al. Most germ-line mutations in the nevoid basal cell carcinoma syndrome lead to a premature termination of the PATCHED protein, and no genotype-phenotype correlations are evident. Am J Hum Genet. 1997;60(1):21-6. [216] Gailani MR, Stahle-Backdahl M, Leffell DJ, Glynn M, Zaphiropoulos PG, Pressman C, et al. The role of the human homologue of Drosophila patched in sporadic basal cell carcinomas. Nat Genet. 1996;14(1):78-81. [217] Kunala S, Brash DE. Excision repair at individual bases of the Escherichia coli lacI gene: relation to mutation hot spots and transcription coupling activity. Proc Natl Acad Sci U S A. 1992;89(22):11031-5. [218] Drobetsky EA, Grosovsky AJ, Glickman BW. The specificity of UV-induced mutations at an endogenous locus in mammalian cells. Proc Natl Acad Sci U S A. 1987;84(24):9103-7. [219] Mullenders LH, Hazekamp-van Dokkum AM, Kalle WH, Vrieling H, Zdzienicka MZ, van Zeeland AA. UV-induced photolesions, their repair and mutations. Mutat Res. 1993;299(3-4):271-6. [220] Stewart GA, Lowrey JA, Wakelin SJ, Fitch PM, Lindey S, Dallman MJ, et al. Sonic hedgehog signaling modulates activation of and cytokine production by human peripheral CD4+ T cells. J Immunol. 2002;169(10):5451-7. [221] Xie J, Johnson RL, Zhang X, Bare JW, Waldman FM, Cogen PH, et al. Mutations of the PATCHED gene in several types of sporadic extracutaneous tumors. Cancer Res. 1997;57(12):2369-72. [222] Maesawa C, Tamura G, Iwaya T, Ogasawara S, Ishida K, Sato N, et al. Mutations in the human homologue of the Drosophila patched gene in esophageal squamous cell carcinoma. Genes Chromosomes Cancer. 1998;21(3):276-9. [223] McGarvey TW, Maruta Y, Tomaszewski JE, Linnenbach AJ, Malkowicz SB. PTCH gene mutations in invasive transitional cell carcinoma of the bladder. Oncogene. 1998;17(9):1167-72. [224] Vorechovsky I, Unden AB, Sandstedt B, Toftgard R, Stahle-Backdahl M. Trichoepitheliomas contain somatic mutations in the overexpressed PTCH gene: support for a gatekeeper mechanism in skin tumorigenesis. Cancer Res. 1997;57(21):4677-81. [225] Xie J, Murone M, Luoh SM, Ryan A, Gu Q, Zhang C, et al. Activating Smoothened mutations in sporadic basal-cell carcinoma. Nature. 1998;391(6662):90-2.
247
[226] Reifenberger J, Wolter M, Weber RG, Megahed M, Ruzicka T, Lichter P, et al. Missense mutations in SMOH in sporadic basal cell carcinomas of the skin and primitive neuroectodermal tumors of the central nervous system. Cancer Res. 1998;58(9):1798-803. [227] Fan H, Oro AE, Scott MP, Khavari PA, Higgins KM, Hu Z, et al. Induction of basal cell carcinoma features in transgenic human skin expressing Sonic Hedgehog Basal cell carcinomas in mice overexpressing sonic hedgehog. Nat Med. 1997;3(7):788-92. [228] Oro AE, Higgins KM, Hu Z, Bonifas JM, Epstein EH, Jr., Scott MP. Basal cell carcinomas in mice overexpressing sonic hedgehog. Science. 1997;276(5313):817-21. [229] Taipale J, Chen JK, Cooper MK, Wang B, Mann RK, Milenkovic L, et al. Effects of oncogenic mutations in Smoothened and Patched can be reversed by cyclopamine. Nature. 2000;406(6799):1005-9. [230] Cartegni L, Chew SL, Krainer AR. Listening to silence and understanding nonsense: exonic mutations that affect splicing. Nat Rev Genet. 2002;3(4):285-98. [231] Strange RC, El-Genidy N, Ramachandran S, Lovatt TJ, Fryer AA, Smith AG, et al. Susceptibility to Basal Cell Carcinoma: Associations with PTCH Polymorphisms. Ann Hum Genet. 2004;68(Pt 6):536-45. [232] McCarthy EM, Phillips JA, 3rd. Characterization of an intron splice enhancer that regulates alternative splicing of human GH pre-mRNA. Hum Mol Genet. 1998;7(9):1491-6. [233] Strange RC, El-Genidy N, Ramachandran S, Lovatt TJ, Fryer AA, Smith AG, et al. PTCH polymorphism is associated with the rate of increase in basal cell carcinoma numbers during follow-up: Preliminary data on the influence of an exon 12-exon 23 haplotype. Environ Mol Mutagen. 2004;44(5):469-76. [234] Chang-Claude J, Dunning A, Schnitzbauer U, Galmbacher P, Tee L, Wjst M, et al. The patched polymorphism Pro1315Leu (C3944T) may modulate the association between use of oral contraceptives and breast cancer risk. Int J Cancer. 2003;103(6):779-83. [235] Asplund A, Gustafsson AC, Wikonkal NM, Sela A, Leffell DJ, Kidd K, et al. PTCH codon 1315 polymorphism and risk for nonmelanoma skin cancer. Br J Dermatol. 2005;152(5):868-73. [236] Bazex A, Dupre A, Christol B. [Follicular atrophoderma, baso-cellular proliferations and hypotrichosis]. Ann Dermatol Syphiligr (Paris). 1966;93(3):241-54. [237] Oley CA, Sharpe H, Chenevix-Trench G. Basal cell carcinomas, coarse sparse hair, and milia. Am J Med Genet. 1992;43(5):799-804. [238] Goeteyn M, Geerts ML, Kint A, De Weert J. The Bazex-Dupre-Christol syndrome. Arch Dermatol. 1994;130(3):337-42. [239] Michaelsson G, Olsson E, Westermark P. The Rombo syndrome: a familial disorder with vermiculate atrophoderma, milia, hypotrichosis, trichoepitheliomas, basal cell carcinomas and peripheral vasodilation with cyanosis. Acta Derm Venereol. 1981;61(6):497-503. [240] Ashinoff R, Jacobson M, Belsito DV. Rombo syndrome: a second case report and review. J Am Acad Dermatol. 1993;28(6):1011-4. [241] van Steensel MA, Jaspers NG, Steijlen PM. A case of Rombo syndrome. Br J Dermatol. 2001;144(6):1215-8.

248
[242] Kraemer KH, Lee MM, Scotto J. Xeroderma pigmentosum. Cutaneous, ocular, and neurologic abnormalities in 830 published cases. Arch Dermatol. 1987;123(2):241-50. [243] Cleaver JE. Defective repair replication of DNA in xeroderma pigmentosum. Nature. 1968;218(142):652-6. [244] Setlow RB, Regan JD, German J, Carrier WL. Evidence that xeroderma pigmentosum cells do not perform the first step in the repair of ultraviolet damage to their DNA. Proc Natl Acad Sci U S A. 1969;64(3):1035-41. [245] Yakubu A, Mabogunje OA. Skin cancer in African albinos. Acta Oncol. 1993;32(6):621-2. [246] Orth G. Epidermodysplasia verruciformis: a model for understanding the oncogenicity of human papillomaviruses. Ciba Found Symp. 1986;120:157-74. [247] Guarneri B, Borgia F, Cannavo SP, Vaccaro M, Happle R. Multiple familial basal cell carcinomas including a case of segmental manifestation. Dermatology. 2000;200(4):299-302. [248] Moulin G, Guillaud V, Ferrier E, Marcellin X. [Unilateral basal cell epitheliomatosis]. Ann Dermatol Venereol. 1988;115(11):1188-90. [249] Bouscarat F, Avril MF, Prade M, Aurias A, Guillaume JC. [Unilateral basal cell epitheliomatosis]. Ann Dermatol Venereol. 1990;117(11):864-6. [250] Happle R. Nonsyndromic type of hereditary multiple basal cell carcinoma. Am J Med Genet. 2000;95(2):161-3. [251] Schaffer JV, Bolognia JL. The melanocortin-1 receptor: red hair and beyond. Arch Dermatol. 2001;137(11):1477-85. [252] Sturm RA. Skin colour and skin cancer - MC1R, the genetic link. Melanoma Res. 2002;12(5):405-16. [253] Cone RD, Lu D, Koppula S, Vage DI, Klungland H, Boston B, et al. The melanocortin receptors: agonists, antagonists, and the hormonal control of pigmentation. Recent Prog Horm Res. 1996;51:287-317; discussion 8. [254] Slominski A, Wortsman J, Luger T, Paus R, Solomon S. Corticotropin releasing hormone and proopiomelanocortin involvement in the cutaneous response to stress. Physiol Rev. 2000;80(3):979-1020. [255] Luger TA, Scholzen T, Grabbe S. The role of alpha-melanocyte-stimulating hormone in cutaneous biology. J Investig Dermatol Symp Proc. 1997;2(1):87-93. [256] Friedmann PS, Gilchrest BA. Ultraviolet radiation directly induces pigment production by cultured human melanocytes. J Cell Physiol. 1987;133(1):88-94. [257] Aberdam E, Romero C, Ortonne JP. Repeated UVB irradiations do not have the same potential to promote stimulation of melanogenesis in cultured normal human melanocytes. J Cell Sci. 1993;106(Pt 4):1015-22. [258] Abdel-Malek Z, Swope VB, Suzuki I, Akcali C, Harriger MD, Boyce ST, et al. Mitogenic and melanogenic stimulation of normal human melanocytes by melanotropic peptides. Proc Natl Acad Sci U S A. 1995;92(5):1789-93. [259] Hearing VJ. Biochemical control of melanogenesis and melanosomal organization. J Investig Dermatol Symp Proc. 1999;4(1):24-8. [260] Hunt G, Kyne S, Ito S, Wakamatsu K, Todd C, Thody A. Eumelanin and phaeomelanin contents of human epidermis and cultured melanocytes. Pigment Cell Res. 1995;8(4):202-8.
249
[261] Ortonne JP, Prota G. Hair melanins and hair color: ultrastructural and biochemical aspects. J Invest Dermatol. 1993;101(1 Suppl):82S-9S. [262] Menon IA, Persad S, Ranadive NS, Haberman HF. Effects of ultraviolet-visible irradiation in the presence of melanin isolated from human black or red hair upon Ehrlich ascites carcinoma cells. Cancer Res. 1983;43(7):3165-9. [263] Kobayashi N, Nakagawa A, Muramatsu T, Yamashina Y, Shirai T, Hashimoto MW, et al. Supranuclear melanin caps reduce ultraviolet induced DNA photoproducts in human epidermis. J Invest Dermatol. 1998;110(5):806-10. [264] Valverde P, Healy E, Jackson I, Rees JL, Thody AJ. Variants of the melanocyte-stimulating hormone receptor gene are associated with red hair and fair skin in humans. Nat Genet. 1995;11(3):328-30. [265] Kanetsky PA, Ge F, Najarian D, Swoyer J, Panossian S, Schuchter L, et al. Assessment of polymorphic variants in the melanocortin-1 receptor gene with cutaneous pigmentation using an evolutionary approach. Cancer Epidemiol Biomarkers Prev. 2004;13(5):808-19. [266] Smith R, Healy E, Siddiqui S, Flanagan N, Steijlen PM, Rosdahl I, et al. Melanocortin 1 receptor variants in an Irish population. J Invest Dermatol. 1998;111(1):119-22. [267] Bastiaens MT, ter Huurne JA, Kielich C, Gruis NA, Westendorp RG, Vermeer BJ, et al. Melanocortin-1 receptor gene variants determine the risk of nonmelanoma skin cancer independently of fair skin and red hair. Am J Hum Genet. 2001;68(4):884-94. Epub 2001 Mar 16. [268] Box NF, Wyeth JR, O'Gorman LE, Martin NG, Sturm RA. Characterization of melanocyte stimulating hormone receptor variant alleles in twins with red hair. Hum Mol Genet. 1997;6(11):1891-7. [269] Flanagan N, Healy E, Ray A, Philips S, Todd C, Jackson IJ, et al. Pleiotropic effects of the melanocortin 1 receptor (MC1R) gene on human pigmentation. Hum Mol Genet. 2000;9(17):2531-7. [270] Xu X, Thornwall M, Lundin LG, Chhajlani V. Val92Met variant of the melanocyte stimulating hormone receptor gene. Nat Genet. 1996;14(4):384. [271] Koppula SV, Robbins LS, Lu D, Baack E, White CR, Jr., Swanson NA, et al. Identification of common polymorphisms in the coding sequence of the human MSH receptor (MCIR) with possible biological effects. Hum Mutat. 1997;9(1):30-6. [272] Harding RM, Healy E, Ray AJ, Ellis NS, Flanagan N, Todd C, et al. Evidence for variable selective pressures at MC1R. Am J Hum Genet. 2000;66(4):1351-61. Epub 2000 Mar 24. [273] Rana BK, Hewett-Emmett D, Jin L, Chang BH, Sambuughin N, Lin M, et al. High polymorphism at the human melanocortin 1 receptor locus. Genetics. 1999;151(4):1547-57. [274] Palmer JS, Duffy DL, Box NF, Aitken JF, O'Gorman LE, Green AC, et al. Melanocortin-1 receptor polymorphisms and risk of melanoma: is the association explained solely by pigmentation phenotype? Am J Hum Genet. 2000;66(1):176-86. [275] Healy E, Jordan SA, Budd PS, Suffolk R, Rees JL, Jackson IJ. Functional variation of MC1R alleles from red-haired individuals. Hum Mol Genet. 2001;10(21):2397-402.

250
[276] Scott MC, Wakamatsu K, Ito S, Kadekaro AL, Kobayashi N, Groden J, et al. Human melanocortin 1 receptor variants, receptor function and melanocyte response to UV radiation. J Cell Sci. 2002;115(Pt 11):2349-55. [277] Jimbow K, Ishida O, Ito S, Hori Y, Witkop CJ, Jr., King RA. Combined chemical and electron microscopic studies of pheomelanosomes in human red hair. J Invest Dermatol. 1983;81(6):506-11. [278] Thody AJ, Higgins EM, Wakamatsu K, Ito S, Burchill SA, Marks JM. Pheomelanin as well as eumelanin is present in human epidermis. J Invest Dermatol. 1991;97(2):340-4. [279] Barsh GS. The genetics of pigmentation: from fancy genes to complex traits. Trends Genet. 1996;12(8):299-305. [280] Valverde P, Healy E, Sikkink S, Haldane F, Thody AJ, Carothers A, et al. The Asp84Glu variant of the melanocortin 1 receptor (MC1R) is associated with melanoma. Hum Mol Genet. 1996;5(10):1663-6. [281] Healy E, Todd C, Jackson IJ, Birch-Machin M, Rees JL. Skin type, melanoma, and melanocortin 1 receptor variants. J Invest Dermatol. 1999;112(4):512-3. [282] Jones FI, Ramachandran S, Lear J, Smith A, Bowers B, Ollier WE, et al. The melanocyte stimulating hormone receptor polymorphism: association of the V92M and A294H alleles with basal cell carcinoma. Clin Chim Acta. 1999;282(1-2):125-34. [283] Box NF, Duffy DL, Irving RE, Russell A, Chen W, Griffyths LR, et al. Melanocortin-1 receptor genotype is a risk factor for basal and squamous cell carcinoma. J Invest Dermatol. 2001;116(2):224-9. [284] Rees JL. The melanocortin 1 receptor (MC1R): more than just red hair. Pigment Cell Res. 2000;13(3):135-40. [285] Rampen FH, Fleuren BA, de Boo TM, Lemmens WA. Unreliability of self-reported burning tendency and tanning ability. Arch Dermatol. 1988;124(6):885-8. [286] McBride OW, Merry D, Givol D. The gene for human p53 cellular tumor antigen is located on chromosome 17 short arm (17p13). Proc Natl Acad Sci U S A. 1986;83(1):130-4. [287] Isobe M, Emanuel BS, Givol D, Oren M, Croce CM. Localization of gene for human p53 tumour antigen to band 17p13. Nature. 1986;320(6057):84-5. [288] Harris AL. Mutant p53--the commonest genetic abnormality in human cancer? J Pathol. 1990;162(1):5-6. [289] Lowe SW, Sherr CJ. Tumor suppression by Ink4a-Arf: progress and puzzles. Curr Opin Genet Dev. 2003;13(1):77-83. [290] Gannon JV, Greaves R, Iggo R, Lane DP. Activating mutations in p53 produce a common conformational effect. A monoclonal antibody specific for the mutant form. Embo J. 1990;9(5):1595-602. [291] Levine AJ. The p53 tumor suppressor gene and gene product. Princess Takamatsu Symp. 1989;20:221-30. [292] Rady P, Scinicariello F, Wagner RF, Jr., Tyring SK. p53 mutations in basal cell carcinomas. Cancer Res. 1992;52(13):3804-6. [293] Ziegler A, Leffell DJ, Kunala S, Sharma HW, Gailani M, Simon JA, et al. Mutation hotspots due to sunlight in the p53 gene of nonmelanoma skin cancers. Proc Natl Acad Sci U S A. 1993;90(9):4216-20.

251
[294] van der Riet P, Karp D, Farmer E, Wei Q, Grossman L, Tokino K, et al. Progression of basal cell carcinoma through loss of chromosome 9q and inactivation of a single p53 allele. Cancer Res. 1994;54(1):25-7. [295] Bolshakov S, Walker CM, Strom SS, Selvan MS, Clayman GL, El-Naggar A, et al. p53 mutations in human aggressive and nonaggressive basal and squamous cell carcinomas. Clin Cancer Res. 2003;9(1):228-34. [296] Moles JP, Moyret C, Guillot B, Jeanteur P, Guilhou JJ, Theillet C, et al. p53 gene mutations in human epithelial skin cancers. Oncogene. 1993;8(3):583-8. [297] Tommasi S, Denissenko MF, Pfeifer GP. Sunlight induces pyrimidine dimers preferentially at 5-methylcytosine bases. Cancer Res. 1997;57(21):4727-30. [298] Dumaz N, Drougard C, Sarasin A, Daya-Grosjean L. Specific UV-induced mutation spectrum in the p53 gene of skin tumors from DNA-repair-deficient xeroderma pigmentosum patients. Proc Natl Acad Sci U S A. 1993;90(22):10529-33. [299] Caron de Fromentel C, Soussi T. TP53 tumor suppressor gene: a model for investigating human mutagenesis. Genes Chromosomes Cancer. 1992;4(1):1-15. [300] Tornaletti S, Pfeifer GP. Slow repair of pyrimidine dimers at p53 mutation hotspots in skin cancer. Science. 1994;263(5152):1436-8. [301] Ouhtit A, Nakazawa H, Armstrong BK, Kricker A, Tan E, Yamasaki H, et al. UV-radiation-specific p53 mutation frequency in normal skin as a predictor of risk of basal cell carcinoma. J Natl Cancer Inst. 1998;90(7):523-31. [302] Wetmore C, Eberhart DE, Curran T. Loss of p53 but not ARF accelerates medulloblastoma in mice heterozygous for patched. Cancer Res. 2001;61(2):513-6. [303] Storey A, Thomas M, Kalita A, Harwood C, Gardiol D, Mantovani F, et al. Role of a p53 polymorphism in the development of human papillomavirus-associated cancer. Nature. 1998;393(6682):229-34. [304] McGregor JM, Harwood CA, Brooks L, Fisher SA, Kelly DA, O'Nions J, et al. Relationship between p53 codon 72 polymorphism and susceptibility to sunburn and skin cancer. J Invest Dermatol. 2002;119(1):84-90. [305] IARC. Human papillomaviruses. IARC monographs on the evaluation of the carcinogenic risk to humans. 1995(64):196-212. [306] Munoz N, Bosch FX, de Sanjose S, Herrero R, Castellsague X, Shah KV, et al. Epidemiologic classification of human papillomavirus types associated with cervical cancer. N Engl J Med. 2003;348(6):518-27. [307] Syverton JT. The pathogenesis of the rabbit papilloma-to-carcinoma sequence. Ann N Y Acad Sci. 1952;54(6):1126-40. [308] Iftner A, Klug SJ, Garbe C, Blum A, Stancu A, Wilczynski SP, et al. The prevalence of human papillomavirus genotypes in nonmelanoma skin cancers of nonimmunosuppressed individuals identifies high-risk genital types as possible risk factors. Cancer Res. 2003;63(21):7515-9. [309] Astori G, Lavergne D, Benton C, Hockmayr B, Egawa K, Garbe C, et al. Human papillomaviruses are commonly found in normal skin of immunocompetent hosts. J Invest Dermatol. 1998;110(5):752-5. [310] Iraji F, Kiani A, Shahidi S, Vahabi R. Histopathology of skin lesions with warty appearance in renal allograft recipients. Am J Dermatopathol. 2002;24(4):324-5.

252
[311] Hartevelt MM, Bavinck JN, Kootte AM, Vermeer BJ, Vandenbroucke JP. Incidence of skin cancer after renal transplantation in The Netherlands. Transplantation. 1990;49(3):506-9. [312] Harwood CA, Surentheran T, McGregor JM, Spink PJ, Leigh IM, Breuer J, et al. Human papillomavirus infection and non-melanoma skin cancer in immunosuppressed and immunocompetent individuals. J Med Virol. 2000;61(3):289-97. [313] Berkhout RJ, Tieben LM, Smits HL, Bavinck JN, Vermeer BJ, ter Schegget J. Nested PCR approach for detection and typing of epidermodysplasia verruciformis-associated human papillomavirus types in cutaneous cancers from renal transplant recipients. J Clin Microbiol. 1995;33(3):690-5. [314] de Jong-Tieben LM, Berkhout RJ, Smits HL, Bouwes Bavinck JN, Vermeer BJ, van der Woude FJ, et al. High frequency of detection of epidermodysplasia verruciformis-associated human papillomavirus DNA in biopsies from malignant and premalignant skin lesions from renal transplant recipients. J Invest Dermatol. 1995;105(3):367-71. [315] Shamanin V, zur Hausen H, Lavergne D, Proby CM, Leigh IM, Neumann C, et al. Human papillomavirus infections in nonmelanoma skin cancers from renal transplant recipients and nonimmunosuppressed patients. J Natl Cancer Inst. 1996;88(12):802-11. [316] de Villiers EM, Lavergne D, McLaren K, Benton EC. Prevailing papillomavirus types in non-melanoma carcinomas of the skin in renal allograft recipients. Int J Cancer. 1997;73(3):356-61. [317] Biliris KA, Koumantakis E, Dokianakis DN, Sourvinos G, Spandidos DA. Human papillomavirus infection of non-melanoma skin cancers in immunocompetent hosts. Cancer Lett. 2000;161(1):83-8. [318] Pierceall WE, Goldberg LH, Ananthaswamy HN. Presence of human papilloma virus type 16 DNA sequences in human nonmelanoma skin cancers. J Invest Dermatol. 1991;97(5):880-4. [319] Eliezri YD, Silverstein SJ, Nuovo GJ. Occurrence of human papillomavirus type 16 DNA in cutaneous squamous and basal cell neoplasms. J Am Acad Dermatol. 1990;23(5 Pt 1):836-42. [320] Kitasato H, Hillova J, Lenormand M, Hill M. Tumorigenicity of the E6 and E6-E7 gene constructions derived from human papillomavirus type 33. Anticancer Res. 1991;11(3):1165-72. [321] Woodworth CD, Waggoner S, Barnes W, Stoler MH, DiPaolo JA. Human cervical and foreskin epithelial cells immortalized by human papillomavirus DNAs exhibit dysplastic differentiation in vivo. Cancer Res. 1990;50(12):3709-15. [322] Schmitt A, Rochat A, Zeltner R, Borenstein L, Barrandon Y, Wettstein FO, et al. The primary target cells of the high-risk cottontail rabbit papillomavirus colocalize with hair follicle stem cells. J Virol. 1996;70(3):1912-22. [323] Struijk L, Bouwes Bavinck JN, Wanningen P, van der Meijden E, Westendorp RG, Ter Schegget J, et al. Presence of human papillomavirus DNA in plucked eyebrow hairs is associated with a history of cutaneous squamous cell carcinoma. J Invest Dermatol. 2003;121(6):1531-5. [324] Boxman IL, Russell A, Mulder LH, Bavinck JN, Schegget JT, Green A. Case-control study in a subtropical Australian population to assess the relation between non-melanoma skin cancer and epidermodysplasia verruciformis human papillomavirus DNA

253
in plucked eyebrow hairs. The Nambour Skin Cancer Prevention Study Group. Int J Cancer. 2000;86(1):118-21. [325] Boxman IL, Russell A, Mulder LH, Bavinck JN, ter Schegget J, Green A. Association between epidermodysplasia verruciformis-associated human papillomavirus DNA in plucked eyebrow hair and solar keratoses. J Invest Dermatol. 2001;117(5):1108-12. [326] Scheffner M, Werness BA, Huibregtse JM, Levine AJ, Howley PM. The E6 oncoprotein encoded by human papillomavirus types 16 and 18 promotes the degradation of p53. Cell. 1990;63(6):1129-36. [327] Caldeira S, Zehbe I, Accardi R, Malanchi I, Dong W, Giarre M, et al. The E6 and E7 proteins of the cutaneous human papillomavirus type 38 display transforming properties. J Virol. 2003;77(3):2195-206. [328] Purdie KJ, Pennington J, Proby CM, Khalaf S, de Villiers EM, Leigh IM, et al. The promoter of a novel human papillomavirus (HPV77) associated with skin cancer displays UV responsiveness, which is mediated through a consensus p53 binding sequence. Embo J. 1999;18(19):5359-69. [329] zur Hausen H, Schulte-Holthausen H, Klein G, Henle W, Henle G, Clifford P, et al. EBV DNA in biopsies of Burkitt tumours and anaplastic carcinomas of the nasopharynx. Nature. 1970;228(5276):1056-8. [330] Melnick JL, Lewis R, Wimberly I, Kaufman RH, Adam E. Association of cytomegalovirus (CMV) infection with cervical cancer: isolation of CMV from cell cultures derived from cervical biopsy. Intervirology. 1978;10(2):115-9. [331] Sanford EJ, Geder L, Laychock A, Rohner TJ, Jr., Rapp F. Evidence for the association of cytomegalovirus with carcinoma of the prostate. J Urol. 1977;118(5):789-92. [332] Hashiro GM, Horikami S, Loh PC. Cytomegalovirus isolations from cell cultures of human adenocarcinomas of the colon. Intervirology. 1979;12(2):84-8. [333] Zafiropoulos A, Tsentelierou E, Billiri K, Spandidos DA. Human herpes viruses in non-melanoma skin cancers. Cancer Lett. 2003;198(1):77-81. [334] Black HS. Potential involvement of free radical reactions in ultraviolet light-mediated cutaneous damage. Photochem Photobiol. 1987;46(2):213-21. [335] Ananthaswamy HN, Pierceall WE. Molecular mechanisms of ultraviolet radiation carcinogenesis. Photochem Photobiol. 1990;52(6):1119-36. [336] Tan KH, Meyer DJ, Gillies N, Ketterer B. Detoxification of DNA hydroperoxide by glutathione transferases and the purification and characterization of glutathione transferases of the rat liver nucleus. Biochem J. 1988;254(3):841-5. [337] Ketterer B, Meyer DJ. Glutathione transferases: a possible role in the detoxication and repair of DNA and lipid hydroperoxides. Mutat Res. 1989;214(1):33-40. [338] Ryberg D, Skaug V, Hewer A, Phillips DH, Harries LW, Wolf CR, et al. Genotypes of glutathione transferase M1 and P1 and their significance for lung DNA adduct levels and cancer risk. Carcinogenesis. 1997;18(7):1285-9. [339] Mannervik B, Awasthi YC, Board PG, Hayes JD, Di Ilio C, Ketterer B, et al. Nomenclature for human glutathione transferases. Biochem J. 1992;282(Pt 1):305-6. [340] Board PG, Baker RT, Chelvanayagam G, Jermiin LS. Zeta, a novel class of glutathione transferases in a range of species from plants to humans. Biochem J. 1997;328(Pt 3):929-35.
254
[341] Smith G, Stanley LA, Sim E, Strange RC, Wolf CR. Metabolic polymorphisms and cancer susceptibility. Cancer Surv. 1995;25:27-65. [342] Ryberg D, Kure E, Lystad S, Skaug V, Stangeland L, Mercy I, et al. p53 mutations in lung tumors: relationship to putative susceptibility markers for cancer. Cancer Res. 1994;54(6):1551-5. [343] Sarhanis P, Redman C, Perrett C, Brannigan K, Clayton RN, Hand P, et al. Epithelial ovarian cancer: influence of polymorphism at the glutathione S-transferase GSTM1 and GSTT1 loci on p53 expression. Br J Cancer. 1996;74(11):1757-61. [344] Lear JT, Heagerty AH, Smith A, Bowers B, Payne CR, Smith CA, et al. Multiple cutaneous basal cell carcinomas: glutathione S-transferase (GSTM1, GSTT1) and cytochrome P450 (CYP2D6, CYP1A1) polymorphisms influence tumour numbers and accrual. Carcinogenesis. 1996;17(9):1891-6. [345] Lear J, Heagerty A, Smith A, Bowers B, Jones P, Gilford J, et al. Polymorphism in detoxifying enzymes and susceptibility to skin cancer. Photochem Photobiol. 1996;63(4):424-8. [346] Yengi L, Inskip A, Gilford J, Alldersea J, Bailey L, Smith A, et al. Polymorphism at the glutathione S-transferase locus GSTM3: interactions with cytochrome P450 and glutathione S-transferase genotypes as risk factors for multiple cutaneous basal cell carcinoma. Cancer Res. 1996;56(9):1974-7. [347] Lear JT, Smith AG, Heagerty AH, Bowers B, Jones PW, Gilford J, et al. Truncal site and detoxifying enzyme polymorphisms significantly reduce time to presentation of further primary cutaneous basal cell carcinoma. Carcinogenesis. 1997;18(8):1499-503. [348] Lear JT, Smith AG, Bowers B, Heagearty AH, Jones PW, Gilford J, et al. Truncal tumor site is associated with high risk of multiple basal cell carcinoma and is influenced by glutathione S-transferase, GSTT1, and cytochrome P450, CYP1A1 genotypes, and their interaction. J Invest Dermatol. 1997;108(4):519-22. [349] Heagerty AH, Fitzgerald D, Smith A, Bowers B, Jones P, Fryer AA, et al. Glutathione S-transferase GSTM1 phenotypes and protection against cutaneous tumours. Lancet. 1994;343(8892):266-8. [350] Kanetsky PA, Holmes R, Walker A, Najarian D, Swoyer J, Guerry D, et al. Interaction of glutathione S-transferase M1 and T1 genotypes and malignant melanoma. Cancer Epidemiol Biomarkers Prev. 2001;10(5):509-13. [351] Fryer AA, Ramsay HM, Lovatt TJ, Jones PW, Hawley CM, Nicol DL, et al. Polymorphisms in glutathione S-transferases and non-melanoma skin cancer risk in Australian renal transplant recipients. Carcinogenesis. 2005;26(1):185-91. Epub 2004 Sep 30. [352] Lear JT, Smith AG, Strange RC, Fryer AA. Detoxifying enzyme genotypes and susceptibility to cutaneous malignancy. Br J Dermatol. 2000;142(1):8-15. [353] Setlow RB. DNA repair, aging, and cancer. Natl Cancer Inst Monogr. 1982;60:249-55. [354] Kutlaca R, Seshadri R, Morley AA. Effect of age on sensitivity of human lymphocytes to radiation. A brief note. Mech Ageing Dev. 1982;19(2):97-101. [355] Turner DR, Griffith VC, Morley AA. Ageing in vivo does not alter the kinetics of DNA strand break repair. Mech Ageing Dev. 1982;19(4):325-31.

255
[356] Kovacs E, Weber W, Muller H. Age-related variation in the DNA-repair synthesis after UV-C irradiation in unstimulated lymphocytes of healthy blood donors. Mutat Res. 1984;131(5-6):231-7. [357] D'Errico M, Calcagnile A, Iavarone I, Sera F, Baliva G, Chinni LM, et al. Factors that influence the DNA repair capacity of normal and skin cancer-affected individuals. Cancer Epidemiol Biomarkers Prev. 1999;8(6):553-9. [358] Lambert B, Ringborg U, Skoog L. Age-related decrease of ultraviolet light-induced DNA repair synthesis in human peripheral leukocytes. Cancer Res. 1979;39(7 Pt 1):2792-5. [359] Singh NP, Danner DB, Tice RR, Brant L, Schneider EL. DNA damage and repair with age in individual human lymphocytes. Mutat Res. 1990;237(3-4):123-30. [360] Licastro F, Franceschi C, Chiricolo M, Battelli MG, Tabacchi P, Cenci M, et al. DNA repair after gamma radiation and superoxide dismutase activity in lymphocytes from subjects of far advanced age. Carcinogenesis. 1982;3(1):45-8. [361] Wei Q, Lee JE, Gershenwald JE, Ross MI, Mansfield PF, Strom SS, et al. Repair of UV light-induced DNA damage and risk of cutaneous malignant melanoma. J Natl Cancer Inst. 2003;95(4):308-15. [362] Myskowski PL, Pollack MS, Schorr E, Dupont B, Safai B. Human leukocyte antigen associations in basal cell carcinoma. J Am Acad Dermatol. 1985;12(6):997-1000. [363] Cerimele D, Contu L, Carcassi C, Costa G, La Nasa G, Sanna E, et al. HLA and multiple skin carcinomas. Dermatologica. 1988;176(4):176-81. [364] Czarnecki DB, Lewis A, Nicholson I, Tait B. Multiple nonmelanoma skin cancer associated with HLA DR7 in southern Australia. Cancer. 1991;68(2):439-40. [365] Rompel R, Petres J, Kaupert K, Muller-Eckhardt G. Human leukocyte antigens and multiple basal cell carcinomas. Recent Results Cancer Res. 1995;139:297-302. [366] Czarnecki D, Nicholson I, Tait B, Nash C, Lewis A. HLA DR4 is associated with the development of multiple basal cell carcinomas and malignant melanoma HLA-DR1 is not a sign of poor prognosis for the development of multiple basal cell carcinomas Multiple basal cell carcinomas and HLA frequencies in southern Australia. Dermatology. 1993;187(1):16-8. [367] Czarnecki D, Lewis A, Nicholson I, Tait B, Nash C. HLA-DR1 is not a sign of poor prognosis for the development of multiple basal cell carcinomas. J Am Acad Dermatol. 1992;26(5 Pt 1):717-9. [368] Czarnecki D, Lewis A, Nicholson I, Tait B. Multiple basal cell carcinomas and HLA frequencies in southern Australia. J Am Acad Dermatol. 1991;24(4):559-61. [369] van 't Veer LJ, Burgering BM, Versteeg R, Boot AJ, Ruiter DJ, Osanto S, et al. N-ras mutations in human cutaneous melanoma from sun-exposed body sites. Mol Cell Biol. 1989;9(7):3114-6. [370] Pierceall WE, Goldberg LH, Tainsky MA, Mukhopadhyay T, Ananthaswamy HN. Ras gene mutation and amplification in human nonmelanoma skin cancers. Mol Carcinog. 1991;4(3):196-202. [371] Dajee M, Lazarov M, Zhang JY, Cai T, Green CL, Russell AJ, et al. NF-kappaB blockade and oncogenic Ras trigger invasive human epidermal neoplasia. Nature. 2003;421(6923):639-43.

256
[372] van der Schroeff JG, Evers LM, Boot AJ, Bos JL. Ras oncogene mutations in basal cell carcinomas and squamous cell carcinomas of human skin. J Invest Dermatol. 1990;94(4):423-5. [373] Cabrera T, Garrido V, Concha A, Martin J, Esquivias J, Oliva MR, et al. HLA molecules in basal cell carcinoma of the skin. Immunobiology. 1992;185(5):440-52. [374] Xie J, Aszterbaum M, Zhang X, Bonifas JM, Zachary C, Epstein E, et al. A role of PDGFRalpha in basal cell carcinoma proliferation. Proc Natl Acad Sci U S A. 2001;98(16):9255-9. [375] von Lintig FC, Dreilinger AD, Varki NM, Wallace AM, Casteel DE, Boss GR. Ras activation in human breast cancer. Breast Cancer Res Treat. 2000;62(1):51-62. [376] Susser M, Susser, E. Separating heredity and envrionment. I. Genetic and environmental indices. Epidemiology, Health and Society: Selected Papers. New York: Oxford University Press 1987:103-14. [377] Wooster R, Bignell G, Lancaster J, Swift S, Seal S, Mangion J, et al. Identification of the breast cancer susceptibility gene BRCA2. Nature. 1995;378(6559):789-92. [378] Miki Y, Swensen J, Shattuck-Eidens D, Futreal PA, Harshman K, Tavtigian S, et al. A strong candidate for the breast and ovarian cancer susceptibility gene BRCA1. Science. 1994;266(5182):66-71. [379] Smith JR, Freije D, Carpten JD, Gronberg H, Xu J, Isaacs SD, et al. Major Susceptibility Locus for Prostate Cancer on Chromosome 1 Suggested by a Genome-Wide Search. Science. 1996 November 22, 1996;274(5291):1371-4. [380] Hemminki K, Chen B. Familial risks for colorectal cancer show evidence on recessive inheritance. Int J Cancer. 2005;115(5):835-8. [381] Klein AP, Beaty TH, Bailey-Wilson JE, Brune KA, Hruban RH, Petersen GM. Evidence for a major gene influencing risk of pancreatic cancer. Genet Epidemiol. 2002;23(2):133-49. [382] Gruber SB, Thompson WD. A population-based study of endometrial cancer and familial risk in younger women. Cancer and Steroid Hormone Study Group. Cancer Epidemiol Biomarkers Prev. 1996;5(6):411-7. [383] Jia WH, Feng BJ, Xu ZL, Zhang XS, Huang P, Huang LX, et al. Familial risk and clustering of nasopharyngeal carcinoma in Guangdong, China. Cancer. 2004;101(2):363-9. [384] Hayward NK. Genetics of melanoma predisposition. Oncogene. 2003;22(20):3053-62. [385] Kaprio J, Teppo L. Basal cell carcinoma in identical twins. Br Med J. 1978;2(6134):436. [386] Milan T, Kaprio J, Verkasalo PK, Jansen CT, Teppo L, Koskenvuo M. Hereditary factors in basal cell carcinoma of the skin: a population-based cohort study in twins. Br J Cancer. 1998;78(11):1516-20. [387] Liddell K. Histologically proved basal cell carcinomas in identical twins. Br Med J. 1978;2(6130):97. [388] Clendenning WE, Block JB, Radde IG. BASAL CELL NEVUS SYNDROME. Arch Dermatol. 1964;90:38-53.
257
[389] Czarnecki D, Tait B, Nicholson I, Lewis A. Multiple non-melanoma skin cancer: evidence that different MHC genes are associated with different cancers. Dermatology. 1994;188(2):88-90. [390] Giles G. Report to National Cancer Control Initiative. Canberra; 1997. [391] Dwyer T, Muller HK, Blizzard L, Ashbolt R, Phillips G. The use of spectrophotometry to estimate melanin density in Caucasians. Cancer Epidemiol Biomarkers Prev. 1998;7(3):203-6. [392] Fujii K, Kohno Y, Sugita K, Nakamura M, Moroi Y, Urabe K, et al. Mutations in the human homologue of Drosophila patched in Japanese nevoid basal cell carcinoma syndrome patients. Hum Mutat. 2003;21(4):451-2. [393] Gail MH, Kessler L, Midthune D, Scoppa S. Two approaches for estimating disease prevalence from population-based registries of incidence and total mortality. Biometrics. 1999;55(4):1137-44. [394] Verdecchia A, Mariotto A, Capocaccia R, Gatta G, Micheli A, Sant M, et al. Incidence and prevalence of all cancerous diseases in Italy: trends and implications. Eur J Cancer. 2001;37(9):1149-57. [395] Doll R, Smith, P.G. Comparison between cancer registries: age standardised rates. In: Waterhouse J SK, Muir C, ed. Cancer incidence in five continents. Lyon: Scientific Publications 1982:chapter 11. [396] Statistics ABo. Mortality Tabulations: Commonwealth Government; 1991 1991. [397] Nordlund JJ, Boissy, R.E. The biology of melanocytes. In: Freinkel RK, Woodley, D.T., ed. The Biology of the Skin. New York: Parthenon Publishing Group Inc. 2001:113-33. [398] Dwyer T, Blizzard L, Ashbolt R, Plumb J, Berwick M, Stankovich JM. Cutaneous melanin density of Caucasians measured by spectrophotometry and risk of malignant melanoma, basal cell carcinoma, and squamous cell carcinoma of the skin. Am J Epidemiol. 2002;155(7):614-21. [399] van der Mei IA, Blizzard L, Stankovich J, Ponsonby AL, Dwyer T. Misclassification due to body hair and seasonal variation on melanin density estimates for skin type using spectrophotometry. J Photochem Photobiol B. 2002;68(1):45-52. [400] O'Donovan MC, Oefner PJ, Roberts SC, Austin J, Hoogendoorn B, Guy C, et al. Blind analysis of denaturing high-performance liquid chromatography as a tool for mutation detection. Genomics. 1998;52(1):44-9. [401] Liu W, Smith DI, Rechtzigel KJ, Thibodeau SN, James CD. Denaturing high performance liquid chromatography (DHPLC) used in the detection of germline and somatic mutations. Nucleic Acids Res. 1998;26(6):1396-400. [402] Jones AC, Austin J, Hansen N, Hoogendoorn B, Oefner PJ, Cheadle JP, et al. Optimal temperature selection for mutation detection by denaturing HPLC and comparison to single-stranded conformation polymorphism and heteroduplex analysis. Clin Chem. 1999;45(8 Pt 1):1133-40. [403] Xiao W, Oefner PJ. Denaturing high-performance liquid chromatography: A review. Hum Mutat. 2001;17(6):439-74. [404] Oncology ASoC. American Society of Clinical Oncology update: Genteic testing for cancer susceptibility. Journal of Clinical Oncology. 2003;21:2397-406.
258
[405] Boxman IL, Berkhout RJ, Mulder LH, Wolkers MC, Bouwes Bavinck JN, Vermeer BJ, et al. Detection of human papillomavirus DNA in plucked hairs from renal transplant recipients and healthy volunteers. J Invest Dermatol. 1997;108(5):712-5. [406] Dokianakis DN, Koumantaki E, Billiri K, Spandidos DA. P53 codon 72 polymorphism as a risk factor in the development of HPV-associated non-melanoma skin cancers in immunocompetent hosts. Int J Mol Med. 2000;5(4):405-9. [407] O'Connor DP, Kay EW, Leader M, Atkins GJ, Murphy GM, Mabruk MJ. p53 codon 72 polymorphism and human papillomavirus associated skin cancer. J Clin Pathol. 2001;54(7):539-42. [408] Marshall SE, Bordea C, Wojnarowska F, Morris PJ, Welsh KI. p53 codon 72 polymorphism and susceptibility to skin cancer after renal transplantation. Transplantation. 2000;69(5):994-6. [409] Bastiaens MT, Struyk L, Tjong AHSP, Gruis N, ter Huurne J, Westendorp RG, et al. Cutaneous squamous cell carcinoma and p53 codon 72 polymorphism: a need for screening? Mol Carcinog. 2001;30(1):56-61. [410] Brown KM, MacGregor S, Montgomery GW, Craig DW, Zhao ZZ, Iyadurai K. Common sequence variants on 20q11.22 confer melanoma susceptibility. Nature Genetics. 2008 Jul; 40(7):838-40.