the general framework of timss 2011 · web view2018-01-31 · students can apply their knowledge...
TRANSCRIPT

Republic of Tunisia
Ministry of Education
The National Center for Pedagogic Innovation and Research in Education
Department of Evaluation
Participation of Tunisia in the International Assessment
"Trends in International Mathematics and Science Study"
TIMSS 2011
Report 2013
Chedia Belaid Mhirsi
Souad Abelwahed
Selmi Houda Helali
Soumaya Ben Khalifa

Table of Contents
I. The General Framework of the Tunisian Participation in TIMSS 2011 31. Objectives of the Study 32. The Methodological Framework of the Comparative International Study (TIMSS 2011) 4
II. Students Results in the TIMSS 2011 Mathematics Assessment 81. Students' Performance in the Mathematics Assessment 82. The Impact of Some Variables on the Students' Scores in Mathematics 163. Variables Related to Teachers 264. Variables Related to Students 30
III. Students Results in the TIMSS 2011 Science Assessment 371. Students' Results in the Science Assessment 372. The Impact of Some Variables on Students' Achievement in Science Assessment 443. Variables Related to Teachers 564. Variables Related to Students 59
IV. Summary 65V. Table of Figures 66VI. Table of Graphs 68VII. Table of Charts 69 VIII. ReferencesVIII. Table of charts……………………………………………………………………………………………………………………………………………………………………………………………… 69
ii

Introduction
Building on recent educational reforms, the educational system in Tunisia has focused on the enforcement of free, compulsory public education.
In order to bridge the socio-economic gaps that exist in our society and aspiring to greater national goals, it is imperative for us to eliminate the obstacles along the path of education, and focus on improving knowledge and skills that empower young generations to keep up with the needs and challenges of modern societies.
Examining the current state of affairs is a prerequisite to any educational reform. National and international assessment studies provide real indicators for measuring levels of performance, as well as provide an understanding of relevant variables that impact performance.
Accordingly, the National Centre for Pedagogic Innovation and Research in Education, which is affiliated to the Tunisia Ministry of Education, participated in the Trends in International Mathematics and Science Study (TIMSS 2011).It is one of the most important international assessment tools, as it provides a significant qualitative and quantitative dataset used in educational policymaking and quality improvements by decision-makers, researchers,teachers, and other stakeholders in the field of education
This document provides a selection of data concerning Tunisia from the report published by the IEA concerning TIMSS 2011 session. It presents average students' results at grade 4 and 8 in mathematics and science and links it to variables related to the students (especially the percentage of repeaters students and those who dropped out of school), teachers, schools, and educational programs in a comparative approach with other participating countries and in a longitudinal perspective.
1

I- The General Framework of TIMSS 2011
TIMSS 2011 is based on the evaluation of grade 4 and 8 students' results in mathematics and science. This research field helps in objectively comparing between the international trends in teaching basic sciences; school systems; and teaching and learning conditions. It provides key players and decision makers in the education sector with databases and results that would help them make informative informed decisions and develop improvement plans.
This study is conducted regularly every four years under the supervision the International Association for the Evaluation of Educational Achievement (IEA), which carries out most the of the study and assigns the technical part to a number of international institutions, namely:
International Study Centre Statistics Canada Educational Testing Service IEA Secretariat Data Processing Center Hamburg
Conducted for the first time in 1995, this international assessment study currently includes 63 countries from all over the world. Tunisia has been participating in this study since 1999 for grade 8 students and since 2003 for grade 4 students.
1. Objectives of the Study
The TIMSS seeks to achieve several goals and objectives, most important of which are:
Following up on the development of the educational systems and programs, and the achievements of fourth and eighth grade students in
mathematics and science.
Learning about other educational practices applied in different parts of the world and sharing related experiences.
Improving the process of teaching and learning science and mathematics based on accurate and scientific findings regarding students'
achievements, their learning and home environment, in addition to other data related to teaching processes and programs.
2

2. The Methodological Framework of the Comparative International Study (TIMSS 2011)
2.1. Research Subjects
The assessment study TIMSS 2011 used 5068 fourth grade students from 222 schools and 330 mathematics and science teachers 1as research subjects, in addition to 5539 eighth grade students and 633 teachers2.
2.2. Tools
The study is based on the following tools: Exercises in mathematics and science. Surveys targeting students, teachers, and directors of educational institutions to compile data on the process of teaching and learning
mathematics and science, and other information related to families, schools, teaching and learning environment, as well as other psychological and material circumstances affecting education.
a) The Mathematics Assessment:
The study is organized around two main dimensions:
The Content Domains in Mathematics
Mathematics is divided into four main domains: numbers, algebra, geometry, and statistics, which were represented in the assessment at fixed percentages, as demonstrated in the following table:
_________________________
1 - Sometimes a teacher may teach Mathematics and Science at the same time.
2 -Each subject is taught by a different teacher; a teacher for Mathematics, a second for physics and a third for Life and Earth Sciences.
3

Table No. 1: Classification of TIMSS 2011 Mathematics Assessment by Content Domains at Fourth and Eighth Grades
Content Domains PercentageFourth Grade Eighth Grade
Numbers 50% 29%Algebra Not applicable 33%Geometry 35% 19%Data 15% 19%
The Cognitive Domains in Mathematics
This comparative assessment study classifies mathematical knowledge and skills into cognitive domains that can be tested through questions represented at percentages stated in the following table:
Table No. 2: Classification of the TIMSS 2011 Mathematics Assessment by Cognitive Domains at Fourth and Eighth Grades
Cognitive Domains PercentageFourth Grade Eighth Grade
Knowing 39% 36%Applying 41% 39%Reasoning 20% 25%
It is worth noting that this study defines four levels of mathematics skills acquired by students. The following table shows the levels of proficiency in mathematics for fourth grade students:
4

Table No. 3: The Level of Proficiency in Mathematics
Level Acquired skillsAdvanced
(625 points)
Students can apply their understanding and knowledge in a variety of relatively complex situations and explain their reasoning .They can solve a variety of multi-step word problems involving whole numbers, including proportions. Students at this level show an increasing understanding of fractions and decimals .Students can apply geometric knowledge of a range of two-and three-dimensional shapes in a variety of situations .They can draw a conclusion from data in a table and justify their conclusion.
High
(550 points)
Students can apply their knowledge and understanding to solve problems .Students can solve word problems involving operations with whole numbers .They can use their understanding of place value to solve problems. Students can extend patterns to find a later specified term. Students demonstrate understanding of line symmetry and geometric properties. Students can interpret and use data in tables and graphs to solve problems. They can use information in pictographs and tally charts to complete bar graphs.
Intermediate
(475 points)
Students can apply basic mathematical knowledge in simple situations. They demonstrate an understanding of whole numbers and some understanding of fractions. Students can visualize three- dimensional shapes from two- dimensional ones. They can read bar graphs, pictographs and tables to solve simple problems.
Low
(400points)
Students have some basic mathematical knowledge. Students can add and subtract whole numbers .They have some recognition of parallel and perpendicular lines, familiar geometric shapes and use designs. They can read and complete simple bar graphs and tables.
5

b) The Science Assessment
The Content Domains in Science:
The subject is classified into main domains represented in the assessment at fixed percentages. At grade 4, TIMSS tests students’ knowledge in three content domains, and tests eighth grade students' knowledge in four content domains, as specified in the two following tables:
Table No. 4: Classification of the TIMSS 2011 Science Assessment by Content Domains at Fourth Grade.
Content Domains PercentageLife Science 45%Physical Science 35%Earth Science 20%
Table No. 5: Classification of the TIMSS 2011 Science Assessment by Content Domains at Eighth Grade
Content Domains PercentageBiology 35%Chemistry 20%Physics 25%Earth Science 20%
The Cognitive Domains of Science
6

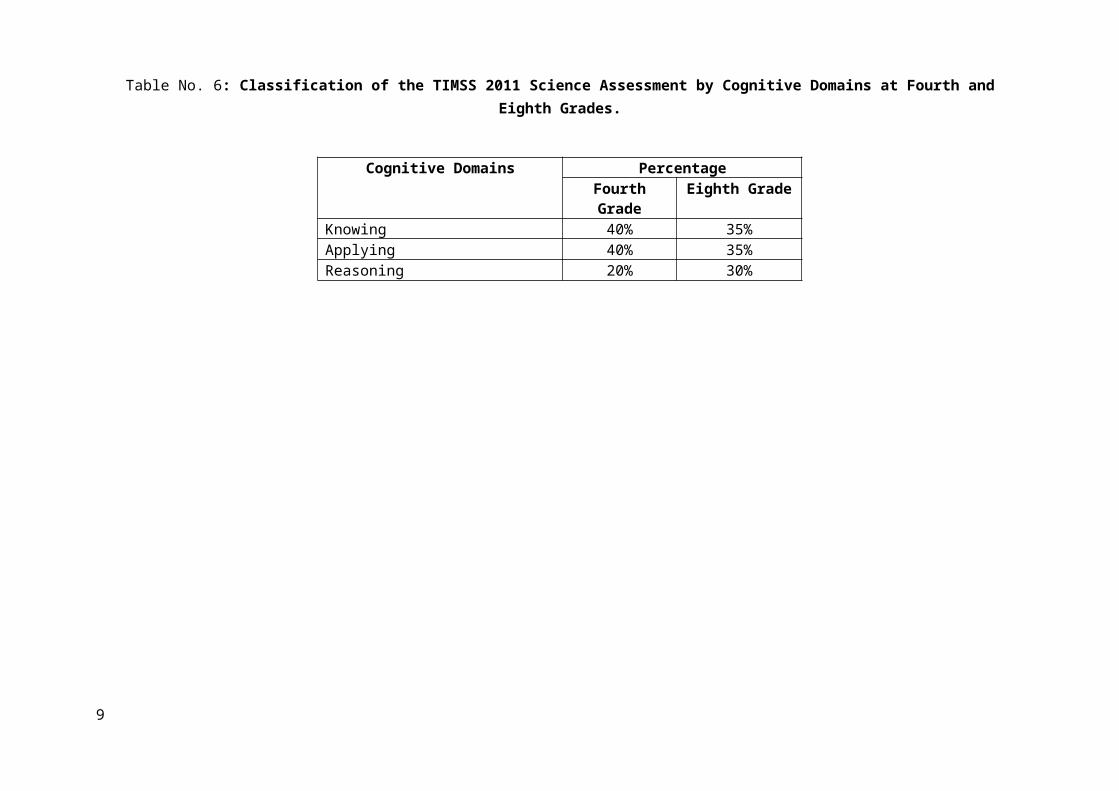
The cognitive domains are represented in the TIMSS science assessment at the percentages stated in the following table:
Table No. 6: Classification of the TIMSS 2011 Science Assessment by Cognitive Domains at Fourth and Eighth Grades.
Cognitive Domains PercentageFourth Grade Eighth Grade
Knowing 40% 35%Applying 40% 35%Reasoning 20% 30%
7

II-Tunisian Participation in TIMSS 2011: Students Results in the Mathematics Assessment
1. Students' Performance in the Mathematics Assessment
The fourth grade students' average score in the mathematics assessment was 359 points, compared to the TIMSS scale average, which is set at 500 points. As a result, Tunisia ranked low (47/50), which indicates the presence of serious problems in the early years of basic education.
Table No. 7: Country Ranking Based on Fourth Grade Students' Score in TIMSS 2011 Mathematics Assessment.
Rank Country Average Score1 Singapore 6062 Korea 6053 Hong Kong 6024 China 5915 Japan 5856 Northern Ireland 5627 Belgium 5498 Finland 5459 England 54210 Russia 54211 The United States 54112 Netherlands 54013 Denmark 53714 Lithuania 53415 Portugal 53216 Germany 52817 Ireland 52718 Serbia 51619 Australia 51620 Hungary 51521 Slovenia 513
8

Rank Country Average Score22 Czech Republic 51123 Austria 50824 Italy 50825 Slovak Republic 50726 Sweden 50427 Kazakhstan 501TIMSS 2011 Scale Average 50028 Malta 49629 Norway 49530 Croatia 49031 New Zealand 48632 Spain 48233 Romania 48234 Poland 48135 Turkey 46936 Azerbaijan 46337 Chile 46238 Thailand 45839 Armenia 45240 Georgia 45041 Bahrain 43642 United Arab Emirates 43443 Iran 43144 Qatar 41345 Saudi Arabia 41046 Oman 38547 Tunisia 35948 Kuwait 34249 Morocco 33550 Yemen 248
9
The following graph shows the change in students' scores in the TIMSS assessments in the years 2003, 2007, and 2011.
2003 2007 2011310
320
330
340
350
360
370
339
327
359
Graph No.1: The Change in Fourth Grade Students’ Score in TIMSS Mathematics Assessment
The difference in average scores of fourth grade students from 2007 to 2011 (32points) is statistically significant.
The average mathematics score increased by 32 points compared to the previous assessment and the science score went up by 27 points, which is the highest score achieved by Tunisia since its first participation in TIMSS in 2003.
This increase in the average score is reflected in all content domains, which could be explained by the implementation of the pre-school year system since 2004/2005 as part of the basic education (not compulsory) and the development of early childhood education. Around 82% of the children go to preschool, of which 30% are public schools.
Concerning the eighth grade average score in the mathematics assessment, students scored 425 points. Here Tunisia is ranked 30 out of 42 participating countries.
10

Table No. 8: Ranking of the Countries Based on Eighth Grade Students' Score in TIMSS 2011 Mathematics Assessment
Rank Country Average Score1 Korea 6132 Singapore 6113 China 6094 Hong Kong 5865 Japan 5706 Russia 5397 Israel 5168 Finland 5149 The United States 50910 England 50711 Australia 50512 Slovenia 50513 Lithuania 502 TIMSS 2011 Scale Average 50015 Italy 49816 New Zealand 48817 Kazakhstan 48718 Sweden 48419 Ukraine 47920 Norway 47521 Armenia 46722 Romania 45823 United Arab Emirates 45624 Turkey 45225 Lebanon 44926 Malaysia 44027 Georgia 43128 Thailand 42729 Macedonia 42630 Tunisia 425
11

Rank Country Average Score31 Chile 41632 Iran 41533 Qatar 41034 Bahrain 40935 Jordan 40636 Palestine 40437 Saudi Arabia 39438 Indonesia 38639 Syria 38040 Morocco 37141 Oman 36642 Ghana 331
As indicated in the table, eighth grade students’ average scores differ from those of fourth grade students. In fact, the students that were assessed in the fourth grade in 2007 had reached the eighth grade by 2011 and thus were assessed at the eighth grade in 2011. Nevertheless, we cannot assume that students' average scores had improved during the past 4 years, since only 64.4 % of the students of the same age group were promoted from grade 7 to grade 8 in the academic year 2010-20113 so more than 35 % of the students were not promoted to grade 8, of whom 22.8% failed and 12.7 % dropped out of school.
_______________________
3 -Ministry of Education—School Statistics 2011-2012—page 129
12

Eighth graders' average scores decreased between 1999 and 2003, but an increase was recorded in 2011 assessments. These changes are shown in the following graph:
Graph No. 2: The Change in Eighth Graders' Score in TIMSS Mathematics Assessment
1.1 . Students' Mathematics Content Domain Scores:
Fourth graders' mathematics content domains are classified as follows:
Table No. 9: Average Mathematics Content Domain Scores of Fourth Graders
13

Content Domains Average Score National Average International AverageNumbers 390
Geometry 329359 500Data 300
As shown in the table, the average scores in the three content domains are below the international average, and the highest students' average scores was achieved in the numbers domain.
Eighth graders' mathematics content domains are classified as follows:
Table No. 10: Average Mathematics Content Domain Scores of Eighth Graders
Content Domains Average Score National Average International AverageNumbers 431
Geometry 426
425 500Algebra 419Data 398
As indicated in the above table, students' scores differ from one domain to the other, and the highest students' average scores were achieved in the numbers domain.
1.2. Students' Mathematics Cognitive Domain Scores
Fourth graders' mathematics cognitive domains scores are classified as follows:
14

Table No. 11: Average Mathematics Cognitive Domain Scores of Fourth Graders
Cognitive Domains Average Score National Average International AverageKnowing 370
Applying 346359 500Reasoning 335
As shown in the table, students' average scores in the reasoning domain, which requires a higher level of skills, are lower than their average scores in the two other domains.
Eighth graders' mathematics cognitive domains scores are classified as follows:
Table No. 12: Average Mathematics Cognitive Domain Scores of Eighth Graders
Cognitive Domains Average Score National Average International AverageKnowing 425
Applying 421425 500Reasoning 423
1.3. Students’ Performance according to the TIMSS international benchmarks
TIMSS defines four levels of student achievement in mathematics: advanced, high, intermediate, and low. Each level describes the skills and knowledge acquired by the students.
Table No. 13: The Classification of Fourth Graders’ Scores according to the Four Levels of Achievement
Level4 National Percentage International PercentageAdvanced
(625 scores)0 4
High 2 28
15

(550 scores)Intermediate(475 scores) 11 69
Low(400 scores) 35 90
________________________
4 -All these are accumulative. If a student reaches a level, then he/she must have reached all the preceding levels, but failed to reach a higher one
These results show that only 2 % of fourth graders reached the advanced benchmark compared to 35 % who performed low benchmark. Around 65 % of the students were outside classification which means they did not reach the low TIMSS international mathematics benchmark.
Although Tunisia is among the countries, which ranked low according to TIMSS international benchmarks, this assessment shows a decrease in the number of students who had low assessment scores and an improvement in their achievements compared to previous assessments. There is also an increase in the scores of students, who reached high benchmark (chapter 1: Trends in Mathematics Achievement page54).
Concerning the eighth graders, results show that only 5 % of the students reached high benchmark and 61 % reached low benchmark. These results were below the average international percentage for each level.
Table No. 14: The Classification of Eighth Graders’ Scores according to the Four Levels of Achievement
Level4 National Percentage International PercentageAdvanced
(625 scores) 0 3
High(550 scores) 5 17
Intermediate(475 scores) 25 46
Low(400 scores) 61 75
16

It is also worth noting that 39% of the students were not part of the classification which means they did not reach the low TIMSS international mathematics benchmark.
_________________________
4 -All these are accumulative. If a student reaches a level, then he/she must have reached all the preceding levels, but failed to reach a higher one
2. The Impact of Some Variables on the Students' Scores in Mathematics
2.1. Difference in Students' Average Scores Classified by Gender
At grade 4, there was no measurable difference between the average mathematics scores of boys and girls. At grade 8, boys (433 scores) outperformed girls (417 scores) by 16 score points and this difference is considered statistically significant.
At grade 4, comparing TIMSS international average score with students' mathematics average score shows a significant difference in the average mathematics scores of boys and girls, in favor of girls, in the three content domains, as indicated in the below table.
Table No. 15: Classification of Fourth Grade boys and girls’ Mathematics Average Score by Content Domains
Mathematics Content Domains
Boys Average Score Girls Average Score National Average Score
Numbers 389 391 359Geometry 324 336
Data 295 305
At grade 8, there is a significant difference in the average mathematics scores of boys and girls in numbers and geometry, in favor of boys.
17

Table No. 16: Classification of Eighth Grade Boys and Girls’ Mathematics Average Score by Content Domains
Mathematics Content Domains
Boys Average Score Girls Average Score National Average Score
Numbers 444 420 425Geometry 435 418
Algebra 421 417Data 408 389
Concerning boys and girls average score in cognitive domains, results show a statically significant difference between fourth grade boys and girls in the “knowing" domain, in favor of girls. At grade 8, boys outperformed girls in all cognitive domains as indicated in the following chart.
8th grade 4th grade
knowing Applying Reasoning400
410
420
430
440
433 432 431
417
412414
Knowing Applying Reasoning310
320
330
340
350
360
370
380
365
344
332
376
346
337
Girls
Boys
18

Graph No. 3: Boys and Girls’ Average Scores in Mathematics Cognitive Domains2.2. Variables Related to Students’ family Surroundings
Home Environment:The study proves that achieving high mathematics scores is somehow related to the availability of some essential resources at home, such as: books, computers, and Internet connection.
The average scores of eighth graders, who answered this part of the survey, are shown in the below table.
Table No. 17: Eighth Grade Students’ Average Scores according to the Availability of Essential Home ResourcesResources Percentage of Students Average Scores
Numerous Resources 3 493Some Resources 58 436Few Resources 38 403
Family Economic StatusFourth and eighth grade students' scores classified according to their families economic conditions as follows:
4th grade 8th grade
More affluent Neither more affluent nor more disadvantaged More disadvantagedMore affluent Neither more affluent nor more disadvantaged More disadvantaged
Chart No. 1: Students' Scores Classified by their Families Economic Status
19
380 points334 points
370 points
432 points411 points
439 points

According to the above pie charts, the higher the families’ economic conditions are, the better students’ average scores are. This difference is increasing when comparing fourth and eighth graders’ scores. In fact there is a little influence of social environment; we can deduce that the whole system constitutes an important factor which explains the students’ low scores.
2.3. Variables Related to Students' School Environment
School EnvironmentTIMSS results proved that lack of facilities and equipment in any educational institution (such as: infrastructure, computers, and books) negatively affects students' scores in mathematics. Around 86% of sampled students at grade 4, and 94% of students at grade 8 are enrolled at schools lacking these facilities and equipment.It is noteworthy that 51% of primary schools suffer from lack of computers, as around 6 students or more share one computer and about 18% of schools do not have computer on their premises. Around 86% of sampled preparatory schools do not have enough computers and assign one computer to every 6 students or more.
2.4. Variables Related to Mathematics Teaching Programs
At grade 4, the TIMSS mathematics assessment includes 18 subjects, of which 7 subjects only are taught within the Tunisian educational program. These subjects are classified according to the mathematics content domains as follows:
Table No. 18: The Classification of TIMSS and the Fourth Grade National Education Program Subjects by Mathematics Content Domains
Numbers Geometry and Measurement
Data Total Number of Subject
TIMSS Subjects 8 7 3 18National Program Subjects 4 2 1 7
20

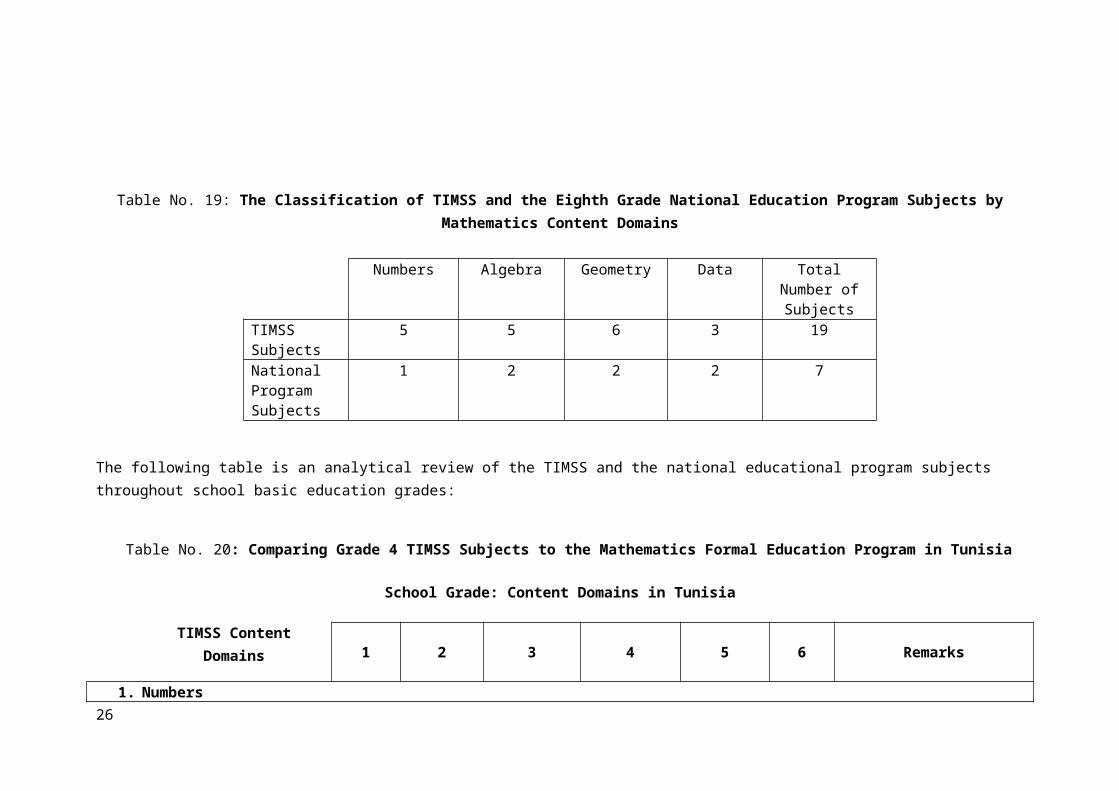
The TIMSS mathematics assessment for grade 8 includes 19 subjects, of which 7 subjects only are taught as part of the Tunisian educational program. These subjects are classified according to the mathematics content domains as follows:
Table No. 19: The Classification of TIMSS and the Eighth Grade National Education Program Subjects by Mathematics Content Domains
Numbers Algebra Geometry Data Total Number of Subjects
TIMSS Subjects 5 5 6 3 19National Program Subjects
1 2 2 2 7
The following table is an analytical review of the TIMSS and the national educational program subjects throughout school basic education grades:
Table No. 20: Comparing Grade 4 TIMSS Subjects to the Mathematics Formal Education Program in Tunisia
School Grade: Content Domains in Tunisia
TIMSS Content Domains 1 2 3 4 5 6 Remarks
1. Numbersa) The concept of whole
numbers, place value, and order.
x x X x Starts at grade 1 with two-digit numbers up to six-digit numbers at grade 4.
b) Addition, subtraction, multiplication and/or division using whole numbers.
Addition Addition and Subtraction
Addition, subtraction, and
Addition, subtraction, multiplication,
x x Operations are introduced to students gradually, and then taught in more detail later.
21

School Grade: Content Domains in Tunisia
TIMSS Content Domains 1 2 3 4 5 6 Remarks
multiplication and divisionc) Understanding fractions
(fractions as part of whole numbers or group of numbers, or a place on the fraction number line)
Fractions and mental math only
Introduction Learning Students at grade 4 learn through mental math how to calculate half or a quarter of a number less than 100. Fractions are introduced to dents at grade 5 and they learn to use fractions to solve operations at grade 6.
d) Addition and subtraction using fractions.
x Operations with fractions are taught at grade 6.
e) Understanding decimals, including place value and ordering decimals.
x x Teaching decimals and operations with decimals starts at grade 5 and is continued in grade 6.
f) Addition and subtraction using decimals.
x x Teaching decimals and operations with decimals starts at grade 5 and is continued in grade 6.
g) Numerical expressions (finding the missing number and extending patterns to find a later specified term using numerical expressions).
x In primary education, numerical expressions mean mixed operations of addition and subtraction without using patterns.
h) Numerical patterns (following the number pattern and finding the missing numbers).
The program teaches counting according to several steps, without introducing the concept of numerical patterns.
2. Geometric Shapes and Measurement a) Lines: measurements, line x Introduced at grade 4 and
22

School Grade: Content Domains in Tunisia
TIMSS Content Domains 1 2 3 4 5 6 Remarks
estimates, perpendicular and parallel lines.
taught in more detail in grades 5 and 6.
b) Drawing and comparing angles.
x Introduced at grade 4 and taught in more detail in grades 5 and 6.
c) Using irregular coordinate systems to determine the position of a point or other geometric element.
x Introduced at grade 4 and taught in more detail in grades 5 and 6.
d) The properties of geometric shapes.
X x Introduced at grades 3 and 4 and taught in more detail in grades 5 and 6.
e) Symmetry and rotation x x Axial symmetry is introduced at grade 4 and taught in more detail in grades 5 and 6.
f) Relations between two and three-dimensional objects
x Three-dimensional objects are introduced in grade 6 (cubes and cuboids)
g) Calculating and estimating area, perimeter, and volume.
Fourth graders are taught how to calculate the perimeter and they learn the concept of the area of a shape without calculating it. Volumes are not taught in primary education.
3. Data Displaya) Interpreting data from tables,
illustrations, bar or pie charts. This is not included as part of the formal education program, however the school book comprises data tables and illustrations, without any bar
23

School Grade: Content Domains in Tunisia
TIMSS Content Domains 1 2 3 4 5 6 Remarks
or pie charts.b) Drawing conclusions from
data in a table.This is not included in the program nor in the school book.
c) Data display using drawings, illustrations, and bar graphs.
This is not included in the program, but the school book, in some cases, displays data using tables and illustrations.
TIMSS content domains which are not taught as part of the Tunisian formal education program
Table No. 21: Comparing Grade 8 TIMSS Subjects to the Mathematics National Education Program
School Grade7 8 9 Remarks
1. Numbersa) Calculations and estimations or rounding up numbers x x xb) Fractions and calculat0ions using fractions x x xc) Decimals and calculations using decimals x x xd) Representation, comparison, ordering, and calculations using whole
numbersx x x
e) Solving problems using percentages and proportions x x x2. Algebra
24

School Grade7 8 9 Remarks
a) Patterns (or numeric, algebraic and geometric series), missing values, and generalizations.
x x
b) Simplifying and evaluating algebraic expressions x x xc) Simple linear equations and inequalities x x x Inequalities are taught at grade 9.d) Simultaneous equations (with two variables)e) Representation of functions, such as ordered pairs, tables, graphs,
words, or equations3. Geometry a) Properties of angles and geometric shapes (triangles, trapezium,
and other regular shapes)x x x
b) 1-Identical shapes 2-Similar triangles 1 1&2 2c) The relationship between two and three dimensional shapes x xd) Using proper methods for measuring perimeter, circumference,
area, surface area, and volume x x
e) Points on Cartesian surfaces x x x Identifying a point on Cartesian surfaces is not included in the program.
f) 1-Transition 2- symmetry 3- rotation 2 2 Transition and rotation are not included in the program.
4. Data and Chancea) Reading and presenting data using tables, illustrated graphs, bar
and pie charts, and diagrams x x x
b) Interpreting data (drawing conclusions, making assumptions, estimating values between displayed data points)
x x x
c) Estimating, expecting and determining the probability of potential results
x x x
Chapt TIMSS content domains which are not taught as part of the national education program
The information sources (teachers’ answers and the assessment framework) are inconsistent concerning the TIMSS content domains. This could be related to the inconsistency between books and the programs on the one hand and the absence of gradual progression between educational grades on the other hand which is reflected in the vagueness of the answers.
25

It is worth mentioning that in spite of the discrepancies in the students' results in different mathematics content domains, the difference between taught and untaught content domains is still relative, which requires further analysis.
In addition, the average of mathematics credit hours (175 hours) is close to the international average (162 hours) for grade 4 as opposed to 131 hours and 138 hours as an international average for grade 8.
3. Variables Related to Teachers
The study results proved that students' performance in the assessment is linked to variables related to the teacher, such as teachers' experience and self-confidence and job satisfaction.
3.1 .Teachers' Level of Education
The sampled fourth and eighth grade teachers are classified according to their level of education as follows:
4th grade
Completed Postgraduate uni-versity degree
Completed bachelor's degree or equivalent but not a postgra-
duate degree
Completed Post-secondary education but not a bachelor's
degree
No further than upper-secondary education
0
10
20
30
40
50
60
0
13
43 43
22
57
15
6
Fourth grade tea-chers' educatio-nal level in Tunisia
Internatio-nal average
26
8th grade
Completed Postgraduate university Degree
Completed Bachelor's Degree or equivalent but not a Postgraduate
Degree
Completed post-secondary educa-tion but not a Bachelor's Degree
No further than upper secondary education
0
10
20
30
40
50
60
70
80
1
73
25
1
24
63
113
Eighth grade teacher's educational level in Tuni-sia
International average
Graph No. 4: Classification of Teachers according to their Level of Education.
Proven results of this study make a significant difference between the educational level of teachers in Tunisia and the global level in the first stage of basic education (primary school): 45% of them did not go beyond high school compared to 6% as a global for this category of teachers. Those with a university degree do not exceed 13% in Tunisia, while the international average is 79%. Results also show lack of cooperation between teachers in Tunisia.
27

3.2. Teaching Experience
The following table shows the results of fourth and eighth grade students in relation to their teachers' years of experience:
Table No. 22: Classification of Students' Results according to their Teachers' Years of Experience
20 Years of Experience or more
From 10 to 20 Years of Experience
From 5 to 10 Years of Experience
Less than 5 Years of Experience
Percentage of Teachers
Students' Average Score
Percentage of Teachers
Students' Average Score
Percentage of Teachers
Students' Average Score
Percentage of Teachers
Students' Average Score
Fourth Grade Students
55 370 24 349 11 340 11 354
Eighth Grade Students
38 442 35 419 18 417 10 394
These results indicate that the more the years of teachers’ experience the better the students' results. However this variable is of limited impact in several countries, such as Finland, Japan, and the United Arab Emirates.
3.3. Teachers' confidence in their Ability to Teach Mathematics
Around 71 % of the teachers and 61 % of the secondary school teachers showed enough self confidence in their abilities to teach mathematics. Their students achieved better results than other students, whose teachers lack self-confidence. (At the fourth grade: 362 score points compared to 353 points, at the eighth grade: 428 score points compared to 422 points).
3.4. Job satisfaction
Around 52 % of the teachers were satisfied with their job, while 6 % were not satisfied. Statistical analysis has proven that students taught by teachers, who are satisfied with their job achieved better results than those who are taught by unsatisfied teachers (366 points compared to 327).
28

In lower secondary education, around 48 % the teachers were satisfied with their job, while 5 % were not satisfied. The following table shows the students' results in mathematics assessment according to the degree of job satisfaction of their teachers.
Table No. 23: Eighth Grade Students' Results in relation to the Degree of Job Satisfaction of their Teachers.
Fully Satisfied with Their Job Relatively Satisfied Not Satisfied at AllPercentage of Teachers 48 47 5Students' Average Score 426 423 432
3.5. Cooperation for Better Education
TIMSS also evaluates the level of cooperation between the teachers to improve the quality of education, for example by evaluating how they discuss teaching a certain subject, how they prepare subject material and try different ideas and concepts. Teachers are classified into three categories according to the frequency of their meetings:
o Very cooperative: they meet once to three times weekly.o Cooperative: they meet two or three times monthly.o Rarely cooperative: they do not meet or they hardly meet.
The analytical review of fourth grade students' results in light of the level of cooperation between their teachers showed that students of cooperative teachers (14 % which is one of the lowest percentages in the world) achieved better results as indicated in the following table:
Table No. 24: Fourth Grade Students’ Average Results according to the Degree of Cooperation of their TeachersVery Cooperative Teachers Cooperative Teachers Relatively Cooperative Teachers
Percentage of Students 14 57 29The National Average Score 368 360 353
Concerning the eighth graders, the percentage of students and their average scores in mathematics are classified according to the level of cooperation of their teachers as follows:
29

Table No. 25: Eighth Grade Students' Average Scores according to the Degree of Cooperation of their Teachers
Very Cooperative Teachers Cooperative Teachers Relatively Cooperative TeachersPercentage of Students 9 52 40The National Average Score 416 425 426
3.6. Using Computers to Teach Mathematics
Only 7 % of fourth grade teachers and 5 % of teachers of secondary schools use computers in their lessons, which is the lowest percentage in the world. Teachers ask their students to carry out some activities using computers, such as exploring concepts and principles of mathematics or searching for ideas and information and practicing skills and procedures.
4. Variables Related to Students
The study proves that the students' scores in the assessment are closely related to several variables, such as students' interest in learning mathematics, self-confidence, and class participation.
4.1. Students’ Interest in Learning Mathematics
Most of the students expressed their interest in learning mathematics, in spite of their low score, which is below the international average.
About 69% of fourth grade students were interested in learning mathematics, which renders Tunisia the fourth among participating countries with respect to this variable. In spite of their weak results, Tunisian students are among the most interested students in learning mathematics throughout the whole participating countries.
Those students achieved 381 points, which is the highest score in mathematics assessment in Tunisia compared to the national average (359 points).
The following table details fourth grade students' results according to their interest in learning mathematics.
30

Table No. 26: Fourth Grade Students' Scores according to their Interest in Mathematics
Interested in Learning Mathematics Relatively Interested in Learning Mathematics
Not Interested in Learning Mathematics
Percentage of Students 69 26 5Students' Average Score 381 320 313
The following table indicates eighth grade students' results according to their interest in learning mathematics:
Table No. 27: Eighth Grade Students' Scores according to their Interest in Mathematics
Interested in Learning Mathematics Relatively Interested in Learning Mathematics
Not Interested in Learning Mathematics
Percentage of Students 38 40 23Students' Average Score 448 415 405
The table indicates that the more interested in mathematics the students are, the better results they achieve.
4.2. Students’ Self-Confidence in Learning Mathematics
Fourth and eighth grade students' results in mathematics according to their self confidence are indicated in the below charts.
31

4th Grade Students
392 points
352 ponts
322 points
confident somewhat confident not confident
32

8th Grade Students
488 points
426 points
398 points
confident somewhat confident not confident
Chart No. 2: Students' Results according to their Self-Confidence in Learning Mathematics
From these results, it is proven that the more self-confident the students are, the better results they achieve.
4.3. Class Participation in Mathematics
Results show that students’ scores in mathematics assessment are closely related to their level of class participation. Tunisia ranked the first according to this variable. Students' results in the two grades are classified as follows:
33

4th grade students’ results:
Classification of fourth grade students' results according to their class participation in Mathematics
Participates in Mathematics lesson Relatively participates in Mathematics lesson
Does not participate in Mathematics lesson
34
295 points
339 points376 points

8 th grade students’ results:
Participates in mathematics lesson Relatively participates in mathematics lesson
Does not participate in mathematics lesson
Chart No. 3: Classification of Students’ Results according to their Class Participation
4.4. Students ‘Lack of Basic Nutrition
4th grade teachers stated that around 53 % of their students suffer from lack of basic nutrition compared to the international average of 29%. Students’ malnutrition negatively affects the teacher’s instruction and the student’s ability to understand and learn.
Average score of students suffering from lack of basic nutrition is 348 points, which is 24 points less than the average score of students who do not suffer from this lack (372 points).
8th grade teachers stated that around 49 % of their students who suffer from lack of basic nutrition compared to the international average of 37%. Students’ malnutrition negatively affects their ability to understand and learn. The average score of those students compared to their peers is indicated as follows:
35
432 points420 points
419 points

Table No. 28: Eighth Grade Students’ Scores according to their Nutrition
Students who do not suffer from basic nutrition
Students who suffer from basic nutrition
National Average Score 437 412International Average Score 477 449
4.5. Students’ Lack of Knowledge and Basic Skills
Fourth grade teachers stated that only 8 % of their students have enough knowledge and basic skills required for this grade. Those students achieved the highest scores in the mathematics assessment (376 points) compared to the students, who relatively have these skills (61% with average score 366 points) and those who do not have any skills (31%).
Concerning the eighth grade, teachers stated that only 5 % of the students have enough knowledge and basic skills required for this grade. Those students achieved an average score of 419 points compared to 417 points the average score of students who lack this knowledge as their teachers stated and their percentage is 40 %. The average score of students who relatively have knowledge and basic skills for learning mathematics (according to their teachers) is 431 points.
4.6. Students Perception of their Academic Future
Although eighth grade students' average score in the mathematics assessment is below the international average score, they have positive perception of their future. Around 49 % of the students (average score 448 points) think they will obtain a university degree. Only 5 % of the students think they will finish the first year of university education (average score 442 points). Around 20 % of the students think they will only finish the first year of secondary school (average score 396 points). About 27 % of the students do not have any perception of their future (average score 406 points).
36

II- Students Results in the TIMSS 2011 Science Assessment
1. Students’ Results in the Science Assessment
Fourth grade students' average score in the science assessment was 346 points, compared to the TIMSS scale average, which is set at 500 points. As a result, Tunisia ranked low compared to other participating countries.
Table No. 29: Ranking of the Countries according to Fourth Grade Students' Scores in TIMSS 2011 Science Assessment
Rank Country Average Score1 Korea 5872 Singapore 5833 Finland 5704 Japan 5595 Russia 5526 China 5527 The United States 5448 The Czech Republic 5369 Hong Kong 53510 Hungary 53411 Sweden 53312 Slovak Republic 53213 Austria 53214 The Netherlands 53115 England 52916 Denmark 52817 Germany 52818 Italy 52419 Portugal 52220 Slovenia 520
37

Rank Country Average Score21 Northern Ireland 51722 Ireland 51623 Croatia 51624 Australia 51625 Serbia 51626 Lithuania 51527 Belgium 50928 Romania 50529 Spain 50530 Bologna 505TIMSS 2011 Scale Average 50031 New Zealand 49732 Kazakhstan 49533 Norway 49434 Chile 48035 Thailand 47236 Turkey 46337 Georgia 45538 Iran 45339 Bahrain 44940 Malta 44641 Azerbaijan 43842 Saudi Arabia 42943 United Arab Emirates 42844 Armenia 41645 Qatar 39446 Oman 37747 Kuwait 34748 Tunisia 34649 Morocco 26450 Yemen 209
An increase in fourth grade students' results was recorded through different rounds of TIMSS assessments as indicated in the below graph.38

2003 2007 2011290
300
310
320
330
340
350
314
318
346
Average achievement of fourth grade students
Graph No. 5: The Change in Fourth Grade Students' Score in TIMSS Science Assessment
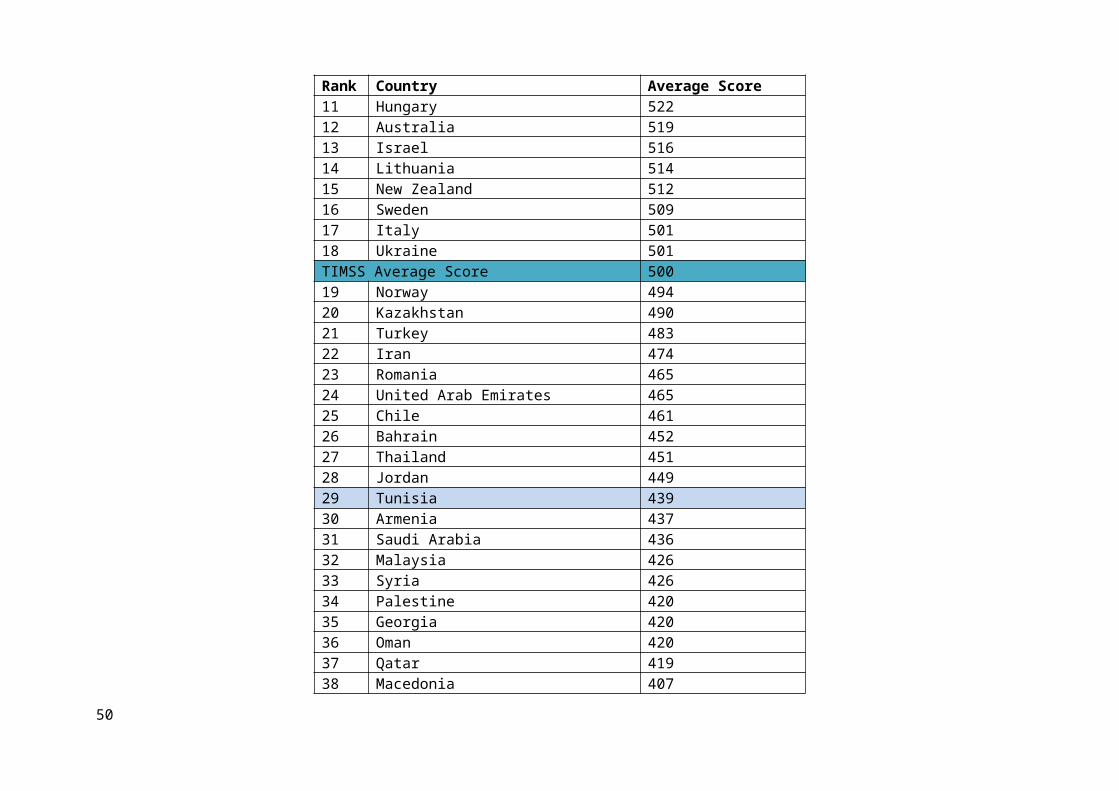
Eighth grade students' average score in science assessment is 439 points. Accordingly, Tunisia ranked 29 out of 42 participating countries.
Table No. 30: Country Ranking according to Eighth Grade Students' Score in TIMSS 2011 Science Assessment
Rank Country Average Score1 Singapore 5902 China 5643 Korea 5604 Japan 5585 Finland 5526 Slovenia 5437 Russia 5428 Hong Kong 5359 England 53310 The United States 52511 Hungary 52212 Australia 51913 Israel 516
39

Rank Country Average Score14 Lithuania 51415 New Zealand 51216 Sweden 50917 Italy 50118 Ukraine 501TIMSS Average Score 50019 Norway 49420 Kazakhstan 49021 Turkey 48322 Iran 47423 Romania 46524 United Arab Emirates 46525 Chile 46126 Bahrain 45227 Thailand 45128 Jordan 44929 Tunisia 43930 Armenia 43731 Saudi Arabia 43632 Malaysia 42633 Syria 42634 Palestine 42035 Georgia 42036 Oman 42037 Qatar 41938 Macedonia 40739 Lebanon 40640 Indonesia 40641 Morocco 37642 Ghana 306
Comparing students’ results in TIMSS science assessment shows a decrease in their average score by 6 points compared to the assessment of year 2007.
40

2003 2007 2011380
390
400
410
420
430
440
450
404
445
439
Average achievement of eighth grade students
Graph No. 6: The Change in Eighth Graders' Score in TIMSS Science Assessment
1.1. Students’ Average Score Classified by Science Content Domains
The following table classifies fourth grade students' average score by science content domains.
Table No. 31: The Classification of Fourth Grade Students' Average Score by Science Content Domains
Science Content Domains Average Score National Average Score International Average ScoreLife Science 342
346 500Physical Science 342Earth Science 319
Students' average score in all three science content domains are below the international average, however, students performed better in Life Science and Physical Science than in Earth Science which is not taught as part of the formal educational curricula.
The following table classifies eighth grade students’ average score by Science Content Domains
41

Table No. 32: The Classification of Eighth Grade Students' Average Score by Science Content Domains
Science Content Domains Average Score National Average Score International Average ScoreBiology 449
439 500Physics 436
Chemistry 434Earth Science 414
Students' average score varied from one domain to the other. They achieved the highest scores in biology compared to earth science.
1.2. Students’ Average Score by Cognitive Domains
Fourth grade students’ average scores in science assessment vary according to cognitive domains as indicated in the following table.
Table No. 33: The Classification of Fourth Grade Students' Average Score by Science Cognitive Domains
Cognitive Domains Average Score National Average Score International Average ScoreKnowing 336
346 500Applying 343Reasoning 337
As demonstrated in the table, students achieved low scores in the knowing and reasoning domains, which require more skills compared to the applying domain.
Concerning the eighth grade students, their average scores by cognitive domains are classified as follows:
Table No. 34: The Classification of Eighth Grade Students' Average Score by Science Cognitive Domains
Cognitive Domains Average Score National Average Score International Average ScoreKnowing 424
439 500Applying 437Reasoning 446
42

Students outperformed in the reasoning domain compared to their results in knowing and applying domains.
1.3. Students’ Performance on the TIMSS International Benchmarks
The following table defines the four levels of students’ achievement in science according to TIMSS International Benchmarks.
Table No. 35: The Classification of Fourth Graders’ Scores according to the Four Levels of Achievement
Level4 National Percentage International PercentageAdvanced
(625 scores) 0 5
High(550 scores) 3 32
Intermediate(475 scores) 14 72
Low(400 scores) 35 92
These results show that only 3 % of students reached high benchmark compared to 35 % who reached the low benchmark. Around 65% of the students were outside classification which means that they did not reach the low TIMSS international benchmark.
Concerning the eighth graders, results show that only 5 % of the students reached high benchmark and 72 % reached Low benchmark. These results were below the average international percentage for each level, as indicated in the following table:
_________________________
4 -All these are accumulative. If a student reaches a level, then he/she must have reached all the preceding levels, but failed to reach a higher one.
43

Table No. 36: Classification of Eighth Graders’ Scores according to the Four Levels of Achievement
Level4 National Percentage International PercentageAdvanced
(625 scores) 0 4
High(550 scores) 5 21
Intermediate(475 scores) 30 52
Low(400 scores) 72 79
Around 28 % of the students were not part of the classification which means they did not reach the lowest international benchmark.
2. The Impact of Some Variables on Students' Achievement in Science Assessment
2.1. Difference in Students' Average Scores Classified by Gender
Results show statistically significant difference between boys and girls at grade 4 and 8 science assessment. Fourth grade girls outperformed boys by 25 points and eighth grade boys outperformed girls by 17 points.
Table No. 37: Classification of Students’ Scores by Gender
Boys Girls
National Average
Score
International Average
Score
National Average Score
International Average Score
4th Grade 334 485 359 487
8th Grade 433 465 417 469
_________________________
4 -All these are accumulative. If a student reaches a level, then he/she must have reached all the preceding levels, but failed to reach a higher one.
44

At grade 4, comparing TIMSS international average score with students’ average score in all domains shows a statistically significant difference in the average scores of boys and girls in favor of girls in the three domains, as indicated in the below table.
Table No. 38: Fourth Grade Boys and Girls ' Science Average Score Classified by Content Domains
Science Content Domains
Boys Average Score Girls Average Score National Average Score
Life Science 330 355 346Physical Science 331 354
Earth Science 306 333
At grade 8, there is a statistically significant difference in the average science scores of boys and girls in all content domains, which is in favor of boys, contrary to fourth grade students' results.
Table No. 39: Eighth Grade Boys and Girls' Science Average Score Classified by Content Domains
Science Content Domains
Boys Average Score Girls Average Score National Average Score
Biology 457 442
439Chemistry 439 429
Physics 447 426Earth Science 426 402
Comparing boys and girls' average score in cognitive domains shows a statistically significant difference between boys and girls in all three domains: knowing, applying, and reasoning as indicated in the following charts. At grade 4, girls outperformed boys in all cognitive domains, whereas, eighth grade boys outperformed girls in these domains.
45

4th grade 8th grade
Reasoning Applying Knowing300
310
320
330
340
350
360
322
333
324
353353
350
Boys
Girls
Reasoning Applying Knowing390
400
410
420
430
440
450
460455
447
433
439
428
417
Boys
Girls
Graph No. 7: Classification of Students' Average Score by Science Cognitive Domains
2.2.Variables Related to Students' family Surroundings
Home EnvironmentThe study proves that achieving high science scores is somehow related to the availability of some essential resources at home, such as: books, computers, and Internet connection.
The average scores of the eighth graders, who answered this part of the survey, are shown in the below table:
Table No. 40: Eighth Grade Students’ Average Scores according to the Availability of Essential Home Resources
Resources Percentage of Students Average ScoresNumerous Resources 3 494Some Resources 58 446Few Resources 38 423
46

The table indicates that the more resource available for the students the better results they achieve.
Family Economic StatusFourth and eighth grade students' scores in relation to their families' economic conditions are classified as follows:
4th grade 8th grade
More affluent Neither more affluent nor more disadvantaged
More disadvantaged
More affluent Neither more affluent nor more disadvantaged More disadvantaged
Chart No. 4: Classification of Students' Scores in Science Assessment according to their Families Economic Status
According to the above charts, the higher the families’ economic conditions are, the better students’ average scores are. The higher percentages of students from economically disadvantaged homes are, the lower students’ average scores are.It is worth noting that fourth grade students ‘ scores did not reach the lowest level of achievement regardless of their economic or social conditions which raises questions about the role of schools.
2.3.Variables Related to School Environment
47
374 points
313 points
357 points
449 points
446 points428 points

School Environment
TIMSS results proves that lack of facilities and equipment in any educational institution (such as: infrastructure, computers, and books) negatively affects students' scores in science. Around 86% of sampled students at grade 4 and 94% of eighth grade students are enrolled at schools lacking these facilities and equipment.
Around 96% of the primary schools and 14% of the lower secondary schools do not have science laboratories and 11 % of lower secondary schools lack technical assistants to carry out scientific experiments.
The study also shows that 33% of the sampled lower secondary schools suffer from a shortage in the number of science teachers, which negatively affects students' scores.
2.4. Variables Related to Teaching Science Programs TIMSS fourth grade science assessment includes 20 subjects, of which only 5 are part of the national education program. These subjects are classified by content domains as follows:
Table No. 41: The Classification of TIMSS Assessment and Fourth Grade National Education Program Subjects by Science Content Domains
Life Science Physics Earth Science Total Number of Subjects
TIMSS Subjects 6 8 6 20Formal Education Program Subjects 2 3 0 5
TIMSS eighth grade science assessment includes 20 subjects, of which only 9 are part of the national education program. These subjects are classified by content domains as follows:
48

Table No. 42: The Classification of TIMSS Assessment and Eighth Grade National Education Program Subjects by Science Content Domains
Biology Chemistry Physics Earth Science Total Number of Subjects
TIMSS Subjects 7 4 5 4 20Formal Education Program Subjects 5 2 2 0 9
The following is a comparative analytical review on the TIMSS and the national educational program subjects in science at the level of fourth grade:
Table No. 43: Comparing Grade 4 TIMSS Subjects to the National Education Program
School Grade1 2 3 4 5 6 Remarks
1. Life Sciencea) Human body organs and their
main functions, as well as other living organisms (plants and animals).
x x x Introduced to students at grade 4.
b) Life cycles and plant and animal reproduction
Life cycles are not included in the program, but students are taught about vegetative reproduction as well as other types of reproduction.
c) Physical characteristics of living things, their behavior, and living conditions.
x Part one of the physical characteristics of living things and their behavior are introduced at grade 4.
d) Relationships between living organisms and their
Not included in the program, however students are taught
49

School Grade1 2 3 4 5 6 Remarks
environment (such as food chains and the relationship between a predator and its prey).
about nutrition.
e) Environmental changes (human activity, pollution and means of prevention).
xStudents are taught how to protect their surrounding environment from pollution (preventing air and water pollution).
f) Human health (infection, prevention, disease symptoms, healthy diet, and physical exercises).
x Students are taught means of disease prevention in human beings and animals.
2. Physicsa) State of matter (solid bodies,
liquids, gases, and the differences in their physical properties (shape and volume)) and changes in the state of matter by heating or cooling.
x Students are taught the physical properties of matter starting from grade 3.
b) Classification of matter according to physical properties (weight, mass, volume, and magnetic attraction).
Not included in the program.
c) Separating the components of a mixture.
Not included in the program.
d) Changes in the state of matter (putrefaction, combustion, rusting, and cooking).
Not included in the program.
e) Different sources of energy, x x Taught to students at grades 3
50
School Grade1 2 3 4 5 6 Remarks
its types, and practical usage (sun, electricity, water, and wind).
and 4.
f) Light (sources and characteristics).
x Taught to students at grade 5.
g) Electrical networks and the characteristics of magnets.
x Electrical circuits are taught to student at grade 5 and magnets are introduced at grade 6.
h) Forces of a moving object (such as gravity, pulling and pushing).
Air pressure is introduced to students at grade 4.
3. Earth Sciencesa) Water on earth (locations,
types, and flow) and air (composition, proof of its existence, and its uses).
Not included in the program, but air is mentioned as a source of energy at grade 4.
b) Terrain (such as mountains, plains, rivers, and deserts) and its relationship to human activities (such as agriculture, irrigation, and land reclamation).
Not included in the program.
c) Weather conditions daily and throughout the seasons
Not included in the program.
d) Animal and plant fossils (age, location, and structure)
Not included in the program.
e) Our solar system (planets, sun, and moon)
Not included in the program.
f) Day and night, and the shadow resulting from the rotation of earth around the
x Introduced to the students at grade 5.
51

School Grade1 2 3 4 5 6 Remarks
sun.
TIMSS content domains which are not taught as part of the national education program
Table No. 44: Comparing Grade 8 TIMSS Subjects to the Science Formal Education ProgramSchool Grade
7 8 9 Remarks1. Biology Structure Structure
(continued)Function
a) Human body systems and main organs, as well as other living organisms (structure/function and healthy life styles).
x x x
b) Cells and their functions, such as: breathing, photosynthesis, and others).
x x Taught to students in detail at grade 9.
c) Sexual and asexual reproduction and genetics (inheritance and inherited and acquired traits)
Plantsx
Humans x
x Genetics was cancelled from the program.
d) The role of variation and adaptation in the survival and extinction of a species in a changing environment.
xx x
e) Interaction between living organisms in an ecosystem (such as energy flow, food networks, competition, and predation) and the impact of natural environment changes on the population) such as climate change and water sources.
x x The parts on flow of energy, competition, and predation were cancelled from the program.
f) Reasons behind the increase in world population (such as progress in medicine and hygiene) and the impact of population growth on the environment.
x x This phenomenon is mentioned in geography program.
g) Human health (infectious diseases, prevention means, and immunity) and the importance of following a healthy diet and exercising to maintain one's health.
x
2. Chemistry a) Classification, formation and structure of substances
(elements, compounds, mixtures, molecules, atoms, protons, electrons, and neutrons).
x The structures of atoms and molecules are taught at the beginning of the program.
52

School Grade7 8 9 Remarks
b) Solutions (solute and solvent, substance concentration, dilution, and the effect of heat on solubility).
x
c) The properties of acidic and alkaline solutions xd) The chemical change (transformation of the reactant,
chemical reaction, preservation of chemical substances, oxidization (such as: combustion, rusting, and pollution).
x
3. Physicsa) Physical state of the matter and its related changes
(explaining the properties of matter in terms of its movement, the space between atoms, changes in the phases of substances, thermal expansion, and changes in volume and/or pressure)
x x Superficially taught in grades 7 and 8.
b) Types of energy, its transformation, heating, and degrees of heating.
x
c) Characteristics of light (reflection, refraction, colors of light, and light rays) and sound (transmission of sound through several media, high sound, intensification of sound, sound frequency, and the speed of light and sound)
x
d) Electric circuits (flow of electric current, types of circuits, series and parallel circuits, and the relationship between electric current and electric tension) properties of electromagnetism and magnetism and its usage.
x x x
e) Force and motion (types of force, explanation of motion, density, and pressure).
Not included in the program of basic education.
4. Earth Sciences a) Earth's terrain and structure ( earth crust, outer core, inner
core, water formation and distribution on earth, and air formation)
Cancelled from the program.
b) Evolution of earth, its cycle and history (rocks cycle, water cycle, weather, main geological events, and the formation of fossils and fossil fuels)
X Rocks are taught to students as part of the environmental studies program.
c) Earth resources, their use and means of preservation x
53

School Grade7 8 9 Remarks
(renewable and non-renewable resources, and the use of land, soil, and water resources).
d) The earth as part of the solar system and the universe (natural phenomena on earth, day and night, high tide and low tide, moon eclipse, seasons, and earth properties compared to those of the sun)
x
conten TIMSS content domains which are not taught as part of the national education program in Tunisia
It is worth noting that the average of science credit hours is close to the international average for grade 4, although science credit hours at grade 8 are less than the international average: 64 hours compared to an international average of 158 hours.
3. Variables Related to Teachers
The study results prove that students' performance in the assessment is affected by variables related to the teacher, such as teachers' experience, self-confidence, and job satisfaction.
3.1. Teachers’ Level of Education:
Sampled fourth and eighth grade teachers classified by the level of their education:
54

4th grade
Completed Postgraduate University Degree
Completed Bachelor's Degree or equivalent but not a Post-
graduate
Completed Post-secondary education but not a Bachelor's
Degree
No further than upper se-condary education
0
10
20
30
40
50
60
0
15
4045
23
57
15
6
Fourth grade teachers' educational level in TunisiaInternational average
55

8th grade
Completed Postgraduate Universi-ty Degree
Completed Bachelor's Degree or equivalent but not a Postgraduate
Degree
Completed Post-secondary edu-cation but not a Bachlor's degree
No further than upper-secondary education
0102030405060708090
1
83
16
0
27
63
82
Eighth grade teachers' educational level in TunisiaInternational Average
Graph No. 8: Classification of Teachers according to their Level of Education.3.2. Teaching Experience:
The following table shows the results of fourth and eighth grade students classified by their teachers' years of experience:
56
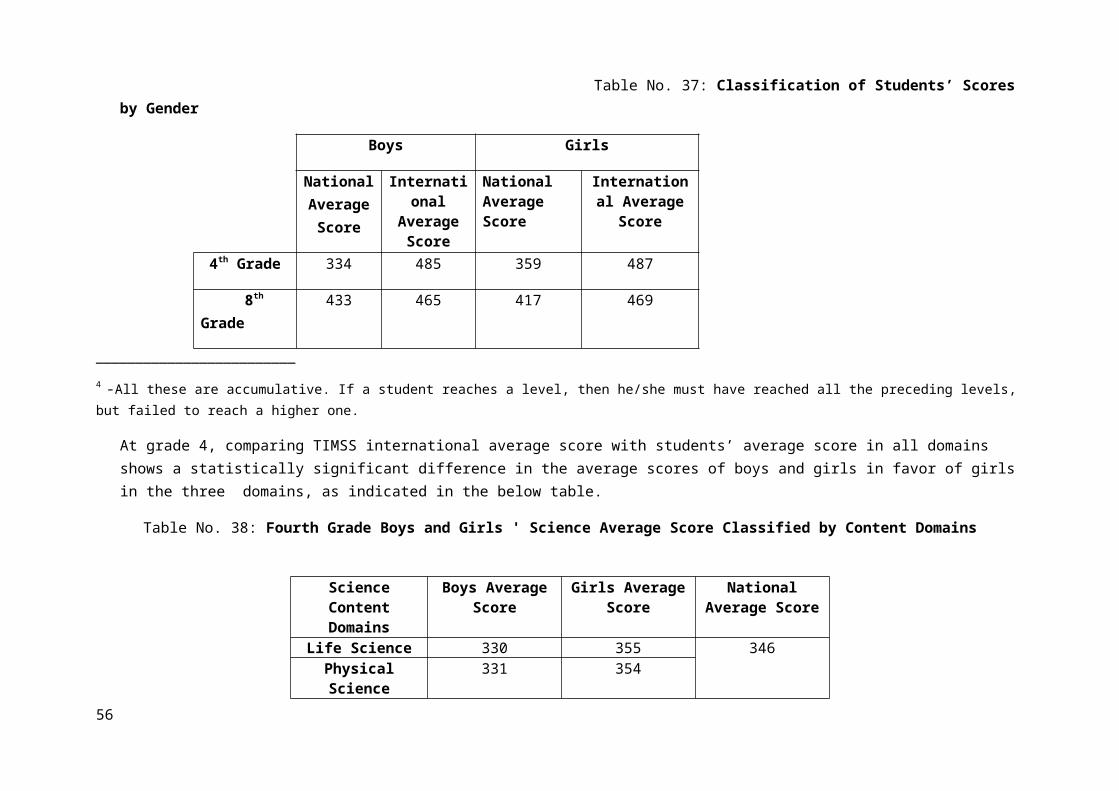
Table No. 45: Classification of Students' Results according to their Teachers' Years of Experience 20 Years of Experience or
moreFrom 10 to 20 Years of
ExperienceFrom 5 to 10 Years of
ExperienceLess than 5 Years of
ExperiencePercentage of
TeachersStudents'
Average ScorePercentage of
TeachersStudents'
Average ScorePercentage of
TeachersStudents'
Average ScorePercentage of
TeachersStudents'
Average ScoreFourth Grade
Students57 359 23 336 10 354 11 310
Eighth Grade Students
30 453 38 437 28 425 3 415
These results indicate that the more the years of teachers’ experience the better the students' results. However this variable is of limited impact in several countries, such as Finland, Japan, and the United Arab Emirates which could be interpreted as a deficiency of training for teachers with less than 5 years of experience.
3.3. Teachers’ confidence in their Ability to Teach Science :
Around 64 % of the teachers showed enough self confidence in their abilities to teach science. However, their students achieved lower results than other students, whose teachers do not have enough self-confidence. (344 score points compared to 350 points).Around 74% of secondary school teachers showed enough self confidence in their abilities to teach science. Their students achieved better results than other students whose teachers do not have enough self –confidence (440 score points compared to 434 points).
3.4. Job satisfaction:
Around 54 % of the teachers were satisfied with their job, while 6 % were not satisfied. The following table shows students' results in science according to the degree of job satisfaction of their teachers.
Table No. 46: Fourth Grade Students' Results according to the Degree of Job Satisfaction of their Teachers
Fully Satisfied with their Job Relatively Satisfied Not Satisfied at AllPercentage of Teachers 54 41 6Students' Average Score 354 340 305
57

As indicated in the table, students, whose teachers were satisfied with their jobs, outperformed their peers.
Concerning the lower secondary education students, 48% of the teachers were satisfied with their job, while 5 % were not satisfied. Students' results in science assessment according to the degree of job satisfaction of their teachers are shown in the below table:
Table No. 47: Eighth Grade Students' Results according to the Degree of Job Satisfaction of their Teachers
Fully Satisfied with their Job Relatively Satisfied Not Satisfied at AllPercentage of Teachers 49 46 5Students' Average Score 438 441 420
3.5. Cooperation for Better Education:
The analytical review of fourth grade students' results in light of the level of cooperation between their teachers shows that students of cooperative teachers (13 %) achieved the best results as indicated in the following table:
Table No. 48: Fourth Grade Students’ Average Results according to the Degree of Cooperation of their Teachers
Very Cooperative Teachers Cooperative Teachers Relatively Cooperative TeachersPercentage of Students 13 57 31The National Average Score 350 347 340
Concerning the eighth grade, the percentage of students and their average scores in science are classified according to the level of cooperation of their teachers as follows:
58

Table No. 49: Eighth grade Students' Average Score according to the Degree of Cooperation of their Teachers
Very Cooperative Teachers Cooperative Teachers Relatively Cooperative TeachersPercentage of Students 19 63 18The National Average Score 436 440 437
Using Computers to Teach ScienceAround 16 % of fourth grade teachers and 19 % of teachers of secondary schools use computers during their lessons, which is the lowest percentage in the world. Teachers ask their students to carry out some activities using computers, such as studying natural phenomena through simulations or searching for ideas and information and practicing skills and procedures.
4. Variables Related to Students
The study proves that students' scores in the assessment are closely related to several variables, such as students' interest in learning science, self-confidence and class participation.
4.1. Students' Interest in Learning Science
Most of the students expressed their interest in learning science in spite of their low scores, which are below the international average.
About 72% of fourth grade students were interested in learning science, which renders Tunisia the second country among the countries whose students participated in TIMSS 2011 with respect to this variable. In spite of their weak results, Tunisian students are among the most interested students in learning science.
The following table details fourth grade students' results according to their interest in learning science.
59

Table No. 50: Fourth Grade Students' Scores according to their Interest in Science
Interested in Learning Science Relatively Interested in Learning Science
Not Interested in Learning Science
Percentage of Students 72 24 4Students' Average Score 376 278 262
The following table indicates eighth grade students' results according to their interest in learning science:
Table No. 51: Eighth Grade Students' Scores according to their Interest in Science
Interested in Learning Science Relatively Interested in Learning Science
Not Interested in Learning Science
Percentage of Students 56 37 8Students' Average Score 450 426 422
Tunisia ranked first among countries with respect to students' interest in learning science
4.2. Students’ Self-Confidence in Learning Science
Fourth and eighth grade students' results in science classified according to their self-confidence.
60

4th grade students:
Confident Somewhat confident Not confident
8th grade students:
Confident Somewhat confident Not confident
Graph No. 9: Students' Results According to their Self-Confidence in Learning Science
61
380 points278 points
329 points
464 points
427 points
414 points

From the previous graphs, it is proven that the more self-confident the students are the better results they achieve.
4.3. Class Participation in Science
Results show that students’ scores in science assessment are closely related to their level of class participation. Tunisia ranked the first according to this variable concerning the fourth and the eighth grades. Students’ results in the two grades are classified as follows:
Classification of fourth grade students' results according to their class participation in science
Participates in Science lessons
Relatively participates in science lessons
Does not participate in science lessons
Classification of eighth grade students' results according to their class participation in science
Participates in Science lessons Relatively participates in science lessons
Dos not participate in science lessons
Graph No. 10: Classification of Students’ Results According to their Class Participation
4.4. Students’ Lack of Basic Nutrition
Fourth grade teachers stated that around 51 % of their students suffer from lack of basic nutrition. Students’ malnutrition negatively affects the teacher’s instruction and the student’s ability to understand and learn. Average score of students suffering from lack of basic nutrition is 333 points compared to the average score of students who do not suffer from this lack (359 points).
62
373 points
308 points
258 points
446 points430 points
431points

Eighth grade teachers stated that around 44 % of their students suffer from lack of basic nutrition. The average scores of those students compared to their peers are indicated as follows:
Table No. 52: Eighth Grade Students’ Scores according to their Nutrition
Students who do not suffer from a lack of basic nutrition
Students who suffer from a lack of basic nutrition
National Average Score 446 429International Average Score 485 461
4.5.Students’ Lack of Knowledge and Basic Skills
Fourth grade teachers stated that only 11 % of their students have the basic skills and enough knowledge required for this grade. Those students achieved the highest scores in the science assessment (358 points) compared to other students who do not have any skills (31% with average score 330 points) and those who have some of these skills (58% with average score 353 points).
Concerning the eighth grade students, their teachers stated that only 10 % of the students have enough knowledge and the basic skills required for this grade. Those students achieved an average score of 454 points compared to their peers, who lack this knowledge; representing 25% with average score 431 points. The average score of students, who have some basic skills for learning science (according to their teachers) is 439 points.
4.6. Students Perception of their Academic Future
Although eighth grade students' average scores in the science assessment are below the international average score, they have positive perception of their future. Around 49 % of the students (average scores 457 points) think they will obtain a university degree. Only 5 % of the students think they will finish the first year of university education (average scores 442 points). Around 20 % of the students think they will only finish the first year of secondary school (average scores 401 points). About 27 % of the students do not have any perception of their future (average scores 426 points).
63

IV-Summary
TIMSS, "Trends in International Mathematics and Science Study" is based on the evaluation of grade 4 and 8 students' results in mathematics and science. This research field helps in objectively comparing between the international trends in teaching basic sciences; school systems; and teaching and learning conditions. This study is conducted regularly every four years under the supervision the International Association for the Evaluation of Educational Achievement (IEA). Conducted for the first time in 1995, this international assessment study currently includes 63 countries from all over the world
The fourth grade students' average score in the mathematics assessment was 359 points, compared to the TIMSS scale average, which is set at 500 points. Tunisia ranked low (47/50), which indicates the presence of serious problems in the early years of basic education. 35% of fourth grade students reached the low TIMSS International benchmark in mathematics and science assessments, whereas 65% of the students did not reach the lowest level of achievement regardless of their economic or social conditions. Although Tunisia is among the countries which ranked low, this assessment shows a decrease in the number of students who had low assessment scores and an improvement in their achievements. There is also an increase in the scores of students, who reached the advanced benchmark. In spite of their weak results, Tunisian students are among the most interested students in learning mathematics throughout the whole participating countries. At grade 4, there was no measurable difference between the average mathematics scores of males and females. At grade 8, males (433 scores) outperformed females (417 scores). Grade 8 results are far better than those of students in grade 4 in 2011 (and in 2007 : the students that were assessed in the fourth grade in 2007 reached the eighth grade by 2011 and thus were assessed at the eighth grade in 2011) : only 64.4 % of the students were promoted from grade 7 to grade 8 in the academic year 2010-2011 i, and more than 35 % of the students were not promoted to grade 8, of whom 22.8% failed and 12.7 % dropped out of school. About 61% of eighth graders achieved the lowest international benchmark in the mathematics assessment compared to 72% who reached the lowest benchmark in the science assessment, and the rest of the students did not even reach the lowest level of achievement despite their interest in learning science and mathematics.
Proven results of this study make a significant difference between the educational level of teachers in Tunisia and the global level in the first stage of basic education (primary school): 45% of them did not go beyond high school compared to 6% as a global for this category of teachers. Those with a university degree do not exceed 13%, while the international average is 79%. Results also show lack of cooperation between teachers in Tunisia. TIMSS mathematics assessment for grade 4 students includes 18 subjects, of which 7 subjects only are taught as part the Tunisian educational program, and the mathematics assessment for grade 8 includes 19 subjects, of which 7 subjects only are taught as part of the national educational program; furthermore the TIMSS fourth grade science assessment includes 20 subjects, of which only 5 are part of the national education program, while the eighth grade assessment includes 20 subjects, of which only 9 subjects are taught at schools. It is worth mentioning that in spite of the discrepancies in the students' results in different mathematics content domains, the difference between taught and untaught content domains is still relative, which requires further analysis.
64

V-References
- Ina V.S. Mullis, Michael O.Martin, Pierre Foy, and Alka Arora (2011).TIMSS 2011 International Results in Mathematics .International Association for the Evaluation of Educational Achievement.
- Michael O.Martin, Ina V.S. Mullis, Pierre Foy, and Gabrielle M. Stanco (2011).TIMSS 2011 International Results in Science. International Association for the Evaluation of Educational Achievement.
- https://wfs.bc.edu/xythoswfs/webui/_xy-19342546_1-t_MLNlk4k1
- www.education.gov.tn
- http://www.cnipre.edunet.tn/
65

VI-Table of Figures
Table No. 1: Classification of TIMSS 2011 Mathematics Assessment by Content Domains at Fourth and Eighth Grades 4 TIMSS 2011 International Results in Mathematics. Executive summary p6.Table No. 2: Classification of the TIMSS 2011 Mathematics Assessment by Cognitive Domains at Fourth and Eighth Grades 4
TIMSS 2011 International Results in Mathematics. Executive summary 6.
Table No. 3: The Level of Proficiency in Mathematics 5
TIMSS 2011 International Results in Mathematics. Executive summary p8.
Table No. 4: Classification of the TIMSS 2011 Science Assessment by Content Domains at Fourth Grade 6
TIMSS 2011 International Results in Science. Executive summary p6.
Table No. 5: Classification of the TIMSS 2011 Science Assessment by Content Domains at Eighth Grade 6
TIMSS 2011 International Results in Science . Executive summary p6.
Table No. 6: Classification of the TIMSS 2011 Science Assessment by Cognitive Domains at Fourth and Eighth Grades 7
TIMSS 2011 International Results in Science. Executive summary p8.
Table No. 7: Country Ranking Based on Fourth Grade Students' Score in TIMSS 2011 Mathematics Assessment 7
TIMSS 2011 International Results in Mathematics. Chapter 1 Exhibit 1.1 p40.
Table No. 8: Ranking of the Countries Based on Eighth Grade Students' Score in TIMSS 2011 Mathematics Assessment 10
TIMSS 2011 International Results in Mathematics. Chapter 1 Exhibit 1.2 p42.
Table No. 9: Average Mathematics Content Domain Scores of Fourth Graders 12
TIMSS 2011 International Results in Mathematics . Chapter3 Exhibit 3.1 p142.
Table No. 10: Average Mathematics Content Domain Scores of Eighth Graders 13
TIMSS 2011 International Results in Mathematics. Chapter3 Exhibit 3.2 p144.
66

Table No. 11: Average Mathematics Cognitive Domain Scores of Fourth Graders 13
TIMSS 2011 International Results in Mathematics. Chapter3 Exhibit 3.3 p148.
Table No. 12: Average Mathematics Cognitive Domain Scores of Eighth Graders 14
TIMSS 2011 International Results in Mathematics. Chapter 3 Exhibit 3.4p 150.
Table No. 13: The Classification of Fourth Graders’ Scores according to the Four Levels of Achievement 14
TIMSS 2011 International Results in Mathematics. Chapter 2 Exhibit 2.2 p90.
Table No. 14: The Classification of Eighth Graders’ Scores according to the Four Levels of Achievement 15
TIMSS 2011 International Results in Mathematics. Chapter 2 Exibit 2.19 p114.
Table No. 15: Classification of Fourth Grade boys and girls’ Mathematics Average Score by Content Domains 16
TIMSS 2011 International Results in Mathematics. Chapter 3 Exhibit 3.9 p 164.
Table No. 16: Classification of Eighth Grade boys and girls’ Mathematics Average Score by Content Domains 16
TIMSS 2011 International Results in Mathematics. Chapter 3 Exhibit 3.10p 166.
Table No. 17: Eighth Grade Students’ Average Scores according to the Availability of Essential Home Resources 17
TIMSS 2011 International Results in Mathematics. Chapter 4 Exhibit 4.3 p 182.
Table No. 18: The Classification of TIMSS and Fourth Grade National Education Program Subjects by Mathematics Content Domains 19
TIMSS 2011 International Results in Mathematics. Chapter 8 Exhibit 8.10 p352.
Table No. 19: The Classification of TIMSS and Eighth Grade National Educational Program Subjects by Mathematics Content Domains 19
TIMSS 2011 International Results in Mathematics. Chapter 8 Exhibit 8.11 p 354.
Table No. 20: Comparing Grade 4 TIMSS Subjects to the Mathematics Formal Education Program in Tunisia 20
Table No. 21: Comparing Grade 8 TIMSS Subjects to the Mathematics National Education Program 23
Table No. 22: Classification of Students' Results according to their Teachers' Years of Experience 26
67

TIMSS 2011 International Results in Mathematics. Chapter 7 Exhibit 7.5 p 294 Exhibit 7.6 p296.
Table No. 23: Eighth Grade Students' Results in relation to the degree of job satisfaction of their teachers 27
TIMSS 2011 International Results in Mathematics. Chapter 7 Exhibit 7.16 p 322.
Table No. 24: Fourth Grade Students ‘Average Results according to the Degree of Cooperation of their Teachers 27
TIMSS 2011 International Results in Mathematics. Chapter 8 Exhibit 8.12 p 360.
Table No. 25: Eighth grade Students' Average Scores according to the Degree of Cooperation of their Teachers 28
TIMSS 2011 International Results in Mathematics. Chapter 8 Exhibit 8.13 p362.
Table No. 26: Fourth Grade Students' Scores according to their Interest in Mathematics 29
TIMSS 2011International Results in Mathematics. Chapter 8 Exhibit 8.1p 330.
Table No. 27: Eighth Grade Students' Scores according to their Interest in Mathematics 29
TIMSS 2011 International Results in Mathematics. Chapter 8 Exhibit 8.2p 332.
Table No. 28: Eighth Grade Students’ Scores according to their Nutrition 33
TIMSS 2011 International Results in Mathematics. Chapter 8 Exhibit 8.22 p 384.
Table No. 29: Ranking of the Countries according to Fourth Grade Students' Scores in TIMSS 2011 Science Assessment 34
TIMSS 2011 International Results in Science. Chapter 1 Exhibit 1.1 p38.
Table No. 30: Country Ranking according to Eighth Grade Students' Score in TIMSS 2011 Science Assessment 36
TIMSS 2011 International Results in Science. Chapter 1 Exhibit 1.2 p40.
Table No. 31: The Classification of Fourth Grade Students' Average Score by Science Content Domains 38
TIMSS 2011 International Results in Science. Chapter 3 Exhibit 3.1 p 144.
Table No. 32: The Classification of Eighth Grade Students' Average Score by Science Content Domains 39
TIMSS 2011 International Results in Science. Chapter 3 Exhibit 3.2 p146.
68

Table No. 33: The Classification of Fourth Grade Students' Average Score by Science Cognitive Domains 39
TIMSS 2011 International Results in Science. Chapter 3 Exhibit 3.3 p150.
Table No. 34: The Classification of Eighth Grade Students' Average Score by Science Cognitive Domains 39
TIMSS 2011 International Results in Science. Chapter 3 Exhibit 3.4 p 152.
Table No. 35: The Classification of Fourth Graders’ Scores according to the Four Levels of Achievement 40
TIMSS 2011 International Results in Science. Chapter 2 Exhibit 2.2 p86.
Table No. 36: Classification of Eighth Graders’ Scores according to the Four Levels of Achievement 41
TIMSS 2011 International Results in Science. Chapter 2 Exhibit 2.18 p114.
Table No. 37: Classification of Students’ Scores by Gender 41
TIMSS 2011 International Results in Science. Chapter 1 Exhibit 1.10 p 66 Exhibit 1.11 p68.
Table No. 38: Fourth Grade boys and girls' Science Average Score Classified by Content Domains 42
TIMSS 2011 International Results in Science. Chapter 3 Exhibit 3.9 p 168.
Table No. 39: Eighth Grade boys and girls' Science Average Score Classified by Content Domains 42
TIMSS 2011 International Results in Science. Chapter 3 Exibit 3.10 p 170.
Table No. 40: Eighth Grade Students ‘ Average Scores according to the Availability of Essential Home Resources 43
TIMSS 2011 International Results in Science. Chapter 4 Exhibit 4.3 p 186.
Table No. 41: The classification of TIMSS and fourth Grade National Education Program Subjects by Science Content Domains 45
TIMSS 2011 International Results in Science. Chapter 8 Exhibit 8.8 p 356.
Table No. 42: The classification of TIMSS and Eighth Grade National Educational Program Subjects by Sciene Content Domains 46
TIMSS 2011 International Results in Science. Chapter 8 Exhibit 8.9 p 358.
Table No. 43: Comparing Grade 4 TIMSS Subjects to the National Education Program 46
69

Table No. 44: Comparing Grade 8 TIMSS Subjects to the Science Formal Education Program 49
Table No. 45: Classification of Students' Results according to their Teachers' Years of Experience 54
TIMSS 2011 International Results in Science. Chapter 7 Exhibit 7.5 p 298 Exhibit 7.6 p 300.
Table No. 46: Fourth Grade Students' Results according to the Degree of Job Satisfaction of their Teachers 54
TIMSS 2011 International Results in Science. Chapter 7 Exhibit 7.15 p 324.
Table No. 47:Eighth Grade Students' Results according to the Degree of Job Satisfaction of their Teachers 55
TIMSS 2011 International Results in Science. Chapter 7 Exhibit 7.16 p 326.
Table No. 48: Fourth Grade Students’ Average Results according to the Degree of Cooperation of their Teachers 55
TIMSS 2011 International Results in Science. Chapter 8 Exhibit 8.12 p 366.
Table No. 49: Eighth grade Students' Average Score according to the Degree of Cooperation of their Teachers 56
TIMSS 2011 International Results in Science. Chapter 8 Exhibit 8.13 p 368.
Table No. 50: Fourth Grade Students' Scores according to their Interest in Science 57
TIMSS 2011 International Results in Science. Chapter 8 Exhibit 8.1 p 322.
Table No. 51: Eighth Grade Students' Scores according to their Interest in Science 57
TIMSS 2011 International Results in Science. Chapter 8 Exhibit 8.2 p 335.
Table No. 52: Eighth Grade Students’ Scores according to their Nutrition 60
TIMSS 2011 International Results in Science. Chapter 8 Exhibit 8.22 p 394.
70
VII-Table of Graphs
Graph No. 1: The Change in Fourth Grade Students' Score in TIMSS Mathematics Assessment 9
TIMSS 2011 International Results in Mathematics. Chapter 1 Exhibit 1.5 p 52.
Graph No. 2: The Change in Eighth Graders' Score in TIMSS Mathematics Assessment 12
TIMSS 2011 International Results in Mathematics. Chapter 1 Exhibit 1.6 p 56.
Graph No.3: Boys and Girls’ Average Scores in Mathematics Cognitive Domains 17
TIMSS 2011 International Results in Mathematics. Chapter 3 Exhibit 3.10 p 168 Exhibit 3.9 p 170.
Graph No.4: Classification of Teachers according to their Level of Education 25
TIMSS 2011 International Results in Mathematics. Chapter 7 Exhibit 7.1 p 284 Exhibit 7.2 p 286.
Graph No.5: The Change in Fourth Grade Students’ Score in TIMSS Science Assessment. 36
TIMSS 2011 International Results in Science. Chapter 1 Exhibit 1.5 p 52.
Graph No.6: The Change in Eighth Graders’ Score in TIMSS Science Assessment 38
TIMSS 2011 International Results in Science. Chapter 1 Exhibit 1.6 p56.
Graph No.7: Classification of Students’ Average Score by Science Cognitive Domains 43
TIMSS 2011 International Results in Science. Chapter 3 Exhibit 3.1 p 144 Chapter 3 Exhibit 3.2 p146.
Graph No.8: Classification of Teachers according to their level of Education 53
TIMSS 2011 International Results in Science. Chapter 7 Exhibit 7.1p 288 Exhibit 7.2 p 290.
Graph No.9: Students’ Results according to their Self-Confidence in Learning Science 58
TIMSS 2011 International Results in Science. Chapter 8 Exhibit 8.4 p 344 Exhibit 8.5 p 346.
Graph No.10: Classification of Students ‘ Results according to their Class Participation 59
71
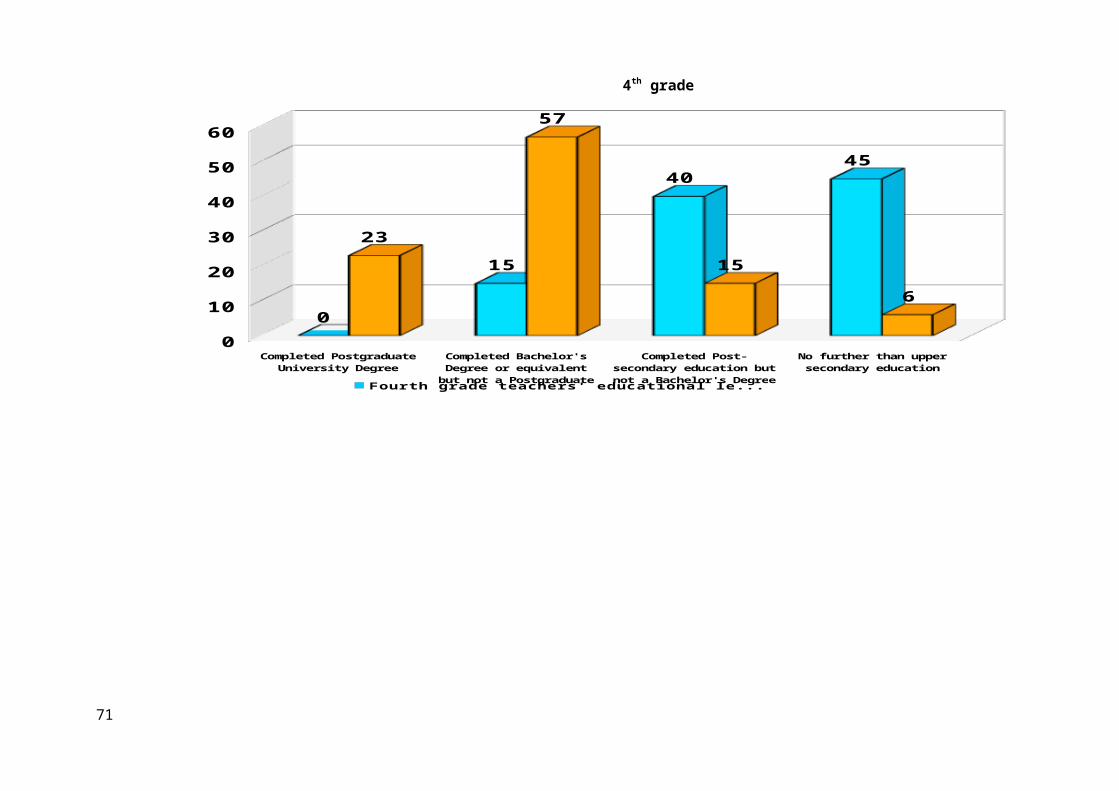
TIMSS 2011 International Results in Science. Chapter 8 Exhibit 8.17 p 380 Exhibit 8.18 p 382
.
VIII-Table of Charts
Chart No. 1: Students' Scores Classified by their Families Economic Status 18
TIMSS 2011 International Results in Mathematics. Chapter 5 Exhibit 5.3 p 214 Exhibit 5.4 p 216.
Chart No. 2: Students' Results According to their Self-Confidence in Learning Mathematics 30
TIMSS 2011 International Results in Mathematics. Chapter 8 Exhibit 8.4 p 336 Exhibit 8.5 p 338.
Chart No. 3: Classification of Students’ Results according to their Class Participation 32
TIMSS 2011 International Results in Mathematics. Chapter 8 Exhibit 8.17 p 370 Exhibit 8.18 p 372 .
Chart No. 4: Classification of Students' Scores in Science Assessment according to their Families Economic Status 44
TIMSS 2011 International Results in Science. Chapter 5 Exhibit 5.3 p 212 Exhibit 5.4 p 214.
72

The National Centre for Pedagogic Innovation and Research in Education
Assessment Section
Participation of Tunisia in the International Assessment Entitled
"Trends in International Mathematics and Science Study"
TIMSS 2011
Report
This report was translated from arabic with the assistance of Alexandritrust –Juillet 2013
Chedia Belaid Mhirsi Inspector General of Education - Director of department of Evaluation, CNIPRE
Souad Abelwahed University teacher- Researcher - Department of Evaluation, CNIPRE
Selmi Houda Helali Researcher - Department of Evaluation, CNIPRE
Soumaya Ben Khalifa Researcher - Department of Evaluation, CNIPRE
73

74

75

i