the gender global entrepreneurship and development index...
TRANSCRIPT

The Gender Global
Entrepreneurship
and Development Index (GEDI) A 17-country pilot analysis of the conditions that foster high-potential female
entrepreneurship
Report of Findings
Produced by the Global Entrepreneurship
and Development Institute
With the generous support of
The Dell Women’s Entrepreneur Network

Acknowledgements
This report was prepared by The GEDI Institute led by Ruta Aidis and comprising Laszlo Szerb, Zoltan
Acs and research assistance by Ainsley Lloyd. Julie Weeks, President and CEO, Womenable joined the
core team making a considerable contribution to this report. We are indebted to our expert panel members
who provided excellent advice and thoughtful commentary for improving the Gender-GEDI 17-country
pilot project at various stages of its development.
Expert panel members
Katrin Anacker – Assistant Professor, George Mason University
Margaret Berger – Vice President, Impact, Evaluation and Monitoring, Vital Voices
Leora Klapper – Lead Economist, Finance and Private Sector Research Team, World Bank
Connie L. McNeely – Professor of Public Policy and Co-Director, Center for Science and Technology
Policy, George Mason University
Amy Millman – Co-Founder and President, Springboard Enterprises
Lauren Murphy – Consultant, Multilateral Investment Fund, Inter-American Development Bank
Shelly Porges - former Senior Advisor, Global Women’s Business Initiative and Global Entrepreneurship
Program, US Department of State
Greta Schettler – Senior Economic Policy Advisor, Secretary’s Office of Global Women’s Issues, US
Department of State
Sudhir Shetty – Sector Director, Poverty Reduction and Economic Management, East Asia and Pacific
Region, Co-director World Development Report 2012 on Gender Equality, World Bank
Anne Simmons-Benton – Global Practice Lead, Trade and Regulatory Reform/Gender, DAI
Elizabeth A. Vazquez – CEO and Co-Founder, WEConnect International
The GEDI Institute is a non-profit research and consulting firm based in Washington DC, which assists
governments, donor agencies, foundations, international assistance providers, and global companies to
expand economic opportunities for individuals, build future markets for societies, and propel economic
development for nations. We use an innovative methodology to advance entrepreneurship, thereby
accelerating economic growth. For more information, visit www.thegedi.org or contact Ruta Aidis, PhD,
Gender-GEDI Project Director, [email protected].
Dell Inc. listens to customers and delivers innovative technology and services that give them the power to
do more. For more information, visit www.dell.com.
For additional Gender-GEDI information including the 'Executive Report' and 'Individual Country
Pages', visit: www.dell.com/dwen

ii
Gender-GEDI Report of Findings (2013)
Contents
Acknowledgements .......................................................................................................................... i
Abbreviations .................................................................................................................................. 1
Introduction ..................................................................................................................................... 2
Chapter 1. Women: Attitudes, Access, Aspirations and Entrepreneurship .................................... 3
Chapter 2: Methodology and Data .................................................................................................. 7
Chapter 3: Gender-GEDI Results ................................................................................................. 27
Country page guide ....................................................................................................................... 49
Australia ........................................................................................................................................ 53
Brazil ............................................................................................................................................. 54
China ............................................................................................................................................. 55
Egypt, Arab Rep............................................................................................................................ 56
France ............................................................................................................................................ 57
Germany ........................................................................................................................................ 58
India .............................................................................................................................................. 59
Japan ............................................................................................................................................. 60
Malaysia ........................................................................................................................................ 61
Mexico .......................................................................................................................................... 62
Morocco ........................................................................................................................................ 63
Russian Federation ........................................................................................................................ 64
South Africa .................................................................................................................................. 65
Turkey ........................................................................................................................................... 66
Uganda .......................................................................................................................................... 67
United Kingdom............................................................................................................................ 68
United States ................................................................................................................................. 69
References ..................................................................................................................................... 70
1
Gender-GEDI Report of Findings (2013)
Abbreviations
GEDI: Global Entrepreneurship and Development Index
GEI: Gender Empowerment Index
GEM: Global Entrepreneurship Monitor
GGGI-WEF: Global Gender Gap, World Economic Forum
GID-OECD: Gender, Institutions and Development
ILO: International Labor Organization
IMF: International Monetary Fund
OECD: Organization for Economic Co-operation and Development
TEA: Total Entrepreneurship Activity – the percentage of the working age (18-64) population that are
either a nascent entrepreneur or owner-manager of a new business (no more than 42 months old)
UNESCO: United Nations Educational, Scientific and Cultural Organization
WB: World Bank
WBL: Women Business and the Law Database, World Bank
WEF: World Economic Forum
WEO- EIU: Women’s Economic Opportunity, Economist Intelligence Unit

2
Gender-GEDI Report of Findings (2013)
Introduction
When a captain steers her ship, she is not looking down at the waves in front of her or even a few hundred
meters ahead – she looks out on the horizon and focuses on her goal. At night, for centuries, captains
have used the North Star to guide them to their destination1.
The aim of the Gender-Global Entrepreneurship and Development Index (Gender-GEDI) is to identify the
entrepreneurial North Star, the destination on the economic growth horizon fostering high potential
female entrepreneurship.
There is a growing understanding – among policy makers, entrepreneurship support organizations and
entrepreneur associations – that laws, policies, support structures as well as cultural mores and individual
motivations all form an interwoven support structure for enterprise development. Further, there is an
increasing realization that there is a gender dimension to these factors; gender-blind business support
measures do not support women’s enterprise development to the extent that they support men-owned
firms. Focusing efforts specifically on women’s enterprise development, and measuring their impact, is of
growing interest.
The Gender-GEDI is the world’s first diagnostic tool that comprehensively identifies and analyzes the
conditions that foster high potential female entrepreneurship development. This initial 17-country pilot
study provides key insights across several regions and levels of national economic development. Female
entrepreneurship at large includes a vast array of activities – ranging from petty market traders and
shopkeepers to biochemical company startups.
The Gender-GEDI focuses on a specific subset of female entrepreneurs, which we refer to as ‘high
potential’, female entrepreneurs: women business owners who possess and operate businesses that are
‘innovative, market expanding and export oriented’. Through their entrepreneurial activities, high-
potential female entrepreneurs not only contribute to improving their own economic welfare but to
improving the economic and social fabric of society through job creation, innovative products, processes,
and services, and cross-border trade. By focusing on the gender differentiated conditions that often affect
‘high potential’ female entrepreneurship development, The Gender-GEDI brings a new systematic
approach that allows for cross-country comparison and benchmarking.
Globally, women and men are not on a ‘level playing field’ in terms of access to resources, which
continues to impact women’s ability to start and grow businesses. The Gender-GEDI focuses specifically
on identifying and assessing the gendered nature of factors that, if addressed, could allow high potential
female entrepreneurs an equal chance to flourish.

3
Gender-GEDI Report of Findings (2013)
Chapter 1. Women: Attitudes, Access, Aspirations and Entrepreneurship
Are female entrepreneurs really different from male entrepreneurs? Numerous studies have tested and
retested the differences between male and female entrepreneurs. After decades of study, this simple
question remains, for the most part, unanswered (Nelson & Duffy: 2010).
However, what the existing data tell us is that a large share of the smallest enterprises is run by women,
and that percentage of female ownership declines with firm size (World Bank 2012; Bruhn 2009;
Hallward-Driemeier 2011a; Sabarwal et al. 2009; Costa & Rijkers 2011). This decline becomes even
sharper when using more restrictive definitions of ownership that account for actual decision-making
power in the presence of multiple owners (Hallward-Driermeier 2011a).
We also know that business ownership by women is more likely to be driven by necessity2 than
opportunity3 (Kelley et al. 2010:21) and, while the fraction of female necessity entrepreneurs declines
with economic development as more economic opportunities are available for women (Allen et al. 2008;
Kelley et al. 2010), the share of adult women who own businesses declines as well.
In addition, women-owned firms are more likely to be home-based (Mead and Liedholm 1998; Bruhn
2009), and are more likely to be concentrated in the service sector and in businesses that ‘conform’ to the
female roles – such as beauty parlors, food vending and sewing (Bates 1995; Hallward-Dreiermeier
2011b; Verheul et al. 2006). In general, women tend to work in sectors, industries, occupations and jobs
with lower average (labor) productivity and this explains a large fraction of the gender gap in productivity
and earnings (World Bank 2012:207). Productivity differences between female-owned and male-owned
businesses are often explained by differences in access to and use of productive resources, where these
differences are primarily a function of the business size and sector of operation rather than a gender-
specific factor (Sabarwal et al. 2009; Hallward-Driemeier 2011a) such as amount of startup capital.
In terms of perceptions, research shows that the most important difference between female and male
entrepreneurs is individual perceptions of one’s own skills, likelihood of failure and existence of
opportunities (Minniti 2010; Welter & Smallbone 2003). Moreover, traditional female roles and images
may influence women’s perceptions of their abilities and undermine their self-efficacy and potential,
including that for growing their businesses (WDR 2012:204; Brush et al. 2004; Bird & Brush 2002).
Often, female entrepreneurship implies ‘breaking out of the norms’ of female behavior (Welter &
Smallbone 2010).
Another important difference is the influence of marriage and children on female self-employment. Being
married and raising children are both strongly associated with self-employment among women (Parker
2009). Having children of less than six years of age has the greatest impact on the probability that women
are self-employed, especially among homeworkers (Edwards & Field-Hendrey 2002). Zellweger et al.
(2011) identify the family and household as decisive influencers to women’s choices for
entrepreneurship.

4
Gender-GEDI Report of Findings (2013)
Finding the answers
There is a growing understanding – among policy makers, entrepreneurship support organizations and
entrepreneur associations – that laws, policies,
support structures as well as cultural mores and
individual motivations all form an interwoven
support structure for enterprise development.
Further, there is an increasing realization that
there is a gender dimension to these factors;
gender-blind business support measures do not
support women’s enterprise development to the
extent that they support men-owned firms.
Focusing efforts specifically on women’s
enterprise development, and measuring their
impact, is of growing interest.
The approaches taken to studying female
entrepreneurship have often taken very limited
perspectives to what influences female
entrepreneurship development. Often female
entrepreneurs have been assessed in terms of their
individual characteristics as compared to their
male counterparts – ranging from basic
characteristics such as age and level of education
to attitudes and perceptions such as aversion to
risk, desire for growth or self-efficacy. Though
important, focusing solely on individual attributes
– sometimes called the ‘Individualistic Fallacy’ –
is based on the notion that the wider social
systems do not exhibit any characteristics beyond
those played out by individuals (Acs, Autio, Szerb
2012; Hofstede 2001:21; Seligson 2002:273).
To date, much research on female
entrepreneurship development has focused on
individual female entrepreneurship characteristics
even though it is clear that individual
characteristics are not the main determinants for
female entrepreneurship development. At the
same time, basic issues such as access to
technology, capital and education have gone
overlooked in country comparisons.
Additional factors related to the institutional
environment, such as equal legal rights, access to
education, networks, technology and capital play a critical role in female entrepreneurship development,
as do social norms, values and expectations. Also the overall business environment in terms of laws,
regulations and business stability will affect the ability for businesses to thrive and grow.
Gender Changes the Equation....
When looking at general factors that influence a
business-enabling environment (laws, policies and
conditions that make it easy – or difficult – to start,
grow and close a business), four top assessment
rankings* all cite Canada, Denmark and the United
States as being among the ten most supportive
environments for small business creation and growth –
with Australia, Singapore and Switzerland joining the
top ten list in three of four rankings.
Concurrently, four global gender equality
assessments** all place Finland, Norway and Sweden at
the top in terms of the relative equality of women and
men in terms of health, education, political
participation, and economic empowerment.
However, a recent paper notes that gender equality
assessments have not included entrepreneurship as an
economic factor, nor have they all been focused on
ranking groups of countries. In addition, general
business-enabling environment (BEE) assessments
have not integrated gender-differentiated factors
influencing business start-up and success in their
analysis. It may then come as no surprise that none of
the countries ranked in the top ten with respect to small
business climate overlap with the countries ranked in
the top ten on gender equality. This points out the need
for more integration of gender-awareness in broad-
based business-enabling environmental assessments, as
well as a more formal inclusion of the results of broad-
based BEE assessments into gender-focused
assessments.
Source: J. Weeks (2011), 'Assessing Business Enabling
Environments: How Gender Changes the Equation'
*The Global Entrepreneurship and Development Institute’s
Global Entrepreneurship Development Index, Heritage
Foundation’s Index of Economic Freedom, World Bank’s
Doing Business, World Economic Forum’s Global
Competitiveness Index.
** The Economist Intelligence Unit’s Women’s Economic
Opportunity Index, the United Nation’s Global Development
Index, the UN Gender Empowerment Measure, and the World
Economic Forum’s Global Gender Gap analysis.
5
Gender-GEDI Report of Findings (2013)
A major impediment to comparative research on female entrepreneurship has been the dearth of reliable
data. Thankfully, new datasets like the World Bank’s Global Findex Database and the World Bank’s
Women, Business and the Law provide gender specific data on previously under-researched areas such as
access to basic financial resources (i.e. ‘access to a bank account’) and equal legal rights. However, many
data gaps still exist in key areas.
Another consideration is how to define ‘female entrepreneurship’. Many studies take a broad approach;
including all female entrepreneurs, ranging from informal petty traders and shopkeepers to high tech
startups. Though all forms of female entrepreneurship are important, higher levels of business
sophistication often require additional resources, skills and aspirations.
High impact, high growth or high potential female entrepreneurship: Does it matter?
High impact or high growth entrepreneurs constitute a sub-segment of entrepreneurs who are
characterized by rapidly growing businesses. But only a small fraction of all entrepreneurs want to scale
their businesses. According to an Ernst and Young 2011 study in which 80,000 adults in 60 countries
were surveyed, only 3 out of every 1,000 respondents achieved high growth (Morris 2012). These high
impact entrepreneurs, defined in terms of their growth aspirations4, tended to be college educated and had
internationally-oriented businesses. Thus ‘high growth’ entrepreneurs make up only a small fraction of all
entrepreneurs.
It is also not easy to pick which entrepreneurs will successfully grow their businesses exponentially. In a
study of rapidly growing firms in the US, Acs and Mueller (2008) find positive short term employment
increases but negative employment effects two years after startup and then later, pronounced positive
long-term employment effects. In other words, rapidly growing firms (often called ‘gazelles’)
demonstrate their major employment effects only after they have been in business for at least five years or
up to twenty-five years after startup (2008:96). This study illustrates the difficulty in identifying business
gazelles, since it can take a number of years for them to emerge. Instead of focusing solely on potential
‘gazelles’ it may be a more productive strategy to promote a healthy entrepreneurial eco-system that
supports a diverse array of female owned firms from which gazelles can grow.
Given the difficulty in identifying gazelles and the small fraction they represent of all entrepreneurs, we
feel it is more beneficial to broaden our focus to ‘high potential’ female entrepreneurs. We define ‘high
potential’ female entrepreneurs as those who exhibit characteristics associated with high growth outcomes
but which may currently be an aspiration rather than an achievement. Thus, high potential female
entrepreneurs are ‘market expanding, export oriented, innovative’ entrepreneurs5.
When a country is not utilizing its full potential, the economy as a whole suffers. Fewer ‘high potential’
female entrepreneurs result in fewer ideas being realized, less innovation, less export potential and fewer
jobs created. Through their entrepreneurial activities, high-potential female entrepreneurs not only
contribute to improving their own economic welfare but to improving the economic and social fabric of
society through job creation, innovative products, processes, and services, and cross border trade.
Moreover, as women, female entrepreneurs have unique capabilities to reach out to female customers6.
These innovations do not have to follow the expected ‘hi-tech’ route to reach phenomenal success. Take,
for example, US-based Sara Blakely, who at age 42 became the world’s youngest self-made female
billionaire based on the success of her high growth business, Spanx, which manufactures shapewear
targeting an exclusively female clientele7.

6
Gender-GEDI Report of Findings (2013)
This report is structured as follows. The following section presents our process of data selection and index
construction. Section three presents our results, including an assessment of six key subject areas and
regional analyses. This section also includes a conclusion and discussion of future steps and data gaps.
Section four provides country pages which detail the Gender-GEDI results for each country and include
additional country-level data we found relevant for providing contextual details missing from the Gender-
GEDI indicators.
1 Ruta Aidis, Gender-GEDI Project Director
2 Necessity based entrepreneurs are individuals who started their businesses out of necessity (such as needed
income, couldn't find another job, etc.). 3 Opportunity based entrepreneurship is defined as individuals who started their businesses due to opportunity
motivation. 4 Expecting to increase the number of employees by 5+ in the next five years.
5 This definition is based on the definition for 'productive' entrepreneurship suggested by the Global
Entrepreneurship and Development Index 2012 (Acs & Szerb, 2012). 6 As Mrs. Roney, co-founder of the US-based highly successful web-based businesses 'The Knot' and 'XO group'
noted: 'Women are going to come up with the best ideas for women, who are driving our economy' (Seligson 2012). 7 Spanx has recently introduced a male line of shapewear but Sara made her initial millions off of designing
shapewear for women.

7
Gender-GEDI Report of Findings (2013)
Chapter 2: Methodology and Data
2.1 Introduction
In this chapter, we present the methodology and data used to construct the Gender-GEDI Index. We begin
by introducing the Gender-GEDI model and framework in section 2.2. In section 2.3, we describe the
Penalty for Bottleneck Methodology which we use for the Gender-GEDI to highlight the lowest index
values or pillar ‘bottleneck’ for each individual country in our sample. The construction of the index is
discussed in section 2.4 and the data selection is presented in the following section 2.5. The final section
2.6 provides detailed descriptions of the variables used in the Gender-GEDI.
2.2 Methodology and Data
The conditions and characteristics that lead to ‘high potential’ female entrepreneurship occur on multiple
levels. Female entrepreneurs, like their male counterparts, are influenced by the general business
environment in which they live. If the general business environment is unstable, if the procedures for
starting, running or exiting a business are highly regulated or bureaucratic, this would form a disincentive
for male and female startups alike. But in some cases, formal institutions or cultural conditions exist that
create additional barriers for women that make it more difficult to start or grow a business enterprise.
Such conditions can include diminished legal rights (either for all women or with respect to rights that
women may give up at marriage) or restrictions to women’s activities outside of the home or her ability to
travel within her community, outside her community, or outside her country. In addition, this combination
of gendered attitudes, social norms and beliefs can result in more limited access to resources critical for
‘high potential’ female entrepreneurship development such as education, skills and finance.
Attitudes also play a crucial role in forming opinions that create a country’s ‘entrepreneurial culture,’
meaning how the general population views entrepreneurial endeavors, risk assessment, and acceptance of
business ownership as a viable career option. This cultural environment in turn influences individual
opportunity recognition and willingness to take the risk to start a new venture.
The institutional foundations including gendered institutions, access to resources and the entrepreneurship
culture form the context from which female startups emerge. In focusing on ‘high potential’ female
entrepreneurship, we are specifically interested in female startups that exhibit characteristics that are
related to ‘high impact entrepreneurship’ which we define as market expanding, innovative and exporting
businesses. The interaction between these five layers is captured in the Gender-GEDI model shown in
figure 2.1.

8
Gender-GEDI Report of Findings (2013)
Figure 2.1 The Gender-GEDI Model
In order to facilitate our analysis, we incorporate the five-level approach presented in the Gender-GEDI
model into the Gender-GEDI framework. The Gender-GEDI framework is composed of three sub-
indices: Entrepreneurial Environment, Entrepreneurial Eco-System and Entrepreneurial Aspirations.
Broadly speaking, Entrepreneurial Environment focuses on assessing the ‘entrepreneurial spirit and
culture’ of a given society as well as the presence of institutions to support entrepreneurial startups. The
Entrepreneurial Eco-System contains variables that capture the access to resources and institutions needed
for female business development. The final sub-index, Entrepreneurial Aspirations, focuses on the
individual entrepreneurial characteristics as well as resource availability needed for ‘high potential’
female entrepreneurship to prosper and contribute to economic growth. These three sub-indices stand on
15 pillars, each of which contains an individual and an institutional variable that corresponds to the
micro- and the macro-level aspects of entrepreneurship. Unlike other indices that incorporate only
institutional or individual variables, the pillars of the Gender-GEDI include both individual and
institutional variables. These pillars attempt to capture the open-ended nature of entrepreneurship;
analyzing them can provide an in-depth view of the strengths and weaknesses of those listed in the index.
The Gender-GEDI Framework is shown in Figure 2.2 and the 15 pillars are described in detail below.
Institutional
Foundations
Gendered Institutions
Gendered Access to Resources
Entrepreneurship Culture
High Potential
Female Entrepreneurship
Characteristics

9
Gender-GEDI Report of Findings (2013)
Fig. 2.2: The Gender-GEDI Framework
Key: Individual-level variables are underlined.
The five pillars of the Entrepreneurial Environment sub-index described
Pillar 1: OPPORTUNITY PERCEPTION. This pillar captures the potential of ‘opportunity perception’ by
women in terms of their abilities to ‘act’ on those opportunities based on the country’s legal rights
legislation. Research has shown that a population’s opportunity perception potential is an essential
ingredient of entrepreneurial startups (Sorensen & Sorenson 2003).
But if women are socialized
differently, they will perceive opportunities in a different way (DeTienne & Chandler 2007). This pillar
includes an individual variable that measures the percentage of the female population that can identify
good opportunities to start a business in the area where they live. However, the desire to act on these
opportunities for some women is constrained legally since in a number of countries worldwide, women
do not share the same legal rights as men. The ‘Equal Legal Rights’ variable measures the parity of laws
for women and men in 27 key areas including capacity, property rights and employment.
Pillar 2: STARTUP SKILLS. Launching a successful venture requires the potential entrepreneur to have
the necessary startup skills (Papagiannidis & Li 2005). The individual variable, ‘Perception of Skills’
measures the percentage of the female population who believe they have adequate startup skills to start a
business. The results of the Global Entrepreneurship and Development Index (GEDI) have shown that
higher percentages of both men and women in developing countries believe they have the necessary skills
P15: External Financing
Female Business Investors
Financial Access
P14: Internationalization
Export Focus
Globalization
P5: Cultural Support
Entrepreneur Perception
Access to Childcare
P13: High Growth
Business Gazelles
Female Leadership
P 12: Process Innovation
New Technology
R&D Expenditure
P9: Competition
Innovativeness
Monopolized Markets
P4: Networking
Know an Entrepreneur
Female Internet Users
P3: Willingness and Risk
Willingness to Start
Business Risk
P8: Quality of Human Resources
Highly Educated Owners
SME Support & Training
Pillar 11: Product Innovation
New Product
Technology Transfer
Sub-index 3: Entrepreneurial Aspirations
P2: Start up Skills
Perception of Skills
Higher Education
Pillar 1: Opportunity Perception
Opportunity Recognition
Equal Legal Rights
Pillar 6: Opportunity Start up
Opportunity Business
Bus Freedom & Movement
Sub-index 2: Entrepreneurial Eco-System
Sub-index 1: Entrepreneurial Environment
P7: Technology Sector
Tech Sector Business
Female Science Graduates
P10: Voice & Agency
Entrepreneurship Ratio
Labor Force Ratio

10
Gender-GEDI Report of Findings (2013)
to start a business, but in reality, they often lack a more complex level of skills needed to grow a business
to scale to the next level of size and sophistication. Hence, education, especially postsecondary education,
plays a vital role in teaching and developing entrepreneurial skills and building networks. Therefore we
combine ‘Perception of Skills’ with an institutional variable measuring the percentage of women with
post-secondary education (Higher Education).
Pillar 3: WILLINGNESS AND RISK. Of the personal entrepreneurial traits, fear of failure is one of the
most important obstacles to the startup process (Caliendo et al. 2009). Women have often been viewed as
more ‘risk adverse’ than men but more recent research has indicated that the main difference lies in the
way in which men and women perceive themselves and their environments (Langowitz & Minniti 2007).
This pillar includes the variable ‘Willingness to Start’ which measures the percentage of the female
population who do not believe that fear of failure would prevent them from starting a business. However,
the institutional variable, 'Business Risk' takes a more macro-level view and reflects the availability and
reliability of corporate financial information, the protection of creditors by law, and the institutional
support of inter-company transactions.
Pillar 4: NETWORKING. Networking is critical for entrepreneurs. Entrepreneurs who have better
networks are more successful, can identify more viable opportunities, and access more and better
resources (Shane & Cable 2003). The Networking pillar combines two strong indicators for networking.
The first, individual-level indicator ‘Know an Entrepreneur’ shows the percentage of the female
population who personally know an entrepreneur who started a business within the last two years. The
second, institutional-level indicator measures the percentage of female Internet users. The Internet opens
up new opportunities for entrepreneurial networking that eliminate temporal, geographic as well as
gendered social constraints that have in many cases limited women’s access to information and resources.
Pillar 5: CULTURAL SUPPORT. This pillar combines the female population’s attitudes towards
entrepreneurs in their countries in term of status and a good career choice with access to childcare.
Entrepreneurship is a socially constructed phenomenon (Welter, 2008) and the views toward
entrepreneurship vary and are socially embedded (Davidsson 2003; Steyaert & Katz 2004). In other
words, without strong cultural support, the best and brightest may not decide to apply their skills towards
entrepreneurship (Baumol 1990). The individual variable ‘Entrepreneurial Perception' provides the
percentage of the female population that says that entrepreneurship is a good career choice and enjoys
high status. The associated institutional variable measures access to childcare that is both affordable and
of high-quality. It also includes the role of the extended family in providing childcare. Social norms as
well as personal ‘internalized’ gendered beliefs worldwide result in women being the primary care-takers
for their children. Access to affordable and high-quality childcare expands mothers’ opportunities to
pursue entrepreneurial activities.
The five pillars of the Entrepreneurial Eco-System sub-index described
Pillar 6: OPPORTUNITY STARTUP. This pillar combines the level of female opportunity-motivated
startup activity with regulatory constraints as well as gendered constraints to participate fully in business
activities. An entrepreneur’s motivation for starting a business is an important signal of quality.
Opportunity entrepreneurs are believed to be better prepared, to have superior skills, and to earn more
than what we call necessity entrepreneurs. The individual level variable 'Opportunity Business' provides
the percentage of female Total Entrepreneurial Activity (TEA)12
businesses started to exploit a good
opportunity, to increase income, or to fulfill personal aims; in contrast to those women who have started

11
Gender-GEDI Report of Findings (2013)
businesses because they had no other options for work. The institutional variable combines both an
overall measure of the business environment with a specific gendered measure that affects business
activity. ‘Business Freedom’ captures overall burden of regulation, as well as the regulatory efficiency of
the government in influencing startups and operating businesses. This is combined with ‘Freedom of
Movement’, a gendered institutional variable that measures the freedom of women to move outside the
home, which is an essential element for expanding business activity.
Pillar 7: TECHNOLOGY SECTOR. Currently, technology-based businesses play a critical role in
innovation, economic development and growth. The individual level variable for this pillar ‘Tech Sector
Business’ measures the percentage of female TEA businesses that are active in the medium or high
technology sectors. The institutional variable ‘Female Science Grads’ gathered by UNESCO is the
percentage of female graduates in Science. This measure provides us with an indication as to the pool of
potential tech sector female entrepreneurs.
Pillar 8: QUALITY OF HUMAN RESOURCES. The prevalence of high-quality human capital is vitally
important for ventures that are highly innovative and require an educated, experienced, and healthy
workforce to continue to grow. A critical feature of a startup with high growth potential is the
entrepreneur’s level of education (Bates 1990).
The ‘Highly Educated Owners’ variable captures the
quality of entrepreneurs; it is widely held that entrepreneurs with higher education degrees are more
capable and willing to start and manage high-growth businesses. The quality of employees also has an
impact on business development, innovation, and growth potential. In addition, female entrepreneurs
having a higher degree may not be the only advantage in education as graduate school may open up
access to key networks and networking channels that help female entrepreneurs in their businesses
(Morris 2012). The institutional variable 'SME Support and Training' measures another important aspect
for business skill development through SME support and training. It considers not only the availability
(including geographic availability), accessibility and affordability of the programs, but also additional
gendered factors such as the length of the program (taking into account women’s time burdens) as well as
if the program is culturally appropriate for women to participate in.
Pillar 9: COMPETITION. Competition is a measure of the level of a business’ product or market
uniqueness, combined with the market power of existing businesses and business groups.
‘Innovativeness’ is defined as the percentage of female businesses that have only a few competitors that
offer the same product or service. However, market entry can also be prevented or made more difficult if
there are powerful business groups dominating the market. The extent of market dominance by a few
business groups is measured by the institutional level variable ‘Monopolized Markets’. Lower degrees of
monopolized markets should facilitate new business entry.
Pillar 10: VOICE & AGENCY. This pillar measures two important aspects of gender parity in
entrepreneurship and in the labor force. In essence it captures the ability of women to be active and
participate on par with men in economic activities. The first variable 'Entrepreneurship Ratio' measures
the ratio of female to male TEA. This percentage includes both opportunity and necessity driven
entrepreneurs and makes no distinction between formal or informal entrepreneurial activity. It therefore
measures the total engagement of women and men in startup and early stage entrepreneurial activity. The
second variable 'Labor Force Ratio' measures the ratio female to male labor force participation. Female
labor force participation provides a good indication of the ability of women to be take part in formal
economic activities, important for paving the way for women’s greater economic visibility as ‘high
potential’ female entrepreneurship.

12
Gender-GEDI Report of Findings (2013)
The five pillars of the Entrepreneurial Aspirations sub-index described
Pillar 11: PRODUCT INNOVATION. New product innovation plays a crucial role for ‘high potential’
female entrepreneurship success. The individual variable ‘New Product’ is a measure female TEA
entrepreneurs who are offering new products to their customers or adopting existing products. The
corresponding institutional variable is ‘Technology Transfer’, which is a measure combining important
aspects of technology transfer such as investment in R&D by the private sector; the presence of high-
quality research institutions; active collaboration in research between universities and industry and
intellectual property rights protection.
Pillar 12: PROCESS INNOVATION. This pillar highlights the important role played by applying and/or
creating new technology for high potential female entrepreneurs by including micro and macro
dimensions supporting innovation. The individual variable ‘New Technology’ is defined as the
percentage of TEA female businesses whose principal underlying technology is less than five years old.
The institutional variable used here relates to research and development (R&D) on a macro scale. R& D
Expenditure is the R&D percentage of Gross Domestic Product (GDP) as reported by OECD. While
R&D alone does not guarantee successful growth, it is clear that without systematic research activity, new
product development—and therefore future growth—will be inhibited (Stam & Wennberg 2009).
Pillar 13: HIGH GROWTH. This pillar combines the percentage of high-growth TEA female businesses
that intends to employ at least ten people and plan to grow more than 50 percent in five years (Business
Gazelles) with a variable measuring the percentage of female managers (Female Leadership). Though the
'Business Gazelle' variable measures expected growth and not actual growth, there is evidence that
attitudes towards growth are good indications of future entrepreneurial activity (Aidis & Mickiewicz
2006). We include the percentage of female managers as the institutional variable, since higher rates of
female managers are important for ‘high potential’ female entrepreneurs for a number of reasons. Most
importantly, female managers often embody the ‘education, skills and experience needed for successful
‘high potential’ female entrepreneurship and as such form a pool of potential candidates. Also the
percentage of female managers provides a good indication of a country’s overall acceptance of women in
positions of leadership and decision-making.
Pillar 14: INTERNATIONALIZATION. A widely applied proxy for internationalization and growth is
exporting, since exporting demands capabilities beyond those needed by businesses that produce only for
domestic markets. An individual variable measuring the percentage of female TEA businesses exporting
(Export Focus) is included as a defining characteristic of high potential female entrepreneurs. The
institutional variable used is Globalization, which captures the degree to which a country’s entrepreneurs
are internationalized, as measured by businesses’ exporting potential, controlling for the extent to which
the country is economically globalized.
Pillar 15: EXTERNAL FINANCING. The availability of external financing, particularly equity rather
than debt, is an essential precondition for fulfilling entrepreneurial aspirations that are beyond an
individual entrepreneur’s personal financial resources (Gompers & Lerner 2004). In general, women-
owned businesses start with both lower levels of overall capitalization and lower ratios of debt financing
than men-owned businesses (Carter & Allen 1997; Coleman 2000). Anecdotal evidence suggests that sex
discrimination may be an influence, which leads researchers to state the need to accumulate more
knowledge in this area (Brush et al. 2004). In this pillar, we combine the presence of female informal
investors (Female Business Investors) with an institutional variable that includes both the percentage of
women with a bank account at a formal institution and women’s access to finance programs.

13
Gender-GEDI Report of Findings (2013)
The GEDI Penalty for Bottleneck methodology is applied to the pillar scores so that the ‘bottleneck’ (i.e.
the pillar with the lowest score) penalizes the final country ranking. This allows for the inter-related
nature of the pillars to affect the final scores. This approach encourages countries to address their weakest
areas first, since that improvement will have the greatest effect on their final score. Without this
procedure, countries could put additional resources in areas of relative strength in order to improve their
final score, yet this would not lead improvement for ‘high potential female entrepreneurs’. Since the
variables inter-relate to one another, their balance is important. This is similar to baking a cake. For
example, increasing your score in education will not lead to further increases in weak areas such as the
availability of informal finance. The same is true for baking. If you don’t have enough eggs, adding more
flour or sugar will not solve the problem of missing eggs. A more detailed description of the Penalty for
Bottleneck Methodology is given in the following section.
2.3 Penalty for Bottleneck Methodology
In the ‘Penalty for Bottleneck (PFB) Methodology’, a bottleneck is defined as the worst performing link
or a binding constraint in the system. With respect to entrepreneurship and the Gender-GEDI, a
bottleneck indicates a shortage or the lowest level of a particular entrepreneurial pillar, relative to other
pillars. This notion of a bottleneck is important for policy purposes. The PFB suggests that pillars
interact; if they are out of balance, 'high potential' female entrepreneurship is inhibited. The pillar values
should be adjusted in a way that takes into account this notion of balance. After normalizing the scores of
all the pillars, the value of each pillar of a country is penalized by linking it to the score of the pillar with
the weakest performing pillar in that country. This simulates the notion of a bottleneck; if the weakest
pillar were improved, ultimately the whole GEDI would show a significant improvement. Moreover, the
penalty should be higher if differences are higher. From the perspective of either the configuration or the
weakest link, it implies that stable and efficient configurations are those that are balanced (have about the
same level) in all pillars.
Equation (1) describes the PFB methodology:
( ) (1)
where is the modified, post-penalty value of pillar j in country i
is the normalized value of index component j in country i
is the lowest value of for country i.
i = 1, 2,……n = the number of countries
j= 1, 2,.……15= the number of pillars

14
Gender-GEDI Report of Findings (2013)
For each pillar, the bottleneck is calculated by adding one, plus an expression that depends on the
difference between that pillar’s country value and the value for that country’s weakest pillar. Thus,
improving the score of the weakest pillar will have a greater effect on the index than improving the score
of stronger pillars. For example, assume the normalized score of a particular pillar in a country is 0.60
and the lowest pillar value is 0.19. The difference is 0.41 and the final adjusted value of the pillar is 0.19
+ 0.34 = 0.53 instead of 0.60. The largest potential difference between two pillars can be 1, when a
particular country has the highest value in one pillar and the lowest value in another. In this case the
maximum penalty is 0.368, and the final adjusted value is 1-0.368= 0.632 instead of 1.
We suggest that this dynamic index construction is particularly useful for enhancing female
entrepreneurship since it facilitates pinpointing the specific area or areas that need improvement.
Dynamic index construction highlights the importance of more balanced pillar scores since the penalty for
bottleneck will have the least effect on the overall country ranking when the difference between the pillar
scores is negligible. In general, a country's policy efforts should be focused on the lowest ranking pillar in
order to improve its overall ranking. However, if a country is characterized by the extremes: a
combination of both very low and very high pillar scores, then focusing simply on the lowest scoring
pillar may not lead to noticeable improvement in a country's overall score since another weak pillar score
will form the next bottleneck. In this instance, it is useful for a country to focus its efforts on the weakest
performing pillars. Thus the policy message is to address the weakest performing pillar (or pillars) first,
since it exerts a negative effect on all the other pillars.
2.4 Index Construction
The construction of the Gender-GEDI Index was an eight step process:
1. The selection of variables: We chose variables that we could access from original, internationally
recognized data sources. Altogether we use 15 individual and 15 institutional variables. Wherever
possible, we used data from 2011, and individual data are calculated based on a 2008-2010 pooled data
set.
2. The construction of the pillars: The pillars are calculated using the interaction variable method, that is,
by multiplying the individual variable with the corresponding institutional variable.
3. Normalization: The next step in constructing the Gender-GEDI Index is to normalize the pillar values
to a 0 to 1 range. This form of normalization is compatible with the PFB method (shown below)
(1)
for all j= 1 ... k, the number of pillars

15
Gender-GEDI Report of Findings (2013)
where is the normalized score value for country i and pillar j
is the original pillar value for country i and pillar j
is the maximum value for pillar j
4. Capping: Since extreme values or outliers could distort the normalized scores, we selected the 95th
percentile score adjustment, meaning that any observed values higher than the 95th percentile were
lowered to the 95th percentile.
5. Average pillar adjustment: The different averages of the normalized values of the pillars imply that
reaching the same indicator values requires different effort and resources. Since we want to apply the
Gender-GEDI for public policy purposes, the additional resources for the same marginal improvement of
the indicator values should be the same for all indicators. Therefore, we need a transformation to equate
the average values of the components. Equation 2 shows the calculation of the average value of a pillar ̅
. (2)
We want to transform the xi values such that the potential minimum value is 0 and the maximum value is
1:
(3)
where denotes the number of countries with the minimal original value. The transformed values
meet with the required assumptions, but they cannot exceed 1. It means that .
6. Penalizing: After these transformations, the Penalty for Bottleneck (PFB) methodology is used to
create indicator-adjusted PFB values. We define our penalty function as follows:
( ) (4)
1
n
i
i
x
xn
0 if 0
1 1 otherwise
i
i
i
x
y n k nyx
n k nx
k iy
1 k
yn

16
Gender-GEDI Report of Findings (2013)
where is the modified, post-penalty value of pillar j in country i
is the normalized value of index component j in country i
is the lowest value of for country i.
i = 1, 2,……n = the number of countries
j= 1, 2,.……m= the number of pillars
7. Sub-index calculation: The value of each sub-index is then calculated as the arithmetic average of its
PFB-adjusted indicators for that sub-index multiplied by 100 to get a 100-point scale.
8. Gender-GEDI point calculation: Finally, the Gender-GEDI index is calculated as the simple
arithmetic average of the three sub-indices. Since 100 represents the theoretically available limit for total
number of Gender-GEDI points possible, it can also be interpreted as a measure of entrepreneurship
resource efficiency for high potential female entrepreneurship development.
Though the results of the Gender-GEDI index presented here are based on 17 countries, the index
calculation process included additional countries to provide more accurate benchmarking.
In several cases, we had to contend with missing variables. The percentage of ‘Female Science
Graduates’ was missing for Russia and also South Africa. We estimated both of these percentages using
data points from countries nearby. For Russia, we used data from Belarus and for South Africa we used
data from Angola. We were also missing data for South Africa for the percentage of women with a post-
secondary education and we used data we felt was comparable from Swaziland. While this is not ideal, it
was felt that inclusion of information where available was better than exclusion short of perfection.
2.5 Data Selection and sources
The data used for the Gender-GEDI index is comprised of both individual level and institutional level
data. The individual level data is compiled from the Global Entrepreneurship Monitor dataset. We
specifically use pooled data from 2008-2010 Adult Population Survey.
All five of the individual-level variables that make up the Entrepreneurial Environment sub-index are
based on attitudes and perceptions that focus on responses from the adult female population (aged 18-64).
These responses make up the ‘entrepreneurship culture’ level of the Gender-GEDI model (Figure 2.3) and
presented in table form below (Table 2.1). The other nine individual variables that make up the
Entrepreneurial Environment and Entrepreneurial Aspirations sub-indices are based on the responses of
female entrepreneurs engaged in what GEM calls ‘Total Entrepreneurship Activity’ which is defined as
individuals involved in the startup process whose businesses are not older than 42 months and/or those
that have not paid a salary for longer than three months. These variables make up the innermost level of
the Gender-GEDI model called ‘Female Entrepreneurship Individual Characteristics’.

17
Gender-GEDI Report of Findings (2013)
One of the novelties of the GEDI index framework, adopted by the Gender-GEDI, is the matching of an
individual-level variable with an institutional-level variable at the pillar level in order to capture the
interplay between both these factors that affect outcomes.
For our index, we selected institutional level variables that would represent the three additional levels of
our Gender-GEDI model. The first is comprised of the institutional foundations that affect all
entrepreneurs, regardless of whether they are male or female. These include the Business Freedom
(compiled by the Heritage Foundation and based on the World Bank’s ‘Ease of Doing Business Index’),
Business Risk (Coface) , Market Monopolization (World Economic Forum – WEF), Technology Transfer
(WEF), R&D Expenditure (UNESCO) and Globalization (KOF Swiss Economic Institute).
The second level of analysis is comprised of gendered institutions, which captures the areas where
women do not share the same rights as men. We include two indicators: Equal Legal Rights which is a
composite indicator we compiled based on 27 separate measures from the Women, Business and the Law
database (World Bank). The second indicator is ‘Freedom of Movement’ from the Gender, Institutions
and Development Database (OECD). In most countries in our sample there are no restrictions on
women’s movement outside the home, yet we found it important to highlight the cases where these
restrictions are applied since it affects a woman’s ability to independently start and grow her business.
Since ‘Freedom of Movement’ is only relevant in a limited number of cases, we merged this variable with
the more general measure ‘Business Freedom’ in order to create the ‘Business Freedom and Movement’
variable.
The third level includes variables that identify areas where women’s access to resources may be more
limited than men’s. These include access to education as measured by percentage of women with post-
secondary education and the percentage of female graduates with degrees in Science (both sourced from
UNESCO); the percentage of female internet users was sourced from the International
Telecommunication Union (ITU); Access to SME support and training programs for women, access and
availability of childcare are based on data from the Economist Intelligence Unit’s (EIU) Women and
Economic Opportunity Index. In order to capture the gendered comparison of women’s labor
participation, this is provided as a female/male ratio obtained from the World Bank. For most countries,
the percentage of female managers is obtained from the Global Gender Gap Index (World Economic
Forum), but for Japan and India, where the data was missing, this percentage was estimated based on
Grant Thornton’s 2011 Women in Senior Management Report3. For financial access, we combined two
variables: The percentage of women with a bank account in a formal institution using data from the
Financial Inclusion database (Findex, World Bank) and Women’s Access to Finance Programs compiled
by the EIU for the Women’s Economic Opportunity Index.
A potential criticism of our index might be the apparently arbitrary selection of institutional variables and
the neglect of other important factors. We aimed to collect the best possible indicators informed by
current research on female entrepreneurship. However, our variable choices were often constrained by the
limited availability of comparative and representative data for the 17 countries included in our pilot study.
The lack of adequate comparative data on female entrepreneurship in general and the factors that
influence its development plagues the field of female entrepreneurship research and severely constrains
the ability to conduct robust quantitative analysis.

18
Gender-GEDI Report of Findings (2013)
Table 2.1: Gender-GEDI Model with variables
Institutional-level variables Individual-level variables
Pillar Institutional
Foundations
Gendered
Institutions
Gendered Access
to Resources
Entrepreneurship
Culture
Female
Entrepreneurship
Individual
Characteristics
1 Equal Legal
Rights
Opportunity
Recognition
2 High Education
Startup Skills
3 Business Risk
Willingness to Start
4 Internet Users
Know an Entrepreneur
5 Business
Freedom
Freedom of
Movement
Entrepreneurship
Perception
6 Access to
Childcare
Opportunity
Business
7 Female Science
Graduates
Technology Sector
8 SME support and
training
Highly educated
owner
9 Market
Monopolization
Innovativeness
10 Labor Force Ratio Entrepreneurship
Ratio
11 Technology
Transfer
New Product
12 R&D
Expenditure
New Technology
use
13 Female
Leadership
Business Gazelles
14 Globalization
Export Focus
15 Financial access Female Business
Investors

19
Gender-GEDI Report of Findings (2013)
Figure 2.3: Gender-GEDI model
Key: Purple shaded levels indicate institutional-level variables; green shaded levels indicate individual level
variables.
Institutional
Foundations
6 variables
Gendered Institutions
2 variables
Gendered Access to Resources
8 variables
Entrepreneurship Culture
5 variables
High Potential
Female Entrepreneurship
Characteristics
10 variables

20
Gender-GEDI Report of Findings (2013)
2.6 Variable Description Tables
Sub Index I: Entrepreneurial Environment
Pillar 1: Opportunity Perception
Individual level variable Institutional level variable
Female Opportunity (GEM)
measures the “opportunity perception” of a
population, defined as the female percentage of the
18-64 aged population that can identify good
opportunities to start a business in the area where
they live.
Source: Based on author calculated GEM data
http://www.gemconsortium.org
Equal Legal Rights (WBL – WB) (2011 data)
27 Indicators grouped as follows:
1) Do men and women have equal capacity by
law?(10 indicators)
2)Do married men and women have equal capacity
by law?(10 indicators)
3) Do men and women have equal ownership rights
over movable and immovable property?(2
indicators)
4) Can women work the same night hours as
men?(1)
5) Can women work in all industries?(1)
6) Can pregnant and nursing mothers work the
same hours and in the same industries as men and
other women?(1)
7) Is the statutory retirement age in the private
sector equal for men and women?(1)
8) Do men and women face the same personal
income tax liability?(1)
The final scoring is based on the total score for the
27 separate indicators. For each indicator
0 = unequal while 1 = equal under the law; total
scoring: 0 – 27with highest score: 27 – converted
to percentages
Source: http://wbl.worldbank.org/data
Pillar 2: Start up Skills
Individual level variable Institutional level variable
Female Skill (GEM)
measures the percentage of the 18-64 aged female
population who believe they have proper skills to
successfully launch a business.
Source: Based on author calculated GEM data
http://www.gemconsortium.org
Women’s Post-Secondary Education (UNESCO)
is defined as the gross enrolment ratio in tertiary
education.
Source: http://stats.uis.unesco.org/unesco/
Pillar 3: Willingness and Risk
Individual level variable Institutional level variable
Willingness to Start (GEM)
is defined as the percentage of the 18-64 aged
female population who do not believe that fear of
failure would prevent them from starting a business
Business Risk (Coface)
The business climate rate “assesses the overall
business environment quality in a country… It
reflects whether corporate financial information is
available and reliable, whether the legal system
provides fair and efficient creditor protection, and

21
Gender-GEDI Report of Findings (2013)
Source: Based on author calculated GEM data
http://www.gemconsortium.org
whether a country’s institutional framework is
favorable to intercompany transactions.” It is a
part of the Country Risk Rate.
Source: http://www.coface.com/
Pillar 4: Networking
Individual level variable Institutional level variable
Know an Entrepreneur (GEM)
is the percentage of the 18-64 aged female adult
population who personally know an entrepreneur.
This variable is a proxy for networking, which has
been found to improve entrepreneurship through
increased access to opportunities and better
resources.
Source: Based on author calculated GEM data
http://www.gemconsortium.org
Female Internet Users, (ITU) (2011- varies)
Number of female Internet Users per 100
inhabitants. 2011 data used whenever possible.
Source: http://www.itu.int/ITU-D/ict/statistics/
IndividualsUsingInternet_00-10.xls
Pillar 5: Cultural Support
Individual level variable Institutional level variable
Entrepreneur Perception (GEM)
The GEM variable NBGOODAV measures
the average percentage of the female
population aged 18-64 who say that
entrepreneurship is a good career choice
while the GEM variable NBSTATAV
measures the average percentage of the
female population aged 18-64 who say that
entrepreneurs enjoy high status. ‘Career
Status’ combines the averages of these two
variables.
Source: Based on author calculated GEM
data http://www.gemconsortium.org
Access to Childcare (WEO-EIU) (2010 data) This indicator considers the availability, affordability
(including the price of childcare as a percent of average
wages) and quality of childcare services. This indicator
also includes the role of the extended family in providing
childcare.
Scoring as follows:
1 = professional childcare is expensive, available for only
a small minority and of low quality; or the extended
family is unwilling to provide childcare, owing to strong
and widely prevalent societal/cultural barriers to women
working.
2= Professional childcare has two of the three following
conditions: it is expensive, difficult to obtain or of low
quality or extended family generally unwilling to provide
childcare, owing to societal/cultural barriers to women
working. The extended family may find it difficult to
provide childcare if they themselves work or due to
distance.
3 = Professional childcare is moderately affordable, often
available and of reasonable quality; or the extended
family is willing to provide childcare but may be able to
do so only occasionally because they themselves work or
due to distance.
4 = Professional childcare meets two of the three
following conditions: it is affordable, easily available and
of high quality or the extended family is willing to provide
childcare and is able to do so with only some difficulty.
5 = Professional childcare is affordable, easily and
widely available, and of high quality; or the extended

22
Gender-GEDI Report of Findings (2013)
family is willing and able to provide childcare.
The scoring is based on a 1- 5 scale. 5 = the most
favorable.
Source:
http://graphics.eiu.com/upload/WEO_June_2010_final.xls
Sub-Index II: Entrepreneurial Eco-system
Pillar 6: Opportunity Start up
Individual level variable Institutional level variable
Female TEA Opportunity (GEM)
is defined as the percentage of female Total
Entrepreneurial Activity (TEA) businesses started
to: exploit a good opportunity, increase income, or
fulfill personal aims, in contrast to those
businesses started by individuals who have no
other employment options.
Note: Total Entrepreneurship Activity is the
percentage of 18-64 population who are either a
nascent entrepreneur or owner-manager of a new
business (no more than 42 months old)
Source: Based on author calculated GEM data
http://www.gemconsortium.org
Business Freedom (Heritage) (2011 data) &
Freedom of Movement (GID-OECD) (2009 data)
Business Freedom is a quantitative measure of the
ability to start, operate and close a business that
represents the overall burden of regulation, as well
as the efficiency of government in the regulatory
process. This variable includes 10 factors based on
the World Bank’s ‘Doing Business Study’. Each
factor receives a maximum of 10 points and the
indicator’s total score is between 0-100.
Freedom of Movement measures the freedom of
women to move outside the home. Following
elements were considered: freedom to travel;
freedom to join a club or association; freedom to do
grocery (and other types of) shopping without a
male guardian; freedom to see one’s family and
friends. 3 point scale:
0 – No restrictions of women’s movement outside
the home;
0.5 – (Some) women can leave home sometimes, but
with restrictions;
1 – Women can never leave home without
restrictions (i.e. they need a male companion, etc.)
Source for Business Freedom:
http://www.heritage.org/index/explore
Source for Freedom of Movement:
http://stats.oecd.org/Index.aspx?DatasetCode=GID2
23
Gender-GEDI Report of Findings (2013)
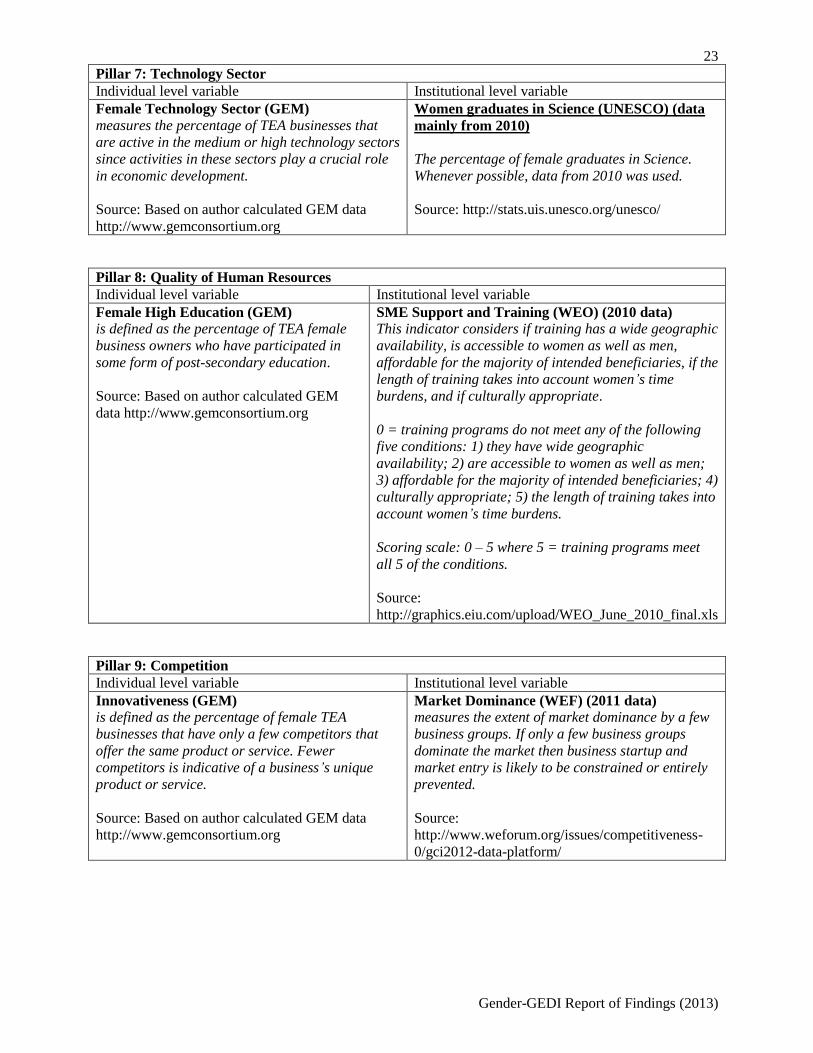
Pillar 7: Technology Sector
Individual level variable Institutional level variable
Female Technology Sector (GEM)
measures the percentage of TEA businesses that
are active in the medium or high technology sectors
since activities in these sectors play a crucial role
in economic development.
Source: Based on author calculated GEM data
http://www.gemconsortium.org
Women graduates in Science (UNESCO) (data
mainly from 2010)
The percentage of female graduates in Science.
Whenever possible, data from 2010 was used.
Source: http://stats.uis.unesco.org/unesco/
Pillar 8: Quality of Human Resources
Individual level variable Institutional level variable
Female High Education (GEM)
is defined as the percentage of TEA female
business owners who have participated in
some form of post-secondary education.
Source: Based on author calculated GEM
data http://www.gemconsortium.org
SME Support and Training (WEO) (2010 data)
This indicator considers if training has a wide geographic
availability, is accessible to women as well as men,
affordable for the majority of intended beneficiaries, if the
length of training takes into account women’s time
burdens, and if culturally appropriate.
0 = training programs do not meet any of the following
five conditions: 1) they have wide geographic
availability; 2) are accessible to women as well as men;
3) affordable for the majority of intended beneficiaries; 4)
culturally appropriate; 5) the length of training takes into
account women’s time burdens.
Scoring scale: 0 – 5 where 5 = training programs meet
all 5 of the conditions.
Source:
http://graphics.eiu.com/upload/WEO_June_2010_final.xls
Pillar 9: Competition
Individual level variable Institutional level variable
Innovativeness (GEM)
is defined as the percentage of female TEA
businesses that have only a few competitors that
offer the same product or service. Fewer
competitors is indicative of a business’s unique
product or service.
Source: Based on author calculated GEM data
http://www.gemconsortium.org
Market Dominance (WEF) (2011 data)
measures the extent of market dominance by a few
business groups. If only a few business groups
dominate the market then business startup and
market entry is likely to be constrained or entirely
prevented.
Source:
http://www.weforum.org/issues/competitiveness-
0/gci2012-data-platform/

24
Gender-GEDI Report of Findings (2013)
Pillar 10: Voice & Agency
Individual level variable Institutional level variable
Entrepreneurship Ratio (GEM)
The female/male ratio of Total
Entrepreneurship Activity (TEA) rates.
Source: Based on author calculated GEM
data http://www.gemconsortium.org
Labor Force Ratio (WB) (2011 data)
The female/male ratio of Labor Force Participation.
Source:
http://data.worldbank.org/indicator/SL.TLF.CACT.FE.ZS
Sub-Index III: Entrepreneurial Aspirations
Pillar 11: Product Innovation
Individual level variable Institutional level variable
New Product (GEM)
is defined as the percentage of those female TEA
businesses offering products or services that are
new to at least some costumers.
Source: Based on author calculated GEM data
http://www.gemconsortium.org
Technology Transfer (WEF) (2011 data)
These are the innovation index points from the
Global Competitiveness Index (GCI): a complex
measure of innovation including investment in
research and development (R&D) by the private
sector, the presence of high-quality scientific
research institutions, the collaboration in research
between universities and industry, and the
protection of intellectual property rights.
Source:
http://www.weforum.org/issues/competitiveness-
0/gci2012-data-platform/
Pillar 12: Process Innovation
Individual level variable Institutional level variable
New Technology (GEM)
is defined as the percentage of female TEA
businesses whose principal underlying technology
is less than five years old.
Source: Based on author calculated GEM data
http://www.gemconsortium.org
R&D Expenditure (UNESCO) (2011 data)
Gross domestic expenditure on Research &
Development as a percentage of GDP.
Source: http://stats.uis.unesco.org/unesco/
Pillar 13: High Growth
Individual level variable Institutional level variable
Business Gazelles (GEM)
measures the percentage of female TEA businesses
that intend to employ at least ten people and plan
to grow more than 50 percent in five years.
Source: Based on author calculated GEM data
http://www.gemconsortium.org
Female Leadership (GGGI – WEF) (2011 data)
Percentage of female managers
Source: http://reports.weforum.org/global-gender-
gap-report-2012/

25
Gender-GEDI Report of Findings (2013)
Pillar 14: Internationalization
Individual level variable Institutional level variable
Female Export (GEM)
is defined as the percentage of female TEA
businesses where more than 1% of
customers are outside of the home country.
Source: Based on author calculated GEM
data http://www.gemconsortium.org
Globalization (KOF) (2011 data)
A part of the Globalization Index measuring the economic
dimension of globalization. The variable involves the
actual flows of trade, Foreign Direct Investment, portfolio
investment and income payments to foreign nationals as
well as restrictions of hidden import barriers, mean tariff
rate, taxes on international trade and capital account.
Source:
http://globalization.kof.ethz.ch/globalization_2011b_long.xls
Pillar 15: External Financing
Individual level variable Institutional level variable
Female Business Investors (GEM) is defined as the percentage of female
informal investors in the population aged 18-
64, multiplied by the average size of an
individuals’ investment in new businesses
owned by other individuals.
Female Credibility (WB – Findex) (2011 data)
Percentage of women who have a bank account at a
formal financial institution.
Source:
http://datatopics.worldbank.org/financialinclusion/

26
Gender-GEDI Report of Findings (2013)
Source: Based on author calculated GEM
data http://www.gemconsortium.org Women’s access to finance programs (WEO-EIU)
(2010 data)
This question assesses three types of programs:
1) Initiatives to provide financial accounts to women
2) Outreach efforts aimed at improving women
entrepreneur’s access to credit/loans/lines of credit, etc.
3) Provision of financial literacy and/or risk management
programs for women
Scoring:
1 = none of the programs are available;
2 = only one of the three programs is available but is it
limited in scope (less than 20% of the women in the
formal sector have access);
3 = two of the three programs are available, but they are
modest in scope (about 50% of women in the formal
sector have access) or only one of the three programs is
available but it is reasonably broad in scope (about 70%
of women in the formal sector have access);
4= Two of the three programs is available, and are
reasonably broad in scope(about 70% of women in the
formal sector have access)/ or women’s access to
financial services is already very broad, so these
programs are largely unnecessary;
5 = All three programs are available, they are
comprehensive in scope/ or women’s access to financial
services is already widespread, so these programs are
unnecessary;
Scoring 1 – 5
Maximum score is 5. 5 = most favorable
Source:
http://graphics.eiu.com/upload/WEO_June_2010_final.xls
Notes
1 Total Entrepreneurship Activity is the percentage of 18-64 population who are either a nascent entrepreneur or
owner-manager of a new business (no more than 42 months old) (source: GEM; www.gemconsortium.org) 2 ibid.
3 Grant Thornton's Women in Senior Management Report 2011 can be accessed at: http://www.grantthorton.com

27
Gender-GEDI Report of Findings (2013)
Chapter 3: Gender-GEDI Results
3.1 Introduction
An index is an ideal tool for simplifying highly complex relationships and distilling them down to a final
rank, set of scores and for benchmarking progress. By integrating the different critical components that
create the conditions for fostering high potential female entrepreneurship, this report presents an initial
attempt at comparing countries according to the same set of key indicators. As such, the Gender-GEDI
index serves as a barometer of a country's current situation relative to a group of other countries with
respect to the conditions present that will fuel high potential female entrepreneurship development. In this
way, it can be a powerful tool for policy makers and other decision makers in terms of identifying the
areas that need improvement in order to foster high potential female entrepreneurship development.
However, an index and overall score cannot substitute for a thorough understanding and analysis of a
given country's context. In the results section, we will provide some glimpses into specific issues as well
as country and regional comparisons. We have limited our analysis in this pilot project phase to a
relatively small number of broad issues, though our framework is suitable for much deeper targeted
analysis for a single country or country clusters.
Being ranked #1 in the Gender-GEDI index does not mean there is no further need for improvement. The
Gender-GEDI calculates relative country scores and there is room for improvement at all rank levels.
Higher-ranking countries also display weaknesses, often in areas where lower ranking countries excel,
since despite their overall ranks, every country is characterized by its unique set of strengths and
weaknesses. By identifying its strengths and weaknesses, a country can chart a course for improvement,
in many cases using another country's exemplary performance as a starting point for discussion and
analysis. Obtaining a top rank is not a static position, and is subject to the relative performance of other
countries. Only countries that are actively cultivating gender parity in terms of access to resources and
institutions as well as their institutional foundations and entrepreneurial spirit retain their top positions.
This chapter begins by presenting the Gender-GEDI rankings for our 17-country sample. This is followed
by a further analysis of the Gender-GEDI rankings which is divided into two main parts: the first section
presents and describes six distinct insights obtained from the Gender-GEDI scores. The second section
presents regional analyses. This chapter ends with a presentation of policy conclusions and future steps.
3.2 The Gender-GEDI rankings
Our initial analysis, focusing on 17 countries representing a variety of regions and economic development
contexts, places the United States in first place followed by Australia, Germany, France and Mexico.
Rounding out the top ten are the United Kingdom, South Africa, China, Malaysia, and Russia (shown in
Table 3.1).

28
Gender-GEDI Report of Findings (2013)
Table 3.1 Gender-GEDI rankings
Rank Country Overall score Rank Country Overall score
1 United States 76 10 Russia 40
2 Australia 70 11 Turkey 40
3 Germany 63 12 Japan 39
4 France 56 13 Morocco 38
5 Mexico 55 14 Brazil 36
6 UK 51 15 Egypt 34
7 South Africa 43 16 India 32
8 China 41 17 Uganda 32
9 Malaysia 40
Even though the US ranks #1, it achieves an overall score of just 76 on the 100-point scale. Even among
the ten top-ranked countries there is a distinct gap between the US and Australia, which score 76 and 70
respectively, and the next four countries, and there is a further gap between 6th-ranked United Kingdom
(which scores 51) and 7th-ranked South Africa, which scores 43.
It is also of interest to compare how countries rank with respect to their Gender-GEDI ranking and their
original Global Entrepreneurship and Development Index (GEDI)11
ranking, which does not differentiate
between sex or include any gender-specific variables. Six countries are rated more highly with respect to
high potential female entrepreneurial development than with respect to general entrepreneurial conditions,
five countries’ ranks worsen and six countries’ relative ranks are similar for both. The top two ranked
countries, the US and Australia, maintain their relative ranks in both the Gender-GEDI and the GEDI
Index. The two countries whose ranks increased to the greatest degree relative to the other 16 countries
included in the Gender-GEDI were Mexico (who moved up from 10th place in the GEDI to 5
th place in the
Gender-GEDI) and Russia (who moved up from 15th place in the GEDI to 10
th place in the Gender-
GEDI). In terms of greatest decrease to final rank, Japan’s rank dropped 6 places from being 6th in the
GEDI to 12th in the Gender-GEDI, and the UK’s relative ranking dropped by 3 places, from being 3
rd in
the GEDI to 6th place in the Gender-GEDI. Egypt and India’s relative rankings also decreased by 3 places,
going from 12th to 15
th for Egypt and from 13
th to 16
th for India.

29
Gender-GEDI Report of Findings (2013)
Figure 3.2: The Gender-GEDI and GEDI rankings compared
Key: Blue columns that extend below the red parity line indicate countries that receive higher relative
ranks in the Gender-GEDI Index; blue columns that are above the red parity line indicate countries that
receive lower scores in the Gender-GEDI index and blue columns that reach the red parity line indicate
no difference in rank for the Gender-GEDI and GEDI scores.
3.3 Six Key Findings described
Reviewing the results of this first pilot Gender-GEDI analysis, including the scores of the countries with
respect to the indices and sub-indices, leads to the following overall points:
1. There is no single method for fostering ‘high potential’ female entrepreneurship;
2. Filling the female startup education gap is an important area for improvement for many countries;
3. Economic development alone is not enough to foster high potential female entrepreneurs;
4. Business formalization is important for successful, scalable enterprises – especially with respect
to improving access to capital;
5. Business freedom (meaning removing legal and regulatory impediments to growth) is a necessary
condition for a vibrant entrepreneurial economy;
6. Social norms are a frequently hidden barrier: lifting the cultural veil that can restrict a woman’s
entrepreneurial vision is critical to unleashing female entrepreneurial potential.
Each of these points is discussed in further depth below.
0
2
4
6
8
10
12
14
16
18
GEDI rankGender GEDI rank

30
Gender-GEDI Report of Findings (2013)
3.3.1. No single recipe for success exists
Looking at how high-ranking countries compare with respect to the major factors of entrepreneurial
environment, institutional eco-system and individual aspirations shows that there is no single recipe for
success – leading countries blend together different factors in varying amounts to achieve success. Figure
3.3 below compares the overall Gender-GEDI ranking with the overall scores for the individual sub-
indices: Entrepreneurial Environment, Entrepreneurial Eco-System and Entrepreneurial Aspirations12
. In
most cases, and especially for the top performers, the three sub-index scores are at similar levels – usually
with less than a 10-point score difference. More balanced scores are able to provide an environment
supportive for current and future high potential female entrepreneurship development.
However other countries show spikes or deeper dips in certain sub-indices. For example, Russia’s score
for the Entrepreneurial Eco-System is as far above average as the Entrepreneurial Environment sub-index
is below average, showing very uneven conditions for startup activity. For example, Russia scores well in
‘high potential’ female entrepreneurship startup activity in terms of having a high percentage of female
startup entrepreneurs that are highly educated, opportunity-driven and engaged in the technology sector.
However, the country has much lower scores for opportunity recognition and startup skills among the
female population as a whole.
It is interesting to note that whereas several high-income, developed countries show clearly lower scores
for the Entrepreneurial Environment sub-index (Germany & Japan), a number of developing and middle-
income countries have their highest scores in the Entrepreneurial Environment sub-index. This indicates a
greater receptiveness in terms of opportunity recognition and skills to start new ventures in those
developing economies.
Figure 3.1: Gender-GEDI Overall Country Scores and Sub-index Scores
0
10
20
30
40
50
60
70
80
90Gender-GEDI
Environment
Eco-System
Aspiration

31
Gender-GEDI Report of Findings (2013)
3.3.2 Addressing the female entrepreneur education gap is critical
The percentage of highly educated women (those that have participated in some form of post-secondary
education) is increasing in many countries globally, but as the results of our 17 country sample shows,
many are not choosing to become entrepreneurs. In fact, in some countries the percentage gap of the
highly educated female population is 20% or greater than the percentage of highly educated female
business owners. This is the case in Brazil (45% difference), Morocco (45% difference), Malaysia (28%
difference) and China (31% difference).
However, in the top Gender-GEDI performers, the education gap is reversed: More female entrepreneurs
are highly educated compared to the overall percentage for the female population. This is true in the US,
Australia, Germany and also in Russia, a middle range performer (which has the highest percentage of
highly educated female business owners out of the 16 other countries in our sample).
Higher education not only provides high potential female entrepreneurs with the skills needed to grow
their businesses, but also broadens their networks, another critical factor for high potential female
entrepreneurship success.
In five of the countries included in our sample: the US, UK, Malaysia, Russia and Brazil, the percentage
of women with a post-secondary education is the same at 57% . However the percentages of highly
educated female startup entrepreneurs in these five countries are very different. Russia comes out on top
with 87% of female startup entrepreneurs being highly educated while only 12% and 29% of the female
startup entrepreneurs are highly educated in Brazil and Malaysia respectively. In the US, 77% of female
startup entrepreneurs are highly educated while in the UK only 54% of female startup entrepreneurs are
highly educated.
Moreover, the general trend seen in other developing and emerging economies is similar to that in
Malaysia, where the desire to exploit an entrepreneurial opportunity is high amongst the less educated
female population, yet the abilities (in terms of skills, networks, access to resources, etc.) are missing and
so these entrepreneurial aspirations rarely move beyond a subsistence, small-scale business phase.
As shown in Figure 3.4, the lower rates of highly educated female entrepreneurs do not seem related to
less favorable opinions regarding entrepreneurship as a career and in terms of overall status. In Japan,
64% of female entrepreneurs are highly educated, yet only 39% of the female population believes that
entrepreneurship is a good career and that entrepreneurs enjoy high status. In contrast, in France, the
majority of the female population believes that entrepreneurship is a good career with good status, yet it is
the only high income country in our sample where the percentage of highly educated female
entrepreneurs is less than 45%.

32
Gender-GEDI Report of Findings (2013)
Figure 3.2: Education and Entrepreneurial Status
Data sources: GEM (2011); UNESCO (2011)
3.3.3. Economic development is not enough to foster high-potential female entrepreneurs
As Figure 3.5 shows, the general relationship between a country’s overall Gender-GEDI Index score and
per capital GDP level indicates that lower income countries receive lower Gender-GEDI scores while
higher income countries receive higher Gender-GEDI scores. We find that the relationship is stronger for
lower income countries than for higher income countries, as one can see that the dispersion of the country
points increases as per capita GDP levels rise.
0.00
0.10
0.20
0.30
0.40
0.50
0.60
0.70
0.80
0.90
1.00
Un
ite
d S
tate
s
Au
stra
lia
Ger
man
y
Fran
ce
Me
xico
Un
ite
d K
ingd
om
Sou
th A
fric
a
Ch
ina
Mal
aysi
a
Ru
ssia
Turk
ey
Jap
an
Mo
rocc
o
Bra
zil
Egyp
t
Ind
ia
Uga
nd
a
Highly educated female owner
Female high education
Entrepreneurship status

33
Gender-GEDI Report of Findings (2013)
Figure 3.3: The Relationship between Gender-GEDI scores and per capital GDP13
Though Japan, the United Kingdom and the United States are all high-income countries with relatively
strong institutional foundations in terms of a business environment that is overall stable and not overly-
regulated, their Gender-GEDI ranks are very different. Out of 17 countries, the US is ranked #1, the UK
ranked #6 and Japan ranked #12. As Figure 3.6 shows, Japan has the lowest levels of opportunity
recognition among women, skill level for startups and status for entrepreneurship. In addition, Japan has
the lowest percentage of female managers (out of the 17 developed and developing countries in our
sample).
0.00
10.00
20.00
30.00
40.00
50.00
60.00
70.00
80.00
0 10000 20000 30000 40000 50000 60000 70000
Ge
nd
er-
GED
I fi
nal
sco
re
Per capita GDP in international $
0
0.2
0.4
0.6
0.8
11
2
3
4
5
6
7
89
10
11
12
13
14
15 USA
UK
Japan
Opportunity
Perception Startup Skills
Willingness and Risk
Networking
Cultural
Support
Opportunity Startup
Technology Sector
Quality of Human Resources Competition
Voice & Agency
Product
Innovation
Process
Innovation
High Growth
Internationalization
External Financing
Figure 3.4: Three High-Income Economies Compared: The US, UK and Japan

34
Gender-GEDI Report of Findings (2013)
3.3.4. Business formalization is important for successful, scalable enterprises
Access to a formal bank account is critical for high potential female entrepreneurs, especially since it is a
necessary precursor to financing – bank loans, credit lines, etc. – that will fuel their further growth. But in
many parts of the world, few women have access to bank accounts, most notably in Egypt (7%), Uganda
(15%), Mexico (22%), India (26%), Morocco (27%) and Turkey (33%). Contrast this with the top
performers where the percentage of women with bank accounts is close to 100% such as in Germany,
Australia, the UK, Japan and France (see Figure 3.7). Formal financing is especially important for female
entrepreneurs, who tend to have less personal capital to invest in their businesses.
Figure 3.5: Percentage of Women with a Bank Account at a Formal Institution
Source: World Bank Findex Database (2011)
0
20
40
60
80
100
120

35
Gender-GEDI Report of Findings (2013)
3.3.5. Business freedom is a necessary condition
When focusing on high potential female entrepreneurship, the general business environment cannot be
overlooked – therefore include female/male total entrepreneurship activity ratios (the share of adult
women engaged in business ownership compared by the share of men so engaged) with the general
business environment in terms of ease of starting, running and exiting a business ('Business Freedom'
variable, compiled by the Heritage Foundation) and the 'Business Risk' variable which assessing the
overall business environment and climate (compiled by Coface) in our analysis.
As shown in Figure 3.8, we see a high ratio of female/male total entrepreneurship activity in a number of
countries such as Brazil, Uganda and Malaysia, yet the business environment has a greater regulatory
burden. This can lead to more female entrepreneurs choosing not to formalize their operations (which can
stunt their growth) as well as fewer businesses surviving or even making it through the startup phase.
Countries with the highest levels of business freedom – such as Australia, the US and Germany – also
display relatively high ratios of female/male entrepreneurial activity.
Figure 3.8: Business Environment and Entrepreneurship Ratio Compared
Source: Business Risk (Coface 2011); Business Freedom (Heritage Foundation, 2011); Entrepreneurship Ratio
(GEM 2011)
In many cases, Business Freedom and Business Risk have a similar tendency, yet there are exceptions
such as is the case for Malaysia, South Africa and India. Between the two, Business Freedom would
appear to have a greater effect on high potential female entrepreneurs, since it focuses specifically on
business-related regulations.
0.00
0.10
0.20
0.30
0.40
0.50
0.60
0.70
0.80
0.90
1.00
Un
ite
d S
tate
s
Au
stra
lia
Ger
man
y
Fran
ce
Me
xico
Un
ite
d K
ingd
om
Sou
th A
fric
a
Ch
ina
Mal
aysi
a
Ru
ssia
Turk
ey
Jap
an
Mo
rocc
o
Bra
zil
Egyp
t
Ind
ia
Uga
nd
aBusiness Risk
Business Freedom
EntrepreneurshipRatio

36
Gender-GEDI Report of Findings (2013)
3.3.6. Social norms: Lifting the veil unleashes female potential
Social norms impact female entrepreneurship in a number of ways. For one thing, they impact the general
societal support for women as entrepreneurs, which can affect an individual woman’s decision to take the
risk to become an entrepreneur. Social norms also impact the access women have to experiences as
decision-makers and leaders as well as to the range of occupations where women work – all of which may
act to either impede or encourage the development of high potential female entrepreneurs.
With respect to pre-entrepreneurial career development, the US leads with the highest percentage of
female managers (43%), followed by France, Germany, Russia and Brazil, which all boast more than 35%
female managers (see Figure 3.9 below). Access to higher education forms the foundation for high
potential female entrepreneurship but management experience provides women with additional skills,
experience and networks which can facilitate female entrepreneurship success and business growth. But,
for a sizeable group of countries in our sample, the pool of female managers is very small. The lowest
percentage is in Japan (9%), followed by Turkey (10%), Egypt (11%) and Morocco (13%).
Figure 3.9: Percentage of Female Managers
Source: Global Gender Gap Index (2011)14
Another very revealing comparison of our 17 countries is of the attitudes towards the capabilities of the
hypothetical male business executive versus the hypothetical female business executive. As shown in
Figure 3.10, two overall findings characterize our 17 country sample: (1) all countries register a gender
difference (i.e. in no country are females considered as ‘good’ as male executives, and (2) greater
percentages of male respondents tend to believe that men make better business executives than women.
The most striking results are for Egypt (less than 20%) and India (less than 50%) of both males and
43
37 38 39
31
35
30
17
24
37
10 9
13
36
11 13
33
0
5
10
15
20
25
30
35
40
45
50

37
Gender-GEDI Report of Findings (2013)
females disagreed with the statement that ‘men make better business executives than women’ while in
Morocco, Malaysia, Russia, South Africa and Turkey, larger percentages of women disagreed with the
statement than men. The majority of men in all five countries agreed with the statement that ‘men make
better business executives than women’. When such a strong opinion is expressed in a hypothetical case
(where the actual capabilities of the male and female executive are unknown), it is reasonable to expect
that attitudes towards women in other positions demanding decision-making and leadership capabilities
such as high potential female entrepreneurs would encounter a similar bias.
Figure 3.10: Perceptions of Female Business Ability
Source: World Values Survey (various years)
Worldwide, women receive less outside funding for their businesses than men. But the gap becomes even
more apparent for high potential female entrepreneurs in need of greater amounts of risk capital typically
provided by Venture Capital (VC). Comparative, sex-disaggregated data on VC funding is not widely
available15
. But as Figure 3.11 shows, for the 7 countries for which data is available, men still dominate
the top management positions in VC investments firms, and in some cases, such as Japan, women are
almost entirely missing.
0%
10%
20%
30%
40%
50%
60%
70%
80%
90%
100%
Percent that disagree with the statement "Men make better business executives than women"
Women
Men

38
Gender-GEDI Report of Findings (2013)
Figure6: Percentage of Men among Top Managers of VC Investment Firms
Source: Gaule & Piacentini (2012)
Other non-traditional forms of funding such as crowdfunding may provide high potential female
entrepreneurs with an alternative source of startup and growth capital but as Figure 3.12 shows, this is not
yet a widely available option in most countries included in our sample.
Figure 3.12: Crowdfunding Availability
Source: data compiled from www.crowdfund.org
81.7 78.7
74.9
83.9 86.8
97.9 90.9
0.0
10.0
20.0
30.0
40.0
50.0
60.0
70.0
80.0
90.0
100.0
UnitedStates
Germany France UnitedKingdom
China Japan India
0
20
40
60
80
100
120
140
160
Un
ite
d S
tate
s
Au
stra
lia
Ger
man
y
Fran
ce
Mex
ico
Un
ite
d K
ingd
om
Sou
th A
fric
a
Ch
ina
Mal
aysi
a
Ru
ssia
n F
ed
erat
ion
Turk
ey
Jap
an
Mo
rocc
o
Bra
zil
Egyp
t, A
rab
Rep
.
Ind
ia
Uga
nd
a
Number of CrowdfundingPlatforms: Donations
Number of CrowdfundingPlatforms: Equity
Number of CrowdfundingPlatforms: Loans
0
2
4
6
8
10
12
14
16
18
20
Un
ite
d S
tate
s
Au
stra
lia
Ger
man
y
Fran
ce
Mex
ico
Un
ite
d K
ingd
om
Sou
th A
fric
a
Ch
ina
Mal
aysi
a
Ru
ssia
n F
ed
erat
ion
Turk
ey
Jap
an
Mo
rocc
o
Bra
zil
Egyp
t, A
rab
Rep
.
Ind
ia
Uga
nd
a

39
Gender-GEDI Report of Findings (2013)
Furthermore, social norms regarding care responsibilities (especially of children) can hinder women’s
advancement as leaders and decision-makers even in spite of seemingly female-friendly employment
options. A recent study16
suggests there is a tradeoff between some policies that make it easier for women
to combine work and family and for women’s advancement at work. Specifically, countries with greater
availability of work flexibility and part-time options often have greater female labor force participation
but also tend to have fewer women in higher-level (especially management) positions. Part of the reason
for this is that women tend to choose the more flexible employment options and the other is that
employers cannot tell which women are likely to use these options. As a result, employers may be wary
of hiring women for high-level positions. Interestingly, in the US, where flexibility and part-time options
are virtually non-existent, women’s labor force participation is lower but the percentage of women in
management positions is one of the highest in the world. At first glance, it may seem like family-friendly
policies are hurting women’s career advances, yet the real culprits are the social norms and gendered
expectations that result in the vast majority of women choosing flexible work options. Social norms may
also exert a similar influence on the development of high potential female entrepreneurs.
3.3.7 Female startup entrepreneur exporting behavior
An additional interesting finding worth nothing was the differences in export behavior of female startups
in our 17 country sample. Through exporting their goods and services, high potential female
entrepreneurs move into new markets, allowing to business growth and contributing to economic growth
and global market integration. The Gender-GEDI captures a wide range of results with 60% or more
female entrepreneurs exporting their goods and services in Morocco, the US, Germany and Turkey Yet, in
a number of other countries, such as in Brazil (6%), Uganda (12%), Russia (13%) and India (14%), very
few female entrepreneurs export.
Figure 3.13: Percentage of female startups that are exporting
0.00
0.10
0.20
0.30
0.40
0.50
0.60
0.70
0.80
0.90

40
Gender-GEDI Report of Findings (2013)
3.4 Gender-GEDI Results Regional Focus
In this section we present a brief analysis for regional groups and country clusters, which include Latin
America, BRICS countries, European countries, MENA countries and Asian - Pacific countries.
3.4.1: Latin America: A look at two very different set of conditions
For our Latin American regional snapshot, we compare the scores for Mexico and Brazil. Mexico ranks
within the top five countries occupying 5th place between France in 4th place and the UK in 6th place. In
fact, it's Gender-GEDI ranking moves up 5 places from its GEDI ranking in 10th place. In comparison,
Brazil ranks in 14th place positioned Morocco in 13th place and Egypt in 15th place and it also ranked in
14th place in the GEDI Index.
Mexico outperforms Brazil in a number of key areas: In Mexico relatively more women know
entrepreneurs (52%) than in Brazil (39%). Knowing an entrepreneur is a proxy for entrepreneurial
networks. Also, knowing an entrepreneur can provides a role model for women considering
entrepreneurship. Mexico also has a much higher percentage of highly educated female startups (40%),
while Brazil displays one of the lowest relative percentages for highly educated female startups (12%). In
addition, in Mexico almost half of all female startups are engaged in new product development (47%),
compared with only 15% in Brazil. Moreover, significantly more female startups are exporting (39%) in
Mexico than in Brazil (6%).
Looking at the pillar level, Mexico performs better than Brazil on 14 out of 15 pillars, the exception being
Voice & Agency, which is part of the Entrepreneurial Eco-System sub-index, where the two countries
show a similar level of performance. Both chart at the low end for female labor force participation ratio
(54%) and both chart relatively high ratios for female/male entrepreneurship activity (94:100 for Mexico
and 87:100 for Brazil).
Figure 3.14: Mexico (ranked 5th) and Brazil (ranked 14th) pillar performance with the US (ranked
1st included for comparative purposed)
0
0.2
0.4
0.6
0.8
11
2
3
4
5
6
7
89
10
11
12
13
14
15Mexico
Brazil
USA
Opportunity Perception
Startup Skills
Willingness and Risk
Networking
Cultural Support
Opportunity Startup
Technology Sector
Quality of Human Resources Competition
Voice & Agency
Product
Innovation
Process
Innovation
High Growth
Internationalization
External Financing
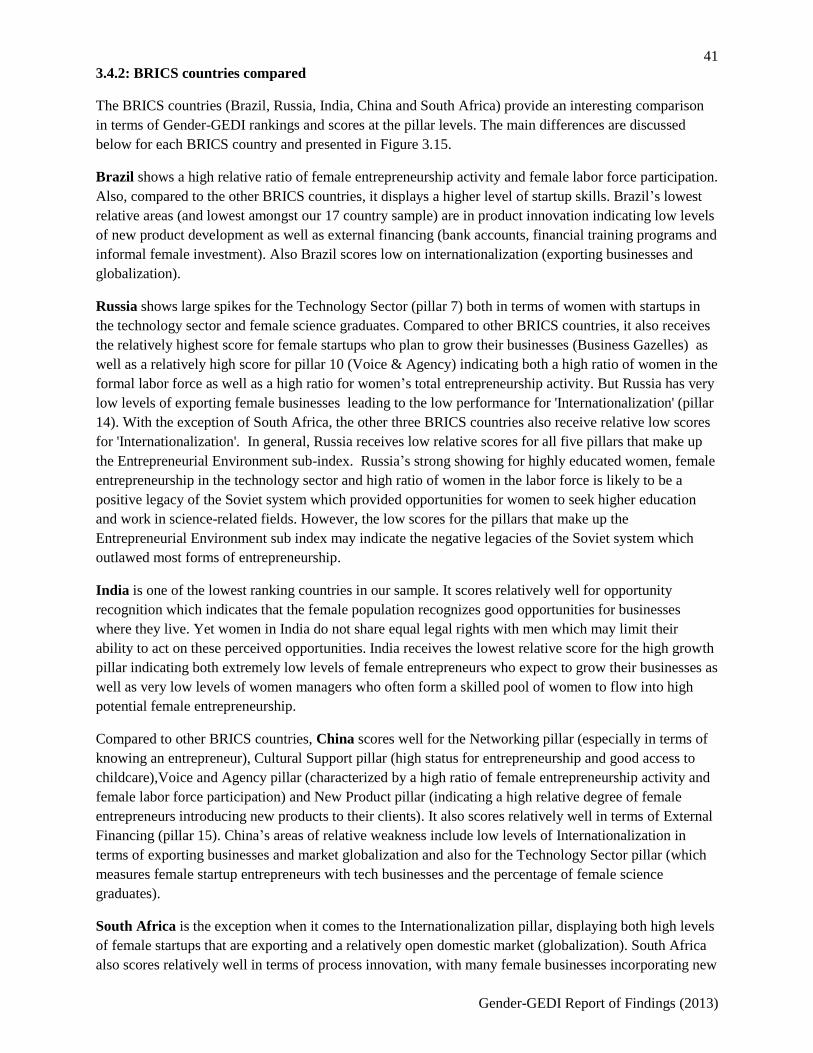
41
Gender-GEDI Report of Findings (2013)
3.4.2: BRICS countries compared
The BRICS countries (Brazil, Russia, India, China and South Africa) provide an interesting comparison
in terms of Gender-GEDI rankings and scores at the pillar levels. The main differences are discussed
below for each BRICS country and presented in Figure 3.15.
Brazil shows a high relative ratio of female entrepreneurship activity and female labor force participation.
Also, compared to the other BRICS countries, it displays a higher level of startup skills. Brazil’s lowest
relative areas (and lowest amongst our 17 country sample) are in product innovation indicating low levels
of new product development as well as external financing (bank accounts, financial training programs and
informal female investment). Also Brazil scores low on internationalization (exporting businesses and
globalization).
Russia shows large spikes for the Technology Sector (pillar 7) both in terms of women with startups in
the technology sector and female science graduates. Compared to other BRICS countries, it also receives
the relatively highest score for female startups who plan to grow their businesses (Business Gazelles) as
well as a relatively high score for pillar 10 (Voice & Agency) indicating both a high ratio of women in the
formal labor force as well as a high ratio for women’s total entrepreneurship activity. But Russia has very
low levels of exporting female businesses leading to the low performance for 'Internationalization' (pillar
14). With the exception of South Africa, the other three BRICS countries also receive relative low scores
for 'Internationalization'. In general, Russia receives low relative scores for all five pillars that make up
the Entrepreneurial Environment sub-index. Russia’s strong showing for highly educated women, female
entrepreneurship in the technology sector and high ratio of women in the labor force is likely to be a
positive legacy of the Soviet system which provided opportunities for women to seek higher education
and work in science-related fields. However, the low scores for the pillars that make up the
Entrepreneurial Environment sub index may indicate the negative legacies of the Soviet system which
outlawed most forms of entrepreneurship.
India is one of the lowest ranking countries in our sample. It scores relatively well for opportunity
recognition which indicates that the female population recognizes good opportunities for businesses
where they live. Yet women in India do not share equal legal rights with men which may limit their
ability to act on these perceived opportunities. India receives the lowest relative score for the high growth
pillar indicating both extremely low levels of female entrepreneurs who expect to grow their businesses as
well as very low levels of women managers who often form a skilled pool of women to flow into high
potential female entrepreneurship.
Compared to other BRICS countries, China scores well for the Networking pillar (especially in terms of
knowing an entrepreneur), Cultural Support pillar (high status for entrepreneurship and good access to
childcare),Voice and Agency pillar (characterized by a high ratio of female entrepreneurship activity and
female labor force participation) and New Product pillar (indicating a high relative degree of female
entrepreneurs introducing new products to their clients). It also scores relatively well in terms of External
Financing (pillar 15). China’s areas of relative weakness include low levels of Internationalization in
terms of exporting businesses and market globalization and also for the Technology Sector pillar (which
measures female startup entrepreneurs with tech businesses and the percentage of female science
graduates).
South Africa is the exception when it comes to the Internationalization pillar, displaying both high levels
of female startups that are exporting and a relatively open domestic market (globalization). South Africa
also scores relatively well in terms of process innovation, with many female businesses incorporating new

42
Gender-GEDI Report of Findings (2013)
technology. Moreover, the high degree of willingness to start a business combined with a stable business
environment, provide a solid combination for new business startups (pillar 3). In terms of areas in need of
improvement to foster high potential female entrepreneurship, South Africa shows very low levels of
female internet users and low levels of women who personally know an entrepreneur, which lead to their
relatively low scores for Networking (pillar 4). Also, a low share of highly educated female startup
entrepreneurs results in lower relative scores for the Quality of Human Resources (pillar 8).
In terms of the general business environment (as measured by market freedom), Russia fares the best of
the BRICS countries but for the sample as a whole, it's relative score for business environment is
moderate, followed by Brazil, S. Africa, China and India.
Figure 3.15: BRICS country performance compared at the pillar level
0
0.1
0.2
0.3
0.4
0.5
0.6
0.7
0.81
2
3
4
5
6
7
89
10
11
12
13
14
15
Brazil
Russia
India
China
South Africa
Opportunity Perception
Startup Skills
Willingness and Risk
Networking
Cultural Support
Opportunity Startup
Technology Sector
Quality of Human Resources Competition
Voice & Agency
Product
Innovation
Process
Innovation
High Growth
Internationalization
External Financing

43
Gender-GEDI Report of Findings (2013)
3.4.3. The European region: Germany, France and the UK compared
The three European countries in our sample generally show less variability between their pillar scores,
albeit with some exceptions. All three countries display a dip in scores for Technology Sector (pillar 7),
with the UK charting the lowest score. This pillar captures the very low percentages of female startups
engaged in the UK's technology sector. France’s high performance for Cultural Support (pillar 5) is
driven both by its high ranking (highest in our 17 country sample) for accessible, affordable and high
quality childcare availability, together with a relatively high percentage of women who believe that
entrepreneurs enjoy high status and entrepreneurship is a good career choice. The UK and Germany do
less well on both accounts. The opposite is true for Quality of Human Resources (pillar 8), where
Germany receives the highest relative score, closely followed by UK with France lagging behind.
Germany’s high score is related to both its high percentage of highly educated female startup
entrepreneurs (almost 70%) as well as offering SME training programs that are available, accessible,
affordable and culturally appropriate for women.
Figure 3.16: European country pillar performance compared
0.00
0.10
0.20
0.30
0.40
0.50
0.60
0.70
0.80
0.901
2
3
4
5
6
7
89
10
11
12
13
14
15Germany
France
UK
Opportunity Perception
Startup Skills
Willingness and Risk
Networking
Cultural Support
Opportunity Startup
Technology Sector
Quality of Human Resources Competition
Voice & Agency
Product
Innovation
Process
Innovation
High Growth
Internationalization
External Financing

44
Gender-GEDI Report of Findings (2013)
3.4.3 The MENA region: Egypt, Morocco and Turkey compared
Turkey is the best overall performer for the MENA countries, ranking 11th, followed by Morocco in 13th
place and Egypt in 15th place. But as Figure 3.17 shows, for pillars 1- 4 Morocco outscores both Turkey
and Egypt. Morocco receives its highest relative rank for the Entrepreneurial Environment sub index
buoyed by higher levels of the female population identifying good opportunities, believing they have the
skills needed for startup and not constrained by ‘fear of failure’. All three countries are characterized by
high portions of the female population stating that entrepreneurship enjoys high status and is a good
career choice (which makes up the 'Cultural Support' pillar 5). However, Morocco's low relative
performance on pillar 5 is attributed to access to childcare. In Morocco, professional childcare is
expensive, difficult to obtain or of low quality whereas childcare availability, affordability or provided by
the extended family is better in Turkey and in Egypt. All three countries receive relatively low scores for
pillar 10 (Voice & Agency) which measures female/male ratio for labor force participation and is
particularly low, less than 4:10. Also it includes the female/male startup ratio which is lowest for Turkey
less than 3:10 and less than 4:10 for Egypt but much higher in Morocco at almost 6:10. However, though
the startup ratio is higher, Morocco is also characterized by an extremely low percentage of female startup
entrepreneurs who are highly educated. Only 2% of female startups are highly educated in Morocco.
However, all three countries also have restrictions on women’s equal legal rights which influences their
relatively low scores for pillar 1 (Opportunity Perception). For all three countries, there are restrictions on
working hours for women as well as women not being able to work in certain industries, and Turkey also
restricts certain types of work from women who are pregnant. In comparison to the other two MENA
countries, Egypt is the most restrictive, including restrictions on women for travel and restrictions on
married women as heads of households.
Figure 3.17: MENA region pillar performance compared
0.00
0.10
0.20
0.30
0.40
0.50
0.60
0.701
2
3
4
5
6
7
89
10
11
12
13
14
15Morocco
Turkey
Egypt
Opportunity Perception
Startup Skills
Willingness and Risk
Networking
Cultural Support
Opportunity Startup
Technology Sector
Quality of Human Resources Competition
Voice & Agency
Product
Innovation
Process
Innovation
High Growth
Internationalization
External Financing

45
Gender-GEDI Report of Findings (2013)
3.4.4: The Asia and Pacific region: Australia, Japan, China, Malaysia and India compared
In the Gender-GEDI Australia ranks in second place (behind the US which is in first position) and as
figure 3.18 shows, it leads the other Asian and Pacific countries in terms of the quite balanced pillar
scores, dipping in score only for the Technology sector (pillar 7) and Product Innovation (pillar 11).
Australia displays exceptionally strong performance for Quality of Human Resources (pillar 8), Voice
and Agency (pillar 10), High Growth (pillar 13) and External Finance (pillar 15). The remaining four
Asian countries show greater variation between their pillar scores. Japan is quite exceptional in this
regard, with relatively high scores for Product and Process Innovation (pillar 11 and 12) in line with
Australia’s scores, but receiving the lowest relative scores for Opportunity Perception (pillar 1) and Voice
and Agency (pillar 10). China receives its highest scores for Competition (pillar 9) and Product
Innovation (pillar11), but is a low performer for High Growth (pillar 13) and Internationalization (14).
Malaysia shows a relatively high score for Networking (pillar 4) but a low score for Cultural Support
(pillar 5). India ranks 16th in the overall Gender-GEDI index and shows lower scores for most pillars,
with a noticeable exception for Opportunity Perception (pillar 1). The higher score for Opportunity
Perception is driven by a relatively high percentage of the female population that recognizes good
opportunities for starting a business. This result may however also be related to opportunities for
‘informal business activities’ given the large size of India’s informal sector (98% of self-employed
females are working in the informal sector). Both India and Malaysia also impose additional gendered
restrictions on women in terms of more limited freedom of movement outside the home and restrictions to
working hours and working in certain industries which lowers their scores for pillar 1 (Opportunity
Perception).
Figure 3.18: Asia and Pacific countries: Australia, China, Japan, Malaysia and India compared
0.00
0.10
0.20
0.30
0.40
0.50
0.60
0.70
0.80
0.90
1.00
1
2
3
4
5
6
7
89
10
11
12
13
14
15
Australia
China
Japan
Malaysia
India
Opportunity Perception
Startup Skills
Willingness and Risk
Networking
Cultural Support
Opportunity Startup
Technology Sector
Quality of Human Resources Competition
Voice & Agency
Product
Innovation
Process
Innovation
High Growth
Internationalization
External Financing

46
Gender-GEDI Report of Findings (2013)
3.5 Concluding Remarks
The Gender-GEDI analysis highlights the importance of addressing the weakest link in order to create the
conditions suitable for high potential female entrepreneurship to flourish. As our assessment shows, there
is no obvious single weakness that impedes high potential female entrepreneurship development across all
countries. Rather, most countries are confronted by a unique combination of factors. As a tool for
analysis, the Gender-GEDI illustrates both some of the obvious and less obvious areas that need to be
addressed in order to improve circumstances, realigning the incentive structure for women to engage in
startups with growth aspirations. In most cases, addressing the lowest ranking pillar is the logical course
for action. However, for four countries in our sample, removing the legal restrictions that do not allow
women the same opportunities for employment, work hours and freedom of movement outside the home
are paramount. Many countries in our sample will improve the conditions for high potential
entrepreneurship development by increasing women's access to both SME training programs and to
finance ‒ initially to formal bank accounts and financial training programs and then to more sophisticated
forms of financing such as bank loans and VC funding. The more subtle but insidious influence of social
norms also needs to be addressed in order to make way for improvements in women’s participation in the
labor force, women's representation as managers, and female graduates in STEM fields. Those countries
that can alter the cultural norms that undermine a woman’s ability to become skilled, educated and
confident will benefit most as they see high potential women pursue their entrepreneurial ambitions for to
the benefit of economy, culture, and society as a whole. Only with this progress will there be a larger,
more educated and better skilled pool of women from which high potential female entrepreneurs will
emerge. The Gender-GEDI charts the course for improvements in the most critical areas for change.
Our regional analysis highlights several important aspects of fostering high potential female
entrepreneurship. In general we find that the higher ranking countries – the US, Australia and the
European countries in our sample – all tend to have more balanced pillar scores characterized by less
extreme spikes and dips. To a large extent these pillar outcomes are driven by more stable institutional
foundations as well as greater, more equal access to key resources related to high potential female
entrepreneurship. However, we also see that there are areas of improvement for these high performing
countries specifically with promoting an 'entrepreneurial culture' amongst the female population in the
UK, France and Germany to increase Opportunity Perception, Startup Skills and the percentage of female
startups in the technology sector (specifically in the UK and France).
Mexico is an interesting exception to this general trend among the high performers in that it scores very
highly for the two Entrepreneurial Environment pillars: Opportunity Perception and Startup Skills, but
Mexico shows relative weakness in the Cultural Support pillar. For Mexico, the additional areas of
improvement include improving the Quality of Human Resources and External Financing pillars.
The BRICS country analysis provides a glimpse of the differing conditions present in emerging
economies for high potential female entrepreneurship development. There is little uniformity in terms of
pillar scores with one country's strength such as the Technology Sector for Russia, being another
country's weakness (low scores on this pillar for South Africa and China). Most BRICS countries score
low on the Internationalization pillar; the notable exception being South Africa who scores above
average. The only obvious trend for the BRICS countries is the low level of opportunity startups,
indicating that most female startups are initiated out of necessity. India is the lowest ranking BRICS
country ranking 16th out of the 17 countries in our sample. Its strengths lie in a high level of opportunity
perception but correspondingly low score in opportunity startup indicating that the female population may
identify opportunities but the businesses started are for the most part out of necessity. Additional
47
Gender-GEDI Report of Findings (2013)
weaknesses for India include low levels of product development indicative of low innovation and low
levels of exporting female startups. This pattern is quite typical for a developing country context such as
India where the entrepreneurial motivation is present amongst the population but the institutions, training
and skills are not present to support high potential female entrepreneurship. In India's case, restrictions on
women's freedom of movement outside the home as well as restrictions to work in certain occupations
and working hours may have a further limiting effect.
In the process of developing the index, we encountered data limitations (discussed in more depth below)
that likely affected the overall Gender-GEDI results. As we move forward, we will further improve and
fine-tune the Gender-GEDI: including additional countries, refining our variable selection and creating an
annual report for benchmarking progress. We welcome your comments and active participation in this
process through our Gender-GEDI LinkedIn group.
Limitations and Future Steps
The Gender-GEDI uses existing data from reliable, internationally recognized datasets and as such, is
limited by the data that is currently available. In the process of building the Gender-GEDI index, we
identified a number of critical gaps where sex-disaggregated data is missing yet paramount for
understanding high potential female entrepreneurship development. Important areas where data is needed
include comparable data on female entrepreneurship rates that differentiate between part-time and full-
time business owners, home-based businesses and intensity of business operations. Anecdotal evidence
continues to emphasize the importance of social norms on entrepreneurial outcomes yet comparative data
for a wide group of countries beyond a small sample is not available. The World Values Survey collects
some relevant attitudinal questions (one of which we include in our discussion in this chapter) but we
could not include this as a variable in the index since the data for Uganda was missing. Increased data
collection on the influence of social norms and values including the portrayal of female entrepreneurs in
the media is needed to be able to capture its potential influence on further female entrepreneurship
development. In addition, though much emphasis has been placed on the importance of increasing the
numbers of women with STEM education and experience, we were not able to include this area in our
analysis due to dearth of comparable data. Access to capital is frequently mentioned in female
entrepreneurship research as a main impediment to female business success and growth yet there is very
little internationally sex-disaggregated comparable data for this critical issue. As a result, we were only
able to include an indicator for bank account access, female informal investors and access to financial
training programs and some basic data on access to crowdfunding yet we are fully aware that this only
reflects very limited aspects of financial access. High potential female entrepreneurs often need more
sophisticated forms of finance including bank loans and VC funding. Unfortunately this data is not
available. Access to networking is another area where more in depth information is needed since research
indicates that women's networks are more limited yet we do not have the quantitative data to measure
this. Similarly, access to technology is very important for high potential female entrepreneurship
development, but data is lacking in this area as well.
We were also limited in a number of cases where the data was available but was not sex-disaggregated.
This was the case for the individual-level variable measuring the female population's view towards
entrepreneurship as a career and if entrepreneurs enjoyed high status. This question may have received
different responses if it was specifically asked with regards to 'female entrepreneurs' and not
entrepreneurs in general.

48
Gender-GEDI Report of Findings (2013)
Currently, a number of high quality reports exist at the individual and multi country level on female
entrepreneurship. However, they do not allow for further comparative analysis and in most cases, the data
is not updated annually so that benchmarking progress is not possible. There is a tremendous opportunity
to improve our understanding of female entrepreneurship development globally by filling these data gaps.
In the following section, we present the Gender-GEDI results at the country level. We also include
additional country level data that we find relevant for understanding high potential female
entrepreneurship development but were unable to include in our estimations due to the data's limited
country coverage.
Notes
11
For the full report, see Acs and Szerb (2011). 12
The Entrepreneurial Environment sub-index includes 5 pillars that measure the female population's proclivity
towards entrepreneurship and the fundamental institutions and resources to support this; Environmental Eco-System
sub-index focuses on resources and general female entrepreneur characteristics that support business development
and growth; and the Entrepreneurial Aspirations sub-index highlights the individual characteristics, institutions and
resources needed that lead to high potential female entrepreneurs. 13
Additional countries were included for this analysis beyond the 17 focus countries in order to allow for a more
robust comparison. 14
Additional sources also used. Please refer to the Methodology section in Gender-GEDI (2013) for full description. 15
Sharon Vosmek, CEO of Astia, a women's business accelerator, estimates that in the US only 3 - 5% of female
entrepreneurs receive Venture Capitalist funding (www.astia.org). 16
Blau & Kahn (2013)

49
Gender-GEDI Report of Findings (2013)
a b c d
Country page guide
Top level information a. Country flag
b. Country name
c. Region
d. Income Group
Overall Gender-GEDI Rank: This is the country’s rank out of
the 17 countries examined in this pilot phase
Overall Gender-GEDI Score: This is the score (out of 100) that
the country has earned across the Gender-GEDI subindices
Rank
colors: 1-2 3-5 6-8 9-11
12-
14
15-
17
Economy and demographics*
GDP per capita PPP (constant 2005 intl $): (World Bank, 2011)
Adolescent fertility rate: Births per 1,000 women ages 15-19), World
Bank, 2011 data.
Mean female marriage age: Female age at marriage (singulate mean),
World Bank, 2012 data.
CEDAW ratification (5 point scale): From the Women’s Economic
Opportunity Index by the Economist Intelligence Unit (2012) data from
2010 (http://graphics.eiu.com/upload/WEO_June_2010_final.xls).
The scoring for this indicator is as follows:
1= CEDAW has not been ratified by the country under consideration
2= CEDAW has been ratified by the country under consideration, but has reservations with CEDAW
articles, other than Article 29. The country has not signed the Optional Protocol
3= CEDAW has been ratified by the country under consideration, but has reservations with CEDAW
Article 29 only. The country has not signed the Optional Protocol
4= CEDAW has been ratified by the country under consideration without reservations, but has not signed
the Optional Protocol
5= CEDAW has been ratified by the country under consideration without reservations, and has signed the
Optional Protocol
Under Article 29 of CEDAW, two or more State parties can refer disputes about the interpretation and
* Note: Throughout the country pages, missing data is indicated with “n.d.” for no data.
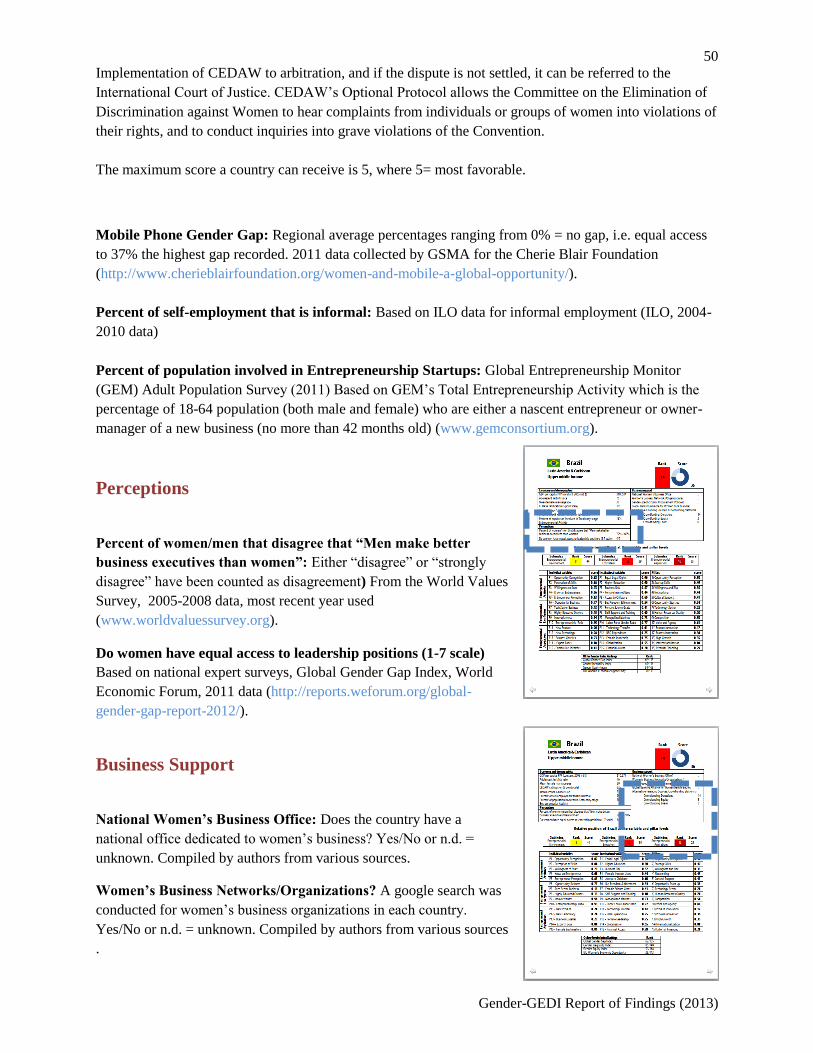
50
Gender-GEDI Report of Findings (2013)
Implementation of CEDAW to arbitration, and if the dispute is not settled, it can be referred to the
International Court of Justice. CEDAW’s Optional Protocol allows the Committee on the Elimination of
Discrimination against Women to hear complaints from individuals or groups of women into violations of
their rights, and to conduct inquiries into grave violations of the Convention.
The maximum score a country can receive is 5, where 5= most favorable.
Mobile Phone Gender Gap: Regional average percentages ranging from 0% = no gap, i.e. equal access
to 37% the highest gap recorded. 2011 data collected by GSMA for the Cherie Blair Foundation
(http://www.cherieblairfoundation.org/women-and-mobile-a-global-opportunity/).
Percent of self-employment that is informal: Based on ILO data for informal employment (ILO, 2004-
2010 data)
Percent of population involved in Entrepreneurship Startups: Global Entrepreneurship Monitor
(GEM) Adult Population Survey (2011) Based on GEM’s Total Entrepreneurship Activity which is the
percentage of 18-64 population (both male and female) who are either a nascent entrepreneur or owner-
manager of a new business (no more than 42 months old) (www.gemconsortium.org).
Perceptions
Percent of women/men that disagree that “Men make better
business executives than women”: Either “disagree” or “strongly
disagree” have been counted as disagreement) From the World Values
Survey, 2005-2008 data, most recent year used
(www.worldvaluessurvey.org).
Do women have equal access to leadership positions (1-7 scale)
Based on national expert surveys, Global Gender Gap Index, World
Economic Forum, 2011 data (http://reports.weforum.org/global-
gender-gap-report-2012/).
Business Support
National Women’s Business Office: Does the country have a
national office dedicated to women’s business? Yes/No or n.d. =
unknown. Compiled by authors from various sources.
Women’s Business Networks/Organizations? A google search was
conducted for women’s business organizations in each country.
Yes/No or n.d. = unknown. Compiled by authors from various sources
.

51
Gender-GEDI Report of Findings (2013)
Gender-specific Public Procurement Policies? This data is incomplete, but where a gender-specific
public procurement policy is known of it is indicated. Yes/No or n.d. = unknown. Compiled by authors
from various sources.
Global Banking Alliance for Women bank branches: The GBAW is a network of banks that have
signed on to “build innovative, comprehensive programs that provide women entrepreneurs with vital
access to capital, markets, education, and training”. The number here indicates how many banks have at
least one branch in the country: the total number of GBAW branches, therefore, may be much higher.
Yes/No or n.d. = unknown. Compiled by authors from various sources .
Alternative Financing Sources: Crowdfunding platforms: This indicator was compiled using
information on crowdfund.org, which lists the crowdfunding platforms available in a number of countries.
Subindex ranks and scores: This section details how the country ranks (out of 17) and scores (out
of 100) on the three subindices that make up the Gender-GEDI.
Normalized pillar scores: Each pillar score is comprised of two indicators combined: an
individual-level indicator and an institutional-level indicator. Each
score has been normalized to range from zero to one, with one being
the best score.
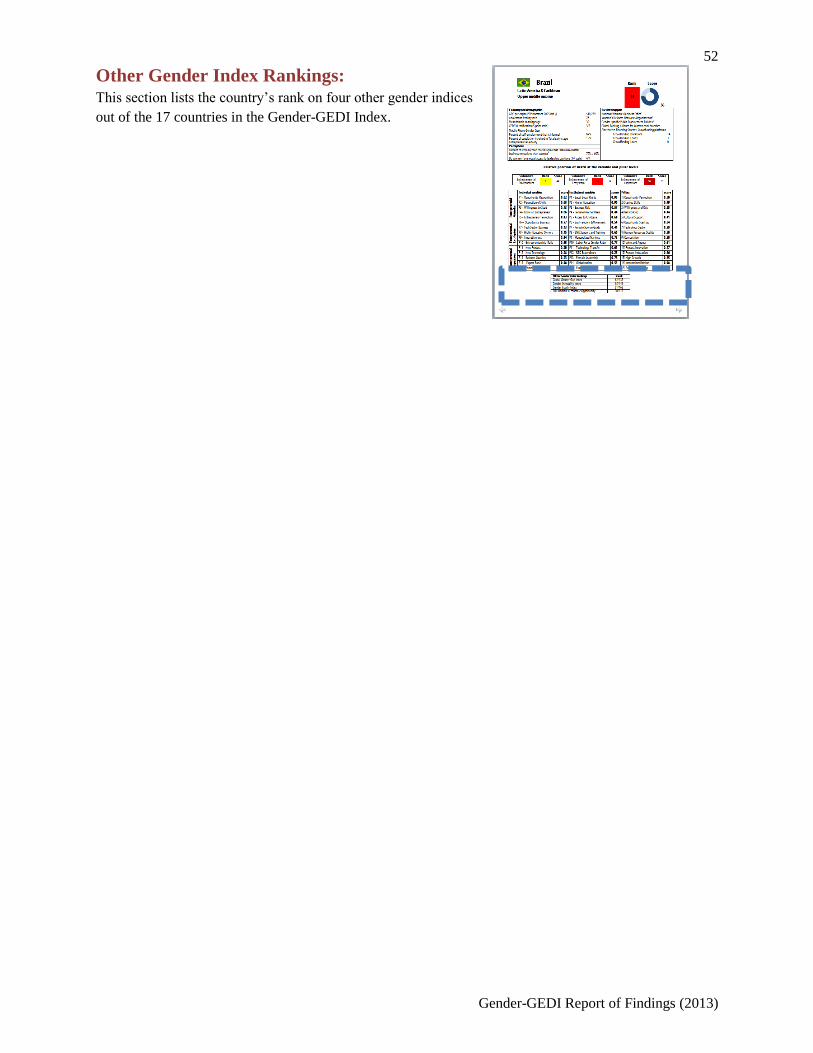
52
Gender-GEDI Report of Findings (2013)
Other Gender Index Rankings: This section lists the country’s rank on four other gender indices
out of the 17 countries in the Gender-GEDI Index.

53
Gender-GEDI Report of Findings (2013)
Australia Australia and Oceania
High income: OECD
Economy and demographics Business support
GDP per capita PPP (constant 2005 intl $) $34,853 National Women’s Business Office? n.d.
Adolescent fertility rate 13 Women’s Business Networks/Organizations? Yes
Mean female marriage age 30 Gender-specific Public Procurement Policies? No
CEDAW ratification (5 point scale) 2/5 Global Banking Alliance for Women bank branches 1
Mobile Phone Gender Gap No gap Alternative Financing Sources: Crowdfunding platforms
Percent of female self-employment that is informal n.d.* Crowdfunding Donations 8
Percent of population involved in Entrepreneurship Startups 7% Crowdfunding Equity 1
Perceptions Crowdfunding Loans 2
Percent of women/men that disagree that “Men make better
business executives than women”
90% / 72%
Do women have equal access to leadership positions (1-7 scale) 5/7
Relative position of Australia at the variable and pillar levels
Individual variables score Institutional variables score Pillars score
En
trep
ren
euri
al
En
vir
on
men
t
P1 – Opportunity Recognition 0.55 P1 – Equal Legal Rights 1.00 1) Opportunity Perception 0.67
P2 – Perception of Skills 0.56 P2 – Higher Education 0.88 2) Startup Skills 0.63
P3 – Willingness to Start 0.81 P3 – Business Risk 1.00 3) Willingness and Risk 0.80
P4 – Know an Entrepreneur 0.41 P4 – Female Internet Users 0.80 4) Networking 0.68
P5 – Entrepreneur Perception 0.70 P5 – Access to Childcare 0.80 5) Cultural Support 0.65
En
trep
ren
euri
al
Eco
-Sy
stem
P6 – Opportunity Business 0.88 P6 – Bus Freedom & Movement 0.93 6) Opportunity Start up 0.78
P7 – Tech Sector Business 0.28 P7 – Female Science Grads 0.47 7) Technology Sector 0.54
P8 – Highly Educated Owners 0.92 P8 – SME Support and Training 1.00 8) Human Resources Quality 0.91
P9 – Innovativeness 0.73 P9 – Monopolized Markets 0.78 9) Competition 0.64
P10 – Entrepreneurship Ratio 0.85 P10 – Labor Force Gender Ratio 0.85 10) Voice and Agency 0.84
En
trep
ren
euri
al
Asp
ira
tio
ns
P11 – New Product 0.36 P11 – Technology Transfer 0.78 11) Product Innovation 0.55
P12 – New Technology 0.39 P12 – R&D Expenditure 0.55 12) Process Innovation 0.70
P13 – Business Gazelles 0.56 P13 – Female Leadership 0.76 13) High Growth 0.84
P14 – Export Focus 0.73 P14 – Globalization 0.77 14) Internationalization 0.75
P15 – Female Bus Investors 0.47 P15 – Financial Access 1.00 15) External Financing 0.85
Other Gender Index Rankings Rank
Global Gender Gap Index 5
Gender Inequality Index 3
Gender Equity Index 2
EIU Women’s Economic Opportunity 2
* Missing data is indicated with “n.d.” for no data.
Rank Score
2
70
Subindex Rank Score Subindex Rank Score Subindex Rank Score
Entrepreneurial
Environment 2 69
Entrepreneurial Eco-
system 2 74
Entrepreneurial
Aspirations 3 67

54
Gender-GEDI Report of Findings (2013)
Brazil Latin America & Caribbean
Upper middle income
Economy and demographics Business support
GDP per capita PPP (constant 2005 intl $) $10,279 National Women’s Business Office? n.d.*
Adolescent fertility rate 76 Women’s Business Networks/Organizations? n.d.
Mean female marriage age 30 Gender-specific Public Procurement Policies? n.d.
CEDAW ratification (5 point scale) 3/5 Global Banking Alliance for Women bank branches n.d.
Mobile Phone Gender Gap 1% Alternative Financing Sources: Crowdfunding platforms
Percent of female self-employment that is informal 69% Crowdfunding Donations 14
Percent of population involved in Entrepreneurship Startups 15% Crowdfunding Equity 3
Perceptions Crowdfunding Loans 0
Percent of women/men that disagree that “Men make better
business executives than women”
79% / 60%
Do women have equal access to leadership positions (1-7 scale) 4/7
Relative position of Brazil at the variable and pillar levels
Individual variables score Institutional variables score Pillars score
En
trep
ren
euri
al
En
vir
on
men
t
P1 – Opportunity Recognition 0.62 P1 – Equal Legal Rights 0.96 1) Opportunity Perception 0.50
P2 – Perception of Skills 0.68 P2 – Higher Education 0.90 2) Startup Skills 0.49
P3 – Willingness to Start 0.73 P3 – Business Risk 0.57 3) Willingness and Risk 0.35
P4 – Know an Entrepreneur 0.66 P4 – Female Internet Users 0.44 4) Networking 0.44
P5 – Entrepreneur Perception 0.83 P5 – Access to Childcare 0.60 5) Cultural Support 0.41
En
trep
ren
euri
al
Eco
-Sy
stem
P6 – Opportunity Business 0.77 P6 – Bus Freedom & Movement 0.54 6) Opportunity Start up 0.34
P7 – Tech Sector Business 0.13 P7 – Female Science Grads 0.41 7) Technology Sector 0.28
P8 – Highly Educated Owners 0.15 P8 – SME Support and Training 0.60 8) Human Resources Quality 0.20
P9 – Innovativeness 0.94 P9 – Monopolized Markets 0.73 9) Competition 0.50
P10 – Entrepreneurship Ratio 0.95 P10 – Labor Force Gender Ratio 0.77 10) Voice and Agency 0.61
En
trep
ren
euri
al
Asp
ira
tio
ns
P11 – New Product 0.20 P11 – Technology Transfer 0.61 11) Product Innovation 0.17
P12 – New Technology 0.28 P12 – R&D Expenditure 0.25 12) Process Innovation 0.36
P13 – Business Gazelles 0.23 P13 – Female Leadership 0.75 13) High Growth 0.35
P14 – Export Focus 0.08 P14 – Globalization 0.55 14) Internationalization 0.08
P15 – Female Bus Investors 0.01 P15 – Financial Access 0.20 15) External Financing 0.29
Other Gender Index Rankings Rank
Global Gender Gap Index 9
Gender Inequality Index 13
Gender Equity Index 8
EIU Women’s Economic Opportunity 7
* Missing data is indicated with “n.d.” for no data.
Rank Score
14
36
Subindex Rank Score Subindex Rank Score Subindex Rank Score
Entrepreneurial
Environment 8 44
Entrepreneurial Eco-
system 12 39
Entrepreneurial
Aspirations 16 25

55
Gender-GEDI Report of Findings (2013)
China East Asia & Pacific
Upper middle income
Economy and demographics Business support
GDP per capita PPP (constant 2005 intl $) $7,418 National Women’s Business Office? n.d.
Adolescent fertility rate 9 Women’s Business Networks/Organizations? n.d.
Mean female marriage age 25 Gender-specific Public Procurement Policies? n.d.
CEDAW ratification (5 point scale) 2/5 Global Banking Alliance for Women bank branches n.d.
Mobile Phone Gender Gap 17% Alternative Financing Sources: Crowdfunding platforms
Percent of female self-employment that is informal n.d.* Crowdfunding Donations 3
Percent of population involved in Entrepreneurship Startups 16% Crowdfunding Equity 0
Perceptions Crowdfunding Loans 1
Percent of women/men that disagree that “Men make better
business executives than women”
66% / 59%
Do women have equal access to leadership positions (1-7 scale) 5/7
Relative position of China at the variable and pillar levels
Individual variables score Institutional variables score Pillars score
En
trep
ren
euri
al
En
vir
on
men
t
P1 – Opportunity Recognition 0.44 P1 – Equal Legal Rights 0.89 1) Opportunity Perception 0.37
P2 – Perception of Skills 0.46 P2 – Higher Education 0.79 2) Startup Skills 0.34
P3 – Willingness to Start 0.84 P3 – Business Risk 0.43 3) Willingness and Risk 0.33
P4 – Know an Entrepreneur 0.93 P4 – Female Internet Users 0.39 4) Networking 0.53
P5 – Entrepreneur Perception 0.82 P5 – Access to Childcare 0.80 5) Cultural Support 0.53
En
trep
ren
euri
al
Eco
-Sy
stem
P6 – Opportunity Business 0.57 P6 – Bus Freedom & Movement 0.47 6) Opportunity Start up 0.24
P7 – Tech Sector Business 0.03 P7 – Female Science Grads 0.40 7) Technology Sector 0.25
P8 – Highly Educated Owners 0.24 P8 – SME Support and Training 0.60 8) Human Resources Quality 0.26
P9 – Innovativeness 1.00 P9 – Monopolized Markets 0.80 9) Competition 0.72
P10 – Entrepreneurship Ratio 0.80 P10 – Labor Force Gender Ratio 0.88 10) Voice and Agency 0.64
En
trep
ren
euri
al
Asp
ira
tio
ns
P11 – New Product 0.85 P11 – Technology Transfer 0.68 11) Product Innovation 0.64
P12 – New Technology 0.55 P12 – R&D Expenditure 0.34 12) Process Innovation 0.50
P13 – Business Gazelles 0.23 P13 – Female Leadership 0.35 13) High Growth 0.22
P14 – Export Focus 0.19 P14 – Globalization 0.54 14) Internationalization 0.15
P15 – Female Bus Investors 0.52 P15 – Financial Access 0.36 15) External Financing 0.44
Other Gender Index Rankings Rank
Global Gender Gap Index 10
Gender Inequality Index 6
Gender Equity Index 10
EIU Women’s Economic Opportunity 13
* Missing data is indicated with “n.d.” for no data.
Rank Score
8
41
Subindex Rank Score Subindex Rank Score Subindex Rank Score
Entrepreneurial
Environment 10 42
Entrepreneurial Eco-
system 10 42
Entrepreneurial
Aspirations 11 39

56
Gender-GEDI Report of Findings (2013)
Egypt, Arab Rep. Middle East & North Africa
Lower middle income
Economy and demographics Business support
GDP per capita PPP (constant 2005 intl $) $5,547 National Women’s Business Office? n.d.
Adolescent fertility rate 42 Women’s Business Networks/Organizations? Yes
Mean female marriage age 23 Gender-specific Public Procurement Policies? n.d.
CEDAW ratification (5 point scale) 1/5 Global Banking Alliance for Women bank branches 2
Mobile Phone Gender Gap 24% Alternative Financing Sources: Crowdfunding platforms
Percent of female self-employment that is informal n.d.* Crowdfunding Donations n.d.
Percent of population involved in Entrepreneurship Startups 10% Crowdfunding Equity n.d.
Perceptions Crowdfunding Loans n.d.
Percent of women/men that disagree that “Men make better
business executives than women”
18% / 11%
Do women have equal access to leadership positions (1-7 scale) 5/7
Relative position of Egypt, Arab Rep. at the variable and pillar levels
Individual variables score Institutional variables score Pillars score
En
trep
ren
euri
al
En
vir
on
men
t
P1 – Opportunity Recognition 0.43 P1 – Equal Legal Rights 0.85 1) Opportunity Perception 0.36
P2 – Perception of Skills 0.64 P2 – Higher Education 0.74 2) Startup Skills 0.43
P3 – Willingness to Start 0.78 P3 – Business Risk 0.43 3) Willingness and Risk 0.31
P4 – Know an Entrepreneur 0.63 P4 – Female Internet Users 0.30 4) Networking 0.35
P5 – Entrepreneur Perception 0.92 P5 – Access to Childcare 0.80 5) Cultural Support 0.58
En
trep
ren
euri
al
Eco
-Sy
stem
P6 – Opportunity Business 0.77 P6 – Bus Freedom & Movement 0.64 6) Opportunity Start up 0.40
P7 – Tech Sector Business 0.14 P7 – Female Science Grads 0.60 7) Technology Sector 0.32
P8 – Highly Educated Owners 0.56 P8 – SME Support and Training 0.60 8) Human Resources Quality 0.43
P9 – Innovativeness 0.87 P9 – Monopolized Markets 0.53 9) Competition 0.39
P10 – Entrepreneurship Ratio 0.37 P10 – Labor Force Gender Ratio 0.33 10) Voice and Agency 0.14
En
trep
ren
euri
al
Asp
ira
tio
ns
P11 – New Product 0.45 P11 – Technology Transfer 0.49 11) Product Innovation 0.30
P12 – New Technology 1.00 P12 – R&D Expenditure 0.05 12) Process Innovation 0.35
P13 – Business Gazelles 0.41 P13 – Female Leadership 0.23 13) High Growth 0.24
P14 – Export Focus 0.31 P14 – Globalization 0.52 14) Internationalization 0.21
P15 – Female Bus Investors 0.18 P15 – Financial Access 0.05 15) External Financing 0.31
Other Gender Index Rankings Rank
Global Gender Gap Index 16
Gender Inequality Index 16
Gender Equity Index 15
EIU Women’s Economic Opportunity 11
* Missing data is indicated with “n.d.” for no data.
Rank Score
15
34
Subindex Rank Score Subindex Rank Score Subindex Rank Score
Entrepreneurial
Environment 11 40
Entrepreneurial Eco-
system 15 34
Entrepreneurial
Aspirations 14 28

57
Gender-GEDI Report of Findings (2013)
France Europe
High income: OECD
Economy and demographics Business support
GDP per capita PPP (constant 2005 intl $) $29,820 National Women’s Business Office? n.d.
Adolescent fertility rate 6 Women’s Business Networks/Organizations? Yes
Mean female marriage age 32 Gender-specific Public Procurement Policies? n.d.
CEDAW ratification (5 point scale) 2/5 Global Banking Alliance for Women bank branches 2
Mobile Phone Gender Gap No gap Alternative Financing Sources: Crowdfunding platforms
Percent of female self-employment that is informal n.d.* Crowdfunding Donations 14
Percent of population involved in Entrepreneurship Startups 4% Crowdfunding Equity 16
Perceptions Crowdfunding Loans 1
Percent of women/men that disagree that “Men make better
business executives than women”
89% / 82%
Do women have equal access to leadership positions (1-7 scale) 3/7
Relative position of France at the variable and pillar levels
Individual variables score Institutional variables score Pillars score
En
trep
ren
euri
al
En
vir
on
men
t
P1 – Opportunity Recognition 0.37 P1 – Equal Legal Rights 0.96 1) Opportunity Perception 0.37
P2 – Perception of Skills 0.30 P2 – Higher Education 0.87 2) Startup Skills 0.27
P3 – Willingness to Start 0.71 P3 – Business Risk 1.00 3) Willingness and Risk 0.61
P4 – Know an Entrepreneur 0.56 P4 – Female Internet Users 0.82 4) Networking 0.67
P5 – Entrepreneur Perception 0.75 P5 – Access to Childcare 1.00 5) Cultural Support 0.79
En
trep
ren
euri
al
Eco
-Sy
stem
P6 – Opportunity Business 0.94 P6 – Bus Freedom & Movement 0.84 6) Opportunity Start up 0.63
P7 – Tech Sector Business 0.23 P7 – Female Science Grads 0.48 7) Technology Sector 0.36
P8 – Highly Educated Owners 0.56 P8 – SME Support and Training 0.80 8) Human Resources Quality 0.56
P9 – Innovativeness 0.66 P9 – Monopolized Markets 0.78 9) Competition 0.46
P10 – Entrepreneurship Ratio 0.48 P10 – Labor Force Gender Ratio 0.86 10) Voice and Agency 0.46
En
trep
ren
euri
al
Asp
ira
tio
ns
P11 – New Product 0.60 P11 – Technology Transfer 0.82 11) Product Innovation 0.62
P12 – New Technology 0.77 P12 – R&D Expenditure 0.52 12) Process Innovation 0.73
P13 – Business Gazelles 0.46 P13 – Female Leadership 0.80 13) High Growth 0.64
P14 – Export Focus 0.63 P14 – Globalization 0.86 14) Internationalization 0.60
P15 – Female Bus Investors 0.43 P15 – Financial Access 0.97 15) External Financing 0.63
Other Gender Index Rankings Rank
Global Gender Gap Index 7
Gender Inequality Index 2
Gender Equity Index 4
EIU Women’s Economic Opportunity 3
* Missing data is indicated with “n.d.” for no data.
Rank Score
4
56
Subindex Rank Score Subindex Rank Score Subindex Rank Score
Entrepreneurial
Environment 4 54
Entrepreneurial Eco-
system 7 49
Entrepreneurial
Aspirations 4 64

58
Gender-GEDI Report of Findings (2013)
Germany Europe
High income: OECD
Economy and demographics Business support
GDP per capita PPP (constant 2005 intl $) $34,573 National Women’s Business Office? n.d.
Adolescent fertility rate 7 Women’s Business Networks/Organizations? Yes
Mean female marriage age 32 Gender-specific Public Procurement Policies? n.d.
CEDAW ratification (5 point scale) 4/5 Global Banking Alliance for Women bank branches n.d.
Mobile Phone Gender Gap No gap Alternative Financing Sources: Crowdfunding platforms
Percent of female self-employment that is informal n.d.* Crowdfunding Donations 9
Percent of population involved in Entrepreneurship Startups 5% Crowdfunding Equity 6
Perceptions Crowdfunding Loans 1
Percent of women/men that disagree that “Men make better
business executives than women”
90% / 76%
Do women have equal access to leadership positions (1-7 scale) 4/7
Relative position of Germany at the variable and pillar levels
Individual variables score Institutional variables score Pillars score
En
trep
ren
euri
al
En
vir
on
men
t
P1 – Opportunity Recognition 0.33 P1 – Equal Legal Rights 0.96 1) Opportunity Perception 0.40
P2 – Perception of Skills 0.51 P2 – Higher Education 0.81 2) Startup Skills 0.48
P3 – Willingness to Start 0.67 P3 – Business Risk 1.00 3) Willingness and Risk 0.65
P4 – Know an Entrepreneur 0.50 P4 – Female Internet Users 0.76 4) Networking 0.66
P5 – Entrepreneur Perception 0.74 P5 – Access to Childcare 0.60 5) Cultural Support 0.49
En
trep
ren
euri
al
Eco
-Sy
stem
P6 – Opportunity Business 0.83 P6 – Bus Freedom & Movement 0.91 6) Opportunity Start up 0.68
P7 – Tech Sector Business 0.35 P7 – Female Science Grads 0.59 7) Technology Sector 0.52
P8 – Highly Educated Owners 0.89 P8 – SME Support and Training 0.80 8) Human Resources Quality 0.81
P9 – Innovativeness 0.79 P9 – Monopolized Markets 0.97 9) Competition 0.69
P10 – Entrepreneurship Ratio 0.64 P10 – Labor Force Gender Ratio 0.83 10) Voice and Agency 0.63
En
trep
ren
euri
al
Asp
ira
tio
ns
P11 – New Product 0.56 P11 – Technology Transfer 0.93 11) Product Innovation 0.72
P12 – New Technology 0.37 P12 – R&D Expenditure 0.66 12) Process Innovation 0.66
P13 – Business Gazelles 0.26 P13 – Female Leadership 0.79 13) High Growth 0.50
P14 – Export Focus 0.79 P14 – Globalization 0.84 14) Internationalization 0.76
P15 – Female Bus Investors 0.54 P15 – Financial Access 0.99 15) External Financing 0.77
Other Gender Index Rankings Rank
Global Gender Gap Index 1
Gender Inequality Index 1
Gender Equity Index 1
EIU Women’s Economic Opportunity 1
* Missing data is indicated with “n.d.” for no data.
Rank Score
3
63
Subindex Rank Score Subindex Rank Score Subindex Rank Score
Entrepreneurial
Environment 5 54
Entrepreneurial Eco-
system 3 67
Entrepreneurial
Aspirations 2 68

59
Gender-GEDI Report of Findings (2013)
India South Asia
Lower middle income
Economy and demographics Business support
GDP per capita PPP (constant 2005 intl $) $3,223 National Women’s Business Office? n.d.*
Adolescent fertility rate 77 Women’s Business Networks/Organizations? Yes
Mean female marriage age 20 Gender-specific Public Procurement Policies? Yes
CEDAW ratification (5 point scale) 2/5 Global Banking Alliance for Women bank branches n.d.
Mobile Phone Gender Gap 37% Alternative Financing Sources: Crowdfunding platforms
Percent of female self-employment that is informal 98% Crowdfunding Donations 3
Percent of population involved in Entrepreneurship Startups 14% Crowdfunding Equity 0
Perceptions Crowdfunding Loans 2
Percent of women/men that disagree that “Men make better
business executives than women”
45% / 32%
Do women have equal access to leadership positions (1-7 scale) 4/7
Relative position of India at the variable and pillar levels
Individual variables score Institutional variables score Pillars score
En
trep
ren
euri
al
En
vir
on
men
t
P1 – Opportunity Recognition 0.87 P1 – Equal Legal Rights 0.85 1) Opportunity Perception 0.60
P2 – Perception of Skills 0.71 P2 – Higher Education 0.63 2) Startup Skills 0.40
P3 – Willingness to Start 0.76 P3 – Business Risk 0.57 3) Willingness and Risk 0.38
P4 – Know an Entrepreneur 0.94 P4 – Female Internet Users 0.07 4) Networking 0.18
P5 – Entrepreneur Perception 0.79 P5 – Access to Childcare 0.60 5) Cultural Support 0.41
En
trep
ren
euri
al
Eco
-Sy
stem
P6 – Opportunity Business 0.83 P6 – Bus Freedom & Movement 0.24 6) Opportunity Start up 0.18
P7 – Tech Sector Business 0.54 P7 – Female Science Grads 0.32 7) Technology Sector 0.39
P8 – Highly Educated Owners 0.52 P8 – SME Support and Training 0.40 8) Human Resources Quality 0.32
P9 – Innovativeness 0.90 P9 – Monopolized Markets 0.78 9) Competition 0.53
P10 – Entrepreneurship Ratio 0.53 P10 – Labor Force Gender Ratio 0.38 10) Voice and Agency 0.23
En
trep
ren
euri
al
Asp
ira
tio
ns
P11 – New Product 0.25 P11 – Technology Transfer 0.62 11) Product Innovation 0.22
P12 – New Technology 0.72 P12 – R&D Expenditure 0.18 12) Process Innovation 0.43
P13 – Business Gazelles 0.18 P13 – Female Leadership 0.29 13) High Growth 0.17
P14 – Export Focus 0.19 P14 – Globalization 0.45 14) Internationalization 0.12
P15 – Female Bus Investors 0.03 P15 – Financial Access 0.11 15) External Financing 0.30
Other Gender Index Rankings Rank
Global Gender Gap Index 14
Gender Inequality Index 17
Gender Equity Index 17
EIU Women’s Economic Opportunity 16
* Missing data is indicated with “n.d.” for no data.
Rank Score
16
32
Subindex Rank Score Subindex Rank Score Subindex Rank Score
Entrepreneurial
Environment 13 39
Entrepreneurial Eco-
system 17 33
Entrepreneurial
Aspirations 15 25

60
Gender-GEDI Report of Findings (2013)
Japan East Asia & Pacific
High income: OECD
Economy and demographics Business support
GDP per capita PPP (constant 2005 intl $) $30,660 National Women’s Business Office? n.d.
Adolescent fertility rate 6 Women’s Business Networks/Organizations? Yes
Mean female marriage age 30 Gender-specific Public Procurement Policies? n.d.
CEDAW ratification (5 point scale) 3/5 Global Banking Alliance for Women bank branches n.d.
Mobile Phone Gender Gap No gap Alternative Financing Sources: Crowdfunding platforms
Percent of female self-employment that is informal n.d.* Crowdfunding Donations 2
Percent of population involved in Entrepreneurship Startups 4% Crowdfunding Equity 0
Perceptions Crowdfunding Loans 1
Percent of women/men that disagree that “Men make better
business executives than women”
71% / 55%
Do women have equal access to leadership positions (1-7 scale) 4/7
Relative position of Japan at the variable and pillar levels
Individual variables score Institutional variables score Pillars score
En
trep
ren
euri
al
En
vir
on
men
t
P1 – Opportunity Recognition 0.09 P1 – Equal Legal Rights 0.96 1) Opportunity Perception 0.09
P2 – Perception of Skills 0.09 P2 – Higher Education 0.72 2) Startup Skills 0.07
P3 – Willingness to Start 0.85 P3 – Business Risk 1.00 3) Willingness and Risk 0.60
P4 – Know an Entrepreneur 0.22 P4 – Female Internet Users 0.77 4) Networking 0.31
P5 – Entrepreneur Perception 0.44 P5 – Access to Childcare 0.60 5) Cultural Support 0.24
En
trep
ren
euri
al
Eco
-Sy
stem
P6 – Opportunity Business 0.80 P6 – Bus Freedom & Movement 0.83 6) Opportunity Start up 0.48
P7 – Tech Sector Business 0.69 P7 – Female Science Grads 0.34 7) Technology Sector 0.42
P8 – Highly Educated Owners 0.82 P8 – SME Support and Training 0.60 8) Human Resources Quality 0.51
P9 – Innovativeness 0.80 P9 – Monopolized Markets 0.98 9) Competition 0.55
P10 – Entrepreneurship Ratio 0.34 P10 – Labor Force Gender Ratio 0.72 10) Voice and Agency 0.26
En
trep
ren
euri
al
Asp
ira
tio
ns
P11 – New Product 0.53 P11 – Technology Transfer 0.97 11) Product Innovation 0.56
P12 – New Technology 0.65 P12 – R&D Expenditure 0.81 12) Process Innovation 0.67
P13 – Business Gazelles 0.69 P13 – Female Leadership 0.19 13) High Growth 0.28
P14 – Export Focus 0.52 P14 – Globalization 0.61 14) Internationalization 0.35
P15 – Female Bus Investors 0.17 P15 – Financial Access 0.97 15) External Financing 0.40
Other Gender Index Rankings Rank
Global Gender Gap Index 13
Gender Inequality Index 4
Gender Equity Index 12
EIU Women’s Economic Opportunity 6
* Missing data is indicated with “n.d.” for no data.
Rank Score
12
39
Subindex Rank Score Subindex Rank Score Subindex Rank Score
Entrepreneurial
Environment 17 26
Entrepreneurial Eco-
system 9 44
Entrepreneurial
Aspirations 9 45

61
Gender-GEDI Report of Findings (2013)
Malaysia East Asia & Pacific
Upper middle income
Economy and demographics Business support
GDP per capita PPP (constant 2005 intl $) $14,174 National Women’s Business Office? n.d.
Adolescent fertility rate 11 Women’s Business Networks/Organizations? Yes
Mean female marriage age 26 Gender-specific Public Procurement Policies? n.d.
CEDAW ratification (5 point scale) 1/5 Global Banking Alliance for Women bank branches 1
Mobile Phone Gender Gap 17% Alternative Financing Sources: Crowdfunding platforms
Percent of female self-employment that is informal n.d.* Crowdfunding Donations 0
Percent of population involved in Entrepreneurship Startups 5% Crowdfunding Equity 1
Perceptions Crowdfunding Loans 0
Percent of women/men that disagree that “Men make better
business executives than women”
57% / 34%
Do women have equal access to leadership positions (1-7 scale) 6/7
Relative position of Malaysia at the variable and pillar levels
Individual variables score Institutional variables score Pillars score
En
trep
ren
euri
al
En
vir
on
men
t
P1 – Opportunity Recognition 0.62 P1 – Equal Legal Rights 0.81 1) Opportunity Perception 0.49
P2 – Perception of Skills 0.36 P2 – Higher Education 0.89 2) Startup Skills 0.32
P3 – Willingness to Start 0.70 P3 – Business Risk 0.71 3) Willingness and Risk 0.45
P4 – Know an Entrepreneur 0.75 P4 – Female Internet Users 0.59 4) Networking 0.64
P5 – Entrepreneur Perception 0.70 P5 – Access to Childcare 0.40 5) Cultural Support 0.27
En
trep
ren
euri
al
Eco
-Sy
stem
P6 – Opportunity Business 1.00 P6 – Bus Freedom & Movement 0.53 6) Opportunity Start up 0.45
P7 – Tech Sector Business 0.38 P7 – Female Science Grads 0.76 7) Technology Sector 0.52
P8 – Highly Educated Owners 0.38 P8 – SME Support and Training 0.60 8) Human Resources Quality 0.35
P9 – Innovativeness 0.83 P9 – Monopolized Markets 0.83 9) Competition 0.56
P10 – Entrepreneurship Ratio 0.69 P10 – Labor Force Gender Ratio 0.59 10) Voice and Agency 0.45
En
trep
ren
euri
al
Asp
ira
tio
ns
P11 – New Product 0.21 P11 – Technology Transfer 0.75 11) Product Innovation 0.22
P12 – New Technology 0.49 P12 – R&D Expenditure 0.15 12) Process Innovation 0.39
P13 – Business Gazelles 0.29 P13 – Female Leadership 0.50 13) High Growth 0.33
P14 – Export Focus 0.30 P14 – Globalization 0.78 14) Internationalization 0.30
P15 – Female Bus Investors 0.01 P15 – Financial Access 0.38 15) External Financing 0.32
Other Gender Index Rankings Rank
Global Gender Gap Index 12
Gender Inequality Index 8
Gender Equity Index 13
EIU Women’s Economic Opportunity 10
* Missing data is indicated with “n.d.” for no data.
Rank Score
9
40
Subindex Rank Score Subindex Rank Score Subindex Rank Score
Entrepreneurial
Environment 9 44
Entrepreneurial Eco-
system 8 47
Entrepreneurial
Aspirations 13 31

62
Gender-GEDI Report of Findings (2013)
Mexico Latin America & Caribbean
Upper middle income
Economy and demographics Business support
GDP per capita PPP (constant 2005 intl $) $12,814 National Women’s Business Office? n.d.*
Adolescent fertility rate 67 Women’s Business Networks/Organizations? n.d.
Mean female marriage age 23 Gender-specific Public Procurement Policies? No
CEDAW ratification (5 point scale) 4/5 Global Banking Alliance for Women bank branches n.d.
Mobile Phone Gender Gap 1% Alternative Financing Sources: Crowdfunding platforms
Percent of female self-employment that is informal 79% Crowdfunding Donations 1
Percent of population involved in Entrepreneurship Startups 12% Crowdfunding Equity 0
Perceptions Crowdfunding Loans 1
Percent of women/men that disagree that “Men make better
business executives than women”
81% / 74%
Do women have equal access to leadership positions (1-7 scale) 4/7
Relative position of Mexico at the variable and pillar levels
Individual variables score Institutional variables score Pillars score
En
trep
ren
euri
al
En
vir
on
men
t
P1 – Opportunity Recognition 0.75 P1 – Equal Legal Rights 0.96 1) Opportunity Perception 0.74
P2 – Perception of Skills 0.84 P2 – Higher Education 0.79 2) Startup Skills 0.69
P3 – Willingness to Start 0.85 P3 – Business Risk 0.57 3) Willingness and Risk 0.55
P4 – Know an Entrepreneur 0.89 P4 – Female Internet Users 0.32 4) Networking 0.59
P5 – Entrepreneur Perception 0.73 P5 – Access to Childcare 0.60 5) Cultural Support 0.52
En
trep
ren
euri
al
Eco
-Sy
stem
P6 – Opportunity Business 0.90 P6 – Bus Freedom & Movement 0.83 6) Opportunity Start up 0.69
P7 – Tech Sector Business 0.35 P7 – Female Science Grads 0.64 7) Technology Sector 0.57
P8 – Highly Educated Owners 0.51 P8 – SME Support and Training 0.40 8) Human Resources Quality 0.44
P9 – Innovativeness 0.73 P9 – Monopolized Markets 0.51 9) Competition 0.44
P10 – Entrepreneurship Ratio 0.88 P10 – Labor Force Gender Ratio 0.57 10) Voice and Agency 0.63
En
trep
ren
euri
al
Asp
ira
tio
ns
P11 – New Product 0.63 P11 – Technology Transfer 0.55 11) Product Innovation 0.57
P12 – New Technology 0.35 P12 – R&D Expenditure 0.09 12) Process Innovation 0.45
P13 – Business Gazelles 0.25 P13 – Female Leadership 0.64 13) High Growth 0.46
P14 – Export Focus 0.50 P14 – Globalization 0.61 14) Internationalization 0.49
P15 – Female Bus Investors 0.13 P15 – Financial Access 0.09 15) External Financing 0.43
Other Gender Index Rankings Rank
Global Gender Gap Index 11
Gender Inequality Index 11
Gender Equity Index 9
EIU Women’s Economic Opportunity 8
* Missing data is indicated with “n.d.” for no data.
Rank Score
5
55
Subindex Rank Score Subindex Rank Score Subindex Rank Score
Entrepreneurial
Environment 3 62
Entrepreneurial Eco-
system 4 56
Entrepreneurial
Aspirations 7 48

63
Gender-GEDI Report of Findings (2013)
Morocco Middle East & North Africa
Lower middle income
Economy and demographics Business support
GDP per capita PPP (constant 2005 intl $) $4,373 National Women’s Business Office? n.d.
Adolescent fertility rate 12 Women’s Business Networks/Organizations? Yes
Mean female marriage age 26 Gender-specific Public Procurement Policies? n.d.
CEDAW ratification (5 point scale) 1/5 Global Banking Alliance for Women bank branches n.d.
Mobile Phone Gender Gap 24% Alternative Financing Sources: Crowdfunding platforms
Percent of female self-employment that is informal n.d.* Crowdfunding Donations n.d.
Percent of population involved in Entrepreneurship Startups 16% Crowdfunding Equity n.d.
Perceptions Crowdfunding Loans n.d.
Percent of women/men that disagree that “Men make better
business executives than women”
61% / 24%
Do women have equal access to leadership positions (1-7 scale) 5/7
Relative position of Morocco at the variable and pillar levels
Individual variables score Institutional variables score Pillars score
En
trep
ren
euri
al
En
vir
on
men
t
P1 – Opportunity Recognition 0.65 P1 – Equal Legal Rights 0.93 1) Opportunity Perception 0.52
P2 – Perception of Skills 0.93 P2 – Higher Education 0.73 2) Startup Skills 0.56
P3 – Willingness to Start 0.95 P3 – Business Risk 0.57 3) Willingness and Risk 0.45
P4 – Know an Entrepreneur 0.70 P4 – Female Internet Users 0.36 4) Networking 0.42
P5 – Entrepreneur Perception 0.94 P5 – Access to Childcare 0.40 5) Cultural Support 0.34
En
trep
ren
euri
al
Eco
-Sy
stem
P6 – Opportunity Business 0.89 P6 – Bus Freedom & Movement 0.78 6) Opportunity Start up 0.52
P7 – Tech Sector Business 0.23 P7 – Female Science Grads 0.61 7) Technology Sector 0.36
P8 – Highly Educated Owners 0.03 P8 – SME Support and Training 0.60 8) Human Resources Quality 0.13
P9 – Innovativeness 0.87 P9 – Monopolized Markets 0.63 9) Competition 0.44
P10 – Entrepreneurship Ratio 0.59 P10 – Labor Force Gender Ratio 0.36 10) Voice and Agency 0.25
En
trep
ren
euri
al
Asp
ira
tio
ns
P11 – New Product 0.24 P11 – Technology Transfer 0.52 11) Product Innovation 0.18
P12 – New Technology 0.74 P12 – R&D Expenditure 0.15 12) Process Innovation 0.41
P13 – Business Gazelles 0.41 P13 – Female Leadership 0.27 13) High Growth 0.26
P14 – Export Focus 1.00 P14 – Globalization 0.52 14) Internationalization 0.54
P15 – Female Bus Investors 0.01 P15 – Financial Access 0.16 15) External Financing 0.30
Other Gender Index Rankings Rank
Global Gender Gap Index 17
Gender Inequality Index 12
Gender Equity Index 16
EIU Women’s Economic Opportunity 15
* Missing data is indicated with “n.d.” for no data.
Rank Score
13
38
Subindex Rank Score Subindex Rank Score Subindex Rank Score
Entrepreneurial
Environment 6 46
Entrepreneurial Eco-
system 14 34
Entrepreneurial
Aspirations 12 34

64
Gender-GEDI Report of Findings (2013)
Russian Federation Europe & Central Asia
Upper middle income
Economy and demographics Business support
GDP per capita PPP (constant 2005 intl $) $14,714 National Women’s Business Office? n.d.*
Adolescent fertility rate 25 Women’s Business Networks/Organizations? n.d.
Mean female marriage age 24 Gender-specific Public Procurement Policies? n.d.
CEDAW ratification (5 point scale) 4/5 Global Banking Alliance for Women bank branches n.d.
Mobile Phone Gender Gap 16% Alternative Financing Sources: Crowdfunding platforms
Percent of female self-employment that is informal 90% Crowdfunding Donations 3
Percent of population involved in Entrepreneurship Startups 4% Crowdfunding Equity 0
Perceptions Crowdfunding Loans 0
Percent of women/men that disagree that “Men make better
business executives than women”
59% / 37%
Do women have equal access to leadership positions (1-7 scale) 4/7
Relative position of Russian Federation at the variable and pillar levels
Individual variables score Institutional variables score Pillars score
En
trep
ren
euri
al
En
vir
on
men
t
P1 – Opportunity Recognition 0.31 P1 – Equal Legal Rights 0.89 1) Opportunity Perception 0.27
P2 – Perception of Skills 0.25 P2 – Higher Education 0.90 2) Startup Skills 0.22
P3 – Willingness to Start 0.60 P3 – Business Risk 0.43 3) Willingness and Risk 0.24
P4 – Know an Entrepreneur 0.54 P4 – Female Internet Users 0.35 4) Networking 0.35
P5 – Entrepreneur Perception 0.72 P5 – Access to Childcare 0.60 5) Cultural Support 0.38
En
trep
ren
euri
al
Eco
-Sy
stem
P6 – Opportunity Business 0.76 P6 – Bus Freedom & Movement 0.66 6) Opportunity Start up 0.40
P7 – Tech Sector Business 0.96 P7 – Female Science Grads 0.72 7) Technology Sector 0.71
P8 – Highly Educated Owners 1.00 P8 – SME Support and Training 0.40 8) Human Resources Quality 0.51
P9 – Innovativeness 1.00 P9 – Monopolized Markets 0.56 9) Competition 0.45
P10 – Entrepreneurship Ratio 0.64 P10 – Labor Force Gender Ratio 0.83 10) Voice and Agency 0.52
En
trep
ren
euri
al
Asp
ira
tio
ns
P11 – New Product 0.57 P11 – Technology Transfer 0.54 11) Product Innovation 0.40
P12 – New Technology 0.45 P12 – R&D Expenditure 0.29 12) Process Innovation 0.43
P13 – Business Gazelles 0.99 P13 – Female Leadership 0.77 13) High Growth 0.71
P14 – Export Focus 0.17 P14 – Globalization 0.52 14) Internationalization 0.13
P15 – Female Bus Investors 0.04 P15 – Financial Access 0.19 15) External Financing 0.31
Other Gender Index Rankings Rank
Global Gender Gap Index 8
Gender Inequality Index 9
Gender Equity Index 6
EIU Women’s Economic Opportunity 12
* Missing data is indicated with “n.d.” for no data.
Rank Score
10
40
Subindex Rank Score Subindex Rank Score Subindex Rank Score
Entrepreneurial
Environment 16 29
Entrepreneurial Eco-
system 6 52
Entrepreneurial
Aspirations 10 40

65
Gender-GEDI Report of Findings (2013)
South Africa Sub-Saharan Africa
Upper middle income
Economy and demographics Business support
GDP per capita PPP (constant 2005 intl $) $9,678 National Women’s Business Office? n.d.*
Adolescent fertility rate 52 Women’s Business Networks/Organizations? n.d.
Mean female marriage age 31 Gender-specific Public Procurement Policies? n.d.
CEDAW ratification (5 point scale) 4/5 Global Banking Alliance for Women bank branches 1
Mobile Phone Gender Gap 23% Alternative Financing Sources: Crowdfunding platforms
Percent of female self-employment that is informal 79% Crowdfunding Donations 3
Percent of population involved in Entrepreneurship Startups 7% Crowdfunding Equity 1
Perceptions Crowdfunding Loans 0
Percent of women/men that disagree that “Men make better
business executives than women”
66% / 47%
Do women have equal access to leadership positions (1-7 scale) 5/7
Relative position of South Africa at the variable and pillar levels
Individual variables score Institutional variables score Pillars score
En
trep
ren
euri
al
En
vir
on
men
t
P1 – Opportunity Recognition 0.48 P1 – Equal Legal Rights 0.96 1) Opportunity Perception 0.44
P2 – Perception of Skills 0.47 P2 – Higher Education 0.80 2) Startup Skills 0.36
P3 – Willingness to Start 0.96 P3 – Business Risk 0.71 3) Willingness and Risk 0.57
P4 – Know an Entrepreneur 0.55 P4 – Female Internet Users 0.12 4) Networking 0.19
P5 – Entrepreneur Perception 0.79 P5 – Access to Childcare 0.60 5) Cultural Support 0.43
En
trep
ren
euri
al
Eco
-Sy
stem
P6 – Opportunity Business 0.71 P6 – Bus Freedom & Movement 0.51 6) Opportunity Start up 0.32
P7 – Tech Sector Business 0.37 P7 – Female Science Grads 0.41 7) Technology Sector 0.39
P8 – Highly Educated Owners 0.18 P8 – SME Support and Training 0.80 8) Human Resources Quality 0.27
P9 – Innovativeness 0.68 P9 – Monopolized Markets 0.73 9) Competition 0.43
P10 – Entrepreneurship Ratio 0.74 P10 – Labor Force Gender Ratio 0.76 10) Voice and Agency 0.57
En
trep
ren
euri
al
Asp
ira
tio
ns
P11 – New Product 0.68 P11 – Technology Transfer 0.61 11) Product Innovation 0.52
P12 – New Technology 0.98 P12 – R&D Expenditure 0.25 12) Process Innovation 0.58
P13 – Business Gazelles 0.50 P13 – Female Leadership 0.62 13) High Growth 0.55
P14 – Export Focus 0.75 P14 – Globalization 0.72 14) Internationalization 0.57
P15 – Female Bus Investors 0.03 P15 – Financial Access 0.41 15) External Financing 0.32
Other Gender Index Rankings Rank
Global Gender Gap Index 2
Gender Inequality Index 14
Gender Equity Index 3
EIU Women’s Economic Opportunity 9
* Missing data is indicated with “n.d.” for no data.
Rank Score
7
43
Subindex Rank Score Subindex Rank Score Subindex Rank Score
Entrepreneurial
Environment 12 40
Entrepreneurial Eco-
system 11 39
Entrepreneurial
Aspirations 6 51

66
Gender-GEDI Report of Findings (2013)
Turkey Europe & Central Asia
Upper middle income
Economy and demographics Business support
GDP per capita PPP (constant 2005 intl $) $13,468 National Women’s Business Office? n.d.*
Adolescent fertility rate 32 Women’s Business Networks/Organizations? Yes
Mean female marriage age 24 Gender-specific Public Procurement Policies? n.d.
CEDAW ratification (5 point scale) 3/5 Global Banking Alliance for Women bank branches 1
Mobile Phone Gender Gap 16% Alternative Financing Sources: Crowdfunding platforms
Percent of female self-employment that is informal n.d. Crowdfunding Donations 1
Percent of population involved in Entrepreneurship Startups 6% Crowdfunding Equity 0
Perceptions Crowdfunding Loans 1
Percent of women/men that disagree that “Men make better
business executives than women”
52% / 41%
Do women have equal access to leadership positions (1-7 scale) 4/7
Relative position of Turkey at the variable and pillar levels
Individual variables score Institutional variables score Pillars score
En
trep
ren
euri
al
En
vir
on
men
t
P1 – Opportunity Recognition 0.45 P1 – Equal Legal Rights 0.85 1) Opportunity Perception 0.38
P2 – Perception of Skills 0.52 P2 – Higher Education 0.70 2) Startup Skills 0.36
P3 – Willingness to Start 0.83 P3 – Business Risk 0.57 3) Willingness and Risk 0.43
P4 – Know an Entrepreneur 0.42 P4 – Female Internet Users 0.20 4) Networking 0.23
P5 – Entrepreneur Perception 0.86 P5 – Access to Childcare 0.60 5) Cultural Support 0.46
En
trep
ren
euri
al
Eco
-Sy
stem
P6 – Opportunity Business 0.57 P6 – Bus Freedom & Movement 0.68 6) Opportunity Start up 0.35
P7 – Tech Sector Business 0.24 P7 – Female Science Grads 0.57 7) Technology Sector 0.38
P8 – Highly Educated Owners 0.53 P8 – SME Support and Training 0.60 8) Human Resources Quality 0.43
P9 – Innovativeness 0.93 P9 – Monopolized Markets 0.71 9) Competition 0.53
P10 – Entrepreneurship Ratio 0.29 P10 – Labor Force Gender Ratio 0.41 10) Voice and Agency 0.16
En
trep
ren
euri
al
Asp
ira
tio
ns
P11 – New Product 1.00 P11 – Technology Transfer 0.55 11) Product Innovation 0.64
P12 – New Technology 0.39 P12 – R&D Expenditure 0.20 12) Process Innovation 0.40
P13 – Business Gazelles 0.90 P13 – Female Leadership 0.20 13) High Growth 0.39
P14 – Export Focus 0.78 P14 – Globalization 0.57 14) Internationalization 0.50
P15 – Female Bus Investors 0.22 P15 – Financial Access 0.20 15) External Financing 0.36
Other Gender Index Rankings Rank
Global Gender Gap Index 15
Gender Inequality Index 10
Gender Equity Index 14
EIU Women’s Economic Opportunity 14
* Missing data is indicated with “n.d.” for no data.
Rank Score
11
40
Subindex Rank Score Subindex Rank Score Subindex Rank Score
Entrepreneurial
Environment 15 37
Entrepreneurial Eco-
system 13 37
Entrepreneurial
Aspirations 8 46

67
Gender-GEDI Report of Findings (2013)
Uganda Sub-Saharan Africa
Low income
Economy and demographics Business support
GDP per capita PPP (constant 2005 intl $) $1,188 National Women’s Business Office? n.d.*
Adolescent fertility rate 131 Women’s Business Networks/Organizations? Yes
Mean female marriage age 20 Gender-specific Public Procurement Policies? n.d.
CEDAW ratification (5 point scale) 3/5 Global Banking Alliance for Women bank branches 7
Mobile Phone Gender Gap 23% Alternative Financing Sources: Crowdfunding platforms
Percent of female self-employment that is informal 87% Crowdfunding Donations 1
Percent of population involved in Entrepreneurship Startups 33% Crowdfunding Equity 0
Perceptions Crowdfunding Loans 0
Percent of women/men that disagree that “Men make better
business executives than women”
n.d. / n.d.
Do women have equal access to leadership positions (1-7 scale) 6/7
Relative position of Uganda at the variable and pillar levels
Individual variables score Institutional variables score Pillars score
En
trep
ren
euri
al
En
vir
on
men
t
P1 – Opportunity Recognition 1.00 P1 – Equal Legal Rights 0.96 1) Opportunity Perception 0.70
P2 – Perception of Skills 1.00 P2 – Higher Education 0.33 2) Startup Skills 0.35
P3 – Willingness to Start 0.99 P3 – Business Risk 0.29 3) Willingness and Risk 0.26
P4 – Know an Entrepreneur 1.00 P4 – Female Internet Users 0.05 4) Networking 0.18
P5 – Entrepreneur Perception 0.93 P5 – Access to Childcare 0.60 5) Cultural Support 0.46
En
trep
ren
euri
al
Eco
-Sy
stem
P6 – Opportunity Business 0.56 P6 – Bus Freedom & Movement 0.33 6) Opportunity Start up 0.17
P7 – Tech Sector Business 0.03 P7 – Female Science Grads 0.36 7) Technology Sector 0.24
P8 – Highly Educated Owners 0.09 P8 – SME Support and Training 0.40 8) Human Resources Quality 0.15
P9 – Innovativeness 0.91 P9 – Monopolized Markets 0.54 9) Competition 0.41
P10 – Entrepreneurship Ratio 0.93 P10 – Labor Force Gender Ratio 1.00 10) Voice and Agency 0.70
En
trep
ren
euri
al
Asp
ira
tio
ns
P11 – New Product 0.26 P11 – Technology Transfer 0.51 11) Product Innovation 0.19
P12 – New Technology 0.43 P12 – R&D Expenditure 0.26 12) Process Innovation 0.41
P13 – Business Gazelles 0.11 P13 – Female Leadership 0.69 13) High Growth 0.21
P14 – Export Focus 0.15 P14 – Globalization 0.51 14) Internationalization 0.11
P15 – Female Bus Investors 0.02 P15 – Financial Access 0.06 15) External Financing 0.30
Other Gender Index Rankings Rank
Global Gender Gap Index 6
Gender Inequality Index 15
Gender Equity Index 11
EIU Women’s Economic Opportunity 17
* Missing data is indicated with “n.d.” for no data.
Rank Score
17
32
Subindex Rank Score Subindex Rank Score Subindex Rank Score
Entrepreneurial
Environment 14 39
Entrepreneurial Eco-
system 16 33
Entrepreneurial
Aspirations 17 24
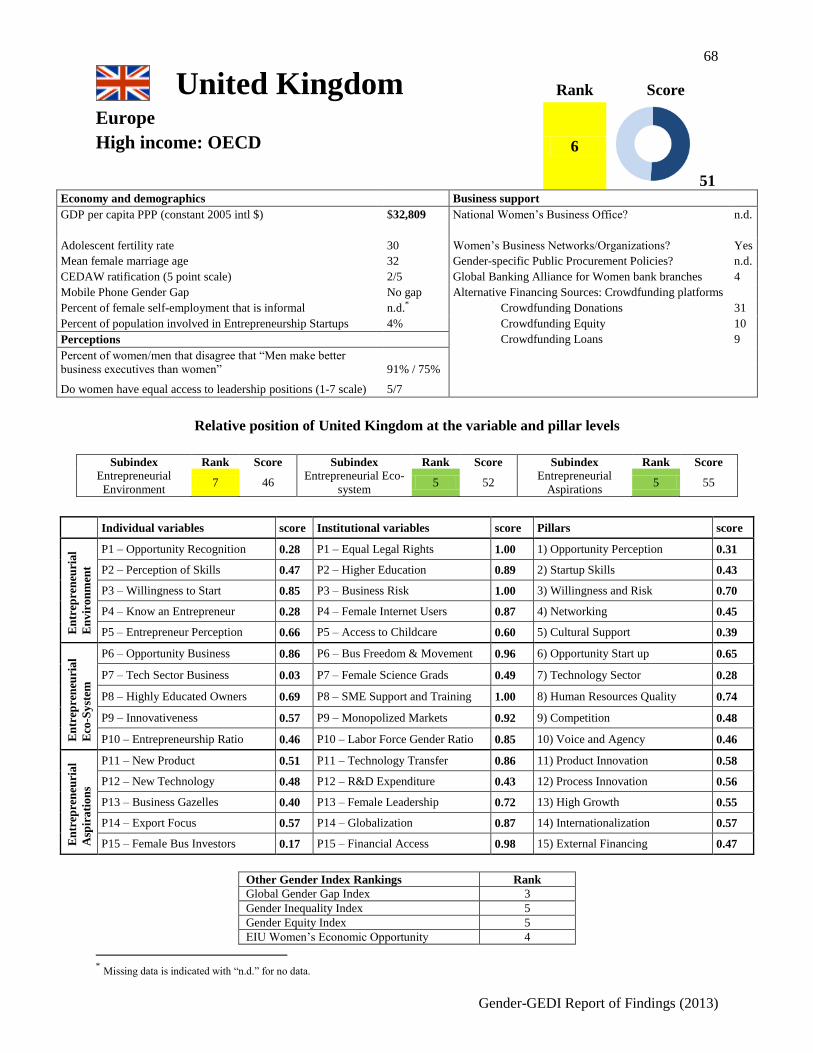
68
Gender-GEDI Report of Findings (2013)
United Kingdom Europe
High income: OECD
Economy and demographics Business support
GDP per capita PPP (constant 2005 intl $) $32,809 National Women’s Business Office? n.d.
Adolescent fertility rate 30 Women’s Business Networks/Organizations? Yes
Mean female marriage age 32 Gender-specific Public Procurement Policies? n.d.
CEDAW ratification (5 point scale) 2/5 Global Banking Alliance for Women bank branches 4
Mobile Phone Gender Gap No gap Alternative Financing Sources: Crowdfunding platforms
Percent of female self-employment that is informal n.d.* Crowdfunding Donations 31
Percent of population involved in Entrepreneurship Startups 4% Crowdfunding Equity 10
Perceptions Crowdfunding Loans 9
Percent of women/men that disagree that “Men make better
business executives than women”
91% / 75%
Do women have equal access to leadership positions (1-7 scale) 5/7
Relative position of United Kingdom at the variable and pillar levels
Individual variables score Institutional variables score Pillars score
En
trep
ren
euri
al
En
vir
on
men
t
P1 – Opportunity Recognition 0.28 P1 – Equal Legal Rights 1.00 1) Opportunity Perception 0.31
P2 – Perception of Skills 0.47 P2 – Higher Education 0.89 2) Startup Skills 0.43
P3 – Willingness to Start 0.85 P3 – Business Risk 1.00 3) Willingness and Risk 0.70
P4 – Know an Entrepreneur 0.28 P4 – Female Internet Users 0.87 4) Networking 0.45
P5 – Entrepreneur Perception 0.66 P5 – Access to Childcare 0.60 5) Cultural Support 0.39
En
trep
ren
euri
al
Eco
-Sy
stem
P6 – Opportunity Business 0.86 P6 – Bus Freedom & Movement 0.96 6) Opportunity Start up 0.65
P7 – Tech Sector Business 0.03 P7 – Female Science Grads 0.49 7) Technology Sector 0.28
P8 – Highly Educated Owners 0.69 P8 – SME Support and Training 1.00 8) Human Resources Quality 0.74
P9 – Innovativeness 0.57 P9 – Monopolized Markets 0.92 9) Competition 0.48
P10 – Entrepreneurship Ratio 0.46 P10 – Labor Force Gender Ratio 0.85 10) Voice and Agency 0.46
En
trep
ren
euri
al
Asp
ira
tio
ns
P11 – New Product 0.51 P11 – Technology Transfer 0.86 11) Product Innovation 0.58
P12 – New Technology 0.48 P12 – R&D Expenditure 0.43 12) Process Innovation 0.56
P13 – Business Gazelles 0.40 P13 – Female Leadership 0.72 13) High Growth 0.55
P14 – Export Focus 0.57 P14 – Globalization 0.87 14) Internationalization 0.57
P15 – Female Bus Investors 0.17 P15 – Financial Access 0.98 15) External Financing 0.47
Other Gender Index Rankings Rank
Global Gender Gap Index 3
Gender Inequality Index 5
Gender Equity Index 5
EIU Women’s Economic Opportunity 4
* Missing data is indicated with “n.d.” for no data.
Rank Score
6
51
Subindex Rank Score Subindex Rank Score Subindex Rank Score
Entrepreneurial
Environment 7 46
Entrepreneurial Eco-
system 5 52
Entrepreneurial
Aspirations 5 55

69
Gender-GEDI Report of Findings (2013)
United States North America
High income: OECD
Economy and demographics Business support
GDP per capita PPP (constant 2005 intl $) $42,486 National Women’s Business Office? Yes
Adolescent fertility rate 30 Women’s Business Networks/Organizations? Yes
Mean female marriage age 27 Gender-specific Public Procurement Policies? Yes
CEDAW ratification (5 point scale) 0/5 Global Banking Alliance for Women bank branches 2
Mobile Phone Gender Gap No gap Alternative Financing Sources: Crowdfunding platforms
Percent of female self-employment that is informal n.d.* Crowdfunding Donations 155
Percent of population involved in Entrepreneurship Startups 6% Crowdfunding Equity 52
Perceptions Crowdfunding Loans 26
Percent of women/men that disagree that “Men make better
business executives than women”
88% / 79%
Do women have equal access to leadership positions (1-7 scale) 5/7
Relative position of United States at the variable and pillar levels
Individual variables score Institutional variables score Pillars score
En
trep
ren
euri
al
En
vir
on
men
t
P1 – Opportunity Recognition 0.39 P1 – Equal Legal Rights 1.00 1) Opportunity Perception 0.54
P2 – Perception of Skills 0.63 P2 – Higher Education 0.90 2) Startup Skills 0.68
P3 – Willingness to Start 0.95 P3 – Business Risk 1.00 3) Willingness and Risk 0.93
P4 – Know an Entrepreneur 0.40 P4 – Female Internet Users 0.78 4) Networking 0.66
P5 – Entrepreneur Perception 0.76 P5 – Access to Childcare 0.80 5) Cultural Support 0.69
En
trep
ren
euri
al
Eco
-Sy
stem
P6 – Opportunity Business 0.85 P6 – Bus Freedom & Movement 0.92 6) Opportunity Start up 0.77
P7 – Tech Sector Business 0.54 P7 – Female Science Grads 0.55 7) Technology Sector 0.68
P8 – Highly Educated Owners 0.98 P8 – SME Support and Training 0.80 8) Human Resources Quality 0.93
P9 – Innovativeness 0.64 P9 – Monopolized Markets 0.88 9) Competition 0.64
P10 – Entrepreneurship Ratio 0.71 P10 – Labor Force Gender Ratio 0.86 10) Voice and Agency 0.77
En
trep
ren
euri
al
Asp
ira
tio
ns
P11 – New Product 0.51 P11 – Technology Transfer 0.97 11) Product Innovation 0.76
P12 – New Technology 0.44 P12 – R&D Expenditure 0.65 12) Process Innovation 0.78
P13 – Business Gazelles 0.51 P13 – Female Leadership 0.89 13) High Growth 0.87
P14 – Export Focus 0.91 P14 – Globalization 0.75 14) Internationalization 0.85
P15 – Female Bus Investors 0.82 P15 – Financial Access 0.84 15) External Financing 0.92
Other Gender Index Rankings Rank
Global Gender Gap Index 4
Gender Inequality Index 7
Gender Equity Index 7
EIU Women’s Economic Opportunity 5
* Missing data is indicated with “n.d.” for no data.
Rank Score
1
76
Subindex Rank Score Subindex Rank Score Subindex Rank Score
Entrepreneurial
Environment 1 70
Entrepreneurial Eco-
system 1 76
Entrepreneurial
Aspirations 1 83

70
Gender-GEDI Report of Findings (2013)
References
Acs, Z. and L. Szerb (2011). The Global Entrepreneurship and Development Index, Northampton, MA:
Edward Elgar.
Acs, Z. and P. Mueller (2006). ‘Employment effects of business dynamics: Mice, Gazelles and Elephants’
Small Business Economics 30: 85 – 100.
Acs, Z., E. Autio, and L. Szerb (2012). ‘National Systems of Entrepreneurship: Measurement Issues and
Policy Implications’, George Mason University School of Public Policy Research Paper No. 2012-08.
Aidis, R. and T. Mickiewicz (2006). ‘Why entrepreneurs do not expect to expand their businesses:
Lessons from Lithuania’, Europe Asia Studies, 58/6, 855 – 880.
Allen, I., A. Elam, N. Langowitz and M. Dean (2008). Global Entrepreneurship Monitor 2007 Report on
Women and Entrepreneurship, Wellesley, MA: Babson College and London: London Business School
Bates, T. (1990). Entrepreneur Human Capital Inputs and Small Business Longevity, The Review of
Economics and Statistics, 72(4) 551-559
Bates, T. (1995). Self-Employment Entry across Industry Groups, Journal of Business Venturing 10(2)
143-56.
Baumol, W. J. (1990). ‘Entrepreneurship: Productive, unproductive, and destructive.’ Journal of political
economy: 893-921.
Bird, B. and C. Brush (2002). A Gendered Perspective on Organizational Creation, Entrepreneurship:
Theory and Practice, 26(3), 41 – 65.
Blau, F. and L. Kahn (2013). ‘Female Labor Supply: Why is the US Falling Behind’ IZA Discussion
Paper No. 7140
Bruhn, M. (2009). Female –owned Firms in Latin America. Characteristics, Performance, and Obstacles
to Growth, Policy Research Working Paper series 5122, World Bank, Washington DC.
Brush, C., Carter, N., Gatewood, E., Greene, P., and M. Hart (2004). Clearing the Hurdles: Women
Building High Growth Businesses, Upper Saddle River, N.J.: Financial Times-Prentice Hall.
Caliendo, M., F. M. Fossen, and A.S. Kritikos (2009). ‘Risk attitudes of nascent entrepreneurs–new
evidence from an experimentally validated survey.’ Small Business Economics 32(2): 153-167.
Carter, N. and K. R. Allen (1997). ‘Size determinants of women-owned businesses: choice or barriers to
resources?’ Entrepreneurship & regional development 9(3): 211-220.
Coface (2011). Country Risk Rate, www.trading-safety.com
Coleman, S. (2000). ‘Access to capital and terms of credit: a comparison of men- and women-owned
small businesses.’ Journal of Small Business Management 38: 37 – 52.
Costa, R. and B. Rijkers (2011). Gender and Rural Non-farm Entrepreneurship, Background paper for
World Bank’s World Development Report 2012.

71
Gender-GEDI Report of Findings (2013)
Davidsson, P. (2003). ‘The domain of entrepreneurship research: Some suggestions.’ Advances in
entrepreneurship, firm emergence and growth 6(3): 315-372.
DeTienne, D. R. and G. N. Chandler (2007). ‘The role of gender in opportunity identification.’
Entrepreneurship Theory and Practice 31(3): 365-386.
Edwards, L. and E. Field-Hendrey (2002). Home-based Work and Women’s Labor Force Decisions,
Journal of Labor Economics 20(1), 170 – 200.
Gaule, P. and M. Piacentini (2012). Gender, Social Networks and Access to Venture Capital, unpublished
manuscript in OECD (2012) Closing the Gender Gap: Act Now, www.oecd.org
Gender-GEDI (2013). Gender-GEDI Report, The GEDI Institute, www.thegedi.org
Global Entrepreneurship Monitor (2011). Adult Population Survey, www.gemconsortium.org
Gompers, P. A. and J. Lerner (2004). The venture capital cycle, MIT press.
Hallward-Driemeier, M. (2011a). Expanding Women’s Opportunities in Africa, Washington DC: World
Bank.
Hallward-Driemeier, M. (2011b). Improving the Legal Investment Climate for Women in Sub-Saharan
Africa, Washington DC: World Bank.
Hallward-Driemeier, M., L. Klapper, A. Togan-Egrican (2011c). Gender and Entrepreneurial
Opportunities: A look at the Legatum Entrepreneurship and Opportunity Index, paper.
Heritage Foundation (2011). Economic Freedom Index, www.heritage.org
Hofstede, G. (2001). Culture’s Consequences: Comparing Values, Behaviors, Institutions and
Organizations Across Nations (2nd ed.). Thousand Oaks, CA: SAGE.
Kelley, D., C. Brush, P. Greene and Y. Litovsky (2011). Global Entrepreneurship Monitor 2010
Women’s Report, Babson College, Babson Park, MA, USA, http://www.gemconsortium.org
Langowitz, N. and M. Minniti (2007). ‘The entrepreneurial propensity of women.’ Entrepreneurship
Theory and Practice 31(3): 341-364.
Mead, D. and C. Liedholm (1998). The Dynamics of Micro and Small Enterprises in Developing
Countries, World Development 26(1), 61-74.
Minniti, M. (2009). Gender Issues in Entrepreneurship, Foundations and Trends in Entrepreneurship,
5(7-8), 497-621.
Morris, R. (2011). ‘2011 High-Impact Entrepreneurship Global Report’, Center for High Impact
Entrepreneurship, Endeavor and the Global Entrepreneurship Monitor,
http://www.gemconsortium.org/docs/download/295
Nelson, T. and S. Duffy (2010). ‘Men, Women, Sex and Gender in Entrepreneurship Education’, in A.
Fayolle (ed.), Handbook of Entrepreneurship Education, Vol. 4, Edward Elgar: Cheltenham, UK.
Papagiannidis, S. and F. Li (2005). ‘Skills Brokerage:: A New Model for Business Startups in the
Networked Economy.’ European Management Journal 23(4): 471-482.
72
Gender-GEDI Report of Findings (2013)
Parker, S. (2009). The Economics of Entrepreneurship, Chapter 6. Cambridge: Cambridge University
Press.
Sabarwal, S. , K. Terrell and E. Bardasi (2009). How do Female Entrepreneurs Perform? Evidence from
Three Developing Regions, World Bank, Washington DC.
Seligson, H. (2012). 'Nurturing a Baby and a Start-up Business', New York Times, June 9, 2012, online
edition (www.nytimes.com)
Seligson, M. A. (2002). The renaissance of political culture or the renaissance of the ecological fallacy.
Comparative Politics, 34(April): 273-292.
Sorensen, J. B. and O. Sorenson (2003). ‘From conception to birth: Opportunity perception and resource
mobilization in entrepreneurship.’ Advances in Strategic Management 20: 89-117.
Stam, E. and K. Wennberg (2009). ‘The roles of R&D in new firm growth.’ Small Business Economics
33(1): 77-89.
Steyaert, C. and J. Katz (2004). ‘Reclaiming the space of entrepreneurship in society: geographical,
discursive and social dimensions.’ Entrepreneurship & regional development 16(3): 179-196.
Verheul, I., A. van Stel and R. Thurik (2006). Explaining Female and Male Entrepreneurship at the
Country Level, Entrepreneurship and Regional Development, 18(2), 151-83.
Weeks, J. (2011). 'Assessing Business Enabling Environments: How Gender Changes the Equation' Paper
presented at International Council for Small Business world conference and an annual meeting of The Donor
Committee for Enterprise Development, both in 2011.
http://www.womenable.com/userfiles/downloads/Weeks_Engendering_BEE_public.pdf
Welter, F. and D. Smallbone (2011). Institutional Perspectives on Entrepreneurial Behaviour in
Challenging Environments. Journal of Small Business Management, 49 (1): 107-125
Welter, F. (2008). Entrepreneurship in its context (s): a review. NSF-DFG Conference ‘Contextualizing
Economic Behaviour’, August 21-23, 2008, New York City.
Welter, F. and D. Smallbone (2003). Entrepreneurship and Enterprise Strategies in Transition Economies:
An Institutional Perspective, in D. Kirby and A. Watson (eds) Small Firms and Economic Development in
Developed and Transition Economies: A Reader, Burlington, VT: Ashgate Publishing.
World Bank (2012). World Development Report 2012: Gender Equality and Development,
http://siteresources.worldbank.org/INTWDR2012/Resources/7778105-1299699968583/7786210-
1315936222006/Complete-Report.pdf
Zellweger, T.M., R.S. Nason, M. Nordqvist and C. Brush (2011). Why Do Family Firms Strive for
Nonfinancial Goals? An Organizational Identity Perspective. Entrepreneurship, Theory and Practice,
May 2011: 1 - 20.