the galvin electricity initiative task 2 – potential for end-use · pdf filetechnologies...
TRANSCRIPT

The Galvin Electricity Initiative Task 2 – Potential for End-Use Energy Technologies to Improve Functionality and Meet Consumer Expectations
Volume 2: Evaluating Trends in End-Use Sectors
February 2006
Galvin Electricity Initiative 3412 Hillview Avenue
Palo Alto, CA 94304 650-855-2400

ii
Galvin Electricity Initiative The Galvin Electricity Initiative seeks to identify opportunities for technological innovation in the electric power system (broadly defined) that will best serve the changing needs of consumers and businesses over at least the next 20 years. Of paramount importance will be insuring that the electricity system provides absolutely reliable and robust electric energy service in the context of changing consumer needs.
For more information about this publication or the Galvin Electricity Initiative, please contact Galvin Electricity Initiative at 650-855-2400 or visit us at www.galvinelectricity.org.
© 2006 Galvin Electricity Initiative
All rights reserved.
Galvin Electricity Initiative and the Galvin Electricity Initiative logo are trademarks of The Galvin Project, Inc.

iii
CITATIONS
This report was prepared by
Galvin Electricity Initiative 3412 Hillview Avenue Palo Alto, CA 94304
and
Global Energy Partners, LLC 3569 Mt. Diablo Blvd., Suite 200 Lafayette, CA 94549
Project Manager P. Hurtado
Principal Investigators K. Parmenter M. Previsic C. Arzbaecher
This report describes research sponsored by The Galvin Project, Inc.
The report is a corporate document that should be cited in the literature in the following manner:
The Galvin Electricity Initiative: Task 2 - Potential for End-Use Energy Technologies to Improve Functionality and Meet Consumer Expectations, Volume 2: Evaluating Trends in End-Use Sectors. EPRI, Palo Alto, CA, and The Galvin Project, Inc., Chicago, IL: 2006.


v
ACKNOWLEDGEMENTS
The Task 2 team is grateful to Mr. Bob Galvin for his vision in initiating this important Initiative and for his generous sponsorship. We also thank his sons, Mike and Chris Galvin, for their insights during a workshop organized to review the preliminary Task 2 results. The Task 2 team is also indebted to the following Task 2 workshop participants, reviewers, and contributors for their valuable contributions.
• Massoud Amin, University of Minnesota
• Jay Apt, Carnegie Mellon University
• Robert Clarke, Electrochemical Design Associates
• Bob Frosch, Harvard University
• Sidney Green, TerraTek
• Maurice Gunderson, Nth Power LLC
• Myron Jones, Independent Consultant
• Frank Kreith, University of Colorado
• Michael McGinnis, Salt River Project
• Tom Sparrow, Purdue University
• Usha Varshney, National Science Foundation
The completion of Task 2 was a monumental effort supported by a number of team members. The Task 2 team consisted of the following contributors.
• Kurt Yeager, President Emeritus, EPRI
• Clark Gellings, EPRI
• John Kotowski, Global Energy Partners, LLC
• Patricia Hurtado, Global Energy Partners, LLC
• Kelly Parmenter, Global Energy Partners, LLC
• Mirko Prevesic, Independent Consultant
• Cecilia Arzbaecher, Global Energy Partners, LLC

vi
• Arshad Mansoor, EPRI Solutions, Inc.
• Chris Melhorn, EPRI Solutions, Inc.
• Haresh Kamath, EPRI Solutions, Inc.
• Gene Oatman, Strategic Decisions Group

vii
CONTENTS
1 INTRODUCTION ....................................................................................................................1-1 1.1 Background .....................................................................................................................1-1 1.2 Task 2 Objectives............................................................................................................1-3 1.3 Methodology and Results................................................................................................1-4 1.4 Step 1: Evaluate Consumer Needs and Technology Trends ..........................................1-5
2 SELECTING END-USE SECTORS........................................................................................2-1
3 RESIDENTIAL SECTOR ........................................................................................................3-1 3.1 Electricity Use Trends .....................................................................................................3-2 3.2 Cooking Trends...............................................................................................................3-5 3.3 Fax/Photocopier Trends..................................................................................................3-7 3.4 Appliance Trends ............................................................................................................3-8 3.5 Growth in the Use of Electric Clothes Dryers ................................................................3-10 3.6 Refrigerator Trends .......................................................................................................3-11 3.7 Household Personal Computer Trends.........................................................................3-12 3.8 Air Conditioning Trends.................................................................................................3-14 3.9 Lighting Trends .............................................................................................................3-15
4 COMMERCIAL SECTOR .......................................................................................................4-1 4.1 Electricity Trends.............................................................................................................4-2 4.2 Lighting Trends ...............................................................................................................4-4 4.3 Space Conditioning Trends.............................................................................................4-5 4.4 Computer Trends ............................................................................................................4-8
5 INDUSTRIAL SECTOR ..........................................................................................................5-1 5.1 Electricity Use Trends .....................................................................................................5-1 5.2 Technology Trends..........................................................................................................5-2 5.3 Trends in Energy Management Activities......................................................................5-11

viii
6 TRANSPORTATION SECTOR ..............................................................................................6-1 6.1 Energy Trends.................................................................................................................6-2 6.2 Fuel Efficiency Trends.....................................................................................................6-5 6.3 Energy Intensity Trends ..................................................................................................6-9 6.4 Trends in the Use of Alternative Fuels ..........................................................................6-11 6.5 Trends in Electric Drive Vehicles...................................................................................6-13 6.6 Air Emissions Trends ....................................................................................................6-13
7 TRENDS APPLICABLE TO MULTIPLE SECTORS..............................................................7-1 7.1 Indoor Air Quality Trends ................................................................................................7-2 7.2 Outdoor Air Quality Trends..............................................................................................7-3 7.3 Waste Management Trends............................................................................................7-7
8 CONCLUSIONS .....................................................................................................................8-1

ix
LIST OF FIGURES
Figure 1-1 Work Flow for Phase I of the Galvin Electricity Initiative..........................................1-2 Figure 1-2 Task 2 Methodology ................................................................................................1-4 Figure 2-1 Breakdown of Total Energy Use by End-Use Sector, 2004.....................................2-2 Figure 2-2 Breakdown of Primary Energy Use by End-Use Sector, Including Electric
Power Sector, 2004............................................................................................................2-3 Figure 2-3 Breakdown of Retail Sales of Electricity by End-Use Sector, 2004.........................2-4 Figure 3-1 Number of Hot Meals Cooked in the Home for All U.S. Households, 1993
and 2001 ............................................................................................................................3-6 Figure 3-2 Trends in Major Electrical Appliances (Percentage of Households Using
Appliances), 1978-2001 .....................................................................................................3-8 Figure 3-3 Trends in Electric Clothes Dryers (Percentage of Households Using
Appliance), 1978-2001 .....................................................................................................3-10 Figure 3-4 Trends in Refrigerator Size and Energy Use, 1947-2001......................................3-11 Figure 3-5 Potential Global PC Power Savings (TWh) Using IAPC Technology ....................3-13 Figure 3-6 Trends in Personal Computers (Percentage of Households Using Appliance),
1984-2001 ........................................................................................................................3-13 Figure 3-7 Combined Shipments of Unitary Air Conditioners and Heat Pumps, January
2003 - October 2005 ........................................................................................................3-14 Figure 4-1 Number of Transistors per Integrated Circuit ........................................................4-10 Figure 6-1 Energy Consumption by Transportation Mode, 2001 (Total Energy Use =
25.51 x 10¹⁵ Btu) ................................................................................................................6-3 Figure 6-2 Share of Passenger-Miles by Mode, 2000 ..............................................................6-4 Figure 6-3 Historical Vehicle Mix in the U.S..............................................................................6-5 Figure 6-4 Fuel Efficiency for Road Transport Vehicles, 1960-1998 ........................................6-6 Figure 6-5 Fuel Efficiency for Aircraft and Rail Freight Locomotives, 1960-1999.....................6-7 Figure 6-6 New Vehicle Fuel Efficiency for Passenger Cars, 1980-1999 .................................6-8 Figure 6-7 Energy Intensity for Passenger Travel, 1960-1998 ...............................................6-10 Figure 6-8 Energy Intensity for Railroad Freight Transport, 1960-1999..................................6-11 Figure 6-9 Alternative Fuel Consumption for Highway Vehicles, 1999...................................6-12 Figure 6-10 Emissions from Mobile Sources in the U.S..........................................................6-14 Figure 7-1 Comparison of Growth Areas and Emissions..........................................................7-4


xi
LIST OF TABLES
Table 1-1 End-Use Sectors Selected for Trend Analysis..........................................................1-5 Table 3-1 Electricity Use Trends by Consumer Technology Application Area – U.S.
Residential Sector ..............................................................................................................3-3 Table 3-2 U.S. Housing Units Using Fax and Photocopier Machines.......................................3-7 Table 3-3 Trends in Air Conditioning Energy Use and Penetration, 1978-2001 .....................3-15 Table 4-1 Electricity Use Trends by Consumer Technology Application Area – U.S.
Commercial Sector.............................................................................................................4-3 Table 4-2 Percentage of Floorspace Lit by Type of Lighting Equipment – U.S.
Commercial Sector.............................................................................................................4-5 Table 4-3 Standards for Commercial-Scale Air Conditioning Systems, 2001...........................4-6 Table 4-4 Percentage of Floorspace Heated by Type of Heating Equipment – U.S.
Commercial Sector.............................................................................................................4-7 Table 4-5 Percentage of Floorspace Cooled by Type of Cooling Equipment – U.S.
Commercial Sector.............................................................................................................4-8 Table 4-6 Change in the Number of Computers in Commercial Buildings, 1992 to 1999.........4-9 Table 5-1 Electricity Use Trends by Consumer Technology Application Area – U.S.
Manufacturing Industries....................................................................................................5-2 Table 5-2 Number of U.S. Establishments by Usage of Energy-Saving Technologies for
Specific Industries, 1994 and 1998 ....................................................................................5-5 Table 5-3 Number of U.S. Establishments by Participation in Energy-Management
Activity, 1994, 1998, and 2002.........................................................................................5-12 Table 7-1 National Long-Term Air Quality Trends, 1981-2000 .................................................7-5 Table 7-2 NAAQS in Effect as of December 2002....................................................................7-6 Table 7-3 Milestones Since the Enactment of the Resource Conservation and Recovery
Act (RCRA) ........................................................................................................................7-8 Table 8-1 End-Use Technology Application Areas Identified During Evaluation of Trends ......8-1

1-1
1 INTRODUCTION
1.1 Background
The Galvin Electricity Initiative seeks to identify opportunities for technological innovation in the electric power system that will serve the changing needs of consumers and businesses over the next 15 to 20 years. The goal of these innovations is to provide absolutely reliable electric energy service that perfectly meets 21st Century consumer needs and expectations and is robust over as broad a set of circumstances as can be envisioned. In the context of this Initiative, electric energy service is defined as the end-use service ultimately provided by electricity. This future electricity service will utilize to best advantage an optimal combination of the traditional electricity infrastructure plus advanced power generation, energy storage, and energy delivery technologies; it will also implement a transformed electrical interface with the consumer that incorporates innovative energy consuming processes, devices, and appliances.
The Initiative will also examine opportunities for marrying this transformed electric energy service capability with innovative electrotechnologies that are capable of improving productivity and enhancing the quality of life for all consumers. This extends beyond the existing interface between consumers and service providers (i.e., the utility-owned meter that measures kilowatt hours of electricity sold by the utility and consumed by the customer). It extends all the way to the energy-consuming device or appliance on the customer’s premises and includes all elements in the chain of technologies that ultimately enable electricity to be utilized as motive power, lumens of light on a work surface, or digitized processes.
Electricity has proven to be an unparalleled transformative agent for the nation’s economy and society throughout the 20th Century. Today, however, the electricity enterprise is at a critical juncture in its life cycle where it too must transform its aging, increasingly vulnerable, electromechanical infrastructure and commodity energy business model. Fundamentally greater emphasis on system reliability, quality, security, and service excellence is essential to build consumer value and satisfaction in the 21st Century. The digital revolution is both a key asset and challenge in this transformation, and the ultimate goal must be absolutely reliable and affordable energy quality and quantity for all.
The goal of Phase I of this Initiative is to determine, from the consumer’s perspective, what the key Nodes of Innovation are that will play the principal role in both shaping and meeting the consumer’s electric energy service demands, particularly in the next 15 to 20 year time frame. These nodes can include the evolution of entirely new end-use devices, the proliferation of existing devices now available – but having limited market penetration today, plus any number of possible electric power system technologies and configurations. Based on these pivotal

Introduction
1-2
innovations, a comprehensive blueprint will be developed in Phase II for achieving and maintaining the absolute electric energy service excellence needed and expected by 21st Century consumers. Figure 1-1 illustrates the workflow for Phase I of the Initiative.
Figure 1-1 Work Flow for Phase I of the Galvin Electricity Initiative
Phase I of the Initiative consists of the following seven tasks:
• Task 1: Consumer Needs and Expectations
• Task 2: Assess Energy Technology Potential
• Task 3: Technology Scanning, Mapping & Foresight
• Task 4: Analysis Framework
• Task 5: Develop Functional Specifications
• Task 6: Synthesis of Innovation Opportunities
• Task 7: Technology Transfer
The Initiative begins with a series of three parallel tasks (Tasks 1 to 3) that comprehensively gather and assess the considerable amount of existing relevant information, data, and research. These tasks examine expected consumer needs and technology developments that have the greatest potential impact on 21st Century electricity needs in terms of functional requirements (service, security, quality, availability, cost, safety, environmental impacts, etc.) and corresponding power system performance. Electric energy service needs can be identified from two complementary perspectives. One would look at the evolution of society and observe how behavior and electric service needs may evolve; this is the focus of Task 1. Another would look

Introduction
1-3
at the technologies currently in use and at those evolving to determine how these technologies may shape future electric service needs. Tasks 2 and 3 follow this approach
This report covers the Task 2 portion of the Initiative:
• What existing and emerging end-use technologies can meet future consumer needs?
• Are there entirely new end-use technologies that could be potentially available to meet future consumer needs?
1.2 Task 2 Objectives
The intent of Task 2 is to identify and evaluate innovative energy technologies that may both influence and meet the needs and expectations of consumers identified in Task 1 coupled with insights regarding how today’s uses may evolve. This task involves three subtasks:
• Study trends affecting technology innovation in end-use sectors
• Conduct a workshop to identify innovative end-use technologies on the horizon and to define the perfect electric energy service system
• Develop potential for innovative end-use technologies to meet consumer needs and expectations, thereby contributing to the perfect electric energy service system
In particular, Task 2 focuses on the potential for technological functionality advancement. This task involves an assessment of the worldwide energy technology horizon to search for early indications of innovative electricity utilization (end-use), distributed resources, power electronics, and power quality technologies that could more perfectly meet consumer needs. (The focus is mainly on end-use technologies; however, technologies related to distributed resources, power electronics, and power quality were also investigated because of their close relationship with end-use technologies and the goals of the Galvin Electricity Initiative.)
The emphasis here is on traditional sources of technology development within the electric industry. These traditional sources include electric utilities; universities; laboratories; and electrical apparatus, appliance and service manufacturers. The assumption is that the end-use technologies to be reviewed have already been developed and at least modestly demonstrated in a laboratory setting.

Introduction
1-4
1.3 Methodology and Results
Figure 1-2 illustrates the methodology used for Task 2.
Figure 1-2 Task 2 Methodology
The team conducted Task 2 in four separate steps:
• Evaluate consumer needs and technology trends
• Define criteria for perfect system and select technology application areas
• Evaluate technology application areas and individual technologies
Identify Trends in Energy User Technology
Application Areas
Evaluate Selected Technology Application Areas and Individual Technologies Within Each Area
Step 2
Step 3
Conduct “Potential for Technological Innovation in the Electric Energy Service
System Workshop”
Step 1
Incorporate Results of Task 1: Future Energy User
Electricity Service Needs
Summarize Technologies and Highlight Contribution to the Perfect Electric
Energy Service System Step 4
Define Design Criteria for the Perfect Electric
Energy Service System
Refine Selection of Technology Application Areas to Address
Contribution to the Perfect System
Identify Technology Application Areas with Most Promise for Innovation in Order to Meet
Future Energy User Needs

Introduction
1-5
• Develop conclusions
This volume (Volume 2) covers Step 1. Volume 1 summarizes all Task 2 results. A detailed description of the Step 3 methodology and results is presented in Volume 3.
1.4 Step 1: Evaluate Consumer Needs and Technology Trends
This report describes results from a two-step process that was used to evaluate trends in end-use sectors. The first step of the process involved selecting end-use sectors to target during the study. The second step identified trends in consumer technology application areas within each targeted sector. The purpose of this process was to identify trends with the potential to affect technology innovation within the end-use sectors.
Chapter 2 discusses the end-use sectors chosen for evaluation, namely: 1) the residential sector, 2) the commercial sector, 3) the industrial sector, and 4) the transportation sector (see Table 1-1).
Table 1-1 End-Use Sectors Selected for Trend Analysis
End-Use Sectors Selected for Trend Analysis
Residential Sector
Commercial Sector
Industrial Sector
Transportation Sector
Chapters 3 through 7 describe pertinent trends with the potential to influence technology development within various application areas associated with the end-use sectors. The purpose of this portion of the study was to investigate areas within each sector where “things are happening” by examining energy use, consumer behavior, or other patterns. These patterns, or trends, show the potential for evolutionary change in technologies to meet changes in functional requirements. Some areas are evolving more quickly than others; trend analysis helps pinpoint the areas rapidly changing and ultimately influencing technology innovation. For example, it is undisputed that the way we communicate is evolving tremendously. Cell phones and other personal electronic devices have proliferated in the last few years. Consumer behavior and desires related to communication will surely continue to drive technological innovation in this area. In contrast, one could argue that water pumping, for example, has changed very little in recent time. The intent of this step was to highlight those technology application areas that are evolving in a manner likely to impact technology innovation.
What the analysis in this volume does not show is the potential for revolutionary change. Technologies with the potential to effect revolutionary change (i.e., “killer applications”) must be identified by other means, including the use of insight from experts in the field. Two examples of recent revolutionary technologies include the personal computer and the cell phone. The introduction of both technologies changed the way we live and do business – we would now

Introduction
1-6
have trouble living without them. These technologies also show room for evolutionary change to meet changing consumer expectations. Deeper research into technology areas (as has been initiated in Volume 3) coupled with “out-of-the-box” thinking by entrepreneurs, scholars, and inventors will help to identify possible revolutionary technologies in future phases of the Galvin Electricity Initiative.
The various trends investigated for the end-use sectors are listed in Table 1-2. The bottom row of the table lists trends that apply to multiple sectors. Subsequent sections present the results of the trends evaluations for each sector.
Table 1-2 Trends Evaluated in End-Use Sectors
Residential Commercial Industrial Transportation
Electricity use
Home cooking
Penetration of fax machines / photocopiers
Penetration of various appliances
Growth in electric clothes dryers
Refrigerator sizes and energy use
Penetration of personal computers
Penetration and energy use of air conditioners
Lighting trends
Electricity use
Penetration of lighting equipment by type
Penetration of space conditioning equipment by type
Penetration of computers by building type
Electricity use
Penetration of energy-efficient technologies
Implementation of energy management activities
Energy use
Fuel efficiency
Energy intensity
Use of alternative fuels
Use of electric drive vehicles
Air emissions
Indoor air quality
Outdoor air quality
Waste management

2-1
2 SELECTING END-USE SECTORS
The project team selected four end-use sectors to focus on:
1. Residential
2. Commercial
3. Industrial
4. Transportation
Depending on how energy consumption is defined, the four sectors represent either all of total energy consumption, or about 60% of primary energy consumption (the other 40% is primary energy used by the electric power sector). According to the Energy Information Administration (EIA), primary energy consumption includes coal, natural gas, petroleum, nuclear electric power, hydroelectric power, wood, waste, alcohol fuels, geothermal, solar, wind, coal coke net imports, and electricity net imports. Total energy consumption includes primary consumption, electricity retail sales, and electrical system energy losses. Figure 2-1 shows the breakdown of total energy consumption by the four end-use sectors listed above. Figure 2-2 shows the breakdown of primary energy consumption by the four sectors above and the electric power sector. The data are for 2004 when the total energy consumption in the U.S. was equal to 100.2 quadrillion Btus. Since electricity is the focus of this study, Figure 2-3 is also included to illustrate the breakdown of retail sales of electricity by end-use sector in 2004. The residential, commercial, and industrial sectors each account for roughly one-third of electricity retail sales; transportation represents less than 1%.

Selecting End-Use Sectors
2-2
Total Energy Consumption by End-Use Sector, 2004 (Total for all Sectors = 100.2 Quadrillion Btu)
Residential21%
Commercial17%
Industrial34%
Transportation28%
Source: Energy Information Administration/Monthly Energy Review, July 2005
Figure 2-1 Breakdown of Total Energy Use by End-Use Sector, 2004

Selecting End-Use Sectors
2-3
Primary Energy Consumption by End-Use Sector, 2004 (Total for all Sectors = 100.2 Quadrillion Btu)
Residential7%
Commercial4%
Industrial22%
Electric Power 39%
Transportation28%
Source: Energy Information Administration/Monthly Energy Review, July 2005
Figure 2-2 Breakdown of Primary Energy Use by End-Use Sector, Including Electric Power Sector, 2004

Selecting End-Use Sectors
2-4
Retail Sales of Electricity by End-Use Sector, 2004 (Total for all Sectors = 3,501 Billion kWh)
Residential36%
Industrial29%
Commercial35%
Transportation<1%
Source: Energy Information Administration/Monthly Energy Review, July 2005
Figure 2-3 Breakdown of Retail Sales of Electricity by End-Use Sector, 2004

3-1
3 RESIDENTIAL SECTOR
This chapter presents trend information for various aspects of the residential sector. The aspects evaluated and overviews of the results are included in the following paragraphs. Sections 3.1 through 3.9 discuss the trends in greater detail.
• Electricity use: Total electricity use in the residential sector increased by about 19% between 1993 and 2001, and is projected to increase by 59% between 2001 and 2025. Three of the areas projected to grow most notably are lighting, color televisions (TVs), and personal computers (PCs). Space conditioning, refrigeration and freezing, water heating, and laundry will continue to be significant electricity users. Because these end-use areas are so reliant on electricity, technological innovations and changes within these areas have the potential to impact the perfect electric energy service system significantly.
• Cooking: Factors such as increasingly busy lifestyles, dual-income families, single-parent families, and in some cases better economic conditions are driving more people to eat out, purchase prepared foods from the grocery store, or buy take-out meals. There is a definite trend toward convenience of meal preparation. End-use technologies that facilitate and expedite meal preparation will be important in the future.
• Fax/photocopiers: Three percent of housing units had fax capability in 1993 compared with 22.1% in 2001. This is more than a 7-fold increase in eight years. Similarly, the number of housing units with photocopier capability experienced nearly a 12-fold increase during the same period. Much of the increase is attributable to the market penetration of personal computers (PCs) and PC printers with fax and photocopier features. As home offices become more sophisticated and as more people begin to telecommute, fax and photocopying will become more prevalent in the home.1 Technological innovations in residential-scale equipment of this type will be important in the future.
• Appliances: The market penetration of microwave ovens in households rose dramatically from 8% in 1978 to 86% in 2001. Dishwashers have also become more prevalent, with a little over one-third of households having a dishwasher in 1978, and over one-half of households having one by 2001. The prevalence of clothes washers and freezers has not changed too drastically in the last 20 to 25 years. According to the Association of Home Appliance Manufacturers (AHAM), consumer trends indicate that users are purchasing appliances that save time, are easy to clean, have a stylish appearance, provide multiple functions, and help to promote healthy cooking and/or a healthy home environment.2 Innovations in end-use technologies that serve these trends will contribute to the perfect electric energy service system.
1 However, email now displaces the use of fax machines in many instances. 2 Association of Home Appliance Manufacturers (AHAM), www.aham.org.

Residential Sector
3-2
• Electric clothes dryers: Between 1978 and 2001, the number of households with electric dryers grew from 45 to 57%. Advancements in electric clothes dryers could increase the share of electric dryers relative to gas-fired units, thus impacting the electric energy service system of the future.
• Refrigerators: The average size of refrigerators has more than doubled from less than 10 cubic feet in 1947 to over 20 cubic feet in 2001. Meanwhile, the efficiency of refrigerators has increased dramatically. The net result is that current refrigerators use about as much energy as those half the size did 45 to 50 years ago. Further efficiency improvements will continue to impact electricity use in the future.
• Household personal computers: PCs represent an increasing share of energy consumption in residential buildings. For example, they accounted for roughly 1.6% of residential energy use in 2001, and are projected to represent 2.4% by 2025.3,4 Though the share of electricity consumption is expected to increase because of greater penetration and use, the efficiency of PCs is continually improving, offsetting energy consumption. Moreover, the greater use of lap top computers, which are inherently more efficient, will mitigate energy consumption increases. Technological innovations in PCs will surely contribute to the perfect electric energy service system of the future.
• Air conditioning: Though the number of households with room air conditioning units remained fairly constant between 1978 and 2001 at roughly one-quarter million, the number of households with central air conditioning units increased steadily from 17.6 million to 57.5 million during this period, a more than three-fold increase. Overall electricity use by air conditioning has also increased due to the greater penetration of central units in homes. However, growth in electricity use has been tempered by efficiency gains in air conditioning systems. Technological improvements and continued gains in efficiency will affect future electricity use.
• Lighting: Lighting accounts for a significant portion of residential electricity use (~9% in 2001), and its share of total electricity use is expected to increase (to ~18% by 2025). Advancements aimed at improving lighting efficiency and functionality will be particularly important for perfection in the electric energy service system of the future.
3.1 Electricity Use Trends
Table 3-1 summarizes past, current, and projected electricity use by consumer technology application area for the residential sector. The results show that total electricity use in the residential sector increased by about 19% between 1993 and 2001, and is projected to increase by 59% between 2001 and 2025. Three of the areas projected to grow most notably are lighting, color televisions (TVs), and personal computers (PCs). Space conditioning, refrigeration and freezing, water heating, and laundry will continue to be significant electricity users.
3 Energy Information Administration, Residential Energy Consumption Survey, 2001.
4 Energy Information Administration, Annual Energy Outlook 2005, Appendix A.

Residential Sector
3-3
Table 3-1 Electricity Use Trends by Consumer Technology Application Area – U.S. Residential Sector
U.S. Residential Sector Electricity Use [billion kWh]
Consumer Technology Application Area
1993 Actual Electricity Use
(% of Total)
2001 Actual Electricity Use
(% of Total)
2025 Projected Delivered Elec. Use
(% of Total)
Total Residential Electricity Use
962 (100%) 1,140 (100%) 1,811 (100%)
Lighting and Other Appliances
Lighting Only
416 (43.2%)
NA
NA
101 (8.8%)
NA
331 (18.3%)
Space Heating 119 (12.4%) 116 (10.2%) 138 (7.6%)
Space Cooling/Ventilation
Central AC
Room/Wall AC
Furnace Fans
194 (20.2%)
170 (17.7%)
24 (2.5%)
NA
183 (16.1%)
161 (14.1%)
22 (1.9%)
38 (3.3%)
234 (13.0%)
NA
NA
35.2 (1.9%)
Indoor Air Quality
Dehumidifier
Humidifier
NA
NA
5 (0.4%)
2 (0.1%)
NA
NA
Cooking a NA 80 (7.0%) 38 (2.1%)
Refrigeration & Freezing
Refrigeration
Freezing
134 (13.9%)
NA
156 (13.7%)
39 (3.4%)
106 (5.8%)
38.1 (2.1%)
Laundry (Clothes Washers and Dryers Combined)
NA 76 (6.7%) 103 (5.7%)
Entertainment/Exercise
Color TV
VCR/DVD/Cable Box/Satellite
Stereo Equipment
Pool Filters, Pumps, & Heaters
NA
NA
NA
NA
33 (2.9%)
16 (1.4%)
6 (0.5%)
17 (1.5%)
82 (4.5% )
NA
NA
NA

Residential Sector
3-4
U.S. Residential Sector Electricity Use [billion kWh]
Consumer Technology Application Area
1993 Actual Electricity Use
(% of Total)
2001 Actual Electricity Use
(% of Total)
2025 Projected Delivered Elec. Use
(% of Total)
Communications/ Information/Education
Personal Computers (Desk and Lap Top)
Printers (w/ and w/o Fax)
Answering Machines and Cordless Phones
NA
NA
NA
19 (1.6%)
5 (0.4%)
4 (0.4%)
44 (2.4%)
NA
NA
Cleaning/Maintenance
Rechargeable Tools
NA
2 (0.2%)
NA
Water Pumping and Purification
Well Water Pump
NA
6 (0.5%)
NA
Water Heating 99 (10.3%) 104 (9.1%) 108 (6.0%)
Other NA 170 (15.1%) 589 (32.5%)
aIncludes electric range top, electric oven, microwave oven, electric toaster oven, and coffee makers. Scope of AEO projection is unclear.
NA = Data are not readily available.
Sources: Energy Information Administration Residential Energy Consumption Surveys, 1993 and 2001.
Annual Energy Outlook 2005, Appendix A.

Residential Sector
3-5
3.2 Cooking Trends
Because of factors such as increasingly busy lifestyles, dual-income families, single-parent families, and in some cases better economic conditions, more people are eating out, purchasing prepared foods from the grocery store, or buying take-out meals. There is a definite trend toward convenience of meal preparation.
A take-out meal, whether it is delivered or picked up, probably represents the ultimate in ease of preparation for an eat-at-home meal. During the end of the 1990s and the year 2000, take-out meals experienced peak popularity. Take-out sales doubled from approximately $50 billion in 1988 to $100 billion in 1998. In addition, the annual number of take-out meals purchased per person rose by more than 4% between 1998 and 2000.5
Figure 3-1 compares the number of hot meals cooked in the home during the years of 1993 and 2001. The data show that fewer households cooked one or more hot meals per day in 2001 than in 1993; in addition, more households cooked a few meals or less per week in 2001 than in 1993.
However, recent years have shown that the frequency of take-out meals has started to fall off. For example, there were 118 take-out meals per person in 2002 compared with 121 in 2000 – a 2.5% decline.6 Convenient foods, especially one-dish meals that can be eaten on the run, continue to be the trend due to time pressures, long commutes, and multi-schedule households. However, the downturn of the economy, coupled with higher gasoline costs and increasing restaurant prices, has shifted the focus to food products that are simple to prepare at home, such as frozen foods and prepackaged meals.
In 2002, 76% of meals were prepared in the home.7 “From scratch” cooking has been declining steadily for years and the popularity of single-dish meals and semi-prepared meals continues to rise. Frozen foods have become more popular as food processors have tailored dinners and entrees for the time-starved consumer. More than one-quarter of the main dishes served were of the ready-to-eat/frozen category in 2002.8 In 2002, complete frozen dinners experienced a 9.7% gain in sales, compared with 3.5% gain for all frozen foods combined.9 The popularity of microwave ovens (see Figure 3-2) has been a major boost for frozen food sales. The consumer can remove a dinner from the freezer, heat it in the microwave oven, and have a meal on the
5 Food Service, Crest Information Services, NPD Group, Rosemont, Ill: 2000.
6 17th Annual National Eating Trends Report, NPD Group, Port Washington, NY: 2003.
7 Sloan, A. E., “What, When, and Where Americans Eat: 2003,” Food Technology, 57(8), 2003.
8 17th Annual National Eating Trends Report.
9 Sloan, A. E.

Residential Sector
3-6
table minutes after entering the kitchen. Currently, more than 90 million homes in the U.S. have microwave ovens, and the number of homes with more than one microwave oven is growing.10
35.9
44.3
15.9
3.8
32.1
40.5
20.3
7.1
0
5
10
15
20
25
30
35
40
45
50
Two or More perDay
One per Day A Few Mealsper Week
Once a Week orLess
Number of Hot Meals Cooked in the Home
Perc
ent o
f Hou
seho
lds
1993 2001
Source: Energy Information Administration Residential Energy Consumption Surveys, 1993 and 2001.
Figure 3-1 Number of Hot Meals Cooked in the Home for All U.S. Households, 1993 and 2001
10 Association of Home Appliance Manufacturers (AHAM), www.aham.org.

Residential Sector
3-7
3.3 Fax/Photocopier Trends
Table 3-2 tabulates trends in households having fax and photocopier machines or fax and photocopier features on their PC printers between 1993 and 2001. In 1993, 3.0% of housing units had fax capability compared with 22.1% in 2001 – a more than 7-fold increase. Similarly, the number of housing units with photocopier capability rose from 1.6% in 1993 to 18.7% in 2001 – which is nearly a 12-fold increase. Much of the increase is attributable to the market penetration of PC printers with fax and photocopier features.
Table 3-2 U.S. Housing Units Using Fax and Photocopier Machines
1993 1997 2001 Number
(millions) Percent Number
(millions) Percent Number
(millions) Percent Fax Machines—Total 2.9 3.0 NA NA 23.6 22.1
Separate 2.9 3.0 6.3 6.2 11.0 10.3 PC Printer Feature NA NA NA NA 12.6 11.8
Photocopier Machines—Total 1.5 1.6 NA NA 20.0 18.7
Separate 1.5 1.6 3.8 3.7 7.4 6.9 PC Printer Feature NA NA NA NA 12.6 11.8
PC Printer with Fax/Copier Features NA NA NA NA 12.6 11.8 Prior to the 2001, RECS respondents were not asked if their PC printer had fax/copier features. Such combination printer/fax/copier machines were generally not available in 1993.
Source: Energy Information Administration Residential Energy Consumption Surveys, 1993, 1997, and 2001.

Residential Sector
3-8
3.4 Appliance Trends
Figure 3-2 shows trends in major household appliances between 1978 and 2001. The data represent the percentage of households having the appliance for the given year. The increase in market penetration of microwave ovens has been considerable; in 1978, only 8% of households had microwave ovens, compared with 86% in 2001. Dishwashers have also become more prevalent. In 1978, a little over one-third of households had a dishwasher, while over one-half of households had one by 2001. The prevalence of clothes washers and freezers has not changed too drastically in the last 20 to 25 years. The market penetration of clothes washers has been growing slowly but steadily, increasing from 74 to 79% between 1978 and 2001. In contrast, the number of households with separate freezers has dropped gradually from 35 to 32% during the same period.
8
35
74
35
61
43
75
34
83
50
77
33
86
53
79
32
0
10
20
30
40
50
60
70
80
90
100
MicrowaveOven
Dishwasher Clothes Washer Freezer
Appliance
Perc
ent o
f Hou
seho
lds
1978 1987 1997 2001
Source: Energy Information Administration Residential Energy Consumption Surveys, 1978, 1987, 1997, and 2001.
Figure 3-2 Trends in Major Electrical Appliances (Percentage of Households Using Appliances), 1978-2001

Residential Sector
3-9
According to the Association of Home Appliance Manufacturers (AHAM), consumer trends for both major and small appliances indicate that users are purchasing appliances that save time, are easy to clean, have a stylish appearance, provide multiple functions, and help to promote healthy cooking and/or a healthy home environment.11 Many kitchen appliances are being introduced in other areas of the home beside the main kitchen, including nurseries, guest rooms, master suites, game rooms, bars, etc. Small, cordless electric appliances are also becoming more popular.12
11 Association of Home Appliance Manufacturers (AHAM), www.aham.org.
12 Ibid.

Residential Sector
3-10
3.5 Growth in the Use of Electric Clothes Dryers
Figure 3-3 shows trends in electric clothes dryers between 1978 and 2001. The data represent the percentage of households having the appliance for the given year. Between 1978 and 2001, the number of households with electric dryers grew from 45 to 57%.
45
5155
57
0
10
20
30
40
50
60
70
Electric Clothes Dryer
Appliance
Perc
ent o
f Hou
seho
lds
1978 1987 1997 2001
Source: Energy Information Administration Residential Energy Consumption Surveys, 1978, 1987, 1997, and 2001.
Figure 3-3 Trends in Electric Clothes Dryers (Percentage of Households Using Appliance), 1978-2001

Residential Sector
3-11
3.6 Refrigerator Trends
Figure 3-4 shows trends in refrigerator size and energy use between 1947 and 2001. For the last 40 years or so, virtually every home in the U.S. has had a refrigerator. Therefore, refrigerators have fully penetrated the residential sector. However, significant changes related to energy use have occurred during this period. For one, the average size of refrigerators has more than doubled from less than 10 cubic feet in 1947 to more than 20 cubic feet in 2001. Meanwhile, the efficiency of refrigerators has increased dramatically. The net result is that current refrigerators use about as much energy as those half the size did 45 to 50 years ago.
United States Refrigerator Use v. Time
0
200
400
600
800
1,000
1,200
1,400
1,600
1,800
2,000
1947 1952 1957 1962 1967 1972 1977 1982 1987 1992 1997 2002
Ave
rage
Ene
rgy
Use
per
Uni
t Sol
d (k
Wh/
yr)
0
5
10
15
20
25
Ref
riger
ator
vol
ume
(cub
ic fe
et)
Refrigerator Size (cubic ft)
Energy Use per Unit(KWH/Year)
Source: Arthur Rosenfeld presentation, April 5 2005. Original source: David Goldstein.
Figure 3-4 Trends in Refrigerator Size and Energy Use, 1947-2001

Residential Sector
3-12
3.7 Household Personal Computer Trends
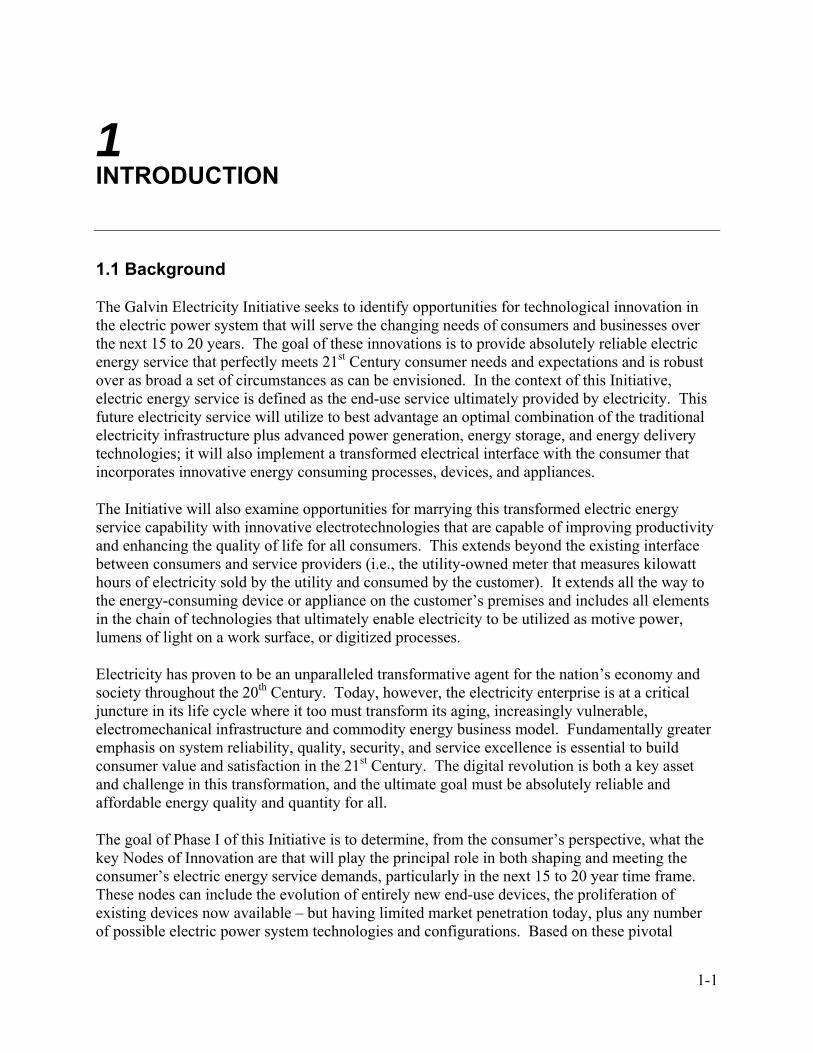
PCs represent an increasing share of energy consumption. For example, they accounted for roughly 1.6% of residential energy use in 2001, and are projected to represent 2.4% by 2025.13,14 Though the share of electricity consumption is expected to increase because of greater penetration and use, the efficiency of PCs is continually improving, offsetting energy consumption. In the last two decades, PC performance has skyrocketed from 6 MHz in the early 1980s to 2.5 GHz in the early 2000s, while per unit energy consumption has remained fairly constant. In addition, since the inception of the transistor more than 40 years ago, transistor size has decreased by 103, transistor power consumption has dropped by 104, and transistors now cost more than 108 less.15 Advanced power management technologies continue to improve energy efficiency, including recent efforts to reduce the “always on” power drain created by the ubiquitous small power module (“power wart”). One such advancement is the Instantly Available PC (IAPC) technology introduced by Intel Corporation in 1999. IAPC considerably reduces power draw in PCs during standby mode. Projections made in 2000 showed that the global consequences of IAPC on energy use could potentially be substantial, even relative to ENERGY STAR® efficiency standards (see Figure 3-5). Moreover, the greater use of lap top computers, which are inherently more efficient, will mitigate energy consumption increases; indeed, lap top computers consume 1/5 to 1/7 the power of desk tops.16
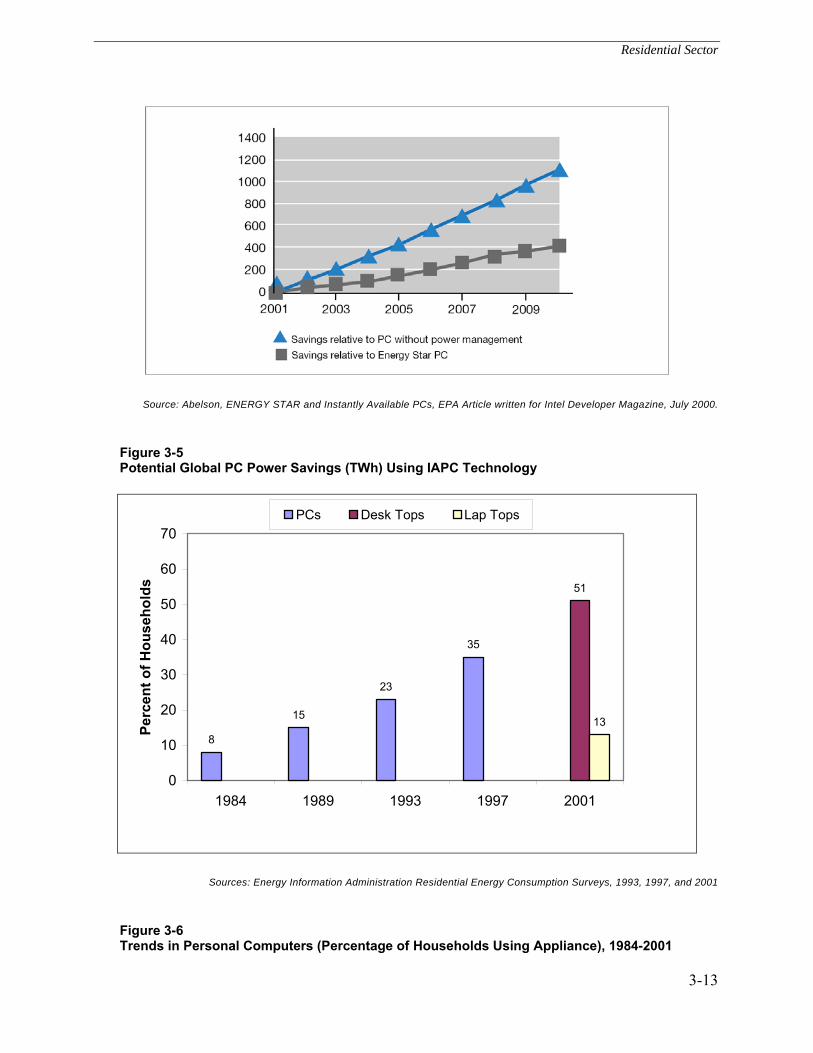
Figure 3-6 shows trends in household PCs between 1984 and 2001. The data for 2001 are divided into desk top PCs and lap top PCs. Growth has been steady since the introduction of the first PC in 1976. In 1986, 8% of households had a PC, while 51% had desktops and 13% had laptops in 2001. The EIA estimates that energy use by PCs increased by 9% between 2001 and 2005, and that it will increase by 29% between 2005 and 2010.
13 Energy Information Administration, Residential Energy Consumption Survey, 2001.
14 Energy Information Administration, Annual Energy Outlook 2005, Appendix A.
15 PC Energy Efficiency Trends and Technology, Intel Corporation, 2002. 251964-001.
16 Ibid.
Residential Sector
3-13
Source: Abelson, ENERGY STAR and Instantly Available PCs, EPA Article written for Intel Developer Magazine, July 2000.
Figure 3-5 Potential Global PC Power Savings (TWh) Using IAPC Technology
8
15
23
35
51
13
0
10
20
30
40
50
60
70
1984 1989 1993 1997 2001
Perc
ent o
f Hou
seho
lds
PCs Desk Tops Lap Tops
Sources: Energy Information Administration Residential Energy Consumption Surveys, 1993, 1997, and 2001
Figure 3-6 Trends in Personal Computers (Percentage of Households Using Appliance), 1984-2001

Residential Sector
3-14
3.8 Air Conditioning Trends
The Air-Conditioning and Refrigeration Institute (ARI) is a trade association that represents North American manufacturers of central air conditioning and commercial refrigeration equipment. According to ARI statistics, factory shipments of central air conditioners and air-source heat pumps increased from 5.1 million units in 1995 to 7.4 million units in 2004, a 45% increase in 9 years. The last three years of activity are shown in Figure 3-7, which plots the combined monthly sales of unitary air conditioners and heat pumps between January 2003 and October 2005. Total yearly shipments rose by 9% between 2003 and 2004, and the year-to-date total for the period between January and October 2005 is 12% higher than the same 10-month period in 2004. Sales were particularly high in October 2005, during which shipments totaled 714 thousand units, a 73% increase relative to October 2004.
Source: Air-Conditioning and Refrigeration Institute, Statistical Releases, October 2005.
Figure 3-7 Combined Shipments of Unitary Air Conditioners and Heat Pumps, January 2003 - October 2005
Table 3-3 also shows the growth in air conditioning equipment between 1978 and 2001. The data include electricity consumption for air conditioning equipment, the number of households with central air conditioning units, and the number of households with room air conditioning units. Though the number of households with room air conditioning units remained fairly constant between 1978 and 2001 at roughly one-quarter million, the number of households with central air conditioning units increased steadily from 17.6 million to 57.5 million during this period, a more than three-fold increase.

Residential Sector
3-15
Table 3-3 Trends in Air Conditioning Energy Use and Penetration, 1978-2001
Survey Year
Household Electricity Consumption for Air
Conditioning (Quadrillion Btu)
Number of Households with
Central Air Conditioning (million)
Number of Households with
Room Air Conditioning (million)
1978 0.31 17.6 25.1 1980 0.32 22.2 24.5 1981 0.33 22.4 26.0 1982 0.30 23.4 25.3 1984 0.32 25.7 25.8 1987 0.44 30.7 26.9 1990 0.48 36.6 27.1 1993 0.46 42.1 24.1 1997 0.42 47.8 25.8 2001 0.62 57.5 23.3
Source: Energy Information Administration Residential Energy Consumption Surveys, 1978-2001.
Overall electricity use by air conditioning has also increased due to the greater penetration of central units in homes. However, growth in electricity use has been tempered by efficiency gains in air conditioning systems. New Federal requirements will continue to improve air conditioning efficiency. The cooling performance of residential air conditioning units is measured in terms of a Seasonal Energy Efficiency Ratio (SEER), which describes the ratio of cooling capacity to electrical power input. Typical values are 10.0 to 14.5 and higher for the most efficient systems. The Federal standards set in 1992 require a minimum SEER of 10.0 for residential-scale units. New standards that take effect in 2006 require a minimum SEER of 13.0. Because of the efficiency gains that will come about with the new requirement, the EIA projects that energy consumption in air conditioning will only increase by 1.1% between 2001 and 2010. That is, efficiency gains will almost completely offset increased penetration of air conditioning equipment during that period.
3.9 Lighting Trends
Lighting accounts for a significant portion of residential electricity use, and its share of total electricity use is expected to increase. In 2001, lighting accounted for 101 billion kWh, which was 8.8% of total residential electricity use. The EIA estimates that between 2001 and 2005, lighting electricity use increased by 8%. In addition, EIA projections show that by 2025 lighting will account for 331 billion kWh, which will represent 18.3% of total residential electricity use

Residential Sector
3-16
that year. Therefore, its share of residential electricity use is expected to more than double from 8.8% in 2001 to 18.3% in 2025.

4-1
4 COMMERCIAL SECTOR
This chapter presents trend information related to electricity use, lighting, space conditioning, and the penetration of computers in the commercial sector. The paragraphs below summarize the trends and their significance to the perfect electric energy service system, and Sections 4.1 to 4.4 describe the trends in more detail.
• Electricity use: Total electricity use by the commercial sector grew by 19% between 1992 and 1999, an average of 2.7% per year. The EIA expects electricity use to more than double between 1999 and 2025. The area experiencing the most growth is office equipment. Lighting and space conditioning (including heating, cooling, and ventilation) should also continue to account for significant shares of commercial electricity use. In general, efficiency gains in equipment used for major end-uses such as for space heating, space cooling, water heating, and lighting will moderate electricity growth in these areas. On the other hand, greater demand for electricity by office equipment and increased penetration of new electrotechnologies, such as for telecommunications and medical imaging systems, will offset efficiency gains. Changes in how electricity is used in these end-use areas will have a direct effect on the future electric energy service system. Efforts to improve efficiency while simultaneously meeting consumer needs will be paramount.
• Lighting: One of the most notable trends in commercial lighting is the improvement in lighting system efficiency. Commercial lighting designs are also moving toward increasingly integrated systems that implement advanced controls for changing the lighting output to meet consumer needs and/or optimize efficiency. The percentages of floorspace lit by incandescent and standard fluorescent lamps remained relatively constant between 1992 and 2003, while the penetration of compact fluorescent, high intensity discharge, and halogen lamps has gradually increased. Since lighting is such an important and significant user of electricity (accounting for roughly one-quarter of commercial electricity use), technological improvements in commercial lighting have the potential to impact the perfect electric energy service system greatly.
• Space conditioning: Though the volume of commercial space that is mechanical conditioned is on the rise, corresponding increases in electricity consumption have been tempered by efficiency improvements in space conditioning systems. Improvements in the efficiency of space cooling systems have the largest impact on electricity use since they account for the majority of electricity use in the commercial sector. Much of the progress in space cooling efficiency is due to Federal standards that dictate the minimum efficiency of new air conditioning systems. Innovations in technologies for this end-use area have the potential to contribute significantly to perfection in the electric energy service system.
• Computers: Computers are becoming increasingly prevalent in commercial buildings. Between 1992 and 1999, the average number of computers per employee in commercial

Commercial Sector
4-2
buildings increased from about 0.4 to 0.7. Computer technology is also advancing rapidly. In 1971, Intel co-founder Gordon Moore made a prediction that the number of transistors on a chip would double about every 2 years. So far, this prediction has held true. The increase in transistor densities combined with an increase in microprocessor speed has yielded a doubling of processing power every 1.5 years. The first microprocessor had about 2,200 transistors embedded on a single chip. Today we are approaching a billion transistors, which is about a million times more complex. If this trend holds true for another 10 years, we will see processors that are 64-times more powerful than the ones available today. Innovations in computer technology will play an essential role in perfecting the electric energy service system.
4.1 Electricity Use Trends
Table 4-1 summarizes past, current, and projected electricity use by consumer technology application area for the commercial sector. Between 1992 and 1999, total electricity use by the commercial sector grew by 19%, or an average of 2.7% per year. The EIA expects electricity use to more than double between 1999 and 2025, from a value of 3,098 trillion Btu in 1999 to a projected value of 7,120 trillion Btu in 2025. This is equivalent to an average annual growth rate of 5.0%.
The area that experienced the most growth in electricity use between 1992 and 1999 is office equipment. In 1992, office equipment accounted by 164 trillion Btu, or 6.3% of total commercial electricity use. In 1999, electricity use by office equipment grew to 555 trillion Btu, or 17.9% of total commercial electricity use. The EIA estimates that electricity use by office equipment will more than double by 2025 to 1,230 trillion Btu, but it will continue to represent a share of total electricity use (17.3%) that is comparable to the 1999 value.
Lighting will also account for a significant share of electricity use in the future, much like it has in the past. In 1992, lighting represented 27.7%; in 1999, it represented 23.1%; and in 2025 it is expected to represent 21.4%.
Space conditioning (including heating, cooling, and ventilation) should also continue to account for a significant share of commercial electricity use. Space conditioning represented roughly 40% of total electricity use in 1992 and 1999. However, values from the EIA’s Annual Energy Outlook 2005 appear to be low, showing that space conditioning will account for only about 13% in 2025. The discrepancy is likely due to differences in how the data are defined between the EIA’s actual values and the predicted values. That is, note the large percentage of electricity use in the “other” category for the projected values (42%) relative to the actual values (9-13%). Perhaps some of the projected space conditioning use is wrapped up in the “other” area.
In general, efficiency gains in equipment used for major end-uses such as for space heating, space cooling, water heating, and lighting will moderate electricity growth in these areas. On the other hand, greater electricity demand by office equipment and increased penetration of new electrotechnologies, such as for telecommunications and medical imaging systems will offset efficiency gains.

Commercial Sector
4-3
Table 4-1 Electricity Use Trends by Consumer Technology Application Area – U.S. Commercial Sector
U.S. Commercial Sector Electricity Use [trillion Btu]
Consumer Technology Application Area
1992 Actual Electricity Use
(% of Total)
1999 Actual Electricity Use
(% of Total)
2025 Projected Delivered Elec. Use
(% of Total)
Total Commercial Electricity Use
2,609 (100%) 3,098 (100%) 7,120 (100%)
Lighting 723 (27.7%) 716 (23.1%) 1,520 (21.4%)
Space Heating 162 (6.2%) 155 (5.0%) 160 (2.3%)
Space Cooling 574 (22.0%) 793 (25.6%) 540 (7.6%)
Ventilation 316 (12.1%) 226 (7.3%) 200 (2.8%)
Cooking 37 (1.4%) 65 (2.1%) 30 (0.4%)
Refrigeration 264 (10.1%) 266 (8.6%) 280 (3.9%)
Office Equipment
PC
Non-PC
164 (6.3%)
NA
NA
555 (17.9%)
NA
NA
1,230 (17.3%)
360 (5.1%)
870(12.2%)
Water Heating 37 (1.4%) 37 (1.2%) 160 (2.3%)
Other 332 (12.8%) 285 (9.2%) 3000 (42.0%)
Sources: Energy Information Administration Commercial Building Energy Consumption Surveys, 1992 and 1999. Annual Energy
Outlook 2005, Appendix A

Commercial Sector
4-4
4.2 Lighting Trends
Improvement in lighting system efficiency is one of the most notable trends in commercial lighting. One example of this trend is illustrated in the transition from T12 (1.5-inch diameter) fluorescent lamps with magnetic ballasts to T8 (1-inch diameter) fluorescent lamps with electronic ballasts. This transition began to occur in the late 1970s and early 1980s. Now T8 electronic ballast systems are the standard for new construction and retrofits. The efficiency improvement, depending on the fixture is roughly 20 to 40% or even more. For example, a 2-lamp F34T12 fixture (i.e., a fixture with two 1.5-inch diameter, 34 W lamps) with standard magnetic ballast requires 82 W, while a 2-lamp F32T8 fixture (i.e., a fixture with two 1-inch diameter, 32 W lamps) with electronic ballast requires only 59 W, which is an electricity savings of 28%. The savings is attributable to the lower wattage lamps as well as the considerably more efficient ballast. Next generation T5 (5/8-inch diameter) fluorescent lamps continue to improve lighting efficiency and can replace conventional lamps is certain applications, such as indirect lighting. Another example of an efficiency improvement is the gradual replacement of incandescent lamps with compact fluorescent lamps (CFLs) for task lighting. Though incandescent lamps are still used to a large extent, CFLs offer energy savings of roughly 75%.
Commercial lighting designs are also moving toward increasingly integrated systems, such as greater use of controls. Advanced lighting controls can continuously change the lighting output to meet consumer needs. Lighting in businesses can be fully automated. The most common lighting control features today are on/off and dimming capabilities. Daylight sensors adjust artificial lighting as dictated by the availability of natural daylighting, while occupancy sensors turn lights on and off based on room occupancy. Emerging lighting systems facilitate biological adjustments to night work and shift work, thereby improving efficiency, productivity, and safety in businesses and industries that must operate continuously (24/7) or at night. Lighting systems can also be integrated into whole-building automation systems. Such systems are capable of controlling lighting as well as space conditioning equipment, security systems, etc.
Table 4-2 shows trends in the types of lighting systems used to illuminate commercial building floorspace between 1992 and 2003. The data are from the last four Commercial Buildings Energy Consumption Surveys conducted by the EIA. While the percentages of floorspace lit by incandescent and standard fluorescent lamps have remained relatively constant during this period, the penetration of compact fluorescent, high intensity discharge, and halogen lamps has gradually increased. The largest increases have been for compact fluorescent lamps (increase of 31 percentage points between 1992 and 2003), and halogen lamps (increase of 27 percentage points or more between 1992 and 2003).

Commercial Sector
4-5
Table 4-2 Percentage of Floorspace Lit by Type of Lighting Equipment – U.S. Commercial Sector
Lighting Equipment Type (more than one may apply)
1992 1995 1999 2003
Incandescent 60% 63% 59% 62%
Standard Fluorescent 95% 96% 94% 96%
Compact Fluorescent 13% 25% 32% 44%
High Intensity Discharge 27% 29% 30% 33%
Halogen Any other: 2% 17% 28% 29%
Sources: Energy Information Administration Commercial Building Energy Consumption Surveys,
1992, 1995, 1999, and 2003
4.3 Space Conditioning Trends
Great strides have been made in the last few decades to improve the efficiency of space conditioning equipment in the commercial sector. Improvements in the efficiency of space cooling systems have the largest impact on electricity use since they account for the majority of electricity use in the commercial sector. Much of the progress in space cooling efficiency is due to Federal standards that dictate the minimum efficiency of new air conditioning systems. Though the volume of commercial space that is mechanical cooled is on the rise, corresponding increases in electricity consumption have been tempered by efficiency improvements in air conditioning systems.
Efficiency standards for commercial space cooling equipment are becoming more stringent. The efficiency for commercial-scale systems is rated by one or more of three parameters: the seasonal energy efficiency ratio (SEER), the energy efficiency ratio (EER), and the integrated part-load value (IPLV). The SEER is for units rated at less than 65,000 Btu per hour and is the ratio of the total annual cooling produced per annual electrical energy input in Watt-hours. The Federal standards set in 1992 require a minimum SEER of 10.0. New standards that will take effect in 2006 require a minimum SEER of 13.0. The EER is the ratio of cooling capacity, expressed in BTU/hour (kilojoules/hour) to the power input required in Watts. The IPLV is used for commercial loads on units rated at more than 65,000 Btu per hour.
Table 4-3 lists the minimum Federal standards for larger-scale units (>65,000 Btu/hour) as of October 29, 2001. Manufacturers sell systems with a broad range of efficiencies. For example, in the 65,000 to 135,000 Btu/hour capacity range, it is possible to buy units with an EER as high as 12.5, even though the current Federal standard is 10.3.17 Units with high EERs are typically 17 Smith, C. B., and K. E. Parmenter, “Electrical Energy Management in Buildings,” in CRC Handbook of Energy Conservation and Renewable Energy, edited by F. Kreith and D. Y. Goswami, in progress.

Commercial Sector
4-6
more expensive, as the greater efficiency is achieved with larger heat exchange surface, more efficient motors, and so on.
One of the most efficient space conditioning devices is the heat pump. Heat pumps can also be used for water heating and in integrated systems that combine water heating and space conditioning. The heating performance of a heat pump is measured by the Heating Seasonal Performance Factor (HSPF), which is equal to the number BTUs of heat added per Watt-hour of electricity input. HSPF values for commercially available heat pumps are 6.8 to 9.0 and higher for the most efficient systems. The cooling performance of heat pumps is measured with the SEER value (as is used for air conditioners). Values of 10.0 to 14.5 and higher are typical for the most efficient systems. New Federal standards that will take effect in 2006 will raise the HSPF for heat pumps from the 1992 minimum value of 6.8 to a new minimum value of 7.8. In addition, the minimum SEER values will be increased from 10.0 to 13.0 (same as for air conditioners). Many existing older units have SEERs of 6 to 7, or roughly half the new minimum requirement. Therefore, substantial efficiency improvements are possible by replacing older equipment.
Table 4-3 Standards for Commercial-Scale Air Conditioning Systems, 2001
2001 Minimum Federal Standard
Equipment Size (Btu/hour) EER IPLV
65,000 to <135,000 10.3
135,000 to <240,000 9.7
240,000 to <760,000 9.5 9.7
760,000 and larger 9.2 9.4

Commercial Sector
4-7
Table 4-4 and Table 4-5, respectively, show trends in the types of heating and cooling systems used to condition commercial building floorspace between 1992 and 2003. The data are from the last four Commercial Buildings Energy Consumption Surveys conducted by the EIA. As can be seen in Table 4-4, the percentage of floorspace heated with individual space heaters steadily decreased between 1992 and 2003 (a total drop of 15 percentage points). Similarly, Table 4-5 shows that the percentage of floorspace cooled with individual air conditioners decreased by 10 percentage points during the same period. Besides these two downward trends, there are no obvious trends in other types of heating or cooling equipment. For the most part, the percentages of floorspace heated or cooled by a particular type of equipment fluctuated up or down by a few percentage points between the period evaluated.
Table 4-4 Percentage of Floorspace Heated by Type of Heating Equipment – U.S. Commercial Sector
Heating Equipment Type (more than one may apply)
1992 1995 1999 2003
Heat Pumps 13% 11% 14% 15%
Furnaces 27% 27% 23% 33%
Individual Space Heaters 36% 31% 28% 21%
District Heating 8% 11% 9% 9%
Boilers 33% 31% 32% 34%
Packaged Heating Units 26% 31% 42% 30%
Other 1% 12% 7% 5%
Sources: Energy Information Administration Commercial Building Energy Consumption Surveys,
1992, 1995, 1999, and 2003

Commercial Sector
4-8
Table 4-5 Percentage of Floorspace Cooled by Type of Cooling Equipment – U.S. Commercial Sector
Cooling Equipment Type (more than one may apply)
1992 1995 1999 2003
Residential-Type Central Air Conditioners
16% 19% 14% 19%
Heat Pumps 15% 14% 16% 16%
Individual Air Conditioners
32% 25% 24% 22%
District Chilled Water 4% 5% 5% 5%
Central Chillers 23% 22% 22% 21%
Packaged Air Conditioning Units
49% 53% 62% 52%
Swamp Coolers 4% 5% 4% 3%
Other <1% 2% 2% 2%
Sources: Energy Information Administration Commercial Building Energy Consumption Surveys,
1992, 1995, 1999, and 2003
4.4 Computer Trends
Computers are becoming increasingly prevalent in commercial buildings. Table 4-6 shows trends in the number of computers in commercial buildings between 1992 and 1999. Between 1992 and 1999, the average number of computers per employee increased from about 0.4 to 0.7 for all buildings. Educational buildings have consistently had the greatest ratio of computers to employees since many computer users are students (non-employees). The ratio for educational buildings rose from about 0.8 to 1.3 between 1992 and 1999. Food service buildings have consistently had the smallest ratio of computers to employees – ranging from about 0.07 in 1992 to 0.14 in 1999. Office buildings are second to educational building, with about 9.5 computers to every ten employees in 1999. Office buildings have also consistently had the greatest density of computers, increasing from 1,319 computers per million sq. ft. in 1992 to 2,295 computers per million sq. ft. in 1999. The upward trend in computer penetration is expected to increase well into the future.
Computer technology is also advancing rapidly. In 1971, Intel co-founder Gordon Moore made a prediction that the number of transistors on a chip would double about every 2 years. As illustrated in Figure 4-1, this prediction has held true up to now. The increase in transistor densities combined with an increase in microprocessor speed has yielded a doubling of processing power every 1.5 years. These factors have become known as Moore’s law. The first

Commercial Sector
4-9
microprocessor had about 2,200 transistors embedded on a single chip. Today we are approaching a billion transistors, which is about a million times more complex. A birthday card equipped with electronics to replay a simple song and costing less than a dollar to manufacture has more processing power than the first computer. If Moore’s law holds true for another 10 years, we will see processors that are 64-times more powerful than the ones available today.
Table 4-6 Change in the Number of Computers in Commercial Buildings, 1992-1999
Principal Building Activity
Computers (thousand)
Computers per Thousand Employees
Computers per Million Square Feet
1992 1995 1999 1992 1995 1999 1992 1995 1999
All Buildings 29,752 43,003 57,864 431 571 707 463 732 859
Assembly 845 1,763 1,654 167 258 526 102 262 377
Education 6,004 8,046 11,914 877 847 1,335 710 1,039 1,377
Food Sales 85 206 247 101 316 252 113 321 249
Food Service 146 276 557 65 118 138 98 204 301
Health Care 1,128 2,549 3,652 334 569 587 641 1,092 1,252
Lodging 651 1,296 1,884 322 472 800 225 358 417
Mercantile and Service 2,478 4,021 5,044 157 308 639 201 316 780
Office 15,451 21,173 27,642 599 797 954 1,319 2,021 2,295
Large (>50,000 sq. ft.) 9,746 13,341 17,437 674 833 963 1,566 2,380 2,459
Small (<=50,000 sq. ft.) 5,705 7,831 10,205 502 743 939 1,040 1,607 2,061
Warehouse and Storage 1,466 1,820 2,606 358 371 419 136 215 249
Other (incl. Vacant) 1,496 1,854 2,664 520 443 2,488 258 398 1,848
Source: Energy Information Administration Commercial Buildings Energy Consumption Surveys 1992, 1995, and 1999

Commercial Sector
4-10
Source: Gordon Moore, Intel, Trend Macrolytics
Figure 4-1 Number of Transistors per Integrated Circuit

5-1
5 INDUSTRIAL SECTOR
This chapter presents trend information related to electricity use, penetration of energy-efficient and electric-based technologies, and energy management activities in the industrial sector. The paragraphs below summarize the trends and their significance to the perfect electric energy service system, and Sections 5.1 to 5.3 describe the trends in more detail.
• Electricity use: Total electricity use in the industrial sector increased by 39% between 1991 and 2002. Changes in the relative shares of electricity use in individual technology application areas were minor. The EIA projects that use of purchased electricity in the industrial sector will increase by 1.3% per year from 2003 to 2025. The most significant electricity use areas are machine drive and process heating, followed by electro-chemical and HVAC systems. Innovations in these areas will affect electric energy use in the future. For example, continued advancements in electric-based process heating technologies may act to displace fossil-fuel-fired units further.
• Technology penetration: One measure of the practicality of a novel technology in an application is its change in penetration over time. Between 1994 and 1998, several technologies increased in prevalence by a factor of two or more, illustrating their importance to the industry. Other technologies have been newly introduced. The newer technologies should be watched closely in the future to see how they impact industrial end-uses. Novel industrial technologies are potentially of interest to the perfect electric energy service system not only because they may save energy (and cost) relative to conventional alternatives, but also because they may enable productivity and environmental improvements.
• Energy management activities: Over time, manufacturing industries have increasingly applied energy management activities to lower and manage energy consumption. These actions also have a positive effect on environmental emissions. In most cases, the percentage of establishments participating in an activity increased between 1994 and 2002. The only exceptions to this trend were for equipment rebates, the U.S. EPA Green Lights program, and other federally sponsored programs. If widely implemented, energy management activities can have a notable effect on the electric energy service system.
5.1 Electricity Use Trends
In its Annual Energy Outlook 2005, the EIA projects that use of purchased electricity in the industrial sector (including agriculture, mining, construction, and traditional manufacturing) will increase by 1.3% per year from 2003 to 2025.
Table 5-1 summarizes past and current electricity use by consumer technology application area for the manufacturing industries. (Note: the data are not for the complete industrial sector – they

Industrial Sector
5-2
are just for the manufacturing industries.) Projected data for individual areas were not available. Between 1991 and 2002, total electricity use increased by 39% from 695 million kWh to 966 million kWh. Changes in the relative shares of electricity use in individual technology application areas were minor. The share of electricity use accounted for by machine drive increased from about 50% to 53%, while electro-chemical’s share decreased from 12.8% to 8.9%. The most significant electricity use areas are machine drive and process heating, followed by electro-chemical and HVAC systems.
Table 5-1 Electricity Use Trends by Consumer Technology Application Area – U.S. Manufacturing Industries
U.S. Manufacturing Sector Electricity Use [million kWh]
Consumer Technology Application Area
1991 Actual Electricity Use (% of Total)
2002 Actual Electricity Use (% of Total)
Total Manufacturing Electricity Use
694,702 (100%) 966,231 (100%)
Lighting 47,309 (6.8%) 62,019 (6.4%)
HVAC (Including Space Heating, Space Cooling/Ventilation, and Indoor Air Quality)
56,165 (8.1%) 81,980 (8.5%)
On-Site Transportation 1,114 (0.2%) 1,277 (0.1%)
Energy Conversion/ Storage/Conditioning
Boilers for CHP/Cogeneration
NA
3,515 (0.4%)
Process Heating 68,853 (9.9%) 103,992 (10.8%)
Process Cooling and Refrigeration
36,330 (5.2%) 62,460 (6.5%)
Machine Drive 347,899 (50.1%) 511,864 (53.0%)
Electro-Chemical 89,005 (12.8%) 86,360 (8.9%)
Other 48,027 (6.9%) 52,764 (5.4%)
Source: Energy Information Administration Manufacturing Energy Consumption Surveys 1991, 1998, and 2002.
5.2 Technology Trends
Table 5-2 shows the number of establishments by usage of energy-saving technologies for specific industries in 1994 and 1998. The EIA was in the process of developing 2002 data at the time of this writing. Note that SIC codes were used in 1994, while NAICS codes were used in

Industrial Sector
5-3
1998. Many of the technologies listed in the table are potentially of interest to The Galvin Project not only because they may save energy (and cost) relative to conventional alternatives, but also because they may enable productivity and environmental improvements.
Between 1994 and 1998, several technologies increased in prevalence by a factor of almost two or more. These high-growth technologies are listed below by industry (an asterisk indicates technologies that increased by a factor of three or more):
• Food industry
Microwave drying
Gas-driven rotary engines and/or turbines
• Textile industry
Water-jet spinning *
Foam printing *
Foam finishing *
• Paper industry
Top-wire (hybrid) paper forming *
Higher nip pressures18
Multi-effect falling-film evaporators for black liquor evaporation/concentration *
Vapor recompression evaporation of black liquor *
Waste-heat recovery technologies in lime kilns *
• Chemical industry
Recycling materials as alternative feedstocks *
• Nonmetallic mineral products industry
Dry-suspension preheater kilns *
Dry-precalciner kilns *
• Primary metals industry
Direct reduction ironmaking – sponge iron produced directly from iron ore
Evaporative cooling of skid rails
Top gas pressure recovery from the blast furnace
Bottom tap vessels
Steel ladle metallurgy with reheat furnace
18 The nip is the point where two rolls on a paper machine come into contact.

Industrial Sector
5-4
The paper industry and the primary metals industry showed the most diversity and growth in technology penetration.
A few new technologies were added to the list in 1998:
• Food industry
Membrane hyperfiltration to separate water from food products
• Textile industry
Electric infrared yarn drying prior to weaving
• Paper industry
Extended delignification
Rapid displacement batch heating processes
High solids firing (black liquor)
Gas infrared radiant drying systems
• Nonmetallic mineral products industry
Oxy-fuel firing
• Primary metals
Oxy-fuel firing
The newer technologies listed above should be watched closely in the future.

Industrial Sector
5-5
Table 5-2 Number of U.S. Establishments by Usage of Energy-Saving Technologies for Specific Industries, 1994 and 1998
Energy-Saving Technologies Number of Establishments in
1994
Number of Establishments in
1998
COMMENTS
FOOD AND KINDRED PRODUCTS, SIC 20 (1994). Total surveyed 14,698.
FOOD, NAICS 311 (1998). Total surveyed 16,553. Approximately 15% did not know answer.
Infrared Heating 607 762 INCREASED
Microwave Drying 127 270 MORE THAN DOUBLED
Closed-Cycle Heat Pump Systems Used to Recover Heat
786 674 DECREASED
Open-Cycle Heat Pump System Used to Produce Steam
259 199 DECREASED
Gas-Driven Rotary Engines and/or Turbines
149 283 ALMOST DOUBLED
Membrane Separation 337 406 INCREASED
Irradiation W 32
Freeze Concentration 573 544 DECREASED
Membrane Hyperfiltration to Separate Water from Food Products
NA 255 NEW IN LIST

Industrial Sector
5-6
Energy-Saving Technologies Number of Establishments in
1994
Number of Establishments in
1998
COMMENTS
TEXTILE MILL PRODUCTS, SIC 22 (1994), Total surveyed 4,427.
TEXTILE MILLS, NAICS 313 (1998), Total surveyed 2,935. Approximately 10% did not know answer.
Open-End Spinning 461 387 DECREASE
Water-Jet Spinning 8 26 3-FOLD INCREASE
Projectile Spinning 243 245 LITTLE CHANGE
Wet-on-Wet Dyeing and Finishing 522 534 LITTLE CHANGE
Indirect Steam Heating of Dye 395 451 INCREASE
Dye Bath Reuse 251 265 LITTLE CHANGE
Foam Dyeing W 82
Foam Printing 4 59 MAJOR INCREASE
Foam Finishing 20 98 MAJOR INCREASE
Low-Add-On Finishing 238 230 LITTLE CHANGE
Electric Infrared Yarn Drying Prior to Weaving
NA 47 NEW IN LIST

Industrial Sector
5-7
Energy-Saving Technologies Number of Establishments in
1994
Number of Establishments in
1998
COMMENTS
PAPER AND ALLIED PRODUTS, SIC 26 (1994), Total surveyed 5,482.
PAPER, NAICS 322 (1998), Total surveyed 4,676. Approximately 13% did not know answer.
Continuous Digester 148 144 LITTLE CHANGE
Displacement Bleaching Process 149 49 MAJOR DECREASE
Top-Wire (Hybrid) Paper Forming 10 122 12-FOLD INCREASE
Extended Nip Press W 89
Higher Nip Pressures 71 148 DOUBLED
Extended Delignification NA 50 NEW IN LIST
Rapid Displacement Batch Heating Processes
NA 17 NEW IN LIST
Multi-Effect Falling-Film Evaporators for Black Liquor Evaporation/Concentration
26 128 5-FOLD INCREASE
Vapor Recompression Evaporation of Black Liquor
7 35 5-FOLD INCREASE
Waste-Heat Recovery Technologies in Lime Kilns
17 54 3-FOLD INCREASE
High Solids Firing (Black Liquor) NA 98 NEW IN LIST
Gas Infrared Radiant Drying Systems NA 197 NEW IN LIST

Industrial Sector
5-8
Energy-Saving Technologies Number of Establishments in
1994
Number of Establishments in
1998
COMMENTS
CHEMICAL AND ALLIED PRODUCTS, SIC 28 (1994), Total surveyed 9,565.
CHEMICALS, NAICS 325 (1998), Total surveyed 8,963. Approximately 16% did not know answer.
Replacing Electrically Heated Platens in Thermoset Molding Process (with gas fired central fluid system)
14 15 LITTLE CHANGE
Recycling Materials as Alternative Feedstocks
203 2,251 11-FOLD INCREASE
Using Biomass Materials as Alternative Feedstocks
141 77 DECREASE
Bioprocessing (incl. direct microbial, immobilized enzyme, fermentation)
141 211 1.5-FOLD INCREASE
Innovative Catalytic Processing 73 119 INCREASE
Separations Processing 647 716 INCREASE

Industrial Sector
5-9
Energy-Saving Technologies Number of Establishments in
1994
Number of Establishments in
1998
COMMENTS
STONE, CLAY AND GLASS PRODUCTS, SIC 32 (1994), Total surveyed 11,866.
NONMETALLIC MINERAL PRODUCTS, NAICS 327 (1998), Total surveyed 11,333. Approximately 18% did not know answer.
Oxygen-Enriched Combustion Air 179 310 INCREASE
Oxy-fuel firing NA 164 NEW IN LIST
Advanced Glass Refiner 48 67 INCREASE
High-efficiency Classifiers in Closed-Circuit Grinding Plants
112 179 INCREASE
Improved Grinding Media/Linings, Wear-Resistant Materials, Classifying Liners
368 588 INCREASE
Waste Heat Drying 296 450 INCREASE
Dry-Suspension Preheater Kilns 104 450 4-FOLD INCREASE
Dry-Precalciner Kilns 89 280 3-FOLD INCREASE
Kiln Combustion System Improvements
298 390 INCREASE
Controlled Particle Size Cement 470 222 DECREASE

Industrial Sector
5-10
Energy-Saving Technologies Number of Establishments in
1994
Number of Establishments in
1998
COMMENTS
BLAST FURNACEC AND STEEL MILLS, SIC 3312 (1994), Total surveyed 284.
PRIMARY METALS – IRON AND STEEL, NAICS 331111 (1998), Total surveyed 272. Approximately 12% did not know answer.
Dry Quenching During the Coking Process
W 4
External Desulphurization of the Charge for Ironmaking
14 10 DECREASE
Hydrocarbon Injection to Maintain Blast Furnace Temperatures
28 28 NO CHANGE
Direct Reduction Ironmaking – Sponge Iron Produced Directly from Iron Ore
0 5 INCREASE
Continuous Casting 115 117 LITTLE CHANGE
Thin Slab/Strip Casting W 11
Waste Heat Boilers/Heat Exchangers in Combination with Reheat Furnace
46 60 INCREASE
Evaporative Cooling of Skid Rails 6 16 MORE THAN DOUBLED
Electric Induction Reheat Furnaces 31 33 LITTLE CHANGE
Hot Charging –Moving Steel Directly from the Caster to the Reheat Furnace
66 66 NO CHANGE
Direct Rolling Required No Reheating 22 3 MAJOR DECREASE
Plasmasmelt Smelting of Partially Reduced Iron Powder with Pulverized Coal
0 0 OPPORTUNITY?
Cold Bonding Pelletizing Technique 0 0 OPPORTUNITY?
Preheating Combustion Air 83 92 INCREASE
Preheating Raw Material 25 21 LITTLE CHANGE
Top Gas Pressure Recovery from the Blast Furnace
11 21 DOUBLED
Slab Heat Recovery 6 10 INCREASE
Continuous Annealing 41 44 LITTLE CHANGE
Continuous Cold Rolling 20 26 INCREASE
Bottom Tap Vessels 29 74 DOUBLED
Injection Steelmaking 12 20 INCREASE

Industrial Sector
5-11
Energy-Saving Technologies Number of Establishments in
1994
Number of Establishments in
1998
COMMENTS
Electroslag or Vacuum Arc Remelting 15 26 ALMOST DOUBLED
Oxygen or Coal Injection to Blast Furnace
50 49 LITTLE CHANGE
Steel Ladle Metallurgy with Reheat Furnace
57 104 ALMOST DOUBLED
Oxy-Fuel Firing NA 83 NEW IN LIST
W=Withheld to avoid disclosing data for individual establishments. NA=Not available.
Source: Energy Information Administration Manufacturing Energy Consumption Surveys, 1994 and 1998.
5.3 Trends in Energy Management Activities
Over time, manufacturing industries have increasingly applied energy management activities to lower and manage energy consumption. These actions also have a positive effect on environmental emissions. Table 5-3 compares results of energy management activities in the manufacturing industries from the three most recent surveys conducted by the EIA. The table lists the number establishments that implemented specific activities and gives the corresponding percentage of all establishments surveyed. For most energy management activities listed, the percentage of establishments participating in the activity increased between 1994 and 2002. The only exceptions to this trend were for equipment rebates, the U.S. EPA Green Lights program, and other federally sponsored programs.
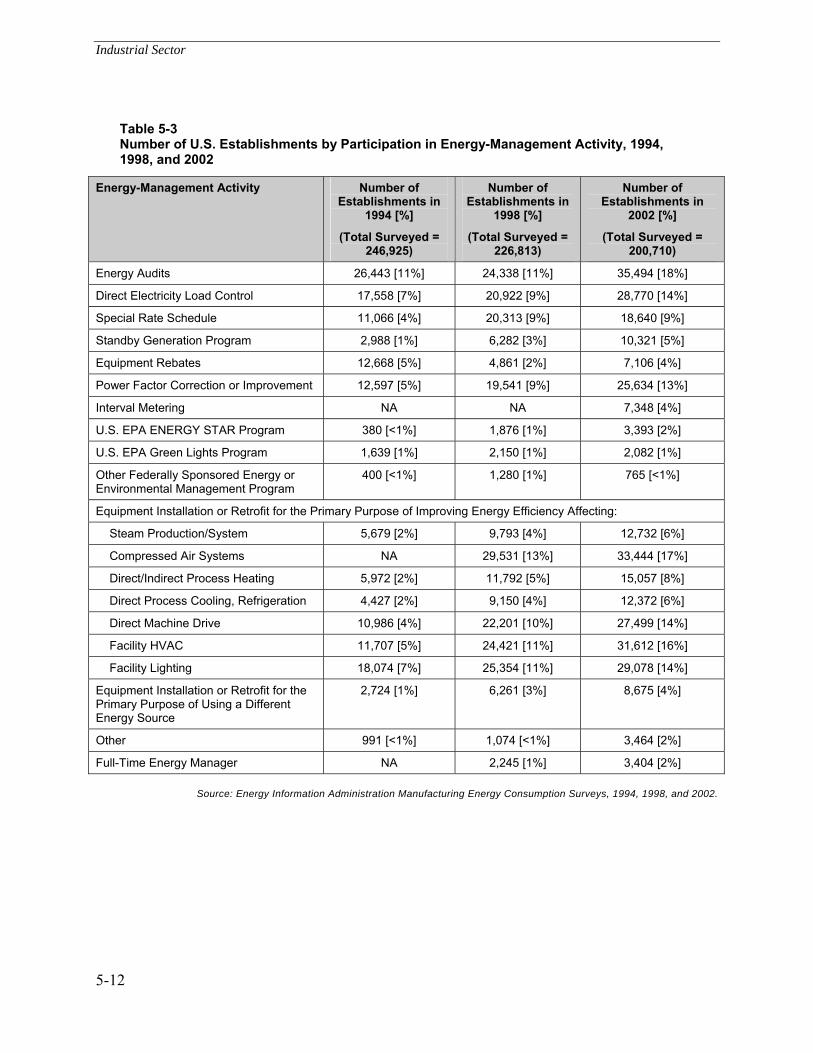
Industrial Sector
5-12
Table 5-3 Number of U.S. Establishments by Participation in Energy-Management Activity, 1994, 1998, and 2002
Energy-Management Activity Number of Establishments in
1994 [%]
(Total Surveyed = 246,925)
Number of Establishments in
1998 [%]
(Total Surveyed = 226,813)
Number of Establishments in
2002 [%]
(Total Surveyed = 200,710)
Energy Audits 26,443 [11%] 24,338 [11%] 35,494 [18%]
Direct Electricity Load Control 17,558 [7%] 20,922 [9%] 28,770 [14%]
Special Rate Schedule 11,066 [4%] 20,313 [9%] 18,640 [9%]
Standby Generation Program 2,988 [1%] 6,282 [3%] 10,321 [5%]
Equipment Rebates 12,668 [5%] 4,861 [2%] 7,106 [4%]
Power Factor Correction or Improvement 12,597 [5%] 19,541 [9%] 25,634 [13%]
Interval Metering NA NA 7,348 [4%]
U.S. EPA ENERGY STAR Program 380 [<1%] 1,876 [1%] 3,393 [2%]
U.S. EPA Green Lights Program 1,639 [1%] 2,150 [1%] 2,082 [1%]
Other Federally Sponsored Energy or Environmental Management Program
400 [<1%] 1,280 [1%] 765 [<1%]
Equipment Installation or Retrofit for the Primary Purpose of Improving Energy Efficiency Affecting:
Steam Production/System 5,679 [2%] 9,793 [4%] 12,732 [6%]
Compressed Air Systems NA 29,531 [13%] 33,444 [17%]
Direct/Indirect Process Heating 5,972 [2%] 11,792 [5%] 15,057 [8%]
Direct Process Cooling, Refrigeration 4,427 [2%] 9,150 [4%] 12,372 [6%]
Direct Machine Drive 10,986 [4%] 22,201 [10%] 27,499 [14%]
Facility HVAC 11,707 [5%] 24,421 [11%] 31,612 [16%]
Facility Lighting 18,074 [7%] 25,354 [11%] 29,078 [14%]
Equipment Installation or Retrofit for the Primary Purpose of Using a Different Energy Source
2,724 [1%] 6,261 [3%] 8,675 [4%]
Other 991 [<1%] 1,074 [<1%] 3,464 [2%]
Full-Time Energy Manager NA 2,245 [1%] 3,404 [2%]
Source: Energy Information Administration Manufacturing Energy Consumption Surveys, 1994, 1998, and 2002.

6-1
6 TRANSPORTATION SECTOR
This chapter presents trend information for several end-use areas within the transportation sector. The trends evaluated and overviews of the results are provided in the following paragraphs. The trends are discussed in detail in Sections 6.1 through 6.6.
• Energy: According to the EIA, the transportation sector of the U.S. accounted for roughly 28% of total energy consumption in 2004. Of the energy consumed by transportation, the vast majority is in the form of petroleum products. The transportation sector is comprised of various modes of transport, including motorcycles, passenger cars, light trucks and vans, heavy trucks, buses, boats, aircraft, intercity passenger trains, freight rail, light rail (e.g., trams and metros), and pipelines. Highway transport accounts for nearly two-thirds of transportation energy use, and much of this is attributable to personal vehicles. While fuel economy has been an important aspect of automobile choice in times of high gasoline prices, SUVs and pickup trucks, which generally have poorer gas-mileage than passenger cars, remain hot items on the buyers list despite record high gasoline prices. Nevertheless, some consumers are seeking out energy efficient alternatives such as hybrid electric vehicles (HEVs). Hybrid electric vehicles are of particular interest to this project because of their obvious connection to the electric service system.
• Fuel efficiency: Over the years, particularly in response to the oil embargos of the 1970s, strides have been made to improve the fuel efficiency of transport vehicles. Considerable attention has been placed on passenger cars and light trucks, since they are the largest energy end users in the transportation sector. However, the efficiency of other transportation modes has increased as well. Advancements in fuel efficiency benefit the environment and impact the overall energy system.
• Energy intensity: Many transport modes have experienced a decline in energy intensity since the early 1970s. This is because although the fuel efficiency has increased, vehicles are being operated with smaller loads. There is a great potential for increasing the energy intensity of transport vehicles, resulting in a significant influence on the overall energy system.
• Use of alternative fuels: There are many types of alternative fuels with potential applicability to the transportation sector, including ethanol, methanol, natural gas, biogas, liquefied petroleum gas (LPG), hydrogen, vegetable oil (biodiesel), P-series (blends of methyltetrahydrofuran, ethanol and hydrocarbons), and producer gas. Of these fuels, ethanol, methanol, natural gas, and LPG currently appear to have the most promise. For widespread application of any of these alternative fuels, access to refueling sites will have to be addressed. Development of alternative fuels will also benefit the electric energy service system, as alternative fuels offer a more environmentally benign solution relative to petroleum fuels for electricity generation.

Transportation Sector
6-2
• Electric drive vehicles: According to the Office of Transportation Technologies and the U.S. Department of Energy, electric-drive vehicles are capable of fuel efficiency improvements of 100 to 300%, and could achieve mass-market penetration in the next decade, depending on the specific technology. Potential barriers to their penetration include current battery technology limitations (e.g., storage capacity, lifetime, and cost) for battery-electric and hybrid electric vehicles, fuel storage considerations for fuel cell vehicles, and high incremental costs (greater than 10 or 20%) for all electric drive vehicles. Continuing advancements will improve electric drive vehicle performance, and the incremental costs should decrease.
• Air emissions: Smog and other localized externalities associated with transport vehicle emissions have been and continue to be the key drivers in implementing more stringent policies with respect to tolerable emission levels. This trend towards reducing pollution levels will likely continue in the coming 20 years and might become a key driver in the adoption of ultra-low emission technologies such as hydrogen and battery-powered vehicles.
6.1 Energy Use Trends
According to the EIA, the transportation sector of the U.S. consumed about 28 x 1015 quadrillion Btus of energy in 2004. This value corresponds to roughly 28% of total energy consumption. The transportation sector’s share of energy usage is second only to that of the industrial sector, which accounted for about 34% in 2004. Of the energy consumed by transportation, the vast majority is in the form of petroleum products.
The transportation sector is comprised of various modes of transport, including motorcycles, passenger cars, light trucks and vans, heavy trucks, buses, boats, aircraft, intercity passenger trains, freight rail, light rail (e.g., trams and metros), and pipelines. Of these transportation modes, motorcycles, passenger cars, light trucks, and vans are commonly used for personal transit. Heavy trucks, boats, aircraft, freight rail, and pipelines are used to transport freight. And, mass transit modes include buses, boats, aircraft, intercity passenger trains, and light rail.
Figure 6-1 shows how energy consumption is divided between the various transportation modes. Highway transportation in passenger cars and motorcycles consumed more than one-third of total energy, and travel in light trucks consumed an additional 26% during 2001. Combined, these two highway modes accounted for about 62% of total energy consumption in the U.S. transportation sector during 2001. Energy usage by heavy truck (19%), air transit (8%), and water transit (5%) followed. Freight transport by pipeline and rail comprised 3% and 2%, respectively. Mass transit by bus, Amtrak, and other public transit systems accounted for only about 1% of total consumption.

Transportation Sector
6-3
Heavy Truck19%
Air8%
Passenger Car and Motorcycle
36%
Light Truck26%
Water5%
Pipeline3%
Bus, Amtrak, and Public Transit
1%
Freight Rail2%
Source: U.S. Department of Transportation, Bureau of Transportation Statistics, National Transportation Statistics 2005, Table 4-6,
Washington, DC, USA: U.S. Government Printing Office.
Figure 6-1 Energy Consumption by Transportation Mode, 2001 (Total Energy Use = 25.51 x 10¹⁵ Btu)
Today there are 212 million vehicles on the road in the U.S. The U.S. road network is expansive and carries the majority of the transportation load. Figure 6-2 shows that the light trucks and passenger cars accounted for just over 85% of miles traveled in the U.S. in 2000. Light trucks include sport utility vehicles (SUVs) and pickup trucks. Estimated passenger-miles per person in the U.S. increased by 24% between 1990 and 2000. The average person in the U.S. traveled 17,000 miles in 2000. Sixty percent of the total annual miles traveled were for trip lengths of less than 40 miles.

Transportation Sector
6-4
Source: U.S. Bureau of Transportation Statistics – Transportation Statistics Annual Report 2003
Figure 6-2 Share of Passenger-Miles by Mode, 2000
Americans tend to purchase their automobiles based on appearance and driving comfort. While fuel economy has been an important aspect of automobile choice in times of high gasoline prices, SUVs and pickup trucks, which generally have poorer gas-mileage than passenger cars, remain hot items on the buyers list despite record high gasoline prices. Figure 6-3 shows that the proportion of SUVs in the U.S. personal vehicle mix has increased steadily since 1980, while the proportion of passenger cars has declined. Vans and pickup trucks have held steady. Attractive financing terms and safety records have supported this trend. This trend is in stark contrast to European and Asian countries, where small passenger vehicles and public transportation dominate the personal transportation market. Nevertheless, some consumers are seeking out energy efficient alternatives such as hybrid electric vehicles (HEVs). Hybrid electric vehicles are of particular interest to this project because of their obvious connection to the electric service system.

Transportation Sector
6-5
Source: U.S. Environmental Protection Agency
Figure 6-3 Historical Vehicle Mix in the U.S.
6.2 Fuel Efficiency Trends19
Over the years, particularly in response to the oil embargos of the 1970s, strides have been made to improve the fuel efficiency of transport vehicles. Considerable attention has been placed on passenger cars and light trucks, since they are the largest energy end users in the transportation sector. However, the efficiency of other transportation modes has increased as well. Figure 6-4 plots the fuel efficiency over time for passenger cars, light trucks (i.e., 2-axle 4-tire vehicles), single unit 2-axle 6-tire or more vehicles, combination trucks, and buses in the U.S. Data for aircraft and class I rail freight locomotives are plotted separately in Figure 6-5. As the figures show, smaller vehicles are capable of traveling more miles per gallon of fuel than heavier vehicles. For example, passenger cars currently travel an average of 21 to 22 miles per gallon, whereas buses travel about 6.7 miles per gallon. In addition, aircraft currently travel only about 0.23 miles per gallon during international travel, and locomotives travel only 0.13 miles per gallon. However, larger vehicles are capable of carrying a larger load than smaller vehicles. When load-carrying capability is considered, large mass transit vehicles are actually significantly
19 Efficient Use and Conservation of Energy in the Transportation Sector, Gellings, C. and K. E. Parmenter, 2002, in “Efficient Use and Conservation of Energy,” edited by C. Gellings, in Encyclopedia of Life Support Systems (EOLSS), EOLSS Publishers, Oxford, UK, http://www.eolss.net.
Pickup Truck

Transportation Sector
6-6
more fuel efficient per unit weight of load than, for example, passenger cars carrying only one person.
0
5
10
15
20
25
1955 1960 1965 1970 1975 1980 1985 1990 1995 2000
Fuel
Effi
cien
cy (m
iles
per g
allo
n) Passenger Car
Light Truck (2-Axle 4-Tire)
Single Unit 2-Axle 6-Tire (or more)
Combination
Bus
Source: U.S. Department of Transportation, Bureau of Transportation Statistics, National Transportation Statistics 2000, Tables 4-11,
4-12, 4-13, 4-14, and 4-15. Washington, DC, USA: U.S. Government Printing Office.
Figure 6-4 Fuel Efficiency for Road Transport Vehicles, 1960-1998

Transportation Sector
6-7
0
0.05
0.1
0.15
0.2
0.25
0.3
0.35
0.4
0.45
0.5
1955 1960 1965 1970 1975 1980 1985 1990 1995 2000 2005
Fuel
Effi
cien
cy (m
iles
per g
allo
n)
Aircraft (Domestic Operation)
Class I Rail Freight Locomotives
Aircraft (International O ti )
Source: U.S. Department of Transportation, Bureau of Transportation Statistics, National Transportation Statistics 2000, Tables 4-8
and 4-17. Washington, DC, USA: U.S. Government Printing Office.
Figure 6-5 Fuel Efficiency for Aircraft and Rail Freight Locomotives, 1960-1999
Figure 6-5 shows that the fuel efficiency of aircraft decreased between 1960 and the early 1970s. Upon initial investigation one might wonder why this is the case. However, what is not accounted for in the plots is the size of the aircraft and their loads. As mentioned earlier, a large vehicle, such as an aircraft, that can carry a big load is often more efficient per unit weight of load than a smaller vehicle with a lighter load. The dip in fuel efficiency for aircraft is therefore due in large part to an increased use of larger aircraft. Another factor not accounted for in Figure 6-4 or Figure 6-5 is the age of the vehicles. In general, newer vehicles of a given type will have higher fuel efficiencies than older vehicles of the same type. Therefore, it is important to emphasize that these figures show the average fuel efficiencies for all vehicles in operation during a given year, rather than the efficiencies of new vehicles in use that year.
In contrast, Figure 6-6 shows average new vehicle fuel efficiencies for passenger cars in the U.S. and the United Kingdom. The average new car used in the United Kingdom is, and has consistently been, considerably more efficient than that used in the U.S. Furthermore, imported cars driven in the U.S. are more efficient than domestic cars. Specifically, in 1999, new car fuel

Transportation Sector
6-8
efficiency in the United Kingdom averaged 38.5 miles per gallon, while in the U.S. domestic cars had an average efficiency of 28.2 miles per gallon and imported cars used 28.4 miles per gallon. On average, the cars of the United Kingdom travel 10 more miles per gallon! When the data in Figure 6-4 and Figure 6-6 are compared, it can be seen that the passenger car fuel efficiency is 21.4 miles per gallon when all passenger cars in operation are included (Figure 6-4) as opposed to 28.1 to 30.0 miles per gallon when just new vehicles are considered (Figure 6-6). This comparison further illustrates how overall fuel efficiency for a given year is a function of vehicle age.
0
5
10
15
20
25
30
35
40
45
1978 1980 1982 1984 1986 1988 1990 1992 1994 1996 1998 2000 2002
New
Pas
seng
er C
ar F
uel E
ffici
ency
(mile
s pe
r gal
lon) United Kingdom, average
United States, domestic
United States, imported
Sources: U.S. Department of Transportation, Bureau of Transportation Statistics. (2001). National Transportation Statistics 2000,
Table 4-23. Washington, DC, USA: U.S. Government Printing Office, and Department of the Environment, Transport and the
Regions, Transport Trends: Indices Data Tables. Table 4.4, www.transtat.dft.gov.uk/tables/2001/tt/contents/index/tttables.htm.
Figure 6-6 New Vehicle Fuel Efficiency for Passenger Cars, 1980-1999

Transportation Sector
6-9
6.3 Energy Intensity Trends20
Energy intensity – defined for the transportation sector as energy consumption per passenger (or load) per mile – is, perhaps, a more meaningful quantity to use when evaluating transport energy efficiency trends. Unlike simple fuel efficiency, energy intensity takes the number of passengers (or load) into account. Figure 6-7 is a plot of energy intensity over time for aircraft, 2-axle, 4-tire vehicles, passenger cars, transit motor buses, and Amtrak locomotives in the U.S. As the figure illustrates, the energy intensity of aircraft travel (in both domestic and international operation) has dropped dramatically since its peak around 1970. Current energy intensity values are not too far off from 2-axle 4-tire vehicles. This is due in large part to an increase in the number of seats per aircraft, and to an increase in load factor. Specifically, the number of seats per aircraft rose from 61 to 133 in domestic travel, and from 73 to 193 in international travel between the years of 1960 and 1999. In addition, the load factor increased from 59 to 70% in domestic operation, and from 62 to 74% for international operation. A comparison of Figure 6-7 with Figure 6-5 shows how fuel efficiency and energy intensity can give entirely different impressions upon first inspection. For the case of mass transit vehicles, such as aircraft, energy intensity is really the most meaningful indicator of energy use.
Passenger cars and 2-axle, 4-tire vehicles have also experienced a decline in energy intensity since the early 1970s, albeit the decline has been more moderate than for aircraft. This is because, although the fuel efficiency of cars and light trucks has increased at a higher rate, more cars are being operated with small passenger loads, resulting in an equalizing effect. Rises in energy intensity for transit motor buses and Amtrak (i.e., between 1995 and 1996) can also be attributed in part to decreased passenger loads. That is, though buses and Amtrak locomotives have the potential of being highly efficient transportation modes, they must be loaded more heavily to achieve minimum values of energy intensity.
In freight transport, energy intensity is defined as energy use per freight ton per mile. Figure 6-8 shows how the energy intensity of Class I railroad freight transport has decreased over the years in the U.S. Between 1960 and 1999, the energy intensity fell from 839 to 359 Btu per freight ton-mile. The decrease energy intensity over the years is due to higher loading per car as well as increased fuel efficiency. For example, each car was loaded with 63 tons of freight in 1999, compared with only 44 tons in 1960.
20 Efficient Use and Conservation of Energy in the Transportation Sector, Gellings, C. and K. E. Parmenter, 2002, in “Efficient Use and Conservation of Energy,” edited by C. Gellings, in Encyclopedia of Life Support Systems (EOLSS), EOLSS Publishers, Oxford, UK, http://www.eolss.net.

Transportation Sector
6-10
0
2000
4000
6000
8000
10000
12000
1955 1960 1965 1970 1975 1980 1985 1990 1995 2000
Ener
gy In
tens
ity (B
tu p
er p
asse
nger
-mile
)
Aircraft (international operation)
Aircraft (domestic operation)
2-Axle 4-Tire Vehicle
Amtrak
Passenger Car
Transit Motor Bus
Source: U.S. Department of Transportation, Bureau of Transportation Statistics, National Transportation Statistics 2000, Table 4-20.
Washington, DC, USA: U.S. Government Printing Office.
Figure 6-7 Energy Intensity for Passenger Travel, 1960-1998

Transportation Sector
6-11
Class I Railroad Freight Service
0
100
200
300
400
500
600
700
800
900
1955 1960 1965 1970 1975 1980 1985 1990 1995 2000 2005
Ener
gy In
tens
ity (B
tu p
er fr
eigh
t ton
-mile
)
Class I Railroad Freight Service
Source: U.S. Department of Transportation, Bureau of Transportation Statistics, National Transportation Statistics 2000, Table 4-25.
Washington, DC, USA: U.S. Government Printing Office.
Figure 6-8 Energy Intensity for Railroad Freight Transport, 1960-1999
6.4 Trends in the Use of Alternative Fuels21
The increased utilization of alternative fuels in transportation will help conserve natural petroleum reserves, thereby increasing the sustainability of transport energy use. There are many types of alternative fuels with potential applicability to the transportation sector, including ethanol, methanol, natural gas, biogas, liquefied petroleum gas (LPG), hydrogen, vegetable oil (biodiesel), P-series (blends of methyltetrahydrofuran, ethanol and hydrocarbons), and producer gas. Of these fuels, ethanol, methanol, natural gas, and LPG currently appear to have the most promise. For widespread application of any of these alternative fuels, access to refueling sites will have to be addressed.
21 Efficient Use and Conservation of Energy in the Transportation Sector, Gellings, C. and K. E. Parmenter, 2002, in “Efficient Use and Conservation of Energy,” edited by C. Gellings, in Encyclopedia of Life Support Systems (EOLSS), EOLSS Publishers, Oxford, UK, http://www.eolss.net.

Transportation Sector
6-12
Total fuel consumption for U.S. highway vehicles in 1999 was 159,172 x 106 gasoline-equivalent gallons. Of this, 341 x 106 gasoline-equivalent gallons (0.21%) were provided by alternative fuels, and 34,239 x 106 gasoline-equivalent gallons (21.5%) were provided by diesel fuel. The remainder of the fuel was in the form of gasoline (including gasohol and methyl-tertiary-butyl-ether). The 1999 share of fuel consumption provided by alternative fuels (0.21%) was up slightly from the 1992 value of 0.17%. Figure 6-9 shows a breakdown of fuel use by type of alternative fuel in 1999. LPG supplied the majority of alternative fuel energy for highway vehicles, representing 71% of total alternative energy use. CNG was the next more significant alternative energy source, supplying 25%. LNG and ethanol E85 supplied about 2 and 1% of alternative fuel energy, respectively. Other alternative fuels combined, including methanol M85, neat methanol, ethanol E95, and electricity, accounted for about 1% of total alternative fuel energy.
Other1%
Compressed Natural Gas
25%
Liquefied Petroleum Gases
71%
Ethanol (E85)1%
Liquefied Natural Gas 2%
Total Alternative Fuel Use = 341 x 106 gasoline-equivalent gallons.
Total Highway Fuel Use = 159,172 x 106 gasoline-equivalent gallons.
Source: U.S. Department of Transportation, Bureau of Transportation Statistics, National Transportation Statistics 2000, Table 4-10.
Washington, DC, USA: U.S. Government Printing Office.
Figure 6-9 Alternative Fuel Consumption for Highway Vehicles, 1999

Transportation Sector
6-13
6.5 Trends in Electric Drive Vehicles22
Electric drive vehicles constitute another transportation alternative. Three types of electric drive vehicles include battery-electric, hybrid electric, and fuel cell. According to the Office of Transportation Technologies and the U.S. Department of Energy, electric-drive vehicles are capable of fuel efficiency improvements of 100 to 300%, and could achieve mass-market penetration in the next decade, depending on the specific technology. Potential barriers to their penetration include current battery technology limitations (e.g., storage capacity, lifetime, and cost) for battery-electric and hybrid electric vehicles, fuel storage considerations for fuel cell vehicles, and high incremental costs (greater than 10 or 20%) for all electric drive vehicles. Continuing advancements will improve electric drive vehicle performance, and the incremental costs should decrease.
In the year 2000, the first hybrid electric vehicles entered the commercial market place. Since then various vendors have introduced such vehicles and today there are about 100,000 hybrid electric vehicles on the road. Sales numbers of hybrid vehicles between 2000 and 2004 have almost doubled every year, with the Toyota Prius accounting for more than 50% of all recent hybrid sales.
6.6 Air Emissions Trends
Intrinsically related to transportation energy use is the air pollution that transport vehicles generate. Indeed, transportation is responsible for a large share of worldwide air emissions. Pollutants emitted from transportation include sulfur dioxide, carbon monoxide, nitrogen oxide, volatile organic compounds, lead, and particulate matter (PM-10 and PM-2.5).
Smog and other localized externalities associated with transport vehicle emissions have been and continue to be the key drivers in implementing more stringent policies with respect to tolerable emission levels. This trend towards reducing pollution levels will likely continue in the coming 20 years and might become a key driver in the adoption of ultra-low emission technologies such as hydrogen and battery-powered vehicles. The present-day externalities from pollution include various types of health issues (such as asthma and allergies), diminished quality of life, reduced productivity, and other factors that are difficult to quantify.
Emissions from transport vehicles come from the combustion of fuel and fuel evaporation. The amount of emissions produced depends on the type of fuel used, fuel economy, engine technology, and exhaust post-treatment methods (e.g., catalytic converters). The major exhaust pollutants from a typical engine contain unburned hydrocarbons, nitrogen oxides, carbon monoxides, and carbon dioxides. Efforts by government and industry have greatly reduced emission levels from mobile sources since 1970. However, the increase in travel has offset much of the technical progress in controlling emission levels. The net result is a modest reduction in
22 Efficient Use and Conservation of Energy in the Transportation Sector, Gellings, C. and K. E. Parmenter, 2002, in “Efficient Use and Conservation of Energy,” edited by C. Gellings, in Encyclopedia of Life Support Systems (EOLSS), EOLSS Publishers, Oxford, UK, http://www.eolss.net.

Transportation Sector
6-14
each automotive pollutant except for lead for which aggregate emissions have dropped by more than 95%. Figure 6-10 shows annual nationwide emissions from mobile sources in the U.S. between 1970 and 1997. The seven principal pollutants defined by the EPA are shown.
Source: U.S. Environmental Protection Agency, http://www.epa.gov/otaq/transp/99indict.pdf
Figure 6-10 Emissions from Mobile Sources in the U.S.

7-1
7 TRENDS APPLICABLE TO MULTIPLE SECTORS
This chapter presents trend information applicable to multiple sectors. The trends evaluated and overviews of the results are presented in the paragraphs below. Sections 7.1 through 7.3 describe the trends in more detail.
• Indoor air quality: Awareness of the importance of good indoor air quality has been on the rise. This increased awareness of indoor air quality has been, in turn, a driver for indoor air quality technologies. A recent report developed by the Business Communications Company, Inc. states that the U.S. indoor air quality market was $5.6 billion in 2003, and is projected to grow to $9.4 billion by 2008. Innovative technologies for indoor air quality will contribute to the perfect electric energy service system by addressing consumer concerns. At the same time, increased penetration of electric-based air quality technologies will affect how electric energy is used in the future.
• Outdoor air quality: The air quality of the nation has increased significantly during the last 20 to 30 years due to standards set by the Clean Air Act and by national and local efforts. Aggregate emissions of the six principal air pollutants have decreased since 1970, while other factors such as population, energy consumption, vehicle miles traveled, and gross domestic product have increased during the same time period. Outdoor air quality is highly dependent on how energy is converted from one form to another and on how resulting emissions from energy conversion are controlled, whether the energy conversion is for industrial processes, transportation, electric power generation, or another application. Innovative methods to control outdoor air emissions will be a critical component of the perfect electric energy service system.
• Waste management: Significant progress has been made in reducing waste in the U.S. since the enactment of the Resource Conservation and Recovery Act (RCRA) in 1976. Since 1976, hazardous waste generation decreased from a value of roughly 300 million tons to about 40 million tons. In addition, efforts to recycle and reduce solid waste have prevented about 62 million tons per year of trash from being disposed of in landfills. These trends are likely to continue and will affect how waste is managed in the future. Waste management innovations, specifically methods that manage waste by using it to produce biofuels that can then be used for power generation, will be important for perfection in the future electric energy service system.

Trends Applicable to Multiple Sectors
7-2
7.1 Indoor Air Quality Trends
Due in large part to educational efforts by EPA, awareness of the importance of good indoor air quality has been on the rise. Increased awareness of indoor air quality has been, in turn, a driver for indoor air quality technologies.
EPA has developed a number of publications and informational resources on indoor air quality (see http://www.epa.gov/iaq/pubs/index.html), including a comprehensive “Tools for Schools” kit designed to inform school operators about the necessity of good indoor air quality for school-age children.
The greater awareness of potential indoor air quality problems combined with the introduction of numerous devices and services claiming to improve indoor air quality has created confusion among consumers regarding the effectiveness of these products and services. It is apparent that more research and performance data are needed to clarify and validate claims made by manufacturers and service personnel. In an attempt to address this problem, EPA highlighted the program needs for indoor environmental research in a March 2005 document:23
As good indoor air quality becomes more widely appreciated and desired by consumers, a host of products are being increasingly developed and marketed to solve or protect against indoor air quality problems. These products include new air cleaning technologies, anti-microbial agents, air fresheners, and air quality sensors. With this increased presence in the marketplace there have been increased inquiries concerning the efficacy, effectiveness, and benefits of these products. However, whether many of these products work, how they work, and what possible secondary contaminants or health effects may be created or enhanced from use of some of these products is often unknown and is of utmost concern to the indoor air quality community. The research proposed in this [report] addresses the need for further evaluation of the performance, effectiveness, and potential positive and/or negative impacts on indoor air quality and human health from these types of products. This information will help EPA and other concerned federal, state and local organizations to subsequently issue information reports and guidelines to potential users.”
Program Needs for Indoor Environmental Research, 402-B-05-001, U.S. EPA, Washington, DC: March 2005.
The program needs identified in the EPA report illustrate potential areas for technology improvement and innovation.
Another recent report developed by the Business Communications Company, Inc. (BCC) describes projected trends for the indoor air quality market.24 The report states that the U.S. 23 Program Needs for Indoor Environmental Research, 402-B-05-001, U.S. EPA, Washington, DC: March 2005, http://www.epa.gov/iaq/pubs/pnier.pdf.
24 Anderson, J. L., E-091 U.S. Indoor Air Quality Markets and Trends, Business Communications Company, Inc. (BCC), Norwalk, CT: July 2004.

Trends Applicable to Multiple Sectors
7-3
indoor air quality market (overall) was $5.6 billion in 2003, and is projected to grow to $9.4 billion by 2008. The market for equipment alone was equal to $3.3 billion in 2003 and is predicted to grow to $4.6 billion by 2008. Consulting and testing services, which were valued at $0.95 billion, are expected to be $1.4 billion by 2008. The area experiencing the most growth consists of environmental services such as mold remediation, asbestos abatement, and radon mitigation, which is expected to increase from its 2003 value of $1.5 billion to $3.4 billion by 2008.
7.2 Outdoor Air Quality Trends
The air quality of the nation has increased significantly during the last 20 to 30 years due to standards set by the Clean Air Act and by national and local efforts. Figure 7-1 illustrates how the aggregate emissions of the six principal air pollutants have decreased since 1970 while other factors such as population, energy consumption, vehicle miles traveled, and gross domestic product have increased during the same time period. In 2002, aggregate emissions were down 48% while U.S. population was up 38%, energy consumption was up 42%, vehicle miles traveled were up 155%, and gross domestic product was up 164%.
Improvements in air quality are shown in detail in Table 7-1, which tabulates trends in long-term air quality for the six primary pollutants between 1981 and 2000. Concentrations of all six primary pollutants have decreased during this period as follows:
1. Carbon monoxide (CO) concentration was 3.4 ppm (2nd maximum 8-hour value) in 2000, down from a 20-year high of 8.4 ppm in 1981
2. Lead (Pb) concentration was 0.4 μg/m3 (maximum quarterly) in 1997 through 2000, down from a 20-year high of 0.58 μg/m3 in 1981 and 1982
3. Nitrogen dioxide (NO2) concentration was 0.017 ppm (arithmetic mean) in 2000, down from a 20-year high of 0.024 ppm
4. Ozone concentration was 0.100 ppm (2nd maximum 1-hour value) in 2000, down from a 20-year high of 0.136 ppm in 1988
5. Concentration of particulate matter of 10 microns and smaller (PM10) was 23.8 μg/m3 (weighted arithmetic mean) in 2000, down from a 10-year high of 29.4 μg/m3
6. Sulfur dioxide (SO2) concentration was 0.0051 ppm (arithmetic mean) in 2000, down from a 20-year high of 0.0102 ppm in 1981

Trends Applicable to Multiple Sectors
7-4
Table 7-2 lists national ambient air quality standards (NAAQS) in effect as of 2002. Even though air quality has improved substantially, there is still more to do. For example, according to the U.S. EPA, 146 million people nationwide lived in counties that had pollution levels above the NAAQS during 2002. Strict air quality standards will continue into the future, affecting allowable emissions from both stationary and mobile sources.
Source: National Air Quality and Emissions Trends Report, 2003 Special Studies Edition, U.S. EPA, Washington, D.C.
Figure 7-1 Comparison of Growth Areas and Emissions

Trends Applicable to Multiple Sectors
7-5
Table 7-1 National Long-Term Air Quality Trends, 1981-2000
Year CO 2nd Max.
8-hr ppm
Pb Maximum Quarterly μg/m3
NO2 Arithmetic
Mean ppm
Ozone 2nd Max.
1-hr ppm
PM10 Wtd. Arith.
Mean μg/m3
SO2 Arithmetic
Mean ppm
1981 8.4 0.58 0.024 0.126 - 0.0102
1982 8.1 0.58 0.023 0.125 - 0.0095
1983 7.9 0.47 0.023 0.137 - 0.0093
1984 7.8 0.45 0.023 0.125 - 0.0095
1985 7.1 0.28 0.023 0.123 - 0.0090
1986 7.2 0.18 0.023 0.118 - 0.0088
1987 6.7 0.13 0.023 0.125 - 0.0086
1988 6.4 0.12 0.023 0.136 - 0.0087
1989 6.4 0.10 0.023 0.116 - 0.0085
1990 5.9 0.08 0.022 0.114 - 0.0079
1991 5.6 0.08 0.019 0.111 29.4 0.0081
1992 5.3 0.07 0.019 0.105 27.3 0.0076
1993 5.0 0.06 0.019 0.107 26.6 0.0074
1994 5.1 0.05 0.020 0.106 26.4 0.0072
1995 4.6 0.05 0.019 0.112 25.1 0.0057
1996 4.3 0.05 0.019 0.105 24.2 0.0057
1997 4.1 0.04 0.018 0.104 24.1 0.0056
1998 3.9 0.04 0.018 0.110 23.8 0.0055
1999 3.7 0.04 0.018 0.107 24.1 0.0053
2000 3.4 0.04 0.017 0.100 23.8 0.0051
Source: National Air Quality and Emissions Trends Report, 2003 Special Studies Edition, U.S. EPA, Washington, D.C.

Trends Applicable to Multiple Sectors
7-6
Table 7-2 NAAQS in Effect as of December 2002
Primary Standard (Health-Related)
Secondary Standard (Welfare-Related)
Pollutant Type of Average Standard Level Concentrationa
Type of Average Standard Level Concentrationa
CO 8-hourb
1-hourb
9 ppm (10 mg/m3)
35 ppm (40 mg/m3)
No secondary standard
No secondary standard
Pb Maximum quarterly hour
1.5 μg/m3 Same as primary standard
NO2 Annual arithmetic mean
0.053 ppm (100 μg/m3)
Same as primary standard
O3 Maximum daily 1-hour averagec
4th maximum dailyd 8-hour average
0.12 ppm (235 μg/m3)
0.08 ppm (157 μg/m3)
Same as primary standard
Same as primary standard
PM10 Annual arithmetic mean
24-hour e
50 μg/m3
150 μg/m3
Same as primary standard
Same as primary standard
PM2.5 Annual arithmetic mean f
24-hour g
15 μg/m3
65 μg/m3
Same as primary standard
Same as primary standard
SO2 Annual arithmetic mean
24-hour b
0.03 ppm (80 μg/m3)
0.14 ppm (365 μg/m3)
3-hour b 0.50 ppm (1,300 μg/m3)
a Parenthetical value is an approximately equivalent concentration
bNot to be exceeded more than once per year
cThe standard is attained when the expected number of days per calendar year with maximum hourly average concentrations above 0.12 ppm is equal to or less than 1, as determined according to Appendix H of the Ozone NAAQS
dThree-year average of the annual 4th highest daily maximum 8-hour average concentration
e The short-term (24-hour) standard of 150 μg/m3 is not to be exceeded more than once per year on average over 3 years
f Spatially averaged over designated monitors
g The form is the 98th percentile
Source: National Air Quality and Emissions Trends Report, 2003 Special Studies Edition, U.S. EPA, Washington, D.C.
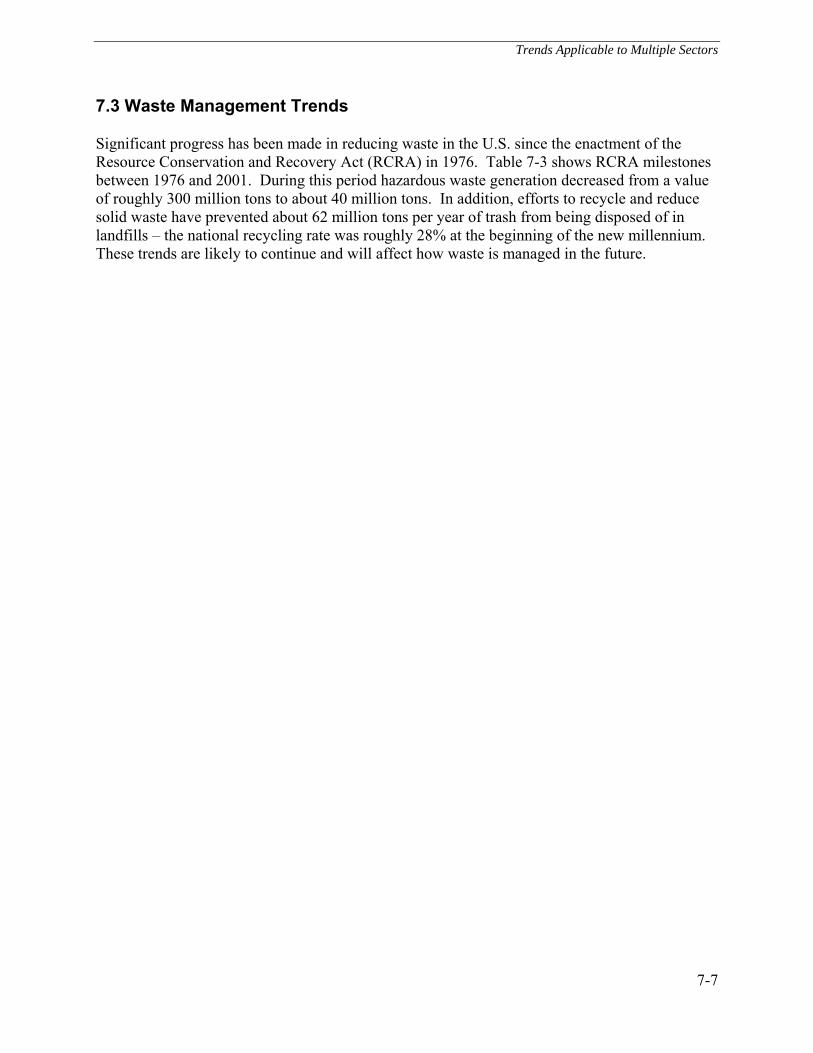
Trends Applicable to Multiple Sectors
7-7
7.3 Waste Management Trends
Significant progress has been made in reducing waste in the U.S. since the enactment of the Resource Conservation and Recovery Act (RCRA) in 1976. Table 7-3 shows RCRA milestones between 1976 and 2001. During this period hazardous waste generation decreased from a value of roughly 300 million tons to about 40 million tons. In addition, efforts to recycle and reduce solid waste have prevented about 62 million tons per year of trash from being disposed of in landfills – the national recycling rate was roughly 28% at the beginning of the new millennium. These trends are likely to continue and will affect how waste is managed in the future.

Trends Applicable to Multiple Sectors
7-8
Table 7-3 Milestones Since the Enactment of the Resource Conservation and Recovery Act (RCRA)
Milestones
Year Legislation and Strategic Direction
Hazardous Waste Solid Waste
1976 Resource Conservation and Recovery Act (RCRA)
1979 Design and operating standards for sanitary landfills
1980 First hazardous waste regulations
1981 First State hazardous waste program
First RCRA permit
Open dump inventory
1982 Design and operating standards for treatment, storage, and disposal facilities
1983 First procurement guidelines
1984 Hazardous and Solid Waste Amendments (HSWA)
1985 Loss of interim status for landfills and surface impoundments
Revised definition of solid waste regulations
1986 First land disposal restrictions
Hazardous waste tank rules
1988 Land disposal permit deadline
1989 Agenda for Action
1990 RCRA implementation study
Toxicity characteristic rule
Regulations for

Trends Applicable to Multiple Sectors
7-9
Milestones
Year Legislation and Strategic Direction
Hazardous Waste Solid Waste
hazardous waste boilers and industrial furnaces
1991 Federal criteria for municipal solid waste
1992 Used oil management standards
1993 Waste minimization and combustion strategy for hazardous waste
1994 WasteWise established
1995 Universal treatment standards
Public participation rule
1996 Land Disposal Flexibility Act
Financial assurance for municipal solid waste landfills
1997 First tribal grants to clean up open dumps
1998 Last land disposal restrictions
1999 RCRA Cleanup Reforms I
Final rule for hazardous air pollutants from combustors (MACT)
2000 RCRA Cleanup Reforms II
2001 Inorganic chemicals listing determination proposal
25 Years of RCRA: Building on Our Past to Protect Our Future, U.S. EPA, Washington D.C.


8-1
8 CONCLUSIONS
Examining trends in end-use technology application areas within a sector can illuminate areas of activity. For example, growth in electricity use over time is an indication that the area is increasing in importance to the sector. The increase could be due to the effects of population growth, or to the increase in electrical demand by various devices serving the application area, or both. In either case, greater electricity use within a technology application area is a measure of the value of that area to society. Greater penetration of end-use technologies within the application area, regardless of energy use, is another measure of the importance of the area. Technologies with attributes that address the evolving functionality requirements of the application area will benefit society, and thus are important for perfection in the electric energy service system. In some cases, the functionality of an area exhibiting growth is improved by reducing the energy use by devices serving the area; in other cases, enhancing the capability of a device for a given level of energy consumption (or even a greater degree of energy consumption) is desirable to improve functionality.
Several end-use technology application areas of particular interest to the Galvin Electricity Initiative stood out from the evaluations of trends in the previous chapters of this report (see Table 8-1). These and other end-use technology application areas are discussed in detail in Volume 3.25
Table 8-1 End-Use Technology Application Areas Identified During Evaluation of Trends
End-Use Technology Application Areas from Trends Evaluation
Lighting
Space Conditioning
Indoor Air Quality
Waste Management
Manufacturing Processes (including control of associated emissions)
Information Technology
Transportation
25 The list in Table 8-1 was later expanded based on the results of Task 1 and the Task 2 workshop. The final list also contains domestic water heating, water and wastewater treatment, distributed generation, electric energy storage, portable power, and power quality.

Conclusions
8-2
Each end-use area was chosen because it meets one or more of the following criteria:
• It is currently a significant user of electric energy
• Its share of electricity consumption is growing (whether due to the effects of population growth, because of changing consumer needs and expectations, as a result of government intervention, or for another reason)
• It is potentially applicable across multiple end-use sectors
• Its relative importance to society is high, whether or not it is a significant user of electric energy
• Its relative importance to the environment is high, whether or not it is a significant user of electric energy
• Technological development in the area shows high potential for contributing to the attributes of a perfect electric energy service system