the galaxy zoo survey for giant agn-ionized clouds:...
TRANSCRIPT

Mon. Not. R. Astron. Soc. 000, 1–21 (2011) Printed 6 October 2011 (MN LATEX style file v2.2)
The Galaxy Zoo survey for giant AGN-ionized clouds: past
and present black-hole accretion events
William C. Keel1,2,3⋆, S. Drew Chojnowski2,3,4, Vardha N. Bennert5, 6,
Kevin Schawinski7,8,9, Chris J. Lintott10,11, Stuart Lynn2,10, Anna Pancoast5,
Chelsea Harris5, A.M. Nierenberg5, Alessandro Sonnenfeld5, & Richard Proctor121Department of Physics and Astronomy, University of Alabama, Box 870324, Tuscaloosa, AL 35487, USA2Visiting Astronomer, Kitt Peak National Observatory, operated by AURA, Inc. under contract to the US National
Science Foundation.3 SARA Observatory4Texas Christian University, Forth Worth, TX 76129 USA5 Department of Physics, University of California, Santa Barbara, CA 93106 USA6 Physics Department, California Polytechnic State University, San Luis Obispo, CA 93407, USA 7Department of Physics, Yale University, New Haven,8Yale Center for Astronomy and Astrophysics, Yale University, P.O.Box 208121, New Haven, CT 06520, USA9Einstein Fellow10Astrophysics, Oxford University11Adler Planetarium, 1300 S. Lakeshore Drive, Chicago, IL 6060512Waveney Consulting, Wimborne, Dorset BH21 3QY
ABSTRACT
Some active galactic nuclei (AGN) are surrounded by extended emission-line regions(EELRs), which trace both the illumination pattern of escaping radiation and itshistory over the light-travel time from the AGN to the gas. From a new set of suchEELRs, we present evidence that the AGN in many Seyfert galaxies undergo luminousepisodes 0.2–2×10⁵ years in duration. Motivated by the discovery of the spectacularnebula known as Hanny’s Voorwerp, ionized by a powerful AGN which has appar-ently faded dramatically within ≈ 105 years, Galaxy Zoo volunteers have carried outboth targeted and serendipitous searches for similar emission-line clouds around low-redshift galaxies. We present the resulting list of candidates and describe spectroscopyidentifying 19 galaxies with AGN-ionized regions at projected radii rproj > 10 kpc.This search recovered known EELRs (such as Mkn 78, Mkn 266, and NGC 5252) andidentified additional previously unknown cases, one with detected emission to r = 37kpc. One new Sy 2 was identified. At least 14/19 are in interacting or merging systems,suggesting that tidal tails are a prime source of distant gas out of the galaxy plane tobe ionized by an AGN. We see a mix of one- and two-sided structures, with observedcone angles from 23–112◦. We consider the energy balance in the ionized clouds, withlower and upper bounds on ionizing luminosity from recombination and ionization-parameter arguments, and estimate the luminosity of the core from the far-infrareddata. The implied ratio of ionizing radiation seen by the clouds to that emitted bythe nucleus, on the assumption of a nonvariable nuclear source, ranges from 0.02 to> 12; 7/19 exceed unity. Small values fit well with a heavily obscured AGN in whichonly a small fraction of the ionizing output escapes to be traced by surrounding gas.However, large values may require that the AGN has faded over tens of thousands ofyears, giving us several examples of systems in which such dramatic long-period vari-ation has occurred; this is the only current technique for addressing these timescalesin AGN history. The relative numbers of faded and non-faded objects we infer, andthe projected extents of the ionized regions, give our estimate (0.2–2×10⁵ years ) forthe length of individual bright phases.
Key words: galaxies: Seyfert — galaxies: ISM — galaxies: active
⋆ E-mail: [email protected]© 2011 RAS

2 W.C. Keel et al.
1 INTRODUCTION
The compact sizes of the central engines of active galacticnuclei (AGN) have long driven study of their distant sur-roundings for clues to their geometry and interaction withthe surrounding galaxy. Observations of gas seen many kpcfrom the AGN itself have proven fruitful in offering viewsof the core from different angles, and implicitly at differenttimes.
Narrowband images revealed extended emission-line re-gions (EELRs) around some luminous AGN, particularlyradio-loud QSOs as well as radio galaxies, as reviewed byStockton, Fu, & Canalizo (2006). Similar structures in lower-luminosity Seyfert galaxies often appear as single or doubletriangles in projection (Unger et al. 1987, Tadhunter & Tsve-tanov 1989), generally interpreted as ionization cones. Whensmall-scale radio jets are present, they lie within the ioniza-tion cones. However, in many cases, the gas must be ionizedby radiation from the nucleus rather than direct interac-tion with a jet or outflow, as seen from narrow linewidthsand (particularly diagnostic) modest electron temperatures,both of which would be much larger in the presence of shocksfast enough to match the observed ionization levels. This isparticularly true for very large EELRs, where interactionwith the radio jet or an origin in outflows alone become lessand less likely. In fact, the best-defined ionization cones areseen in radio-quiet objects (Wilson 1996).
This is one line of evidence linking large-scale struc-tures to the small-scale obscuring regions (“tori”) implied byother arguments for a unification scheme (Antonucci 1993),in which Seyferts of types 1 and 2 are part of a single par-ent population, appearing different based on how our line ofsight passes this torus. The emission-line structures can belarge and well-resolved, offering a way to measure the open-ing angle over which ionizing radiation escapes. Some previ-ous studies have also noted that these emission-line cloudsprovide a view to the immediate past of the AGN, via light-travel time to the cloud and then toward us (Dadina et al.2010).
Using extended emission-line clouds as probes of AGNhistory came of age with the discovery of Hanny’s Voor-werp, a high-ionization region extending 45 kpc in projec-tion from the LINER IC 2497 at z = 0.05 (Lintott et al.2009). Linewidths and electron temperature indicate thatthe gas is photoionized rather than shock-excited, while acombination of ionization-parameter and recombination ar-guments bound the required nuclear ionizing luminosity tobe 1− 4× 1045 erg s−1. However, X-ray spectroscopy showsthe nucleus of IC 2497 to be only modestly absorbed, withionizing luminosity only ≈ 1042 erg s−1 (Schawinski et al.2010a). It is difficult to avoid the conclusion that the nucleusof IC 2497 was in fact a QSO (the nearest known luminousQSO) until roughly 105 years before our current view, andhas faded dramatically in the interim; radio and HST obser-vations offer hints that some of its energy output may haveswitched to kinetic forms over this timespan (Josza et al.2009, Rampadarath et al. 2010, Schawinski et al. 2010a, Keelet al. 2011). The unlikeliness of the nearest QSO showinghighly unusual behaviour suggests that such variations maybe common among AGN, prompting us to re-examine theincidence and properties of extended ionized clouds aroundnearby AGN. Such an examination should not be confined to
catalogued AGN, since the most interesting objects - thosewhich have faded dramatically - may no longer appear asspectroscopically classified AGN.
Hanny’s Voorwerp was first noted by Dutch teacherHanny van Arkel in the course of the Galaxy Zoo project(Lintott et al. 2008), on the basis of its unusual structureand colour. In view of the interest of similar ionized cloudsfor study of both the history and obscuration of AGN, par-ticipants in the Galaxy Zoo project have carried out a widesearch for such clouds using data from the Sloan DigitalSky Survey (SDSS). They examined both known AGN hostsand galaxies not known to have AGN, using the distinc-tive colour of highly-ionized regions across the SDSS grifilters as a first selection criterion. We present the results offurther analysis of the SDSS images, narrow-band imaging,and spectroscopy, yielding a list of 19 galaxies with AGN-photoionized clouds detected to beyond 10 kpc from thenuclei (many of which are newly identified). We considerconstraints on changes in ionizing luminosity for these, andidentify several as the most likely candidates for the kind oflong-term fading seen in IC 2497 and Hanny’s Voorwerp.
2 SEARCHES FOR EMISSION-LINE CLOUDS
The Galaxy Zoo search for giant AGN-ionized clouds com-bined both targeted and serendipitous approaches, to com-bine a complete examination of known AGN hosts with thepossibility of finding ionized clouds around AGN which areyet unknown or in fact optically unseen. In the targetedsearch, we formed a sample of potential AGN at z < 0.1.This combined all galaxies whose SDSS pipeline emission-line ratios put them in either the AGN or composite regionsof the Baldwin-Phillips-Terlevich (BPT) diagram (Baldwin,Phillips, & Terlevich 1981, as revised by Kewley et al. 2001and Kauffmann et al. 2003) using [O III]/Hβ and [N II]/Hα,and all additional objects listed in the Veron-Cetty & Veroncatalog (Veron-Cetty & Veron 2010) at z < 0.1 fallingwithin the SDSS data release 7 (DR7) area. This additionaccounted for AGN with no SDSS nuclear spectrum, eitherbecause they are relatively bright or, more often, because fi-bre collisions or sampling rules prevented their selection forspectra, and type 1 AGN where the pipeline spectroscopicclassification is less reliable than for narrow-line objects. Themerged AGN sample, designed to err on the side of inclu-sion in borderline cases, included 18,116 objects. With aweb interface designed by RP, 199 participants examinedall of these within a 6-week period in 2009, marking eachas certain, possible, or lacking an extended emission region.These emission regions have distinctive signatures in bothmorphology and colour from the SDSS data. They do notfollow the usual spiral or annular distributions of star forma-tion in disc galaxies. Such regions show unusual colours inthe SDSS composite images, which map gri bands to blue,green, and red (Lupton et al. 2004). Hence strong [O III] atlow redshift is rendered as a pure blue, as in the discoveryof Hanny’s Voorwerp. A combination of strong [O III] andsignificant Hα+[N II] appears purple; beyond about z = 0.1,[O III] falls in the gap between g and r filters, so our searchtechnique loses utility until [O III] is well within the r band,when the galaxies have much smaller angular sizes. This
c© 2011 RAS, MNRAS 000, 1–21

Giant AGN clouds 3
subproject was known as the “voorwerpje hunt”, using theDutch diminutive form of Voorwerp.
Each galaxy was examined by at least ten participants;199 Zoo volunteers participated in this program, seven ofwhom examined the entire sample. The final average num-ber of votes was 11.2 per object. After this screening process,a straightforward ranking was by relative numbers of “yes”(weight=1), “maybe” (weight=0.5), and “no” (weightedzero) votes.
The most interesting results of such a search would begalaxies with prominent AGN-ionized clouds in which wedon’t see the AGN, either because of strong obscuration ordramatic variability during the light-travel time from thenucleus to the clouds. These would not be found by tar-geting known AGN, and neither would clouds around AGNwhich do not have catalogued spectral information. Accord-ingly, we also posted a request on the Galaxy Zoo discus-sion forum, with examples of confirmed AGN clouds andvarious kinds of similar-appearing image artifacts. Partici-pants were invited to post possible cases from among thegalaxies they saw in the ordinary course of the Galaxy Zooclassification programs (Lintott et al. 2008), and some ac-tive users reposted examples from other discussion threads.The resulting followups1 provided an additional sample forinvestigation; WCK also checked all the threads with imagediscussion for more such objects, early examples of which in-stigated this search on the first place. To reduce the numberof false positives caused by extended star-forming regions orstarburst winds, objects were removed from consideration ifan SDSS spectrum shows emission lines characteristic of astarburst. Remaining candidates were examined first on theSDSS composite images for appropriate colour and geome-try, and the most promising ones were carried forward forfurther analysis.
Both targeted and serendipitous lists overlap for manyobjects with bright emission-line structures, and recoversuch well-studied cases from the literature as Mkn 266, NGC5252 and Mkn 78; we observed these so as to have a con-sistent set of spectra for comparison. The entire list of can-didates is given in Table 8. In the Survey column, S or Tdenotes whether the object was found in the serendipitoussurvey, the targeted survey of known AGN, or both. Thetype of nuclear optical spectrum is listed as Sy 1/1.5/1.9/2,LINER, SB for starburst, or nonAGN for an ordinary stel-lar population. The final column indicates which GalaxyZoo participant (by user name) first posted objects in theserendipitous survey.
2.1 SDSS image analysis and new images
For both subsamples, further winnowing had the same steps.Most importantly, we reanalyzed the SDSS images, to verifythat the features do not have continuum counterparts, andeliminate artifacts caused by imperfect registration of theimages when forming the colour composites. This effect is ofparticular concern for Seyfert 1 nuclei, where the PSF of thebright nucleus can produce a decentered colour signature ifone of the constituent images is slightly misregistered; Sy 1
1 in http://www.galaxyzooforum.org/index.php?topic=275014.0
g r g-0.75r
Figure 1. Linear combination of SDSS images to iso-late candidate [O III] emission regions, shown with SDSSJ143029.88+133912.0 (the Teacup AGN). The region shown spans64×128 SDSS pixels, or 25.3×50.6”, with north at the top. Eachimage is displayed with a logarithmic intensity mapping, with a
small zero point offset to reduce the effects of noise around zero.At the redshift z = 0.085 of this galaxy, Hα and [N II] emissionfall redward of the r filter band (response 0.2% of peak) so the rimage is used as a continuum estimate.
galaxy image are more vulnerable to this artifact than nor-mal galactic nuclei. Since many candidates (including somewith spectroscopic confirmation) have “purple haze” on theSDSS images, which could either be genuinely extended andsomewhat amorphous [O III] and Hα or an artifact, thiswas a helpful step. We adopted a tomographic approach,taking one of the SDSS bands free of strong emission lines(r or i, depending on redshift) as an estimate of the struc-ture of starlight in the galaxy. This was scaled to match thelargest part of the g structure, iteratively when necessary.This is illustrated in Fig. 1, isolating the emission-line loopin SDSS 1430+13 (nicknamed the Teacup AGN because ofthis structure). Chojnowski and Keel inspected the best sub-traction among various scalings (often a compromise, dueto colour gradients within the galaxy) to assess the realityof extended emission-line features not associated with clearspiral arms or stellar rings. These results let us rank the can-didate lists from both targeted and serendipitous searches inorder of significance of the emission-line structures based onthe SDSS images themselves. We used these results to limitthe number of candidates from the targeted search to the top50; below this there were no convincing candidates based onmore detailed analysis of the SDSS images.
Where appropriate filters were available for [O III] orHα at a galaxy’s redshift, some candidates were imaged atthe remote SARA 1m (Kitt Peak) and 0.6m (Cerro Tololo)telescopes. For [O III], we used a filter centered at 5100 Awith half-transmission width 100A , useable for the redshiftrange z = 0.009−0.025. At Hα, both telescopes have steppedsets of filters 75 A apart with FWHM ∼ 75 A . Continuumwas taken from V, R or g, r, appropriately scaled for sub-traction to show net emission-line structures. These data areparticularly helpful in tracing the emission-line structures ofUGC 7342 (Fig. 2) and SDSS 2201+11 (Fig. 3).
c© 2011 RAS, MNRAS 000, 1–21

4 W.C. Keel et al.
Figure 2. The extended clouds in UGC 7342. Left, the starlightcontinuum in a band at 6450 A from the SARA 1m telescope.Center, an estimated [O III] image from the SDSS data as in Fig.1. Right, continuum-subtracted Hα image from the SARA 1m.North is at the top and east to the left; the field shown spans97 × 150 arcseconds.
Figure 3. The extended clouds in SDSS 2201+11. Left, a g imagefrom the SARA-S 0.6m telescope, showing the dusty disk. Right,continuum-subtracted [O III] image from the SARA-N 1m tele-scope, smoothed by a Gaussian of 2.0” FWHM. North is at thetop and east to the left; the field shown spans 64×84 arcseconds.
2.2 Spectroscopy
To confirm that regions are in fact ionized by AGN, and de-rive diagnostic emission-line properties, we carried out long-slit spectroscopy for the highest-priority candidates. Obser-vations used the GoldCam spectrograph at the 2.1m tele-scope of Kitt Peak National Observatory and the Kast dou-ble spectrograph at the 3m Shane telescope of Lick Obser-vatory. Table 1 compares the setups used for each session.The slit width was set at 2” for all these observations, andthe spectrographs were rotated to sample the most extendedknown structures of each galaxy. Scheduling allowed us toreduce the Kitt Peak data before the first Lick observing
run, so that the 3m spectra could be concentrated on themost interesting galaxies. Total exposures ranged from 30minutes, for initial reconnaissance to see whether an objectmight host AGN clouds, to 2 hours for weaker lines in con-firmed targets. Either night-sky line or interspersed lampobservations were used to track flexure, as needed. Reduc-tion used the longslit package in IRAF2 (Tody 1986), andincluded rebinning to a linear wavelength scale, sky sub-traction, and flux calibration. Spectrophotometric standardstars were observed to set the flux scale; in a few cases wherepassing clouds were an issue, the spectra were scaled so thatthe nucleus within a 2 × 3” region matched the flux of theSDSS spectra.
Our identification of these extended regions as beingphotoionized by AGN rests on three results - location inthe strong-line BPT diagram, strength of the high-ionizationspecies He II and [Ne V], and electron temperature consis-tent with photoionization but not with shock ionization. Weclassify emission regions based on the “BPT” line-ratio di-agrams pioneered for galactic nuclei by Baldwin, Phillips,& Terlevich (1981) and refined by Veilleux & Osterbrock(1987), with caution based on the possibility that some ofthe external gas could have much lower metal abundancesthan found in galactic nuclei (as seen in Hanny’s Voorwerp;Lintott et al. 2009). Abundance effects in gas photoionizedby AGN, as manifested in the BPT diagrams, have beenconsidered in calculations by Bennert et al. (2006a). Thelargest effect is higher equilibrium temperature at lower Oabundance, since it is an important coolant, which drivesstronger forbidden lines and higher ionization levels untilvery low levels (0.1 solar) are reached. In any case, the abun-dance changes are not large enough to move these cloudsacross the empirical AGN/starburst ionization boundary.Furthermore, in the galaxies where we have data coveringthe red emission lines, the clouds’ locations in the (essen-tially abundance-independent) auxiliary BPT diagram of [OIII]/Hβ versus [O I]/Hα also indicated photoionization by anAGN continuum. The various BPT diagrams are comparedfor Points along the slit in each of the clouds we classify asAGN-ionized in Fig. 4. This classification is examined moreclosely in the context of its radial behavior in the next sec-tion.
Independent of these line ratios, strong He II λ4686 or[Ne V] λλ3346, 3426 indicate photoionization by a hardercontinuum than provided by young stars, and resolved emis-sion from these species is immediately diagnostic of AGNphotoionization in this context. For some objects, we do nothave red data; in these, we classify the cloud as AGN-ionizedbased on the presence of the high-ionization lines or conti-nuity of line ratios with the nucleus. Line ratios in the ex-treme blue may be affected in subtle ways by atmosphericdispersion (Filippenko 1982); the scheduling of our observa-tions forced us to observe most targets at hour angles whichdid not allow us to put the slit simultaneously along thestructures of interest and close to the parallactic angle. Theextended regions we observe are generally wider than the
2 IRAF is distributed by the National Optical Astronomy Ob-servatory, which is operated by the Association of Universitiesfor Research in Astronomy (AURA) under cooperative agreementwith the National Science Foundation.
c© 2011 RAS, MNRAS 000, 1–21

Giant AGN clouds 5
Figure 4. Summary Baldwin-Phillips-Terlevich (BPT) diagrams for the Lick spectra, where we measured the requisite red emissionlines. Circles indicate points along the slit for extended clouds classified as AGN-ionized and the host nuclei. Gray-scale backgroundshows the density of points from all low-redshift SDSS galactic nuclei, as in Schawinski et al. (2010b). The dividing lines between regionsphotoionized by AGN and by hot stars are shown as given by Kewley et al. (2001; Ke01) and by Kauffmann et al. (2003; Ka03).
slit; to first order line intensities are not affected by atmo-spheric refraction, since we calibrate with standard stars atlow airmass. Some of the Lick blue spectra have atmosphericdispersion contributing as much as 3” of offset along the slitfrom red to blue ends of the spectrum, important only forthe nuclei and corrected in extracting their spectra.
The BPT diagrams are designed to separate commonsources of photoionization in galaxies; temperature and kine-matic data are also important to understand whether shockspay a significant role. In a few cases, the [O III] λ4363 linewas measured in the extended clouds with sufficient signal-to-noise ratio for a measurement of the electron tempera-ture via its ratio to the strong λλ4959, 5007 lines. Using theIRAF task temden, which implements the algorithm of Shaw& Dufour (2007), and considering ne < 100 cm−3, we find Te
values of 18, 600± 1000 in the SDSS 2201+11, 13, 300± 300for Mkn 266, and 15, 400±500 for the Teacup system. Theseconfirm that the gas is photoionized rather than shocked; forcomparison, temperatures in the [O III] zone of supernova
remnants (including some with lower ionization levels thanin these clouds) range from 20,000-69,000 K (e.g., Fesen etal. 1982, Wallerstein & Balick 1990, Morse et al. 1995). Inaddition, very high shock velocities ≈ 400 km s−1 are neededto produce significant [Ne V] emission Dopita & Sutherland(1996). This is far in excess of the local velocity ranges weobserve (section 6); even though we would not necessarilyobserve material on both sides of a shock in the same ion,it is difficult to envision a situation with large-scale shocksof this velocity without observable velocity widths or struc-tures exceeding 100 k s−1.
While not the main thrust of our survey, it is worthnoting that we find a few instances of either double AGNin interacting systems, or AGN in the fainter member ofa close pair (Mkn 177, Was 49, possibly SDSS J111100.60-005334.9 and SDSS J142522.28+141126.5). These may beworth deeper spectroscopy in the context of mapping AGNobscuration; if a high-ionization component can be isolatedin the gas of the other galaxy, its distribution could show
c© 2011 RAS, MNRAS 000, 1–21

6 W.C. Keel et al.
where ionizing radiation escapes any circumnuclear absorb-ing structure. This offers a distinct way of tracing the ioniz-ing radiation even in the absence of extensive gaseous tidalfeatures, in an approach that has been discussed for Was49ab by Moran et al. (1992).
Table 4 lists the results of our spectroscopy. Confirmed,resolved clouds ionized by the AGN are separated from otherresults (unresolved AGN emission, extended star-forming re-gions denoted as H II, and so on). The instruments used aredenoted by GCam (Kitt Peak GoldCam) and Lick (Lick 3mwith Kast spectrograph). New redshifts and spectral classi-fications are marked with asterisks. We separate the AGNclouds of most interest based on the detected extent of [OIII] λ5007; our spectra have a lower detection threshold thanour images for this, roughly 10−16 erg cm−2 s−1 arcsec−2 foremission regions a few arcseconds in size. Spectra of the nu-clei and representative cloud regions are shown in Figs. 5and 6. Table 5 lists emission-line ratios and selected fluxesfor the same regions plotted in these figures. Fluxes are givenboth for [O III] λ5007 and Hα, since these were usually mea-sure with different gratings and detectors. For some of thenuclei, correction of the Hβ flux for underlying absorptionin the stellar population was significant; we have applied anapproximate correction based on typical values for syntheticstellar populations from Keel (1983).
The upper part in Table 4, with AGN-ionized gas de-tected more than 10 kpc from the nucleus, forms the samplefor our subsequent analysis. As a sign of completeness, ofthese 19, 14 were found in both targeted and serendipitoussearches. SDSS J095559.88+395446.9 was newly identifiedas a type 2 Seyfert in our spectrum, after having been foundin the “blind” search of galaxies independent of prior clas-sification as an AGN host (so it was not included in thetargeted sample). Of the remainder, Mkn 78 and Mkn 463were selected in the targeted AGN sample, while Mkn 1498and UGC 11185 were recognized only in the serendipitoussurvey. It may be relevant that both Mkn 78 and Mkn 463have ionized regions with relatively small projected extent,easily lost against the galaxy starlight (which in Mkn 463 ismorphologically complex).
The [S II] λ6717, 6731 lines are particularly important,tracing electron densities and thereby providing one esti-mate of the intensity of the impinging ionizing radiation.Since the densities in these extended clouds are low, andthe ratio is generally near its low-density limit, where themapping from line ratio to density is highly nonlinear, wehave examined the errors in measuring the line ratio closely.We generated multiple realizations of pixel-to-pixel noise,and each was scaled to four representative fractions of thestronger line peak. This was added to line pairs, modeled tomatch the line widths and pixel separation of the red Lickdata. Gaussian fitting of the lines with added noise gave arelation between the peak signal-to-noise and error of thefitted ratio which we adopted; we use ±2σ error bounds toderive bounds on the density. Density values were calculatedusing the IRAF task temden.
3 ENERGY BUDGET IN EXTENDED
CLOUDS: OBSCURATION VERSUS
VARIABILITY
Seeing the effects of radiation from an AGN on gas tens ofkpc from the nucleus allows us the possibility of tracing dra-matic changes in core luminosity. One straightforward wayto approach this question is a simple energy balance. Thespectra give us upper and lower bounds on the required ion-izing luminosity. To probe the most extreme conditions, weanalyze galaxies in which we detect ionized gas at projecteddistances r > 10 kpc. For all distances and luminosities, weuse the WMAP “consensus” cosmological parameters, withH0 = 72 km s−1 Mpc−1 (Spergel et al. 2007).
The lower bound comes from the highest recombination-line surface brightness we observe; the central source mustprovide at least enough ionizing photons to sustain this overperiods longer than the recombination timescale (which maybe as long as 104 years at these low densities). This is alower limit, since the actual emission-line surface brightnessof some regions may be smeared out by seeing, and we donot know that a given feature is optically thick at the Lymanlimit. This limit depends only very weakly on the slope ofthe ionizing continuum, since helium will generally absorbmost of the radiation shortward of its ionization edge leavingonly the 13.6-54.4 eV range to consider for hydrogen ioniza-tion. We base our bounds on the highest implied luminosityamong structures at various projected radii in a given sys-tem, with no correction for projection effects. This makesour limits conservative, since a given cloud will always liefarther from the nucleus than our projected measurement.In essence, this argument is based on the surface brightnessin a recombination line; we use Hβ since we have these datafor the whole sample. In a simple approximation, we takethe surface brightness in the brightest portion of a cloud,assuming this to be constant across the slit. We take theregion sampled in this way to be circular in cross-sectionas seen from the nucleus, so its solid angle is derived fromthe region subtended by the slit. We then see this regionoccupying a small angle α = 2arctan(slit halfwidth/r) asseen projected at angular distance r from the AGN, the re-quired ionizing luminosity is given from observed quantitiesas Lion = 1.3 × 1064z2F (Hβ)/α2 for α in degrees. The de-rived values are listed in Table 6, along with complementaryquantities related to the nuclear luminosity (as collected be-low). The derived ionizing luminosities are lower limits, sincethere may be unresolved regions of higher surface brightness,and we do not know whether a given cloud is optically thickin the Lyman continuum. Higher-resolution imaging in theemission lines could this increase these values.
Upper limits to the incident ionizing flux come froma complementary analysis using the ionization parameter(U , the ratio of ionizing photons to particles), since theseemission-line features all have [S II] line ratios near the low-density limit. Our density results from the λ6717/λ6731 [SII] line ratio are given in Table 7. Values are listed only forobjects with useful measures far from the core. In each case,we evaluated the density at a typical temperature of 104 K,and at the higher temperature 1.3×10⁴ K found in Hanny’sVoorwerp (Lintott et al. 2009) and in our data for Mkn 266and SDSS 2201+11, as set by thermal equilibrium for sub-stantially subsolar oxygen abundance. We quote the extreme
c© 2011 RAS, MNRAS 000, 1–21

Giant AGN clouds 7
3500 3700 3900 4100 4300 4500 4700 4900 5100−200
0200400600800
[Ne V
] 334
6[N
e V] 3
426
[O II
] 372
7
[Ne I
II] 38
69[N
e III]
3968
[S II
] 406
9Hδ
4102
Hγ 43
41[O
III]
4363
[He I
I] 46
86
Hβ 48
61
[O II
I] 49
59[O
III]
5007
cloud: 6.3" (6.6 kpc) wsw nucleus
6600 6800 7000
[O I]
6300
[O I]
6364
Hα 65
63[N
II] 6
584
[S II
] 671
6[S
II] 6
730
Mkn 78(Lick - Kast)
050100150200250300350
nucleus cloud
3500 3700 3900 4100 4300 4500 4700 4900 5100−20
020406080
100120
cloud: 21.9" (12.5 kpc) north nucleus
6500 6700 6900
Mkn 266(Lick - Kast)
020406080100120140nucleus cloud
3500 3700 3900 4100 4300 4500 4700 4900 5100−50
050
100150200250300
cloud: 8.4" (6.4 kpc) east nucleus
6600 6800 7000
Mkn 883(Lick - Kast)
051015202530
nucleus cloud
3600 3800 4000 4200 4400 4600 4800 5000 5200−40−20
020406080
100120140
cloud: 7.0" (7.8 kpc) nnw nucleus
Nuc
leus
Flu
x (10−1
7erg/cm
2/s/Å)
6700 6900 7100
Mkn 1498(Lick - Kast)
Cloud Flux (1
0 −17erg
/cm
2/s/Å
)
0
10
20
30
40
50nucleus cloud
3500 3700 3900 4100 4300 4500 4700 4900 51000
50100150200 cloud: 14.0" (8.5 kpc) nnw nucleus
6500 6700 6900
NGC 5972(Lick - Kast)
020406080100120140nucleus cloud
3600 3800 4000 4200 4400 4600 4800 5000 5200−5
05
1015202530
cloud: 5.7" (5.6 kpc) sse nucleus
6600 6800 7000
SDSS 0955(Lick - Kast)
0
5
10
15
20nucleus cloud
3600 3800 4000 4200 4400 4600 4800 5000 5200−10
0
10
20
30
40cloud: 4.2" (4.3 kpc) ene nucleus
6700 6900 7100
SDSS 1005(Lick - Kast)
0510152025303540
nucleus cloud
3500 3700 3900 4100 4300 4500 4700 4900 5100−20
020406080
100cloud: 11.7" (7.0 kpc) nne nucleus
Observed Wavelength (Å)6500 6700 6900
SDSS 2201(Lick - Kast)
0
10
20
30
40
50nucleus cloud
Figure 5. Lick spectra for nuclei and associated AGN-ionized clouds. Small insets at left show the Hβ+[O III] region for nuclei andclouds, scaled to the peak of λ5007 emission. Panels on the right show the [O I] - [S II] region at the same flux scale as the blue spectra.He II and [Ne V] emission, especially important as indicators of a hard ionizing radiation field, are indicated by red dotted lines whenclearly detected in clouds. Nuclear spectra represent 2× 3.1-arcsecond areas, and cloud spectra are summed over 2× 6.2-arcsecond areas.Distances and directions of cloud relative to nuclei are indicated as shown. Three spectra have gaps in the blue region, since they weretaken with the dichroic splitting red and blue optical trains near 4600 A .
range of density values between these two cases (allowing inthe Teacup an upper bound on the electron density as highas 240 cm−3, and in some cases limits < 10cm−3), since thetemperature-sensitive [O III] λ4959 + 5007/λ4363 line ratiois not well-enough measured in most of these objects to useindividual Te values. We derive U from the [O II] λ3727/[OIII] λ5007 ratio using the power-law continuum models fromKomossa & Schulz (1997), and the analytic fits from Bennert(2005) as interpolation tools. For fully ionized hydrogen ata distance d from the AGN, the photon flux in the ionizingcontinuum is Q = 4πd2neU/c. For objects with red spectra,giving densities from the [S II] lines, limits to the luminosity
are given in Table 7. It is reassuring that the upper limits toionizing luminosity derived from U and ne always fall abovethe lower limits from recombination balance.
The lower limits from recombination-balance are inde-pendent of assumptions about the local density ne, makingit more robust than ionization-parameter arguments whenwe have no independent tracer at these low densities. Fig.7 shows several of our objects in one of the “BPT” dia-grams, going beyond their initial use to classify the gas asAGN-ionized to examine changes with projected distancefrom the nuclei. Some of these, such as Mkn 1498 and theTeacup 1430+13, show a phenomenon remarked earlier in,
c© 2011 RAS, MNRAS 000, 1–21

8 W.C. Keel et al.
3700 3900 4100 4300 4500 4700 4900 5100 53000
20406080
100120
[Ne V
] 334
6[N
e V] 3
426
[O II
] 372
7
[Ne I
II] 38
69[N
e III]
3968
[S II
] 406
9Hδ
4102
Hγ 43
41[O
III]
4363
[He I
I] 46
86
Hβ 48
61[O
III]
4959
[O II
I] 50
07
Nuc
leus
Flu
x
cloud: 6.6" (11.3 kpc) ne nucleus
6900 7100 7300
[O I]
6300
[O I]
6364
Hα 65
63[N
II] 6
584
[S II
] 671
6[S
II] 6
730
Cloud Flux
Teacup(Lick - Kast)
0
10
20
30
40
50nucleus cloud
3500 3700 3900 4100 4300 4500 4700 4900 5100−50
0
50
100
150
Observed Wavelength (Å)
cloud: 6.8" (5.6 kpc) east nucleus
6600 6800 7000
UGC 11185(Lick - Kast)
0
10
20
30
40
50nucleus cloud
Figure 5 – continued
for example, NGC 5252 (Dadina et al. 2010) - the ioniza-tion balance stays roughly constant with radius, which isnaturally explained if the characteristic density ne ∝ r−2.This might occur naturally for gas in the host galaxy; tidalstreams of gas would not be likely to match the extrapolatedbehavior of gas within the galaxy and indeed we see somecases (Mkn 266, NGC 5972, SDSS 2201+11) with substan-tial radial changes in U . However, for Seyfert narrow-lineregions, Bennert et al. (2006b) find a shallower density gra-dient ne ∝ R−1.1, which would imply U ∝ R−0.9 for gaswhich is optically thin (or has a small covering fraction).These objects have heterogenous behavior; In the ionizationcone of NGC 7212, Cracco et al. (2011) find no radial trendof ne.
Similar conclusions come from the more limited blue-line diagram also considered by Baldwin, Phillips, & Ter-levich (1981), which we can apply to the objects for whichwe have only blue-light spectra from KPNO. Some of ob-jects in this diagram as well as in Fig. 7 show systematicchanges in ionization level with radius, manifested as off-sets from upper left (higher ionization) to lower right (lowerionization). We show this behavior in Fig. 8.
We use far-IR data to estimate (or limit, for nondetec-tions) the amount of AGN radiation absorbed (and reradi-ated) by nearby dense material, whether in an AGN “torus”or in the inner parts of the host interstellar medium. TheFIR luminosity is conservatively high as an estimate ofthe potential obscured AGN luminosity, since there may bea nontrivial contribution from star formation in the hostgalaxy as well as the AGN, and in some cases companiongalaxies might blend with the target in the FIR beam. Ina simple picture where a fraction f of the AGN radiationis absorbed by nearby dust and reradiated, the FIR lumi-nosity will be of order Lionf/4π, with an additional scalingfactor of a few to account for non-ionizing radiation heatingthe grains (which we omit at this point for the sake of aconservative calculation). For convenience, we approximatethe total far-IR output by the FIR parameter introduced forIRAS point-source catalog data (Fullmer & Lonsdale 1989),a linear combination of flux values in the 60 and 100µ bandswhich gives a reasonable approximation to the total flux be-
tween 42-122µ. Numerically,
FIR(W m−2) = 1.26 × 10⁻¹⁴(2.58f60 + f100)
for IRAS fluxes in the 60 and 100 µ bands given in Jy (mul-tiplied by 107 for a result in ergs cm−2 s−1). IRAS data weresupplemented, where possible, by Akari data (Murakami etal. 2007, Kawada et al. 2007, Yamamura et al. 2010) ofhigher accuracy. The positions of all these galaxies werecovered in the IRAS survey, so we can assign typical upperlimits to nondetections depending on ecliptic latitude; Akari
added two additional detections not found in the IRAS data,using only quality 1 (confirmed detection) fluxes. For non-ULIRG objects (LF IR < 1045 erg s−1), we can reproducethe IRAS FIR parameter from Akari 90µ fluxes and meancolours via
FIR(W m−2) ≈ 5.0 × 10⁻¹⁴f90
with 30% accuracy (±0.15 dex), and we use this to fill inFIR luminosities for the objects detected only by Akari.The input values and results of this energy-balance test areshown in Table 6. Within our sample, Mkn 273 and Mkn 266are classic ultraluminous infrared galaxies (ULIRGs), withLF IR = 1 − 5 × 1045 erg s−1. Some of the others remainundetected in both the IRAS and Akari surveys, leading tolimits typically < 1044 erg s−1. An index of whether theextended clouds can be ionized by an obscured AGN is pro-vided by the ratio of required ionizing luminosity to FIRluminosity, tabulated in Table ??. These values are all lowerlimits, since the ionizing luminosity is a lower limit This ra-tio ranges from 0.02 to values > 12 (FIg. 9). Low valuesclearly represent AGN which are strongly obscured alongour line of sight but not toward the EELR clouds. Large ra-tios indicate long-term fading of the AGN, a spectral shapestrongly peaked in the ionizing UV, or very specific geome-try for obscuring material, and thus indicate objects worthyof close attention.
Arguments for long-timescale variations in the centralsources here depend on our having estimates for their totalluminosity as seen directly, which could in principle fail ei-ther if their ionizing radiation were collimated by somethingother than obscuration, or the spectral shapes in the deep
c© 2011 RAS, MNRAS 000, 1–21

Giant AGN clouds 9
3700 3900 4100 4300 4500 4700 4900 51000
50
100
150
200
250
IC 2637
[Ne V
] 342
6
[O II
] 372
7
[Ne I
II] 38
69[N
e III]
3968
[S II
] 406
9Hδ
4102
Hγ 43
41[O
III]
4363
[He I
I] 46
86
Hβ 48
61[O
III]
4959
[O II
I] 50
07
(KPNO - GCam)
cloud: 5.6" (3.3 kpc) sw nucleus
0
50
100
150
200
3600 3800 4000 4200 4400 4600 4800 5000 5200
0
20
40
60
80
100
120
Mkn 273
[Ne V
] 342
6
[O II
] 372
7
[Ne I
II] 38
69[N
e III]
3968
[S II
] 406
9Hδ
4102
Hγ 43
41[O
III]
4363
[He I
I] 46
86
Hβ 48
61[O
III]
4959
[O II
I] 50
07
(KPNO - GCam)
cloud: 9.8" (7.6 kpc) sw nucleus
0
10
20
30
40
50
60
70
80
3700 3900 4100 4300 4500 4700 4900 5100−200
0
200
400
600
800
Mkn 463(KPNO - GCam)
cloud: 10.9" (11.0 kpc) south nucleus
Nuc
leus
Flu
x (10−1
7erg/cm
2/s/Å)
0
20
40
60
80
100
3600 3800 4000 4200 4400 4600 4800 50000
20
40
60
80
100
120
140
Mkn 739(KPNO - GCam)
cloud: 10.6" (6.4 kpc) nnw nucleus
0
20
40
60
80
100
Cloud Flux (1
0 −17erg
/cm
2/s/Å
)
3500 3700 3900 4100 4300 4500 4700 4900
−500
0
500
1000NGC 4388(KPNO - GCam)
cloud: 12.9" (2.4 kpc) ssw nucleus
0
20
40
60
80
100
120
3600 3800 4000 4200 4400 4600 4800 5000
−50
0
50
100
150
200
250
300NGC 5252(KPNO - GCam)
cloud: 14.4" (6.7 kpc) south nucleus
0
20
40
60
80
100
3700 3900 4100 4300 4500 4700 4900 5100
−10
0
10
20
30
40
50
60
SDSS 1510(KPNO - GCam)
cloud: 7.3" (6.8 kpc) south nucleus
0
5
10
15
20
25
30
35
40
3600 3800 4000 4200 4400 4600 4800 5000 5200
0
20
40
60 SDSS 1524(KPNO - GCam)
cloud: 12.8" (9.6 kpc) sse nucleus
Observed Wavelength (Å)
0
10
20
30
40
50
3700 3900 4100 4300 4500 4700 4900 5100
0
50
100
150 UGC 7342(KPNO - GCam)
cloud: 19.5" (18.7 kpc) sw nucleus
Observed Wavelength (Å)
0
10
20
30
40
50
Figure 6. KPNO GoldCam spectra sampling nuclei and associated AGN-ionized clouds. Spectra are scaled to show [O III] λ4959, withnuclear spectra representing 2 × 3.1-arcsecond areas and cloud spectra representing 2 × 6.2-arcsecond areas. He II and [Ne V] emission,especially important as indicators of a hard ionizing radiation field, are indicated by red dotted lines when clearly detected in clouds.Distances and directions of cloud relative to nuclei are indicated as shown.
ultraviolet differ from our expectations based on the UV andX-ray behavior of familiar AGN. Collimation by relativisticbeaming does not fit the combinations of opening angle andflux ratio is required (as found for Hanny’s Voorwerp; Keelet al. 2011). A spectral solution to the behavior would re-quire an extreme-ultraviolet ’bump” dominating the ionizingflux from 13.6-54 eV by more than an order of magnitude.However, known AGN do not provide evident examples ofeither solution; the most straightforward interpretation ofthe data suggests that some of these clouds are ionized byAGN which have faded over the differential light-travel timebetween our views of the clouds and nuclei.
4 NUCLEAR AND EXTENDED RADIO
EMISSION
To further characterize the AGN in these galaxies, we col-lected radio fluxes at 1.4 GHz from the NVSS source catalog
(Condon et al. 1998). All but two objects (SDSS 1510+07and 1005+28) were detected above the 2.5 mJy survey limit;the source luminosity L(1.4 GHz) ranges from < 1.3 × 10²²
W Hz−1 to 2.0× 1024, the latter for the double source asso-ciated with NGC 5972 and comprising 94% of the galaxy’stotal flux. Eight of the galaxies qualify as radio-loud if oneuses a simple, representative division at 1023 W Hz−1, andonly one lies above 1024. This one - NGC 5972 - represents aninteresting departure from the usual alignment of emission-line and radio structure (section 7).
5 HOST AND CLOUD MORPHOLOGY
The examples of Hanny’s Voorwerp (Josza et al. 2009) andNGC 5252 (Prieto & Freudlng 1996) suggest that a commonsource of extraplanar gas at large radii is tidal debris. Thehost morphologies of the galaxies where we find extendedionized clouds support this notion. Table 8 lists morpho-
c© 2011 RAS, MNRAS 000, 1–21

10 W.C. Keel et al.
Figure 7. Baldwin-Phillips-Terlevich (BPT) diagrams for spatial slices in Lick data. Each row shows the three classical BPT diagramsfor each object, highlighting radial ionization behaviors. The nucleus is indicated by crosshairs, with colors changing from white to redwith increasing distance from the nucleus. The greyscale background and dividing lines are the same as in Figure 4; these show onlythe region around the AGN loci in each case for discrimination of detail. Nearly all measurements lie firmly in the AGN domain, withpossible exceptions in some regions of SDSS 1005 and SDSS 0955. The starburst/AGN ionization boundary from Kewley et al. (2001)is shown as the red full curve, while the boundary from Kauffmann et al. (2003) is the black dashed curve. All these measurements liefirmly in the AGN domain, with the possible exception of two regions in SDSS 1005 and the nucleus of Mkn 883, whose red spectrumshows a broad-line region and strong [O I]. The greyscale show the density of points representing low-redshift galactic nuclei in the SDSS,from Schawinski et al. (2010b), which we also follow in adopting the straight line as the LINER/Seyfert boundary
c© 2011 RAS, MNRAS 000, 1–21

Giant AGN clouds 11
Figure 7 – continued
logical information on these galaxies, including warps, closecompanions, asymmetries, or ongoing mergers. The actualincidence of tidal structures will be higher - for example,the inclined ring of gas with distinct kinematics in NGC5252 has no optical counterpart. Of the 19 confirmed large-scale clouds, 14 are in systems classified from SDSS data
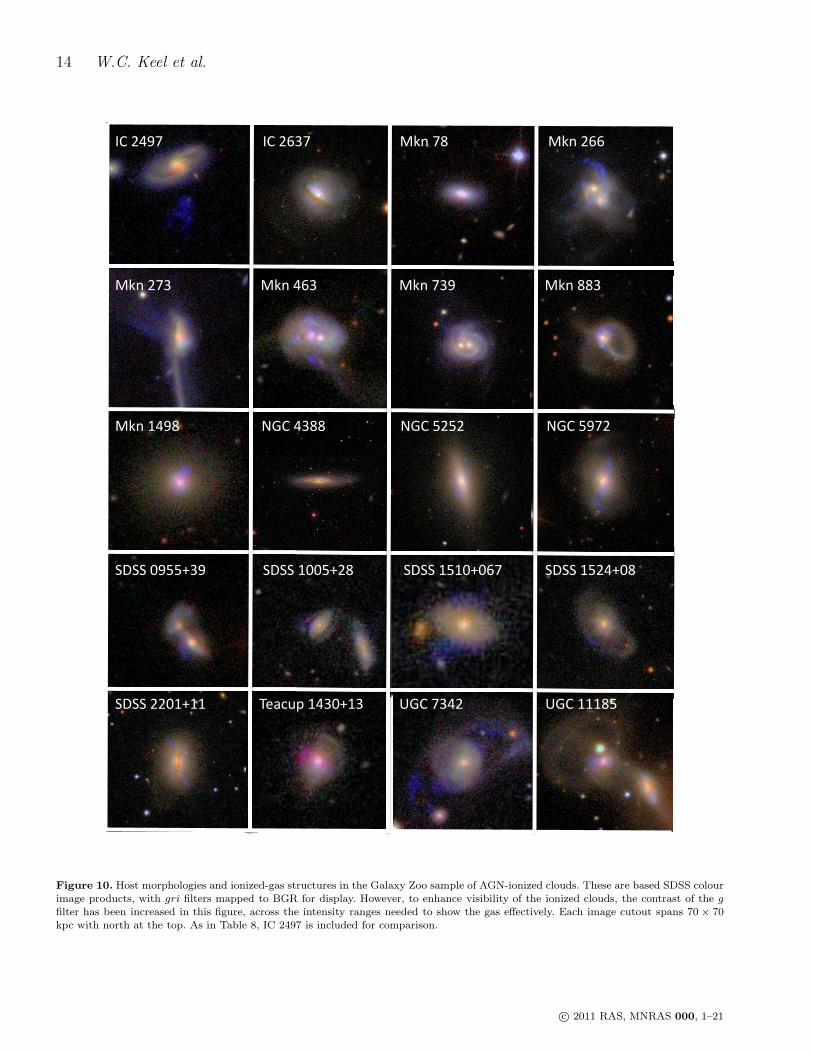
alone as interacting, merging, or postmerger (still showingtidal tails). This remarkably high incidence of disturbed sys-tems (at least 73%, even without including NGC 5252) sup-ports the idea that most very extended emission-line cloudsaround local AGN represent illuminated tidal debris. We il-lustrate this in Fig. 10, showing the SDSS colour images with
c© 2011 RAS, MNRAS 000, 1–21

12 W.C. Keel et al.
Figure 8. An alternate Baldwin-Phillips-Terlevich (BPT) diagram, usable when only blue spectra are available (in this case, from theKitt Peak GoldCam). As in Fig. 7, points are colour-coded with projected distance from the galaxy nuclei. Since Mkn 739 has a significantbroad-line region, its Hβ components were deblended using a broad Gaussian and narrow Lorentzian, with narrow-line ratios plottedhere.
c© 2011 RAS, MNRAS 000, 1–21

Giant AGN clouds 13
Figure 9. Distribution of the ratio Lion/LF IR in the log. Smallvalues are consistent with AGN heavily obscured along our line ofsight but not toward the emission-line clouds, while large valuesindicate fading of the AGN. Shaded regions show that there isno obvious differences in the distributions among type 1 Seyferts(black), intermediate type 1.5 and 19 objets grey), and type 2nucle (white).
the g-band [O III] contribution enhanced to show the clouds’locations. In this section, we include IC 2497/Hanny’s Voor-werp in the tabulations for comparison. A striking instanceof a QSO ionizing gas in a companion and tidal tail, on sim-ilar scales ≈ 40 kpc, has been reported by de Silva et al.(2011).
Several of these galaxies show discs seen nearly edge-on. From these, it is clear that the ionizing radiation canemerge well away from the disc poles. The projected anglesfrom stellar disc to the axis of the ionized clouds, when it iswell defined, range from 30–54◦. This fits with the statisticsreported by Schmitt et al. (1997), in which obscured (type2) objects show a wider range of angle than type 1 objectsbetween the host-galaxy axes and the AGN axes as tracedby radio jets.
We see both one- and two-sided emission regions. Thetwo-sided regions are generally highly symmetric in angularlocation, although not necessarily in radial extent or sur-face brightness, fitting with biconical illumination patterns.As listed in Table 8, 9 of 19 of our confirmed objects haveemission detected on both sides of the nucleus. Particularlyin very disturbed systems, a strong asymmetry may reflectthe location of cold gas rather than the pattern of escapingionizing radiation, so that we cannot necessarily concludethat the one-sided clouds are in galaxies that do not havetwo-sided radiation patterns
The angular width of regions of escaping radiation mayconstrain the geometry of obscuring regions, if the ioniza-tion is bounded by the availability of radiation rather thangas. We list, in Table 8, a cone angle, which is the projectedangular width of each half of a notional bicone encompass-ing all the high-ionization regions seen in our images, out-side of a usual nuclear emission region (Fig. 11). Projectioneffects make the observed angle an upper limit to the three-dimensional opening angle of a cone. The sample of largeemission clouds exhibits a wide range, from 23–112◦ . Thenarrower ones are challenging to understand from obscu-
Figure 11. Illustration of angles listed in Table 8. The disc angle,defined only for highly inclined and reasonably symmetric hostdisks, is measured from the projected major axis of the disc tothe midpoint of the cloud (bi)cones. The cone angle, as shown,measures the width of the paired triangles about the nucleus thatencompass the extranuclear emission detected in available images.The base image is the SDSS r observation of SDSS 2201+11, withthe [O III] clouds shown schematically.
ration by a circumnuclear torus, suggesting absorbers thatare geometrically quite thick compared to the opening anglefor escape of ionizing radiation, to an extent which mightbetter be described as an obscuring shell with small polarholes. However, some of these objects have dual clouds invery symmetric locations, which would be most naturallyexplained by such a scheme.
Several of the two-sided clouds show near-symmetry inradial extent on opposite sides of the galaxy. This could re-flect episodic activity on the light-travel time scale, althoughfront-back geometric effects would generally break an exactsymmetry.
6 KINEMATICS OF IONIZED GAS
Extended ionized regions around AGN may commonly beseparated into kinematically quiescent components, such aswould be seen for disk gas ionized from the nucleus, andoutflow, with additional superimposed radial motion whichmight be manifested in a well-sampled velocity field as mis-alignment of the velocity field with the galaxy morphologyif the superimposed velocity components are not spectrally
c© 2011 RAS, MNRAS 000, 1–21
14 W.C. Keel et al.
!"#$%&'############################!"#$()'#########################*+,#'-############################*+,#$((#
*+,#$')#########################*+,#%()#######################*+,#')&#########################*+,#--)#
*+,#.%&-#######################/0"#%)--#####################/0"#1$1$#######################/0"#1&'$#
2322#4&115)&################2322#.4415$-##############2322#.1.454('############2322#.1$%54-#
2322#$$4.5..###############6789:;#.%)45.)##########<0"#')%$#######################<0"#...-1#
Figure 10. Host morphologies and ionized-gas structures in the Galaxy Zoo sample of AGN-ionized clouds. These are based SDSS colourimage products, with gri filters mapped to BGR for display. However, to enhance visibility of the ionized clouds, the contrast of the gfilter has been increased in this figure, across the intensity ranges needed to show the gas effectively. Each image cutout spans 70 × 70kpc with north at the top. As in Table 8, IC 2497 is included for comparison.
c© 2011 RAS, MNRAS 000, 1–21

Giant AGN clouds 15
resoved (Barbosa et al. 2009). In addition, for disturbed sys-tems, tidal features may show motions decoupled from thedisk itself. We consider here the information on gas kine-matics provided by our spectra, noting that in most caseswe sample only a single position angle through each galaxy.
Redshifts were measured for each pixel along the slitusing Gaussian fitting in IRAF. We show results for [O III],Hβ, and when observed, Hα and [N II]. Velocity errors arebased on propagation of photon statistics (Keel 1996).
Fig. 12 shows a selection of these velocity slices, rela-tive to the nucleus in each case. Despite the angular offsetfrom the edge-on disk, the gas velocities in SDSS 2201+11are continuous with the pattern in the inner rotating sec-tion, and closely symmetric. Similarly, the emission cloudsin NGC 5972 fall along an extrapolation of the inner-disk ro-tation curve (as traced by [O III]). Despite its very disturbedmorphology, UGC 11185 shows near-symmetry in kinemat-ics, with a very strong velocity gradient crossing the nucleus.
Other systems in our sample show less ordered velocityslices. The gas in UGC 7342 at all radii has a single senseof motion on each side of the nucleus, but local departureshave amplitudes up to 120 km s−1. A central gradient inthe Teacup (SDSS 1430+13) may be reversed where the slitcrosses its loop of emission. The kinematics in Mkn 883 andMkn 739 are very disordered, as expected for a merging sys-tem. In Mkn 78, multiple components are seen in the innerfew arcseconds, even in [Ne V] (Fischer et al. 2011).
The northern filament in Mkn 266 presents interest-ing kinematic behavior, with a large and consistent velocityoffset between [O III] and Hα, Hβ. This difference is seenin spectra from both spectrographs. A likely explanation issuperposition of structures with quite different ionizationstates as well as velocity, so that the weighting of lines inour spectra, even though they are not separately resolved,gives different velocity centroids. The offset is close to 50 kms−1 along the entire filament. Localized instances of similarmismatches between [O III] and Hβ velocities on one sideof SDSS 2201+11 and possibly in NCG 5972. Outflows aretypically inferred from blue wings on [O III], but far fromthe nuclei where disk extinction is unlikely to be a majoreffect, velocity offsets of either sign could show outflows.One corollary of this distinction is that there exists a gascomponent of much higher excitation than implied by theionization parameter we derived from ratios of total line fluxat these locations, suggesting higher ionizing luminosities inthese galaxies.
The relatively quiescent kinematics of most of these fea-tures may indicate a contrast in origin of the extended gaswhen compared with the radio-loud QSOs (Fu & Stockton2009a, Fu & Stockton 2009b). In their sample, modest star-formation rates led them to suggest that much of the ionizedgas was expelled from the system by the launch of power-ful radio jets. The galaxies in our EELR sample are mostlyradio-quiet (or at least radio-weak), as noted above. Also un-like their QSO sample, we see significant metallicity differ-ences between the nuclei and EELRs, most strongly shownin the [N II]/Hα ratio, again consistent with the EELR gashaving an external tidal origin.
7 NOTEWORTHY SYSTEMS
From our results or previously reported data, several of thesegalaxies have interesting individual features.
The inner parts of the EELR in Mkn 78 have long beenknown (Pedlar et al. 1989, who detected much of the [O III]extent we observe), and observed with HST in both imag-ing and spectroscopic modes (Capetti et al. 1994, Whittle& Wilson 2004). A detailed fit to the HST radial velocitiesexplains the double line profiles near the core without requir-ing a second AGN (Fischer et al. 2011); optical and near-IRline spectra suggest that the gas is photoionized from thenucleus with at most a very localized role for excitation byinteraction with small-scale radio jets (Whittle et al. 2005,Ramos Almeida et al. 2006). Our data also show the complexspatial and velocity structure in the inner few arcseconds.The outer emission is spatially smooth, and is measured tomuch larger radii in our spectra than in the initial SDSSimaging detection.
In Mkn 883, the blue line ratios indicate that it lies nearthe Seyfert/starburst boundary. Only in the red do weakbroad Hα and [O I] definitely indicate an AGN. We do notdetect a broad component at Hβ.
For NGC 4388, the SDSS images detect only a few in-ner knots of the extensive emission region revealed by, forexample, Subaru imaging Yoshida et al. (2002). Our spectradetect more of this structure. Our cone angle is estimatedfrom the Subaru image. Detailed spectroscopy by Michitoshiet al. (2004) confirms that this distant gas is photoionizedby the AGN.
NGC 5252 has been considered the archetypal Seyfertgalaxy with ionization cones. The implied energetics of thenucleus depend critically on the density in the ionized fila-ments. Our implied limits from photoionization balance viasurface brightness in Hβ are significantly greater than thevalues suggested from pressure balance with the galaxy’shot ISM (Dadina et al. 2010), while we concur with the X-ray results that the ionization parameter remains roughlyconstant with radius among the ionized features. In turn,the interpretation of this behavior depends on fine struc-ture (much still unresolved) in the emission-line filaments,as seen in Hanny’s Voorwerp (Keel et al. 2011).
Two objects in this sample appear to violate the usualpattern of ionization cones encompassing radio-source axes.NGC 5972 is the most radio-luminous of our galaxies, andshows a typical double-lobed structure Condon & Broderick(1988). The lobes are separated by 9.4’ (330 kpc) in pro-jection, and are oriented near PA 100◦, quite different fromthe optical emission at PA 167◦. In this source, the mostradio-powerful in our sample, the very different geometries ofthe line and radio emission make ionization from interactionwith the radio plasma unlikely, and their near-perpendicularorientation is unlike the typical case for Seyfert galaxies(Wilson & Tsvetanov 1994). This could be explained if theionization cones have extremely broad opening angles, or ifthe radio structure makes a dramatic and yet-unobservedtwist on small scales. Similarly, Mkn 1498 is associated witha giant low-frequency double radio source Rottgering et al.(1996), with projected separation 1.1 Mpc. In this case aswell, the orientations of the emission-line structures and thelarge radio source differ strongly, by about 70◦.
SDSS 1430+13, the “Teacup” AGN, is distinguished by
c© 2011 RAS, MNRAS 000, 1–21

16 W.C. Keel et al.
Figure 12. Radial-velocity slices (shown relative to the nuclei) along our slit locations for selected hosts and AGN clouds. Nuclei areindicated by dark red circles. Lines used in calculating radial velocites from GCam and Lick data sets are indicated in the plots for NGC5972, one of several objects observed at both locations though typically at slightly different position angles. In some cases, the extendedemission follows the inner rotation closely even for extraplanar gas, as in SDSS 2201+11 and NGC 5972. Others are more chaotic, asexpected for mergers. Particularly for Mkn 266, some structures show significant differences between the lines, indicating that we areseeing blends of multiple components with very different line ratios. Intensity slices in the continuum and lines are plotted across thebottom to show correlations between location and velocity structure, scaled in flux to match [O III] λ . Velocity errors are calculatedas ±2σ from photon statistics following Keel (1996); in some cases, larger errors may be appropriate from such factors as blending ofmultiple components.
c© 2011 RAS, MNRAS 000, 1–21

Giant AGN clouds 17
Figure 12 – continued
a 5-kpc loop of ionized gas. The FIRST VLA data at 20cm show extended structure roughly coextensive with thisfeature, possibly indicating a related origin.
In both SDSS 2201+11 and SDSS 1111-00 (the latterobserved spectroscopically but with emission smaller than
our 10-kpc limit), the extranuclear clouds outshine the AGNitself in the [O III] lines.
UGC 11185 shows a second, weaker set of emission-linecomponents near the nucleus, peaking about 1.8” to the eastalong our slit, roughly 600 km s−1 to the red of the main
c© 2011 RAS, MNRAS 000, 1–21

18 W.C. Keel et al.
peaks, and including about 1/4 of the nuclear [O III] fluxwithin a 2 × 3” aperture.
In both Mkn 463 and Mkn 739, Chandra imaginghas furnished evidence for double AGN (Koss et al. 2011,Bianchi et al. 2008). In both cases, the emission regionsare much larger than the separation between AGN compo-nents, so we do not know whether the ionization is associatedmostly with one or the other. More detailed [O III] imagescould resolve this. However the flux sources are apportionedbetween components, one AGN in each system must have anionizing/FIR ratio at least as high as our tabulated limit.Several earlier studies have noted the extended [O III] emis-sion around Mkn 463 (Mazzarella et al. 1991, Uomoto et al.1993, Chatzichristou & Vanderriest 1995).
Wu et al. (2011) summarize polarimetric detections of“hidden” broad-line regions in nearby AGN. Their list in-cludes four of the nuclei in our sample: NGC 4388, NGC5252, Mkn 78, and Mkn 463. Broad wings to the Balmerlines are seen in Mkn 266 (southwestern nucleus) and Mkn739 (eastern nucleus), making them clear Sy 1 nuclei with“non-hidden” broad-line regions. Weak wings are seen at Hβin Mkn 1498, which would then be classified as a type 1.8object (Osterbrock 1977).
8 CONCLUSIONS
Volunteers in the Galaxy Zoo project have carried out asearch for AGN-ionized gas clouds on large scales (10-40kpc). This paper has documented the search, and spectro-scopic observations of candidates yielding 19 such features.These clouds were classified as AGN-photoionized based ontheir locations in the Baldwin-Phillips-Terlevich (BPT) line-ratio diagrams, strength of [Ne V] and He II emission, and(when measurements are sufficient) modest electron temper-atures Te < 20, 000 K, consistent with photoionization butnot with shock heating. Most of the host galaxies show signsof interaction, suggesting that the extended ionized gas inmany cases rises from tidal tails.
We consider upper and lower bounds to the luminosityof the AGN as it reached the clouds - lower limits from re-combination and upper limits from density and ionizationparameter. We compare these with the obscured luminos-ity estimated from far-infrared measurements; an excess inionizing luminosity (or deficit in the far-IR) could signallong-term variability of the AGN. The ratio of ionizing toobscured luminosity spans a wide range, from 0.02 to > 12.Over a third of them (7/19) exceed unity, making this kindof energy deficit a common issue. Small values fit with an ori-gin in obscured AGN, requiring only a small fraction of theextreme ultraviolet to escape. In contrast, large values mayrequire a long-term fading of the AGN. An extreme case ofthis is represented by Hanny’s Voorwerp near IC 2497 (Lin-tott et al. 2009). In this object, the required ionizing fluxindicates that the AGN has faded by a factor > 1000 withinthe last ≈ 2 × 10⁵ years, sampling a timescale on which weotherwise have no information. More detailed observationsof this new sample, including pending X-ray measurements,could give statistics adequate to show how common suchvariations are.
An important use of this sample is in addressing the his-tory of AGN luminosity - on what timescales do episodes of
high luminosity persist and fade? Broad arguments suggestthat AGN episodes extend over spans comparable to theduration of a galaxy merger (several 108 years), if statis-tics associating excess AGN with strong interactions andmergers are representative. We note that establishing a linkbetween galaxy interactions and AGN episodes has provenremarkably elusive, with the results depending on details ofcomparison sample selection and what kind of AGN is stud-ied; as recent examples, Maia et al. (2003), Alonso et al.(2007), and Li et al. (2008) reached different conclusions - anull result, enhancement limited to certain kinds of AGN, ora weak overall enhancement of AGN - from similar analysisof nearby galaxy samples. Therefore, even within such longtimespans, we have little information on how episodic theaccretion and associated luminous output might be.
The relevant equation for time delay between radiationreaching us directly from the nucleus and that reprocessedin a cloud follow usage for light echos in ordinary reflection,except that here we are constrained by the location of gas sowe deal with a constant observed radius rproj and unknownangle θ between the illumination direction and the plane ofthe sky; and the long recombination times at low density im-pose a convolution with a nontrivial time span for response.With the geometry defined in Fig. 13, keeping rproj fixed bythe observations means that the geometrical time delay ∆tfor observing reprocessed nuclear radiation depends on thethe viewing angle θ (from observer to nucleus to the cloud,with a cloud along the line of sight at zero and increasingaway from the observer) as given by
∆t =rproj
c sin θ(1 − cos θ) (1)
derived in the approximation of infinite distance from theobserver. Two-sided symmetric sets of clouds have progres-sively much longer differential delays when seen with theiraxis near the line of sight, so that a faded source in thisregime should eventually be seen ionizing only the farsidecloud. Our ability to reconstruct the actual distribution of θis hampered by an inner cutoff in rproj (10 kpc, so that thecloud detection is not hampered by galaxy starlight) andlack of knowledge of the distribution of cloud extent fromthe nuclei. To be conservative, our calculations of ionizingluminosity (above) assume θ = 90◦, the minimum possibledistance for the nucleus and thus minimal ionizing luminos-ity,
We might expect our sample to be complete at least forthe lowest redshifts and highest surface brightnesses, butthere are a few objects with selection priority as high assome of our cloud hosts for which we do not yet have con-firming optical spectra. Of our 19 confirmations, 14 werefound in both the targeted and serendipitous searches. Twowere found only in the targeted search, and 3 in the serendip-itous search. Of these 3, one (SDSS J095559.88+395446.9)had no previous optical spectrum and could not have beenincluded in the targeted sample.
A first hint as to characteristic timescales comes for therelative numbers of galaxies with and without deficits in ion-izing luminosity, since the ones with deficits in the energybudget would be seen during the appropriate delay time af-ter fading of the nucleus. There is no obvious reason for thisratio to be biased in our sample, since the serendipitous sur-vey was independent of the presence of an AGN, and evenin the targeted search there are many AGN which are too
c© 2011 RAS, MNRAS 000, 1–21

Giant AGN clouds 19
!"#$%&'()$
!" *$
+%+,-$
,./)+0)+$
123$
Figure 13. Behavior of the differential time delay ∆t betweenradiation seen directly from the nucleus and reprocessed througha cloud at distance R from the nucleus, as a function of angle θfrom the line of sight, for fixed value of projected radius rproj .The inset diagram shows the geometric quantities. Units of ∆tare rproj/c.
weak to ionize the extended gas; in essence, given a luminousAGN, our selection is for objects with outlying gas availableto be ionized. In a toy model where all objects’ delay times∆t are equal, the timescale for the AGN to be at high lu-minosity before fading would be of order ∆tnbright/nfaded.From Table 6, our estimate is 1.2∆t when we divide thebright and faded groups at an ionizing/FIR ratio of 1.5. Theprojected extent of the clouds rmax from our [O III] data islisted in table 8; for the 19 galaxies in our sample, the meanvalue is 19 kpc with a median of 17. For a typical projectedextent 20 kpc, this becomes a range 25,000–175,000 years,taking the sample to populate values of θ = 90± 50◦ at thissmall sample size. For the luminosity range of Seyfert galax-ies we have probed, the fading may be an order of magnitudein ionizing luminosity, but this sample includes no cases inwhich we see AGN-ionized clouds around a galaxy with nooptical trace of an AGN. IC 2497 (Lintott et al. 2009) mustbe extreme in this respect, having faded from a QSO to aborderline LINER./Sy 2 nucleus. As noted by Schawinskiet al. (2010a), these timescales are rapid compared to ex-pectations from scaling up the behavior of accretion disksaround stellar-mass black holes, perhaps indicating that diskself-gravity enhances the growth of accretion instabilities.
There are several directions in which we can expand thisstudy. In a “Dead Quasar Survey”, we are conducting [OIII] imaging of samples of luminous AGN hosts and galaxieswithout AGN signatures, to seek fainter (and possibly older)clouds than can be detected from the SDSS g images. H Iselection should help pick out objects with tidal tails in suit-able positions to be ionized at tens of kpc from the core; weare beginning with the Kuo et al. (2008) sample of Seyfertgalaxies mapped in H I. For the “faded” galaxies in thessample, we are pursuing XMM-Newton and HST observa-tions to clarify the obscuration toward the nucleus, seek anysigns of outflow-induced star formation as seen in Hanny’sVoorwerp, and refine estimates of the ionizing luminosity
through the highest recombination-line surface brightnessin the clouds.
ACKNOWLEDGEMENTS
This work would not have been possible without the con-tributions of citizen scientists as part of the Galaxy Zooproject. We particularly thank Hannah Hutchins, ElizabethBaeten, Massimo Mezzoprete, Elizabeth Siegel, Aida Berges,and users voyager1682002 and Caro, who each examined allof the galaxies in the targeted AGN sample, and in addi-tion Christian Manteuffel, for assistance in compiling thelist of SDSS AGN candidates. We are grateful to the follow-ing additional Galaxy Zoo participants who contributed tothe targeted AGN search: Michael Aarons, Mark Ackland,AdrianusV, Aerial, alexob6, Daniela Alice, Norvan Allen,Anderstp, AndrewM, angst, Anjinsan, ARCHEV, artemiit,aryamwojn, astrobrainiac, astronomicom1, Markku Au-tio, Michelle Ayers, Elisabeth Baeten, R. Balick, MichaelBalzer, Michael Derek Barnett, Kirsten Barr, BarbaraAnn Barrett, David Bartlett, Coral Benham, Aida Berges,Mark Bernaldo, Chiheb Boussema, Gwen Brogmus, DaveBrowne brunochi, buddyjesus, David Burt cadou, caliz83,Capella, Alice Carlsen, Caro, Jiri Cejka, Theodore J.Celaya Sr., chairstar, citisue3, Nick Clarke, Ana Claudia,cloud9, clua, David N. Cook, coral, Gemma Coughlin, RobCowhey, Penny Cox, Laurence Cuffe, cyprien, DancesWith-Words, Darren, DarthKeribo, Lloyd Daub, daveb, dave3,david mbe, david nw, Michael C. Davis Jr., distel, Dobador,Shane Dobkins, drawm, Juliette Dowle, Elizabeth Duff,Graham Dungworth, dxjerlubb, dzd, Michael Easterly,echo, Alan Eggleston, Thomas Erickson, ErroneousBee, Fal-conet, firejuggler, frisken, Gino, glyphon, GNB080, gordhad-dow, Michael Gronceski, grrower1, Michael Hand, ThomasHardy, Hans Heilman, Steph Hill, Thomas Hobbs, RickHoltz, Rob Hounsell, hrutter, Mikko Huovinen, IC1101,ixzrtxp, Nina Jansen, Alain Jaureguiberry, jayton, jczoe-hdo, jhyatt, David E. Johnson, Steve Johnson, David JamesJones, John Kelly, khwdfnwit, Pat Kieran, KillerSkaarj,kiske1, knuid, kokdeblade, Anuradha Koratkar, Michi Ko-vacs, kzhndepnd Marc Laidlaw, laihro01, landersonzych,Lily Lau WW, lawless, Bill Lawrence, Kathleen Little-field, Liz, Marc Lluell, Michael Lopez, lpspieler, luigimx,Lzsp, Michael MacIsaac, Christine Macmillan, Katie Ma-lik, Steve Malone, mardo, Lelah Marie, Mark, MichaelMarling, Stephanie R. Marsala, Mauro Marussi, marxpmp,Mark McCormack, Rob Mellor, Massimo Mezzoprete, mgn,Michaelr1415, MichaelRoberts, MichaelSangerTx, milkn-cookies, miraculix250, Elspeth Mitchell, Graham Mitchell,mlvgofjedxv, mothic, Mukund, mykyij, NGC3372, JulianNicol, Rick Nowell, nrbeuw, Richard Oram, orion, os-wego9050, pbungaro, Alice Peachey, Thomas Perraudin,Amanda Peters, Erica Pinto, plummerj, Jim Porter, StevenPorter, Richard Proctor ptkypxdh, randa, RandyC, KimReece, Jessica Reeder, RelativisticDog2, Thomas Ricken-bach, ripw, rjwarmv, rnjrchd, Michael Roberts, RobinMiller,Jim Robinson, roborali, Rona, Geoff Roynon, Paul Rut-ten, Rynnfox, S4CCG, Michael Salmon, salteV, JeroenSassen, second try, Matt Sellick, sheba, Alice Sheppard,SianElderxyz, Nanne Sierkstra, Michael Simmons, SJPorter,skepticdetective, Stephen Sliva, Mark Smith, Sophie378,
c© 2011 RAS, MNRAS 000, 1–21

20 W.C. Keel et al.
spat, Maria Steinrueck, stella13, stellar390, John H. Stew-art, Doug Stork, sumoworm, superhouse, tadaemdg, AuraleeTamison, Chet Thomas, thom 2, Michael Thorpe, timchem,torres, Trixie64, Ramon van der Hilst, Marcel Veillette, RobH.B. Velthuis, John Venables, Michael Viguet, vkhtmhfigou,Aileen Waite, David Walland, wbybjbpv, weezerd, MarkWestover, Julia Wilkinson, Nat T. Winston III, Windsmurf,wpubphx, xuhtjhc, xzxupfqjd, and Mairi Yates. We alsothank the referee, who caught a mistake in calculating light-delay times and helped make the discussion more compre-hensive.
W.C. Keel acknowledges support from a Dean’s Lead-ership Board faculty fellowship. C. J. Lintott acknowledgesfunding from The Leverhulme Trust and the STFC Sciencein Society Program. Galaxy Zoo was made possible by fund-ing from a Jim Gray Research Fund from Microsoft and TheLeverhulme Trust. S. D. Chojnowski participated throughthe SARA Research Experiences for Undergraduates pro-gram funded by the US National Science Foundation. Thisresearch is based on observations with AKARI, a JAXAproject with the participation of ESA. We thank the LickObservatory staff for their assistance in obtaining the data.Support for the work of KS was provided by NASA throughEinstein Postdoctoral Fellowship grant number PF9-00069issued by the Chandra X-ray Observatory Center, which isoperated by the Smithsonian Astrophysical Observatory forand on behalf of NASA under contract NAS8-03060.
Funding for the creation and distribution of the SDSSArchive has been provided by the Alfred P. Sloan Founda-tion, the Participating Institutions, the National Aeronau-tics and Space Administration, the National Science Foun-dation, the U.S. Department of Energy, the Japanese Mon-bukagakusho, and the Max Planck Society. The SDSS Website is http://www.sdss.org/. The SDSS is managed by theAstrophysical Research Consortium (ARC) for the Partici-pating Institutions. The Participating Institutions are TheUniversity of Chicago, Fermilab, the Institute for AdvancedStudy, the Japan Participation Group, The Johns Hop-kins University, Los Alamos National Laboratory, the Max-Planck-Institute for Astronomy (MPIA), the Max-Planck-Institute for Astrophysics (MPA), New Mexico State Uni-versity, Princeton University, the United States Naval Ob-servatory, and the University of Washington.
This research has made use of the NASA/IPAC Ex-tragalactic Database (NED), which is operated by the JetPropulsion Laboratory, Caltech, under contract with the Na-tional Aeronautics and Space Administration.
REFERENCES
Alonso, M. S., Lambas, D. G., Tissera, P., & Coldwell, G.2007, MNRAS 375, 1017
Antonucci, R. 1993, ARA&A 31, 473Baldwin, J.A., Phillips, M.M. & Terlevich, R. 1981, PASP93, 5
Barbosa, F.K.B., Storchi-Bergmann, T., Cid Fernandes, R.,Winge, C. & Schmitt, H. 2009, MNRAS 396, 2
Bennert, N. 2005, Ph.D. dissertation, Ruhr-UniversitatBochum
Bennert, N., Jungwiert, B., Komossa, S., Haas, M. & Chini,R. 2006a, A&A 446, 919
Bennert, N., Jungwiert, B., Komossa, S., Haas, M. & Chini,R. 2006b, A&A 456, 953
Bianchi, S., Chiaberge, M., Piconcelli, E., Guainazzi, M. &Matt, G. 2008, MNRAS 386, 105
Capetti, A., Macchetto, F., Sparks, W. B., & Boksenberg,A. 1994, ApJ 421, 87
Chatzichristou, E.T. & Vanderriest, C. 1995, A&A 298, 343Condon, J.J. & Broderick, J.J 1988, AJ 96, 30Condon, J.J., Cotton, W.D., Greisen, E.W., Yin, Q.F., Per-ley, R.A., Taylor, G.B. & Broderick, J.J. 1998, AJ. 115,1693
Cracco, V. et al. 2011, MRAS (in the press),arXiv:1109.1195
Dadina, M., Guainazzi, M., Cappi, M., Bianchi, S., Vignali,C., Malaguti, G., & Comastri, A. 2010, A&A 516, A9
da Silva, R.L., Prochaska, J.X., Rosario, D., Tumlinson,J., & Tripp, T.R. 2011, ApJ (in the press) =arXiv1103.4134v1
Dopita, M.A. & Sutherland, R.S. 1996, ApJS 102, 161Fesen, R. A., Blair, W. P., & Kirshner, R. P. 1982, ApJ262, 171
Filippenko, A.V. 1982, PASP 94, 715Fischer, T. C., Crenshaw, D. M., Kraemer, S. B., Schmitt,H. R., Mushotsky, R. F., & Dunn, J. P. 2011, ApJ 727, 71
Fu, H. & Stockton, A. 2009, ApJ 690, 953Fu, H. & Stockton, A. 2009, ApJ 696, 693Fullmer, L. & Lonsdale, C.J. 1989, Cataloged Galaxies andQuasars Observed in the IRAS Survey, Version 2, JetPropulsion Laboratory (JPL D-1932)
Josza, G.I.G. et al. 2009, A&A 500, l33Kauffmann, G. et al. 2003, MNRAS, 346, 1055Kawada, M. et al. 2007, PASJ 59, S389–S400Keel, W.C. 1983, ApJ 269, 466Keel, W.C. 1996, ApJS 106, 27Keel, W.C., et al. 2011, in preparationKewley, L. J., Dopita, M. A., Sutherland, R. S., Heisler, C.A., & Trevena, J. 2001, ApJ, 556, 121
Komossa S. & Schulz, H. 1997 A&A 323, 31Koss, M., Mushotzky, R., Treister, E., Veilleux, S., Va-sudevan, R., Miller, N., Sanders, D.B., Schawinski, K.,& Trippe, M 2011, ApJL 735, L42
Kuo, C.-Y., Li, J., Tang, Y.-W., & Ho, P.T.P. 2008, ApJ679, 1047
Li, C., Kauffmann, G., Heckman, T. M., White, S. D. M.,& Jing, Y. P. 2008, MNRAS 385, 1915
Lintott, C. J., et al. 2008, MNRAS, 389, 1179Lintott, C. J., et al. 2009, MNRAS, 399, 129Lupton, R., Blanton, M. R., Fekete, G., Hogg, D. W.,O’Mullane, W., Szalay, A., & Wherry, N. 2004, PASP,116, 133
Maia, M. A. G., Machado, R. S., & Willmer, C. N. A. 2003,AJ 126, 1750
Mazzarella, J.M., Soifer, B.T., Graham, J.R., Neugebauer,G., Matthews, K. & Gaume, R.A. 1991, AJ 102, 1241
Michitoshi, Y. et al. 2004, AJ 127, 90Moran, E.C., Halpern, J.P., Bothun, G.D., & Becker, R.H.1992, AJ 104, 990
Morse, J. A., Winkler, P. F., & Kirshner, R. P. 1995, AJ109, 2104
Murakami, H., et al., 2007, PASJ 59, S369–S376Osterbrock, D.E. 1977, ApJ 215, 733Pedlar, A., Meaburn, J., Axon, D. J., Unger, S. W., Whit-
c© 2011 RAS, MNRAS 000, 1–21

Giant AGN clouds 21
Table 1. Spectroscopic data
Telescope UT Dates Range, A Resolution, A Slit scale ”/pixel Galaxies observed
KPNO 2.1m 2010 June 15-21 3630-5700 3.2 0.78 33Lick 3m 2010 July 12-15 5450-8260 4.5 0.78 11
3495-5605 1.5 0.43 11Lick 3m 2010 Dec 1 - 3 4630-7410 4.3 0.78 13
3280-4595 2.7 0.43 13Lick 3m 2009 Dec 17 5250-9940 13.5 0.78 2
3650-5710 4.8 0.43 2
tle, D. M., Meurs, E. J. A., Guerrine, N., & Ward, M. J.1989, MNRAS 238, 863
Prieto, M.A. & Freudling, W, 1996, MRAS 279, 63Ramos Almeida, C., Perez Garcıa, A. M., Acosta-Pulido,J. A., Rodrıguez Espinosa, J. M., Barrena, R., & Man-chado, A. 2006, ApJ 645, 148
Rampadarath, H., et al. 2010, A&A 517, 8Rottgering, H.J.A, Tang, Y., Bremer, M.A.R., de Bruyn,A.G., Miley, G.K. Rengelink, R.B. & Bremer, M.N. 1996,MNRAS 282, 1033
Schawinski, K., et al. 2010a, ApJL 724, L30Schawinski, K., et al. 2010b, ApJ, 711, 284Schmitt, H.R., Kinney, A.L., Storchi-Bergmann, T. & An-tonucci, R. 1997, ApJ 477, 623
Shaw, R.A. & Dufour, R. J. 1995, PASP 107, 896Spergel, D. N., et al. 2007, ApJS 170, 377Stasinska, G., Cid Fernandes, R., Mateus, A., Sodre, L., &Asari, N. V. 2006, MNRAS 371, 972
Stockon, A., Fu, H. & Canalizo, G. 2006, NewAR 50, 694Tadhunter, C. & Tsvetanov, Z. 1989, Nature 341, 422Tody, D. 1986, SPIE 627, 733Unger, S.W., Pedlar, A., Axon, D.J., Whittle, M., Meurs,E.J.A., & Ward, M.J. 1987, MNRAS 228, 671
Uomoto, A., Caganoff, S., Ford, H.C., Rosenblatt, E.I., An-tonucci, R.R.J., Evans, I.N., & Cohen R.D. 1993, AJ 1-5,1308
Veilleux, S. & Osterbrock, D.E. 1987, ApJS 63, 295Veron-Cetty, M.P. & Veron, P. A&A 518, 10Wallerstein, G. & Balick, B. 1990, MNRAS 245, 701Whittle, D.M., Rosario, D., Silverman, J.D., Nelson, C.H.& Wilson, A.S. 2005, AJ 129, 104
Whittle, D.M. & Wilson, A.S. 2004, AJ 127, 606Wilson, A.S. 1996, VA 40, 63Wilson, A.S. & Tsvetanov, Z. 1994, AJ 107, 1227Wu, Y.-Z., Zhang, E.-P., Liang, Y.-C., Zhang, C.-M., &Zhao, Y.-H. 2011, ApJ 730, 121
Yamamura, I., Makiuti, S., Ikeda, N., Fukuda,Y., Oyabu, S., Koga, T., & White, G. J., 2010,http://www.ir.isas.jaxa.jp/AKARI/Observation/PSC/Public/RN/AKARI-FIS BSC V1 RN.pdf
Yoshida, M., et al. 2002, ApJ 567, 118
c© 2011 RAS, MNRAS 000, 1–21

22 W.C. Keel et al.
Table 2. Candidate AGN with extended emission-line clouds
Coordinate name SDSS ObjID z Nucleus Name/note Search Posted by
SDSS J005607.66+254804.7 587740589487030353 0.1530 Sy 1 purple haze S ElisabethBSDSS J003507.44+004502.1 587731187281494175 0.1205 LINER blue arc S scott LSDSS J004527.06+004237.6 587731187282608299 0.1096 Sy 1.5 S davidjamesjonesSDSS J013037.75+131251.9 587724197207212176 0.0721 Sy 2 CGCG436-065 TSDSS J014238.47+000514.7 588015509280587804 0.1459 Sy 1 S TseringSDSS J014644.82-004043.1 588015508207304746 0.0827 Sy 1 S davidjamesjonesSDSS J030526.96+005144.9 588015510363373793 0.1181 Sy 1 S Mukund VedapudiSDSS J030639.58+000343.2 588015509289762862 0.1074 Sy 1 S MitchSDSS J033013.26-053235.9 587724242842026028 0.0131 Sy 1 NGC 1346 S Half65SDSS J040548.78-061925.7 587727178476093634 0.0556 Sy 1 S echo-lily-malSDSS J074241.70+651037.8 758878270293868614 0.0371 Sy 2 Mkn 78 TSDSS J075910.44+115156.7 588023046395527377 0.0503 Sy 1 S silverhazeSDSS J080452.73+212050.2 588016878287650850 0.1242 Sy 1 purple haze S davidjamesjonesSDSS J082034.78+153111.3 587741532229337219 0.1435 Sy 1 S Half65SDSS J082342.37+482754.4 587725470667833620 0.0935 Sy 2 S spiralmaniaSDSS J082642.63+111555.5 587745244691628370 0.0884 trans TSDSS J083525.51+104925.7 587744873714679862 0.1172 Sy 1 S spiralmaniaSDSS J083818.43+333441.3 587732470387703859 0.0621 LINER KUG TSDSS J084002.36+294902.6 587735240637284507 0.0648 Sy 2 4C 29.30 TSDSS J084344.98+354942.0 587732484342415393 0.0539 Sy 2 S T laihroSDSS J084518.51+142034.1 587742062124269645 0.0606 Sy 1 purple haze S mitchSDSS J084810.10+351534.0 587732470388818038 0.0573 Sy 2 KUG0845+354 TSDSS J084809.59+351530.3 587732470388818042 0.0567 Sy 2 KUG0845+354 TSDSS J084917.31+531755.7 587725470670585957 0.1112 Sy 1 purple haze S TseringSDSS J085625.93+021310.5 587727944563884115 0.1251 RG S BrunoSDSS J085729.84+064210.6 587734691423453446 — — S lovethetropicsSDSS J085837.52+182221.5 587741708866289722 0.0588 Sy 2 TSDSS J085813.75+385631.8 587732053243855000 0.0884 Sy 2 TSDSS J090547.33+374738.2 587732152565432366 0.0475 trans TSDSS J090958.07+621450.4 587737826756198431 0.0261 Sy 2 NGC 2742A S IoannabSDSS J091011.34+230717.9 587741421104136355 0.0362 — S Citizen KirkSDSS J091708.26+292215.6 587738946130018402 0.0353 Sy 2 KUG 0914+295 S Half65SDSS J093033.05+034443.6 587728880335257753 0.0911 Sy 1 S ElisabethBSDSS J094529.64-002154.7 587725074458345485 0.0515 LINER TSDSS J095559.88+395446.9 588016528244670522 0.0483 — violet plume S StephanieCSDSS J100507.88+283038.6 587741392112451744 0.0517 Sy 2 S T stellar190SDSS J100529.60+275844.2 587741391575580675 0.0555 Sy 2 S mitchSDSS J101128.26+260655.4 587741490365792357 0.1164 Sy 2 S mitchSDSS J101645.11+421025.5 588297863112294442 0.0553 NLSy1 S mitchSDSS J102016.20+524756.9 587731499185602761 0.0689 Sy 2 SSDSS J102108.59+024058.5 587726033311498259 — S mitch
SDSS J103734.22+140120.5 587735349101199404 0.2061 Sy 2 S davidjamesjonesSDSS J104232.05+050241.9 587728880879992930 0.0271 Sy 2 NGC 3341 S mitchSDSS J104326.47+110524.2 587734948595499096 0.0475 Sy 1 purple haze S lovethetropicsSDSS J104515.28+421331.7 588017626147782828 0.0990 LINER bubble? S RandyCSDSS J110157.90+101739.2 587732772658806856 0.0340 Sy 1 S davidjamesjonesSDSS J110335.42+032014.7 587726033853022296 0.0531 Sy 2 S skwalkerSDSS J110445.46+041755.2 588010358543351857 0.0252 Sy 2 S ElisabethBSDSS J110756.53+474434.8 588295840708755475 0.0727 Sy 1 S davidjamesjonesSDSS J111100.60-005334.9 588848898833580220 0.0904 Sy 2 S T ElisabethBSDSS J111113.00+284242.7 587741532784361479 0.0294 SB NGC 3561A TSDSS J111113.18+284147.0 587741532784361477 0.0295 Sy 2 NGC 3561 TSDSS J111349.74+093510.7 587734892748144649 0.0292 Sy 1.5 IC 2637 S T stellar190SDSS J111653.96+593146.8 587729387686461462 0.0815 trans VII Zw 384 TSDSS J112534.58+523247.0 587732136456487055 0.0270 SB S errattanSDSS J112753.87+302138.6 587741491447070913 0.0736 nonAGN S paulrogersSDSS J112942.51+235014.1 587742189363331247 0.1277 LINER S ElisabethBSDSS J113323.97+550415.8 587733081347063838 0.0085 Sy 1 Mkn 177 compn S stellar190SDSS J113629.36+213551.7 587742013279502427 0.0297 Sy 1 Mkn 739 S T BudgieyeSDSS J113849.61+574243.4 587735696978215000 0.1162 Sy 1 S ElisabethBSDSS J114155.61+010516.7 588848901521277093 0.1365 Sy 2 S lovethetropics
c© 2011 RAS, MNRAS 000, 1–21

Giant AGN clouds 23
Table 2 – continued
Table 3 – continued Candidate AGN with extended emission-line clouds
Coordinate name SDSS ObjID z Nucleus Name/note Search Posted by
SDSS J114454.85+194635.3 588023669168537695 0.0274 Sy 2 S T stellar190SDSS J114517.10+200121.8 588023669705474229 0.04953 — (possible) S Half65SDSS J115140.70+675041.9 587725552285122567 0.0629 Sy 2 S StephanieCSDSS J115739.07-023908.3 587724649256779921 0.1308 Sy 1 purple haze S c cldSDSS J115906.89+101001.7 587732771591225359 0.1165 Sy 1.8 purple haze S c cldSDSS J120114.35-034041.0 587725039018311737 0.0196 Sy 1 Mkn 1310 S Milk n cookiesSDSS J120150.80+143323.9 587735348036370587 0.0677 nonAGN S DuffBeerSDSS J120719.81+241155.8 587742189367066665 0.0505 NLSy1 purple haze Mkn 648 S davidjamesjonesSDSS J120939.43+643107.6 587729154134966352 0.1042 Sy 2 S mitchSDSS J121418.25+293146.7 587741532253519916 0.0632 Sy 2 Was 49ab S T stellar190SDSS J121431.32+402902.6 588017979429486656 0.1211 Sy 2 S mitchSDSS J121452.41+591953.2 587729386079059975 0.0607 Sy 2 VII Zw 444 S mitchSDSS J121553.08+051447.8 588010359624827047 0.0803 LINER S codexluminatiSDSS J121819.30+291513.0 587739719750058064 0.0477 Sy 2 UGC 7342 S T stellar190SDSS J122402.57+435814.0 588017603610935505 0.1040 nonAGN S fluffyporcupineSDSS J122546.72+123942.7 588017566564155399 0.0086 Sy 2 NGC 4388 S T RandyCSDSS J122802.10+094347.9 587732771057434918 0.1534 LINER S BrunoSDSS J123034.25+033800.7 587726016682917948 0.01285 LINER S StephanieCSDSS J123038.98+401614.4 587738947758456849 0.1322 Sy 1.5 purple haze S TseringSDSS J123046.11+103317.3 587732772131504164 0.01540∗ SB∗ VPC 0764 S lovethetropicsSDSS J123113.12+120307.2 588017702933823557 0.1161 Sy 1 S lovethetropicsSDSS J124036.73+365004.3 587739096991334439 0.0404 Sy 2 S stellar190SDSS J124046.40+273353.5 587741602034090027 0.0565 Sy 1.5 S TseringSDSS J124103.66+273526.0 587741602034155555 0.2007 Sy 1 S TseringSDSS J124325.65+365525.3 587739096991596570 0.0839 Sy 2 S BrunoSDSS J124450.84-042604.5 587745544806727722 0.0147∗ LINER∗ IC 0812 S Milk n CookiesSDSS J124505.56+102433.2 587732772133011652 0.0976 Sy 2 S davidjamesjonesSDSS J124511.84+230210.0 587742014897127434 0.02326 — IC 0813 S ElizabethSDSS J125741.04+202347.7 588023670249750583 0.0807 Sy 2 IC 3929 S T c cldSDSS J130007.06+183914.3 587742575372730410 0.1130 Sy 2 S mitchSDSS J130234.89+184122.3 588023668102856809 0.0656 Sy 2 S Mukund VedapudiSDSS J130422.19+361543.1 587738950954385445 0.0443 Sy 2 WR 470 S mitchSDSS J130258.82+162427.7 587742773491531836 0.0673 Sy 1 Mkn 783 S stellar190SDSS J130509.98-033209.2 587725039025258588 0.0835 Sy 1 purple haze S lovethetropicsSDSS J131555.15+212521.5 587742013289660465 0.0884 Sy 1 S T davidjamesjonesSDSS J131639.74+445235.0 588017605762482225 0.0909 Sy 1.9 S c cldSDSS J131913.93+132030.8 587736802936684556 0.0960 Sy 2 S mitchSDSS J132340.31-012749.1 587725041711644785 0.0767 Sy 1 S IC 1101SDSS J132540.23+275146.1 587739719219675227 0.0377 S ElisabethB
SDSS J133227.20+112910.4 588017570316615795 0.0778 Sy 2 S veggy2SDSS J133416.49+311709.1 587739609171230755 0.0570 SB Was 75 TSDSS J133718.72+242303.3 587742190986657795 0.1076 NLSy1 S c cldSDSS J133815.86+043233.3 587729158970736727 0.0228 Sy 1.5 NGC 5252 S T laihroSDSS J133817.11+481636.1 587732483292266549 0.02786 Sy 2 NGC 5256, Mkn 266 S T ElisabethBSDSS J134442.16+555313.5 587735666377949228 0.0373 Sy 2 Mkn 273 S T stellar190SDSS J134608.10+293810.4 587739504478060626 0.0776 Sy 1 S lovethetropicsSDSS J134630.29+283646.3 587739707943092392 0.0518 Sy 2 TSDSS J135255.67+252859.6 587739810484650051 0.06387 Sy 1 KUG1350+257 TSDSS J135602.62+182217.7 587742550676275314 0.0506 Sy 2 Mkn 463 TSDSS J135635.73+232135.9 587739845379883044 0.0668 LINER TSDSS J135712.06-070433.0 587746236298231865 — S stellar190SDSS J140037.11+622132.7 587728918446407773 0.0752 Sy 1 S mitchSDSS J141051.82+410412.5 588017604156457121 0.0812 LINER S SongSDSS J140506.26+024618.2 587726033335943373 0.0766 Sy 2 S mitchSDSS J141405.01+263336.8 587739720298201117 0.0357 Sy 1 S davidamesjonesSDSS J142522.28+141126.5 587742609727684701 0.0601 Sy 2 TSDSS J142925.07+451831.8 587735490282848380 0.0748 Sy 1.5 purple haze S T AroelSDSS J143029.88+133912.0 587736809916399664 0.0852 Sy 2 Teacup S T Half65SDSS J143239.83+361808.0 587736583892238376 0.0132 Sy 2/SB NGC 5675 TSDSS J144038.10+533015.8 587733427086426161 0.0376 Sy 2 Mkn 477 T
c© 2011 RAS, MNRAS 000, 1–21

24 W.C. Keel et al.
Table 2 – continued
Table 3 – continued Candidate AGN with extended emission-line clouds
Coordinate name SDSS ObjID z Nucleus Name/note Search Posted by
SDSS J144240.79+262332.5 587739457225097282 0.1071 Sy 1 S spiralmaniaSDSS J144331.19+191121.0 587742062161428638 0.0598 Sy 2 S BrunoSDSS J145724.63+105937.3 587736807771930760 0.1227 Sy 1 S davidjamesjonesSDSS J150756.88+032037.3 587726100952449048 0.1369 Sy 1 S mitchSDSS J151004.01+074037.1 588017991773520114 0.0458 Sy 2 S T BlackprojectsSDSS J150408.46+143123.3 587742575922708553 0.1181 Sy 1 Mkn 840 S mitchSDSS J151141.26+051809.2 587736546312323142 0.0845 Sy 1 S Half65SDSS J151915.98+104847.8 587736813131989104 0.0988 Sy 1 S T spiralmaniaSDSS J152412.58+083241.2 588017703489372418 0.0371 Sy 2 S T spiralmaniaSDSS J152549.54+052248.7 587730022796755031 0.048 Sy 2 TSDSS J152907.45+561606.6 587742882456731737 0.0998 Sy 1 S spiralmaniaSDSS J153355.15+585756.4 587725818571063416 — S lovethetropicsSDSS J153432.52+151133.2 587742013841145937 0.0066 Sy 2 NGC 5953 S Half65SDSS J153508.93+221452.8 587739814240190581 0.0858 trans purple haze TSDSS J153703.36+135944.1 587742590401904799 0.0737 LINER S RandyCSDSS J153854.16+170134.2 587739845390761994 0.02974 Sy 2 NGC 5972 S T NeilGibsonSDSS J155007.62+272814.5 587736941990969374 0.1468 Sy 1 purple haze S ElisabethBSDSS J160536.79+174807.5 587739720846934175 0.0339 Sy 2 IC 1182 S stelar190SDSS J162538.08+162718.1 587739814246023211 0.0343 LINER Akn 502 TSDSS J162804.06+514631.4 587736980102643827 0.0547 Sy 1.9 Mkn 1498 S BudgieyeSDSS J162930.01+420703.2 587729653421441105 0.0717 Sy 1 purple haze S TseringSDSS J162952.88+242638.4 587736898503639075 0.0368 Sy 1 Mkn 883 S T ElisabethBSDSS J164800.81+295657.4 587733399186898947 0.1059 Sy 1 S mitchSDSS J172335.75+342133.4 587739849686843709 — S Mukund VedapudiSDSS J172747.17+265121.4 587729409160183880 0.0291 VV 389 S elizabethSDSS J172935.81+542939.9 587725505559855518 0.0820 Sy 2 S BrunoSDSS J181611.61+423937.3 758879745074397535 0.04120 Sy 2 UGC 11185 S stellar190SDSS J210918.38-060754.7 587726879412256901 0.0286 Sy 2 S mitchSDSS J214150.10+002209.4 587731186725683280 0.1068 LINER S echo-lily-malSDSS J220141.64+115124.3 587727221400862869 0.0296 Sy 2 S T stellar190SDSS J233254.46+151305.4 587730774959652922 0.2148 Sy 1 S ElisabethBSDSS J234413.61+004813.9 587731187275923676 0.0497 LINER S davidjamesjones
c© 2011 RAS, MNRAS 000, 1–21

Giant AGN clouds 25
Table 4. Results of long-slit spectroscopy
Coordinate name SDSS ObjID z Nucleus Name PA◦ Source Region Type
Confirmed AGN-ionized:SDSS J074241.70+651037.8 758878270293868614 0.0371 Sy 2 Mkn 78 90 Lick AGNSDSS J095559.88+395446.9 588016528244670522 0.0483∗ Sy 2∗ 148 Lick AGNSDSS J100507.88+283038.5 587741392112451744 0.0517 Sy 2 62 Lick AGNSDSS J111349.74+093510.7 587734892748144649 0.0292 Sy 1.5 IC 2637 47 GCam AGNSDSS J113629.36+213551.7 587742013279502427 0.0297 Sy 1 Mkn 739 168 GCam AGNSDSS J121819.30+291513.0 587739719750058064 0.0477 Sy 2 UGC 7342 133 GCam AGNSDSS J122546.72+123942.7 588017566564155399 0.0086 Sy 2 NGC 4388 26 GCam AGNSDSS J133815.86+043233.3 587729158970736727 0.0228 Sy 1.5 NGC 5252 175 GCam AGNSDSS J133817.11+481636.1 587732483292266549 0.0279 Sy 2 Mkn 266 176 GCam Lick AGNSDSS J134442.16+555313.5 587735666377949228 0.0373 Sy 2 Mkn 273 57 GCam AGNSDSS J135602.62+182217.8 587742550676275314 0.0504 Sy 2 Mkn 463 8 GCam AGNSDSS J143029.88+133912.0 587736809916399664 0.0852 Sy 2 Teacup 37 GCam Lick AGNSDSS J151004.01+074037.1 588017991773520114 0.0458 Sy 2 175 GCam AGNSDSS J152412.58+083241.2 588017703489372418 0.0371 Sy 2 CGCG 077-117 150 GCam AGNSDSS J153854.16+170134.2 587739845390761994 0.0297 Sy 2 NGC 5972 167 GCam Lick AGNSDSS J162804.06+514631.4 587736980102643827 0.0547 Sy 1.9 Mkn 1498 150 GCam Lick AGNSDSS J162952.88+242638.4 587736898503639075 0.0368 Sy 1 Mkn 883 91 Lick AGNSDSS J181611.61+423937.3 758879745074397535 0.0412 Sy 2 UGC 11185 90 GCam Lick AGNSDSS J220141.64+115124.3 587727221400862869 0.0296 Sy 2 19 GCam Lick AGN
Other cloud types:SDSS J003507.44+004502.1 587731187281494175 0.1205 LINER 35 Lick H II regionsSDSS J005607.66+254804.7 587740589487030353 0.1530 Sy 1 200 Lick noSDSS J012839.87+144553.8 587724233179660360 0.0452 Sy 2 CGCG436-060 45 Lick noSDSS J014238.47+000514.7 588015509280587804 0.1459 Sy 1 80 Lick AGNSDSS J030639.58+000343.2 588015509289762862 0.1074 Sy 1 40 Lick AGN (small)SDSS J033013.26-053235.9 587724242842026028 0.0131 SB∗ NGC 1346 76 Lick H IISDSS J040548.78-061925.7 587727178476093634 0.0556 Sy 1 76 Lick H IISDSS J080452.73+212050.2 588016878287650850 0.1242 Sy 1 150 Lick AGN (small)SDSS J082642.63+111555.5 587745244691628370 0.0884 trans 72 Lick resolved?SDSS J083525.51+104925.7 587744873714679862 0.1172 Sy 1 150 Lick small?SDSS J084344.98+354942.0 587732484342415393 0.0539 Sy 2 141 Lick AGNSDSS J111100.60-005334.9 588848898833580220 0.0904 Sy 2 101 GCam unresolved cloud at 4”SDSS J113323.97+550415.8 587733081347063838 0.0085 Sy 1 Mkn 177 136 GCam AGN in small compnSDSS J114454.85+194635.3 588023669168537695 0.0274 Sy 2 131 GCam unresolved < 2”SDSS J121418.25+293146.7 587741532253519916 0.0632 Sy 2 Was 49ab 63 GCam off-nuc AGN or cloudSDSS J123046.11+103317.3 587732772131504164 0.01540 SB VPC 0764 30 GCam unresolvedSDSS J124450.84-042604.5 587745544806727722 0.0147∗ LINER∗ IC 0812 62 GCam < 2”SDSS J125741.04+202347.7 588023670249750583 0.0807 Sy 2 IC 3929 47 GCam H II to 9”SDSS J134630.29+283646.3 587739707943092392 0.0518 Sy 2 164 GCam 34” dim AGN cloud?SDSS J135255.67+252859.6 587739810484650051 0.06387 Sy 1 KUG1350+257 163 GCam H IISDSS J142522.28+141126.5 587742609727684701 0.0601 Sy 2 110 GCam two AGN?
SDSS J150408.46+143123.3 587742575922708553 0.1181 Sy 1 Mkn 840 70 GCam 7”SDSS J151915.98+104847.8 587736813131989104 0.0099 Sy 1 89 GCam unresolved < 2”SDSS J153508.93+221452.8 587739814240190581 0.0858 trans 70 GCam < 2”SDSS J153703.36+135944.1 587742590401904799 0.0737 LINER 21 GCam unresolvedSDSS J160536.79+174807.5 587739720846934175 0.0339 Sy 2 IC 1182 96 GCam H IISDSS J210918.38-060754.7 587726879412256901 0.0286 Sy 2 70 GCam unresolved < 2”SDSS J214150.10+002209.4 587731186725683280 0.1068 LINER 70 GCam Lick unresolved < 2”SDSS J233254.46+151305.4 587730774959652922 0.2148 Sy 1 138 Lick unresolved < 2”SDSS J234413.61+004813.9 587731187275923676 0.0497 LINER 71 Lick H II
c© 2011 RAS, MNRAS 000, 1–21

26 W.C. Keel et al.
Table 5. Emission-line ratios and selected fluxes
Object[Ne V]λ3426[Ne III]λ3869
[Ne III]λ3869[O II]λ3727
[O II]λ3727[O III]λ5007
He IIλ4686Hβ
[O III]λ5007Hβ
F(5007)[OI]λ6300
Hα
[NII]λ6583Hα
[SII]Hα
F(Hα)
IC 2637 nuc 0.23 0.28 0.81 0.11 3.94 2.7e-14cloud < 0.2 0.12 2.43 < 0.06 1.34 4.6e-15
Mkn 78 nuc (1) 0.35 0.32 0.10 0.29 13.5 6.8e-14 0.05 1.00 0.23 6.5e-13cloud 2.00 0.16 0.43 0.37 14.00 7.8e-15 0.094 0.51 0.22 2.0e-15
Mkn 266 nuc 0.69 0.17 0.43 0.19 4.08 3.4e-14 0.052 0.58 0.35 4.0e-14cloud 0.46 0.40 0.22 0.38 8.20 3.7e-14 0.029 0.25 0.23 1.1e-14
Mkn 273 nuc 0.27 0.11 0.90 0.12 3.93 2.4e-14cloud 0.06 0.26 0.93 0.27 9.3 1.0e-14
Mkn 463 nuc 0.26 0.29 0.30 0.08 7.7 3.7e-13cloud 0.41 0.16 0.51 0.17 11.3 1.8e-14
Mkn 739 nuc (2) 1.16 0.49 0.15 0.18 5.88 1.5e-14cloud 1.31 0.22 0.45 0.24 8.30 6.5e-15
Mkn 883 nuc 0.31 0.12 0.81 0.08 2.82 5.3e-14 0.12 0.47 0.47 8.4e-14cloud 0.30 0.22 0.30 0.19 7.84 6.6e-15 0.08 0.31 0.49 4.1e-15
Mkn 1498 nuc (2) 0.73 0.82 0.07 0.10 3.72 1.5e-13 0.07 1.00 0.22 4.9e-14cloud 1.08 0.62 0.18 0.32 12.3 1.0e-14 0.06 0.14 0.20 3.4e-15
NGC 4388 nuc 0.45 0.25 0.27 0.23 11.5 3.6e-13cloud 0.39 1.15 0.57 < 0.23 4.72 4.3e-15
NGC 5252 nuc 0.31 0.27 0.55 0.19 9.22 6.0e-14cloud 1.31 0.34 0.31 0.34 10.1 1.1e-14
NGC 5972 nuc 2.25 0.31 0.29 0.40 2.56 5.1e-14 0.07 0.69 0.49 1.9e-14cloud 0.15 0.20 0.63 0.26 8.48 2.6e-14 0.12 0.79 0.61 9.5e-15
SDSS 0955+39 nuc < 0.54 0.05 4.60 < 0.04 2.90 6.9e-16 0.32 0.84 1.02 1.6e-15cloud 2.64 0.47 0.28 0.51 7.00 3.2e-15 0.08 0.26 0.37 9.5e-16
SDSS1005+28 nuc 0.55 0.29 0.30 0.24 7.96 1.1e-14 0.07 0.57 0.48 5.8e-15cloud 1.52 0.60 0.24 0.58 5.46 4.5e-15 < 0.01 0.25 0.34 3.3e-15
SDSS 1510+07 nuc 0.04 1.15 1.86 < 0.01 2.11 3.2e-15cloud 1.76 0.22 0.56 0.39 6.64 4.4e-15
SDSS 1524+08 nuc 0.78 0.19 0.91 0.37 8.00 4.8e-15cloud 1.58 0.15 0.49 0.44 7.84 5.4e-15
SDSS 2201+11 nuc 0.17 0.07 1.65 0.28 5.48 1.7e-15 0.17 1.21 1.02 7.0e-15cloud 0.53 0.24 0.21 0.18 10.1 7.8e-15 0.07 0.40 0.35 3.0e-15
Teacup nuc 0.31 0.23 0.30 0.09 7.95 1.3e-13 0.15 0.23 0.15 1.1e-14cloud 0.14 0.17 0.23 0.15 8.07 2.1e-14 0.11 0.34 0.36 7.6e-15
UGC 7342 nuc 0.75 0.22 0.58 0.22 9.14 2.9e-14cloud 0.77 0.26 0.41 0.55 9.90 8.9e-15
UGC 11185 nuc (1) 0.17 0.19 0.37 0.16 8.89 8.5e-14 0.19 1.29 0.88 3.8e-14cloud 0.28 0.28 0.25 0.26 8.11 1.4e-14 0.07 1.10 0.72 5.1e-15
Notes: Line fluxes are in units of erg cm−2 s−1
(1) blend of two velocity components(2) BLR present; flux is estimated NLR only
c© 2011 RAS, MNRAS 000, 1–21

Giant AGN clouds 27
Table 6. Ionizing and far-infrared luminosity comparison
SDSS ID Other name IRAS 60µ 100µ Akari 90µ 140µ L(FIR) r” F(Hβ) α◦ Lion Ratio
074241.70+651037.8 Mkn 78 1.11 1.13 0.9 ± 0.2 1.4 ± 0.1 2.4e44 10 4.0e-16 11 > 5.7e43 0.25095559.88+395446.9 – – 1.2 ± 0.2 2.5 ± 0.3 5.0e44 7 2.5e-16 16 > 3.0e43 0.06100507.88+283038.5 – – – – < 2.1e44 8 4.2e-16 14 > 1.0e44 0.5111349.74+093510.7 IC 2637 1.75 3.39 2.6 ± 0.1 4.0 ± 0.7 3.0e44 10 3.0e-16 11 > 2.7e43 0.10113629.36+213551.7 Mkn 739 1.3 2.4 1.7 ± 0.07 3.5 ± 0.6 2.3e44 18 2.1e-16 6.3 > 6.1e43 0.26121819.30+291513.0 UGC 7342 < 0.2 < 0.6 – – < 1.1e44 35 1.8e-16 43.2 > 4.4e44 3.6122546.72+123942.7 NGC 4388 10.0 17.1 10.4 ± 0.6 15 ± 3 1.4e44 15 3.8e-16 7.6 > 6.3e42 0.02133815.86+043233.3 NGC 5252 < 0.2 < 0.6 0.4 ± 0.1 – 4.0e43 32 3.8e-16 3.5 > 2.0e44 5133817.11+481636.1 Mkn 266 7.3 10.3 7.1 ± 0.3 9.0 ± 1.2 1.0e45 27 6.8e-16 4.2 > 3.9e44 0.4134442.16+555313.5 Mkn 273 22.5 22.5 20.2 ± 0.6 14.3 ± 1.1 5.0e45 12 9.0e-16 10 > 1.6e44 0.03135602.62+182217.8 Mkn 463 2.33 1.94 1.58 ± 0.03 2.2 ± 0.5 9.0e44 16 3.8e-16 7 > 2.5e44 0.3143029.88+133912.0 Teacup 0.26 < 0.6 – – < 2.3e43 5 1.66e-15 22 > 3.2e44 14151004.01+074037.1 < 0.2 < 0.6 – – < 4e44 14 8.2e-16 8 > 1.3e45 3.4152412.58+083241.2 0.71 0.73 0.63 < 0.96 1.6e44 5.6e-16 12 10 1.0e44 0.6153854.16+170134.2 NGC 5972 0.24 < 0.76 – – < 5.5e43 35 7.2e-17 3 > 7.8e43 1.8162804.06+514631.4 Mkn 1498 0.34 < 0.61 – – < 5.e43 10 9.8e-17 11 > 3.1e43 0.6162952.88+242638.4 Mkn 883 1.01 1.13 0.84 ± 0.04 – 2.2e44 10 4.0e-16 11 > 5.9e43 0.26181611.61+423937.3 UGC 11185 < 0.4 < 0.8 – – < 1.8e44 10 1.7e-15 11 > 3.1e44 1.7220141.64+115124.3 0.28 < 0.99 – – < 6.1e43 23 4.6e-16 5.0 > 2.0e44 3.4
Notes: FIR fluxes are in JyMean IRAS detection limits are used when no specific value is available
Luminosities are in erg s−1; Hβ fluxes are in erg cm2 s−1
Values of ionizing/FIR luminosity ratio are all lower limits
Table 7. [S II] density measures and limits
Object Distance: arcsec kpc [S II] ratio ne (cm−3) [O II]/[O III] log U Lion (erg/s)
Teacup 5-14 8-22 1.25 ± 0.04 130-240 0.15 -2.16 < 1.9e46Mkn 883 12-16 9-12 1.36 ± 0.03 12- 100 2.62 -3.34 < 4.8e44SDSS 2201 8-16 5-10 1.48 ± 0.06 < 10 0.25 -2.42 < 2.2e44NGC 5972 26-30 15-18 1.29 ± 0.12 3-300 0.11 -1.99 < 9.8e46Mkn 266 20-29 11-16 1.36 ± 0.04 12-100 0.22 -2.36 < 9.3e45
Table 8. Morphologies of AGN hosts with extended clouds
SDSS designation z Sy type Name rmax, kpc Morphology cone angle◦ disc/cloud angle◦ Sides
SDSS J074241.70+651037.8 0.0371 2 Mkn 78 16 E 55 2SDSS J095559.88+395446.9 0.0483 2 10 Interacting S 88 1SDSS J100507.88+283038.5 0.0517 2 13 Sb, disturbed companion 92 1SDSS J111349.74+093510.7 0.0292 1.5 IC 2637 11 Merger remnant 60 1SDSS J113629.36+213551.7 0.0297 1 Mkn 739 17 Ongoing merger 28 1SDSS J121819.30+291513.0 0.0477 2 UGC 7342 38 Ongoing merger; tails 86 2SDSS J122546.72+123942.7 0.0086 2 NGC 4388 13 Edge-on Sc 80 53 1SDSS J133815.86+043233.3 0.0228 1.5 NGC 5252 21 Edge-on S0, tilted H I ring 59 31 2SDSS J133817.11+481636.1 0.0279 2 Mkn 266 21 Ongoing merger 112 2SDSS J134442.16+555313.5 0.0373 2 Mkn 273 19 Ongoing merger 75 2SDSS J135602.62+182217.8 0.0504 2 Mkn 463E 16 Ongoing merger 55 2SDSS J143029.88+133912.0 0.0852 2 Teacup 18 Stellar tail and arc 80 1SDSS J151004.01+074037.1 0.0904 2 10 Symmetric disc; S0 or Sa 85 2SDSS J152412.58+083241.2 0.0371 2 CGCG 077-117 19 Merger remnant 56 1SDSS J153854.16+170134.2 0.0297 2 NGC 5972 33 Warped disc and tails 35 18 2SDSS J162804.06+514631.4 0.0547 1.9 Mkn 1498 21 E 42 1SDSS J162952.88+242638.4 0.0368 1 Mkn 883 37 Ongoing merger 73 1SDSS J181611.61+423937.3 0.0412 2 UGC 11185 11 Strong interaction 48 1SDSS J220141.64+115124.3 0.0296 2 16 Edge-on warped disc, tails 23 30 2SDSS J094104.11+344358.4 0.0499 LINER IC 2497 40 Warped disk, H I tail 46 65 1
c© 2011 RAS, MNRAS 000, 1–21