the g-pat tool gpat tool.pdf · gpat and data filtering ads-c pbcs manual filtering requirements...
TRANSCRIPT
Federal AviationAdministration
The G-PAT Tool
Global Operational Data Link (GOLD)
Familiarization with Performance Based Communications
and Surveillance (PBCS) Workshop
Dakar, Senegal 11-15 September 2017
Prepared by:
FAA WJH Technical Center
Separation Standards Analysis Branch
Presented by: John Warburton ANG-E61
Federal AviationAdministration 2
GOLD/PBCS/DATALINK
MONITORING ACTIVITIES
11- 15 Sep 2017, Dakar, Senegal
The United States has developed software to aid
ANSPs in the task of post-implementation monitoring
This software – the GOLD performance analysis tool
(G-PAT) – helps the user perform graphical analysis
to assess the performance of the data link system in
their respective airspace in relation to the RCP/RSP
specifications for TIME / CONTINUITY
The G-PAT is written in java script and has a
graphical user interface (GUI) which can be run on a
MS Windows-based personal computer
Overview
Federal AviationAdministration 3
GOLD/PBCS/DATALINK
MONITORING ACTIVITIES
11- 15 Sep 2017, Dakar, Senegal
The G-PAT is used to create charts to measure:
• CPDLC performance against the required
communication performance (RCP) 240 or RCP 400
criteria
• actual communication performance (ACP)
• actual communication technical performance (ACTP)
• pilot operational response time (PORT)
• ADS-C downlink latency performance against the
required surveillance performance (RSP) 180 or RSP
400 criteria
Purpose

Federal AviationAdministration 4
GOLD/PBCS/DATALINK
MONITORING ACTIVITIES
11- 15 Sep 2017, Dakar, Senegal
The user inputs CPDLC or ADS-C performance data in the format described in Appendix D of the GOLD
The user then selects:
• the desired analysis filters, e.g. media type or operator
• the performance measure being analyzed, e.g. ACTP
• the performance criteria based on the data type and the media type
• CPDLC – RCP 240 for satellite, VHF media or RCP 400 for HF media
• ADS-C – RSP 180 for satellite, VHF media or RSP 400 for HF media
The tool then creates the cumulative distribution for the selected performance measure and generates the reports and charts selected by the user
How it works
Federal AviationAdministration 5
GOLD/PBCS/DATALINK
MONITORING ACTIVITIES
11- 15 Sep 2017, Dakar, Senegal
Prior to using G-PAT, the input data will require pre-filtering to conform to the requirements specified in Appendix D of the GOLD.
The CPDLC input data should be filtered according to the following:
• The raw CPDLC transaction data should contain only uplink CPDLC transactions that end with a “WILCO” response (DM 0). Any transactions that end with any response other than “WILCO” should be filtered out.
• All uplink transactions with an uplink initiation message containing elements UM 79-84, UM91-92, UM 116-123, or UM169 should be filtered out.
• All uplink transaction occurring during an outage as reported by one of the data link service providers (DSP) should be removed.
• G-PAT will automatically filter out any records containing uplink transactions with a negative ACP, ACTP or PORT. The records removed from the analysis by G-PAT will be written to a file with a filename that is the same as the input file with the addition of “_R” to the end.
GPAT and Data Filtering CPDLC
PBCS Manual Filtering Requirements Summary
Federal AviationAdministration 6
GOLD/PBCS/DATALINK
MONITORING ACTIVITIES
11- 15 Sep 2017, Dakar, Senegal
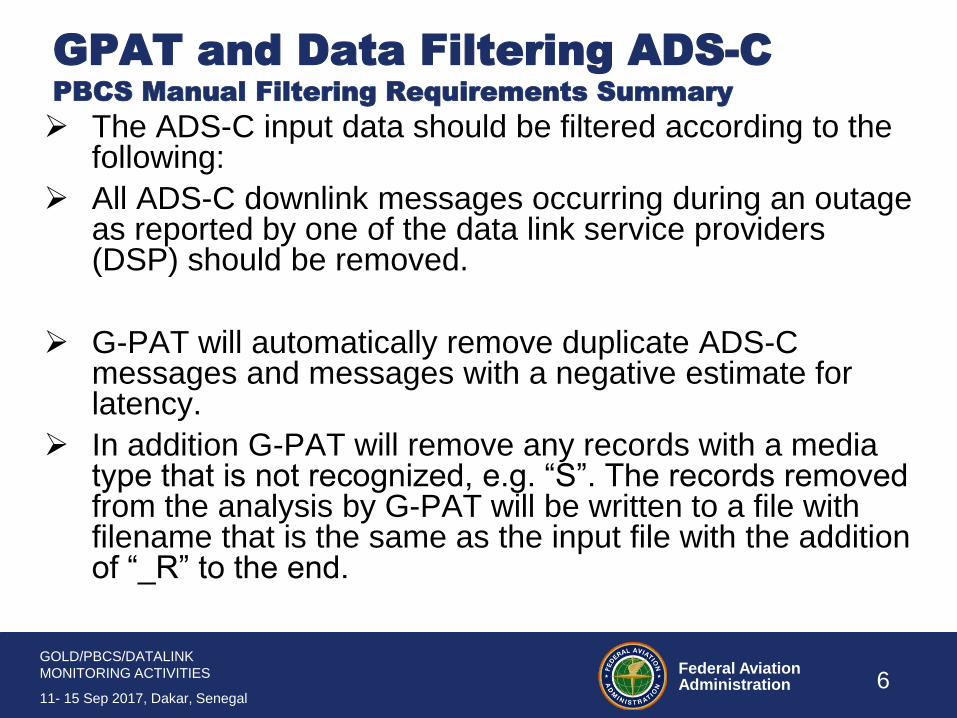
The ADS-C input data should be filtered according to the following:
All ADS-C downlink messages occurring during an outage as reported by one of the data link service providers (DSP) should be removed.
G-PAT will automatically remove duplicate ADS-C messages and messages with a negative estimate for latency.
In addition G-PAT will remove any records with a media type that is not recognized, e.g. “S”. The records removed from the analysis by G-PAT will be written to a file with filename that is the same as the input file with the addition of “_R” to the end.
GPAT and Data Filtering ADS-C
PBCS Manual Filtering Requirements Summary
Federal AviationAdministration 7
GOLD/PBCS/DATALINK
MONITORING ACTIVITIES
11- 15 Sep 2017, Dakar, Senegal
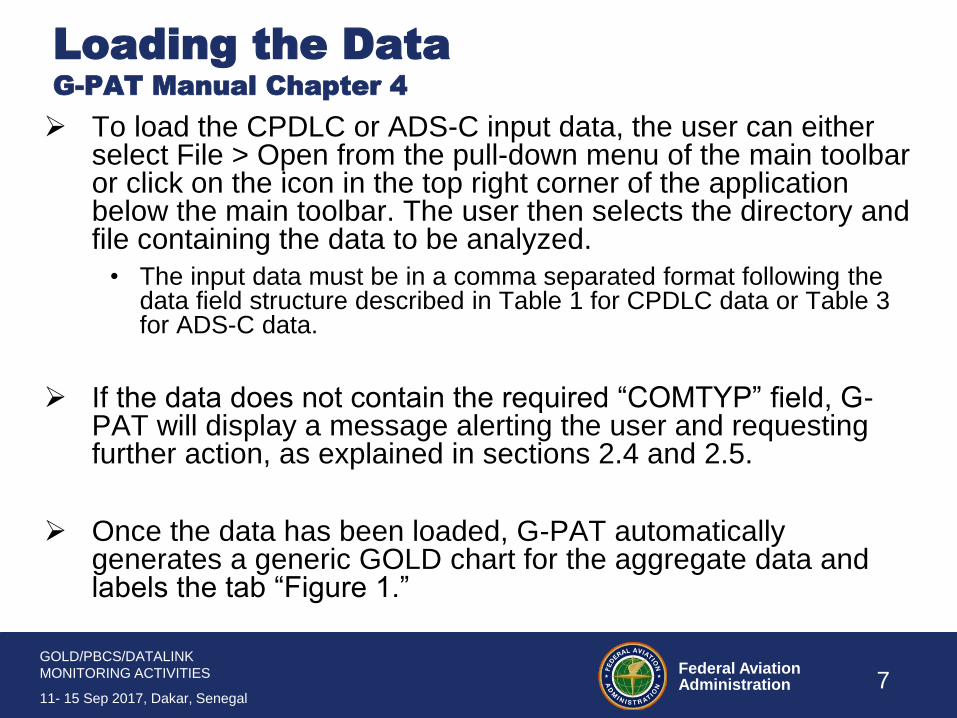
To load the CPDLC or ADS-C input data, the user can either select File > Open from the pull-down menu of the main toolbar or click on the icon in the top right corner of the application below the main toolbar. The user then selects the directory and file containing the data to be analyzed.
• The input data must be in a comma separated format following the data field structure described in Table 1 for CPDLC data or Table 3 for ADS-C data.
If the data does not contain the required “COMTYP” field, G-PAT will display a message alerting the user and requesting further action, as explained in sections 2.4 and 2.5.
Once the data has been loaded, G-PAT automatically generates a generic GOLD chart for the aggregate data and labels the tab “Figure 1.”
Loading the Data
G-PAT Manual Chapter 4
Federal AviationAdministration 8
GOLD/PBCS/DATALINK
MONITORING ACTIVITIES
11- 15 Sep 2017, Dakar, Senegal
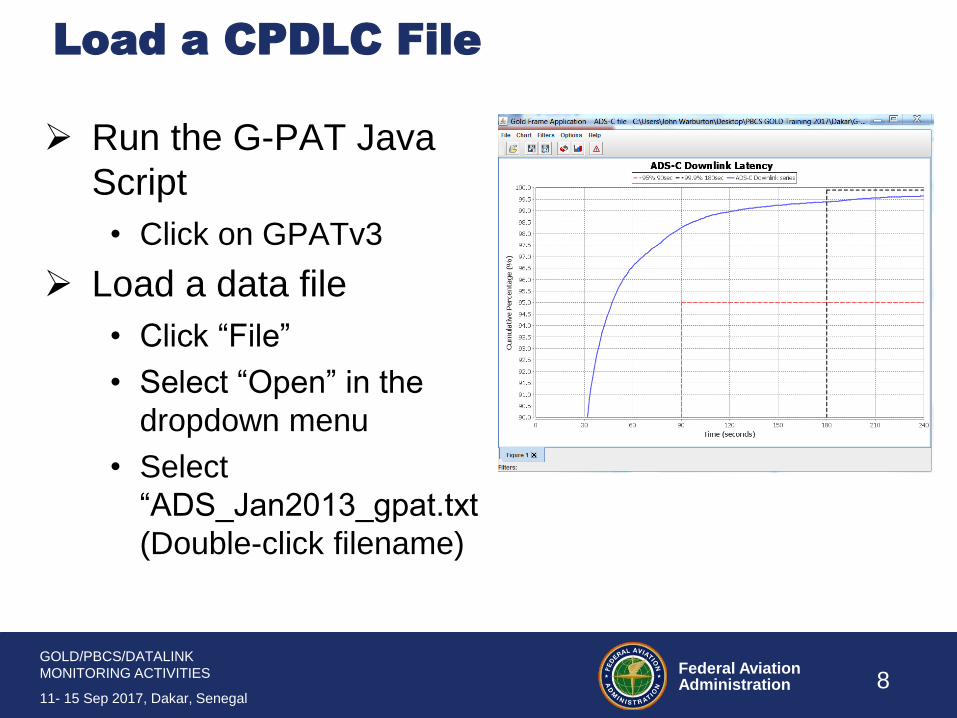
Run the G-PAT Java
Script
• Click on GPATv3
Load a data file
• Click “File”
• Select “Open” in the
dropdown menu
• Select
“ADS_Jan2013_gpat.txt
(Double-click filename)
Load a CPDLC File

Federal AviationAdministration 9
GOLD/PBCS/DATALINK
MONITORING ACTIVITIES
11- 15 Sep 2017, Dakar, Senegal
Once the data is loaded the user will click on “Chart”
in the main toolbar.
• If the input data is ADS-C there is only one option available
(ADS-C), and all other options will be grayed out.
• If the input data is CPDLC, the user will select the
performance parameter of interest: ACP, ACTP or PORT.
Similarly, ADS-C will be grayed out.
Once the performance parameter is selected another
box will pop up displaying the available performance
criteria. For CPDLC parameters the options will be
RCP 240 or RCP400 and for the ADS-C parameter,
the options will be RSP180 or RSP 400.
Performance Parameter and Criteria
G-PAT Manual Chapter 5
Federal AviationAdministration 10
GOLD/PBCS/DATALINK
MONITORING ACTIVITIES
11- 15 Sep 2017, Dakar, Senegal
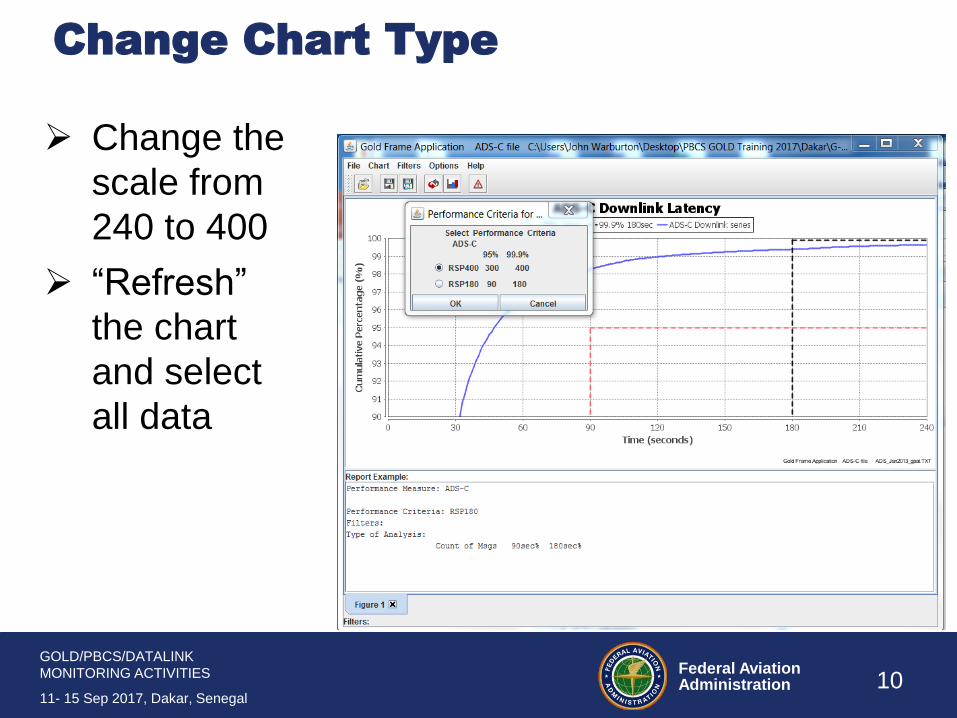
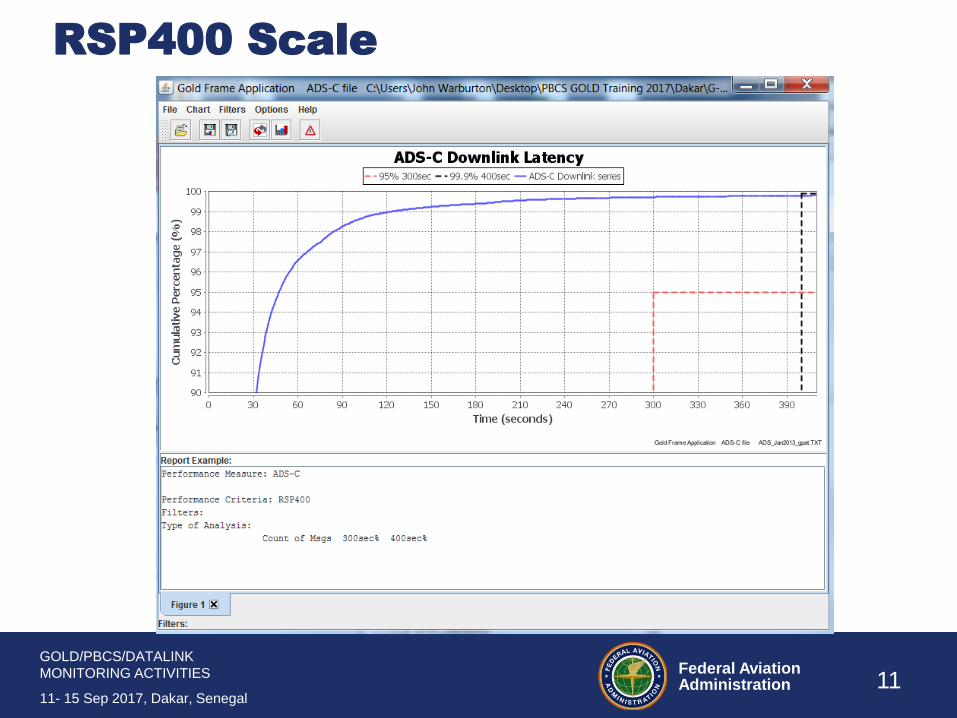
Change the
scale from
240 to 400
“Refresh”
the chart
and select
all data
Change Chart Type
Federal AviationAdministration 11
GOLD/PBCS/DATALINK
MONITORING ACTIVITIES
11- 15 Sep 2017, Dakar, Senegal
RSP400 Scale

Federal AviationAdministration 12
GOLD/PBCS/DATALINK
MONITORING ACTIVITIES
11- 15 Sep 2017, Dakar, Senegal
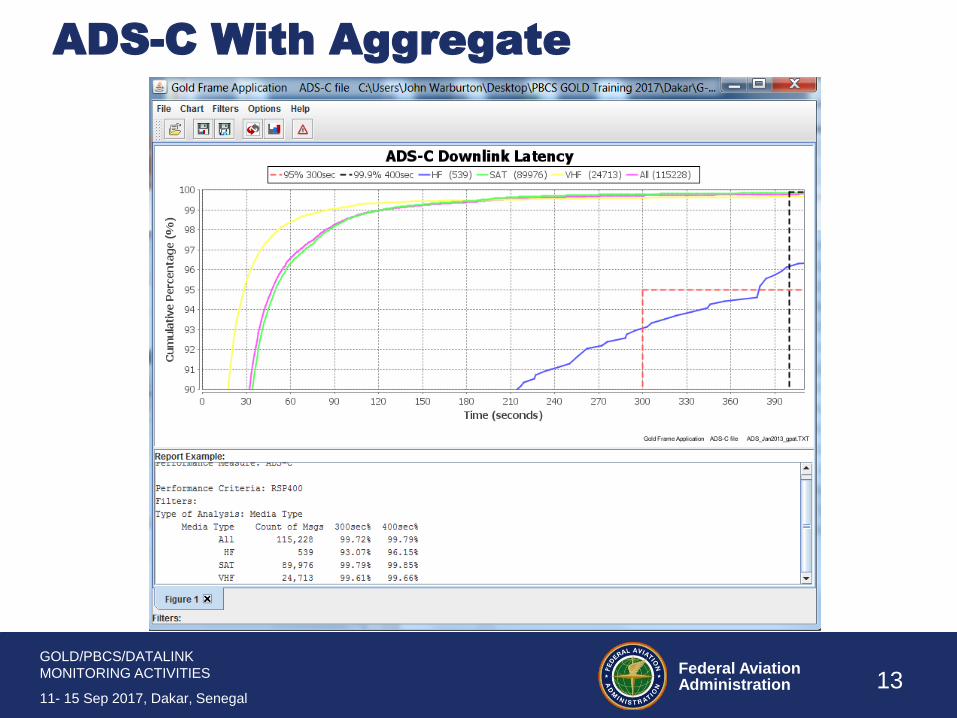
Click Refresh
Click Media Type
Select all three
Click OK
Click Options
Selection
“Add Aggregate on
Chart” and refresh
Separate by Media Type
Federal AviationAdministration 13
GOLD/PBCS/DATALINK
MONITORING ACTIVITIES
11- 15 Sep 2017, Dakar, Senegal
ADS-C With Aggregate
Federal AviationAdministration 14
GOLD/PBCS/DATALINK
MONITORING ACTIVITIES
11- 15 Sep 2017, Dakar, Senegal
If the user would like* to apply any additional filters to the data, the user will select “Filters” from the main toolbar. The following types of filters are available:
• Month
• FIR (flight information region)
• Media Type (SAT, VHF, HF, etc.)
• GES ( ground earth station)
• Operator
• Aircraft Type
*This is useful for limiting the full set of aggregate data
Within the “Filters” pull-down Menu, the number of options available for each filter type within the data set is shown next to the name of each filter type.
Filtering the (loaded) Data
G-PAT Manual Chapter 6

Federal AviationAdministration 15
GOLD/PBCS/DATALINK
MONITORING ACTIVITIES
11- 15 Sep 2017, Dakar, Senegal
If the user would like* to apply any additional filters to the data, the user will select “Filters” from the main toolbar. The following types of filters are available:
• Month
• FIR (flight information region)
• Media Type (SAT, VHF, HF, etc.)
• GES ( ground earth station)
• Operator
• Aircraft Type
*This is useful for limiting the full set of aggregate data
Within the “Filters” pull-down Menu, the number of options available for each filter type within the data set is shown next to the name of each filter type.
Filtering the Data
Federal AviationAdministration 16
GOLD/PBCS/DATALINK
MONITORING ACTIVITIES
11- 15 Sep 2017, Dakar, Senegal
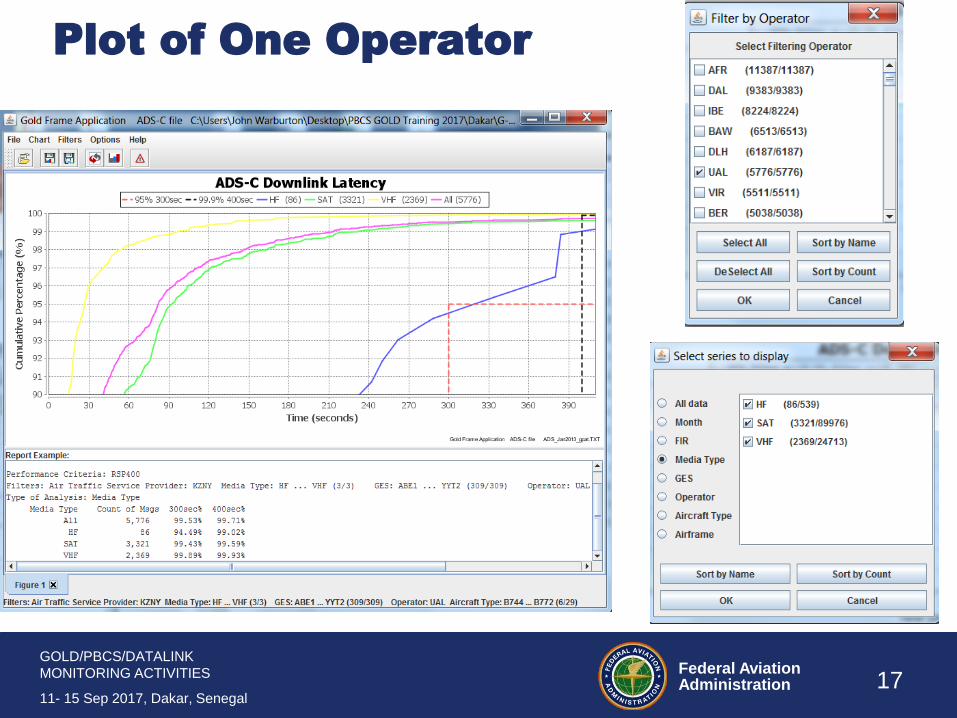
Click Filter
Click Operator
Click “Sort by count”
Click DeSelect All
Click UAL
Refresh Plot (All data)
Refresh Plot (Media Types – Select all three)
• Note the reduced counts
Select Only One Operator
Federal AviationAdministration 17
GOLD/PBCS/DATALINK
MONITORING ACTIVITIES
11- 15 Sep 2017, Dakar, Senegal
Plot of One Operator
Federal AviationAdministration 18
GOLD/PBCS/DATALINK
MONITORING ACTIVITIES
11- 15 Sep 2017, Dakar, Senegal
Click File
Select Open
Double Click file icon next to
RCP_Nov11_gold.txt
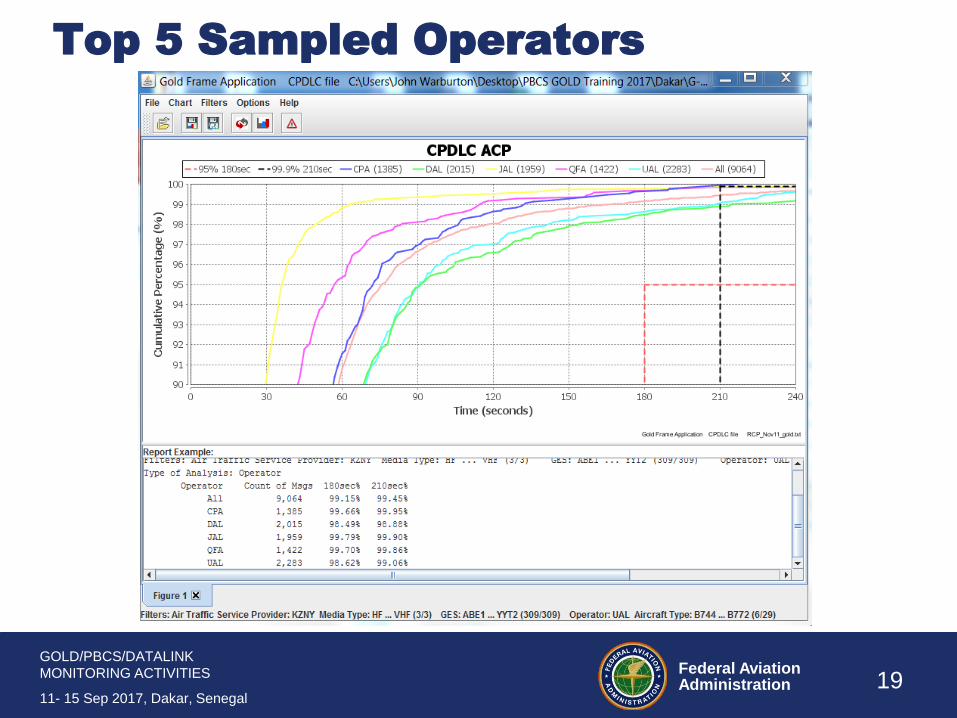
Create a CPDCL ACP CDF using only the
operators with the top 5 most samples
Load New CPDLC Data File
Federal AviationAdministration 19
GOLD/PBCS/DATALINK
MONITORING ACTIVITIES
11- 15 Sep 2017, Dakar, Senegal
Top 5 Sampled Operators
Federal AviationAdministration 20
GOLD/PBCS/DATALINK
MONITORING ACTIVITIES
11- 15 Sep 2017, Dakar, Senegal
Someone Please Request A Plot??
G-PAT provides a stand-alone tool to process
PBCS data files created according to 9869
Appendix D
G-PAT also creates data plots as described in
Appendix D
G-PAT was created to help other monitoring
organization gain experience with PBCS and the
standard analysis plots, so please use it!
Summary and Questions