the future prospect of renewable energy in … · 2017-10-02 · wave energy is as source of power...
TRANSCRIPT

THE FUTURE PROSPECT OF RENEWABLE
ENERGY IN THE MIDDLE EAST
Dr Mohamed Darwish - Brunel University, UK

• Review of renewable energy sources
• Renewable energy in the middle east
• Electric vehicles – future challenges
• Some case studies
• Q & A
Contents:

Renewable Energy Sources
Ocean energy Tidal; waves and currents
Geothermal energy Power plants, direct use, heat pumps
Biomass energy Direct: combustion of biomass
Indirect: chemical conversion to biofuel
Hydro energy
Wind energy
Radiant solar energy Solar heating (passive and active), solar power plants,
photovoltaic cells

Ocean Energy: We can harness energy from
tides, waves and currents
The rising and falling of ocean tides twice each day
Differences in height between low and high tides are especially great in long narrow bays
These areas are best for harnessing tidal energy by erecting dams across the outlets of tidal basins
17-4#

Energy can be extracted from tidal movement

Wave energy
Can be developed at a greater variety of sites than tidal energy
The motion of wind-driven waves at the ocean’s surface is harnessed and converted from mechanical energy into electricity
Offshore or coastal

Wave Energy Devices
Wave energy is as source
of power that comes from
the endless march of the
waves as they roll into
the shore then back out
again. Humans harness
this power along the
coastal regions of the
United States, Canada,
Scotland, and Australia.
Archimedes Wave Swing (AWS)

Ocean currents
Harnesses marine kinetic energy by using the motion of ocean currents, such as the Gulf Stream
Underwater wind turbines have been erected in European waters to test this idea

The machine is made up of connected sections
which flex and bend as waves pass; it is this
motion which is used to generate electricity
Pelamis

Advantages to Ocean Energy
Once you've built it, ocean power is free.
It produces no greenhouse gases or other
waste.
It needs no fuel.
It produces electricity reliably.
Not expensive to maintain.
Tides are totally predictable.
No Damage to Land

Disadvantages to Ocean Energy
Suitable to Certain Locations.
Effect on marine Ecosystem.
Source of Disturbance for Private and
Commercial Vessels.
Noise and Visual pollution.
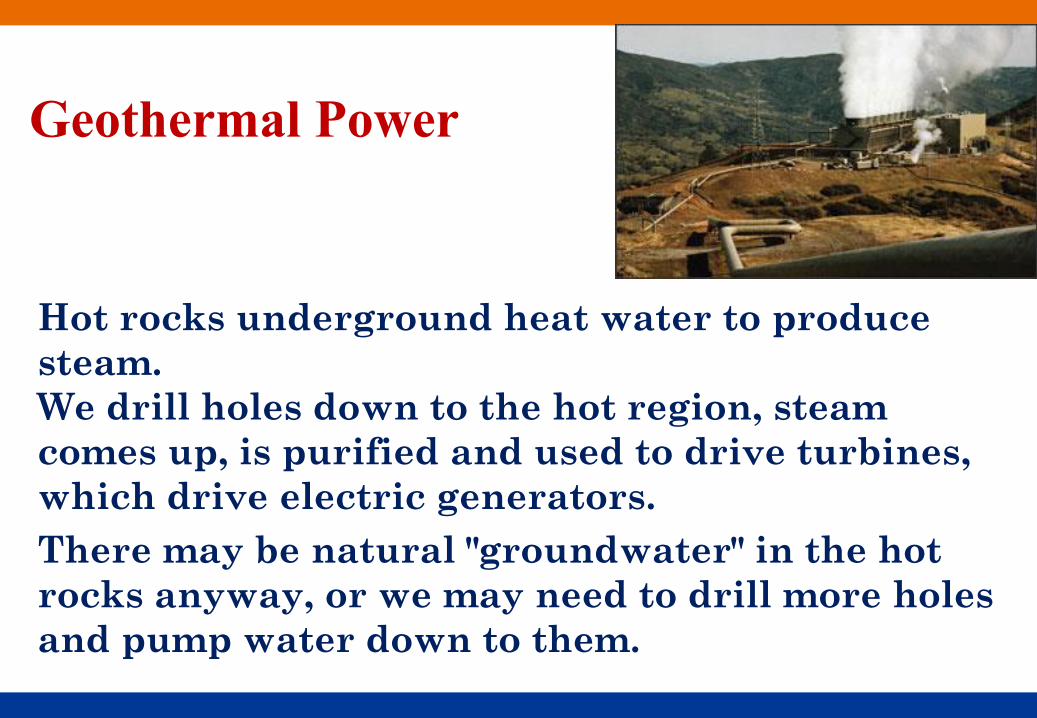
Geothermal Power
Hot rocks underground heat water to produce
steam.
We drill holes down to the hot region, steam
comes up, is purified and used to drive turbines,
which drive electric generators.
There may be natural "groundwater" in the hot
rocks anyway, or we may need to drill more holes
and pump water down to them.

Advantages to Geothermal Power
No fuel is needed.
Once you've built a geothermal power station, the
energy is almost free.
It may need a little energy to run a pump, but this
can be taken from the energy being generated.
Geothermal energy does not
produce any pollution.
The power stations do not take up
much room, so there is not much
impact on the environment.

Disadvantages to
Geothermal Power
The big problem is that there are not many places
where you can build a geothermal power station.
You need hot rocks of a suitable type, at a depth
where we can drill down to them.
Sometimes a geothermal site may "run out of steam",
perhaps for decades.
Hazardous gases and minerals may come up from
underground, and can be difficult to safely dispose
of.

Biomass Energy
Sugar cane is harvested and taken to a mill, where
it is crushed to extract the juice. The juice is used
to make sugar, whilst the left-over pulp, called
"bagasse" can be burned in a power station.
Other solid wastes, can be burned to provide heat,
or used to make steam for a power station.
Plant and animal waste is used
to produce fuels such as
methanol, natural gas, and oil.
We can use rubbish, animal
manure, woodchips, seaweed,
corn stalks and other wastes.

Biomass Energy

Advantages of Biomass
It makes sense to use waste materials
where we can.
The fuel tends to be cheap.
Less demand on the Earth's resources.

Disadvantages of using Biomass
Collecting the waste in sufficient
quantities can be difficult.
We burn the fuel, so it makes greenhouse
gases.
Some waste materials are not available all
year round.

Hydro Energy
A dam is built to trap water, usually in a valley
where there is an existing lake.
Water is allowed to flow through tunnels in the
dam, to turn turbines and thus drive generators.
Hydro-electricity provides 20% of the world’s
power

Hydro power stations

It depends on two deferent levels in the river.
The generating capacity of a hydroelectric plant
is a function of the head and flow rate of water
discharged through the hydraulic turbines.
P = 0.98 Q H
Where: P = power (kilowatts)
= plant efficiency
Q = discharge flow rate (m3/s)
H = head (m)
Hydro power stations

Hydroelectric generating unit may have its shaft
oriented in a vertical, horizontal, or inclined
direction depending on the physical conditions of
the site and the type of turbine applied.

Vertical axial-flow unit
arrangement

Horizontal axial-flow unit
arrangement

Advantages of Hydro Energy
1. Once the dam is built, the energy is virtually free
(running cost is very low because it depends on
water) .
2. The response is very high to supply the sudden
increasing in load.
3. It is clean (no waste or pollution produced) .
4. Efficiency is equal ( 90 : 95 %) .

Disadvantages of Hydro Energy
It has high construction cost.
Building a large dam will flood a very large area
upstream.
Finding a suitable site can be difficult.
Water quality and quantity downstream can be
affected, which can have an impact on plant life.
Constructed far from the loads.
Takes more time to construct.

Wind Energy
We've used the wind as an energy
source for a long time.
The ancient Egyptians and Chinese
were using wind power to pump water
for irrigating crops 4,000 years ago,
and sailing boats were around long
before that.
Wind power was used in the Middle
Ages, in Europe, to grind corn, which
is where the term "windmill" comes
from.

How Wind Power Works
The Sun heats our atmosphere
unevenly, so some patches become
warmer than others.
These warm patches of air rise,
other air blows in to replace them -
and we feel a wind blowing.
We can use the energy in the wind
by building a tall tower, with a
large blades. The wind will push
the blades, transferring some of its
own energy of motion into
electrical energy.

Types of Wind Turbine Generators
generator
full power
Plant
Feeders
ac
to
dc
dc
to
ac
generator
partia l power
PlantFeeders
ac
to
dc
dc
to
ac
generator
Slip power
as heat loss
PlantFeeders
PF controlcapacitor s
ac
to
dc
generator
PlantFeeders
PF controlcapacitor s
Type 1 Conventional Induction Generator (fixed speed)
Type 2 Wound-rotor Induction Generator w/variable rotor resistance
Type 3 Doubly-Fed Induction Generator (variable speed)
Type 4 Full-converter interface

D = 120 m
P = 5 MW
D = 100 m
P = 3.5 MW
D = 85 m
P = 2.5 MW
D = 66 m
P = 1.5 MW
D = 50 m
P = 0.75 MW
D = 10 m
P = 0.15 MW
Wind Turbine Size-Power
Comparison
h = 220 m
D = 164 m
P = 8 MW

Wind speed at hub height (m/s)
Pro
du
ced
pow
er o
f w
ind
tu
rbin
e
(MW
) Power Production of a Typical Wind Turbine

Solar Energy Heating of water
Solar thermal power stations
Photovoltaic

Solar Energy! How effective?
Argument that sun provides power only
during the day is countered by the fact that
70% of energy demand is during daytime
hours.
At night, traditional
methods can be used to
generate the electricity.

Solar Water
Heating
heat from the Sun is
used to heat water in
glass panels on your
roof.
Solar heating is
worthwhile in places
where you get lots of
sunshine.

Solar Water Heating
Indirect
System
Direct
System Active
System (pump)
Passive
System (no
pump)
Integral
Collector Storage
Closed
Loop Thermosyphon
Open
Loop

Active indirect
system
Active direct system

Thermosyphon System

Solar Thermal
Power Stations
Use a huge array of mirrors
to concentrate the Sun's
energy into a small space
and produce very high
temperatures.
Parabolic Panels Compact Linear Fresnel Reflector
(CLFR)

Photovoltaics Best known as a method
for generating electric
power by using solar cells
to convert energy from
the sun into a flow of
electrons by the
photovoltaic effect.
Solar cells produce direct
current electricity from
sunlight which can be
used to power equipment
or to recharge a battery


Copenhagen School uses 12,000 solar tiles and it
provides 300 MWh of electricity per year

PV cells come in different
shapes and types

Concentration Photovoltaics
It uses lenses and curved mirrors to focus sunlight onto
small, but highly efficient, multi-junction (MJ) solar cells

Renewable Energy in the Arab Countries –
Present and Future Challenges

Hydroelectric
(6.14%)
Natural Gas
(32.68%)
Nuclear
(19.5%)
Solar
(0.65%)
Wind
(4.67%)
Geothermal
(0.41%)
Coal
(33.17%)
Other
(2.78%)
Total
4087 TWh
Electricity Generation by Source (2015)

0
5,000,000
10,000,000
15,000,000
20,000,000
25,000,000
30,000,000
List of countries by electricity generation per year
based on multiple sources (2016)
GWh

0
50,000
100,000
150,000
200,000
250,000
300,000
350,000
400,000
List of 10 Arabic countries (in comparison to UK) by electricity
generation per year based on multiple sources (2016)
GWh

Total Capacity of Renewable Energy (2016)
GW
0
300
600
900
Asia Europe N America S America Africa Oceania Middle
East
C America
+ Carib

0
200
400
600
Total Capacity of Renewable Energy – Top 10
Countries (2016)
GW

0
1
2
3
4
Total Capacity of Renewable Energy – Top Arab
Countries (2016)
GW

Renewable and non-renewable power generation:
Installed capacity in Arab countries
Source: Arab Union of Electricity (2015)
Non-Renewable Renewable Total Installed
Capacity

• For every 1degree rise, the panel power will
reduce by 0.5%
• Dust considerably reduces the efficiency as
89%.
Effect of Temperature and Dust on PV
Efficiency
In a sunny winter’s morning, the panels
will actually be more efficient.

Renewable energy projects under construction or planned
in the Arab region

13 partners involved in this project from 6 different countries (Cyprus,
Egypt, France, Greece, Italy and Jordan)
4 demonstrative plants based on concentrating solar collectors for a
total power of about 500 kW
A Case Study Project:
Small Scale Thermal Solar District Units for
Mediterranean Communities (STS-Med)

Small Scale Thermal Solar District Units for Mediterranean
Communities (STS-Med)

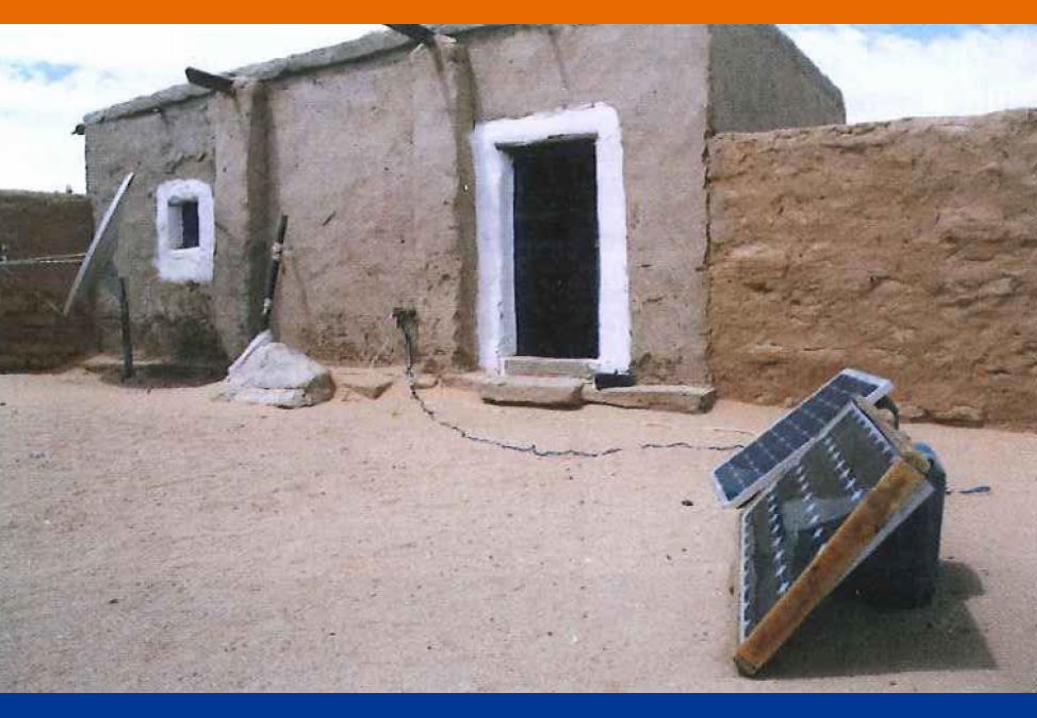
Solar Home System (SHS) - DC
- SHS is small,
independent DC
system
- Most efficient
and economical
system

Solar Home System (SHS) - AC
- AC system is
convenient for
users
- Less efficient and
higher cost than
DC
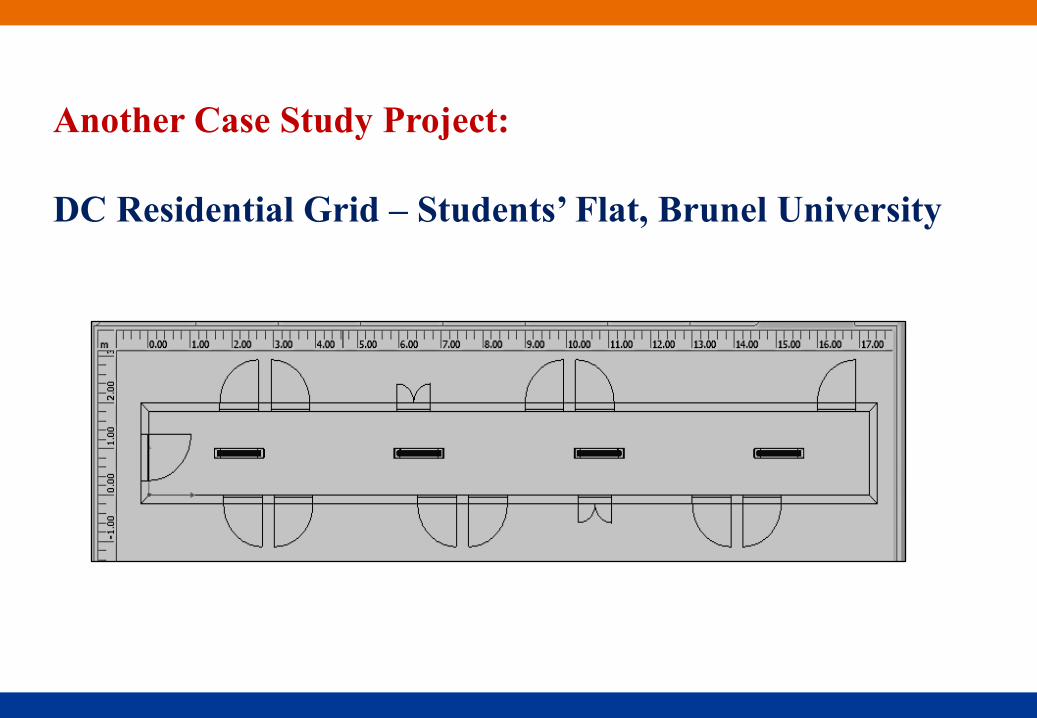
Another Case Study Project:
DC Residential Grid – Students’ Flat, Brunel University

[VA
LU
E]
[VA
LU
E]
0.00
50.00
100.00
150.00
200.00
250.00
300.00
350.00
400.00
450.00
500.00
AC
Supply
DC
Supply
En
erg
y U
sag
e (k
Wh
)
Annually Energy
Usage Per Flat
[VA
LU
E]
[VA
LU
E]
760.000
780.000
800.000
820.000
840.000
860.000
880.000
900.000
920.000
AC
Supply
DC
Supply
En
erg
y U
sag
e (k
Wh
)
Annually Energy
Usage Per Flat
Annual Energy Consumption for
a Lap Top
Annual Energy Consumption 15W
CFL Bulbs

0.00
100.00
200.00
300.00
400.00
500.00
600.00
AC Supply DC Supply
En
erg
y C
ost
(£)
Annually Energy Cost
Annual Cost for a residential flat at Brunel University

Electric Vehicles:
Is it ahead of time or is it time to move ahead?

Electric vehicles can significantly reduce
global and local emissions, but only when
charged from renewable energy sources.
What are the global challenges?
What are the challenges for Arab countries?


1 2 3 4 5 6 7 8 9 10 11 12 1 2 3 4 5 6 7 8 9 10 11 12
Total
Demand
Residential
Demand
Electricity Consumption in a Typical Day
a.m. p.m.

Probabilities of arriving home
throughout a typical weekday

250
0
50
100
150
200
Pow
er (
kW
)
1 2 3 4 5 6 7 8 9 10 11 12 1 2 3 4 5 6 7 8 9 10 11 12
a.m. p.m.
Additional load due to EV charging for a
population of 1262 houses and an
assumed EV take up of 20%.

250
0
50
100
150
200
Pow
er (
kW
)
1 2 3 4 5 6 7 8 9 10 11 12 1 2 3 4 5 6 7 8 9 10 11 12
a.m. p.m.
Peak Shaving

Vehicle To Grid (V2G) Technology

Low Carbon Vehicle Event
6th – 7th September 2017
• The Automotive Council and UK Capabilities
Development
• Electric Vehicle Charging Technology and Market
Trends
• Battery Technologies
• Intelligent Mobility and the Connected Vehicle
Opportunity

Low Carbon Vehicle Event
6th – 7th September 2017

Q:
If electric vehicles become cheaper with time, what
impact will it have on economies of oil-rich
countries of the Middle East? “Newsweek – 30/4/2016”
A:
Devastating, if they don't adapt fast enough and
invest in their future. However, the decline will be
fairly gradual and will take a decade, maybe even
longer.

• It is predicted that huge chunks of the world’s
population will switch to self-drive electric
vehicles (EVs), which are 10 times cheaper to
run than fossil-based cars.
• EVs will have a low maintenance cost and an
expected lifespan of one million miles.
• It has been predicted that there will be no new
petrol or diesel cars, buses or trucks sold
anywhere in the world within the next eight
years.

• This will result in the catastrophic collapse of oil
prices and lead to the devastation of the
petroleum industry as well as automobile
manufacturers who fail to adapt to this
innovative industrial disruption
• The price of crude oil will fall to $25 or even less
per barrel
• Petrol stations will be hard to find and people will
adapt to vehicles on demand rather than owning
vehicles themselves

Oil-producing Arab countries will slide back into
the state of poverty that enveloped them till 1950 as
they have failed to take advantage of the window of
opportunity that history had offered them. Instead
of developing strong knowledge economies like
Korea, Finland and other countries had done, they
have frittered away their wealth on luxuries and
weapons. Tony Seba, Stanford University

Energy Management Central Unit
Smart Meter
DC source (Renewable)
AC source
Energy storage
Energy conversion devices
DC Loads
AC Loads
Energy Management System Modular

References:
⁃ Ibrahim Abdel Gelil, “ENERGY Demand Profile in Arab Countries
– Arab Forum for Environment and Development”, 2016
⁃ Dayal Singh Rajput , K. Sudhakar “Effect Of Dust On The
Performance Of Solar PV Panel”, International Journal of
ChemTech Research CODEN( USA): IJCRGG, 2013
⁃ Iraq Renewable Energy Policy Handbook 2017, Published by
GlobalData, May 2017 ($500)
⁃ RENEWABLE CAPACITY STATISTICS 2017, International
Renewable Energy Agency, 2017.

Thank You M. Darwish