the future of pension systems - european...
TRANSCRIPT
1 Jürgen Kohl October 2003
Eurobaromètre spécial
THE FUTURE OF PENSION SYSTEMS
Fieldwork: September - October 2001
Publication: January 2004
Spe
cial
Eur
obar
omet
er 1
61/
Wav
e 56
.1-
Eur
opea
n O
pini
on R
esea
rch
Gro
up E
EIG
This survey was requested by Directorate General Employment and Social Affairs and coordinated by Directorate General Press and Communication
This document does not represent the point of view of the European Commission.
The interpretations and opinions contained in it are solely those of the authors.
Special Eurobarometer
EuropeanCommission
2
This public opinion survey was carried out at the request of the Directorate-General
Employment and Social Affairs and organised by the Public Opinion Analysis Sector of the
Directorate-General Press and Communication.
It was conducted in all the Member at States of the European Union between September 17
and October 26, 2001, under the general coordination of the European Opinion Research
Group EEIG in Brussels.
The technical specifications, the names of the institutes involved in the research and the
questionnaire are annexed.
The European Commission accepts no liability of any kind arising from this report.
The original language of this report is English.
3
TABLE OF CONTENTS Executive Summary ..........................................................................................................................4 Introduction ....................................................................................................................................12 1. Background characteristics of the pensioner population...........................................................14
1.1. Proportion of pensioners within the European Union.............................................................14 1.2. Retirement age......................................................................................................................16
2. Economic well-being of pensioners............................................................................................18 2.1. Standard of living .................................................................................................................18
2.1.1. Current standard of living............................................................................................18 2.1.2. Expected standard of living .........................................................................................21 2.1.3. Comparison of standard of living before and after retirement.......................................24
2.2. Benefit level of state pensions...............................................................................................26 2.2.1. Pensioners...................................................................................................................26 2.2.2. Non-pensioners ...........................................................................................................28 2.2.3. Aspiration level of future pensioners ...........................................................................30
3. The composition of pensioners’ household income ...................................................................33 3.1. Sources of income for current pensioners ..............................................................................33
3.1.1. Main source of income ................................................................................................33 3.1.2. The second most important source of income ..............................................................36
3.2. Expected sources of income for future pensioners .................................................................36 3.3. Preferred sources of income for pensioners ...........................................................................40
4. Goals and principles of pension systems....................................................................................44 4.1. Goals ....................................................................................................................................44
4.1.1. Prevention of poverty in old age..................................................................................44 4.1.2. Maintaining an adequate standard of living..................................................................46 4.1.3. Reducing social inequalities amongst elderly...............................................................48
4.2. Principles..............................................................................................................................50 4.2.1. Basic social right.........................................................................................................50 4.2.2. Universality ................................................................................................................52 4.2.3. Equivalence ................................................................................................................54
5. Opinions on current policy proposals........................................................................................57 5.1. Direct changes in parameters of pension systems ..................................................................57
5.1.1. Maintaining benefit levels by increasing contribution rates and/or taxes ......................58 5.1.2. Reducing benefit levels in order to maintain contribution rates ....................................60 5.1.3. Raising the age of retirement .......................................................................................62
5.2. Indirect changes in parameters of pension systems ................................................................64 5.2.1. Cutting expenditures in other policy areas ...................................................................64 5.2.2. Fighting unemployment ..............................................................................................66 5.2.3. Increasing labour force participation............................................................................68 5.2.4. Increasing immigration of foreigners ...........................................................................70
6. Opinions on transition from work to retirement ......................................................................73 6.1. Gradual retirement ................................................................................................................73 6.2. Fixed retirement age .............................................................................................................75 6.3. Influence of retirement age on pension benefits.....................................................................77 6.4. Incentives to retire later ........................................................................................................80
Conclusions .....................................................................................................................................83 Annexes ..........................................................................................................................................86 Annex I: English questionnaire.....................................................................................................87 Annex II : Technical specifications ............................................................................................102 Annex III : List of charts ............................................................................................................104 Annex IV : List of tables ............................................................................................................107
4
EXECUTIVE SUMMARY
Pension reform is currently on the agenda of many national governments and parliaments in the
European Union. While mass unemployment and sluggish economic growth have short-term
effects on the balances of revenues and expenditures of pension schemes (as well as on social
protection schemes in general), longer term structural problems are posed by the shifting
demographic structure (the ageing process) in advanced societies and by increasing life
expectancy. Changes in family structures and in patterns of labour force participation as well as
in working time arrangements and working conditions create additional challenges.
Public acceptance of reform measures is a crucial condition for social policy reform efforts.
Therefore, a comparative cross-national survey on the opinions and attitudes of EU citizens
about pension issues was set up. The survey seeks an answer to the questions such as whether
citizens’ opinions on pension issues vary as much as the existing pension systems in the
member countries do and whether there is a growing awareness of common problems and a
similarity of envisaged solutions to these problems.
This executive summary reflects the views of the EU citizens about pension issues which were
gathered between 17 September and 26 October 2001. Views are assessed across the European
Union and results are presented according to results at EU level and country level.
The present generation of pensioners does not perceive their living standard as
substantially lower than that of the working-age population.
The perception of current living standards is very similar among pensioners and people of
working age. Half of the working-age population describes their present standard living as
average, and 25% as being positive. Amongst pensioners, the percentages of those who describe
their situation as average or positive are only slightly smaller.
However, considerable cross-national differences can be observed concerning the perception of
the present living standards. Pensioners in the Netherlands, Luxembourg, the United Kingdom,
Ireland, Denmark and Greece view their current standard of living much more favourable than
the EU citizens at large. In Portugal, 46% of the citizens describe their living standard as
negative.
5
These differences may be partly due to differences in the general level of economic wealth and
prosperity of countries and their economic performance in recent years. But partly, they are
certainly also due to widely differing institutional arrangements for social security in old age
and, hence, to differences and deficits in the social protection systems of the member states.
For the overwhelming majority of the present generation of pensioners, state or public
pensions constitute the most important source of income.
78% of the pensioners report that state or public pensions are their main source of income.
Other types of income only represent the main source of income for small minorities of
pensioners: for 8% the main income source is occupational pensions, for an additional 3% it is
personal pensions and even fewer pensioners report another main source such as other social
and private transfers, returns from savings or real estate or continued earnings.
There are some major cross-national differences in the main source of income. In Greece, 96%
of the pensioners report that the compulsory state or public pension is their main source of
income. In Finland, on the other hand, the smallest proportion of respondents (12%) says that a
state pension is their main source of income. Finland is the only European Union country where
respondents indicate occupational pensions as the main source of income for current pensioners.
However, this is due to the perception of the statutory earnings-related pension schemes as
occupational schemes.
The current working-age population is more skeptical than the current pensioners
regarding the benefit level of the state pension.
Half of the pensioners report that they do not experience problems getting by with their current
state pension benefit, while only 21% of the working-age population expect not to have
problems.
The aspiration level seems to be quite high. When asked what income replacement level they
would consider sufficient, 53% of respondents would only consider a net income replacement
level of 70% or more as sufficient for the retirement phase; another 16% say they would need
50%-70% of their pre-retirement income, but only 2% can imagine considering an income
6
replacement level of less than 50% as sufficient. However, almost one third of the respondents
could not give a clear indication of what income level they would consider sufficient. As the
respondents come closer to retirement age, the aspiration level drops: around 60% of the
respondents aged 25-54 years consider a net income of 70% or more as sufficient versus 52% of
the non-pensioners older than 55 years.
For future pensioners, state or public pensions are expected to remain the most important
source of income.
61% of the future pensioners expect that state or public pensions will be their main source of
income after retirement. Private pension plans (10%) and occupational schemes (9%) are
expected, by the present working-age population, to gain importance.
In all countries, the current working-age population expects the importance of state or public
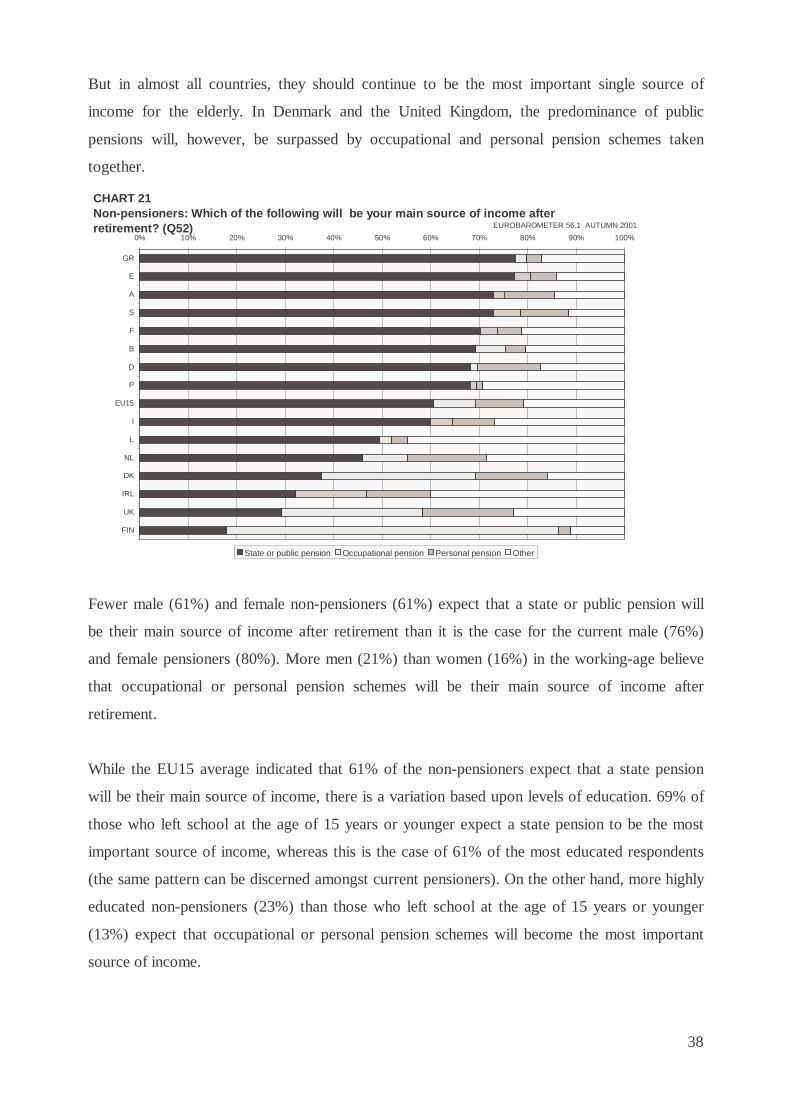
pensions to diminish. But in almost all countries, they should continue to be the most important
single source of income for elderly. In Denmark and the United Kingdom, the predominance of
public pensions is, however, expected to be surpassed by occupational and personal pension
schemes taken together.
Non-pensioners would like occupational pension schemes to play a substantial larger role
than that they will probably play in the future.
The non-pensioners were asked how pension benefits should be provided. A majority of the
non-pensioners (56%) shares the opinion that it should mainly be provided by public pension
schemes, while 61% expect these to be the main source of income after retirement.
Substantially more non-pensioners, albeit still a minority, (23%) would like occupational
pension schemes to play a larger role than they will probably play in the future (9% expect them
to play a larger role). Conversely, they would ascribe a smaller role to private arrangements
(8%) than they expect them to play in the future (10%).
In almost all countries non-pensioners desire that public or state pensions are the most
important single source of income for the elderly. Only the Finnish, Dutch, Danish and German
7
non-pensioners desire that occupational and personal pensions (taken together) get more
importance than state or public pensions.
There seems a broad consensus amongst European citizens concerning the goals of
pension policies and even about the prioritisation of certain goals.
92% of the EU citizens agree with the statement that “the primary goal of a good pension
scheme should be to protect elderly against the risk of poverty”. The proportion of people who
agree with the statement that stresses the social protection function ranges from 96% in Greece
to 85% in Austria. Greece is followed by Italy (95%), France and Denmark (94% each).
88% of the citizens demand that “a good pension system should allow everybody to maintain an
adequate standard of living relative to their income before retirement”. The support for this
statement ranges from 93% in Greece to 83% in Denmark and is especially strong in countries
like Greece, France, Ireland, Denmark and the UK: more than nine out of ten respondents agree
with it.
84% support that “a good pension system should contribute to greater equality in income and
living conditions amongst the elderly”. The support is also high, although somewhat less than
the first two goal statements and ranges from 91% in Portugal to 78% in Denmark. In Portugal,
Greece and Ireland more than 90% of the respondents agree that a good pension system should
contribute to greater equality in income and living conditions amongst the elderly.
These findings may be good news for the prospects of European social policy. They are
evidence that the value orientations and the social policy attitudes of citizens in the EU member
countries do not fall as far apart as the institutionalised forms of social security do (especially in
the field of pensions). In other words: for historical reasons, pension systems in the various
European countries have developed in very different ways and have exhibited few signs of
convergence in institutional terms. But there seems to be a great deal of consensus at the level
of citizens’ expectations and evaluations of what constitutes a good pension system.
8
Almost all respondents endorse the basic social right principle of pensions.
92% of the EU citizens agree with the statement that “a guaranteed minimum pension should be
a basic social right of every citizen”. With regard to this statement, the cross-national
differences vary between 96% in Greece and 85% in Austria.
In order to achieve the broad goal of adequate living standards, it seems justified to
deviate from the (pure) equivalence principle and to allow for a moderate “solidaristic”
redistribution of income.
A substantially lower number of citizens (56%) agree with the statement that “the amount of
one’s pension should be strictly based on the amount of contributions one has paid into the
pension scheme”. But a larger number of citizens (82%) agree with the view that "people who
cannot pay sufficient contributions into a pension scheme" should be supported by the state.
In all countries a larger proportion of citizens agree with the “solidaristic” redistribution of
income than with the strict equivalence principle. Germany is the only exception in this regard:
German citizens put more emphasis on the equivalence principle than on the “solidaristic”
redistribution of income.
Maintaining current pension levels “even if this means raising taxes or contributions”
gains the broadest support, while raising the age of retirement “so that people work
longer and therefore spend less time in retirement” proves to be least popular in almost all
EU member states.
Of the three alternatives that have a direct influence on the parameters of pension systems,
“maintaining pension levels, even if this means raising taxes and contributions” gains strongest
support: 69% of the EU citizens agree. The support is the strongest in Denmark and Finland,
where four out of five respondents agree with the statement. One out of three Greek respondents
tend to disagree compared to an EU15 average of 20%.
In contrast to the first policy option, the second option “not raising contribution rates, even if
this means lower pension levels" is supported by only 31% of citizens. Moreover, it does not
9
win the approval of more than 40% of respondents in any of the member countries. Dutch and
Danish respondents are fiercely against this statement: two out of three respondents tend to
disagree compared with an EU15 average of 53%.
The third alternative, namely "raising the age of retirement", is even less popular amongst
European citizens than the prospects of lower pension levels. It is favoured by only 23%.
Moreover, it does not win the approval of more than 30% of the respondents in any of the
member countries, except in Ireland. Ireland stands out with more respondents in favour of
raising the retirement age (41%) than reducing benefit levels in order to maintain contribution
rates (31%).
We interpret these findings as evidence of a fairly strong normative consensus throughout
Europe concerning the main alternative options for responding to the challenges posed by the
demographic shifts in Western Europe. This fact illustrates the difficult trade-offs that need to
be dealt with by decision makers throughout the EU. The full costs of the policy options that are
preferred by citizens are not yet correctly perceived by the public. Yet, many recent reform
measures undertaken by national governments are at odds with the order of preferences as
revealed by this survey.
Employers should not discriminate against older workers, but continue to invest in the re-
organisation of work arrangements and (the adaptation of) their qualifications
Age discrimination in the form of excluding workers above a certain age from the labour market
through mandatory retirement remains still widely accepted by public opinion. Under the
currently prevailing labour market conditions of high mass unemployment, a majority (57%) of
the citizens in the EU support the view that older workers should be forced to retire at a fixed
age.
However, there are considerable cross-national variations in this respect. In Greece (93%) and
Portugal (79%) more than three quarters of citizens agree with the proposal. Denmark is at the
other end of the spectrum with fewer than one fifth (19%) of citizens supporting a mandatory
retirement age.
10
The support for a fixed retirement age contrasts, however, with the desire for more individual
flexibility. 75% of the EU citizens support the statement that older workers should be allowed
to retire gradually from work. So, it is important that employers adapt working conditions to the
individual needs and circumstances of older workers by providing more opportunities for part-
time work and gradual retirement.
Looking at the member states country by country, the proportion of respondents agreeing with a
gradual retirement ranges from 95% in Denmark to 56% in Italy. Apart from these extreme
cases, the proportion is 10 percentage points or more above the EU15 average (74%) in Finland,
Sweden, the Netherlands and Germany and 10 percentage points below the average in Greece.
Furthermore, working arrangements should be made more attractive to older workers, in order
to induce them to extend their working life voluntarily, by positive incentives rather than by the
promise of increased pensions alone. The statement that older workers should be helped to stay
in the labour market by being offered the same access to training as younger workers was
generally supported (56%) – particularly among the British, Finnish and Danish respondents
(73%).
Actuarial incentives for prolonging working lives receive only half-hearted support.
Two statements submitted to respondents can be interpreted as indicators of the degree to which
the (insurance) principle of equivalence is supported amongst the citizens. These two statements
are: “older workers who retire early should accept a reduced pension” and “someone who
retires after the normal retirement age should receive a higher pension”. The results of the
survey show, however, that for the European Union as a whole, not more than half of the
respondents support these statements. Slightly more citizens disagree (49%) with benefit cuts in
the case of early retirement, compared to a proportion of citizens who agree of 43%. The
opinions are equally split (45% agree and 46% disagree) with regard to higher benefits for those
who are willing to work beyond normal retirement age.
However, significant national differences are masked by the EU average. In only five countries,
more than half of the respondents agree with both statements: Greece, Luxembourg, Austria,
Sweden and Germany.
11
Differences in opinions about transitions from work to retirement seem to reflect labour
market conditions.
There are quite substantial cross-national differences in patterns of opinion concerning the
conditions for the transition from work to retirement. These may reflect differences in the actual
labour market situation in the various countries and/or the specific social policy arrangements in
the respective country. For example: if unemployment is high amongst younger workers, this
may give added support to the view that “people in their late 50’s should give up their work to
make way for younger and unemployed people”. Conversely, if there is a shortage of labour in a
country, it seems more reasonable that “older workers should be helped to stay in the labour
market”. In other words: if the labour market situation changes, this will alter the plausibility of
‘adequate’ policy responses. The difference to the “cultural explanation” lies in the assumption
that it is not the value orientation per se, but the (macro) social context, which shapes the
popular support for various policy proposals.
12
INTRODUCTION
Pension reform is currently on the agenda of many national governments and parliaments in the
European Union. While mass unemployment and sluggish economic growth have short-term
effects on the balances of revenues and expenditures of pension schemes (as well as on social
protection schemes in general), longer term structural problems are posed by the shifting
demographic structure (the ageing process) in advanced societies and by increasing life
expectancy. Changes in family structures and in patterns of labour force participation as well as
in working time arrangements and working conditions create additional challenges.
In recent years, pensions policy has also increasingly become an area of common concern for
EU policy and it was decided to apply the “open method of coordination (OMC)” in the area of
pensions. The underlying assumption is that in view of similar demographic, economic and
social challenges and pressures, national pension reform efforts should be guided by and
directed towards a common set of goals agreed at EU level.
For almost all social policy reform efforts, public acceptance of reform measures seems to be a
crucial condition. First, it is a crucial element of mobilizing the political support to get reform
proposals enacted. And second, it is of crucial importance for the long-term sustainability of
pension schemes that the basic principles of existing schemes are in accordance with the basic
value orientations and beliefs (normative interpretations) of the citizens.
Against this background, a comparative cross-national survey on the opinions and attitudes of
the EU citizens about pension issues promises to yield important information for the policy-
making process, at the national and at the EU level. Usually, the main actors involved in the
policy-making process – apart from the politicians themselves – are professional experts:
lawyers, economists, and social administrators with much expertise in their respective fields.
Much of the current reform discussion is focusing on the fiscal implications and economic
effects of certain reform proposals. From such a fragmented and biased decision-making
process, however, the danger arises that the social effects, in particular the distributional
consequences of reform proposals with regard to the (objective) living conditions and economic
well-being of social classes and other social groups (by gender, age, occupational status etc.) are
lost sight of. Moreover, if “social security” is at stake and is taken seriously, the “subjective
dimension” of social security, the citizens’ views and perceptions of their situation should not
be neglected.
13
Which are the expectations of the citizens concerning a ‘good’ or ‘fair’ pension system? Which
goals are to be attained? Which are the underlying concepts of social justice? How do citizens
evaluate their present situation and their future prospects? What is their opinion on current
reform proposals, e.g. the acceptable level of benefits and of contributions, or the adequate
retirement age?
From an EU perspective, probably the most interesting question is whether citizens’ opinions on
pension issues vary as much as the existing pension systems in the member countries do, or
whether there is a growing awareness of common problems and a similarity of envisaged
solutions to these problems. Answers to these questions are relevant for assessing the prospects
of a common EU pension policy.
These are just a few questions about which not very much is empirically known, at least not in a
systematic and comparative way for all EU countries. The Eurobarometer survey 56.1 has
aimed at filling these gaps. It covers a broad range of issues and aspects relevant to pension
policy:
• perceptions of present and future living standards of pensioners,
• data on the income composition of pensioner households,
• opinions on goals and principles of pension systems (and the underlying value
orientations),
• opinions on more specific policy proposals to cope with the problems of financing
pensions, and
• opinions on the transition from work to retirement.
•
The following chapters summarize and highlight some of the most interesting findings.
14
1. Background characteristics of the pensioner population
This first chapter of the report describes the pensioner population. Two main characteristics are
discussed: the proportion of pensioners in the European Union population older than 15 years
(1.1.) and the retirement age of pensioners (1.2.). Besides the age at which the current
generation of pensioners retired, this chapter also consider the age at what the working-age
population intends to retire.
1.1. Proportion of pensioners within the European Union
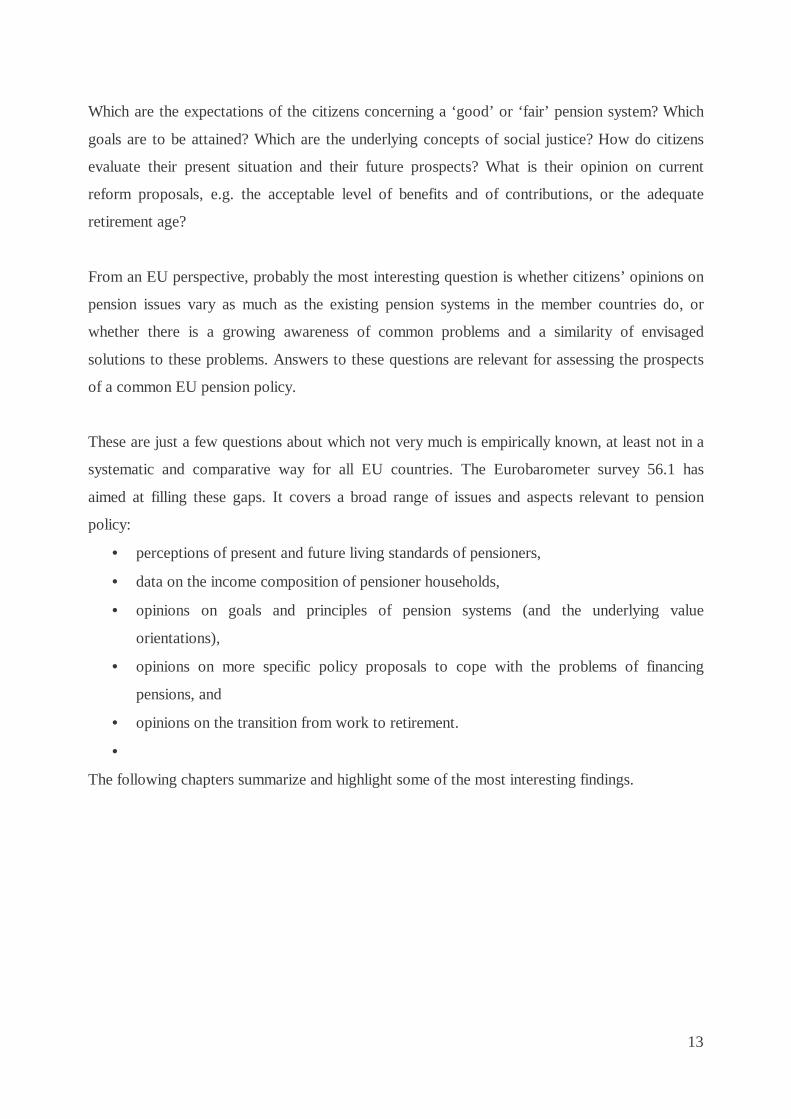
Currently, almost one in four adult citizens in the EU (23%) defines him or herself as a
pensioner (“retired or unable to work through illness”). There is no remarkable difference
between men and women: 23% of men report being retired, while 24% of women do.
Looking at the member states, country by country, the percentage of pensioners ranges from
14% in Ireland to 28% in the United Kingdom. Apart from these extreme cases, the share of
pensioners in the adult population is below 20% in Portugal, Spain, Luxembourg and the
Netherlands and above 25% in Denmark, Belgium, Sweden, Italy, and Greece.
CHART 1What is your current occupation? (D15A)
28
27
27
26
25
25
24
24
23
23
22
19
18
17
15
14
0% 5% 10% 15% 20% 25% 30%
UK
GR
I
S
B
DK
A
FIN
EU15
D
F
P
E
L
NL
IRL
Retired
EUROBAROMETER 56.1 AUTUMN 2001
15
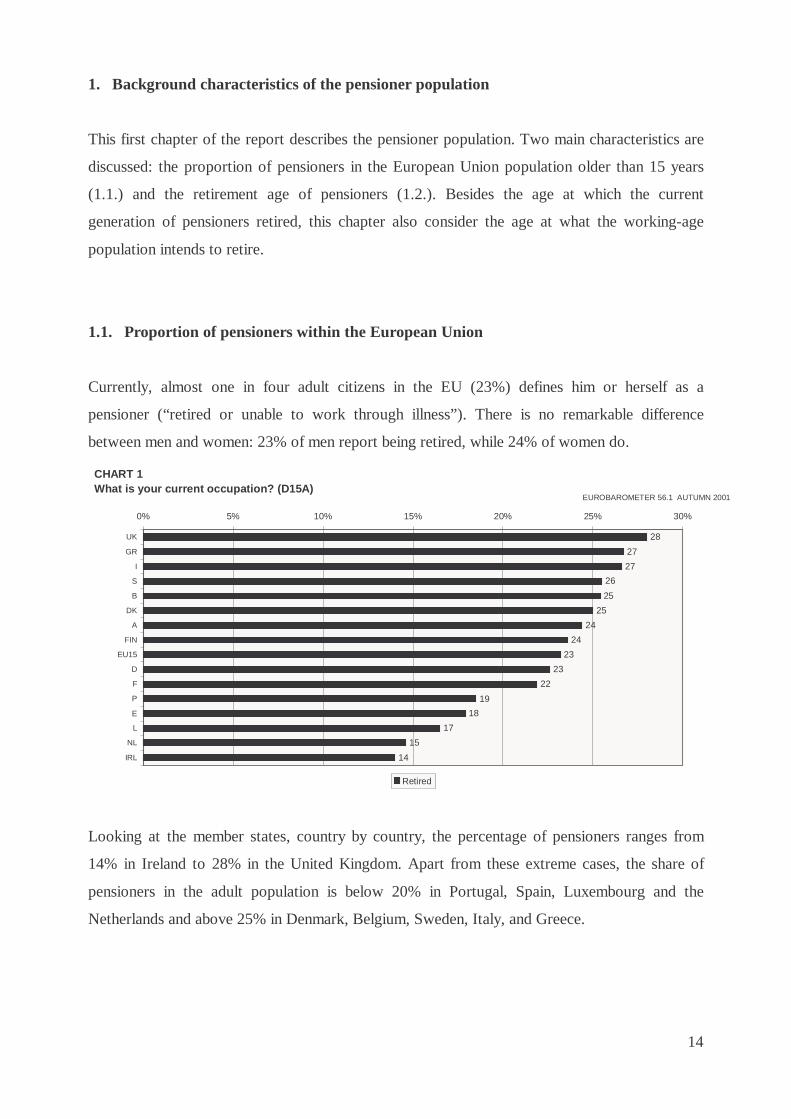
Almost half of the pensioners (48%) were involved in manual work before they retired and 1
out of 10 pensioners never did any paid work.
CHART 2Pensioners: What was your last occupation before retirement? (D15B)
16
48
10
14
12
0 % 5 % 10 % 15 % 20 % 25 % 30 % 35 % 40 % 45 % 50 %
self-employed
managers
other white collars
manual workers
never did any paid work
EUROBAROMETER 56.1 AUTUMN 2001
16
1.2. Retirement age
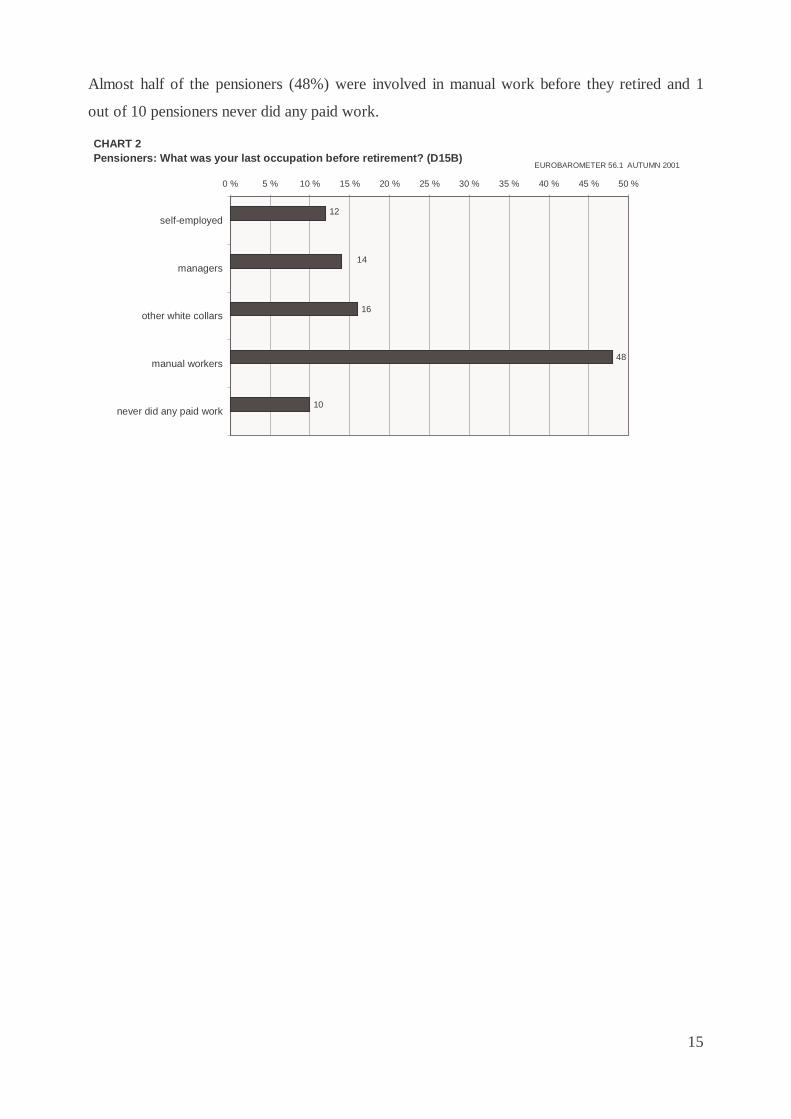
The reported EU average retirement age of the current generation of pensioners (Q49) is 59.4
years. It is more than one year above the EU average in the Netherlands (61.7 years), Ireland
(61.4 years), Sweden (60.6 years), Spain (60.6 years), and Finland (60.5 years). And it is more
than one year below the EU average in Portugal (56.9 years), Austria (57.2 years), Italy (57.9
years) and Luxembourg (58.2 years).
The age when the present working-age population intends to retire (Q48) is on average 60.3
years, i.e. about one year later than in the present generation of pensioners. While in 10
countries (DK, D, GR, E, I, NL, A, P, S, UK), it is anticipated that future pensioners will have
to retire later than the present generation; people in 5 countries (B, F, IRL, L, FIN) intend to
retire even earlier than the present generation of pensioners.
Both female and male respondents intend to retire later than it is currently the case. Men intend
to work 1.1 year longer than today while women intend to retire only 0.8 year later than the
current generation of female pensioners.
CHART 3Pensioners: At what age did you retire? (Q49)Non-pensioners: At what age do you intend to retire? (Q48)
61.4
57.2
60.6
61.757.9
60.5
59.459.9
58.458.8
60.260.1
58.2
58.7
60.6
56.960.9
58.2
58.8
62.1
62.9
61.3
60.4
60.4
59.0
61.2
57.1
60.460.3
60.3
60.1
59.9
53 y. 54 y. 55 y. 56 y. 57 y. 58 y. 59 y. 60 y. 61 y. 62 y. 63 y.
DK
E
S
NL
I
P
IRL
FIN
EU15
D
GR
UK
A
F
B
L
Current retirement age (pensioners) Intended retirement age (non-pensioners)
EUROBAROMETER 56.1 AUTUMN 2001
17
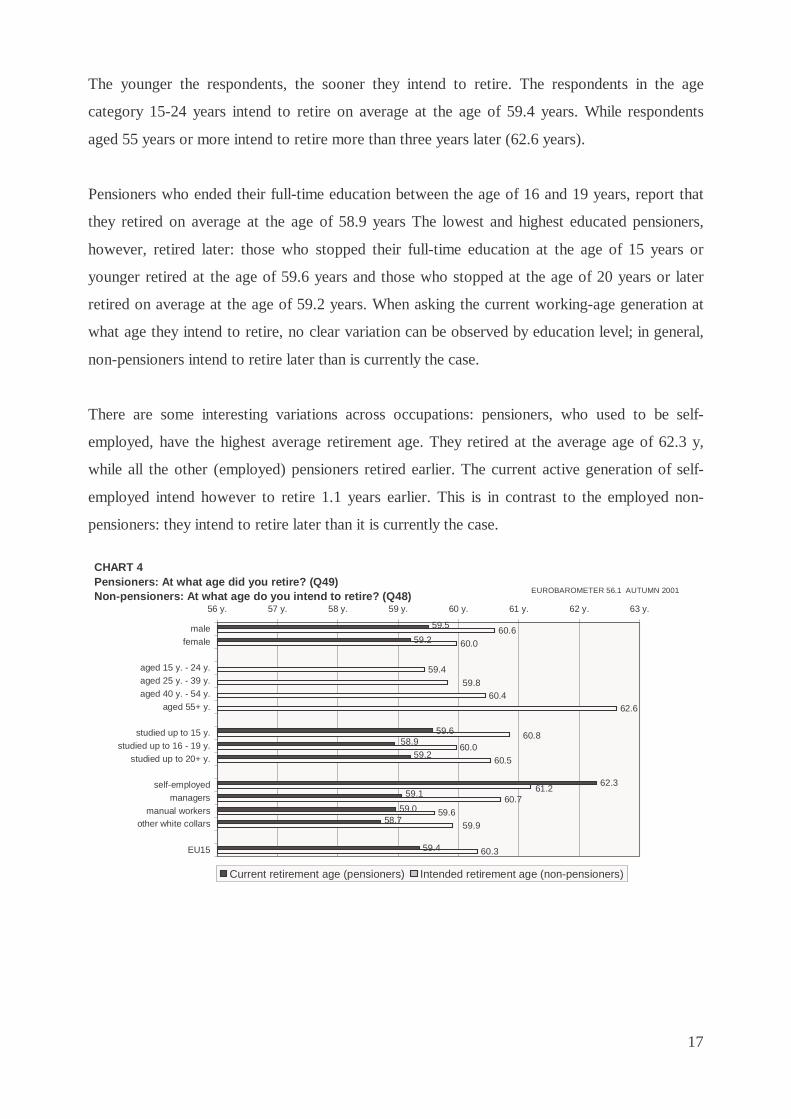
The younger the respondents, the sooner they intend to retire. The respondents in the age
category 15-24 years intend to retire on average at the age of 59.4 years. While respondents
aged 55 years or more intend to retire more than three years later (62.6 years).
Pensioners who ended their full-time education between the age of 16 and 19 years, report that
they retired on average at the age of 58.9 years The lowest and highest educated pensioners,
however, retired later: those who stopped their full-time education at the age of 15 years or
younger retired at the age of 59.6 years and those who stopped at the age of 20 years or later
retired on average at the age of 59.2 years. When asking the current working-age generation at
what age they intend to retire, no clear variation can be observed by education level; in general,
non-pensioners intend to retire later than is currently the case.
There are some interesting variations across occupations: pensioners, who used to be self-
employed, have the highest average retirement age. They retired at the average age of 62.3 y,
while all the other (employed) pensioners retired earlier. The current active generation of self-
employed intend however to retire 1.1 years earlier. This is in contrast to the employed non-
pensioners: they intend to retire later than it is currently the case.
CHART 4 Pensioners: At what age did you retire? (Q49)Non-pensioners: At what age do you intend to retire? (Q48)
59.4
58.759.0
59.162.3
59.258.9
59.6
59.2
59.5
60.3
59.959.6
60.7
60.5
61.2
60.060.8
62.660.4
59.8
59.4
60.060.6
56 y. 57 y. 58 y. 59 y. 60 y. 61 y. 62 y. 63 y.
malefemale
aged 15 y. - 24 y.aged 25 y. - 39 y.aged 40 y. - 54 y.
aged 55+ y.
studied up to 15 y.studied up to 16 - 19 y.
studied up to 20+ y.
self-employedmanagers
manual workersother white collars
EU15
Current retirement age (pensioners) Intended retirement age (non-pensioners)
EUROBAROMETER 56.1 AUTUMN 2001
18
2. Economic well-being of pensioners
This second chapter consist of two main parts.
In the first part the standard of living of pensioners and non-pensioners is discussed.
Successively the focus is set on the current standard of living of pensioners and non-pensioners
(2.1.1.), the standard of living both pensioners and non-pensioners expect to have in the future
(2.1.2.) and the difference in standard of living pensioners experienced before and after
retirement (2.1.3.)
The second part covers the benefit level of state pensions. It answers the question “How the
state pension allows the pensioners to get by” (2.2.1). Besides, attention is given to how the
current working-age population expects to get by with the state pension they will receive in the
future (2.2.2.). The last part of this chapter discusses the level of income replacement the
current working-age population desires to have after retirement (2.2.3.).
2.1. Standard of living
2.1.1. Current standard of living
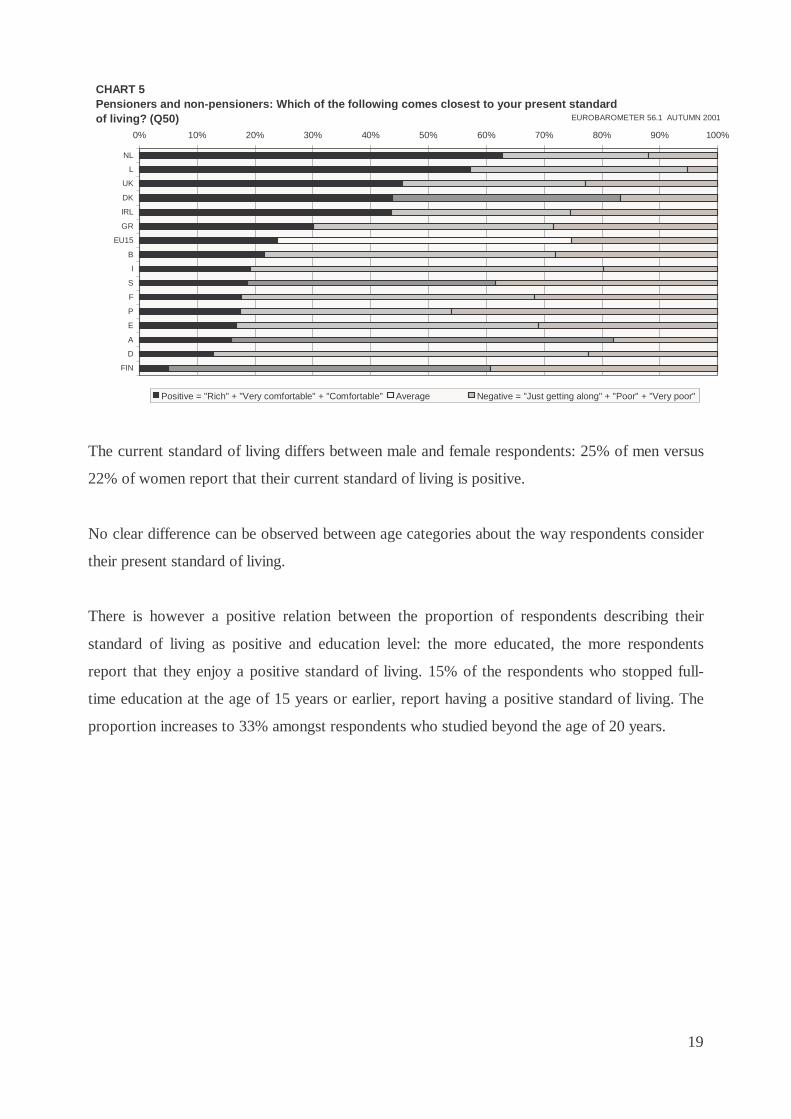
When asked to assess their present standard of living (Q50), about half of EU citizens describe
it as “average”, about one fourth as being positive1 and another quarter as being negative2.
However, there are considerable cross-national variations in this respect. Citizens in the
Netherlands, Luxembourg, the United Kingdom, Ireland, Denmark and Greece view their
current standard of living much more favourably than the EU citizens at large, while in
Germany and Austria about two thirds of the population cluster in the “average” category. In
Portugal 46% of the citizens describe their living standard as negative.
1 In this section a positive standard of living refers to the sum of the categories “rich”, “very comfortable” and “comfortable”. 2 In this section a negative standard of living refers to the sum of the categories “just getting along”, “poor” and “very poor”.
19
The current standard of living differs between male and female respondents: 25% of men versus
22% of women report that their current standard of living is positive.
No clear difference can be observed between age categories about the way respondents consider
their present standard of living.
There is however a positive relation between the proportion of respondents describing their
standard of living as positive and education level: the more educated, the more respondents
report that they enjoy a positive standard of living. 15% of the respondents who stopped full-
time education at the age of 15 years or earlier, report having a positive standard of living. The
proportion increases to 33% amongst respondents who studied beyond the age of 20 years.
CHART 5Pensioners and non-pensioners: Which of the following comes closest to your present standard of living? (Q50)
0% 10% 20% 30% 40% 50% 60% 70% 80% 90% 100%
NL
L
UK
DK
IRL
GR
EU15
B
I
S
F
P
E
A
D
FIN
Positive = "Rich" + "Very comfortable" + "Comfortable" Average Negative = "Just getting along" + "Poor" + "Very poor"
EUROBAROMETER 56.1 AUTUMN 2001
20
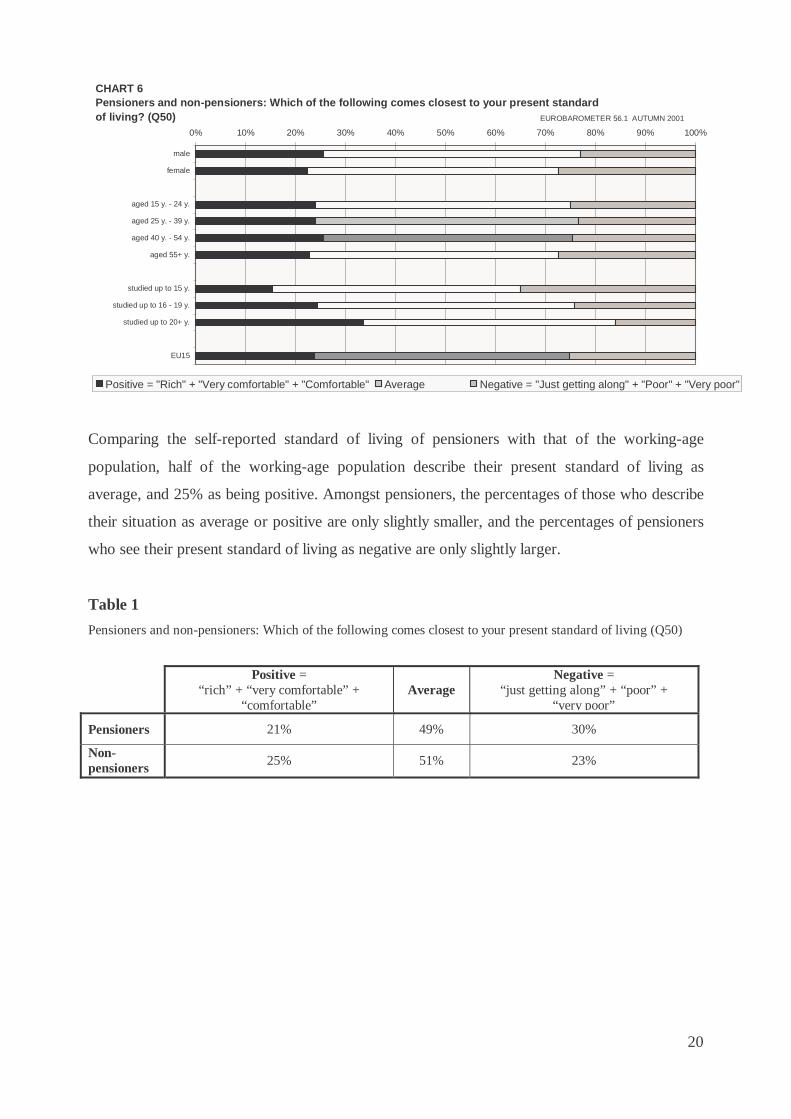
Comparing the self-reported standard of living of pensioners with that of the working-age
population, half of the working-age population describe their present standard of living as
average, and 25% as being positive. Amongst pensioners, the percentages of those who describe
their situation as average or positive are only slightly smaller, and the percentages of pensioners
who see their present standard of living as negative are only slightly larger.
Table 1
Pensioners and non-pensioners: Which of the following comes closest to your present standard of living (Q50)
Positive =
“rich” + “very comfortable” + “comfortable”
Average Negative =
“just getting along” + “poor” + “very poor”
Pensioners 21% 49% 30%
Non-pensioners 25% 51% 23%
CHART 6Pensioners and non-pensioners: Which of the following comes closest to your present standard of living? (Q50)
0% 10% 20% 30% 40% 50% 60% 70% 80% 90% 100%
male
female
aged 15 y. - 24 y.
aged 25 y. - 39 y.
aged 40 y. - 54 y.
aged 55+ y.
studied up to 15 y.
studied up to 16 - 19 y.
studied up to 20+ y.
EU15
Positive = "Rich" + "Very comfortable" + "Comfortable" Average Negative = "Just getting along" + "Poor" + "Very poor"
EUROBAROMETER 56.1 AUTUMN 2001
21
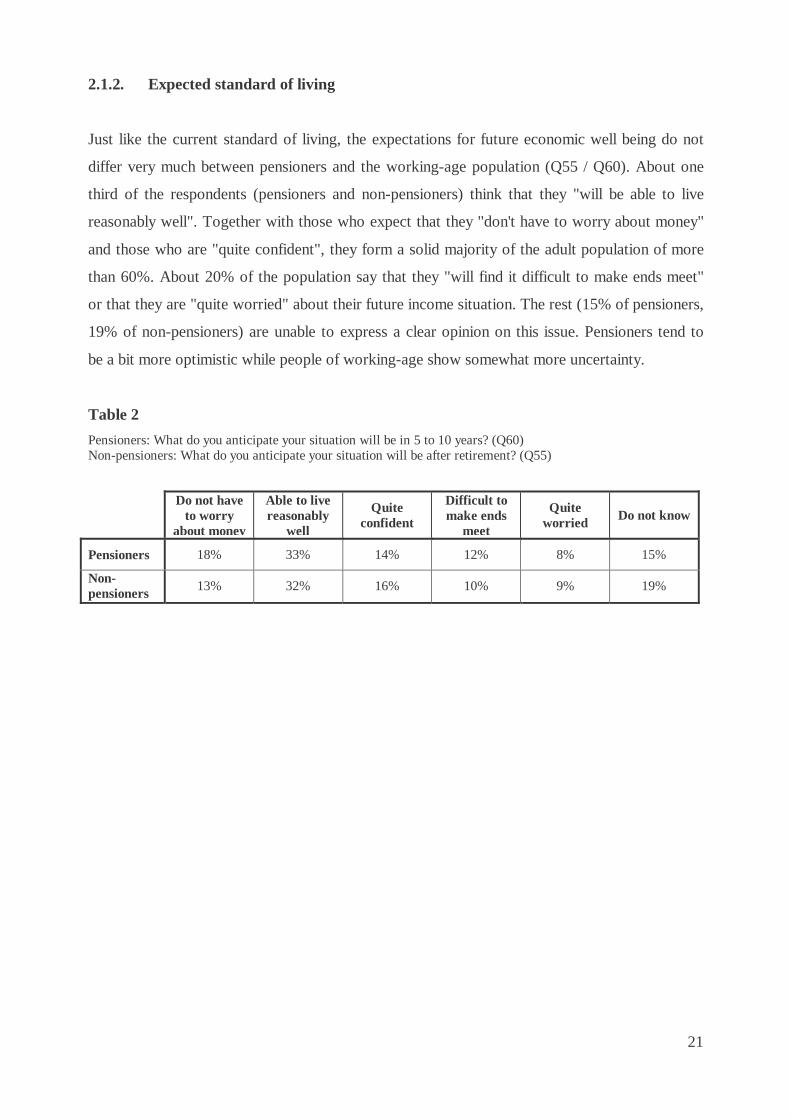
2.1.2. Expected standard of living
Just like the current standard of living, the expectations for future economic well being do not
differ very much between pensioners and the working-age population (Q55 / Q60). About one
third of the respondents (pensioners and non-pensioners) think that they "will be able to live
reasonably well". Together with those who expect that they "don't have to worry about money"
and those who are "quite confident", they form a solid majority of the adult population of more
than 60%. About 20% of the population say that they "will find it difficult to make ends meet"
or that they are "quite worried" about their future income situation. The rest (15% of pensioners,
19% of non-pensioners) are unable to express a clear opinion on this issue. Pensioners tend to
be a bit more optimistic while people of working-age show somewhat more uncertainty.
Table 2
Pensioners: What do you anticipate your situation will be in 5 to 10 years? (Q60) Non-pensioners: What do you anticipate your situation will be after retirement? (Q55)
Do not have
to worry about money
Able to live reasonably
well
Quite confident
Difficult to make ends
meet
Quite worried Do not know
Pensioners 18% 33% 14% 12% 8% 15%
Non-pensioners 13% 32% 16% 10% 9% 19%
22
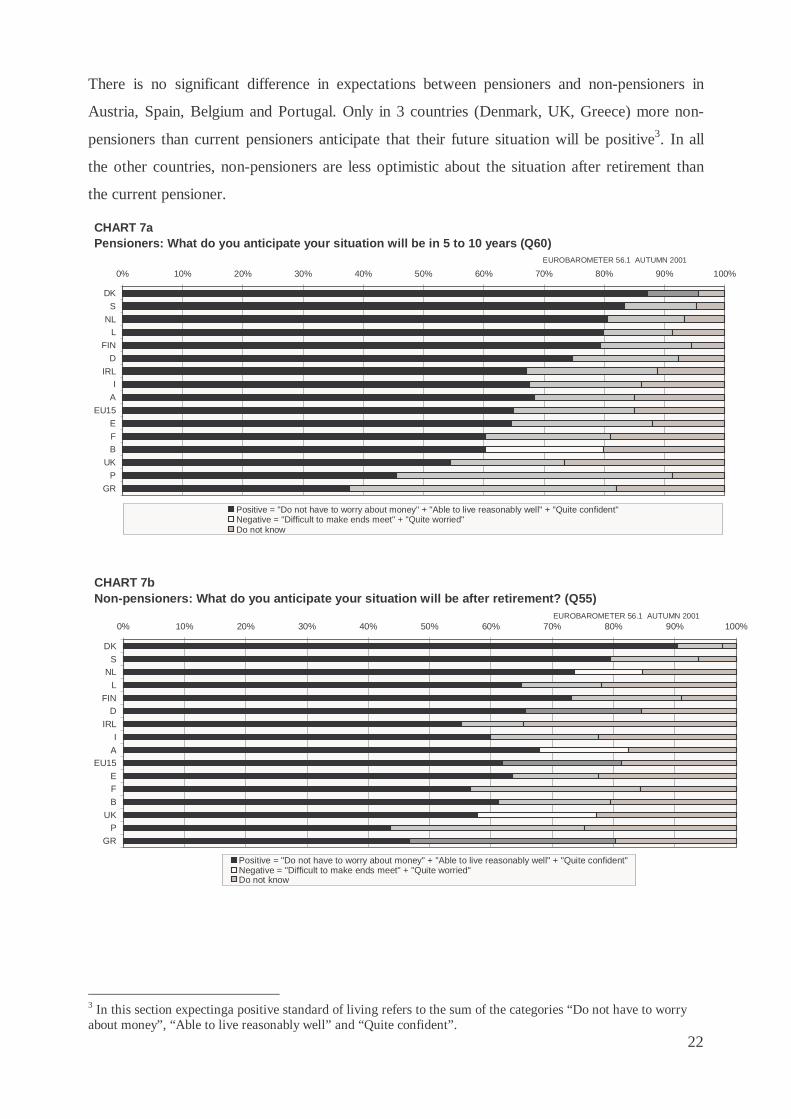
There is no significant difference in expectations between pensioners and non-pensioners in
Austria, Spain, Belgium and Portugal. Only in 3 countries (Denmark, UK, Greece) more non-
pensioners than current pensioners anticipate that their future situation will be positive3. In all
the other countries, non-pensioners are less optimistic about the situation after retirement than
the current pensioner.
3 In this section expectinga positive standard of living refers to the sum of the categories “Do not have to worry about money”, “Able to live reasonably well” and “Quite confident”.
CHART 7aPensioners: What do you anticipate your situation will be in 5 to 10 years (Q60)
0% 10% 20% 30% 40% 50% 60% 70% 80% 90% 100%
DK
S
NLL
FIN
D
IRLI
A
EU15
E
FB
UK
P
GR
Positive = "Do not have to worry about money" + "Able to live reasonably well" + "Quite confident"Negative = "Difficult to make ends meet" + "Quite worried"Do not know
EUROBAROMETER 56.1 AUTUMN 2001
CHART 7bNon-pensioners: What do you anticipate your situation will be after retirement? (Q55)
0% 10% 20% 30% 40% 50% 60% 70% 80% 90% 100%
DK
SNL
L
FIND
IRL
I
AEU15
EF
B
UKP
GR
Positive = "Do not have to worry about money" + "Able to live reasonably well" + "Quite confident"Negative = "Difficult to make ends meet" + "Quite worried"Do not know
EUROBAROMETER 56.1 AUTUMN 2001
23
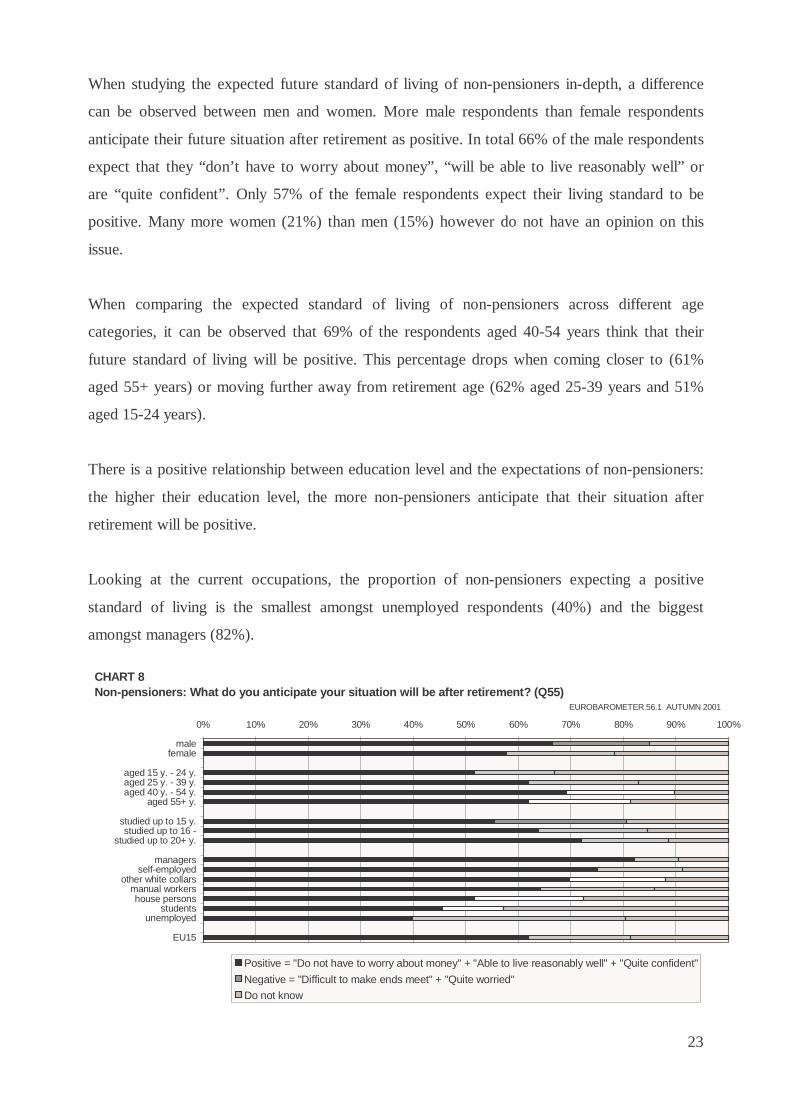
When studying the expected future standard of living of non-pensioners in-depth, a difference
can be observed between men and women. More male respondents than female respondents
anticipate their future situation after retirement as positive. In total 66% of the male respondents
expect that they “don’t have to worry about money”, “will be able to live reasonably well” or
are “quite confident”. Only 57% of the female respondents expect their living standard to be
positive. Many more women (21%) than men (15%) however do not have an opinion on this
issue.
When comparing the expected standard of living of non-pensioners across different age
categories, it can be observed that 69% of the respondents aged 40-54 years think that their
future standard of living will be positive. This percentage drops when coming closer to (61%
aged 55+ years) or moving further away from retirement age (62% aged 25-39 years and 51%
aged 15-24 years).
There is a positive relationship between education level and the expectations of non-pensioners:
the higher their education level, the more non-pensioners anticipate that their situation after
retirement will be positive.
Looking at the current occupations, the proportion of non-pensioners expecting a positive
standard of living is the smallest amongst unemployed respondents (40%) and the biggest
amongst managers (82%).
CHART 8Non-pensioners: What do you anticipate your situation will be after retirement? (Q55)
0% 10% 20% 30% 40% 50% 60% 70% 80% 90% 100%
malefemale
aged 15 y. - 24 y.aged 25 y. - 39 y.aged 40 y. - 54 y.
aged 55+ y.
studied up to 15 y.studied up to 16 -
studied up to 20+ y.
managersself-employed
other white collarsmanual workershouse persons
studentsunemployed
EU15
Positive = "Do not have to worry about money" + "Able to live reasonably well" + "Quite confident"
Negative = "Difficult to make ends meet" + "Quite worried"
Do not know
EUROBAROMETER 56.1 AUTUMN 2001

24
2.1.3. Comparison of standard of living before and after retirement
Compared to the time before retirement (Q56), 39% of the pensioners regard their financial
situation as more or less the same and another 43% as worse4. More than 11% regard their
financial situation even better5 than before.
In Greece, Luxembourg, Denmark and the Netherlands, about 20% of the pensioners seem to
enjoy a better standard of living than before retirement. On the other hand, about 43% of EU
citizens report their financial situation as worse. In particular, in Portugal (59%), Belgium
(54%), Greece (51%), France (51%) and Ireland (49%) pensioners see themselves worse off
than before retirement. Although these findings are based on subjective self-assessments rather
than objective levels of income, these cross-national differences point to significant differences
in the degree to which pension systems maintain people’s living standards after retirement.
4 A worse situation than before retirement is the sum of two categories: “a bit worse” and “much worse.” 5 A better situation than before retirement is the sum of two categories: “much better” and “a bit better”.
CHART 9Pensioners: Compared to the time before your retirement, is your current financial situation ... ? (Q56)
0% 10% 20% 30% 40% 50% 60% 70% 80% 90% 100%
GR
L
DK
NL
FIN
S
A
P
E
EU15
D
IRL
I
F
UK
B
Better = "Much better" + "A bit better" More or less the same Worse = "A bit worse" + "Much worse" Do not know
EUROBAROMETER 56.1 AUTUMN 2001
25
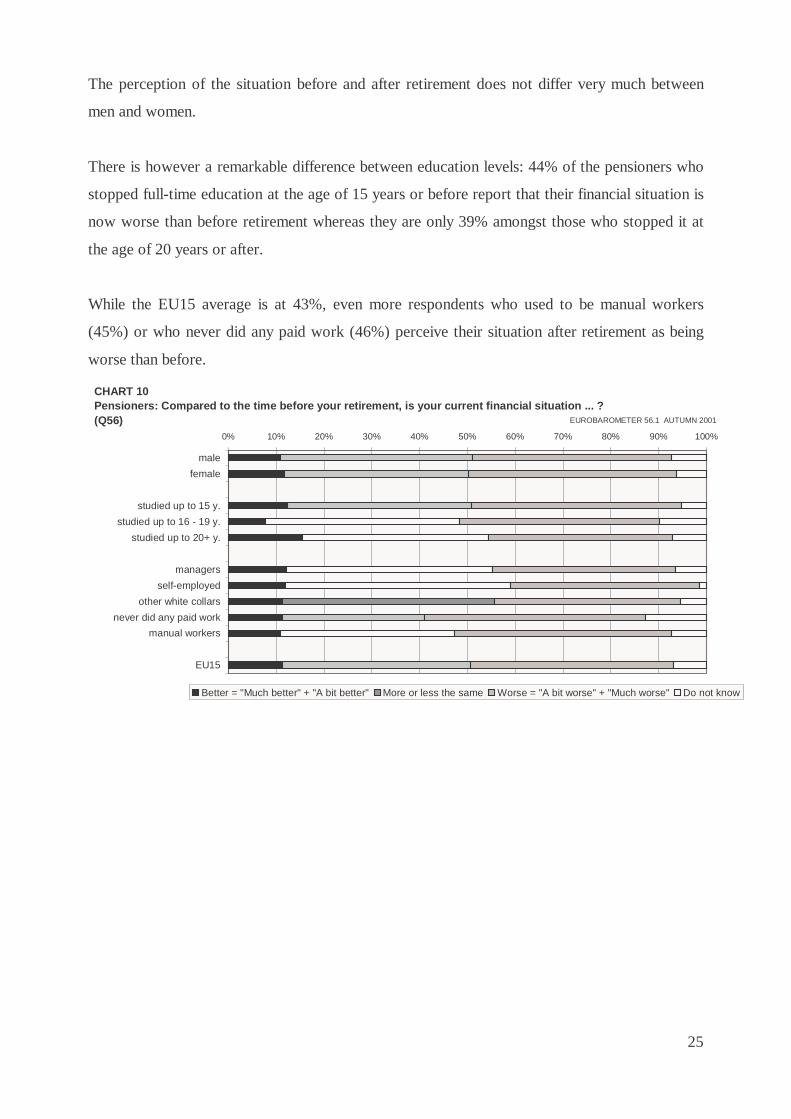
The perception of the situation before and after retirement does not differ very much between
men and women.
There is however a remarkable difference between education levels: 44% of the pensioners who
stopped full-time education at the age of 15 years or before report that their financial situation is
now worse than before retirement whereas they are only 39% amongst those who stopped it at
the age of 20 years or after.
While the EU15 average is at 43%, even more respondents who used to be manual workers
(45%) or who never did any paid work (46%) perceive their situation after retirement as being
worse than before.
CHART 10Pensioners: Compared to the time before your retirement, is your current financial situation ... ? (Q56)
0% 10% 20% 30% 40% 50% 60% 70% 80% 90% 100%
male
female
studied up to 15 y.
studied up to 16 - 19 y.
studied up to 20+ y.
managers
self-employed
other white collars
never did any paid work
manual workers
EU15
Better = "Much better" + "A bit better" More or less the same Worse = "A bit worse" + "Much worse" Do not know
EUROBAROMETER 56.1 AUTUMN 2001

26
2.2. Benefit level of state pensions6
2.2.1. Pensioners
State (or public) pensions are certainly the most important, but not the only component of
pensioners’ household income. Pensioners were also asked how they managed to get by with
their current state pension benefit (Q58). Even on this basis, i.e. taking only the benefit level of
state pensions into account, half of the pensioners reported that they get along without any
problems7, the other half say they experience problems8.
The countries where a disproportionate large share of pensioners says that they experience
problems are Greece (77%), Portugal (77%) and Ireland (67%).
6 Notions such as 'state' and 'occupational' pensions refer to very different arrangements from one country to another and respondents had not been given a clear definition of what is to be regarded as 'state' or 'occupational' pension. This may limit the comparability of results between countries. In particular, Finnish respondents clearly perceived the statutory earnings-related pension schemes as occupational schemes and regarded only the means-tested national minimum pension as 'state pension'. 7 Getting by without any problems is the sum of two categories: “easily” and “very easily”. 8 Experiencing problems is the sum of two categories: “with great difficulty” and “with difficulty”.
CHART 11Pensioners: Do you think that the state pension you receive now, allows you to get by ... ? (Q58)
0% 10% 20% 30% 40% 50% 60% 70% 80% 90% 100%
GR
P
IRL
E
FIN
UK
EU15
F
B
I
S
NL
D
DK
A
L
Problems = "With great difficulty" +"With difficulty" No problems = "Easily" +"Very easily" Do not know
EUROBAROMETER 56.1 AUTUMN 2001
27
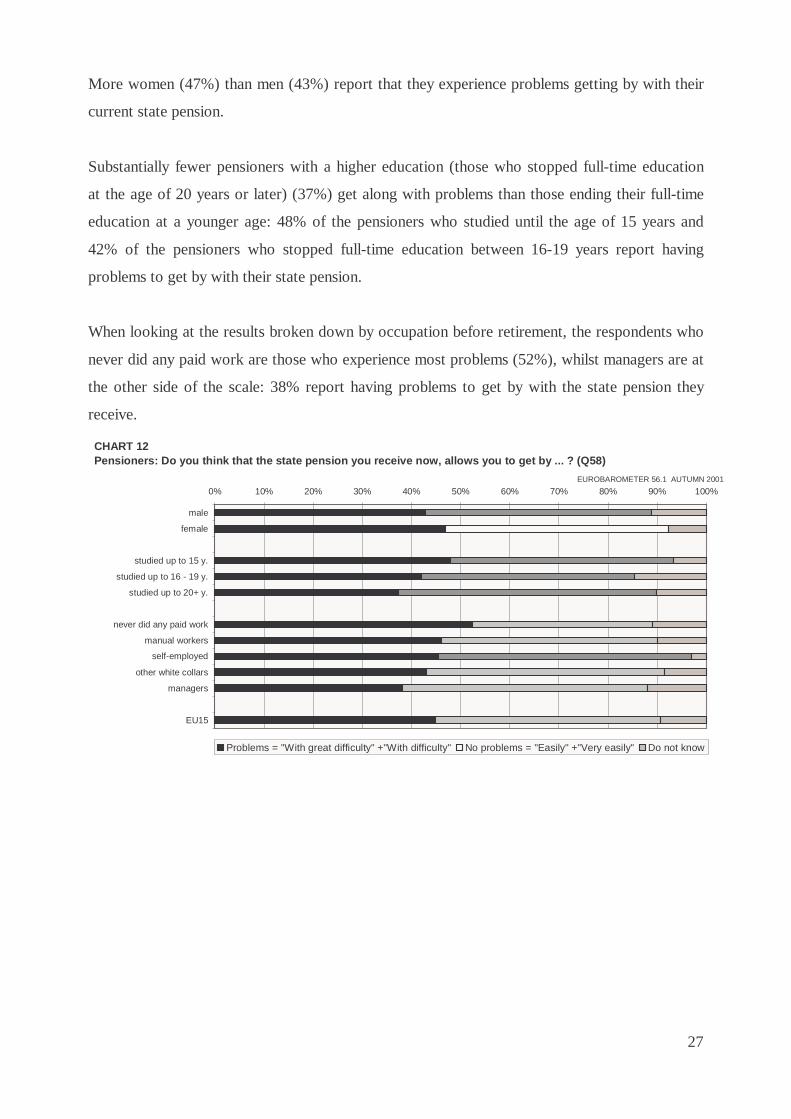
More women (47%) than men (43%) report that they experience problems getting by with their
current state pension.
Substantially fewer pensioners with a higher education (those who stopped full-time education
at the age of 20 years or later) (37%) get along with problems than those ending their full-time
education at a younger age: 48% of the pensioners who studied until the age of 15 years and
42% of the pensioners who stopped full-time education between 16-19 years report having
problems to get by with their state pension.
When looking at the results broken down by occupation before retirement, the respondents who
never did any paid work are those who experience most problems (52%), whilst managers are at
the other side of the scale: 38% report having problems to get by with the state pension they
receive.
CHART 12Pensioners: Do you think that the state pension you receive now, allows you to get by ... ? (Q58)
0% 10% 20% 30% 40% 50% 60% 70% 80% 90% 100%
male
female
studied up to 15 y.
studied up to 16 - 19 y.
studied up to 20+ y.
never did any paid work
manual workers
self-employed
other white collars
managers
EU15
Problems = "With great difficulty" +"With difficulty" No problems = "Easily" +"Very easily" Do not know
EUROBAROMETER 56.1 AUTUMN 2001
28
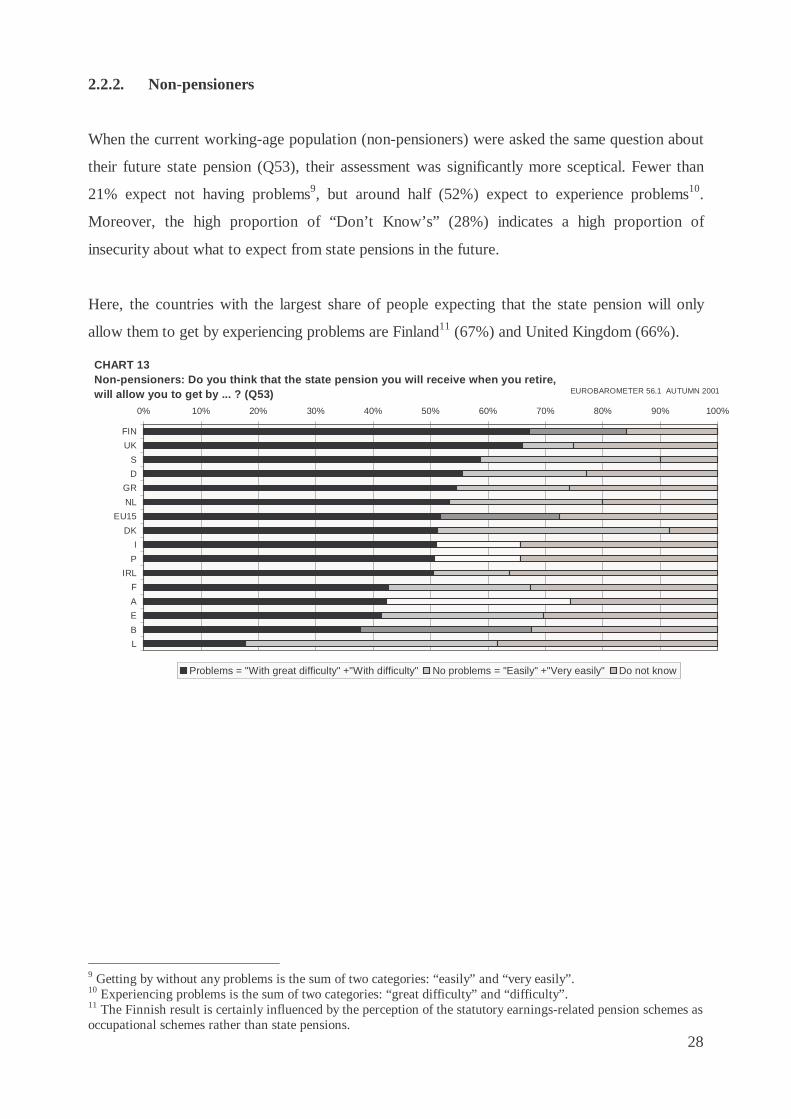
2.2.2. Non-pensioners
When the current working-age population (non-pensioners) were asked the same question about
their future state pension (Q53), their assessment was significantly more sceptical. Fewer than
21% expect not having problems9, but around half (52%) expect to experience problems10.
Moreover, the high proportion of “Don’t Know’s” (28%) indicates a high proportion of
insecurity about what to expect from state pensions in the future.
Here, the countries with the largest share of people expecting that the state pension will only
allow them to get by experiencing problems are Finland11 (67%) and United Kingdom (66%).
9 Getting by without any problems is the sum of two categories: “easily” and “very easily”. 10 Experiencing problems is the sum of two categories: “great difficulty” and “difficulty”. 11 The Finnish result is certainly influenced by the perception of the statutory earnings-related pension schemes as occupational schemes rather than state pensions.
CHART 13Non-pensioners: Do you think that the state pension you will receive when you retire, will allow you to get by ... ? (Q53)
0% 10% 20% 30% 40% 50% 60% 70% 80% 90% 100%
FIN
UK
S
D
GR
NL
EU15
DK
I
P
IRL
F
A
E
B
L
Problems = "With great difficulty" +"With difficulty" No problems = "Easily" +"Very easily" Do not know
EUROBAROMETER 56.1 AUTUMN 2001
29
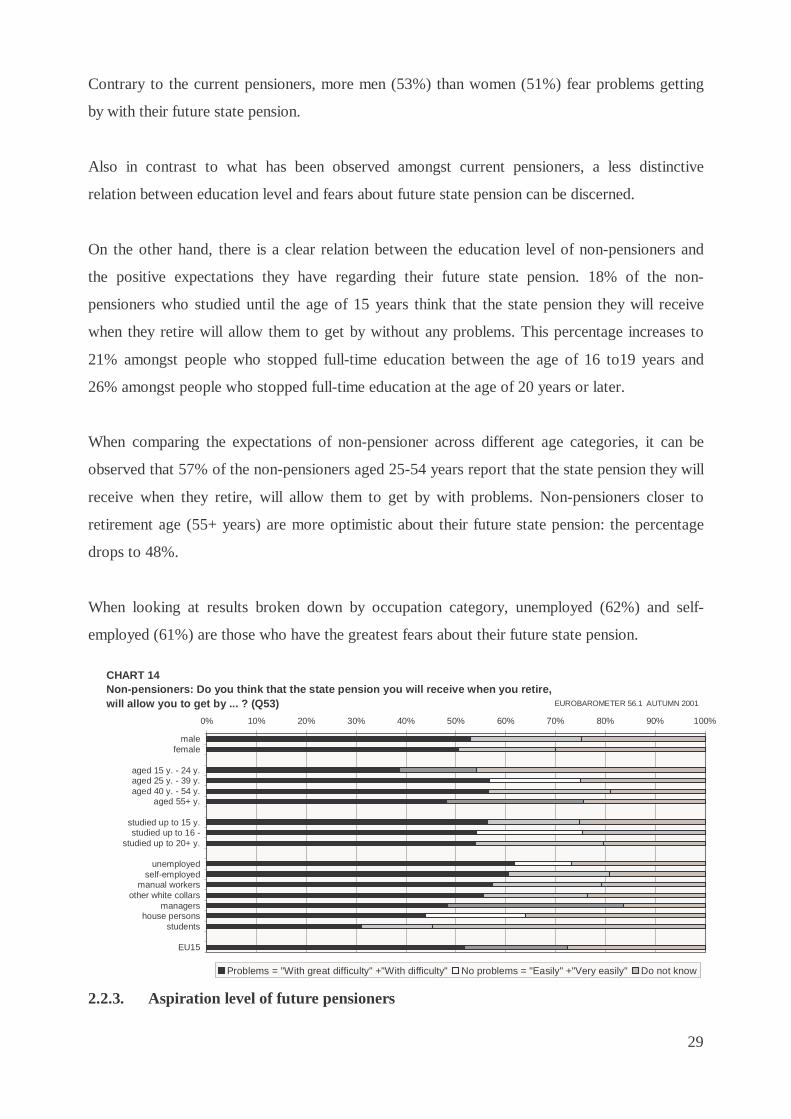
Contrary to the current pensioners, more men (53%) than women (51%) fear problems getting
by with their future state pension.
Also in contrast to what has been observed amongst current pensioners, a less distinctive
relation between education level and fears about future state pension can be discerned.
On the other hand, there is a clear relation between the education level of non-pensioners and
the positive expectations they have regarding their future state pension. 18% of the non-
pensioners who studied until the age of 15 years think that the state pension they will receive
when they retire will allow them to get by without any problems. This percentage increases to
21% amongst people who stopped full-time education between the age of 16 to19 years and
26% amongst people who stopped full-time education at the age of 20 years or later.
When comparing the expectations of non-pensioner across different age categories, it can be
observed that 57% of the non-pensioners aged 25-54 years report that the state pension they will
receive when they retire, will allow them to get by with problems. Non-pensioners closer to
retirement age (55+ years) are more optimistic about their future state pension: the percentage
drops to 48%.
When looking at results broken down by occupation category, unemployed (62%) and self-
employed (61%) are those who have the greatest fears about their future state pension.
2.2.3. Aspiration level of future pensioners
CHART 14Non-pensioners: Do you think that the state pension you will receive when you retire, will allow you to get by ... ? (Q53)
0% 10% 20% 30% 40% 50% 60% 70% 80% 90% 100%
malefemale
aged 15 y. - 24 y.aged 25 y. - 39 y.aged 40 y. - 54 y.
aged 55+ y.
studied up to 15 y.studied up to 16 -
studied up to 20+ y.
unemployedself-employed
manual workersother white collars
managershouse persons
students
EU15
Problems = "With great difficulty" +"With difficulty" No problems = "Easily" +"Very easily" Do not know
EUROBAROMETER 56.1 AUTUMN 2001
30
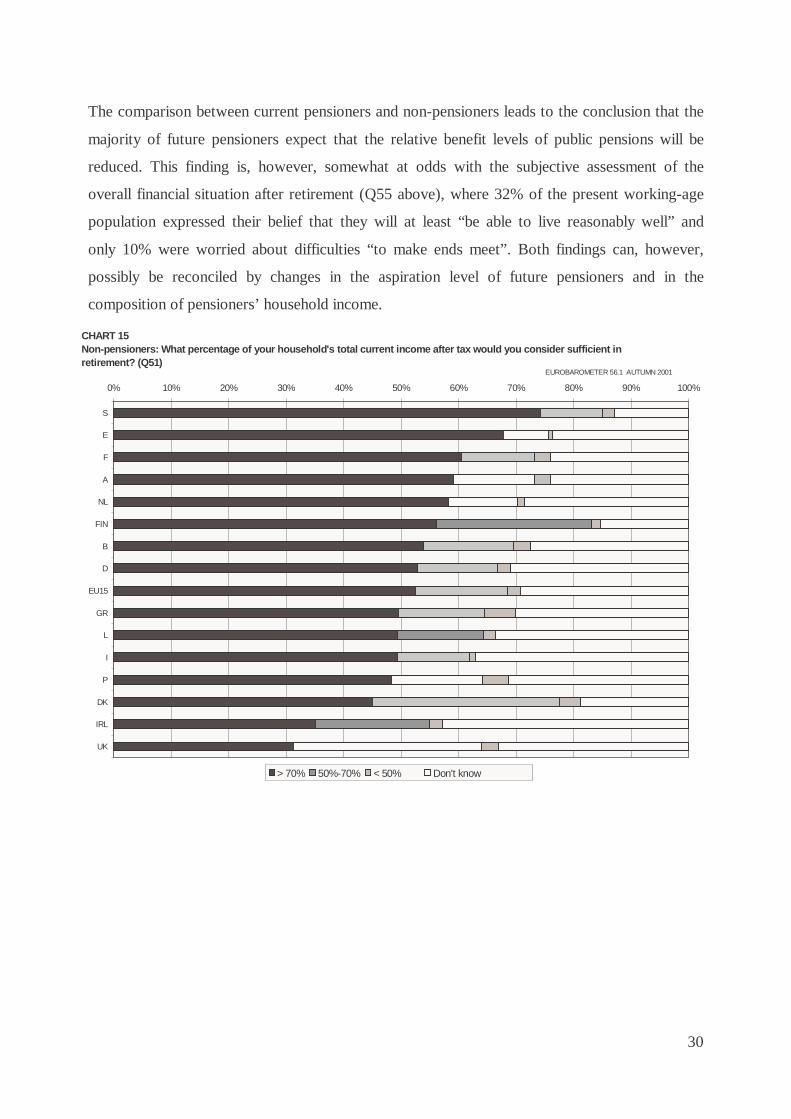
The comparison between current pensioners and non-pensioners leads to the conclusion that the
majority of future pensioners expect that the relative benefit levels of public pensions will be
reduced. This finding is, however, somewhat at odds with the subjective assessment of the
overall financial situation after retirement (Q55 above), where 32% of the present working-age
population expressed their belief that they will at least “be able to live reasonably well” and
only 10% were worried about difficulties “to make ends meet”. Both findings can, however,
possibly be reconciled by changes in the aspiration level of future pensioners and in the
composition of pensioners’ household income.
CHART 15Non-pensioners: What percentage of your household's total current income after tax would you consider sufficient in retirement? (Q51)
0% 10% 20% 30% 40% 50% 60% 70% 80% 90% 100%
S
E
F
A
NL
FIN
B
D
EU15
GR
L
I
P
DK
IRL
UK
> 70% 50%-70% < 50% Don't know
EUROBAROMETER 56.1 AUTUMN 2001

31
The aspiration level seems to be quite high, though (Q51). When asked what income
replacement level they would consider sufficient, 53% of respondents would only consider a net
income replacement level of 70% or more as sufficient for the retirement phase; another 16%
say they would need 50%-70% of their pre-retirement income, but only 2% can imagine to
consider an income replacement level of less than 50% as sufficient12.
While the European average is at 53%, far more Swedish respondents (74%) consider a net
income replacement of 70% or more as sufficient. This is also the case for Spain (68%), France
(60%), Austria (59%), the Netherlands (58%) and Finland (56%).
The aspiration level of male non-pensioners seems to be higher than that of their female
counterpart. 56% of men and 49% of women would consider a net income replacement of 70%
or more as sufficient.
As the respondents come closer to retirement age, the aspiration level drops: around 60% of the
respondents aged 25-54 years consider a net income of 70% or more as sufficient versus 52% of
the non-pensioners older than 55 years.
People with a higher education have higher aspiration levels about their income after retirement
than those with a lower education.
There are variations across occupations. The proportion of non-pensioners considering a net
income of 70% or more as sufficient is the highest amongst managers (61%) and other white
collars (61%).
12 However, almost one third of the respondents could not give a clear indication of what income level they would
consider sufficient.

32
CHART 16Non-pensioners: What percentage of your household's total current income after tax would you consider sufficient in retirement? (Q51)
0% 10% 20% 30% 40% 50% 60% 70% 80% 90% 100%
male
female
aged 15 y. - 24 y.
aged 25 y. - 39 y.
aged 40 y. - 54 y.
aged 55+ y.
studied up to 15 y.
studied up to 16 - 19 y.
studied up to 20+ y.
managers
other white collars
manual workers
self-employed
unemployed
house persons
students
EU15
> 70% 50%-70% < 50% Don't know
EUROBAROMETER 56.1 AUTUMN 2001
33
3. The composition of pensioners’ household income
In order to assess the relative importance of various income sources in the household income
package of pensioners, we asked for a ranking of the main source of income, the second most
important source, and any other sources of income. This chapter discusses the sources of
income for current pensioners (3.1.), the sources of income the future pensioners expect (3.2.)
and the sources of income both current and future pensioners prefer (3.3.).
3.1. Sources of income for current pensioners
3.1.1. The main source of income
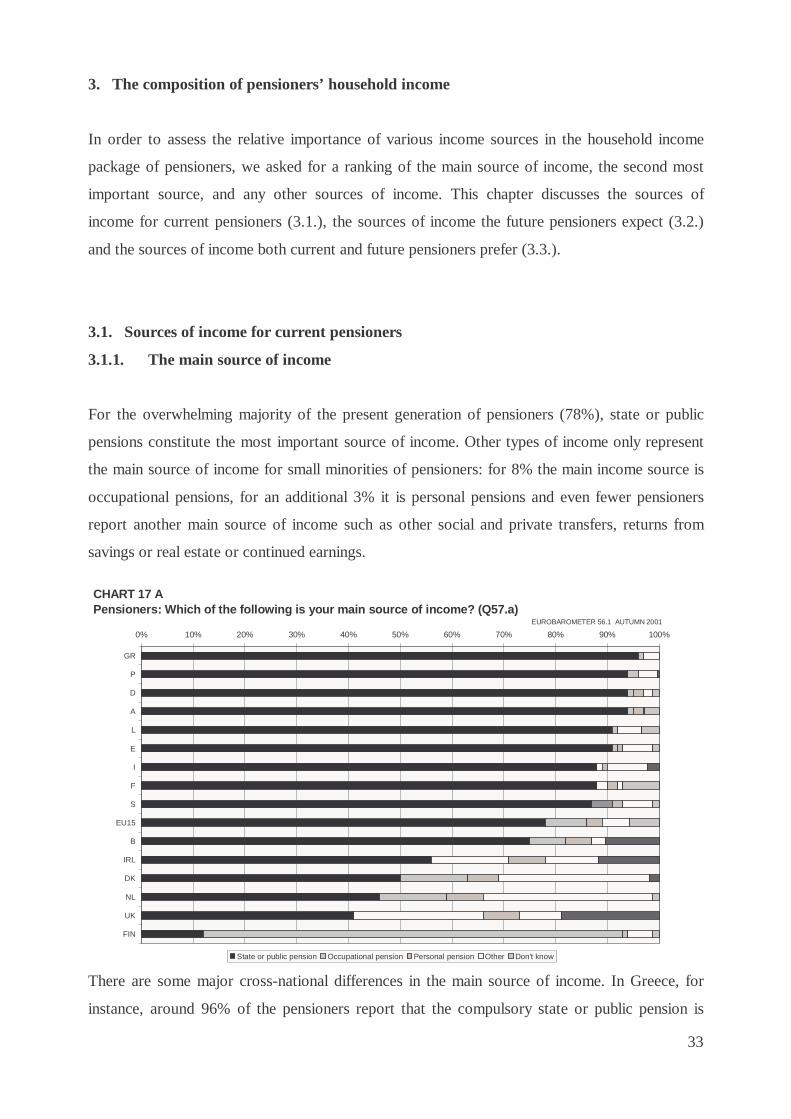
For the overwhelming majority of the present generation of pensioners (78%), state or public
pensions constitute the most important source of income. Other types of income only represent
the main source of income for small minorities of pensioners: for 8% the main income source is
occupational pensions, for an additional 3% it is personal pensions and even fewer pensioners
report another main source of income such as other social and private transfers, returns from
savings or real estate or continued earnings.
There are some major cross-national differences in the main source of income. In Greece, for
instance, around 96% of the pensioners report that the compulsory state or public pension is
CHART 17 APensioners: Which of the following is your main source of income? (Q57.a)
0% 10% 20% 30% 40% 50% 60% 70% 80% 90% 100%
GR
P
D
A
L
E
I
F
S
EU15
B
IRL
DK
NL
UK
FIN
State or public pension Occupational pension Personal pension Other Don't know
EUROBAROMETER 56.1 AUTUMN 2001
34
their main source of income. From all the European Union countries, Greece is positioned the
highest above the European average (78%). In Finland, on the other hand, the smallest
proportion of respondents (12%) says that a state pension is their main source of income.
Finland is the only European Union country where respondents indicate occupational pensions
as the main source of income for current pensioners. However, this is due to the perception of
the statutory earnings-related pension schemes as occupational schemes.
Slightly more women (80%) than men (76%) report that state or public pensions constitute their
most important source of income.
There is a negative relationship between the education level and the proportion of pensioners
for whom the state pension is the main source of income (82% amongst the lowest educated
pensioners versus 68% amongst the highest educated). Whereas the importance of the state
pension decreases with the education level, the importance of the occupational pension
increases with it. 6% of the lowest educated pensioners report that an occupational pension is
their main source of income, whilst this is the case for 14% of the highest educated pensioners.
There are some important variations when looking at the occupation before retirement: the
biggest proportion of manual workers (82%) report that a state or public pension is their main
source of income. Respondents who used to be managers before retirement are situated at the
other end of the scale: 69% report that a state or public pension is their main source of income.
In comparison to other occupation categories, occupational or private pensions are very
important for managers (19%).

35
CHART 18Pensioners: Which of the following is your main source of income? (Q57)
0% 10% 20% 30% 40% 50% 60% 70% 80% 90% 100%
male
female
studied up to 15 y.
studied up to 16 - 19 y.
studied up to 20+ y.
manual workers
other white collars
self-employed
never did any paid work
managers
EU15
State or public pension Occupational pension Personal pension Other
EUROBAROMETER 56.1 AUTUMN 2001
36
3.1.2. The second most important source of income
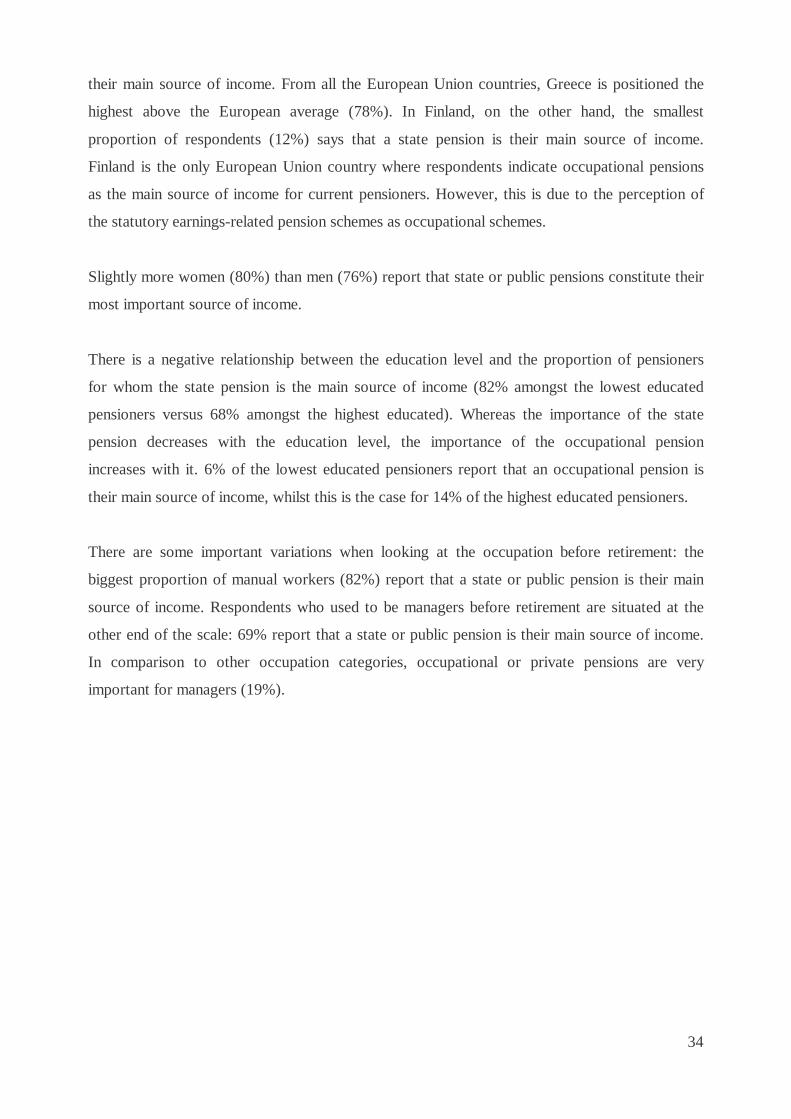
As second most important source of income, in addition to the three main items mentioned
previously (state pension, occupational pension and personal pension), 10% also mentioned
“returns from savings or other assets” and 6% “returns from real estate”. But 34% of present
pensioners were unable to name a second income source – which underlines the predominance
of public pensions for determining the standard of living for the larger part of the present
generation of pensioners.
3.2. Expected sources of income for future pensioners
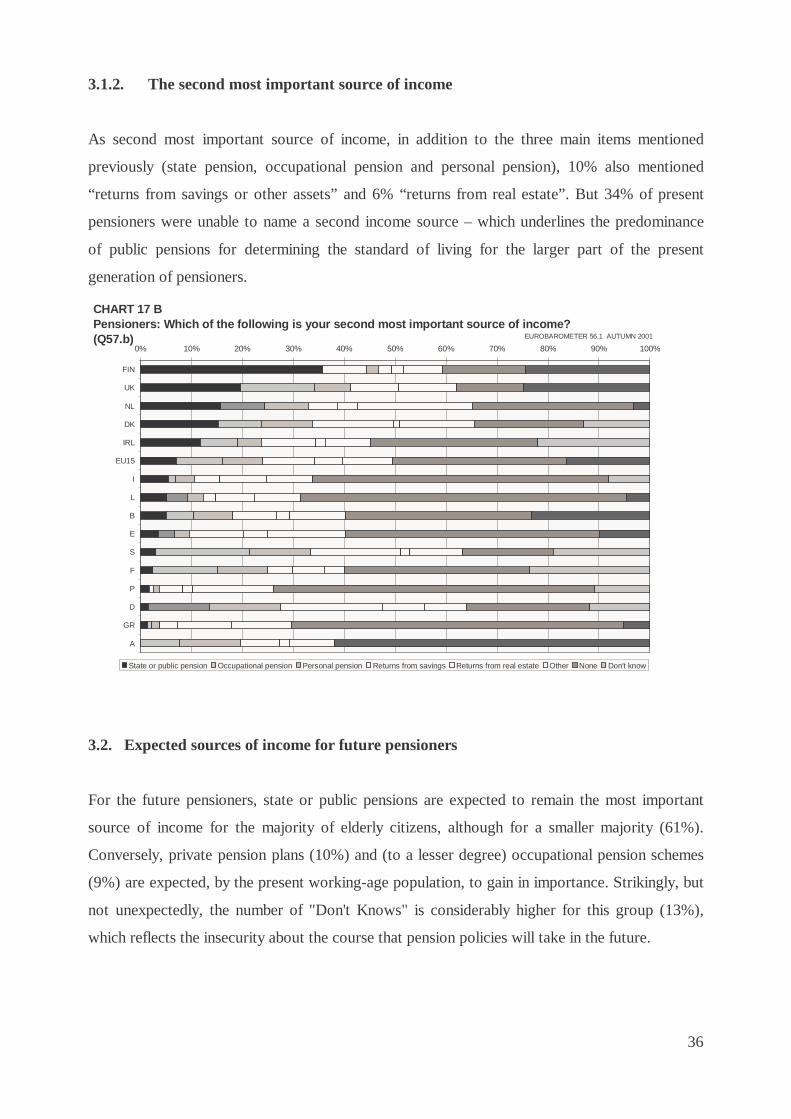
For the future pensioners, state or public pensions are expected to remain the most important
source of income for the majority of elderly citizens, although for a smaller majority (61%).
Conversely, private pension plans (10%) and (to a lesser degree) occupational pension schemes
(9%) are expected, by the present working-age population, to gain in importance. Strikingly, but
not unexpectedly, the number of "Don't Knows" is considerably higher for this group (13%),
which reflects the insecurity about the course that pension policies will take in the future.
CHART 17 BPensioners: Which of the following is your second most important source of income? (Q57.b)
0% 10% 20% 30% 40% 50% 60% 70% 80% 90% 100%
FIN
UK
NL
DK
IRL
EU15
I
L
B
E
S
F
P
D
GR
A
State or public pension Occupational pension Personal pension Returns from savings Returns from real estate Other None Don't know
EUROBAROMETER 56.1 AUTUMN 2001
37
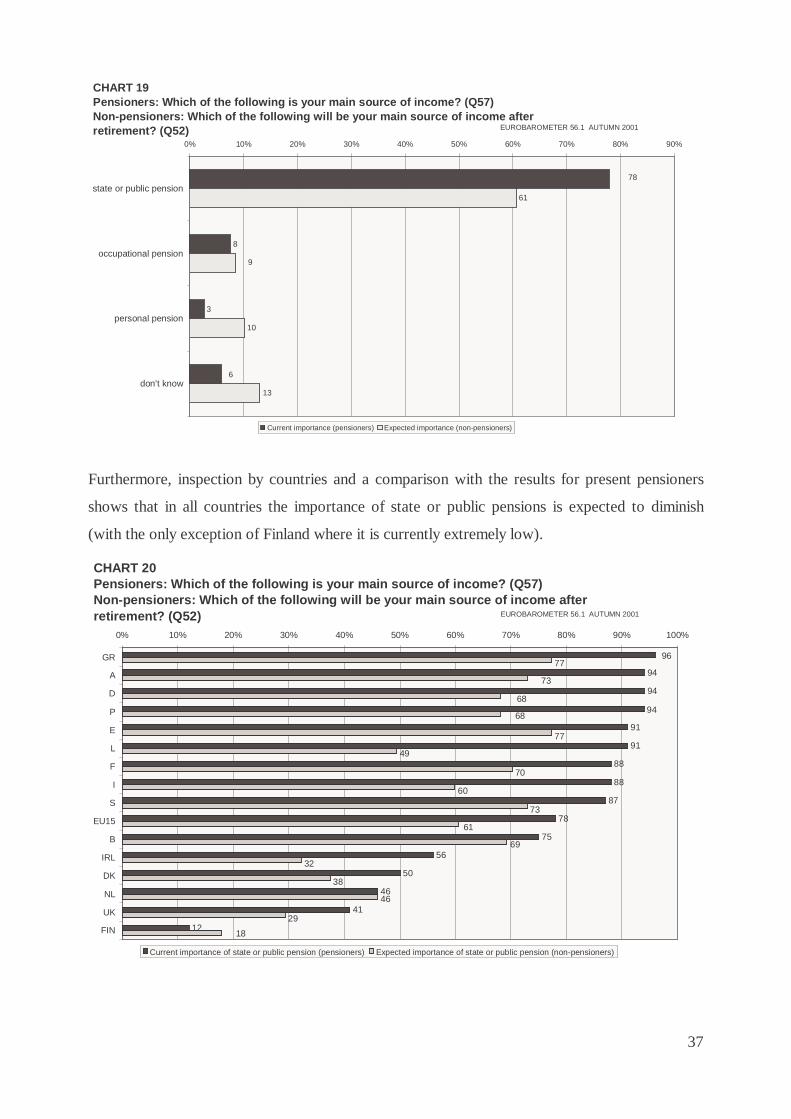
Furthermore, inspection by countries and a comparison with the results for present pensioners
shows that in all countries the importance of state or public pensions is expected to diminish
(with the only exception of Finland where it is currently extremely low).
CHART 19Pensioners: Which of the following is your main source of income? (Q57)Non-pensioners: Which of the following will be your main source of income after retirement? (Q52)
8
3
61
10
13
78
6
9
0% 10% 20% 30% 40% 50% 60% 70% 80% 90%
state or public pension
occupational pension
personal pension
don't know
Current importance (pensioners) Expected importance (non-pensioners)
EUROBAROMETER 56.1 AUTUMN 2001
CHART 20Pensioners: Which of the following is your main source of income? (Q57)Non-pensioners: Which of the following will be your main source of income after retirement? (Q52)
94
94
91
91
88
88
87
78
75
56
50
46
41
12
96
94
18
29
46
38
32
69
61
73
60
70
49
77
68
68
77
73
0% 10% 20% 30% 40% 50% 60% 70% 80% 90% 100%
GR
A
D
P
E
L
F
I
S
EU15
B
IRL
DK
NL
UK
FIN
Current importance of state or public pension (pensioners) Expected importance of state or public pension (non-pensioners)
EUROBAROMETER 56.1 AUTUMN 2001
38
But in almost all countries, they should continue to be the most important single source of
income for the elderly. In Denmark and the United Kingdom, the predominance of public
pensions will, however, be surpassed by occupational and personal pension schemes taken
together.
Fewer male (61%) and female non-pensioners (61%) expect that a state or public pension will
be their main source of income after retirement than it is the case for the current male (76%)
and female pensioners (80%). More men (21%) than women (16%) in the working-age believe
that occupational or personal pension schemes will be their main source of income after
retirement.
While the EU15 average indicated that 61% of the non-pensioners expect that a state pension
will be their main source of income, there is a variation based upon levels of education. 69% of
those who left school at the age of 15 years or younger expect a state pension to be the most
important source of income, whereas this is the case of 61% of the most educated respondents
(the same pattern can be discerned amongst current pensioners). On the other hand, more highly
educated non-pensioners (23%) than those who left school at the age of 15 years or younger
(13%) expect that occupational or personal pension schemes will become the most important
source of income.
CHART 21Non-pensioners: Which of the following will be your main source of income after retirement? (Q52)
0% 10% 20% 30% 40% 50% 60% 70% 80% 90% 100%
GR
E
A
S
F
B
D
P
EU15
I
L
NL
DK
IRL
UK
FIN
State or public pension Occupational pension Personal pension Other
EUROBAROMETER 56.1 AUTUMN 2001
39
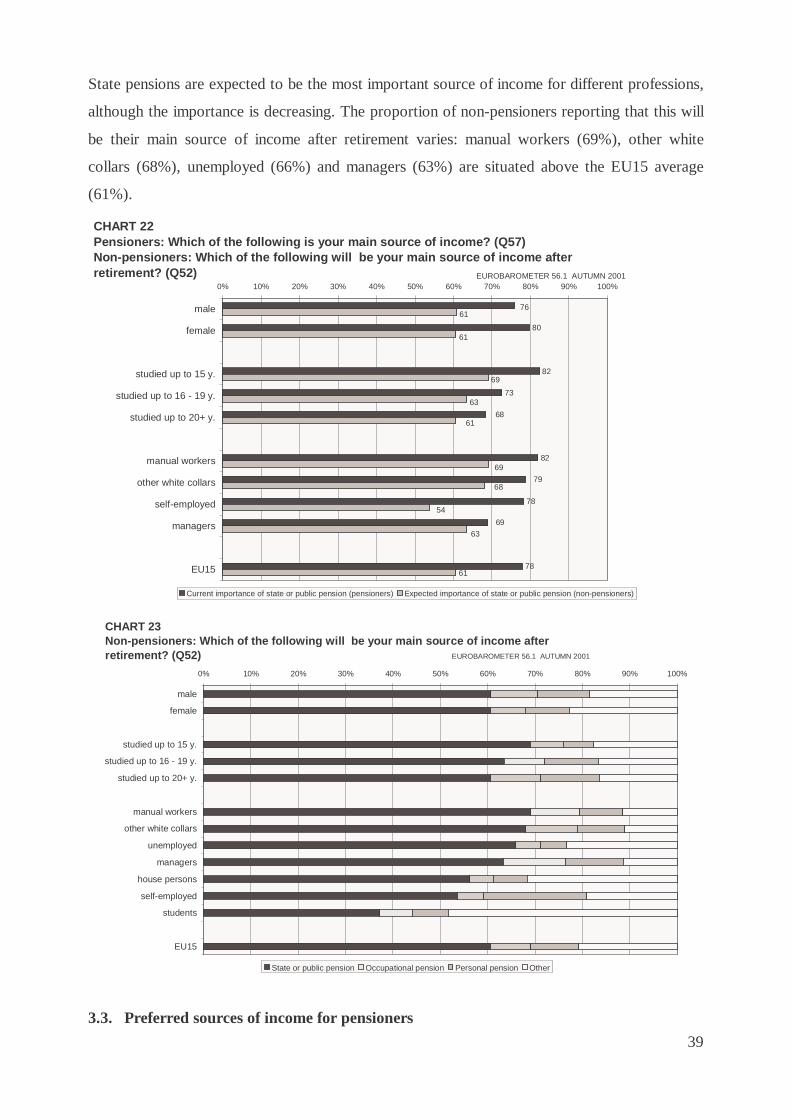
State pensions are expected to be the most important source of income for different professions,
although the importance is decreasing. The proportion of non-pensioners reporting that this will
be their main source of income after retirement varies: manual workers (69%), other white
collars (68%), unemployed (66%) and managers (63%) are situated above the EU15 average
(61%).
3.3. Preferred sources of income for pensioners
CHART 22Pensioners: Which of the following is your main source of income? (Q57)Non-pensioners: Which of the following will be your main source of income after retirement? (Q52)
80
73
82
78
78
69
79
68
76
82
61
63
54
68
69
61
63
69
61
61
0% 10% 20% 30% 40% 50% 60% 70% 80% 90% 100%
male
female
studied up to 15 y.
studied up to 16 - 19 y.
studied up to 20+ y.
manual workers
other white collars
self-employed
managers
EU15
Current importance of state or public pension (pensioners) Expected importance of state or public pension (non-pensioners)
EUROBAROMETER 56.1 AUTUMN 2001
CHART 23Non-pensioners: Which of the following will be your main source of income after retirement? (Q52)
0% 10% 20% 30% 40% 50% 60% 70% 80% 90% 100%
male
female
studied up to 15 y.
studied up to 16 - 19 y.
studied up to 20+ y.
manual workers
other white collars
unemployed
managers
house persons
self-employed
students
EU15
State or public pension Occupational pension Personal pension Other
EUROBAROMETER 56.1 AUTUMN 2001

40
The questions reported in the previous sections refer to the likely shifts in the relative
importance of various income sources. It is a different question, however, to ask people how
pension benefits should be provided. We proposed three alternatives (Q61):
• mainly by state or public pension schemes,
• mainly by occupational pension schemes, or
• mainly by private arrangements.
The pattern of answers shows a certain similarity with the expected importance of the various
sources of income, but also some interesting differences. A clear majority of EU citizens (57%)
shares the opinion that pensions should be mainly provided by public pension schemes. 24%
think that occupational schemes should perform this function, and only 7% think that this task
should be left to (voluntary) private arrangements. For the large majority of citizens, occu-
pational and private-individual schemes may be acceptable as supplementary sources of
income, but not as the main pillar of income security in old age. Thus, an interesting difference
emerges: substantially more people, albeit still a minority (24%), would like occupational
pension schemes to play a larger role than they currently do (8%) and than they will probably
play in the future (9%). And conversely, they would ascribe a smaller role to private
arrangements (7%) than they expect them to play in the future (10%).
CHART 24Pensioners: Which of the following is your main source of income? (Q57)Non-pensioners: Which of the following will be your main source of income (Q52)Pensioners and non-pensioners: How do you think that pensions should be provided?(Q61)
3
61
10
13
24
7
13
8
6
78
9
57
0% 10% 20% 30% 40% 50% 60% 70% 80% 90%
state or public pension
occupational pension
personal pension
don't know
Current importance (pensioners) Expected importance (non-pensioners) Desired importance (pensioners and non-pensioners)
EUROBAROMETER 56.1 AUTUMN 2001
41
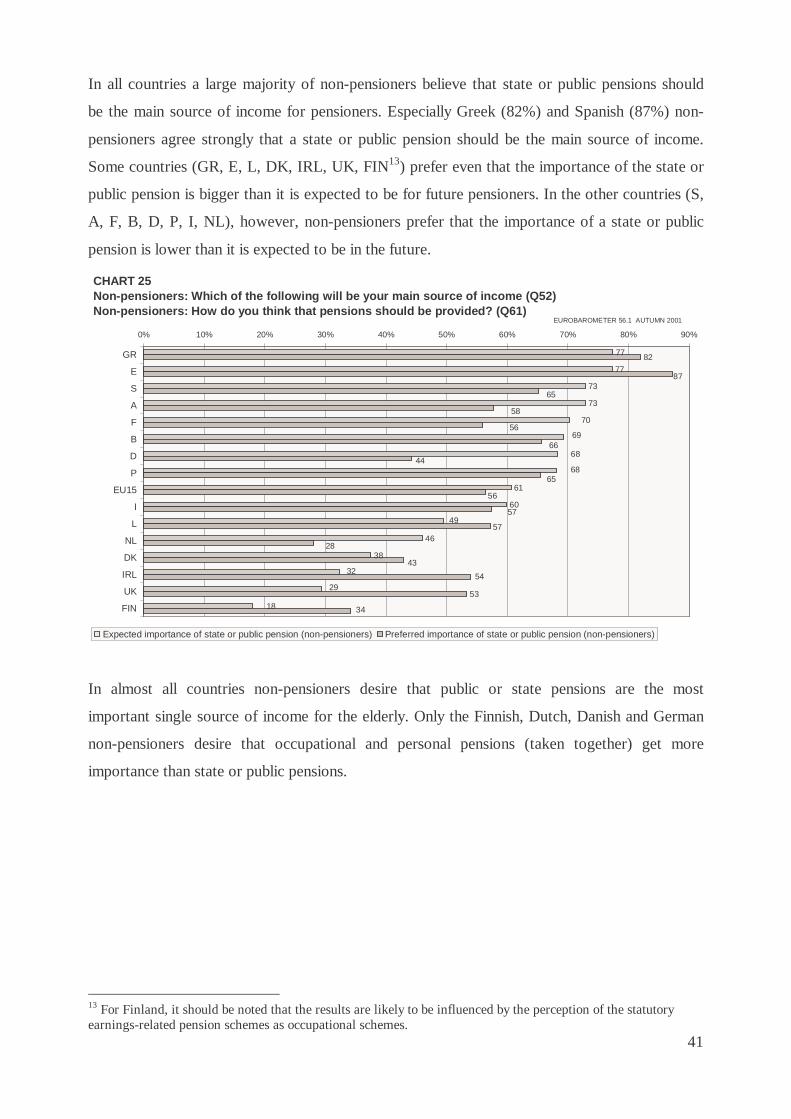
In all countries a large majority of non-pensioners believe that state or public pensions should
be the main source of income for pensioners. Especially Greek (82%) and Spanish (87%) non-
pensioners agree strongly that a state or public pension should be the main source of income.
Some countries (GR, E, L, DK, IRL, UK, FIN13) prefer even that the importance of the state or
public pension is bigger than it is expected to be for future pensioners. In the other countries (S,
A, F, B, D, P, I, NL), however, non-pensioners prefer that the importance of a state or public
pension is lower than it is expected to be in the future.
In almost all countries non-pensioners desire that public or state pensions are the most
important single source of income for the elderly. Only the Finnish, Dutch, Danish and German
non-pensioners desire that occupational and personal pensions (taken together) get more
importance than state or public pensions.
13 For Finland, it should be noted that the results are likely to be influenced by the perception of the statutory earnings-related pension schemes as occupational schemes.
CHART 25Non-pensioners: Which of the following will be your main source of income (Q52)Non-pensioners: How do you think that pensions should be provided? (Q61)
77
77
73
73
61
60
46
38
82
53
49
68
68
32
70
18
29
69
43
28
34
54
57
57
56
65
44
66
56
58
65
87
0% 10% 20% 30% 40% 50% 60% 70% 80% 90%
GR
E
S
A
F
B
D
P
EU15
I
L
NL
DK
IRL
UK
FIN
Expected importance of state or public pension (non-pensioners) Preferred importance of state or public pension (non-pensioners)
EUROBAROMETER 56.1 AUTUMN 2001

42
More than half of the male (55%) and female (57%) non-pensioners believe that state or public
pensions should be the most important source of income after retirement. Compared to the
expected importance of state or public pensions, this would imply that both male and female
non-pensioners prefer that state pensions would play a somewhat less important role in the
household income, although state pensions clearly remain by far the preferred main source of
income in old age. Next to state or public pensions, more men (34%) than women (28%)
mention occupational or personal pension schemes as the preferred main source of income.
Time spent on education tends to reduce the preference for state or public pensions as main
income after retirement. While 67% of the non-pensioners educated to the age of 15 years or
less prefer this option, this figure decreases to 54% for those whose education has continued to
the age of 20 years or beyond. All non-pensioners prefer that state pensions play a smaller role
than they are expected to play for the future pensioners.
When looking at results broken down by occupation, especially unemployed (66%) and manual
workers (60%) believe that a state or public pension should be the main source of income.
House persons, self-employed non-pensioners and students prefer even that the importance of
state or public pension increase, whereas other occupational categories believe that the
importance of state or public pension should be diminished. The proportion of managers who
CHART 26Non-pensioners: How do you think that pensions should be provided, mainly by? (Q61)
0% 10% 20% 30% 40% 50% 60% 70% 80% 90% 100%
E
GR
B
P
S
A
I
L
EU15
F
IRL
UK
D
DK
FIN
NL
State or public pension Occupational pension Personal pension Other
EUROBAROMETER 56.1 AUTUMN 2001
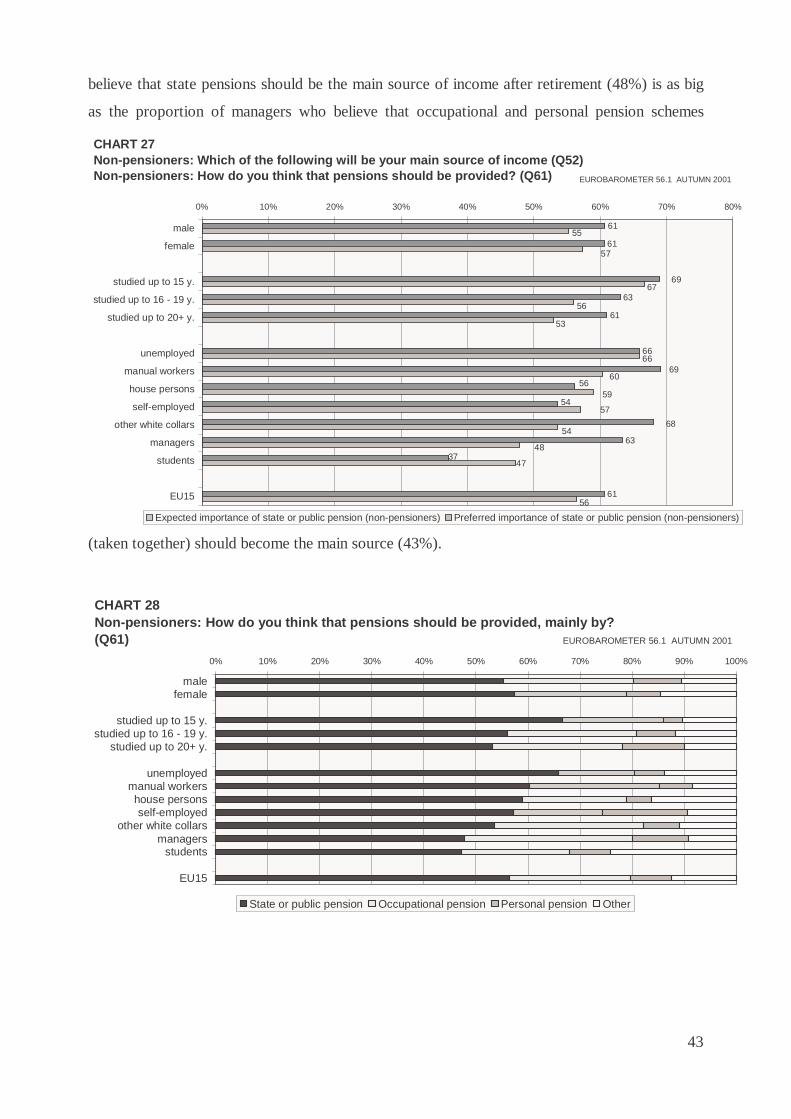
43
believe that state pensions should be the main source of income after retirement (48%) is as big
as the proportion of managers who believe that occupational and personal pension schemes
(taken together) should become the main source (43%).
CHART 27Non-pensioners: Which of the following will be your main source of income (Q52)Non-pensioners: How do you think that pensions should be provided? (Q61)
61
61
63
61
66
63
61
56
69
69
37
68
54
56
47
48
54
57
59
60
66
53
56
67
57
55
0% 10% 20% 30% 40% 50% 60% 70% 80%
male
female
studied up to 15 y.
studied up to 16 - 19 y.
studied up to 20+ y.
unemployed
manual workers
house persons
self-employed
other white collars
managers
students
EU15
Expected importance of state or public pension (non-pensioners) Preferred importance of state or public pension (non-pensioners)
EUROBAROMETER 56.1 AUTUMN 2001
CHART 28Non-pensioners: How do you think that pensions should be provided, mainly by? (Q61)
0% 10% 20% 30% 40% 50% 60% 70% 80% 90% 100%
malefemale
studied up to 15 y.studied up to 16 - 19 y.
studied up to 20+ y.
unemployedmanual workershouse personsself-employed
other white collarsmanagers
students
EU15
State or public pension Occupational pension Personal pension Other
EUROBAROMETER 56.1 AUTUMN 2001

44
4. Goals and principles of pension systems
An important issue for the debate about the course future pension reforms should take, are the
normative foundations of pension policies. Therefore, we asked a series of questions about
goals and principles of pension systems in order to investigate the underlying value orientations,
in particular the ideas on social justice held by citizens. More precisely: we asked people
whether they agreed14 or disagreed15 with a series of normative statements which reflect the
desirability of currently discussed reform options (Q62). These statements concern broad goals
such as the prevention of poverty in old age (4.1.1.), maintaining an adequate standard of living
(4.1.2.) and reducing social inequalities amongst the elderly (4.1.3.). Furthermore, the
statements tackle principles of basic social right (4.2.1.), equivalence (4.2.2.) and universality
(4.2.3.).
4.1. Goals
4.1.1. Prevention of poverty in old age
The statement "the primary goal of a good pension scheme should be to protect elderly people
against the risk of poverty" (Q62.3) was endorsed by a vast majority of the respondents: 92%
agree with it. This statement stresses the ‘social protection’ function a good pension scheme
should fulfil.
The proportion of people who agree with this statement is the highest in Greece (96%). It is
followed by Italy (95%), France (94%) and Denmark (94%). Austria ranks at the last position
with 85% of people sharing this opinion.
14 When in chapter 4 „respondents agree“ is used, it refers to the sum of two categories: „strongly agree“ and „slightly agree“. 15 When in chapter 4 „respondents disagree“ is used, it refers to the sum of two categories: „strongly disagree“ and „slightly disagree“.
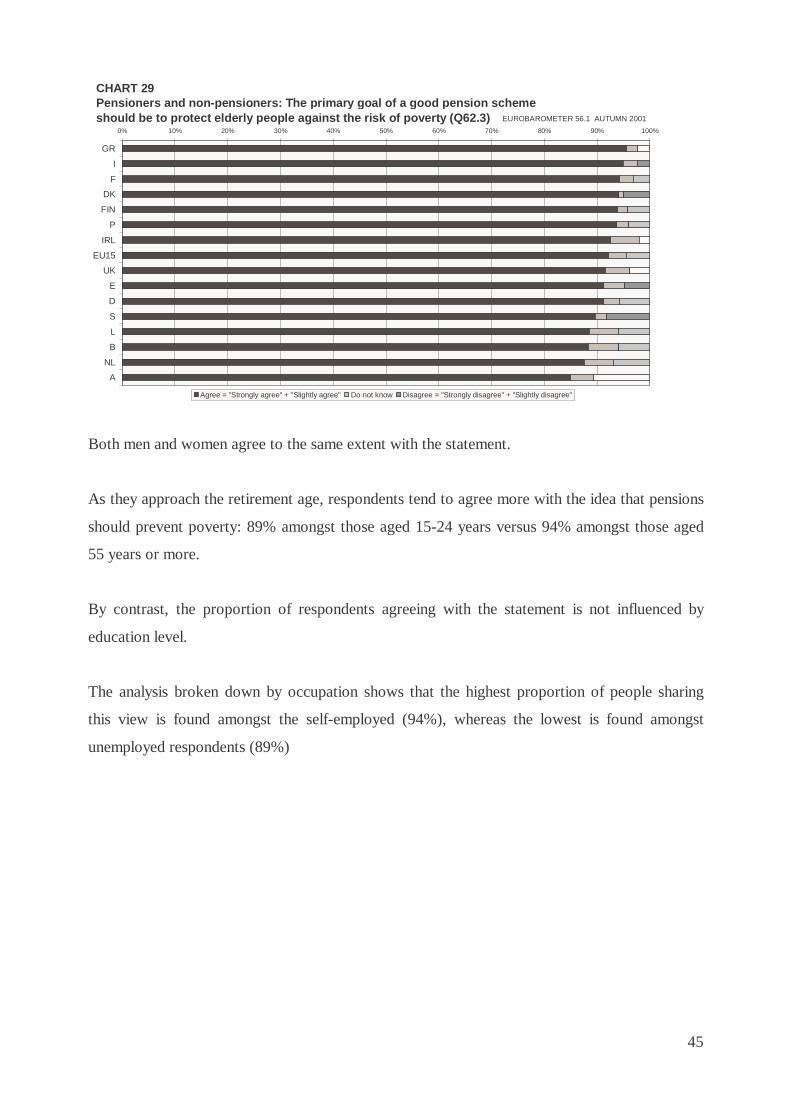
45
Both men and women agree to the same extent with the statement.
As they approach the retirement age, respondents tend to agree more with the idea that pensions
should prevent poverty: 89% amongst those aged 15-24 years versus 94% amongst those aged
55 years or more.
By contrast, the proportion of respondents agreeing with the statement is not influenced by
education level.
The analysis broken down by occupation shows that the highest proportion of people sharing
this view is found amongst the self-employed (94%), whereas the lowest is found amongst
unemployed respondents (89%)
CHART 29Pensioners and non-pensioners: The primary goal of a good pension scheme should be to protect elderly people against the risk of poverty (Q62.3)
0% 10% 20% 30% 40% 50% 60% 70% 80% 90% 100%
GR
I
F
DK
FIN
P
IRL
EU15
UK
E
D
S
L
B
NL
A
Agree = "Strongly agree" + "Slightly agree" Do not know Disagree = "Strongly disagree" + "Slightly disagree"
EUROBAROMETER 56.1 AUTUMN 2001

46
4.1.2. Maintaining an adequate standard of living
The statement about basic income protection does, however, not imply that the responsibility of
the state with regard to pension provision should be restricted to providing a minimum pension
as a safeguard against the risk of poverty. This is underlined by the fact that at the same time a
similarly high percentage of citizens (88%) demands that "a good pension system should allow
everybody to maintain an adequate standard of living relative to their income before
retirement", that is, to secure their relative social status which they have achieved during
working life (Q62.5). This means that both goals enjoy a high degree of consensus and - in the
perception of most citizens - should be pursued simultaneously.
The support for this statement is especially strong in countries like Greece, France, Ireland,
Denmark and UK: more than nine out of ten respondents agree that pensions should allow
everybody to maintain an adequate standard of living.
CHART 30Pensioners and non-pensioners: The primary goal of a good pension scheme should be to protect elderly people against the risk of poverty (Q62.3)
0% 10% 20% 30% 40% 50% 60% 70% 80% 90% 100%
malefemale
aged 15 y. - 24 y.aged 25 y. - 39 y.aged 40 y. - 54 y.
aged 55+ y.
studied up to 15 y.studied up to 16-19studied up to 20+ y.
self-employedhouse persons
other white collarsmanagers
studentsretired
manual workersunemployed
EU15
Agree = "Strongly agree" + "Slightly agree" Do not know Disagree = "Strongly disagree" + "Slightly disagree"
EUROBAROMETER 56.1 AUTUMN 2001
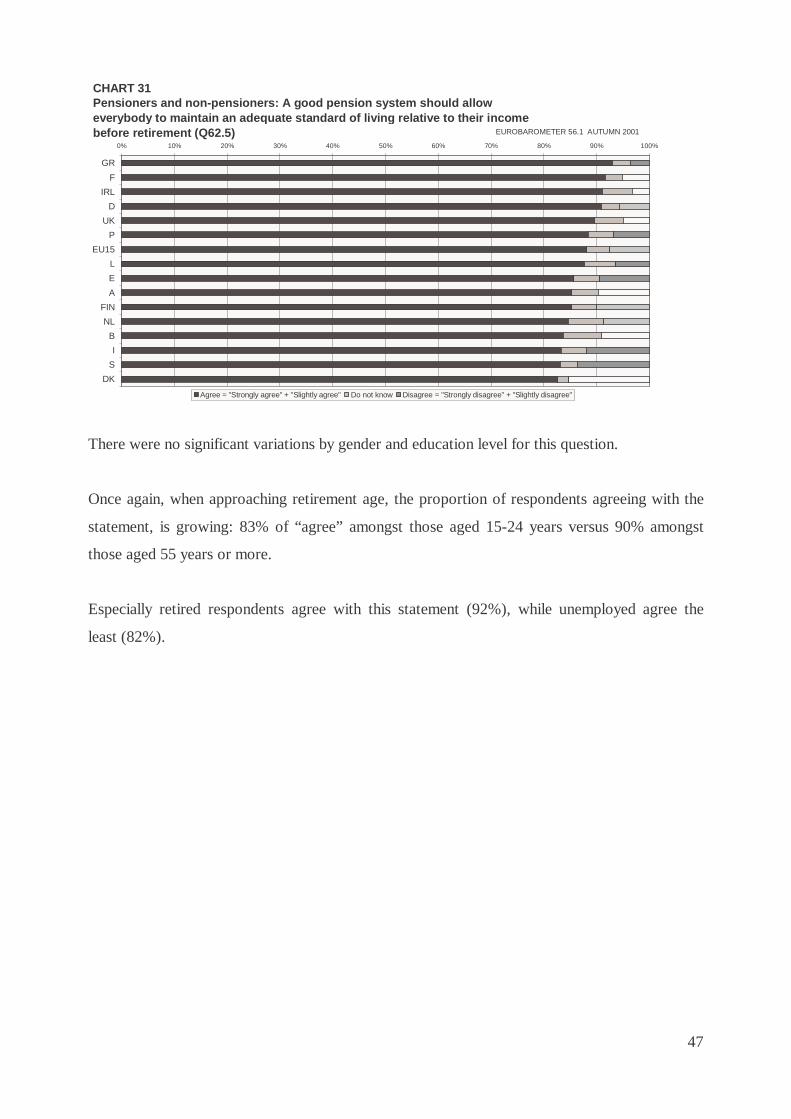
47
There were no significant variations by gender and education level for this question.
Once again, when approaching retirement age, the proportion of respondents agreeing with the
statement, is growing: 83% of “agree” amongst those aged 15-24 years versus 90% amongst
those aged 55 years or more.
Especially retired respondents agree with this statement (92%), while unemployed agree the
least (82%).
CHART 31Pensioners and non-pensioners: A good pension system should allow everybody to maintain an adequate standard of living relative to their income before retirement (Q62.5)
0% 10% 20% 30% 40% 50% 60% 70% 80% 90% 100%
GR
F
IRL
D
UK
P
EU15
L
E
A
FIN
NL
B
I
S
DK
Agree = "Strongly agree" + "Slightly agree" Do not know Disagree = "Strongly disagree" + "Slightly disagree"
EUROBAROMETER 56.1 AUTUMN 2001
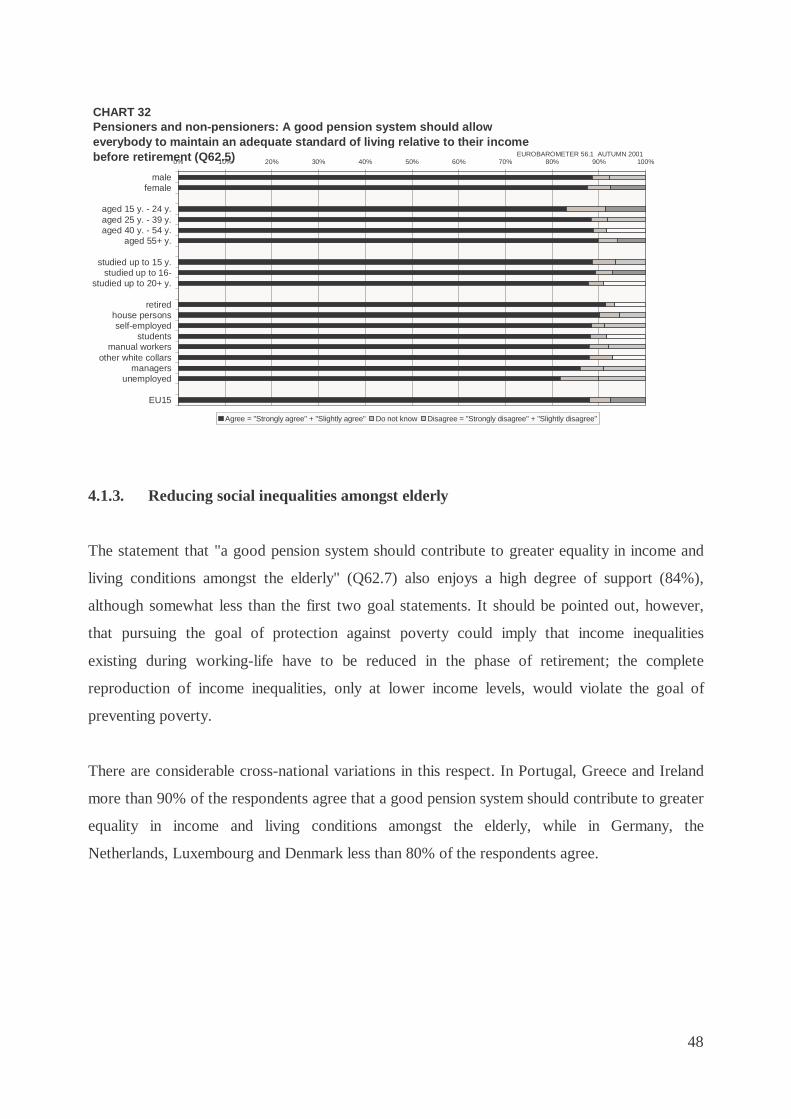
48
4.1.3. Reducing social inequalities amongst elderly
The statement that "a good pension system should contribute to greater equality in income and
living conditions amongst the elderly" (Q62.7) also enjoys a high degree of support (84%),
although somewhat less than the first two goal statements. It should be pointed out, however,
that pursuing the goal of protection against poverty could imply that income inequalities
existing during working-life have to be reduced in the phase of retirement; the complete
reproduction of income inequalities, only at lower income levels, would violate the goal of
preventing poverty.
There are considerable cross-national variations in this respect. In Portugal, Greece and Ireland
more than 90% of the respondents agree that a good pension system should contribute to greater
equality in income and living conditions amongst the elderly, while in Germany, the
Netherlands, Luxembourg and Denmark less than 80% of the respondents agree.
CHART 32Pensioners and non-pensioners: A good pension system should allow everybody to maintain an adequate standard of living relative to their income before retirement (Q62.5)0% 10% 20% 30% 40% 50% 60% 70% 80% 90% 100%
malefemale
aged 15 y. - 24 y.aged 25 y. - 39 y.aged 40 y. - 54 y.
aged 55+ y.
studied up to 15 y.studied up to 16-
studied up to 20+ y.
retiredhouse personsself-employed
studentsmanual workers
other white collarsmanagers
unemployed
EU15
Agree = "Strongly agree" + "Slightly agree" Do not know Disagree = "Strongly disagree" + "Slightly disagree"
EUROBAROMETER 56.1 AUTUMN 2001
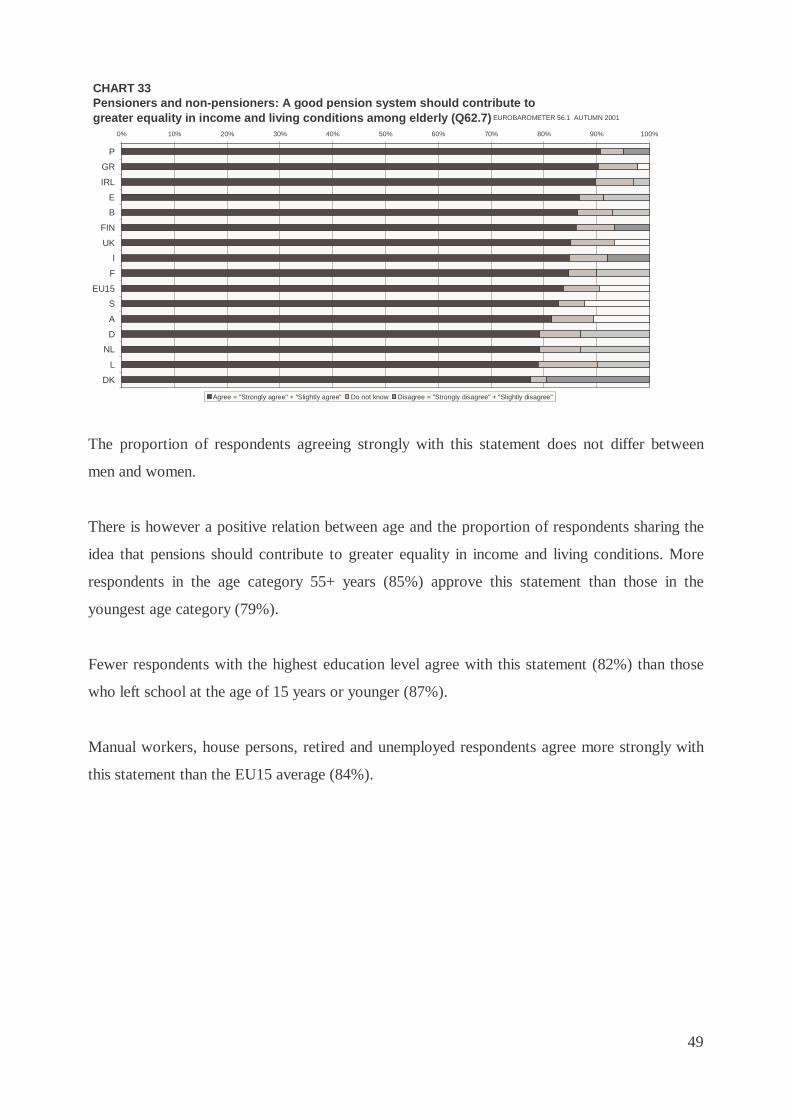
49
The proportion of respondents agreeing strongly with this statement does not differ between
men and women.
There is however a positive relation between age and the proportion of respondents sharing the
idea that pensions should contribute to greater equality in income and living conditions. More
respondents in the age category 55+ years (85%) approve this statement than those in the
youngest age category (79%).
Fewer respondents with the highest education level agree with this statement (82%) than those
who left school at the age of 15 years or younger (87%).
Manual workers, house persons, retired and unemployed respondents agree more strongly with
this statement than the EU15 average (84%).
CHART 33Pensioners and non-pensioners: A good pension system should contribute to greater equality in income and living conditions among elderly (Q62.7)
0% 10% 20% 30% 40% 50% 60% 70% 80% 90% 100%
P
GR
IRL
E
B
FIN
UK
I
F
EU15
S
A
D
NL
L
DK
Agree = "Strongly agree" + "Slightly agree" Do not know Disagree = "Strongly disagree" + "Slightly disagree"
EUROBAROMETER 56.1 AUTUMN 2001
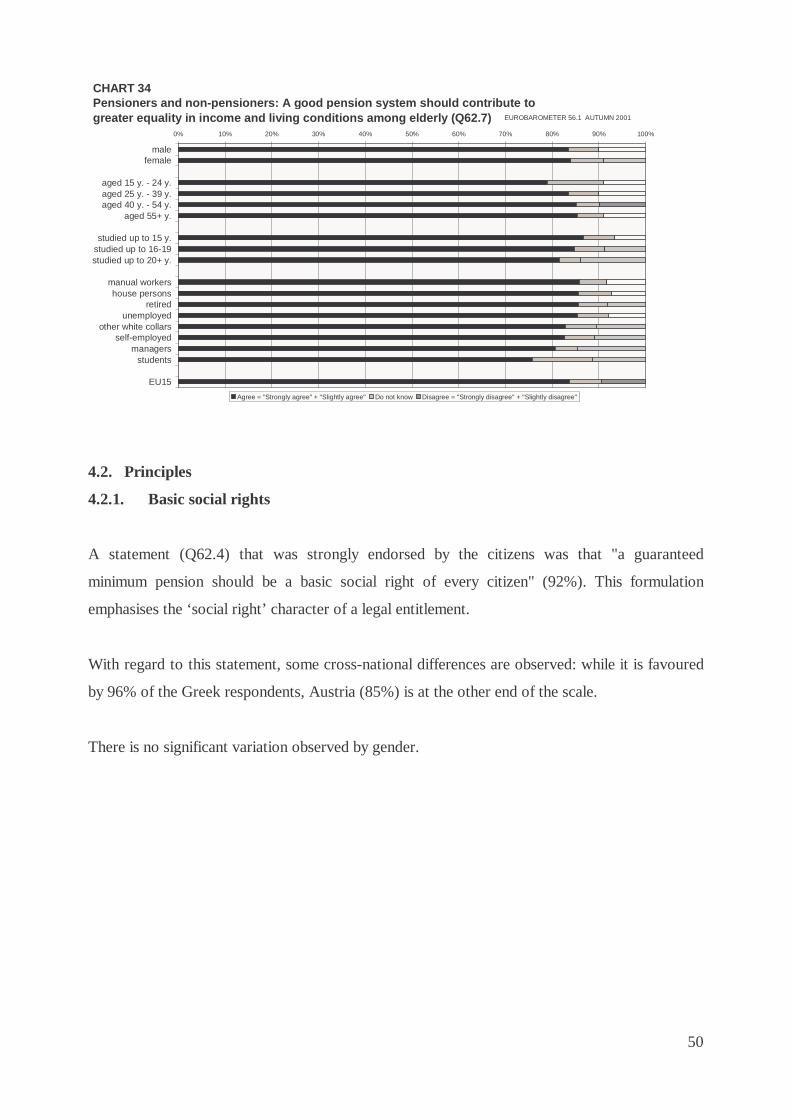
50
4.2. Principles
4.2.1. Basic social rights
A statement (Q62.4) that was strongly endorsed by the citizens was that "a guaranteed
minimum pension should be a basic social right of every citizen" (92%). This formulation
emphasises the ‘social right’ character of a legal entitlement.
With regard to this statement, some cross-national differences are observed: while it is favoured
by 96% of the Greek respondents, Austria (85%) is at the other end of the scale.
There is no significant variation observed by gender.
CHART 34Pensioners and non-pensioners: A good pension system should contribute to greater equality in income and living conditions among elderly (Q62.7)
0% 10% 20% 30% 40% 50% 60% 70% 80% 90% 100%
malefemale
aged 15 y. - 24 y.aged 25 y. - 39 y.aged 40 y. - 54 y.
aged 55+ y.
studied up to 15 y.studied up to 16-19studied up to 20+ y.
manual workershouse persons
retiredunemployed
other white collarsself-employed
managersstudents
EU15
Agree = "Strongly agree" + "Slightly agree" Do not know Disagree = "Strongly disagree" + "Slightly disagree"
EUROBAROMETER 56.1 AUTUMN 2001
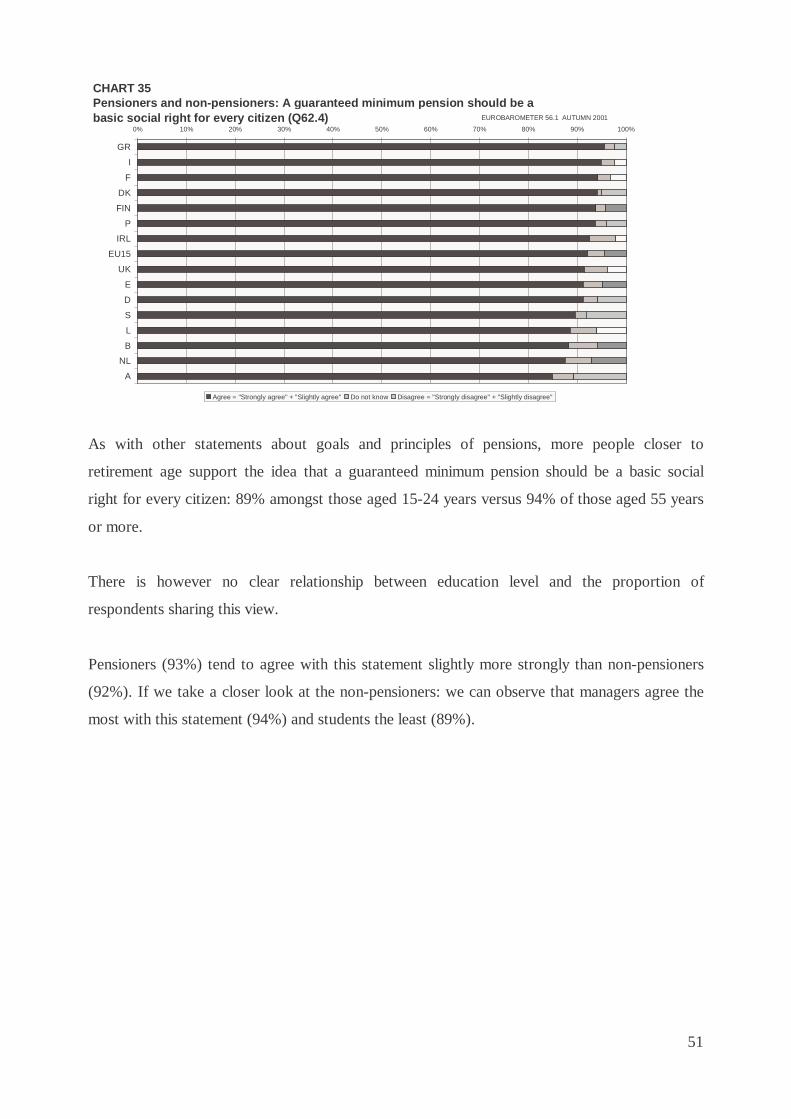
51
As with other statements about goals and principles of pensions, more people closer to
retirement age support the idea that a guaranteed minimum pension should be a basic social
right for every citizen: 89% amongst those aged 15-24 years versus 94% of those aged 55 years
or more.
There is however no clear relationship between education level and the proportion of
respondents sharing this view.
Pensioners (93%) tend to agree with this statement slightly more strongly than non-pensioners
(92%). If we take a closer look at the non-pensioners: we can observe that managers agree the
most with this statement (94%) and students the least (89%).
CHART 35Pensioners and non-pensioners: A guaranteed minimum pension should be a basic social right for every citizen (Q62.4)
0% 10% 20% 30% 40% 50% 60% 70% 80% 90% 100%
GR
I
F
DK
FIN
P
IRL
EU15
UK
E
D
S
L
B
NL
A
Agree = "Strongly agree" + "Slightly agree" Do not know Disagree = "Strongly disagree" + "Slightly disagree"
EUROBAROMETER 56.1 AUTUMN 2001
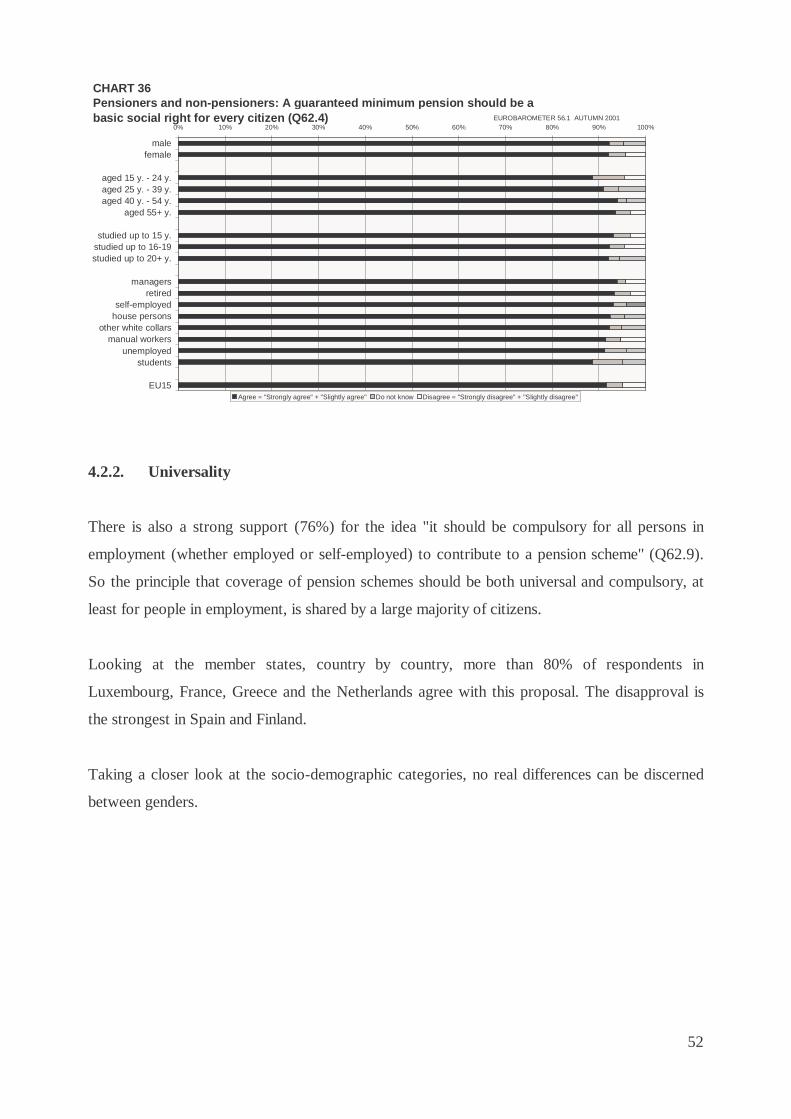
52
4.2.2. Universality
There is also a strong support (76%) for the idea "it should be compulsory for all persons in
employment (whether employed or self-employed) to contribute to a pension scheme" (Q62.9).
So the principle that coverage of pension schemes should be both universal and compulsory, at
least for people in employment, is shared by a large majority of citizens.
Looking at the member states, country by country, more than 80% of respondents in
Luxembourg, France, Greece and the Netherlands agree with this proposal. The disapproval is
the strongest in Spain and Finland.
Taking a closer look at the socio-demographic categories, no real differences can be discerned
between genders.
CHART 36Pensioners and non-pensioners: A guaranteed minimum pension should be a basic social right for every citizen (Q62.4)
0% 10% 20% 30% 40% 50% 60% 70% 80% 90% 100%
malefemale
aged 15 y. - 24 y.aged 25 y. - 39 y.aged 40 y. - 54 y.
aged 55+ y.
studied up to 15 y.studied up to 16-19studied up to 20+ y.
managersretired
self-employedhouse persons
other white collarsmanual workers
unemployedstudents
EU15Agree = "Strongly agree" + "Slightly agree" Do not know Disagree = "Strongly disagree" + "Slightly disagree"
EUROBAROMETER 56.1 AUTUMN 2001
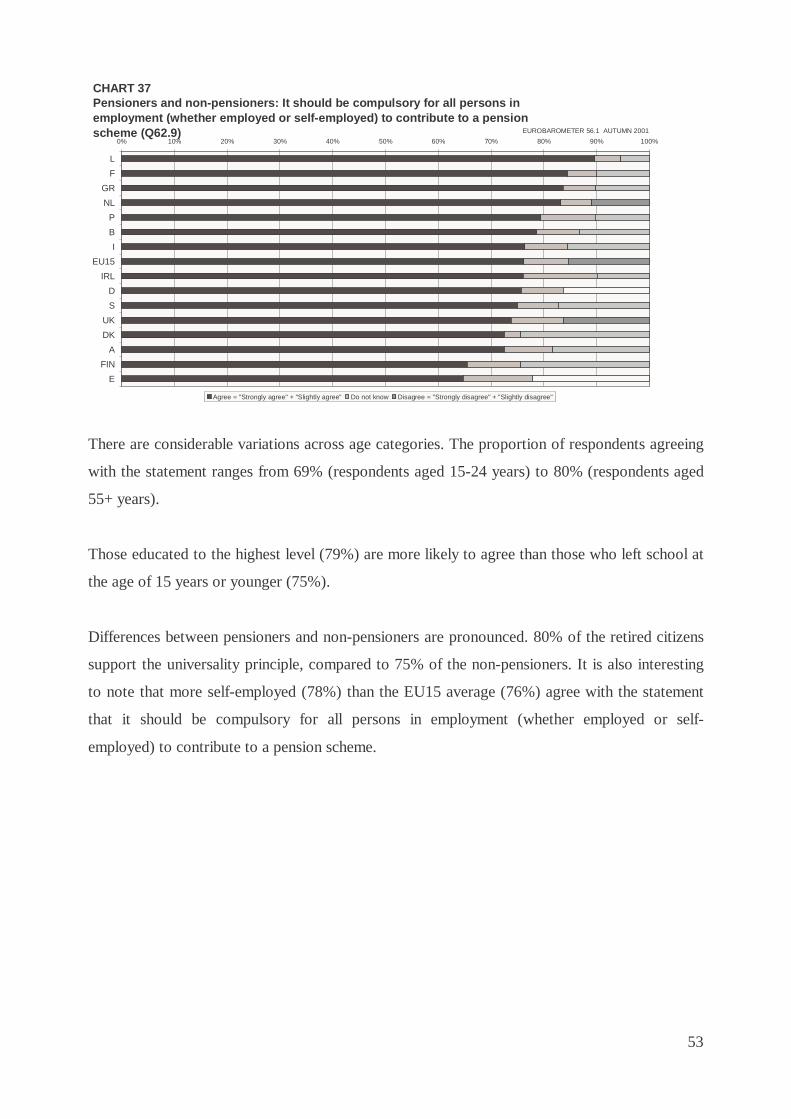
53
There are considerable variations across age categories. The proportion of respondents agreeing
with the statement ranges from 69% (respondents aged 15-24 years) to 80% (respondents aged
55+ years).
Those educated to the highest level (79%) are more likely to agree than those who left school at
the age of 15 years or younger (75%).
Differences between pensioners and non-pensioners are pronounced. 80% of the retired citizens
support the universality principle, compared to 75% of the non-pensioners. It is also interesting
to note that more self-employed (78%) than the EU15 average (76%) agree with the statement
that it should be compulsory for all persons in employment (whether employed or self-
employed) to contribute to a pension scheme.
CHART 37Pensioners and non-pensioners: It should be compulsory for all persons in employment (whether employed or self-employed) to contribute to a pension scheme (Q62.9)
0% 10% 20% 30% 40% 50% 60% 70% 80% 90% 100%
L
F
GR
NL
P
B
I
EU15
IRL
D
S
UK
DK
A
FIN
E
Agree = "Strongly agree" + "Slightly agree" Do not know Disagree = "Strongly disagree" + "Slightly disagree"
EUROBAROMETER 56.1 AUTUMN 2001
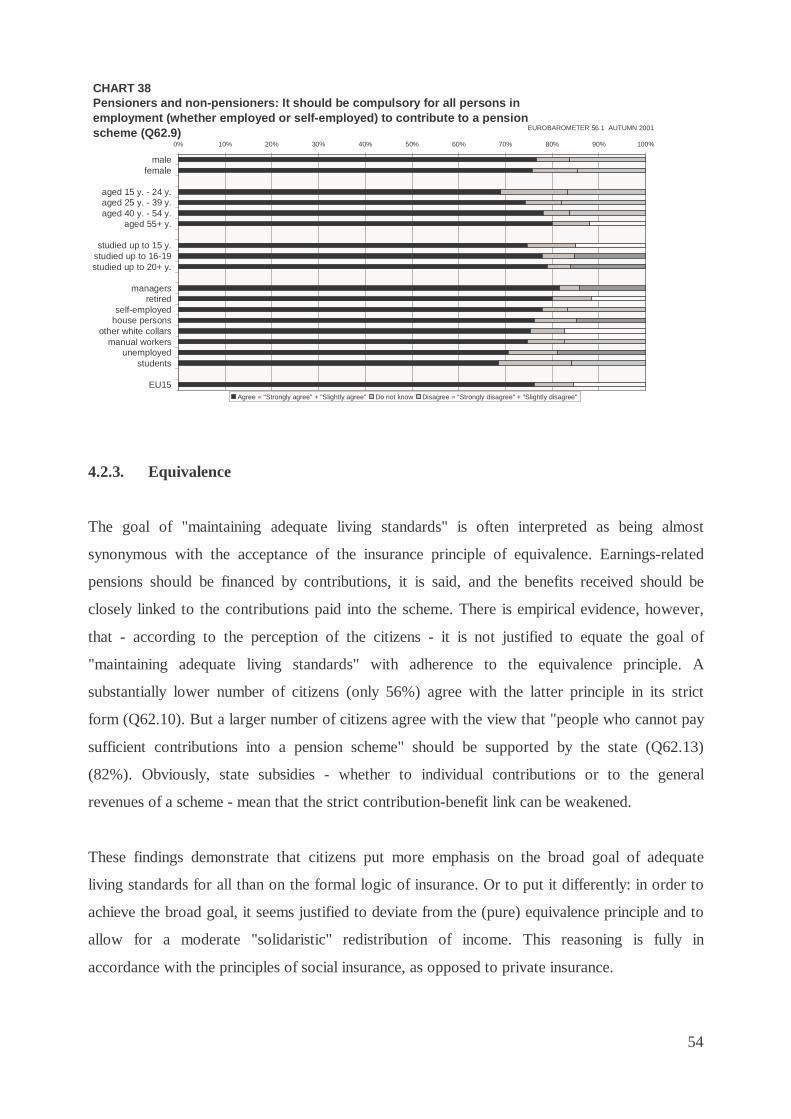
54
4.2.3. Equivalence
The goal of "maintaining adequate living standards" is often interpreted as being almost
synonymous with the acceptance of the insurance principle of equivalence. Earnings-related
pensions should be financed by contributions, it is said, and the benefits received should be
closely linked to the contributions paid into the scheme. There is empirical evidence, however,
that - according to the perception of the citizens - it is not justified to equate the goal of
"maintaining adequate living standards" with adherence to the equivalence principle. A
substantially lower number of citizens (only 56%) agree with the latter principle in its strict
form (Q62.10). But a larger number of citizens agree with the view that "people who cannot pay
sufficient contributions into a pension scheme" should be supported by the state (Q62.13)
(82%). Obviously, state subsidies - whether to individual contributions or to the general
revenues of a scheme - mean that the strict contribution-benefit link can be weakened.
These findings demonstrate that citizens put more emphasis on the broad goal of adequate
living standards for all than on the formal logic of insurance. Or to put it differently: in order to
achieve the broad goal, it seems justified to deviate from the (pure) equivalence principle and to
allow for a moderate "solidaristic" redistribution of income. This reasoning is fully in
accordance with the principles of social insurance, as opposed to private insurance.
CHART 38Pensioners and non-pensioners: It should be compulsory for all persons in employment (whether employed or self-employed) to contribute to a pension scheme (Q62.9)
0% 10% 20% 30% 40% 50% 60% 70% 80% 90% 100%
malefemale
aged 15 y. - 24 y.aged 25 y. - 39 y.aged 40 y. - 54 y.
aged 55+ y.
studied up to 15 y.studied up to 16-19studied up to 20+ y.
managersretired
self-employedhouse persons
other white collarsmanual workers
unemployedstudents
EU15Agree = "Strongly agree" + "Slightly agree" Do not know Disagree = "Strongly disagree" + "Slightly disagree"
EUROBAROMETER 56.1 AUTUMN 2001

55
In all countries a bigger proportion of citizens agrees with the view that “people who cannot pay
sufficient contributions into a pension scheme should be supported by the state" (Q62.13) than
with the strict equivalence principle (Q62.10). Germany is the only exceptions in this regard:
German citizens put more emphasis on the equivalence principle than on the “solidaristic”
redistribution of income.
No significant differences were observed by gender or education level.
All age categories put more emphasis on the “solidaristic” redistribution of income than on the
strict equivalence principle. However, it should be stressed that more respondents close to
retirement age agree with the equivalence principle than younger respondents (66% amongst
those age 55+ y. versus 57% amongst those aged 15 – 24 years), whereas there are no
significant variations between age categories as far as the acceptance of the “solidaristic”
redistribution of income is concerned.
Both pensioners and non-pensioners put more emphasis on the “solidaristic” redistribution of
income than on the strict equivalence principle. The proportion of unemployed respondents
agreeing with the “solidaristic” redistribution of income is remarkable: while the EU15 average
is at 78%, 84% of the unemployed agree with the statement that “people who cannot pay
sufficient contributions into a pension scheme should be supported by the state".
7370
66
93
8183
797878
6882
8683
90
7245
4653
555556
5859
6063
65
68
76
80
76
5674
0% 10% 20% 30% 40% 50% 60% 70% 80% 90% 100%
IDK
DUK
SFB
NLL
IRLEU15
FINPEA
GR
Agree that benefits = contribution Agree that benefits = contribution + state support
CHART 39Pensioners and non-pensioners:The amount of one's pension should be strictly based on the amount of contributions one has paid into the pensi People who cannot pay sufficient contributions into a pension scheme (e.g. unemployed, those on low earnings)extra help from the state for old age (Q62.13)
EUROBAROMETER 56.1 AUTUMN 2001
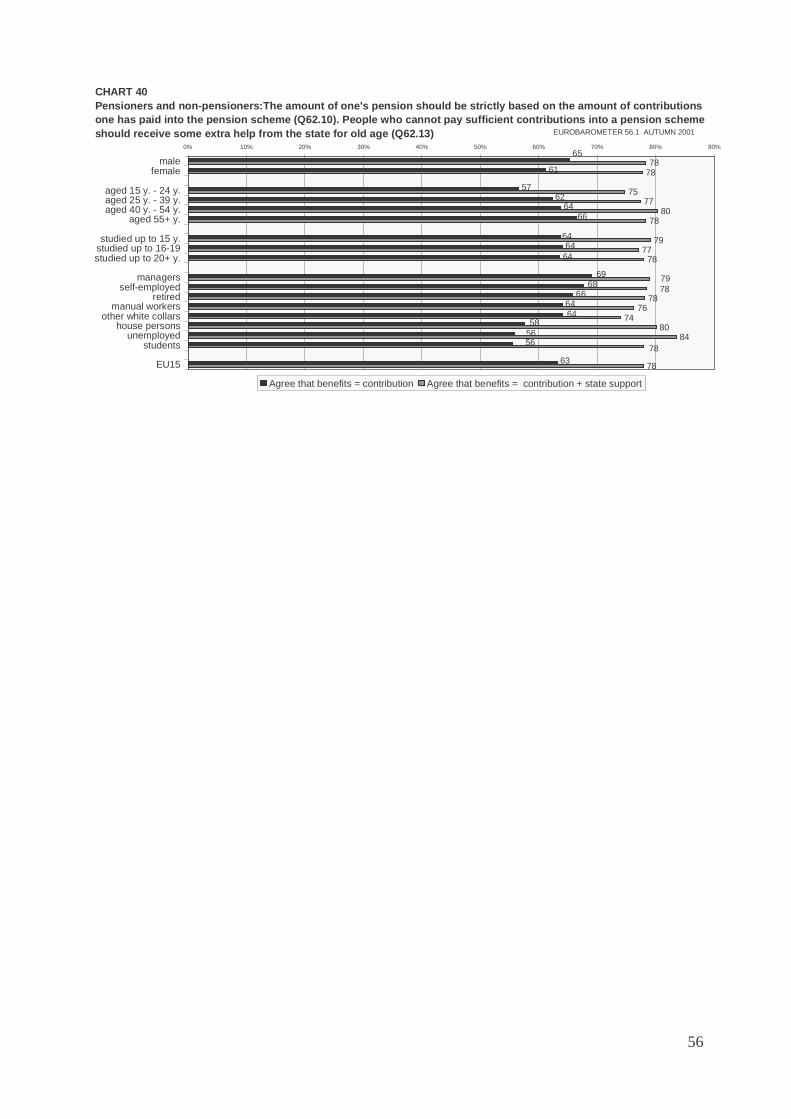
56
6178
78
7577
8078
7977
78
7876
7480
84
78
65
6664
5762
66
63
6464
64
6968
6464
58
5656
7978
78
0% 10% 20% 30% 40% 50% 60% 70% 80% 90%
malefemale
aged 15 y. - 24 y.aged 25 y. - 39 y.aged 40 y. - 54 y.
aged 55+ y.
studied up to 15 y.studied up to 16-19studied up to 20+ y.
managersself-employed
retiredmanual workers
other white collarshouse persons
unemployedstudents
EU15
Agree that benefits = contribution Agree that benefits = contribution + state support
CHART 40Pensioners and non-pensioners:The amount of one's pension should be strictly based on the amount of contributions one has paid into the pension scheme (Q62.10). People who cannot pay sufficient contributions into a pension scheme should receive some extra help from the state for old age (Q62.13) EUROBAROMETER 56.1 AUTUMN 2001
57
5. Opinions on pension reform options proposals
Since pension schemes in most countries frequently face severe financial crises in economic
downturns, and since foreseeable demographic shifts will lead to increased financial pressures,
we found it useful to ask citizens about their opinions concerning currently debated policy
options. These options can be broken down in two categories: one group are proposals which
have a direct influence on the parameters of pension systems (5.2.), and another group
comprises certain proposals which may indirectly help to solve or alleviate the problems of
financing pensions (5.2.).
In order to ensure comparability across countries, these proposals had to be formulated as
general approaches to cope with the problems, disregarding institutional peculiarities of national
pension systems (Q67).
5.1. Direct changes in parameters of pensions systems
The main alternative options for stabilising the balance between revenues and expenditures of
public pension schemes are the following:
• Maintaining benefit levels by increasing contribution rates and/or taxes (5.1.1.)
• Reducing benefit levels in order to maintain contribution rates (5.1.2.)
• Raising the age of retirement (5.1.3.)
The trade-offs were explicitly mentioned in the wording of the question, although the
implications could not be quantified.
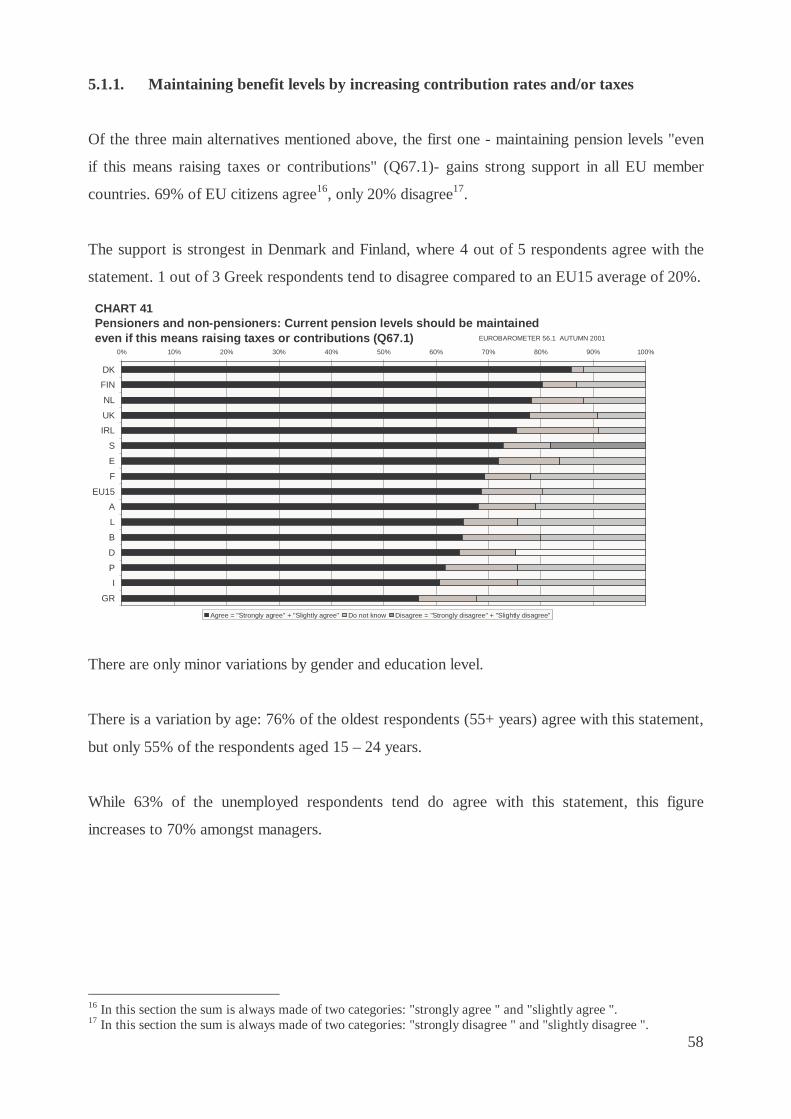
58
5.1.1. Maintaining benefit levels by increasing contribution rates and/or taxes
Of the three main alternatives mentioned above, the first one - maintaining pension levels "even
if this means raising taxes or contributions" (Q67.1)- gains strong support in all EU member
countries. 69% of EU citizens agree16, only 20% disagree17.
The support is strongest in Denmark and Finland, where 4 out of 5 respondents agree with the
statement. 1 out of 3 Greek respondents tend to disagree compared to an EU15 average of 20%.
There are only minor variations by gender and education level.
There is a variation by age: 76% of the oldest respondents (55+ years) agree with this statement,
but only 55% of the respondents aged 15 – 24 years.
While 63% of the unemployed respondents tend do agree with this statement, this figure
increases to 70% amongst managers.
16 In this section the sum is always made of two categories: "strongly agree " and "slightly agree ". 17 In this section the sum is always made of two categories: "strongly disagree " and "slightly disagree ".
CHART 41Pensioners and non-pensioners: Current pension levels should be maintained even if this means raising taxes or contributions (Q67.1)
0% 10% 20% 30% 40% 50% 60% 70% 80% 90% 100%
DK
FIN
NL
UK
IRL
S
E
F
EU15
A
L
B
D
P
I
GR
Agree = "Strongly agree" + "Slightly agree" Do not know Disagree = "Strongly disagree" + "Slightly disagree"
EUROBAROMETER 56.1 AUTUMN 2001
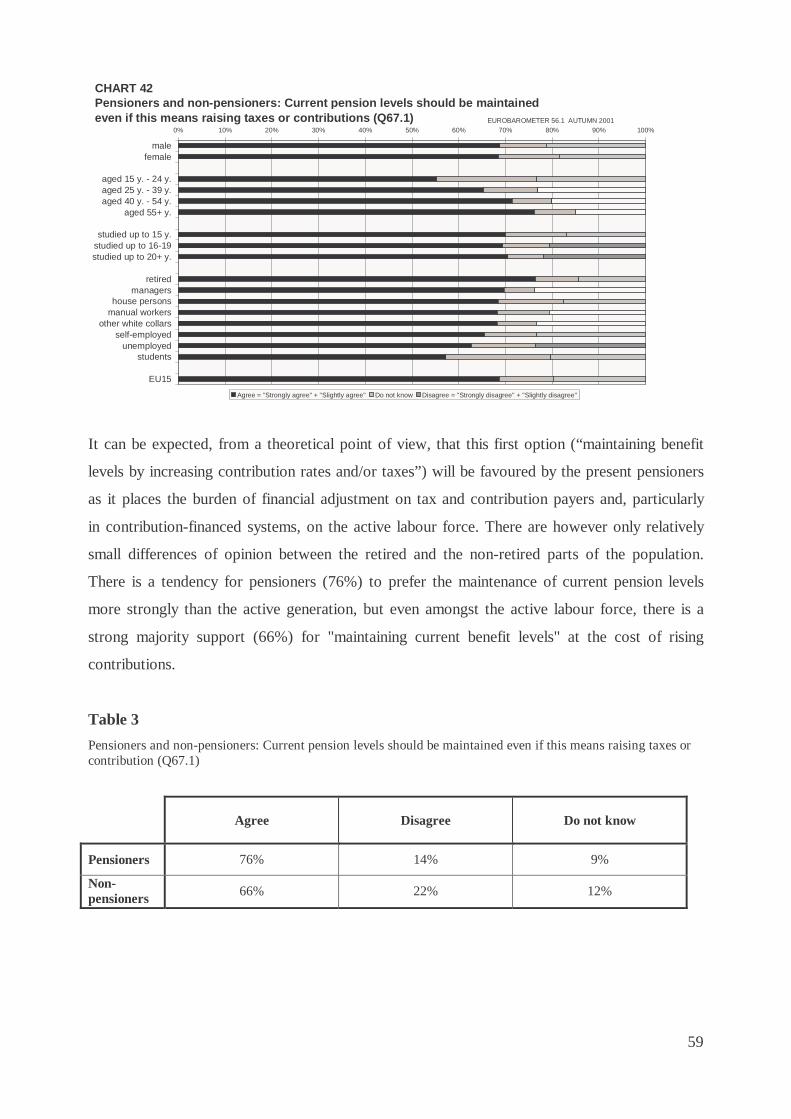
59
It can be expected, from a theoretical point of view, that this first option (“maintaining benefit
levels by increasing contribution rates and/or taxes”) will be favoured by the present pensioners
as it places the burden of financial adjustment on tax and contribution payers and, particularly
in contribution-financed systems, on the active labour force. There are however only relatively
small differences of opinion between the retired and the non-retired parts of the population.
There is a tendency for pensioners (76%) to prefer the maintenance of current pension levels
more strongly than the active generation, but even amongst the active labour force, there is a
strong majority support (66%) for "maintaining current benefit levels" at the cost of rising
contributions.
Table 3
Pensioners and non-pensioners: Current pension levels should be maintained even if this means raising taxes or contribution (Q67.1)
Agree Disagree Do not know
Pensioners 76% 14% 9%
Non-pensioners 66% 22% 12%
CHART 42Pensioners and non-pensioners: Current pension levels should be maintained even if this means raising taxes or contributions (Q67.1)
0% 10% 20% 30% 40% 50% 60% 70% 80% 90% 100%
malefemale
aged 15 y. - 24 y.aged 25 y. - 39 y.aged 40 y. - 54 y.
aged 55+ y.
studied up to 15 y.studied up to 16-19studied up to 20+ y.
retiredmanagers
house personsmanual workers
other white collarsself-employed
unemployedstudents
EU15
Agree = "Strongly agree" + "Slightly agree" Do not know Disagree = "Strongly disagree" + "Slightly disagree"
EUROBAROMETER 56.1 AUTUMN 2001
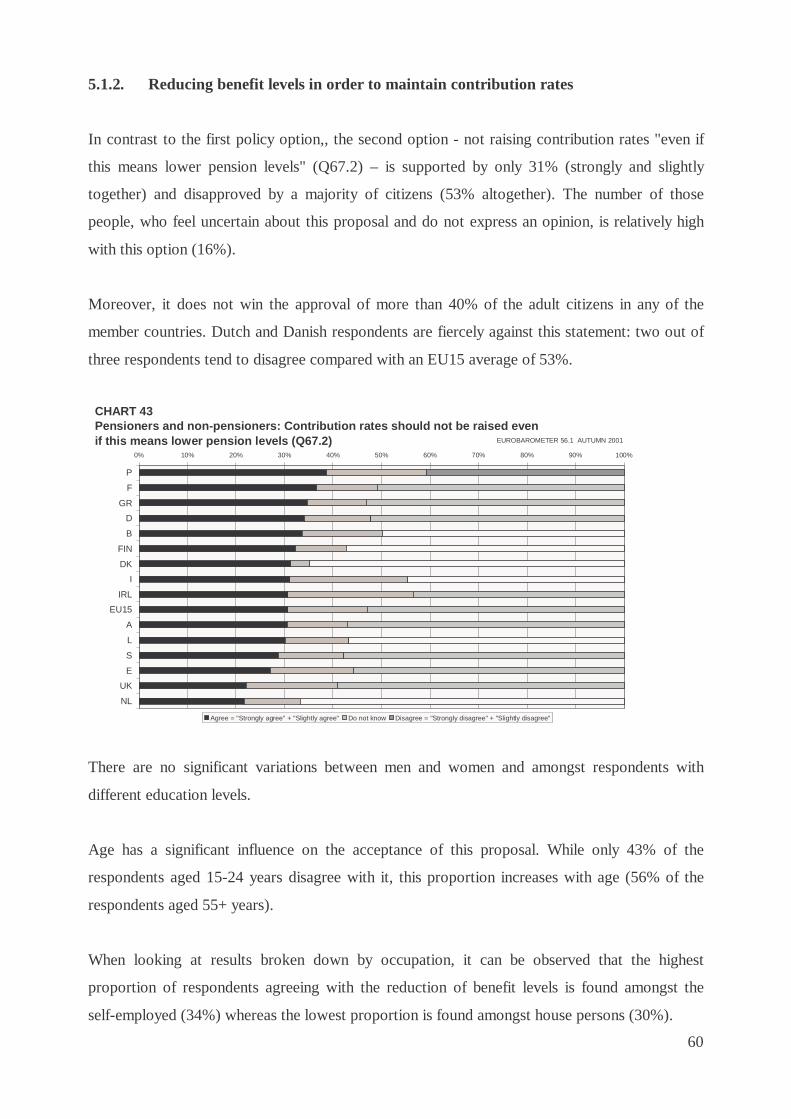
60
5.1.2. Reducing benefit levels in order to maintain contribution rates
In contrast to the first policy option,, the second option - not raising contribution rates "even if
this means lower pension levels" (Q67.2) – is supported by only 31% (strongly and slightly
together) and disapproved by a majority of citizens (53% altogether). The number of those
people, who feel uncertain about this proposal and do not express an opinion, is relatively high
with this option (16%).
Moreover, it does not win the approval of more than 40% of the adult citizens in any of the
member countries. Dutch and Danish respondents are fiercely against this statement: two out of
three respondents tend to disagree compared with an EU15 average of 53%.
There are no significant variations between men and women and amongst respondents with
different education levels.
Age has a significant influence on the acceptance of this proposal. While only 43% of the
respondents aged 15-24 years disagree with it, this proportion increases with age (56% of the
respondents aged 55+ years).
When looking at results broken down by occupation, it can be observed that the highest
proportion of respondents agreeing with the reduction of benefit levels is found amongst the
self-employed (34%) whereas the lowest proportion is found amongst house persons (30%).
CHART 43Pensioners and non-pensioners: Contribution rates should not be raised even if this means lower pension levels (Q67.2)
0% 10% 20% 30% 40% 50% 60% 70% 80% 90% 100%
P
F
GR
D
B
FIN
DK
I
IRL
EU15
A
L
S
E
UK
NL
Agree = "Strongly agree" + "Slightly agree" Do not know Disagree = "Strongly disagree" + "Slightly disagree"
EUROBAROMETER 56.1 AUTUMN 2001
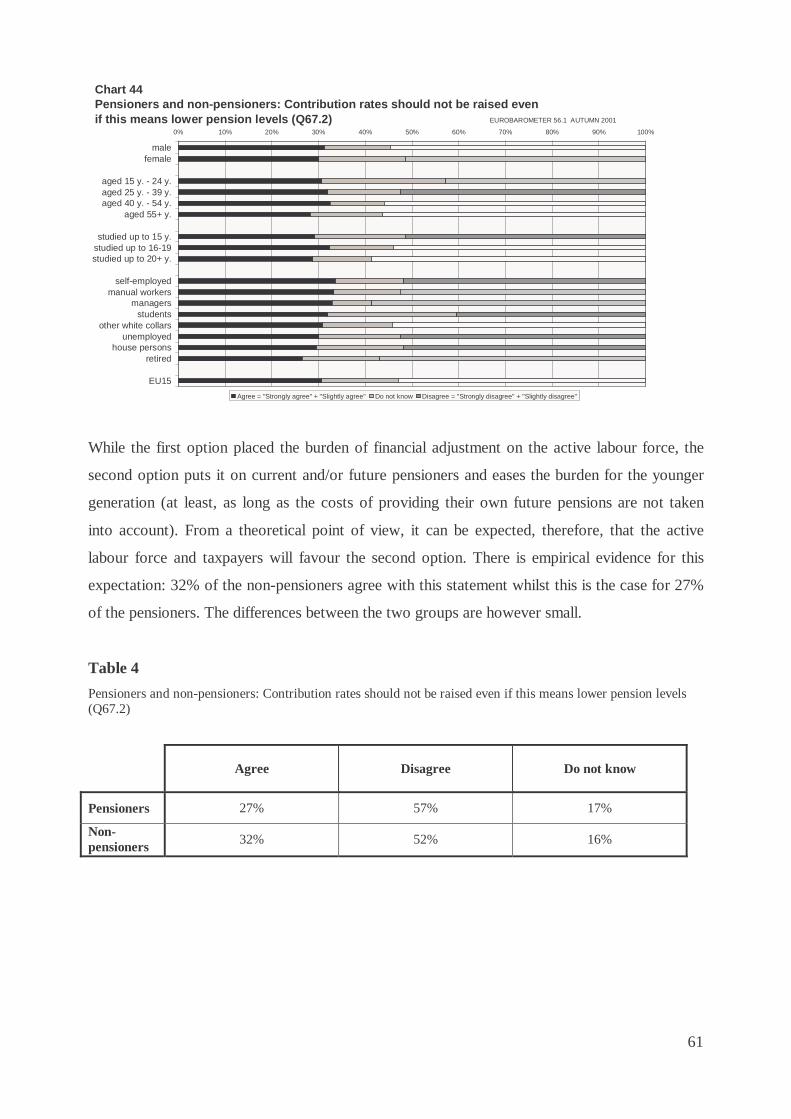
61
While the first option placed the burden of financial adjustment on the active labour force, the
second option puts it on current and/or future pensioners and eases the burden for the younger
generation (at least, as long as the costs of providing their own future pensions are not taken
into account). From a theoretical point of view, it can be expected, therefore, that the active
labour force and taxpayers will favour the second option. There is empirical evidence for this
expectation: 32% of the non-pensioners agree with this statement whilst this is the case for 27%
of the pensioners. The differences between the two groups are however small.
Table 4
Pensioners and non-pensioners: Contribution rates should not be raised even if this means lower pension levels (Q67.2)
Agree Disagree Do not know
Pensioners 27% 57% 17%
Non-pensioners 32% 52% 16%
Chart 44Pensioners and non-pensioners: Contribution rates should not be raised even if this means lower pension levels (Q67.2)
0% 10% 20% 30% 40% 50% 60% 70% 80% 90% 100%
malefemale
aged 15 y. - 24 y.aged 25 y. - 39 y.aged 40 y. - 54 y.
aged 55+ y.
studied up to 15 y.studied up to 16-19studied up to 20+ y.
self-employedmanual workers
managersstudents
other white collarsunemployed
house personsretired
EU15
Agree = "Strongly agree" + "Slightly agree" Do not know Disagree = "Strongly disagree" + "Slightly disagree"
EUROBAROMETER 56.1 AUTUMN 2001
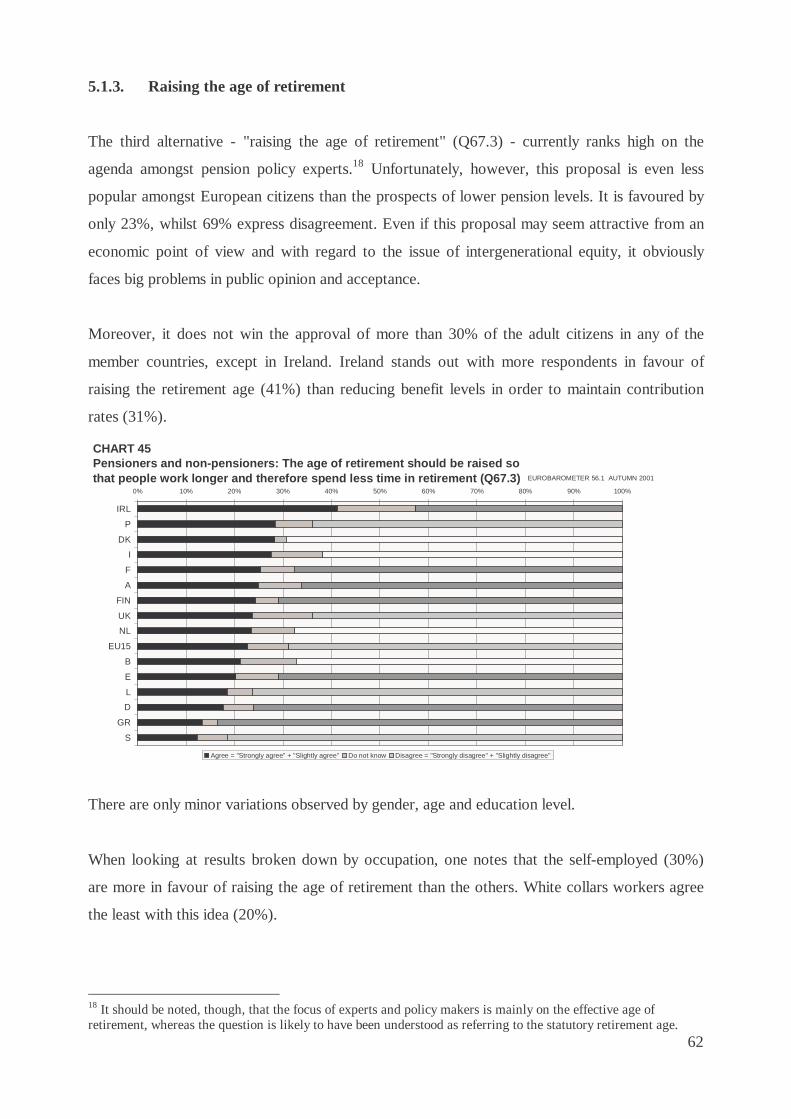
62
5.1.3. Raising the age of retirement
The third alternative - "raising the age of retirement" (Q67.3) - currently ranks high on the
agenda amongst pension policy experts.18 Unfortunately, however, this proposal is even less
popular amongst European citizens than the prospects of lower pension levels. It is favoured by
only 23%, whilst 69% express disagreement. Even if this proposal may seem attractive from an
economic point of view and with regard to the issue of intergenerational equity, it obviously
faces big problems in public opinion and acceptance.
Moreover, it does not win the approval of more than 30% of the adult citizens in any of the
member countries, except in Ireland. Ireland stands out with more respondents in favour of
raising the retirement age (41%) than reducing benefit levels in order to maintain contribution
rates (31%).
There are only minor variations observed by gender, age and education level.
When looking at results broken down by occupation, one notes that the self-employed (30%)
are more in favour of raising the age of retirement than the others. White collars workers agree
the least with this idea (20%).
18 It should be noted, though, that the focus of experts and policy makers is mainly on the effective age of retirement, whereas the question is likely to have been understood as referring to the statutory retirement age.
CHART 45Pensioners and non-pensioners: The age of retirement should be raised so that people work longer and therefore spend less time in retirement (Q67.3)
0% 10% 20% 30% 40% 50% 60% 70% 80% 90% 100%
IRL
P
DK
I
F
A
FIN
UK
NL
EU15
B
E
L
D
GR
S
Agree = "Strongly agree" + "Slightly agree" Do not know Disagree = "Strongly disagree" + "Slightly disagree"
EUROBAROMETER 56.1 AUTUMN 2001
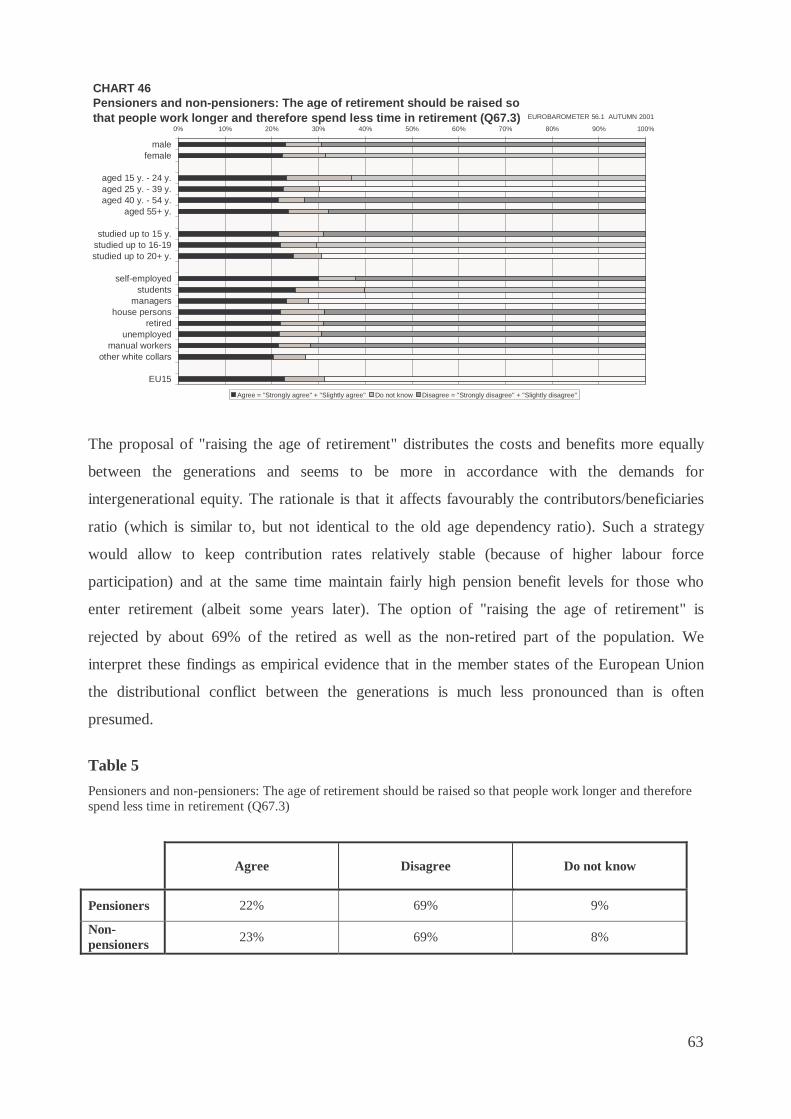
63
The proposal of "raising the age of retirement" distributes the costs and benefits more equally
between the generations and seems to be more in accordance with the demands for
intergenerational equity. The rationale is that it affects favourably the contributors/beneficiaries
ratio (which is similar to, but not identical to the old age dependency ratio). Such a strategy
would allow to keep contribution rates relatively stable (because of higher labour force
participation) and at the same time maintain fairly high pension benefit levels for those who
enter retirement (albeit some years later). The option of "raising the age of retirement" is
rejected by about 69% of the retired as well as the non-retired part of the population. We
interpret these findings as empirical evidence that in the member states of the European Union
the distributional conflict between the generations is much less pronounced than is often
presumed.
Table 5
Pensioners and non-pensioners: The age of retirement should be raised so that people work longer and therefore spend less time in retirement (Q67.3)
Agree Disagree Do not know
Pensioners 22% 69% 9%
Non-pensioners 23% 69% 8%
CHART 46Pensioners and non-pensioners: The age of retirement should be raised so that people work longer and therefore spend less time in retirement (Q67.3)
0% 10% 20% 30% 40% 50% 60% 70% 80% 90% 100%
malefemale
aged 15 y. - 24 y.aged 25 y. - 39 y.aged 40 y. - 54 y.
aged 55+ y.
studied up to 15 y.studied up to 16-19studied up to 20+ y.
self-employedstudents
managershouse persons
retiredunemployed
manual workersother white collars
EU15
Agree = "Strongly agree" + "Slightly agree" Do not know Disagree = "Strongly disagree" + "Slightly disagree"
EUROBAROMETER 56.1 AUTUMN 2001
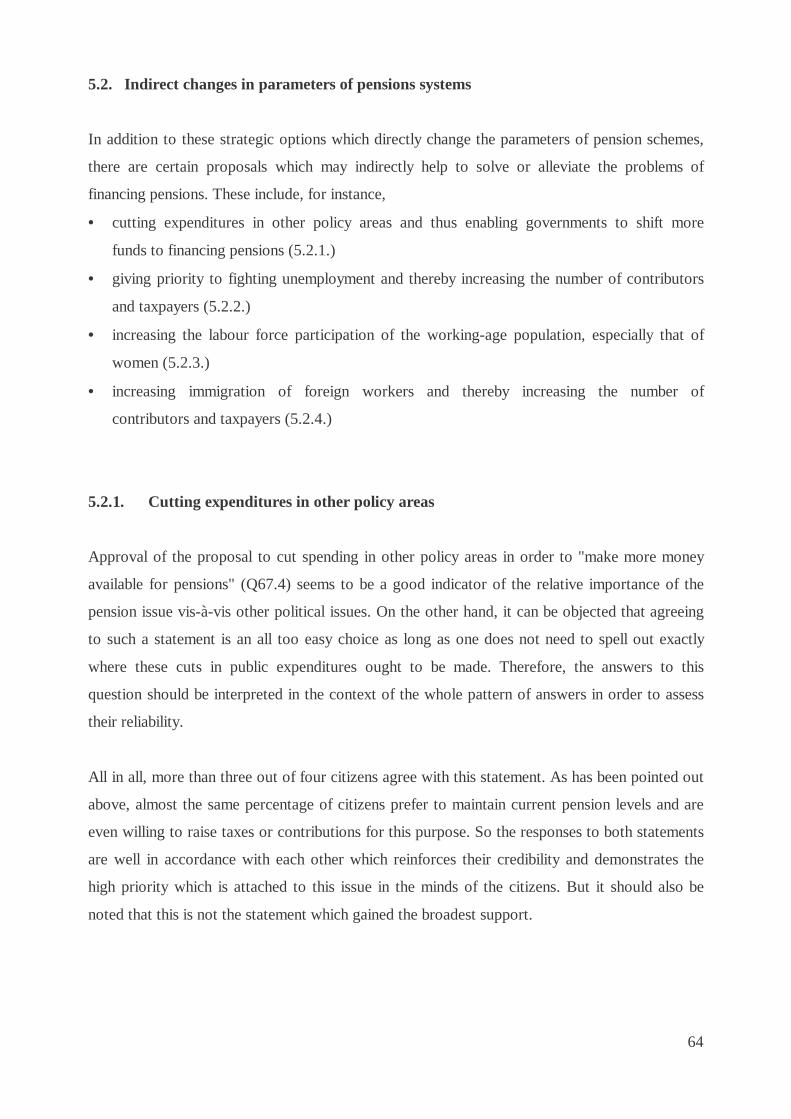
64
5.2. Indirect changes in parameters of pensions systems
In addition to these strategic options which directly change the parameters of pension schemes,
there are certain proposals which may indirectly help to solve or alleviate the problems of
financing pensions. These include, for instance,
• cutting expenditures in other policy areas and thus enabling governments to shift more
funds to financing pensions (5.2.1.)
• giving priority to fighting unemployment and thereby increasing the number of contributors
and taxpayers (5.2.2.)
• increasing the labour force participation of the working-age population, especially that of
women (5.2.3.)
• increasing immigration of foreign workers and thereby increasing the number of
contributors and taxpayers (5.2.4.)
5.2.1. Cutting expenditures in other policy areas
Approval of the proposal to cut spending in other policy areas in order to "make more money
available for pensions" (Q67.4) seems to be a good indicator of the relative importance of the
pension issue vis-à-vis other political issues. On the other hand, it can be objected that agreeing
to such a statement is an all too easy choice as long as one does not need to spell out exactly
where these cuts in public expenditures ought to be made. Therefore, the answers to this
question should be interpreted in the context of the whole pattern of answers in order to assess
their reliability.
All in all, more than three out of four citizens agree with this statement. As has been pointed out
above, almost the same percentage of citizens prefer to maintain current pension levels and are
even willing to raise taxes or contributions for this purpose. So the responses to both statements
are well in accordance with each other which reinforces their credibility and demonstrates the
high priority which is attached to this issue in the minds of the citizens. But it should also be
noted that this is not the statement which gained the broadest support.
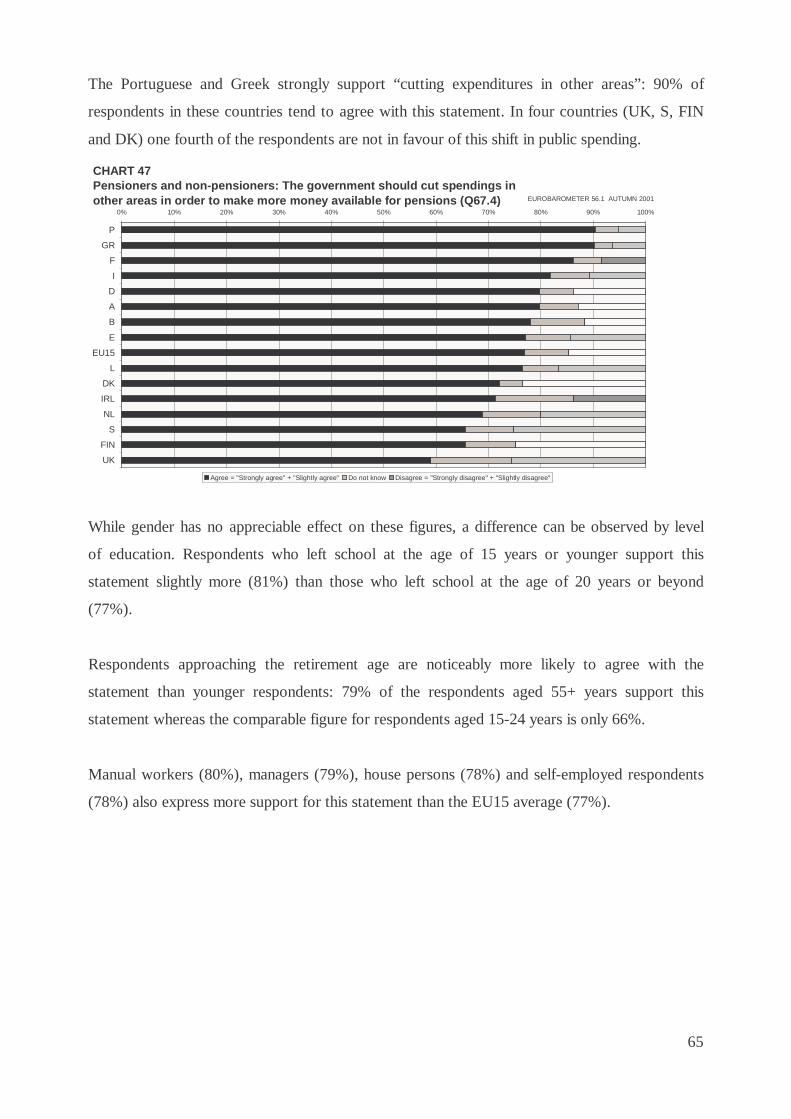
65
The Portuguese and Greek strongly support “cutting expenditures in other areas”: 90% of
respondents in these countries tend to agree with this statement. In four countries (UK, S, FIN
and DK) one fourth of the respondents are not in favour of this shift in public spending.
While gender has no appreciable effect on these figures, a difference can be observed by level
of education. Respondents who left school at the age of 15 years or younger support this
statement slightly more (81%) than those who left school at the age of 20 years or beyond
(77%).
Respondents approaching the retirement age are noticeably more likely to agree with the
statement than younger respondents: 79% of the respondents aged 55+ years support this
statement whereas the comparable figure for respondents aged 15-24 years is only 66%.
Manual workers (80%), managers (79%), house persons (78%) and self-employed respondents
(78%) also express more support for this statement than the EU15 average (77%).
CHART 47Pensioners and non-pensioners: The government should cut spendings in other areas in order to make more money available for pensions (Q67.4)
0% 10% 20% 30% 40% 50% 60% 70% 80% 90% 100%
P
GR
F
I
D
A
B
E
EU15
L
DK
IRL
NL
S
FIN
UK
Agree = "Strongly agree" + "Slightly agree" Do not know Disagree = "Strongly disagree" + "Slightly disagree"
EUROBAROMETER 56.1 AUTUMN 2001
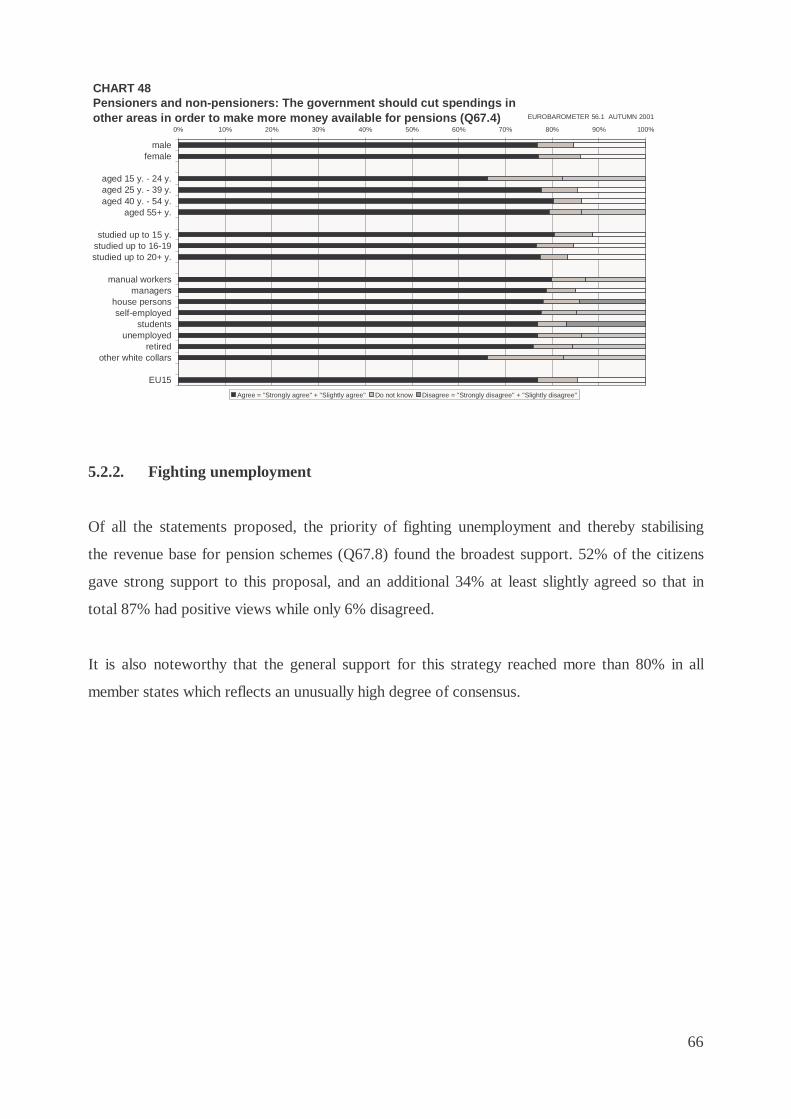
66
5.2.2. Fighting unemployment
Of all the statements proposed, the priority of fighting unemployment and thereby stabilising
the revenue base for pension schemes (Q67.8) found the broadest support. 52% of the citizens
gave strong support to this proposal, and an additional 34% at least slightly agreed so that in
total 87% had positive views while only 6% disagreed.
It is also noteworthy that the general support for this strategy reached more than 80% in all
member states which reflects an unusually high degree of consensus.
CHART 48Pensioners and non-pensioners: The government should cut spendings in other areas in order to make more money available for pensions (Q67.4)
0% 10% 20% 30% 40% 50% 60% 70% 80% 90% 100%
malefemale
aged 15 y. - 24 y.aged 25 y. - 39 y.aged 40 y. - 54 y.
aged 55+ y.
studied up to 15 y.studied up to 16-19studied up to 20+ y.
manual workersmanagers
house personsself-employed
studentsunemployed
retiredother white collars
EU15
Agree = "Strongly agree" + "Slightly agree" Do not know Disagree = "Strongly disagree" + "Slightly disagree"
EUROBAROMETER 56.1 AUTUMN 2001
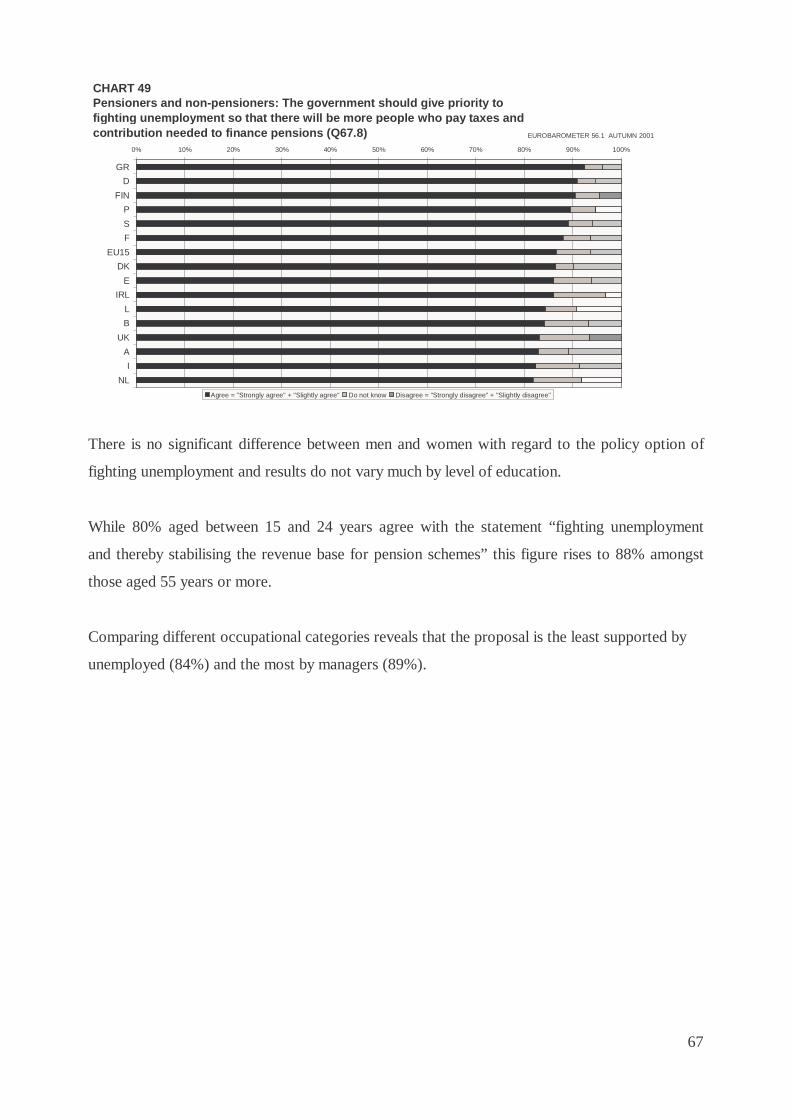
67
There is no significant difference between men and women with regard to the policy option of
fighting unemployment and results do not vary much by level of education.
While 80% aged between 15 and 24 years agree with the statement “fighting unemployment
and thereby stabilising the revenue base for pension schemes” this figure rises to 88% amongst
those aged 55 years or more.
Comparing different occupational categories reveals that the proposal is the least supported by
unemployed (84%) and the most by managers (89%).
CHART 49Pensioners and non-pensioners: The government should give priority to fighting unemployment so that there will be more people who pay taxes and contribution needed to finance pensions (Q67.8)
0% 10% 20% 30% 40% 50% 60% 70% 80% 90% 100%
GR
D
FIN
P
S
F
EU15
DK
E
IRL
L
B
UK
A
I
NL
Agree = "Strongly agree" + "Slightly agree" Do not know Disagree = "Strongly disagree" + "Slightly disagree"
EUROBAROMETER 56.1 AUTUMN 2001
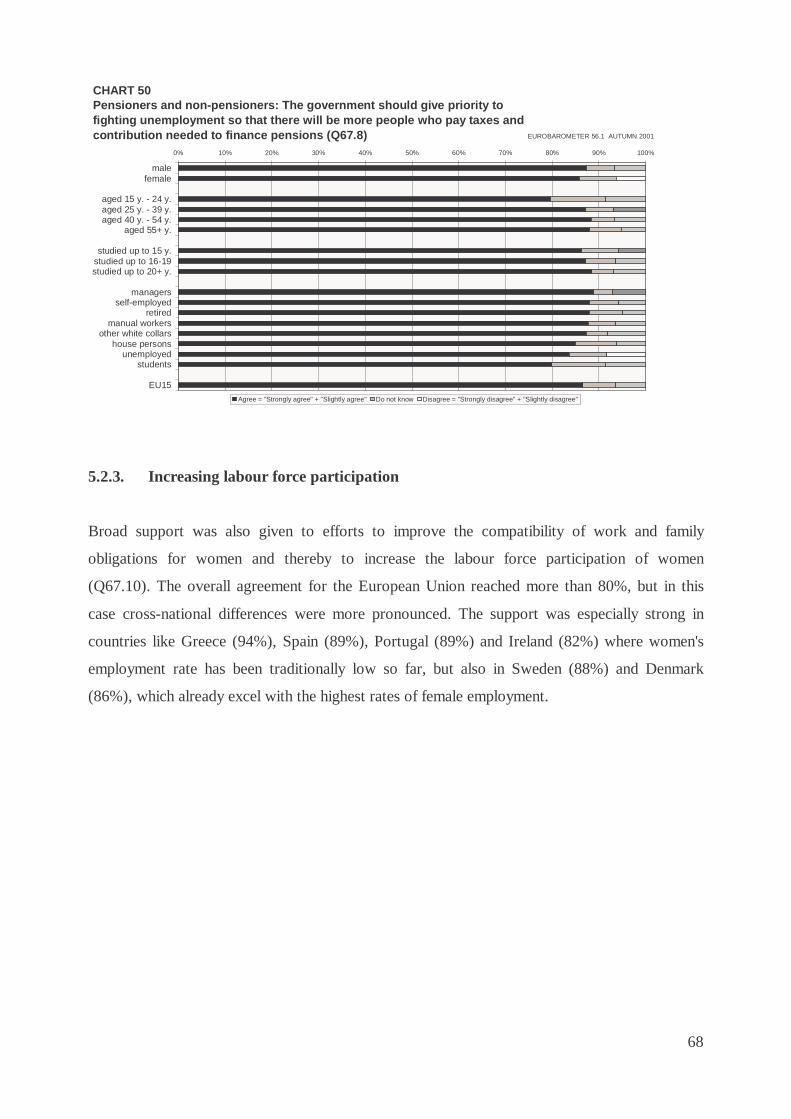
68
5.2.3. Increasing labour force participation
Broad support was also given to efforts to improve the compatibility of work and family
obligations for women and thereby to increase the labour force participation of women
(Q67.10). The overall agreement for the European Union reached more than 80%, but in this
case cross-national differences were more pronounced. The support was especially strong in
countries like Greece (94%), Spain (89%), Portugal (89%) and Ireland (82%) where women's
employment rate has been traditionally low so far, but also in Sweden (88%) and Denmark
(86%), which already excel with the highest rates of female employment.
CHART 50Pensioners and non-pensioners: The government should give priority to fighting unemployment so that there will be more people who pay taxes and contribution needed to finance pensions (Q67.8)
0% 10% 20% 30% 40% 50% 60% 70% 80% 90% 100%
malefemale
aged 15 y. - 24 y.aged 25 y. - 39 y.aged 40 y. - 54 y.
aged 55+ y.
studied up to 15 y.studied up to 16-19studied up to 20+ y.
managersself-employed
retiredmanual workers
other white collarshouse persons
unemployedstudents
EU15
Agree = "Strongly agree" + "Slightly agree" Do not know Disagree = "Strongly disagree" + "Slightly disagree"
EUROBAROMETER 56.1 AUTUMN 2001
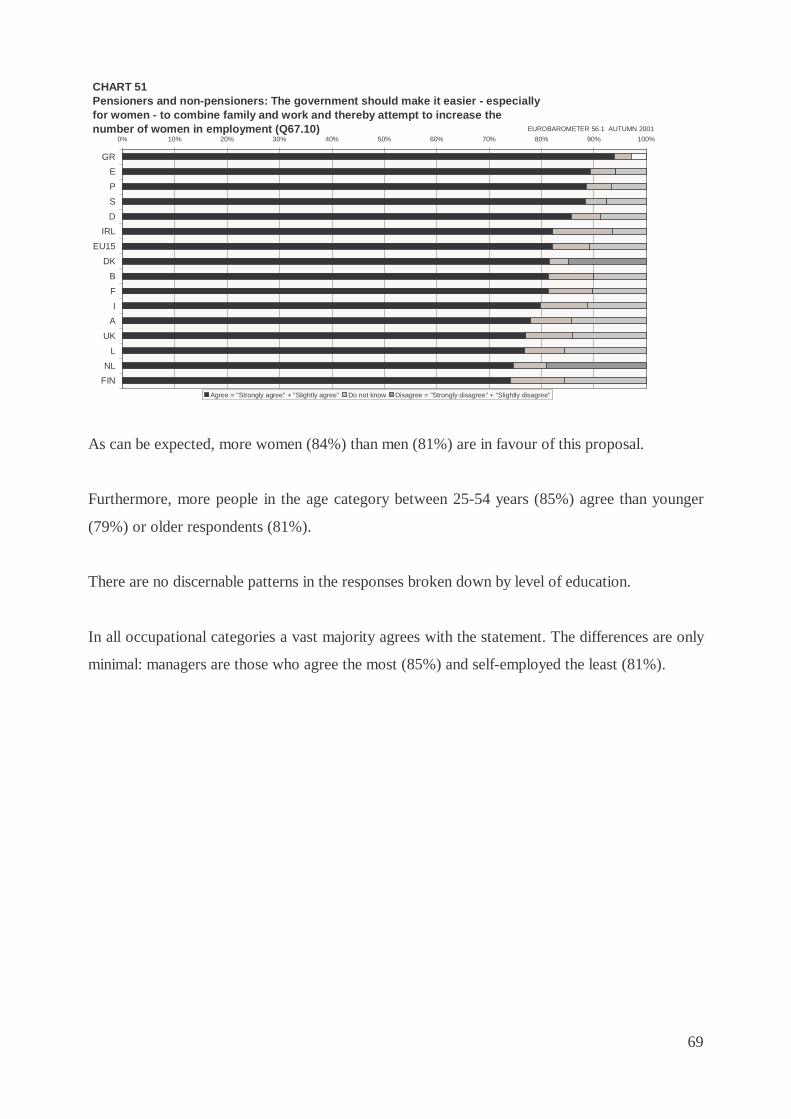
69
As can be expected, more women (84%) than men (81%) are in favour of this proposal.
Furthermore, more people in the age category between 25-54 years (85%) agree than younger
(79%) or older respondents (81%).
There are no discernable patterns in the responses broken down by level of education.
In all occupational categories a vast majority agrees with the statement. The differences are only
minimal: managers are those who agree the most (85%) and self-employed the least (81%).
CHART 51Pensioners and non-pensioners: The government should make it easier - especially for women - to combine family and work and thereby attempt to increase the number of women in employment (Q67.10)
0% 10% 20% 30% 40% 50% 60% 70% 80% 90% 100%
GR
E
P
S
D
IRL
EU15
DK
B
F
I
A
UK
L
NL
FIN
Agree = "Strongly agree" + "Slightly agree" Do not know Disagree = "Strongly disagree" + "Slightly disagree"
EUROBAROMETER 56.1 AUTUMN 2001
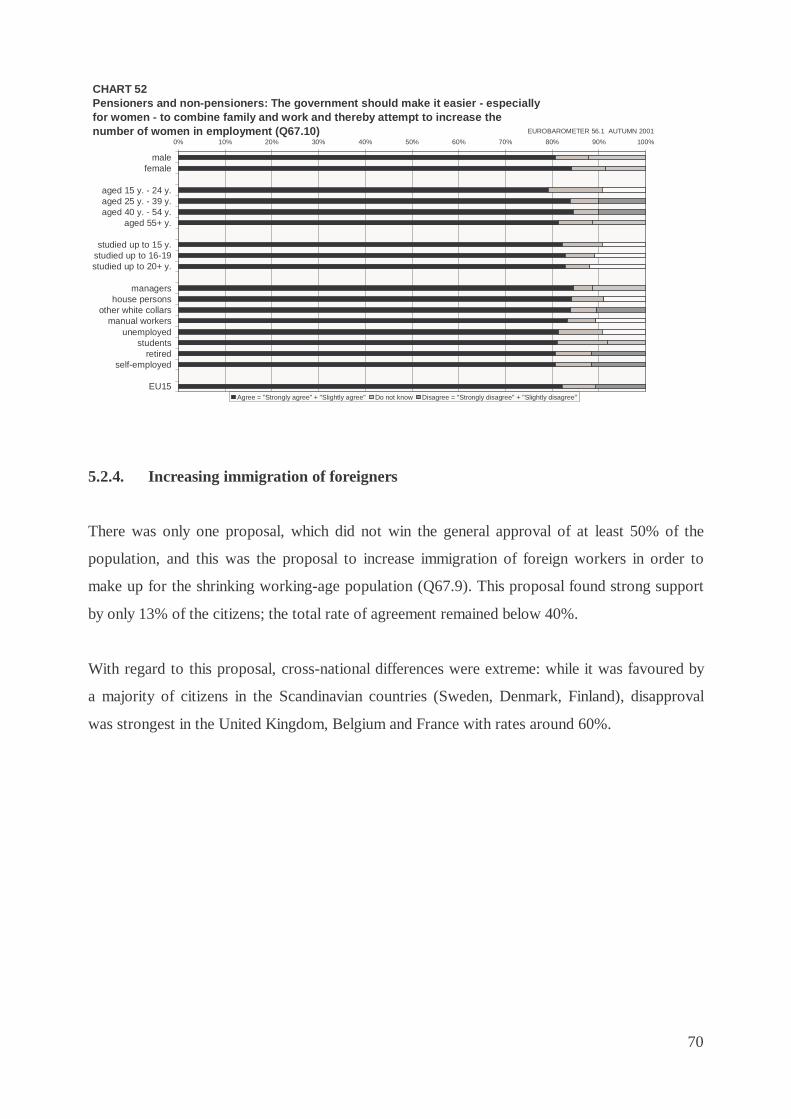
70
5.2.4. Increasing immigration of foreigners
There was only one proposal, which did not win the general approval of at least 50% of the
population, and this was the proposal to increase immigration of foreign workers in order to
make up for the shrinking working-age population (Q67.9). This proposal found strong support
by only 13% of the citizens; the total rate of agreement remained below 40%.
With regard to this proposal, cross-national differences were extreme: while it was favoured by
a majority of citizens in the Scandinavian countries (Sweden, Denmark, Finland), disapproval
was strongest in the United Kingdom, Belgium and France with rates around 60%.
CHART 52Pensioners and non-pensioners: The government should make it easier - especially for women - to combine family and work and thereby attempt to increase the number of women in employment (Q67.10)
0% 10% 20% 30% 40% 50% 60% 70% 80% 90% 100%
malefemale
aged 15 y. - 24 y.aged 25 y. - 39 y.aged 40 y. - 54 y.
aged 55+ y.
studied up to 15 y.studied up to 16-19studied up to 20+ y.
managershouse persons
other white collarsmanual workers
unemployedstudents
retiredself-employed
EU15Agree = "Strongly agree" + "Slightly agree" Do not know Disagree = "Strongly disagree" + "Slightly disagree"
EUROBAROMETER 56.1 AUTUMN 2001
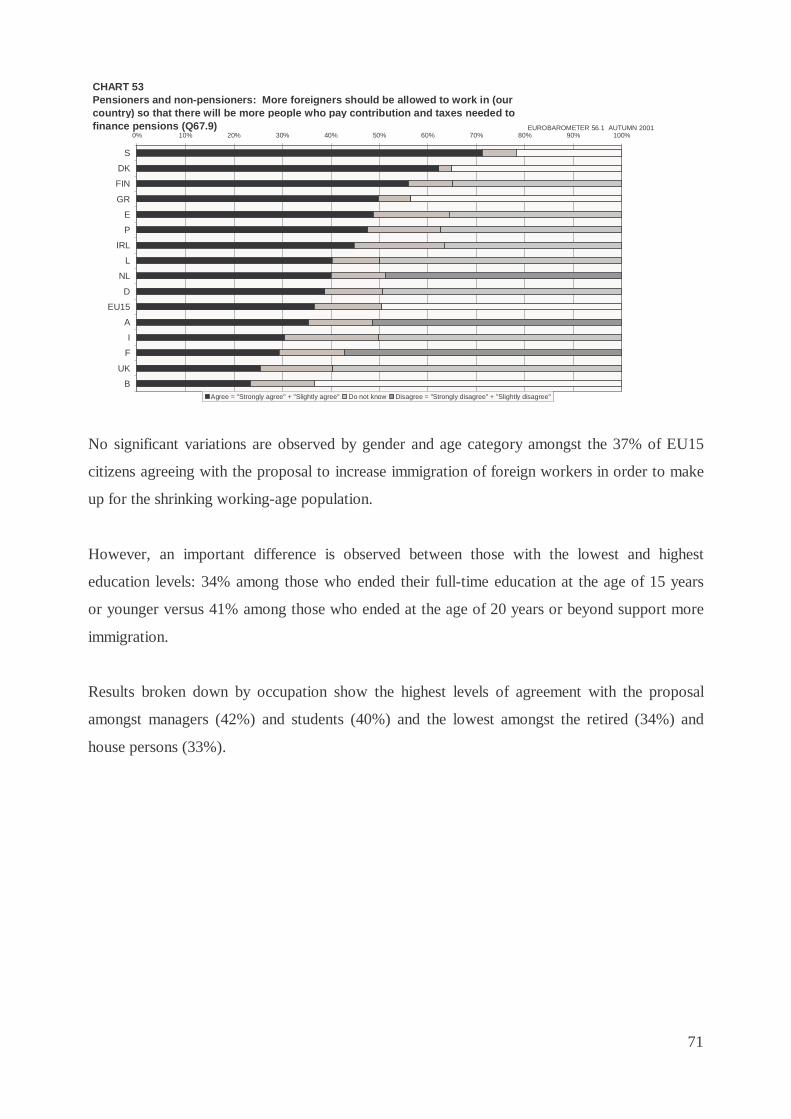
71
No significant variations are observed by gender and age category amongst the 37% of EU15
citizens agreeing with the proposal to increase immigration of foreign workers in order to make
up for the shrinking working-age population.
However, an important difference is observed between those with the lowest and highest
education levels: 34% among those who ended their full-time education at the age of 15 years
or younger versus 41% among those who ended at the age of 20 years or beyond support more
immigration.
Results broken down by occupation show the highest levels of agreement with the proposal
amongst managers (42%) and students (40%) and the lowest amongst the retired (34%) and
house persons (33%).
CHART 53Pensioners and non-pensioners: More foreigners should be allowed to work in (our country) so that there will be more people who pay contribution and taxes needed to finance pensions (Q67.9)
0% 10% 20% 30% 40% 50% 60% 70% 80% 90% 100%
S
DK
FIN
GR
E
P
IRL
L
NL
D
EU15
A
I
F
UK
BAgree = "Strongly agree" + "Slightly agree" Do not know Disagree = "Strongly disagree" + "Slightly disagree"
EUROBAROMETER 56.1 AUTUMN 2001
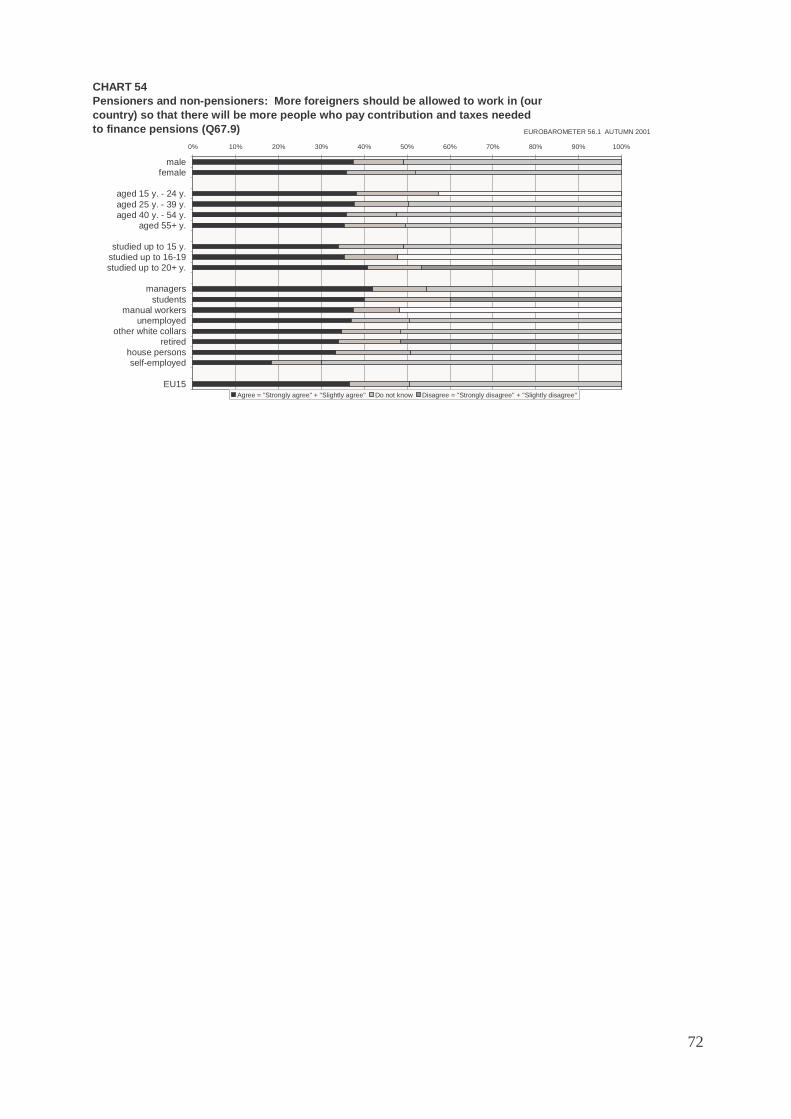
72
CHART 54Pensioners and non-pensioners: More foreigners should be allowed to work in (our country) so that there will be more people who pay contribution and taxes needed to finance pensions (Q67.9)
0% 10% 20% 30% 40% 50% 60% 70% 80% 90% 100%
malefemale
aged 15 y. - 24 y.aged 25 y. - 39 y.aged 40 y. - 54 y.
aged 55+ y.
studied up to 15 y.studied up to 16-19studied up to 20+ y.
managersstudents
manual workersunemployed
other white collarsretired
house personsself-employed
EU15Agree = "Strongly agree" + "Slightly agree" Do not know Disagree = "Strongly disagree" + "Slightly disagree"
EUROBAROMETER 56.1 AUTUMN 2001
73
6. Opinions on the transition from work to retirement
We asked a series of questions about more specific proposals concerning the conditions of the
transition from work to retirement (Q68). The answers to these questions show that, despite the
low level of support for the general idea of raising the (statutory) age of retirement, there may
still be some leeway for political action to take reform measures which can gain broader
political acceptance.
6.1. Gradual retirement
The proposal that "older workers should be allowed to retire gradually from work (e.g. to
combine a partial pension with reduced work)" (Q68.4) gained the broadest support: almost 3
out of 4 persons agreed19, while only 17% disagreed20.
The prospect of retiring gradually from work, according to one's own preferences and physical
abilities (64%), seems much more acceptable than extending working life across the board by
raising the statutory age of retirement (23%, see 5.1.3.). This response can be taken as strong
evidence that people are in favour of more individual flexibility in the transition from work to
retirement.
Moreover, a gradual transition is not tantamount to an early retirement scheme. Depending on
the individual and labour market conditions, it could as well lead to defer the final retreat from
employment. When a sufficiently large number of employees is willing to act in this way, this
could well result in an increase in the actual average age of retirement. Of course, such an
outcome is only likely if there sufficient demand for labour and if working conditions and
financial conditions are sufficiently attractive to keep older employees in their jobs.
Looking at the member states country by country, the proportion of respondents agreeing with a
gradual retirement ranges from 95% in Denmark to 56% in Italy. Apart from these extreme
cases, the proportion is 10 percentage points or more above the EU15 average (74%) in Finland,
Sweden, the Netherlands and Germany and 10 percentage points below the average in Greece.
19 In this section "agree" = "strongly agree " + "slightly agree ". 20 In this section "disgree": "strongly disagree " + "slightly disagree ".
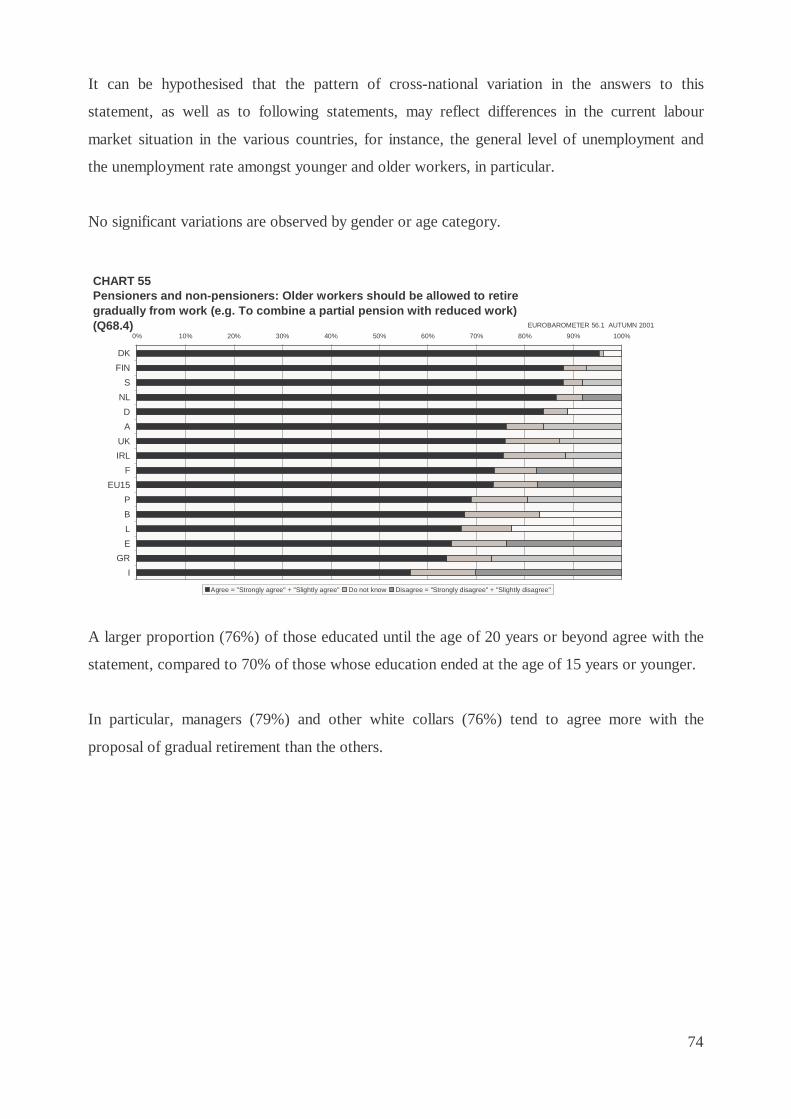
74
It can be hypothesised that the pattern of cross-national variation in the answers to this
statement, as well as to following statements, may reflect differences in the current labour
market situation in the various countries, for instance, the general level of unemployment and
the unemployment rate amongst younger and older workers, in particular.
No significant variations are observed by gender or age category.
A larger proportion (76%) of those educated until the age of 20 years or beyond agree with the
statement, compared to 70% of those whose education ended at the age of 15 years or younger.
In particular, managers (79%) and other white collars (76%) tend to agree more with the
proposal of gradual retirement than the others.
CHART 55Pensioners and non-pensioners: Older workers should be allowed to retire gradually from work (e.g. To combine a partial pension with reduced work) (Q68.4)
0% 10% 20% 30% 40% 50% 60% 70% 80% 90% 100%
DK
FIN
S
NL
D
A
UK
IRL
F
EU15
P
B
L
E
GR
I
Agree = "Strongly agree" + "Slightly agree" Do not know Disagree = "Strongly disagree" + "Slightly disagree"
EUROBAROMETER 56.1 AUTUMN 2001

75
6.2. Fixed retirement age
Under the currently prevailing labour market conditions of high mass unemployment, however,
a majority of the citizens in the EU support the view that "older workers should be forced to
retire at a fixed age" (Q68.2) (57%). The latter result is surprising as it contrasts with the desire
for more individual flexibility expressed in the question discussed above. Moreover, it runs
counter the efforts to fight age discrimination. On the other hand, it should be noted that there is
also strong opposition against such a strategy: 37% disagree.
There are considerable cross-national variations in this respect. In Greece (93%) and Portugal
(79%) more than three quarters of citizens agree with the proposal. Denmark is at the other end
of the spectrum with less than a quarter (19%) of citizens supporting a mandatory retirement
age.
CHART 56Pensioners and non-pensioners: Older workers should be allowed to retire gradually from work (e.g. To combine a partial pension with reduced work (Q68.4)
0% 10% 20% 30% 40% 50% 60% 70% 80% 90% 100%
malefemale
aged 15 y. - 24 y.aged 25 y. - 39 y.aged 40 y. - 54 y.
aged 55+ y.
studied up to 15 y.studied up to 16-19studied up to 20+ y.
managersother white collars
self-employedmanual workers
retiredunemployed
studentshouse persons
EU15
Agree = "Strongly agree" + "Slightly agree" Do not know Disagree = "Strongly disagree" + "Slightly disagree"
EUROBAROMETER 56.1 AUTUMN 2001
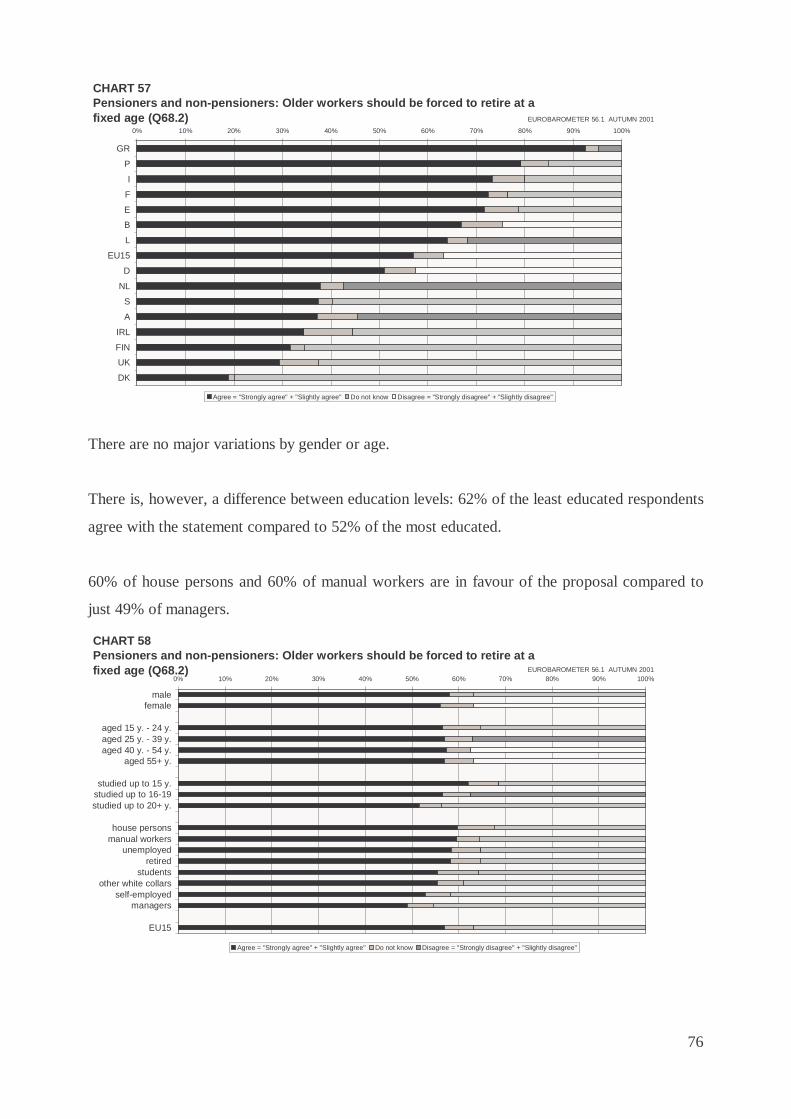
76
There are no major variations by gender or age.
There is, however, a difference between education levels: 62% of the least educated respondents
agree with the statement compared to 52% of the most educated.
60% of house persons and 60% of manual workers are in favour of the proposal compared to
just 49% of managers.
CHART 57Pensioners and non-pensioners: Older workers should be forced to retire at a fixed age (Q68.2)
0% 10% 20% 30% 40% 50% 60% 70% 80% 90% 100%
GR
P
I
F
E
B
L
EU15
D
NL
S
A
IRL
FIN
UK
DK
Agree = "Strongly agree" + "Slightly agree" Do not know Disagree = "Strongly disagree" + "Slightly disagree"
EUROBAROMETER 56.1 AUTUMN 2001
CHART 58Pensioners and non-pensioners: Older workers should be forced to retire at a fixed age (Q68.2)
0% 10% 20% 30% 40% 50% 60% 70% 80% 90% 100%
malefemale
aged 15 y. - 24 y.aged 25 y. - 39 y.aged 40 y. - 54 y.
aged 55+ y.
studied up to 15 y.studied up to 16-19studied up to 20+ y.
house personsmanual workers
unemployedretired
studentsother white collars
self-employedmanagers
EU15
Agree = "Strongly agree" + "Slightly agree" Do not know Disagree = "Strongly disagree" + "Slightly disagree"
EUROBAROMETER 56.1 AUTUMN 2001
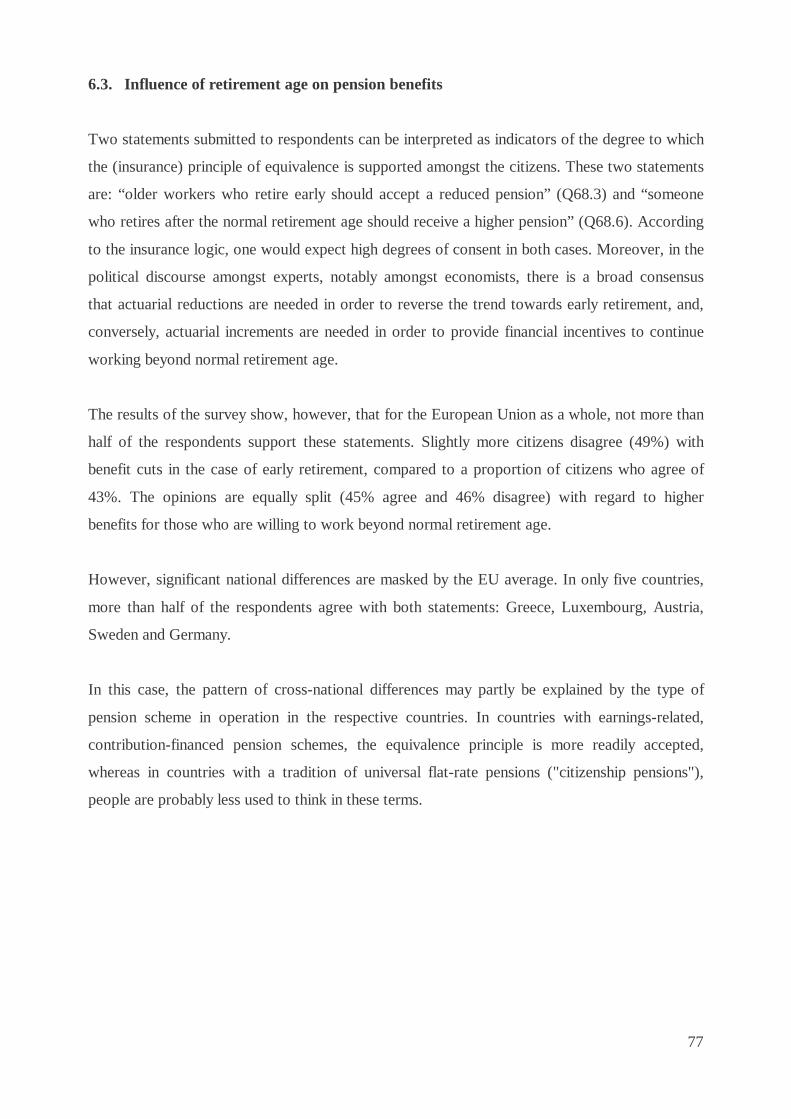
77
6.3. Influence of retirement age on pension benefits
Two statements submitted to respondents can be interpreted as indicators of the degree to which
the (insurance) principle of equivalence is supported amongst the citizens. These two statements
are: “older workers who retire early should accept a reduced pension” (Q68.3) and “someone
who retires after the normal retirement age should receive a higher pension” (Q68.6). According
to the insurance logic, one would expect high degrees of consent in both cases. Moreover, in the
political discourse amongst experts, notably amongst economists, there is a broad consensus
that actuarial reductions are needed in order to reverse the trend towards early retirement, and,
conversely, actuarial increments are needed in order to provide financial incentives to continue
working beyond normal retirement age.
The results of the survey show, however, that for the European Union as a whole, not more than
half of the respondents support these statements. Slightly more citizens disagree (49%) with
benefit cuts in the case of early retirement, compared to a proportion of citizens who agree of
43%. The opinions are equally split (45% agree and 46% disagree) with regard to higher
benefits for those who are willing to work beyond normal retirement age.
However, significant national differences are masked by the EU average. In only five countries,
more than half of the respondents agree with both statements: Greece, Luxembourg, Austria,
Sweden and Germany.
In this case, the pattern of cross-national differences may partly be explained by the type of
pension scheme in operation in the respective countries. In countries with earnings-related,
contribution-financed pension schemes, the equivalence principle is more readily accepted,
whereas in countries with a tradition of universal flat-rate pensions ("citizenship pensions"),
people are probably less used to think in these terms.
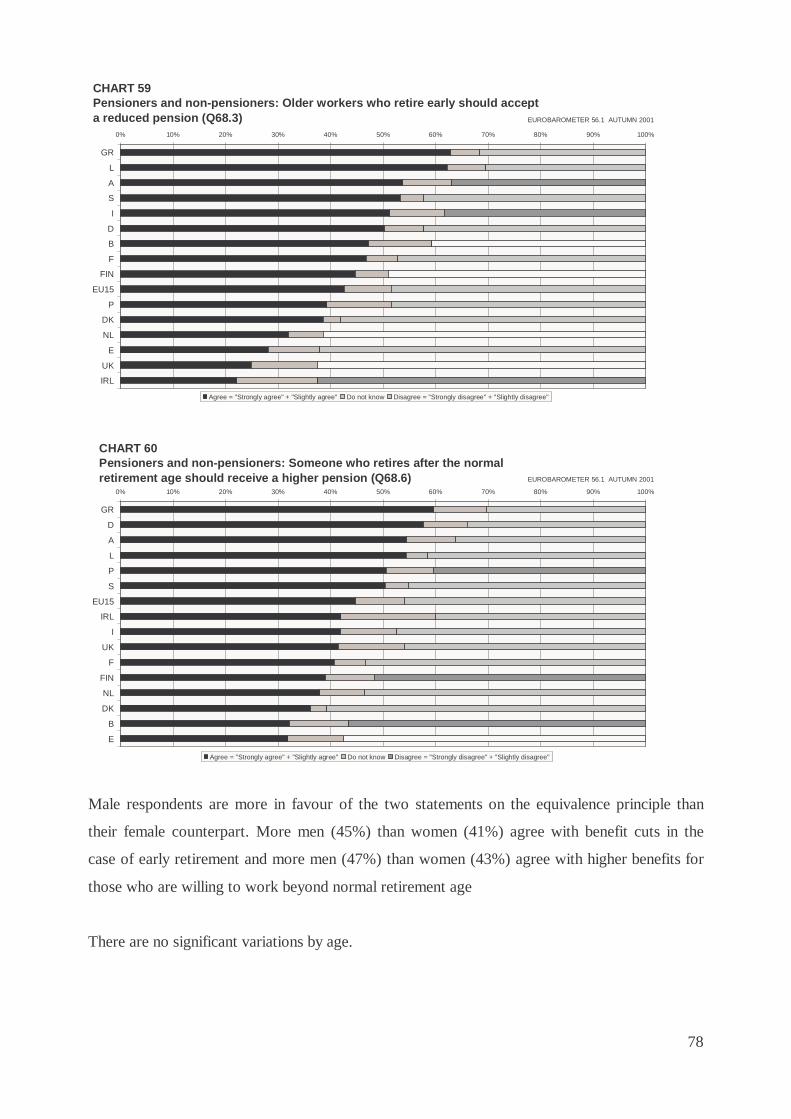
78
Male respondents are more in favour of the two statements on the equivalence principle than
their female counterpart. More men (45%) than women (41%) agree with benefit cuts in the
case of early retirement and more men (47%) than women (43%) agree with higher benefits for
those who are willing to work beyond normal retirement age
There are no significant variations by age.
CHART 59Pensioners and non-pensioners: Older workers who retire early should accept a reduced pension (Q68.3)
0% 10% 20% 30% 40% 50% 60% 70% 80% 90% 100%
GR
L
A
S
I
D
B
F
FIN
EU15
P
DK
NL
E
UK
IRL
Agree = "Strongly agree" + "Slightly agree" Do not know Disagree = "Strongly disagree" + "Slightly disagree"
EUROBAROMETER 56.1 AUTUMN 2001
CHART 60Pensioners and non-pensioners: Someone who retires after the normal retirement age should receive a higher pension (Q68.6)
0% 10% 20% 30% 40% 50% 60% 70% 80% 90% 100%
GR
D
A
L
P
S
EU15
IRL
I
UK
F
FIN
NL
DK
B
E
Agree = "Strongly agree" + "Slightly agree" Do not know Disagree = "Strongly disagree" + "Slightly disagree"
EUROBAROMETER 56.1 AUTUMN 2001
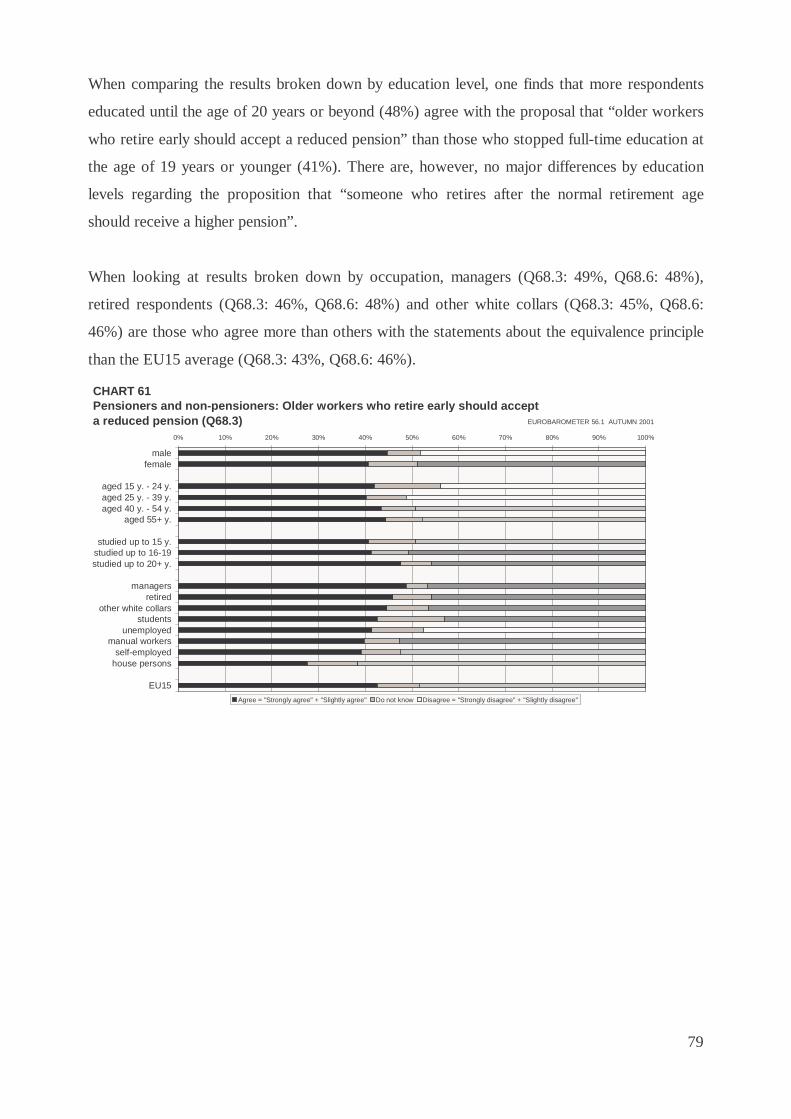
79
When comparing the results broken down by education level, one finds that more respondents
educated until the age of 20 years or beyond (48%) agree with the proposal that “older workers
who retire early should accept a reduced pension” than those who stopped full-time education at
the age of 19 years or younger (41%). There are, however, no major differences by education
levels regarding the proposition that “someone who retires after the normal retirement age
should receive a higher pension”.
When looking at results broken down by occupation, managers (Q68.3: 49%, Q68.6: 48%),
retired respondents (Q68.3: 46%, Q68.6: 48%) and other white collars (Q68.3: 45%, Q68.6:
46%) are those who agree more than others with the statements about the equivalence principle
than the EU15 average (Q68.3: 43%, Q68.6: 46%).
CHART 61Pensioners and non-pensioners: Older workers who retire early should accept a reduced pension (Q68.3)
0% 10% 20% 30% 40% 50% 60% 70% 80% 90% 100%
malefemale
aged 15 y. - 24 y.aged 25 y. - 39 y.aged 40 y. - 54 y.
aged 55+ y.
studied up to 15 y.studied up to 16-19studied up to 20+ y.
managersretired
other white collarsstudents
unemployedmanual workers
self-employedhouse persons
EU15
Agree = "Strongly agree" + "Slightly agree" Do not know Disagree = "Strongly disagree" + "Slightly disagree"
EUROBAROMETER 56.1 AUTUMN 2001
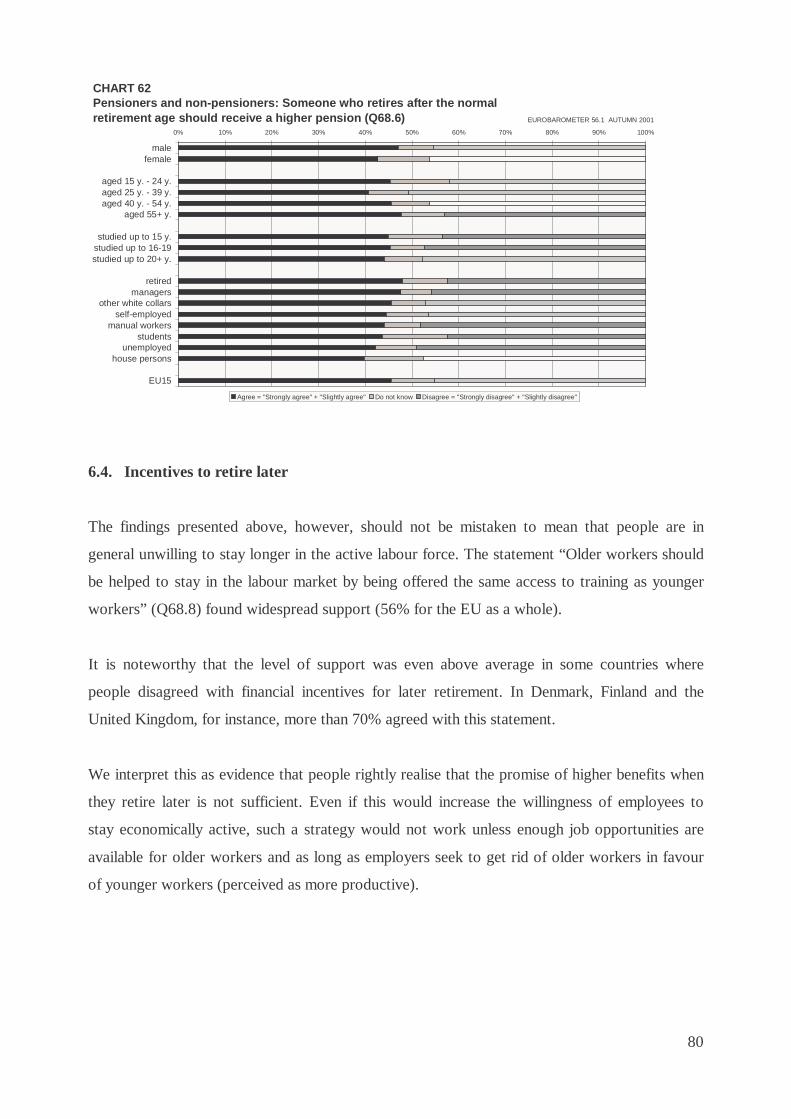
80
6.4. Incentives to retire later
The findings presented above, however, should not be mistaken to mean that people are in
general unwilling to stay longer in the active labour force. The statement “Older workers should
be helped to stay in the labour market by being offered the same access to training as younger
workers” (Q68.8) found widespread support (56% for the EU as a whole).
It is noteworthy that the level of support was even above average in some countries where
people disagreed with financial incentives for later retirement. In Denmark, Finland and the
United Kingdom, for instance, more than 70% agreed with this statement.
We interpret this as evidence that people rightly realise that the promise of higher benefits when
they retire later is not sufficient. Even if this would increase the willingness of employees to
stay economically active, such a strategy would not work unless enough job opportunities are
available for older workers and as long as employers seek to get rid of older workers in favour
of younger workers (perceived as more productive).
CHART 62Pensioners and non-pensioners: Someone who retires after the normal retirement age should receive a higher pension (Q68.6)
0% 10% 20% 30% 40% 50% 60% 70% 80% 90% 100%
malefemale
aged 15 y. - 24 y.aged 25 y. - 39 y.aged 40 y. - 54 y.
aged 55+ y.
studied up to 15 y.studied up to 16-19studied up to 20+ y.
retiredmanagers
other white collarsself-employed
manual workersstudents
unemployedhouse persons
EU15
Agree = "Strongly agree" + "Slightly agree" Do not know Disagree = "Strongly disagree" + "Slightly disagree"
EUROBAROMETER 56.1 AUTUMN 2001

81
No significant variations are observed by gender or age category.
A slightly larger percentage (58%) of those educated to the age of 20 years or above believe that
older workers should be helped to stay in the labour market by being offered the same access to
training as younger workers, compared to 54% of those whose education has ended at the age of
15 years or before.
A higher proportion of managers (64%) and self-employed (58%) agree with the statement
compared to the EU15 average (56%).
CHART 63Pensioners and non-pensioners: Older workers should be helped to stay in the labour market by being offered the same access to training as younger workers (Q68.8)
0% 10% 20% 30% 40% 50% 60% 70% 80% 90% 100%
DK
FIN
UK
A
L
IRL
D
NL
GR
EU15
B
S
E
P
F
I
Agree = "Strongly agree" + "Slightly agree" Do not know Disagree = "Strongly disagree" + "Slightly disagree"
EUROBAROMETER 56.1 AUTUMN 2001
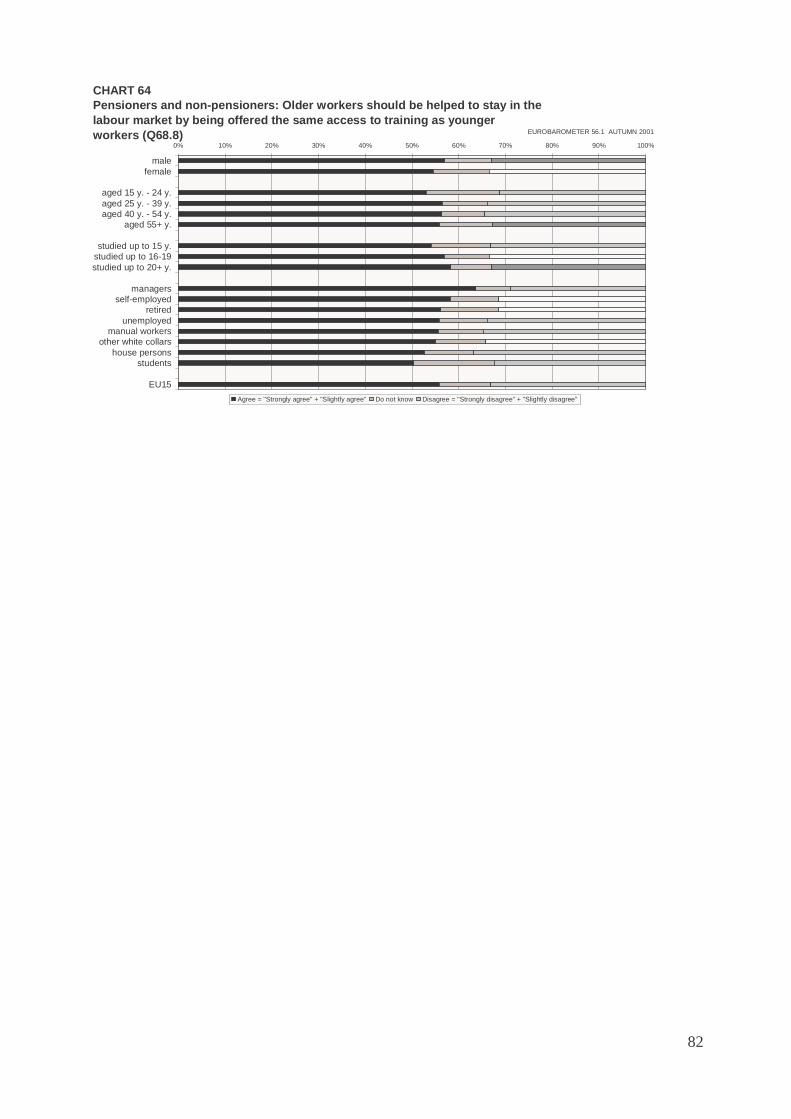
82
CHART 64Pensioners and non-pensioners: Older workers should be helped to stay in the labour market by being offered the same access to training as younger workers (Q68.8)
0% 10% 20% 30% 40% 50% 60% 70% 80% 90% 100%
malefemale
aged 15 y. - 24 y.aged 25 y. - 39 y.aged 40 y. - 54 y.
aged 55+ y.
studied up to 15 y.studied up to 16-19studied up to 20+ y.
managersself-employed
retiredunemployed
manual workersother white collars
house personsstudents
EU15
Agree = "Strongly agree" + "Slightly agree" Do not know Disagree = "Strongly disagree" + "Slightly disagree"
EUROBAROMETER 56.1 AUTUMN 2001
83
CONCLUSION
At the time of the survey (Autumn 2001), the present generation of pensioners did not, in
general, perceive their living standard as substantially lower than that of the working-age
population. In fact, the distribution of subjective assessments of current living standards is very
similar in both groups. Likewise, the prospects for future economic well-being do not differ
very much between the two groups. Nevertheless, more than one third of pensioners reported
having difficulties to get by on their state pensions, the most important income source for
pensioners.
However, considerable cross-national differences can be observed concerning the perception of
the present living standards as well as the expectations about the future development of living
standards. Partly, such differences may be due to differences in the general level of economic
wealth and prosperity of countries and their economic performance in recent years. But partly
they are certainly also due to widely differing institutional arrangements for social security in
old age and, hence, to differences and deficits in the social protection systems of the member
states.
Notwithstanding the differences in institutional arrangements stemming from different national
traditions of social policy, there seems to be a broad consensus amongst European citizens
concerning the principles and the goals of pension policies, and even about the prioritisation of
certain goals. The goals of a guaranteed minimum pension and effective protection against
poverty in old age enjoy the broadest support in almost all countries, followed by the goals of
maintaining relative standards of living (income security) and greater equality amongst the
elderly.
These findings may be good news for the prospects of European social policy. They are
evidence that the value orientations and the social policy attitudes of citizens in the EU member
countries do not fall as far apart as the institutionalised forms of social security do (especially in
the field of pensions). In other words: for historical reasons, pension systems in the various
European countries have developed in very different ways and have exhibited few signs of
convergence in institutional terms. But there seems to be a great deal of consensus at the level
of citizens’ expectations and evaluations of what constitutes a good pension scheme. It is to be
hoped that this knowledge about citizens’ attitudes will facilitate and give momentum to efforts
of reforming national pension systems.
84
Concerning the main alternative options for responding to the challenges posed by the demo-
graphic shifts in Western Europe, we also found a surprisingly high degree of consensus about
the desirability of these alternatives: Maintaining current pension levels “even if this means
raising tax or contributions” gained the broadest support, while raising the age of retirement “so
that people work longer and therefore spend less time in retirement” proved to be least popular
in almost all EU member states.
Moreover, the rank-order of preferences proved to be stable across all social subgroups within
each society. We interpret these findings as evidence of a fairly strong normative consensus
throughout Europe, concerning this issue. This fact illustrates the difficult trade-offs that need
to be dealt with by decision makers throughout the EU. The full costs of the policy options that
are preferred by citizens are not yet correctly perceived by the public. Yet, many recent reform
measures undertaken by national governments are at odds with the order of preferences as
revealed by this survey..
On the other hand, we observed quite substantial cross-national differences in patterns of
opinion concerning the conditions for the transition from work to retirement. This may reflect,
as has been argued above, differences in the actual labour market situation in the various
countries and/or the specific social policy arrangements in the respective country. For example:
if unemployment is high amongst younger workers, this may give added support to the view
that “people in their late 50’s should give up their work to make way for younger and
unemployed people”. Conversely, if there is a shortage of labour in a country, it seems more
reasonable that “older workers should be helped to stay in the labour market”. In other words: if
the labour market situation changes, this will alter the plausibility of ‘adequate’ policy
responses. The difference to the “cultural explanation” lies in the assumption that it is not the
value orientation per se, but the (macro) social context, which shapes the popular support for
various policy proposals.
On the basis of the opinions expressed by European citizens in this survey, a promising strategy
to extend working life should focus particularly on changing labour market conditions and the
re-organisation of work arrangements in parallel with changes to the rules of pension schemes.
But what is more important, even crucial for such a strategy to be successful is that employers
do not discriminate against older workers, but continue to invest in (the adaptation of) their
qualifications. Yet, age discrimination in the form of excluding workers above a certain age

85
from the labour market through mandatory retirement remains still widely accepted by public
opinion. What is also important is that employers adapt working conditions to the individual
needs and circumstances of older workers by providing more opportunities for part-time work
and gradual retirement. Of course, these steps, which need to be taken by companies and
employers in the first instance, can be facilitated and supported by means of public policy and
collective bargaining. As a result, it can be expected that they will make working arrangements
more attractive to older workers and will thus induce them to extend their working life
voluntarily, by positive incentives rather than by the threat of reduced pensions alone.

86
ANNEXES
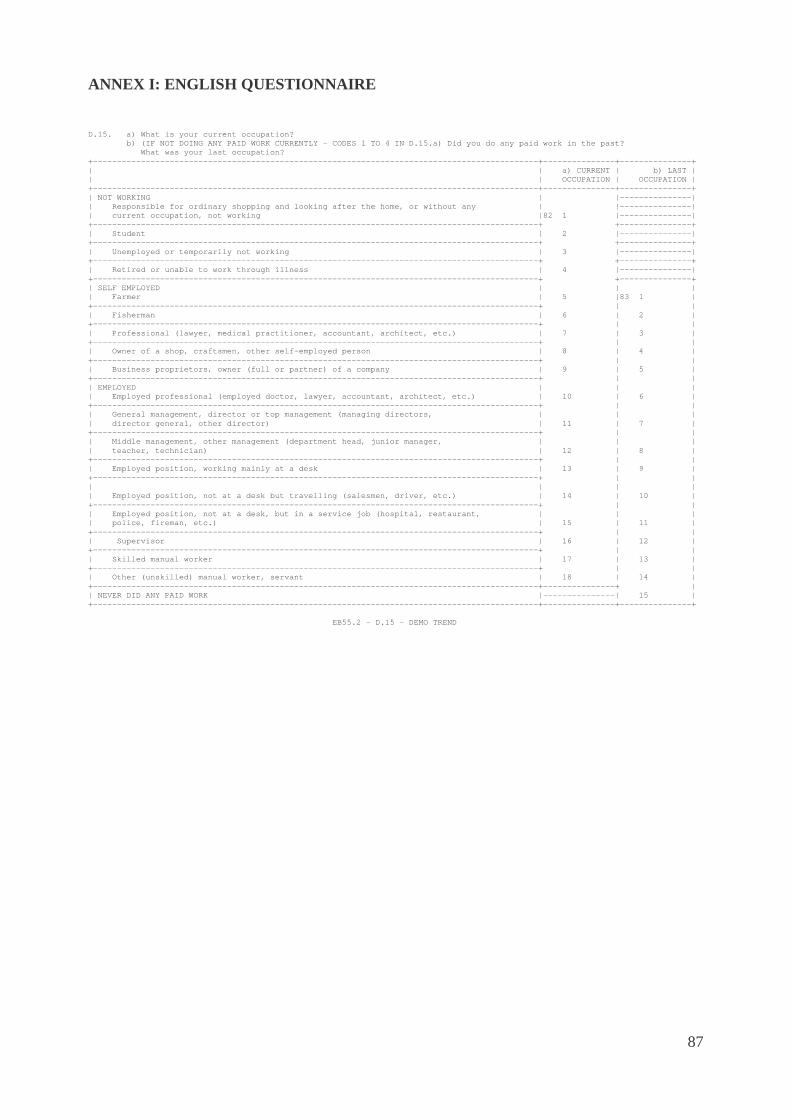
87
ANNEX I: ENGLISH QUESTIONNAIRE
D.15. a) What is your current occupation? b) (IF NOT DOING ANY PAID WORK CURRENTLY - CODES 1 TO 4 IN D.15.a) Did you do any paid work in the past? What was your last occupation? +---------------------------------------------------------------------------------------------+---------------+---------------+ | | a) CURRENT | b) LAST | | | OCCUPATION | OCCUPATION | +---------------------------------------------------------------------------------------------+---------------+---------------+ | NOT WORKING | |---------------| | Responsible for ordinary shopping and looking after the home, or without any | |---------------| | current occupation, not working |82 1 |---------------| +---------------------------------------------------------------------------------------------+ +---------------+ | Student | 2 |---------------| +---------------------------------------------------------------------------------------------+ +---------------+ | Unemployed or temporarily not working | 3 |---------------| +---------------------------------------------------------------------------------------------+ +---------------+ | Retired or unable to work through illness | 4 |---------------| +---------------------------------------------------------------------------------------------+ +---------------+ | SELF EMPLOYED | | | | Farmer | 5 |83 1 | +---------------------------------------------------------------------------------------------+ | | | Fisherman | 6 | 2 | +---------------------------------------------------------------------------------------------+ | | | Professional (lawyer, medical practitioner, accountant, architect, etc.) | 7 | 3 | +---------------------------------------------------------------------------------------------+ | | | Owner of a shop, craftsmen, other self-employed person | 8 | 4 | +---------------------------------------------------------------------------------------------+ | | | Business proprietors, owner (full or partner) of a company | 9 | 5 | +---------------------------------------------------------------------------------------------+ | | | EMPLOYED | | | | Employed professional (employed doctor, lawyer, accountant, architect, etc.) | 10 | 6 | +---------------------------------------------------------------------------------------------+ | | | General management, director or top management (managing directors, | | | | director general, other director) | 11 | 7 | +---------------------------------------------------------------------------------------------+ | | | Middle management, other management (department head, junior manager, | | | | teacher, technician) | 12 | 8 | +---------------------------------------------------------------------------------------------+ | | | Employed position, working mainly at a desk | 13 | 9 | +---------------------------------------------------------------------------------------------+ | | | | | | | Employed position, not at a desk but travelling (salesmen, driver, etc.) | 14 | 10 | +---------------------------------------------------------------------------------------------+ | | | Employed position, not at a desk, but in a service job (hospital, restaurant, | | | | police, fireman, etc.) | 15 | 11 | +---------------------------------------------------------------------------------------------+ | | | Supervisor | 16 | 12 | +---------------------------------------------------------------------------------------------+ | | | Skilled manual worker | 17 | 13 | +---------------------------------------------------------------------------------------------+ | | | Other (unskilled) manual worker, servant | 18 | 14 | +---------------------------------------------------------------------------------------------+---------------+ | | NEVER DID ANY PAID WORK |---------------| 15 | +---------------------------------------------------------------------------------------------+---------------+---------------+ EB55.2 - D.15 - DEMO TREND
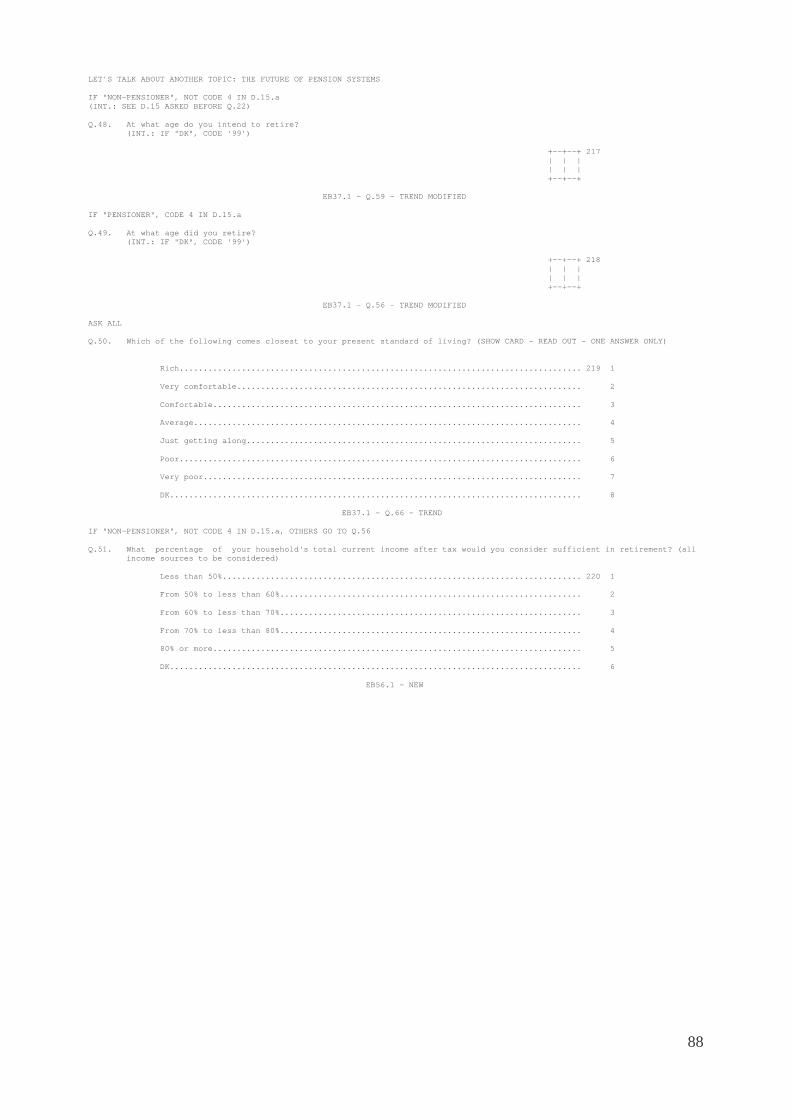
88
LET'S TALK ABOUT ANOTHER TOPIC: THE FUTURE OF PENSION SYSTEMS IF "NON-PENSIONER", NOT CODE 4 IN D.15.a (INT.: SEE D.15 ASKED BEFORE Q.22) Q.48. At what age do you intend to retire? (INT.: IF "DK", CODE '99') +--+--+ 217 | | | | | | +--+--+ EB37.1 - Q.59 - TREND MODIFIED IF "PENSIONER", CODE 4 IN D.15.a Q.49. At what age did you retire? (INT.: IF "DK", CODE '99') +--+--+ 218 | | | | | | +--+--+ EB37.1 - Q.56 - TREND MODIFIED ASK ALL Q.50. Which of the following comes closest to your present standard of living? (SHOW CARD - READ OUT - ONE ANSWER ONLY) Rich.................................................................................... 219 1 Very comfortable........................................................................ 2 Comfortable............................................................................. 3 Average................................................................................. 4 Just getting along...................................................................... 5 Poor.................................................................................... 6 Very poor............................................................................... 7 DK...................................................................................... 8 EB37.1 - Q.66 - TREND IF "NON-PENSIONER", NOT CODE 4 IN D.15.a, OTHERS GO TO Q.56 Q.51. What percentage of your household's total current income after tax would you consider sufficient in retirement? (all income sources to be considered) Less than 50%........................................................................... 220 1 From 50% to less than 60%............................................................... 2 From 60% to less than 70%............................................................... 3 From 70% to less than 80%............................................................... 4 80% or more............................................................................. 5 DK...................................................................................... 6 EB56.1 - NEW

89
Q.52. Which of the following will probably be your main source of income after retirement? (SHOW CARD - ONE ANSWER ONLY) And your second most important? (SHOW SAME CARD - ONE ANSWER ONLY) And which other(s)? (SHOW SAME CARD - MULTIPLE ANSWERS POSSIBLE) +-----------------------------------------------------------------------------------------+-----------+-----------+-----------+ | READ OUT | MAIN | SECOND | OTHER | | | SOURCE | SOURCE | SOURCE(S) | +-----------------------------------------------------------------------------------------+-----------+-----------+-----------+ | | | | | | | | | | | 1. Compulsory state or public pensions (old age or widow's/widower's) |221 1 |222 1 |223 1, | +-----------------------------------------------------------------------------------------+ | | | | 2. Optional private pension scheme, through an employer | 2 | 2 | 2, | +-----------------------------------------------------------------------------------------+ | | | | 3. Personal private pension scheme, not through an employer and long term savings plan | | | | | (life insurance, etc.) | 3 | 3 | 3, | +-----------------------------------------------------------------------------------------+ | | | | | | | | | 4. Returns from savings or other assets (shares, bonds, etc.) | 4 | 4 | 4, | +-----------------------------------------------------------------------------------------+ | | | | 5. Returns from real estate (e.g.: renting of apartment, etc.) | 5 | 5 | 5, | +-----------------------------------------------------------------------------------------+ | | | | 6. Earnings from other employment | 6 | 6 | 6, | +-----------------------------------------------------------------------------------------+ | | | | 7. Social welfare/income support | 7 | 7 | 7, | +-----------------------------------------------------------------------------------------+ | | | | | | | | | 8. Support in cash or kind (e.g.: housing) from relatives, family members | 8 | 8 | 8, | +-----------------------------------------------------------------------------------------+ | | | | Others (SPONTANEOUS) | 9 | 9 | 9, | +-----------------------------------------------------------------------------------------+ | | | | None (SPONTANEOUS) | 10 | 10 | 10, | +-----------------------------------------------------------------------------------------+ | | | | DK | 11 | 11 | 11, | +-----------------------------------------------------------------------------------------+-----------+-----------+-----------+ EB56.1 - NEW Q.53. Do you think that the state pension you will receive when you retire, will allow you to get by....? (SHOW CARD - READ OUT - ONE ANSWER ONLY) with great difficulty................................................................... 224 1 with difficulty......................................................................... 2 easily.................................................................................. 3 very easily............................................................................. 4 DK...................................................................................... 5 EB37.1 - Q.61 - TREND MODIFIED
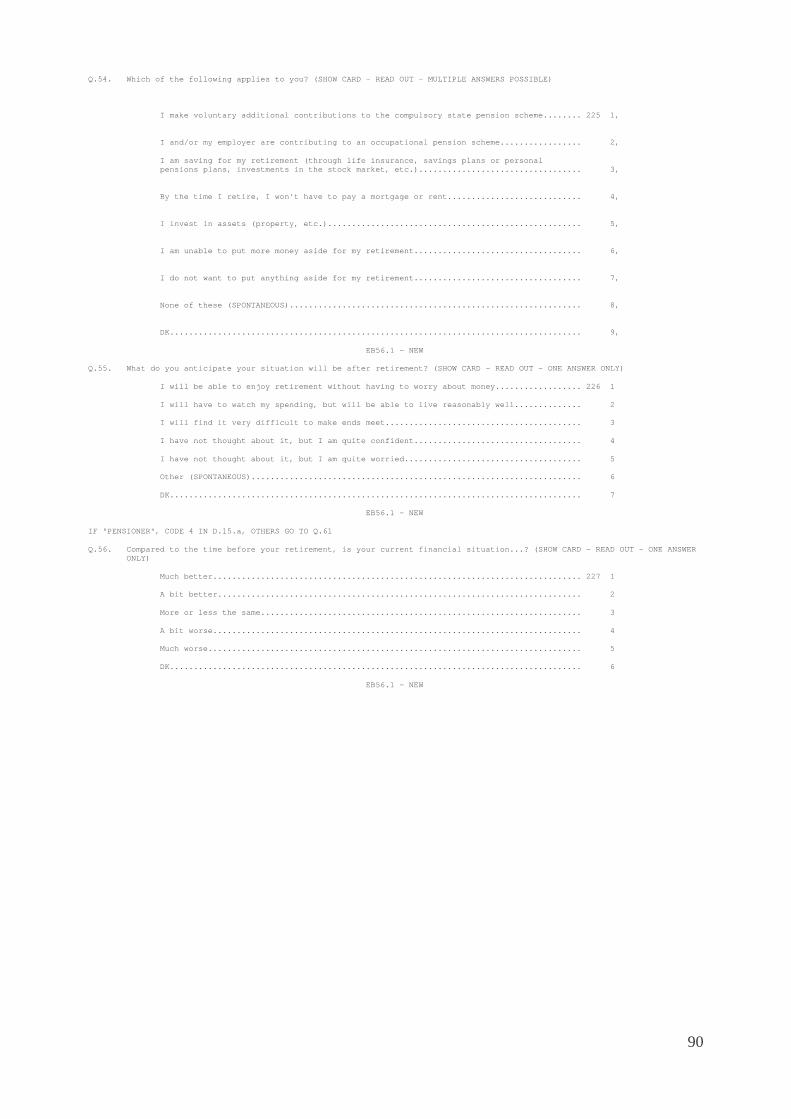
90
Q.54. Which of the following applies to you? (SHOW CARD - READ OUT - MULTIPLE ANSWERS POSSIBLE) I make voluntary additional contributions to the compulsory state pension scheme........ 225 1, I and/or my employer are contributing to an occupational pension scheme................. 2, I am saving for my retirement (through life insurance, savings plans or personal pensions plans, investments in the stock market, etc.).................................. 3, By the time I retire, I won't have to pay a mortgage or rent............................ 4, I invest in assets (property, etc.)..................................................... 5, I am unable to put more money aside for my retirement................................... 6, I do not want to put anything aside for my retirement................................... 7, None of these (SPONTANEOUS)............................................................. 8, DK...................................................................................... 9, EB56.1 - NEW Q.55. What do you anticipate your situation will be after retirement? (SHOW CARD - READ OUT - ONE ANSWER ONLY) I will be able to enjoy retirement without having to worry about money.................. 226 1 I will have to watch my spending, but will be able to live reasonably well.............. 2 I will find it very difficult to make ends meet......................................... 3 I have not thought about it, but I am quite confident................................... 4 I have not thought about it, but I am quite worried..................................... 5 Other (SPONTANEOUS)..................................................................... 6 DK...................................................................................... 7 EB56.1 - NEW IF "PENSIONER", CODE 4 IN D.15.a, OTHERS GO TO Q.61 Q.56. Compared to the time before your retirement, is your current financial situation...? (SHOW CARD - READ OUT - ONE ANSWER ONLY) Much better............................................................................. 227 1 A bit better............................................................................ 2 More or less the same................................................................... 3 A bit worse............................................................................. 4 Much worse.............................................................................. 5 DK...................................................................................... 6 EB56.1 - NEW
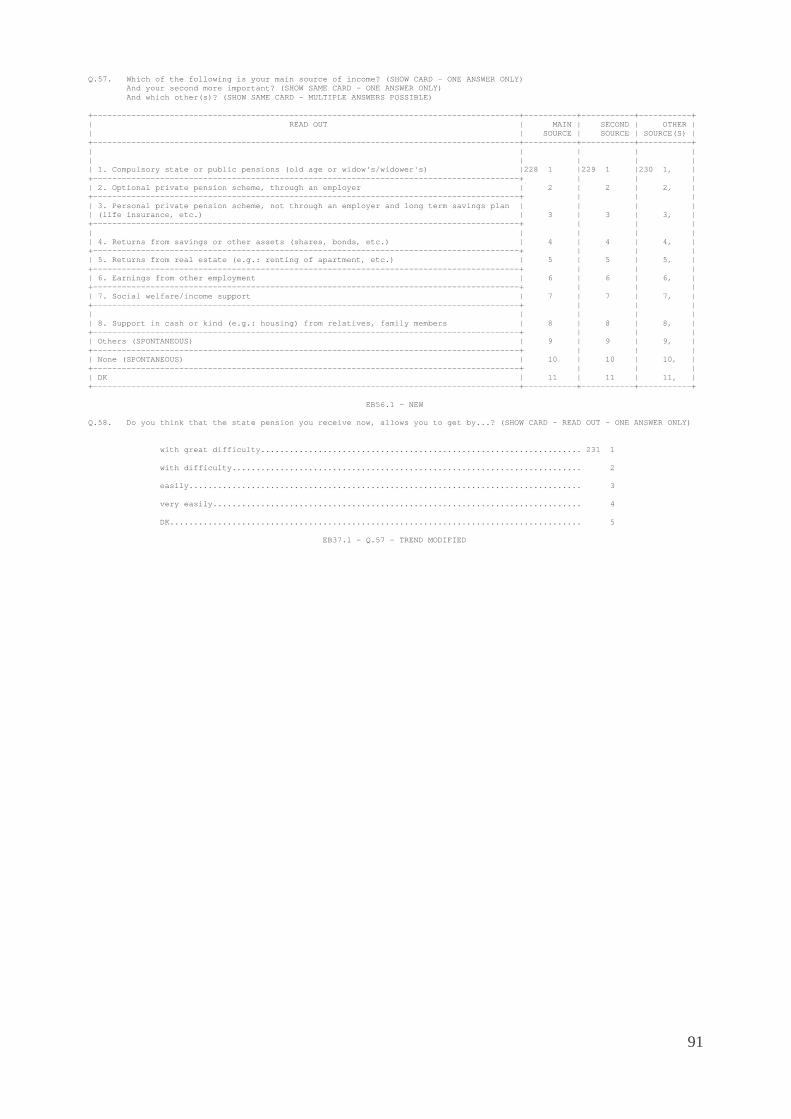
91
Q.57. Which of the following is your main source of income? (SHOW CARD - ONE ANSWER ONLY) And your second more important? (SHOW SAME CARD - ONE ANSWER ONLY) And which other(s)? (SHOW SAME CARD - MULTIPLE ANSWERS POSSIBLE) +-----------------------------------------------------------------------------------------+-----------+-----------+-----------+ | READ OUT | MAIN | SECOND | OTHER | | | SOURCE | SOURCE | SOURCE(S) | +-----------------------------------------------------------------------------------------+-----------+-----------+-----------+ | | | | | | | | | | | 1. Compulsory state or public pensions (old age or widow's/widower's) |228 1 |229 1 |230 1, | +-----------------------------------------------------------------------------------------+ | | | | 2. Optional private pension scheme, through an employer | 2 | 2 | 2, | +-----------------------------------------------------------------------------------------+ | | | | 3. Personal private pension scheme, not through an employer and long term savings plan | | | | | (life insurance, etc.) | 3 | 3 | 3, | +-----------------------------------------------------------------------------------------+ | | | | | | | | | 4. Returns from savings or other assets (shares, bonds, etc.) | 4 | 4 | 4, | +-----------------------------------------------------------------------------------------+ | | | | 5. Returns from real estate (e.g.: renting of apartment, etc.) | 5 | 5 | 5, | +-----------------------------------------------------------------------------------------+ | | | | 6. Earnings from other employment | 6 | 6 | 6, | +-----------------------------------------------------------------------------------------+ | | | | 7. Social welfare/income support | 7 | 7 | 7, | +-----------------------------------------------------------------------------------------+ | | | | | | | | | 8. Support in cash or kind (e.g.: housing) from relatives, family members | 8 | 8 | 8, | +-----------------------------------------------------------------------------------------+ | | | | Others (SPONTANEOUS) | 9 | 9 | 9, | +-----------------------------------------------------------------------------------------+ | | | | None (SPONTANEOUS) | 10 | 10 | 10, | +-----------------------------------------------------------------------------------------+ | | | | DK | 11 | 11 | 11, | +-----------------------------------------------------------------------------------------+-----------+-----------+-----------+ EB56.1 - NEW Q.58. Do you think that the state pension you receive now, allows you to get by...? (SHOW CARD - READ OUT - ONE ANSWER ONLY) with great difficulty................................................................... 231 1 with difficulty......................................................................... 2 easily.................................................................................. 3 very easily............................................................................. 4 DK...................................................................................... 5 EB37.1 - Q.57 - TREND MODIFIED
92
Q.59. Which of the following applies to your own situation? (SHOW CARD - READ OUT - MULTIPLE ANSWERS POSSIBLE) I prepared well for my retirement....................................................... 232 1, If I had saved more for my retirement, my state benefits would have been reduced accordingly, leaving me with no extra money............................................. 2, I should have made voluntary additional contributions to the compulsory state pension scheme.................................................................................. 3, I should have contributed (more) to an occupational pension scheme, through my employer. 4, I should have saved (more) for my retirement (through life insurance, savings plans, or personal pension plans, investments in the stock market, etc.).......................... 5, I should have bought my own accomodation................................................ 6, I should have invested in assets (property, etc.)....................................... 7, I was not able to put more money aside for my retirement................................ 8, None of these (SPONTANEOUS)............................................................. 9, DK...................................................................................... 10 EB56.1 - NEW Q.60. What do you anticipate your situation will be in 5 to 10 years? (SHOW CARD - READ OUT - ONE ANSWER ONLY) I will be able to live without having to worry about money.............................. 233 1 I will have to watch my spending, but will be able to live reasonably well.............. 2 I will find it very difficult to make ends meet......................................... 3 I have not thought about it, but I am quite confident................................... 4 I have not thought about it, but I am quite worried..................................... 5 Other (SPONTANEOUS)..................................................................... 6 DK...................................................................................... 7 EB56.1 - NEW

93
ASK ALL Q.61. How do you think that pensions should be provided...? (SHOW CARD - READ OUT - ONE ANSWER ONLY) mainly by state or public pension schemes, financed from taxes and contributions........ 234 1 mainly by occupational schemes, financed from employers' and their employees' contributions........................................................................... 2 mainly by private arrangements between individuals and insurance companies, banks, etc.. 3 DK...................................................................................... 4 EB37.1 - Q.68 - TREND MODIFIED
94
Q.62. For each of the following statements, could you please tell me whether you strongly agree, slightly agree, slightly disagree or strongly disagree? +--------------------------------------------------------------+------------+------------+------------+------------+----------+ | READ OUT | STRONGLY | SLIGHTLY | SLIGHTLY | STRONGLY | | | | AGREE | AGREE | DISAGREE | DISAGREE | DK | +--------------------------------------------------------------+------------+------------+------------+------------+----------+ | 1. Those who are now working have a duty to ensure, through | | | their taxes and contributions, that elderly people have a | | | decent standard of living |235 1 2 3 4 5 | +--------------------------------------------------------------+--------------------------------------------------------------+ | 2. There should be a legal obligation for children to | | | financially support their elderly parents if they don't have | | | enough income of their own |236 1 2 3 4 5 | +--------------------------------------------------------------+--------------------------------------------------------------+ | | | | 3. The primary goal of a good pension scheme should be to | | | protect elderly people against the risk of poverty |237 1 2 3 4 5 | +--------------------------------------------------------------+--------------------------------------------------------------+ | 4. A guaranteed minimum pension should be a basic social | | | right of every citizen |238 1 2 3 4 5 | +--------------------------------------------------------------+--------------------------------------------------------------+ | 5. A good pension system should allow everybody to maintain | | | an adequate standard of living relative to their income | | | before retirement |239 1 2 3 4 5 | +--------------------------------------------------------------+--------------------------------------------------------------+ | | | | 6. Older people who have wealth or sufficient income from | | | other sources should not receive a pension from the state |240 1 2 3 4 5 | +--------------------------------------------------------------+--------------------------------------------------------------+ | | | | 7. A good pension system should contribute to greater | | | equality in income and living conditions amongst the elderly |241 1 2 3 4 5 | +--------------------------------------------------------------+--------------------------------------------------------------+ | 8. Basic pensions should be financed from general tax | | | revenues |242 1 2 3 4 5 | +--------------------------------------------------------------+--------------------------------------------------------------+ | 9. It should be compulsory for all persons in employment | | | (whether employed or self-employed) to contribute to a | | | pension scheme |243 1 2 3 4 5 | +--------------------------------------------------------------+--------------------------------------------------------------+ | 10. The amount of one's pension should be strictly based on | | | the amount of contributions one has paid into the pension | | | scheme |244 1 2 3 4 5 | +--------------------------------------------------------------+--------------------------------------------------------------+ | | | | 11. State pensions should only provide a basic minimum, but | | | people should be obliged to make additional private | | | provisions for old age |245 1 2 3 4 5 | +--------------------------------------------------------------+--------------------------------------------------------------+ | 12. It should be left entirely to the individual whether | | | he/she wants to make additional private provisions for old | | | age |246 1 2 3 4 5 | +--------------------------------------------------------------+--------------------------------------------------------------+ | | | | 13. People who cannot pay sufficient contributions into a | | | pension scheme (e.g. the unemployed, those on low earnings) | | | should receive some extra help from the state for old age |247 1 2 3 4 5 | +--------------------------------------------------------------+--------------------------------------------------------------+ | | | | 14. Women should have to pay higher contributions into | | | pension schemes because they live longer |248 1 2 3 4 5 | +--------------------------------------------------------------+--------------------------------------------------------------+ | | | | 15. Couples of the same sex should be entitled to a | | | widow's/widower's pension as if they had lived with a | | | partner of the opposite sex |249 1 2 3 4 5 | +--------------------------------------------------------------+--------------------------------------------------------------+ EB56.1 - NEW
95
Q.63. What level of minimum guaranteed income, do you think, should be provided for elderly people? (SHOW CARD - READ OUT - ONE ANSWER ONLY) The same level of social assistance or income support as needy people of working age, after checking that they don't have sufficient other income or wealth................... 250 1 The same level of social asistance or income support, regardless of other income or wealth.................................................................................. 2 A higher level of social assistance or income support than needy people of working age, after checking that they don't have sufficient other income or wealth................... 3 A higher level of social assistance or income support than needy people of working age, regardless of other income or wealth.................................................... 4 Others (SPONTANEOUS).................................................................... 5 DK...................................................................................... 6 EB56.1 - NEW Q.64. Which of the following do you think, should apply, when the main family income earner dies....? (SHOW CARD - READ OUT - ONE ANSWER ONLY) the widow or widower and any dependent children should receive the pension or at least a portion of it, to which the deceased person was entitled................................ 251 1 the widow or widower and any dependent children should receive a fixed benefit, regardless of the entitlements of the deceased.......................................... 2 the widow or widower and any dependent children should receive no such benefits at all.. 3 DK...................................................................................... 4 EB37.1 - Q.63 - TREND Q.65. For each of the following, please indicate whether, you think, men and women should be treated equally or not? +-----------------------------------------------------------------------------------------+-----------+------------+----------+ | READ OUT | | | | | | EQUALLY |NOT EQUALLY | DK | +-----------------------------------------------------------------------------------------+-----------+------------+----------+ | 1. The age at which they can retire |252 1 2 3 | +-----------------------------------------------------------------------------------------+-----------------------------------+ | 2. The contributions they make for their retirement pension |253 1 2 3 | +-----------------------------------------------------------------------------------------+-----------------------------------+ | 3. The amount they receive when they retire |254 1 2 3 | +-----------------------------------------------------------------------------------------+-----------------------------------+ | 4. The right to receive a widow's/widower's pension (N) |255 1 2 3 | +-----------------------------------------------------------------------------------------+-----------------------------------+ EB37.1 - Q.44 - TREND MODIFIED Q.66. The population in (OUR COUNTRY) is ageing, due to lower birth rates and increasing life expectancy. Do you think that in the future this will pose...? (SHOW CARD - READ OUT - ONE ANSWER ONLY) a major problem......................................................................... 256 1 a minor problem......................................................................... 2 no problem at all....................................................................... 3 DK...................................................................................... 4 EB56.1 - NEW
96
Q.67. Given the fact that the share of elderly people in the population is growing, many different proposals have been put forward. Please, tell me for each of the following whether you strongly agree, slightly agree, slightly disagree or strongly disagree. +---------------------------------------------------------------+------------+-----------+------------+------------+----------+ | READ OUT | STRONGLY | SLIGHTLY | SLIGHTLY | STRONGLY | | | | AGREE | AGREE | DISAGREE | DISAGREE | DK | +---------------------------------------------------------------+------------+-----------+------------+------------+----------+ | | | | 1. Current pension levels should be maintained even if this | | | means raising taxes or contributions |257 1 2 3 4 5 | +---------------------------------------------------------------+-------------------------------------------------------------+ | | | | 2. Contribution rates should not be raised even if this means | | | lower pension levels |258 1 2 3 4 5 | +---------------------------------------------------------------+-------------------------------------------------------------+ | | | | 3. The age of retirement should be raised so that people work | | | longer and therefore spend less time in retirement |259 1 2 3 4 5 | +---------------------------------------------------------------+-------------------------------------------------------------+ | | | | 4. The government should cut spendings in other areas in | | | order to make more money available for pensions |260 1 2 3 4 5 | +---------------------------------------------------------------+-------------------------------------------------------------+ | 5. The government should build up a pension reserve fund to | | | pay for future pensions |261 1 2 3 4 5 | +---------------------------------------------------------------+-------------------------------------------------------------+ | 6. The government should provide financial tax incentives to | | | encourage people to save/make private provisions for their | | | retirement |262 1 2 3 4 5 | +---------------------------------------------------------------+-------------------------------------------------------------+ | | | | 7. The government should allow people to put their | | | contributions into private pension funds or life insurance | | | policies of their choice |263 1 2 3 4 5 | +---------------------------------------------------------------+-------------------------------------------------------------+ | | | | 8. The government should give priority to fighting | | | unemployment so that there will be more people who pay the | | | taxes and contributions needed to finance pensions |264 1 2 3 4 5 | +---------------------------------------------------------------+-------------------------------------------------------------+ | | | | 9. More foreigners should be allowed to work in (OUR COUNTRY) | | | so that there will be more people who pay the contributions | | | and taxes needed to finance pensions |265 1 2 3 4 5 | +---------------------------------------------------------------+-------------------------------------------------------------+ | | | | 10. The government should make it easier - especially for | | | women - to combine family and work and thereby attempt to | | | increase the number of women in employment |266 1 2 3 4 5 | +---------------------------------------------------------------+-------------------------------------------------------------+ | 11. The government should give greater support to people who | | | want to have more children |267 1 2 3 4 5 | +---------------------------------------------------------------+-------------------------------------------------------------+ EB56.1 - NEW
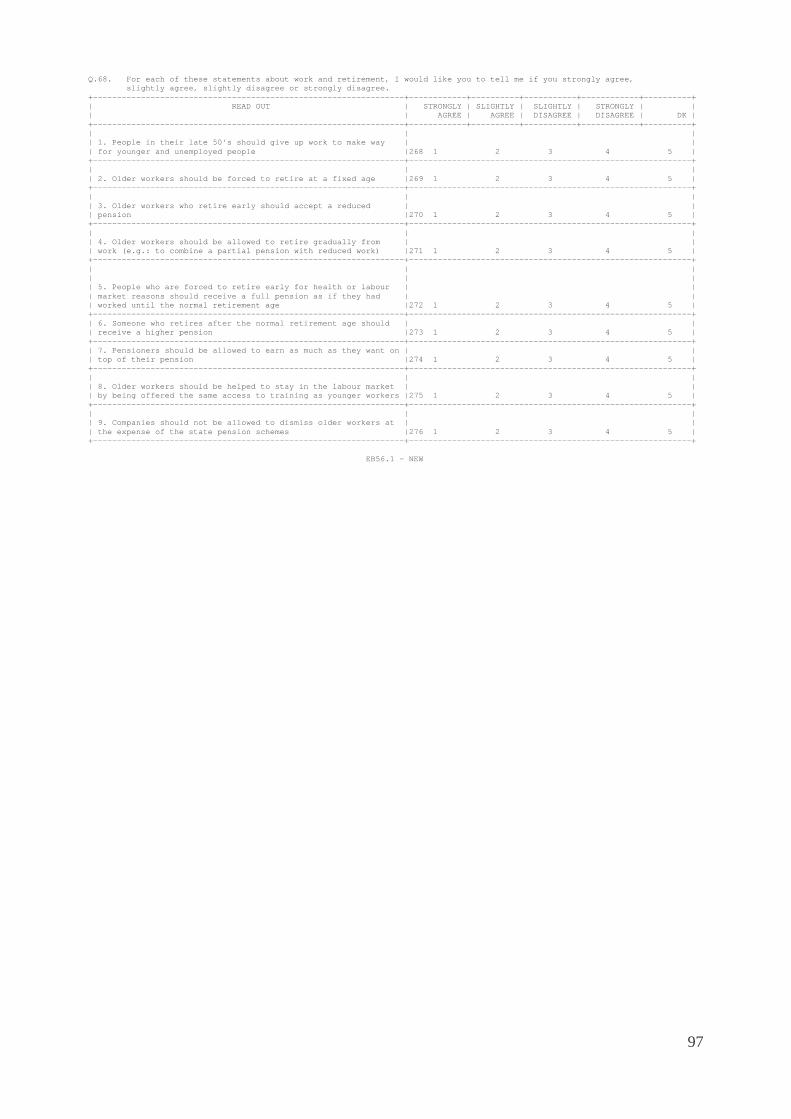
97
Q.68. For each of these statements about work and retirement, I would like you to tell me if you strongly agree, slightly agree, slightly disagree or strongly disagree. +-----------------------------------------------------------------+------------+----------+-----------+------------+----------+ | READ OUT | STRONGLY | SLIGHTLY | SLIGHTLY | STRONGLY | | | | AGREE | AGREE | DISAGREE | DISAGREE | DK | +-----------------------------------------------------------------+------------+----------+-----------+------------+----------+ | | | | 1. People in their late 50's should give up work to make way | | | for younger and unemployed people |268 1 2 3 4 5 | +-----------------------------------------------------------------+-----------------------------------------------------------+ | | | | 2. Older workers should be forced to retire at a fixed age |269 1 2 3 4 5 | +-----------------------------------------------------------------+-----------------------------------------------------------+ | | | | 3. Older workers who retire early should accept a reduced | | | pension |270 1 2 3 4 5 | +-----------------------------------------------------------------+-----------------------------------------------------------+ | | | | 4. Older workers should be allowed to retire gradually from | | | work (e.g.: to combine a partial pension with reduced work) |271 1 2 3 4 5 | +-----------------------------------------------------------------+-----------------------------------------------------------+ | | | | | | | 5. People who are forced to retire early for health or labour | | | market reasons should receive a full pension as if they had | | | worked until the normal retirement age |272 1 2 3 4 5 | +-----------------------------------------------------------------+-----------------------------------------------------------+ | 6. Someone who retires after the normal retirement age should | | | receive a higher pension |273 1 2 3 4 5 | +-----------------------------------------------------------------+-----------------------------------------------------------+ | 7. Pensioners should be allowed to earn as much as they want on | | | top of their pension |274 1 2 3 4 5 | +-----------------------------------------------------------------+-----------------------------------------------------------+ | | | | 8. Older workers should be helped to stay in the labour market | | | by being offered the same access to training as younger workers |275 1 2 3 4 5 | +-----------------------------------------------------------------+-----------------------------------------------------------+ | | | | 9. Companies should not be allowed to dismiss older workers at | | | the expense of the state pension schemes |276 1 2 3 4 5 | +-----------------------------------------------------------------+-----------------------------------------------------------+ EB56.1 - NEW
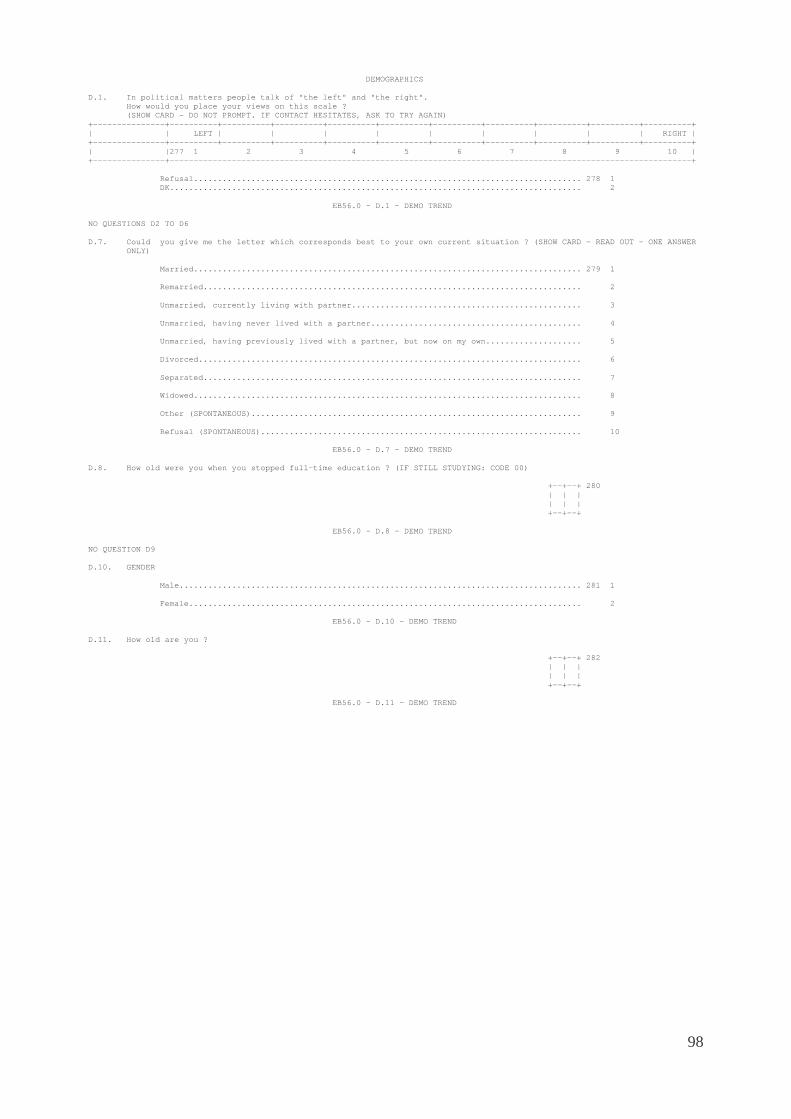
98
DEMOGRAPHICS D.1. In political matters people talk of "the left" and "the right". How would you place your views on this scale ? (SHOW CARD - DO NOT PROMPT. IF CONTACT HESITATES, ASK TO TRY AGAIN) +---------------+----------+----------+----------+----------+----------+----------+----------+----------+----------+----------+ | | LEFT | | | | | | | | | RIGHT | +---------------+----------+----------+----------+----------+----------+----------+----------+----------+----------+----------+ | |277 1 2 3 4 5 6 7 8 9 10 | +---------------+-------------------------------------------------------------------------------------------------------------+ Refusal................................................................................. 278 1 DK...................................................................................... 2 EB56.0 - D.1 - DEMO TREND NO QUESTIONS D2 TO D6 D.7. Could you give me the letter which corresponds best to your own current situation ? (SHOW CARD - READ OUT - ONE ANSWER ONLY) Married................................................................................. 279 1 Remarried............................................................................... 2 Unmarried, currently living with partner................................................ 3 Unmarried, having never lived with a partner............................................ 4 Unmarried, having previously lived with a partner, but now on my own.................... 5 Divorced................................................................................ 6 Separated............................................................................... 7 Widowed................................................................................. 8 Other (SPONTANEOUS)..................................................................... 9 Refusal (SPONTANEOUS)................................................................... 10 EB56.0 - D.7 - DEMO TREND D.8. How old were you when you stopped full-time education ? (IF STILL STUDYING: CODE 00) +--+--+ 280 | | | | | | +--+--+ EB56.0 - D.8 - DEMO TREND NO QUESTION D9 D.10. GENDER Male.................................................................................... 281 1 Female.................................................................................. 2 EB56.0 - D.10 - DEMO TREND D.11. How old are you ? +--+--+ 282 | | | | | | +--+--+ EB56.0 - D.11 - DEMO TREND
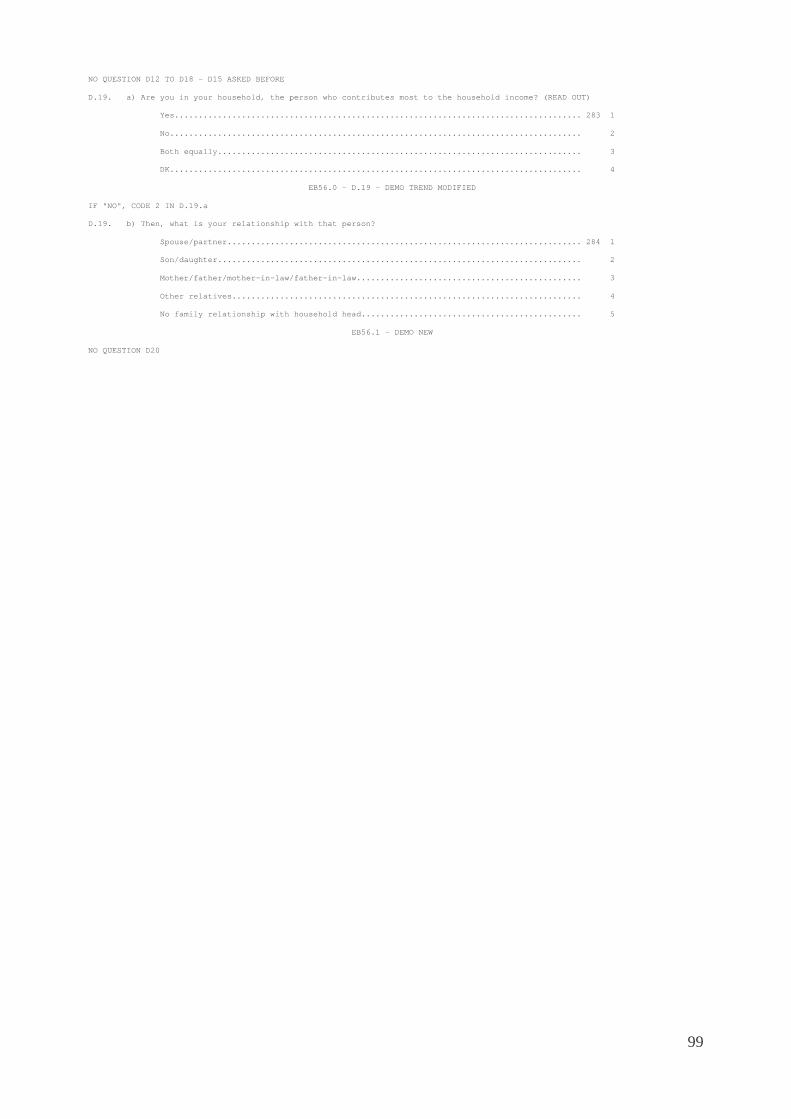
99
NO QUESTION D12 TO D18 - D15 ASKED BEFORE D.19. a) Are you in your household, the person who contributes most to the household income? (READ OUT) Yes..................................................................................... 283 1 No...................................................................................... 2 Both equally............................................................................ 3 DK...................................................................................... 4 EB56.0 - D.19 - DEMO TREND MODIFIED IF "NO", CODE 2 IN D.19.a D.19. b) Then, what is your relationship with that person? Spouse/partner.......................................................................... 284 1 Son/daughter............................................................................ 2 Mother/father/mother-in-law/father-in-law............................................... 3 Other relatives......................................................................... 4 No family relationship with household head.............................................. 5 EB56.1 - DEMO NEW NO QUESTION D20
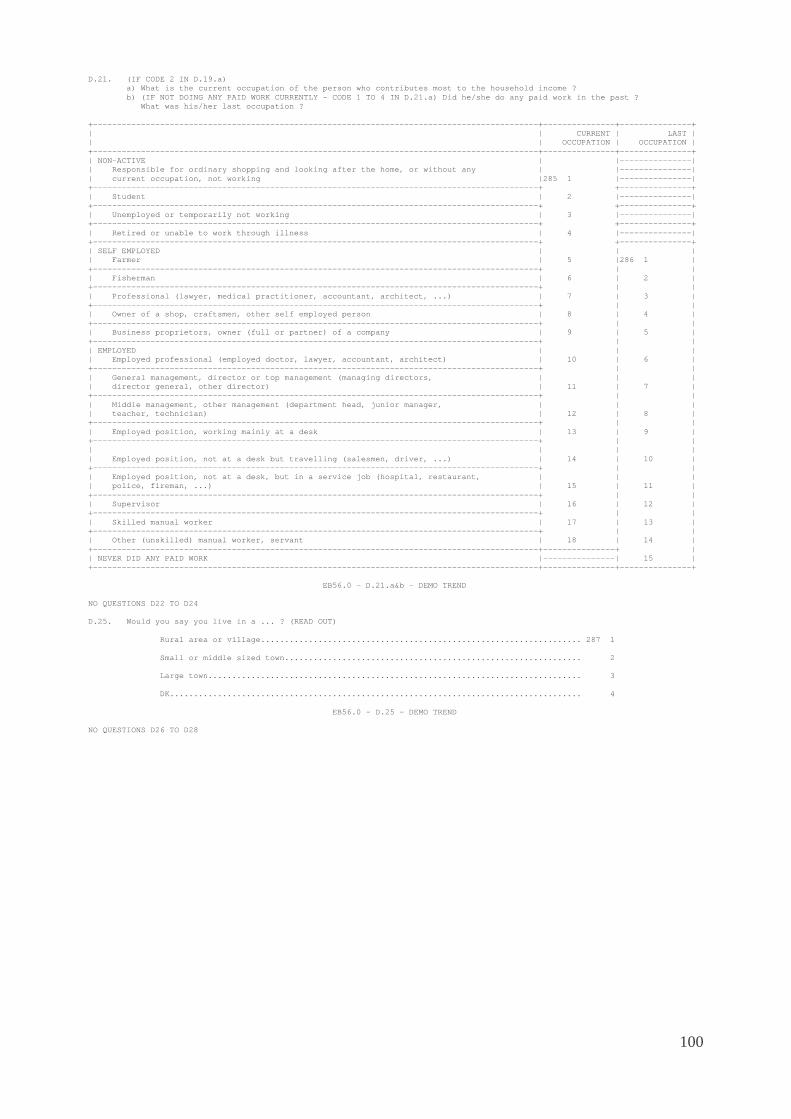
100
D.21. (IF CODE 2 IN D.19.a) a) What is the current occupation of the person who contributes most to the household income ? b) (IF NOT DOING ANY PAID WORK CURRENTLY - CODE 1 TO 4 IN D.21.a) Did he/she do any paid work in the past ? What was his/her last occupation ? +---------------------------------------------------------------------------------------------+---------------+---------------+ | | CURRENT | LAST | | | OCCUPATION | OCCUPATION | +---------------------------------------------------------------------------------------------+---------------+---------------+ | NON-ACTIVE | |---------------| | Responsible for ordinary shopping and looking after the home, or without any | |---------------| | current occupation, not working |285 1 |---------------| +---------------------------------------------------------------------------------------------+ +---------------+ | Student | 2 |---------------| +---------------------------------------------------------------------------------------------+ +---------------+ | Unemployed or temporarily not working | 3 |---------------| +---------------------------------------------------------------------------------------------+ +---------------+ | Retired or unable to work through illness | 4 |---------------| +---------------------------------------------------------------------------------------------+ +---------------+ | SELF EMPLOYED | | | | Farmer | 5 |286 1 | +---------------------------------------------------------------------------------------------+ | | | Fisherman | 6 | 2 | +---------------------------------------------------------------------------------------------+ | | | Professional (lawyer, medical practitioner, accountant, architect, ...) | 7 | 3 | +---------------------------------------------------------------------------------------------+ | | | Owner of a shop, craftsmen, other self employed person | 8 | 4 | +---------------------------------------------------------------------------------------------+ | | | Business proprietors, owner (full or partner) of a company | 9 | 5 | +---------------------------------------------------------------------------------------------+ | | | EMPLOYED | | | | Employed professional (employed doctor, lawyer, accountant, architect) | 10 | 6 | +---------------------------------------------------------------------------------------------+ | | | General management, director or top management (managing directors, | | | | director general, other director) | 11 | 7 | +---------------------------------------------------------------------------------------------+ | | | Middle management, other management (department head, junior manager, | | | | teacher, technician) | 12 | 8 | +---------------------------------------------------------------------------------------------+ | | | Employed position, working mainly at a desk | 13 | 9 | +---------------------------------------------------------------------------------------------+ | | | | | | | Employed position, not at a desk but travelling (salesmen, driver, ...) | 14 | 10 | +---------------------------------------------------------------------------------------------+ | | | Employed position, not at a desk, but in a service job (hospital, restaurant, | | | | police, fireman, ...) | 15 | 11 | +---------------------------------------------------------------------------------------------+ | | | Supervisor | 16 | 12 | +---------------------------------------------------------------------------------------------+ | | | Skilled manual worker | 17 | 13 | +---------------------------------------------------------------------------------------------+ | | | Other (unskilled) manual worker, servant | 18 | 14 | +---------------------------------------------------------------------------------------------+---------------+ | | NEVER DID ANY PAID WORK |---------------| 15 | +---------------------------------------------------------------------------------------------+---------------+---------------+ EB56.0 - D.21.a&b - DEMO TREND NO QUESTIONS D22 TO D24 D.25. Would you say you live in a ... ? (READ OUT) Rural area or village................................................................... 287 1 Small or middle sized town.............................................................. 2 Large town.............................................................................. 3 DK...................................................................................... 4 EB56.0 - D.25 - DEMO TREND NO QUESTIONS D26 TO D28
101
D.29. We also need some information about the income of this household to be able to analyse the survey results for different types of households. Here is a list of income groups. (SHOW CARD) Please count the total wages and salaries PER MONTH of all members of this household; all pensions and social insurance benefits; child allowances and any other income like rents, etc ... Of course, your answer as all other replies in this interview will be treated confidentially and referring back to you or your household will be impossible. Please give me the letter of the income group your household falls into AFTER tax and other deductions. B....................................................................................... 288 1 T....................................................................................... 2 P....................................................................................... 3 F....................................................................................... 4 E....................................................................................... 5 H....................................................................................... 6 L....................................................................................... 7 N....................................................................................... 8 R....................................................................................... 9 M....................................................................................... 10 S....................................................................................... 11 K....................................................................................... 12 Refusal................................................................................. 13 DK...................................................................................... 14 EB56.0 - D.29 - DEMO TREND MODIFIED
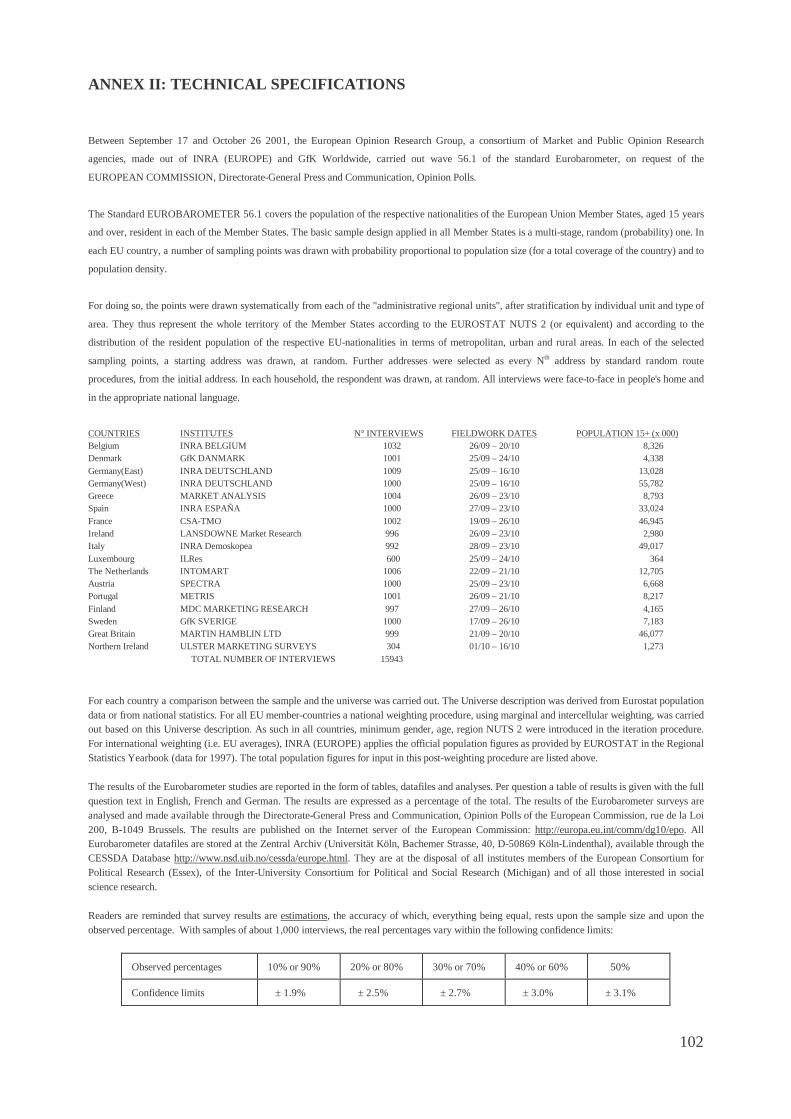
102
ANNEX II: TECHNICAL SPECIFICATIONS
Between September 17 and October 26 2001, the European Opinion Research Group, a consortium of Market and Public Opinion Research
agencies, made out of INRA (EUROPE) and GfK Worldwide, carried out wave 56.1 of the standard Eurobarometer, on request of the
EUROPEAN COMMISSION, Directorate-General Press and Communication, Opinion Polls.
The Standard EUROBAROMETER 56.1 covers the population of the respective nationalities of the European Union Member States, aged 15 years
and over, resident in each of the Member States. The basic sample design applied in all Member States is a multi-stage, random (probability) one. In
each EU country, a number of sampling points was drawn with probability proportional to population size (for a total coverage of the country) and to
population density.
For doing so, the points were drawn systematically from each of the "administrative regional units", after stratification by individual unit and type of
area. They thus represent the whole territory of the Member States according to the EUROSTAT NUTS 2 (or equivalent) and according to the
distribution of the resident population of the respective EU-nationalities in terms of metropolitan, urban and rural areas. In each of the selected
sampling points, a starting address was drawn, at random. Further addresses were selected as every Nth address by standard random route
procedures, from the initial address. In each household, the respondent was drawn, at random. All interviews were face-to-face in people's home and
in the appropriate national language.
COUNTRIES INSTITUTES N° INTERVIEWS FIELDWORK DATES POPULATION 15+ (x 000) Belgium INRA BELGIUM 1032 26/09 – 20/10 8,326 Denmark GfK DANMARK 1001 25/09 – 24/10 4,338 Germany(East) INRA DEUTSCHLAND 1009 25/09 – 16/10 13,028 Germany(West) INRA DEUTSCHLAND 1000 25/09 – 16/10 55,782 Greece MARKET ANALYSIS 1004 26/09 – 23/10 8,793 Spain INRA ESPAÑA 1000 27/09 – 23/10 33,024 France CSA-TMO 1002 19/09 – 26/10 46,945 Ireland LANSDOWNE Market Research 996 26/09 – 23/10 2,980 Italy INRA Demoskopea 992 28/09 – 23/10 49,017 Luxembourg ILRes 600 25/09 – 24/10 364 The Netherlands INTOMART 1006 22/09 – 21/10 12,705 Austria SPECTRA 1000 25/09 – 23/10 6,668 Portugal METRIS 1001 26/09 – 21/10 8,217 Finland MDC MARKETING RESEARCH 997 27/09 – 26/10 4,165 Sweden GfK SVERIGE 1000 17/09 – 26/10 7,183 Great Britain MARTIN HAMBLIN LTD 999 21/09 – 20/10 46,077 Northern Ireland ULSTER MARKETING SURVEYS 304 01/10 – 16/10 1,273
TOTAL NUMBER OF INTERVIEWS 15943
For each country a comparison between the sample and the universe was carried out. The Universe description was derived from Eurostat population data or from national statistics. For all EU member-countries a national weighting procedure, using marginal and intercellular weighting, was carried out based on this Universe description. As such in all countries, minimum gender, age, region NUTS 2 were introduced in the iteration procedure. For international weighting (i.e. EU averages), INRA (EUROPE) applies the official population figures as provided by EUROSTAT in the Regional Statistics Yearbook (data for 1997). The total population figures for input in this post-weighting procedure are listed above. The results of the Eurobarometer studies are reported in the form of tables, datafiles and analyses. Per question a table of results is given with the full question text in English, French and German. The results are expressed as a percentage of the total. The results of the Eurobarometer surveys are analysed and made available through the Directorate-General Press and Communication, Opinion Polls of the European Commission, rue de la Loi 200, B-1049 Brussels. The results are published on the Internet server of the European Commission: http://europa.eu.int/comm/dg10/epo. All Eurobarometer datafiles are stored at the Zentral Archiv (Universität Köln, Bachemer Strasse, 40, D-50869 Köln-Lindenthal), available through the CESSDA Database http://www.nsd.uib.no/cessda/europe.html. They are at the disposal of all institutes members of the European Consortium for Political Research (Essex), of the Inter-University Consortium for Political and Social Research (Michigan) and of all those interested in social science research. Readers are reminded that survey results are estimations, the accuracy of which, everything being equal, rests upon the sample size and upon the observed percentage. With samples of about 1,000 interviews, the real percentages vary within the following confidence limits:
Observed percentages 10% or 90% 20% or 80% 30% or 70% 40% or 60% 50%
Confidence limits ± 1.9% ± 2.5% ± 2.7% ± 3.0% ± 3.1%
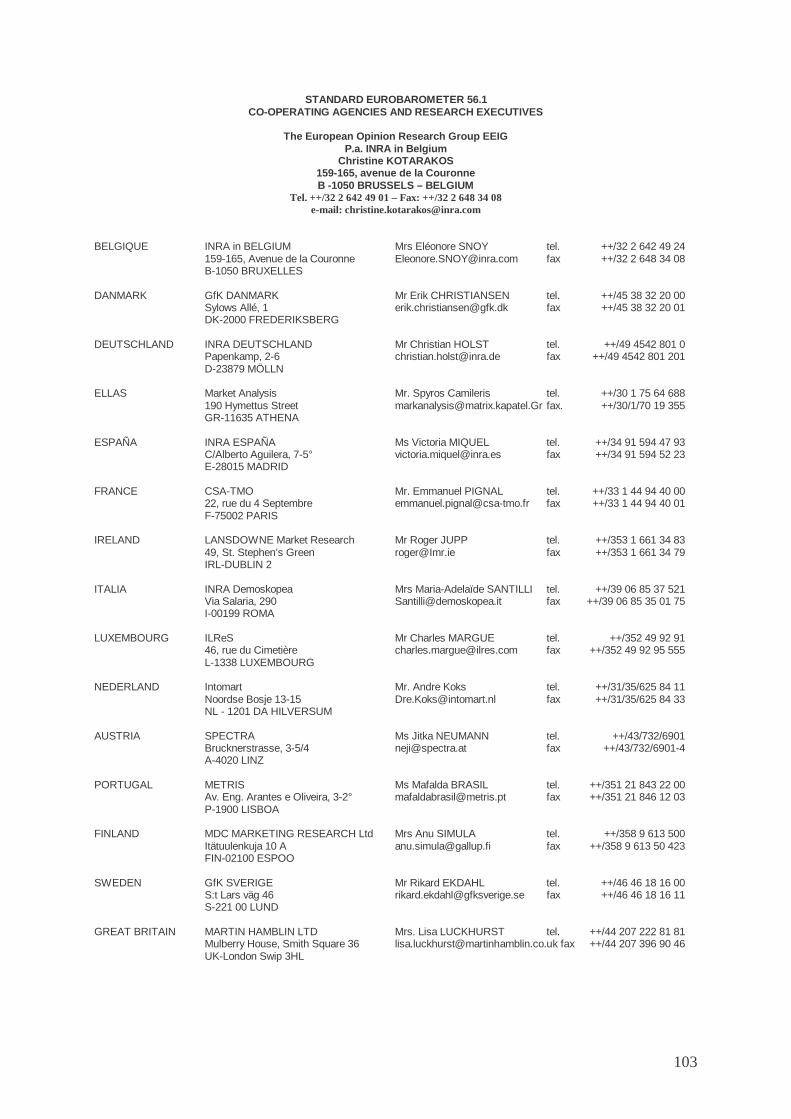
103
STANDARD EUROBAROMETER 56.1 CO-OPERATING AGENCIES AND RESEARCH EXECUTIVES
The European Opinion Research Group EEIG
P.a. INRA in Belgium Christine KOTARAKOS
159-165, avenue de la Couronne B -1050 BRUSSELS – BELGIUM
Tel. ++/32 2 642 49 01 – Fax: ++/32 2 648 34 08 e-mail: [email protected]
BELGIQUE INRA in BELGIUM Mrs Eléonore SNOY tel. ++/32 2 642 49 24 159-165, Avenue de la Couronne [email protected] fax ++/32 2 648 34 08 B-1050 BRUXELLES DANMARK GfK DANMARK Mr Erik CHRISTIANSEN tel. ++/45 38 32 20 00 Sylows Allé, 1 [email protected] fax ++/45 38 32 20 01 DK-2000 FREDERIKSBERG DEUTSCHLAND INRA DEUTSCHLAND Mr Christian HOLST tel. ++/49 4542 801 0 Papenkamp, 2-6 [email protected] fax ++/49 4542 801 201 D-23879 MÖLLN ELLAS Market Analysis Mr. Spyros Camileris tel. ++/30 1 75 64 688 190 Hymettus Street [email protected] fax. ++/30/1/70 19 355 GR-11635 ATHENA ESPAÑA INRA ESPAÑA Ms Victoria MIQUEL tel. ++/34 91 594 47 93 C/Alberto Aguilera, 7-5° [email protected] fax ++/34 91 594 52 23 E-28015 MADRID FRANCE CSA-TMO Mr. Emmanuel PIGNAL tel. ++/33 1 44 94 40 00 22, rue du 4 Septembre [email protected] fax ++/33 1 44 94 40 01 F-75002 PARIS IRELAND LANSDOWNE Market Research Mr Roger JUPP tel. ++/353 1 661 34 83 49, St. Stephen’s Green [email protected] fax ++/353 1 661 34 79 IRL-DUBLIN 2 ITALIA INRA Demoskopea Mrs Maria-Adelaïde SANTILLI tel. ++/39 06 85 37 521 Via Salaria, 290 [email protected] fax ++/39 06 85 35 01 75 I-00199 ROMA LUXEMBOURG ILReS Mr Charles MARGUE tel. ++/352 49 92 91 46, rue du Cimetière [email protected] fax ++/352 49 92 95 555 L-1338 LUXEMBOURG NEDERLAND Intomart Mr. Andre Koks tel. ++/31/35/625 84 11 Noordse Bosje 13-15 [email protected] fax ++/31/35/625 84 33 NL - 1201 DA HILVERSUM AUSTRIA SPECTRA Ms Jitka NEUMANN tel. ++/43/732/6901 Brucknerstrasse, 3-5/4 [email protected] fax ++/43/732/6901-4 A-4020 LINZ PORTUGAL METRIS Ms Mafalda BRASIL tel. ++/351 21 843 22 00 Av. Eng. Arantes e Oliveira, 3-2° [email protected] fax ++/351 21 846 12 03 P-1900 LISBOA FINLAND MDC MARKETING RESEARCH Ltd Mrs Anu SIMULA tel. ++/358 9 613 500 Itätuulenkuja 10 A [email protected] fax ++/358 9 613 50 423 FIN-02100 ESPOO SWEDEN GfK SVERIGE Mr Rikard EKDAHL tel. ++/46 46 18 16 00 S:t Lars väg 46 [email protected] fax ++/46 46 18 16 11 S-221 00 LUND GREAT BRITAIN MARTIN HAMBLIN LTD Mrs. Lisa LUCKHURST tel. ++/44 207 222 81 81 Mulberry House, Smith Square 36 [email protected] fax ++/44 207 396 90 46 UK-London Swip 3HL
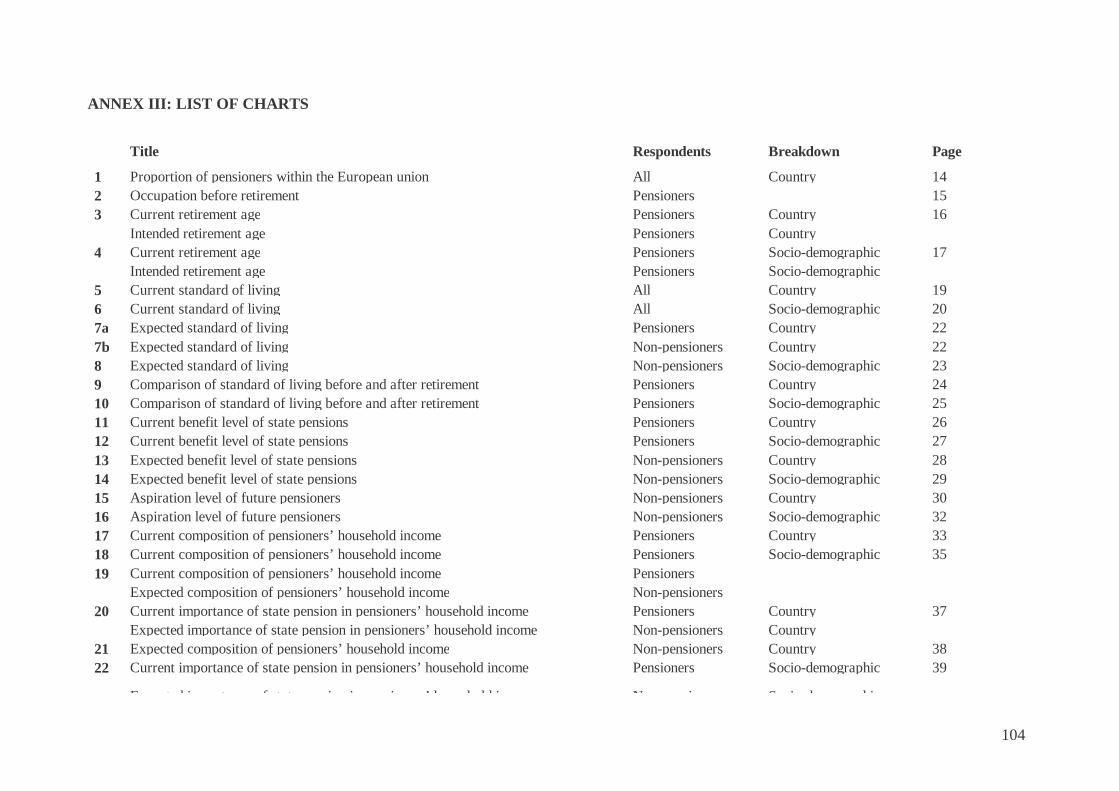
104
ANNEX III: LIST OF CHARTS
Title Respondents Breakdown Page
1 Proportion of pensioners within the European union All Country 14 2 Occupation before retirement Pensioners 15 3 Current retirement age Pensioners Country 16 Intended retirement age Pensioners Country 4 Current retirement age Pensioners Socio-demographic 17 Intended retirement age Pensioners Socio-demographic 5 Current standard of living All Country 19 6 Current standard of living All Socio-demographic 20 7a Expected standard of living Pensioners Country 22 7b Expected standard of living Non-pensioners Country 22 8 Expected standard of living Non-pensioners Socio-demographic 23 9 Comparison of standard of living before and after retirement Pensioners Country 24 10 Comparison of standard of living before and after retirement Pensioners Socio-demographic 25 11 Current benefit level of state pensions Pensioners Country 26 12 Current benefit level of state pensions Pensioners Socio-demographic 27 13 Expected benefit level of state pensions Non-pensioners Country 28 14 Expected benefit level of state pensions Non-pensioners Socio-demographic 29 15 Aspiration level of future pensioners Non-pensioners Country 30 16 Aspiration level of future pensioners Non-pensioners Socio-demographic 32 17 Current composition of pensioners’ household income Pensioners Country 33 18 Current composition of pensioners’ household income Pensioners Socio-demographic 35 19 Current composition of pensioners’ household income Pensioners Expected composition of pensioners’ household income Non-pensioners 20 Current importance of state pension in pensioners’ household income Pensioners Country 37 Expected importance of state pension in pensioners’ household income Non-pensioners Country 21 Expected composition of pensioners’ household income Non-pensioners Country 38 22 Current importance of state pension in pensioners’ household income Pensioners Socio-demographic 39
Expected importance of state pension in pensioners’ household income Non-pensioners Socio-demographic
105
Title Respondents Breakdown Page
23 Expected composition of pensioners’ household income Non-pensioners Socio-demographic 39 24 Current composition of pensioners’ household income Pensioners 40 Expected composition of pensioners’ household income Non-pensioners Desired composition of pensioners’ household income All 25 Expected importance of state pension in pensioners’ household income Non-pensioners Country 41 Desired importance of state pension in pensioners’ household income Non-pensioners Country 26 Desired composition of pensioners’ household income All Country 42 27 Expected importance of state pension in pensioners’ household income Non-pensioners Socio-demographic 43 Desired importance of state pension in pensioners’ household income Non-pensioners Socio-demographic 28 Desired composition of pensioners’ household income All Socio-demographic 43 29 Goal of pensions: prevention of poverty in old age All Country 45 30 Goal of pensions: prevention of poverty in old age All Socio-demographic 46 31 Goal of pension: maintaining an adequate standard of living All Country 47 32 Goal of pension: maintaining an adequate standard of living All Socio-demographic 48 33 Goal of pensions: reducing social inequalities amongst elderly All Country 49 34 Goal of pensions: reducing social inequalities amongst elderly All Socio-demographic 50 35 Principle of pensions: basic social right All Country 51 36 Principle of pensions: basic social right All Socio-demographic 52 37 Principle of pensions: universality All Country 53 38 Principle of pensions: universality All Socio-demographic 54 39 Principle of pensions: equivalence All Country 55 40 Principle of pensions: equivalence All Socio-demographic 56 41 Statement: maintaining benefit levels by increasing contribution rates and/or taxes All Country 58 42 Statement: maintaining benefit levels by increasing contribution rates and/or taxes All Socio-demographic 59 43 Statement: reducing benefit levels in order to maintain contribution rates All Country 60 44 Statement: reducing benefit levels in order to maintain contribution rates All Socio-demographic 61 45 Statement: raising the (statutory or actual) age of retirement All Country 62 46 Statement: raising the (statutory or actual) age of retirement All Socio-demographic 63 47 Statement: cutting expenditures in other policy areas All Country 65

106
Title Respondents Breakdown Page
48 Statement: cutting expenditures in other policy areas All Socio-demographic 66 49 Statement: fighting unemployment All Country 67 50 Statement: fighting unemployment All Socio-demographic 68 51 Statement: increasing labor force participation All Country 69 52 Statement: increasing labor force participation All Socio-demographic 70 53 Statement: increasing immigration of foreigners All Country 71 54 Statement: increasing immigration of foreigners All Socio-demographic 72 55 Statement: gradual retirement All Country 74 56 Statement: gradual retirement All Socio-demographic 75 57 Statement: fixed retirement age All Country 76 58 Statement: fixed retirement age All Socio-demographic 76 59 Statement: influence of early retirement on pension benefits All Country 78 60 Statement: influence of late retirement on pension benefits All Country 78 61 Statement: influence of early retirement on pension benefits All Socio-demographic 79 62 Statement: influence of late retirement on pension benefits All Socio-demographic 80 63 Statement: incentives for late retirement All Country 81 64 Statement: incentives for late retirement All Socio-demographic 82
107
ANNEX IV: LIST OF TABLES
Title Respondents Breakdown Page
1 Current standard of living All (Non) - Pensioners 12 2 Expected standard of living All (Non) - Pensioners 13 3 Statement: maintaining benefit levels by increasing contribution rates and taxes All (Non) - Pensioners 50 4 Statement: reducing benefit levels in order to maintain contribution rates All (Non) - Pensioners 52 5 Statement: raising (statutory or actual) age of retirement All (Non) - Pensioners 54