the future of oil & gas emission inventory work€™s next? the future of oil & gas...
TRANSCRIPT

What’s Next? The Future of Oil & Gas Emission
Inventory Work
June 2016
2016 Midwest and Central States Air Quality Workshop
June 21-23, 2016
Mark Gibbs Chair National Oil and Gas Emissions Committee

Why are we so concerned about Oil and Gas emissions?
• Significant emissions from this sector
• Key data for modeling, rulemaking, and national and international reporting
• Accurate inventories yield more effective and targeted regulations
• O&G emissions impact NO2 and ozone attainment
• Interstate transport – CSAPR and follow-up rules
– Decline of EGU NOX emissions
– Rise in O&G NOX emissions
• In spite of the recent O&G price collapse, we can expect future growth in onshore exploration and production
2

This Presentation
• What’s Next?
• Super-Emitters / Fat Tails
• The Midstream Gap
• Other Missing Sources
• Better Characterizing Oil and Gas Emissions
– Assessing gaps and possible improvements
– Increasing granularity and heterogeneity
– Oil versus gas wells?
– Projecting future emissions
• How to Find Out More 3

National Oil and Gas Committee: What’s Next?
• Closing the midstream gap
• Accounting for new rules coming on line – NSPS OOOO, OOOOa, etc.
• Determine actual capture efficiencies
• How do we address super-emitters? – How do we estimate the probability and quantify the magnitude of emissions
from equipment malfunctions?
• How do we continue to better integrate different sources of O&G emissions data?
4
GHGRP Pending ICR data State permitting data WRAP studies and
inventories
Industry studies EDF/University/Industry
collaborative work Upcoming EPA study in the
Uintah Basin

National Oil and Gas Committee: What’s Next?
• Developing better emission factors
• Updating engine fleet data
• Unconventional vs. conventional wells
• How do we address stripper wells?
• Reconciling top-down and bottom-up inventories
• Additional GHGRP data will be available for 2017:
– US Well IDs
– Gathering and Boosting Systems (Midstream Facilities)
5

In the O&G Sector, Something is Always Leaking
OK DEQ
Compliance
Inspection with
FLIR camera
6
Open thief hatch
EPA Compliance Alert (September 2015)

Super-Emitters/Fat Tails (log-normal data distribution of emissions by source)
• The point of an emission inventory is to estimate actual emissions, not emissions when everything is working properly.
• Potential for large impacts on emissions estimates
• Super-emitters observed at the facility level and at the individual source level
• How to effectively characterize?
– Imagery collection and analysis
– New technologies
• OKDEQ NODA comments/quantifying fat tails (hybrid analysis based on OIPA study and Allen et al. 2013)
• Work performed in Colorado – e.g., Dale Wells (Colorado DPHE) and Cindy Beeler (EPA Region 8)
7

8
2013 Oklahoma Wellhead Facility Emissions

Super-Emitters/Fat Tails (a work in progress)
• Lesson learned: when scaling up emissions, use the arithmetic mean of the data set; do not populate the tool with median values or the geometric mean.
• Outliers matter. If you think outliers are skewing the data set, do not discard them. Gather more data!
9
• Need to explore additional approaches

Super-Emitters/Fat Tails (a work in progress)
“Half of the money I spend on advertising is wasted; the trouble is I don’t know which half.” – John Wanamaker
• Ten percent of my sources are super emitters, I just don’t know which ones.
• Develop approaches to incorporate super emitters into key emission factors.
10 (Allen, 2016)
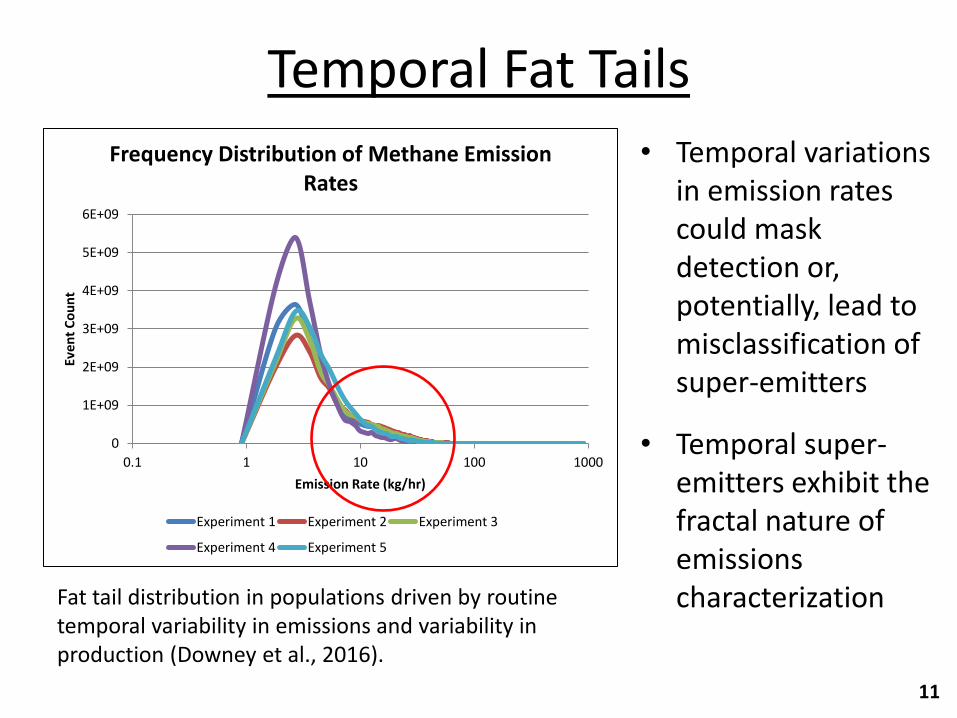
Temporal Fat Tails
• Temporal variations in emission rates could mask detection or, potentially, lead to misclassification of super-emitters
• Temporal super-emitters exhibit the fractal nature of emissions characterization
11
Fat tail distribution in populations driven by routine temporal variability in emissions and variability in production (Downey et al., 2016).
0
1E+09
2E+09
3E+09
4E+09
5E+09
6E+09
0.1 1 10 100 1000
Eve
nt
Co
un
t
Emission Rate (kg/hr)
Frequency Distribution of Methane Emission Rates
Experiment 1 Experiment 2 Experiment 3
Experiment 4 Experiment 5

Reconciling Top-Down and Bottom-Up Emissions Inventories
12
• Top-down approaches have generally identified “missing” VOC emissions
• Methane:ethane ratios can help rule out non-O&G sources
• More work is needed to better inventory super-emitters
(Karion, et al., 2015)
(Yakovitch, et al., 2015)
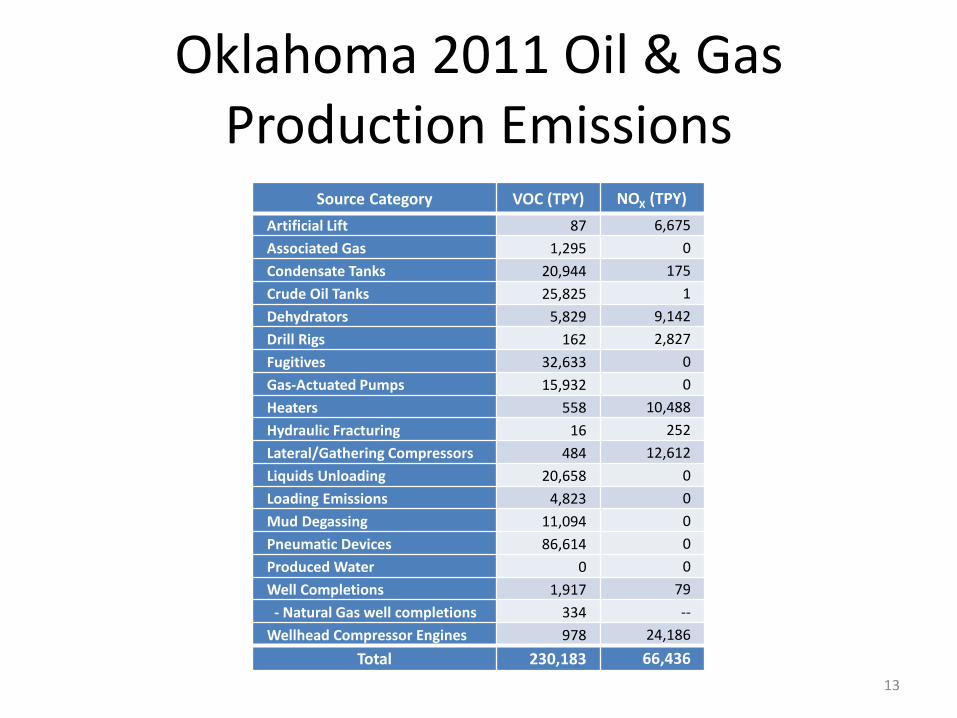
Oklahoma 2011 Oil & Gas Production Emissions
Source Category VOC (TPY) NOX (TPY)
Artificial Lift 87 6,675
Associated Gas 1,295 0
Condensate Tanks 20,944 175
Crude Oil Tanks 25,825 1
Dehydrators 5,829 9,142
Drill Rigs 162 2,827
Fugitives 32,633 0
Gas-Actuated Pumps 15,932 0
Heaters 558 10,488
Hydraulic Fracturing 16 252
Lateral/Gathering Compressors 484 12,612
Liquids Unloading 20,658 0
Loading Emissions 4,823 0
Mud Degassing 11,094 0
Pneumatic Devices 86,614 0
Produced Water 0 0
Well Completions 1,917 79
- Natural Gas well completions 334 --
Wellhead Compressor Engines 978 24,186
Total 230,183 66,436
13


15
• Type A & B Potential Point Sources
• Oil and Gas Tool + Aggregated Permitted Wells
• Point Source Midstream Emissions

OK 2011 NEI VOC
TONS
PROPORTION OF ALL SOURCES
Point 46,554 8%
Area 287,938 45%
Onroad 35,528 5%
Nonroad 27,815 4%
Event 243,573 38%
All Sources 641,407
TONS
PROPORTION OF ALL SOURCES
All Point 46,554 8%
Title V Oil & Gas 11,813 2%
Midstream Oil & Gas 18,255 3%
Area 287,938 45%
Production Oil & Gas 231,250 36%
All Sources 641,407
Point 3%
Title V Oil & Gas 2% Midstream Oil & Gas
3%
Production Oil & Gas 36%
Other Area 9% Onroad
5%
Nonroad 4%
Event 38%
All Area 45%
All Oil & Gas
41%
16
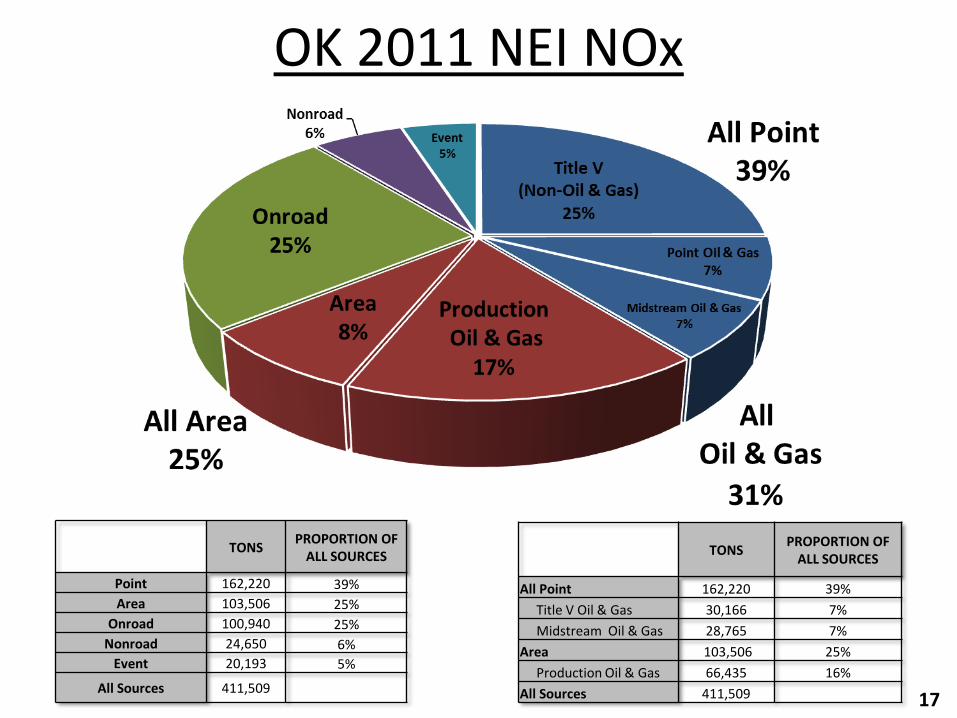
OK 2011 NEI NOx
TONS PROPORTION OF
ALL SOURCES
Point 162,220 39%
Area 103,506 25%
Onroad 100,940 25%
Nonroad 24,650 6%
Event 20,193 5%
All Sources 411,509
TONS
PROPORTION OF ALL SOURCES
All Point 162,220 39%
Title V Oil & Gas 30,166 7%
Midstream Oil & Gas 28,765 7%
Area 103,506 25%
Production Oil & Gas 66,435 16%
All Sources 411,509 17
31%

Midstream Gap
• Three Questions: Is the facility permitted?
Is the facility inventoried?
Is its inventory submitted
to the NEI?
• What about small un-permitted midstream facilities (such as junction stations)?
– Lateral/gathering compressor engines in the O&G Tool: are those sufficient to capture these un-permitted facilities?
18

OK 2014 Midstream Emissions
19
Oklahoma Midstream Emissions VOC TPY NOx TPY
AERR Midstream Emissions 8,200 31,700
Min/Syn-Minor Midstream Emissions
(from OK DEQ permitted Min/Syn Minor sources) 31,700 29,300
Uninventoried Midstream Emissions
(from unpermitted sources in OK) no data no data
Total Midstream Emissions > 28,200 > 61,000
2014 Emissions as of 6/14/2016

U.S. Natural Gas Pipeline Network
20
The “plumbing” is different between basins

Other Missing Sources
• Abandoned Wells
• Produced Water (tanks and ponds)
• Pipelines
• Distribution sector (post city gate)
21

• Assessing gaps and possible improvements:
– MJO-funded project about to start:
• Evaluate potential for missing sources in the NEI
• Compare detailed state inventories to the Tool
• Evaluate data sources
• Identify emission sources with highest uncertainty
– Information Collection Request (ICR) for existing sources
• Draft is currently open for comment
• How can the ICR help improve the NEI?
• What data already exists that the ICR does not need to
address?
• Ensure best possible data is used to develop new regulations
Better Characterizing O&G Emissions
22

• Sensitivity Analyses
• Examples: – Age of Engines
– Fraction of gas wells with
compression (large driver of NOx emissions)
– Engine data missing from the draft ICR
• Possible applications: – Use the Tool to assess impacts of potential regulations
– Identify key areas for high priority future work and data collection
Better Characterizing O&G Emissions
23

24
Granularity and Heterogeneity
Gas analyses from permits for wellheads
Number of unique gas analyses per county (for counties with at least 10 unique analyses)

Granularity and Heterogeneity
25
Weight % VOC used for pneumatic device and fugitive emissions in the Oil & Gas Tool
Weight % VOC for pneumatic device and
fugitives emissions based on gas analyses from
OKDEQ mined permits
14%
14%
14% 3%
23%
13%

Granularity and Heterogeneity Incorporation of Permit Data and Point Source Subtraction
Oil Wells Gas Wells CBM Wells
Crude Oil (BBL/well)
Associated Gas
(MCF/well)
Condensate (BBL/well)
Natural Gas (MCF/well)
Condensate (BBL/well)
Natural Gas (MCF/well)
OKDEQ Permitted
Wells 16,289 154,286 674 223,805 0 13,042
Residual Wells 3,400 17,523 37 36,389 15 8,652
26
• Wells from the OKDEQ point source inventory are (in general): ‒ Newer wells ‒ Higher production wells
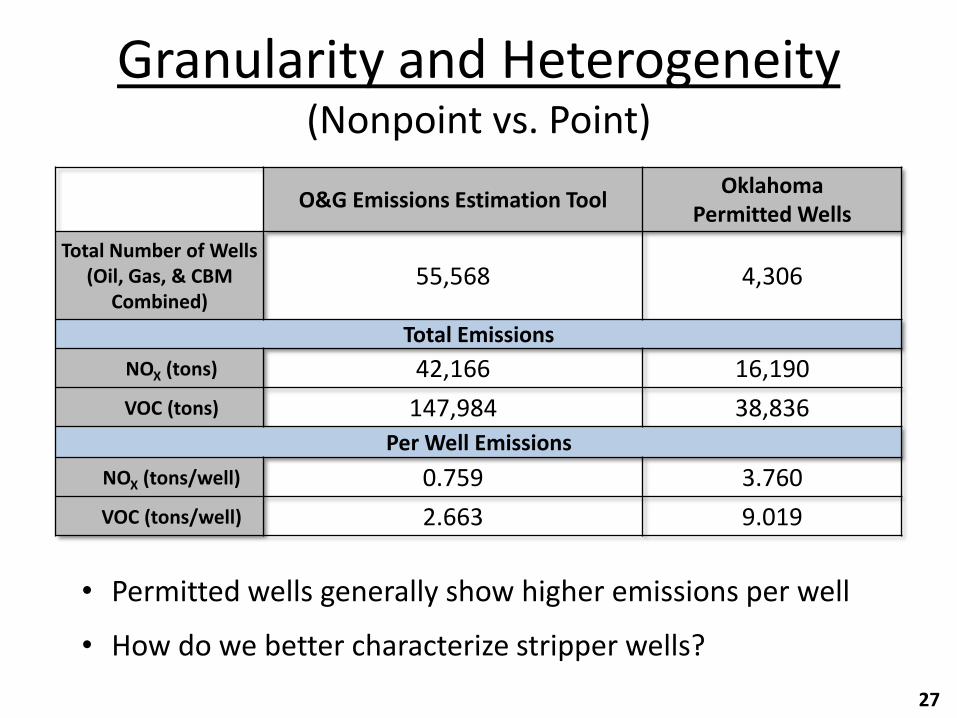
Granularity and Heterogeneity (Nonpoint vs. Point)
O&G Emissions Estimation Tool Oklahoma
Permitted Wells
Total Number of Wells (Oil, Gas, & CBM
Combined) 55,568 4,306
Total Emissions
NOX (tons) 42,166 16,190
VOC (tons) 147,984 38,836
Per Well Emissions
NOX (tons/well) 0.759 3.760
VOC (tons/well) 2.663 9.019
27
• Permitted wells generally show higher emissions per well
• How do we better characterize stripper wells?

Well Classification Based on Gas-Oil Ratio (GOR)
28
• For the 2014 Tool the method for classifying wells (as oil or gas) was changed to match OAP GHG programs
– 100 Mscf / bbl
Result: a greater proportion of Oklahoma wells are classified as crude oil rather than gas (when compared to the method used in the 2011 Tool)
We expect that this has resulted in an underestimation of VOC emissions from working, breathing, flashing, and loading losses. Why? Because condensate has a higher API gravity, more lighter hydrocarbons, higher vapor pressure, and more VOC emissions.

Well Classification based on GOR • For horizontal wells in unconventional plays, the
distinction between oil well and gas well is artificial – API gravity intermediate between crude oil and condensate
– High gas production but high liquids production too
– This artificial distinction can yield different default equipment counts and/or emissions estimates (both in the Tool and in programs like the GHGRP)
29
Wells that produce only from high permeability gas, shale gas, coal seam, or other tight gas reservoir rock are considered gas wells…. All wells that produce hydrocarbon liquids (with or without gas) and do not meet the definition of a gas well in this sub-basin category definition are considered to be in the oil formation.
40 CFR Part 98, GHGRP: 2014 Revisions and Confidentiality Determinations, Final Rule (79 FR 70356), November 25, 2014,

30
• Develop defensible methods for agencies to use for air quality planning and management
• At the formation level in each basin, across exploration and production
• With respect to current and changing future practices integrate: ‒ Existing reservoir decline curves vs. new formations & production
methods
‒ Expectations for future production
‒ Commodity prices
‒ Commodity distribution and waste/by-product mgmt. systems
‒ Episodic and regular practices
‒ Evolution in source type distributions and regulations
Projecting Future O&G Emissions

Oil & Gas Emissions Repository http://vibe.cira.colostate.edu/ogec/home.htm
31

National Oil & Gas Emissions Committee
32
• Participants from EPA Offices, MJO’s, States, Locals
• Calls are at 2 PM Eastern on Second Thursday of each month
• Email [email protected] to be added to the mailing list