the future of fgd gypsum in europe 25th ashtrans europe ...ashtrans.eu/onewebmedia/7 ashtrans europe...
TRANSCRIPT

ASHTRANS EUROPE 2015 - DE/KT
1
Dr.-Ing. Jörg Demmich, Knauf Group
Chairman of the FGD Gypsum WG of Eurogypsum
The Future of FGD Gypsum in Europe 25th
ASHTRANS EUROPE 2015
7 – 8 September
Copenhagen

ASHTRANS EUROPE 2015 - DE/KT
2
1. Introduction
Eurogypsum presentation
Energy policy in Europe: Similarities and differences
2. Current status of FGD gypsum production in the EU
3. The German Energy Policy Concept
Steps to increase renewables in electricity generation
Decision to run out of nuclear energy generation
Estimated impact on FGD gypsum production
4. The European Energy Policy
European data basis
Estimation on prospective FGD gypsum production possible
5. Summary
Content

ASHTRANS EUROPE 2015 - DE/KT
3
Founded in 1961 in Geneva
Registered in Belgium since 2006
Full Members:
- National Gypsum Associations
11 covering Western Europe, Poland and Turkey
Associate Members:
- Companies in countries without associations
Five companies
The Gypsum Industry in Europe Eurogypsum AISBL

ASHTRANS EUROPE 2015 - DE/KT
4
With a turnover of over 7.7 billion EURO, the European gypsum industry
operates
- 154 quarries
- 164 factories (plaster powder plants, plaster block plants and
plasterboard plants) and
- generates employment directly to 28,000, indirectly to 300,000
people and indirectly for 1,000,000 plasterboard installers.
- It is one of the few fully integrated industries within the construction
products field.
The European Gypsum Industry covers the whole life-cycle of the
product (from extraction to recycling).
The Gypsum Industry in Europe Eurogypsum AISBL

ASHTRANS EUROPE 2015 - DE/KT
5
Common objective of the European energy policy is to reduce GHG1) emissions
EU-wide. The EU Climate & Energy Package3) defines 3 explicit targets “20 – 20
– 20” based on 1990 level and changed in 20144):
- 20% (40%) reduction of GHG emissions by 2020 (2030)
Current status (2012): 19,2%
- 20% (35%) share of RES2) in electricity generation by 2020 (2030)
- 20% (min. 27%) increasing in energy savings by 2020 (2030)
For 2050 the European Commission proposes a “competitive low-carbon
economy” with GHG emission reduction of 80-95%.
The most part of CO2-equivalents emission results from energy generation
(79% in 2012).
1) GHG: Green House Gas 2) RES: Renewable energy sources 3) European Commission: “An Energy Policy for Europe”, COM (2007) 1 4) European Commission: “A Policy Framework for Climate and Energy
in the period from 2020 to 203”, COM (2014) 15
Energy Policy in Europe –
Similarities and differences

ASHTRANS EUROPE 2015 - DE/KT
6
Energy Policy in Europe –
Similarities and differences
But the current situation differs from member state to member state
significantly:
- RES share (2012) of electricity generation in EU-MS1) from 6,1%
(Hungary) to Austria (65,5%), EU average 23,5%.
- Coal/lignite share (2012) of electricity generation in EU-MS from
1% (Sweden) to 92,5% (Poland), EU average 27%.
The current situation and the way how to achieve the EU goals is very
different from country to country. As only in Germany a clear roadmap
for energy policy until 2050 exists it has to be distinguished between
Germany and the EU in the following.
But at first let´s have a look on the current FGD gypsum production in
the EU and Germany as the main producer.
1) MS: Member State without small countries

ASHTRANS EUROPE 2015 - DE/KT
7
7,57,1 6,9 6,6
6,36,8 7,03
11,5 11,210,8
11,310,6
10,211,3
4
5
6
7
8
9
10
11
12
2005 2006 2007 2008 2009 2010 2011 2012
FGD gypsum quantities 2005-2012 (EU151) and Germany2))
Germany
Europe
mill. tons/
year
1) ECOBA (15 Member states) EU: 28 Member states
2) VGB Powertech
Current status of FDG gypsum production in the EU
(EU 28: 18 mill. t)1)

ASHTRANS EUROPE 2015 - DE/KT
8
1) Energy concept of the German Government (28.09.2010): RES shares and gross power generation according to Energy Concept Germany.
Share of coal and others calculated/estimated. 2) RES: Renewable Energy Sources
Why separate assessment of Germany? Biggest FGD gypsum producer in
the EU
Energy Concept Germany (28.09.2010)
(Gross power generation and RES2) shares before exit-decision of nuclear
power generation)
The German Energy Policy Concept

ASHTRANS EUROPE 2015 - DE/KT
9
Gross power generation in Germany- after exit-decision of nuclear power
generation (2011)
(Basis: Energy Concept of German Government, 28.09.2010, changed by lead
scenario 2012)
Source: Long term scenarios and strategies for development of renewable energies in Germany taking into consideration the development in Europe and worldwide (scenario A).
BMU-FKZ 03MAP146, 29.03.2012 (BMU Lead Scenario 2012)
1) Federal Ministry for Economic Affairs and Energy 2012
The German Energy Policy Concept
/lignite

ASHTRANS EUROPE 2015 - DE/KT
10
The German Energy Policy Concept
Estimated impact on FGD gypsum production
Goals for GHG1)- reduction and RES2) share of gross electricity generation
Current status
Germany 2010 2015 2020 2025 2030 2040 2050 2014
GHG reduction 3) 40% 55% 70% 80-95%
RES share 3) 35% 50% 65% 80% 26,20%
RES share 4) 39-45% 48-64% 54-77% 65-85%
RES share 5) 17%6) 28% 42% 53% 64% 77% 85%
coal / lignite share 4) 26-42% 15-41% 7-28% 2-15% 43,40%
coal / lignite share 5) 42%6) 38% 26% 25% 15% 7% 2%
1) GHG = Greenhouse Gas
2) RES = Renewable Energy Sources
3) Energy Concept German Government (2010) 4) Different studies (2012-2014) after phasing out of
nuclear energy; best case: Federal Ministry of
Economical Affairs BMWi “Energy Reference
Prognosis June 2014”
5) BMU Lead Study 2012

ASHTRANS EUROPE 2015 - DE/KT
11
Prospective development of FGD gypsum production in Germany
Fuel-shares of electricity production
The German Energy Policy Concept
17
28
42
53
64
77
85
17
39
47 48
54
65
0
10
20
30
40
50
60
70
80
90
2010 2020 2030 2040 2050
Renewable energies (%)
BMU Lead Study 2012(worst case)
BMWI Energy Referenceprognosis/Trend scenario
2014 (best case)
42 38
26 25
15
7
2
42 42 4241
28
15
0
5
10
15
20
25
30
35
40
45
2010 2020 2030 2040 2050
%
Coal/lignite %
ASHTRANS EUROPE 2015 - DE/KT
12
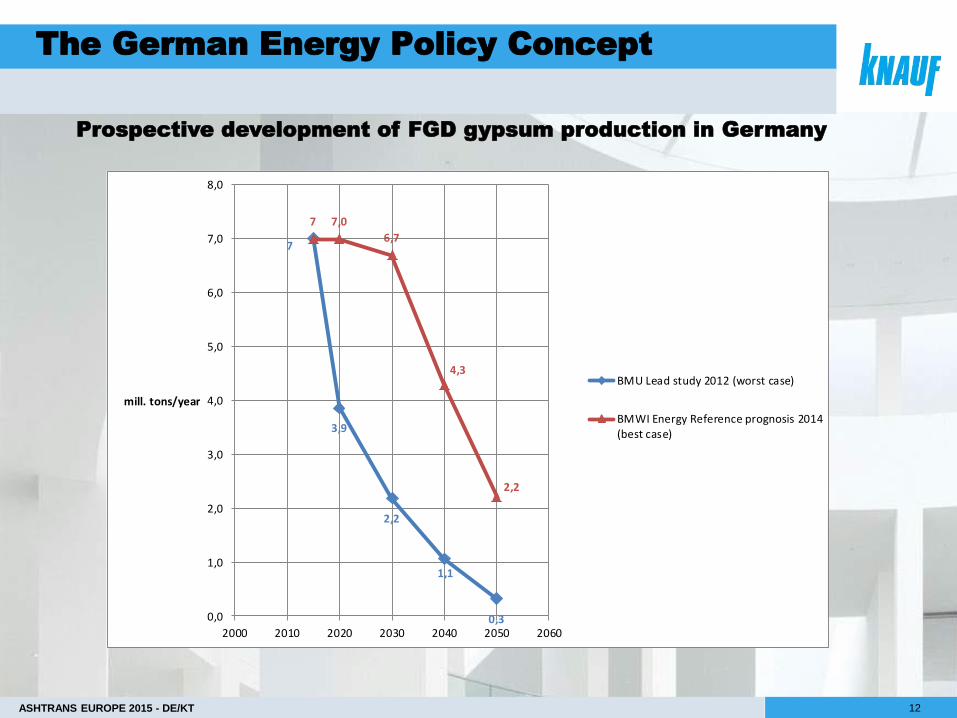
Prospective development of FGD gypsum production in Germany
7
3,9
2,2
1,1
0,3
7 7,0
6,7
4,3
2,2
0,0
1,0
2,0
3,0
4,0
5,0
6,0
7,0
8,0
2000 2010 2020 2030 2040 2050 2060
mill. tons/year
BMU Lead study 2012 (worst case)
BMWI Energy Reference prognosis 2014(best case)
The German Energy Policy Concept

ASHTRANS EUROPE 2015 - DE/KT
13
In the European Union there are some official publications and a lot of unofficial
studies on the European energy policy, e.g.
- An Energy Policy for Europe, COM (2007) 1, European Commission.
- Energy Road Map 2050, COM (2011) 885 — 6 different scenarios, European
Commission.
- EU Energy Trends to 2050 (2013), European Commission, EU Reference
Scenario 2013.
- Thermal Power in 2030 (2015), EPPSA European Power Plant Suppliers
Association, including 7 different studies.
- Prognos-Report: „Supply of Gypsum to industry in the context of energy
turnaround in Europe, Ashtrans Europe 2014, Berlin.
Against this background it is not easy which scenario should be taken as a basis for
estimation of the prospective FGD gypsum production.
The European Energy Policy

ASHTRANS EUROPE 2015 - DE/KT
14
Prospective development of FGD gypsum production in the EU
The European Energy Policy
Goals for GHG1)- reduction and RES2) share of gross electricity generation
Current status
EU 2020 2030 2040 2050 2012
GHG reduction 3) 20% 40% 80-95%
RES share 3) 20% 35% 40,3-83,1% 22,4% 5)
RES share 4) 36% 45% 53%
coal and lignite share 3) 2,1-15,2 %
coal and lignite share 4) 20% 12% 7% 27,4% 5)
1) GHG = Greenhouse Gas
2) RES = Renewable Energy Sources
3) EU Commission "Energy Road Map 2050", COM (2011) 885
4) EU Commission "EU Energy Trends to 2050 - EU Reference Scenario 2013" (2013)
5) Eurostat

ASHTRANS EUROPE 2015 - DE/KT
15
Prospective development of FGD gypsum production in the EU
The European Energy Policy
(1) Prognos-Report: „Supply of Gypsum to industry in the context of energy turnaround in Europe, Ashtrans Europe 2014,
Berlin
(2) European Comission: “EU Trends to 2050 – EU-Reference Scenario“ (2013)
19,6 19,7
17,3
15,2
11,7
18(Estimation ECOBA)
13,1
7,8
4,6
0
5
10
15
20
25
2010 2015 2020 2025 2030 2035 2040 2045 2050 2055
FGD Gypsum (1)
FGD Gypsum calculatedfrom (2)
mill. tons/ year

ASHTRANS EUROPE 2015 - DE/KT
16
EU
The European Union follows a strict “decarbonisation objective” in electricity generation in the
time period 2010-2050:
Nuclear share will be stable at 20% (2012: 27%).
Coal/lignite share will decrease from 27% down to 7%.
RES share will increase from 22% up to 53%.
Starting from these background data the FGD gypsum production will decrease from
estimated 18 mill. tons/year down to almost 5 mill. tons/year.
But the databasis is not reliable enough.
Can the EU achieve these ambitious aims in terms of significantly increasing RES share
regarding the substantially different situation in the EU-MS?
Germany
The data basis in Germany is based on a couple of studies with a large variety.
Nuclear share will be zero in 2022.
Coal/lignite share will decrease from 43% down to 2-15%.
RES share will increase from 26% up to 65-85%.
Starting from these background data the FGD gypsum production will decrease from 7 mill.
tons/year down to 0,3-2,2 mill. tons/year.
Summary I
ASHTRANS EUROPE 2015 - DE/KT
17
Beside a reduction in quantity another issue is important for the use of
FGD gypsum: the quality.
Due to LCP-BREF process the emissions of mercury and other heavy metals (?)
have to be reduced tremendously.
The enrichment of these pollutants in the FGD gypsum has to be
avoided by all means.
Otherwise the European gypsum industry cannot guarantee the further
use of this secondary raw material.
What are the counteractive measures for the European gypsum industry
for raw materials supply protection?
Increasing activities for recycling gypsum waste, first of all plasterboard waste
(estimated medium-term 2 mill. tons/year).
As the recycled gypsum cannot compensate decreasing FGD gypsum
quantities: Increased use of natural gypsum will be necessary.
Summary II

ASHTRANS EUROPE 2015 - DE/KT
18
Thank you for your attention !
Z Z Z Z z
…