the future of e- commerce - sharesinvestcoach.com · fairprice and cold storage have e-commerce...
TRANSCRIPT

The Future of E-commerce
Done By: Kenny Ong1

Agenda:1. Introduction2. Industry Analysis3. Forecasts4. Implications5. Emerging Tech6. Conclusion
2

Introduction
3

Introduction Forecasts Implications ConclusionIndustry Analysis Emerging Tech 4
Value Chain Analysis - Disintermediation

Introduction Forecasts Implications ConclusionIndustry Analysis Emerging Tech 5
Definitions

Introduction Forecasts Implications ConclusionIndustry Analysis Emerging Tech
IndustryAnalysis
6
Introduction Forecasts Implications ConclusionIndustry Analysis Emerging Tech 7
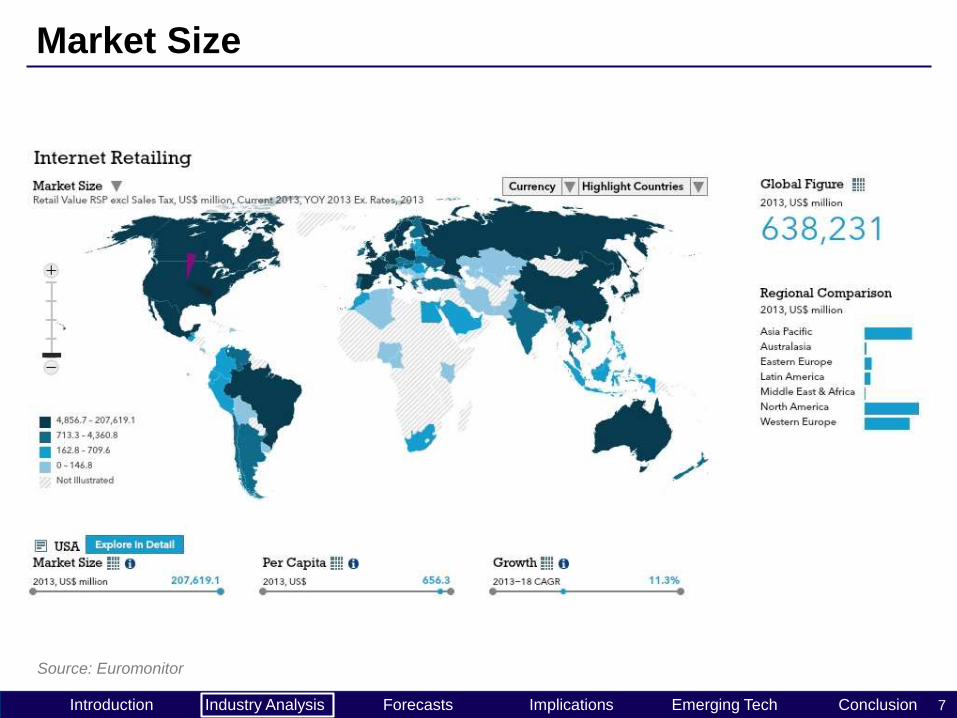
Market Size
Source: Euromonitor

Introduction Forecasts Implications ConclusionIndustry Analysis Emerging Tech 8
Competitive Forces the Shape Industry
Bargaining Power of Buyers
Moderate• Customer centric service
• Customer able to switch to
other services at little, or no,
costs.
Threat of Potential Entrants
High• Low capital needed.
• Cost of exiting the industry is also
low for smaller players.
Threat of Substitute Products
Low• E-retailing provides consumers
with major necessities from
retail.
Rivalry among Competing Firms
Moderate• Many firms fighting for the pie
with some obvious winners.
Bargaining Power of Suppliers
Low• Directly to commodity
manufacturers.
Introduction Forecasts Implications ConclusionIndustry Analysis Emerging Tech 9
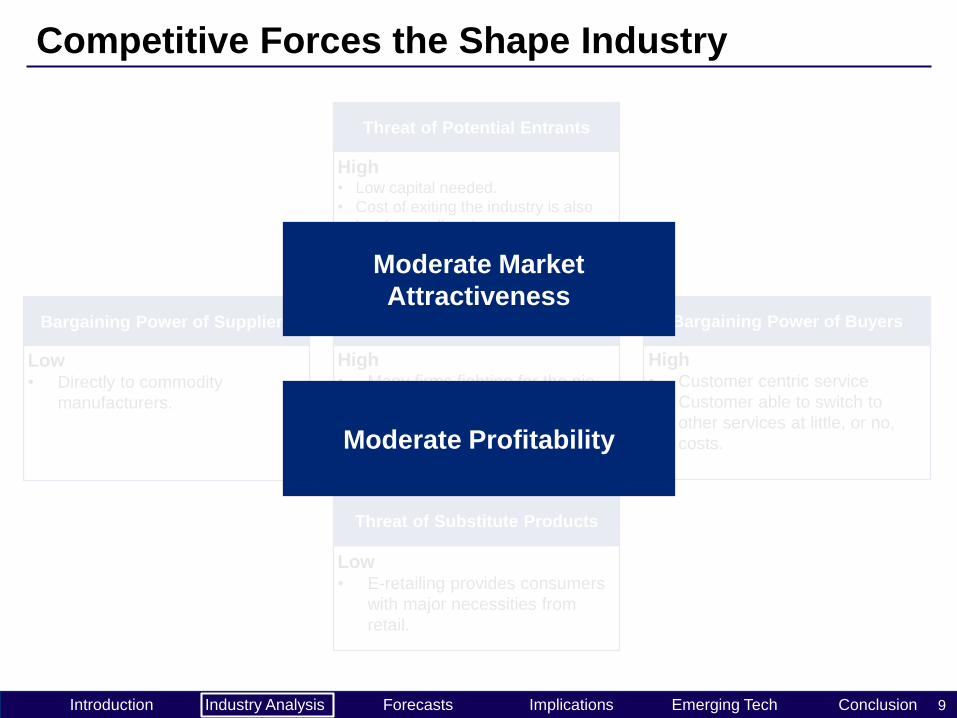
Competitive Forces the Shape Industry
Bargaining Power of Buyers
High• Customer centric service
• Customer able to switch to
other services at little, or no,
costs.
Threat of Potential Entrants
High• Low capital needed.
• Cost of exiting the industry is also
low for smaller players.
Threat of Substitute Products
Low• E-retailing provides consumers
with major necessities from
retail.
Rivalry among Competing Firms
High• Many firms fighting for the pie
with some obvious winners.
Bargaining Power of Suppliers
Low• Directly to commodity
manufacturers.
Moderate Market
Attractiveness
Moderate Profitability

Introduction Forecasts Implications ConclusionIndustry Analysis Emerging Tech 10
Industry Life Cycle
Source: Emerald Insight

Introduction Forecasts Implications ConclusionIndustry Analysis Emerging Tech 11
Historical Growth (2008-2013)
Souce: Euromonitor
0
100,000
200,000
300,000
400,000
500,000
600,000
700,000
2008 2009 2010 2011 2012 2013
E-C
om
me
rce
Sal
es
(US
Mn
)
World
USA
Western Europe
Japan
China
Indonesia
Singapore
CAGR: 17%
CAGR: 13%
CAGR: 122%

Introduction Forecasts Implications ConclusionIndustry Analysis Emerging Tech 12
Historical Growth (2008-2013)
0.0
100,000.0
200,000.0
300,000.0
400,000.0
500,000.0
600,000.0
700,000.0
2008 2009 2010 2011 2012 2013
World
USA
Western Europe
Japan
China
Indonesia
Singapore
CAGR: 17%
CAGR: 13%
CAGR: 122%
Where are we heading to?

Introduction Forecasts Implications ConclusionIndustry Analysis Emerging Tech
Forecasts
13

Introduction Forecasts Implications ConclusionIndustry Analysis Emerging Tech 14
Is the how you want to shop?
Soruce: The Columbian

Introduction Forecasts Implications ConclusionIndustry Analysis Emerging Tech 15
Or would you rather shop from home?

Introduction Forecasts Implications ConclusionIndustry Analysis Emerging Tech 16
Many companies in the US are announcing cuts
More than 1000 stores closed

Introduction Forecasts Implications ConclusionIndustry Analysis Emerging Tech 17
Where do they shop at now?

Introduction Forecasts Implications ConclusionIndustry Analysis Emerging Tech 18
Online Growth far outstrips Offline Growth
Source: Euromonitor
2008 2009 2010 2011 2012 2013
World(Offline) 10,900,231.2 11,059,031.0 11,513,269.7 12,062,173.9 12,650,706.3 13,277,934.3
World(Online) 281,598.9 300,738.0 364,261.5 458,541.6 545,011.8 638,231.0
WorldGrowth(Offline) 1% 4% 5% 5% 5%
WorldGrowth(Online) 7% 21% 26% 19% 17%
0%
5%
10%
15%
20%
25%
30%
0
2,000,000
4,000,000
6,000,000
8,000,000
10,000,000
12,000,000
14,000,000
16,000,000
TotalR
etailSalesUS$m
n
Introduction Forecasts Implications ConclusionIndustry Analysis Emerging Tech 19
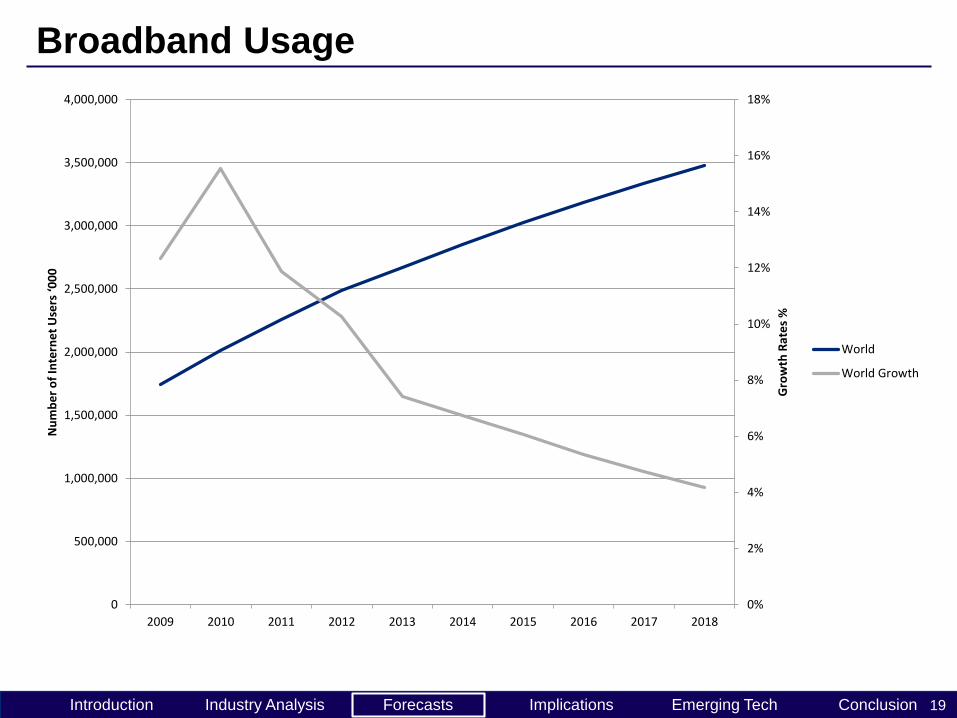
Broadband Usage
0%
2%
4%
6%
8%
10%
12%
14%
16%
18%
0
500,000
1,000,000
1,500,000
2,000,000
2,500,000
3,000,000
3,500,000
4,000,000
2009 2010 2011 2012 2013 2014 2015 2016 2017 2018
Gro
wth
Rat
es
%
Nu
mb
er
of
Inte
rne
t U
sers
‘00
0
World
World Growth
Introduction Forecasts Implications ConclusionIndustry Analysis Emerging Tech 20
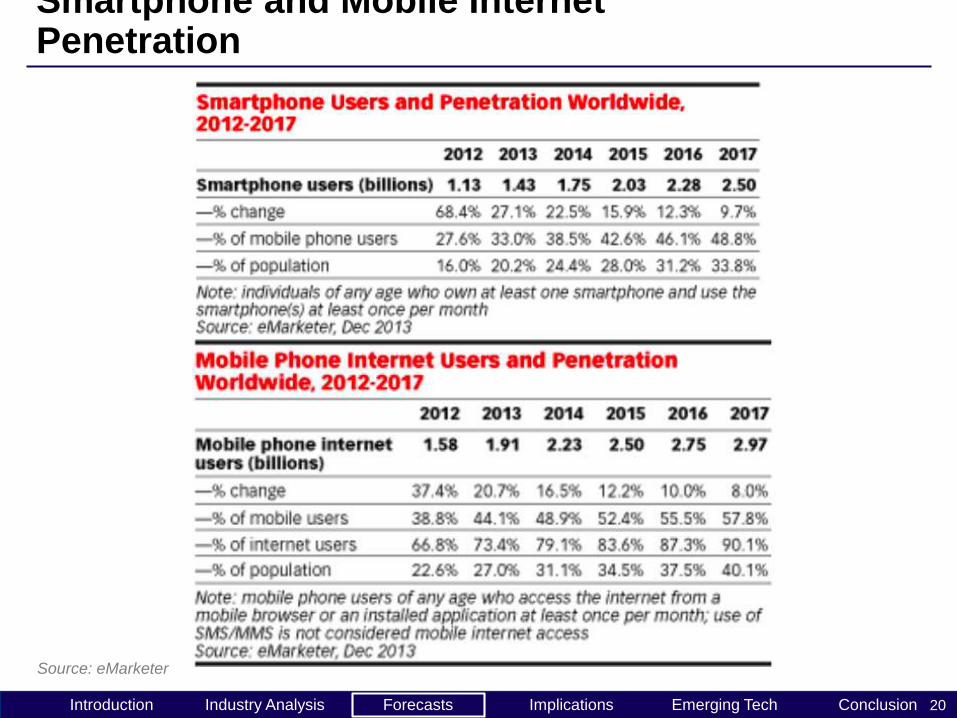
Smartphone and Mobile Internet Penetration
Source: eMarketer

Introduction Forecasts Implications ConclusionIndustry Analysis Emerging Tech 21
Time Spent on Internet
Source: Wearesocial

Introduction Forecasts Implications ConclusionIndustry Analysis Emerging Tech 22
Global Adspend
Source: Nielsen

Introduction Forecasts Implications ConclusionIndustry Analysis Emerging Tech 23
New technologies to make shopping more convenient
Source: Deloitte

Introduction Forecasts Implications ConclusionIndustry Analysis Emerging Tech 24
New technologies to make shopping more convenient
Source: Financial Times
Integration with various social
media and touchpoints

Introduction Forecasts Implications ConclusionIndustry Analysis Emerging Tech 25
New technologies to make shopping more convenient
Source: H&M
Augmented reality and virtual
fitting rooms

Introduction Forecasts Implications ConclusionIndustry Analysis Emerging Tech 26
New technologies to make shopping more convenient
Source: Amazon
2 day shipping? How about
30 minutes with drones?

Introduction Forecasts Implications ConclusionIndustry Analysis Emerging Tech 27
E-commerce Industry Forecast
Source: Euromonitor
2013 2014 2015 2016 2017 2018
World (Offline) 13,277,934.3 14,030,864.7 14,904,524.0 15,881,874.8 16,950,398.6 18,129,175.3
World (Online) 638,231.0 757,761.0 890,131.1 1,035,403.4 1,187,387.9 1,346,180.9
World Growth (Offline) 5% 6% 6% 7% 7% 7%
World Growth (Online) 17% 19% 17% 16% 15% 13%
0%
2%
4%
6%
8%
10%
12%
14%
16%
18%
20%
0
5,000,000
10,000,000
15,000,000
20,000,000
25,000,000R
eta
il Sa
les
US$
mn

Introduction Forecasts Implications ConclusionIndustry Analysis Emerging Tech
Implications
28

Introduction Forecasts Implications ConclusionIndustry Analysis Emerging Tech 29
Logistics and Delivery Services
Source: JONES LANG LASALLE IP

Introduction Forecasts Implications ConclusionIndustry Analysis Emerging Tech 30
E-commerce Software Platforms

Introduction Forecasts Implications ConclusionIndustry Analysis Emerging Tech 31
Advertising and Digital Marketing
Source: Singpost

Introduction Forecasts Implications ConclusionIndustry Analysis Emerging Tech 32
Payment Services
Introduction Forecasts Implications ConclusionIndustry Analysis Emerging Tech
Emerging Technology
33

Introduction Forecasts Implications ConclusionIndustry Analysis Emerging Tech 34
Other Emerging Commerce
M-Commerce

Introduction Forecasts Implications ConclusionIndustry Analysis Emerging Tech 35
Other Emerging Commerce
T-Commerce

Introduction Forecasts Implications ConclusionIndustry Analysis Emerging Tech 36
Other Emerging Commerce
Source: Google

Introduction Forecasts Implications ConclusionIndustry Analysis Emerging Tech
Conclusion
37

Introduction Forecasts Implications ConclusionIndustry Analysis Emerging Tech 38
Conclusion (Bringing back to Singapore)
Source: Euromonitor
Some Trends
• Pure internet retailers performed better than “bricks and clicks”. In addition, new dominant players such as Zalora Singapore and Qoo10 Singapore are also pure internet retailers.
• Local retailers trying to innovate. EgNoel and local supermarkets NTUC FairPrice and Cold Storage have e-commerce platforms, with Sheng Siong coming up soon.
• Dominant segments are Apparels and Beauty Care with Furnishing being the obvious laggard. However, IKEA launch an augmented reality platform to help make sales.
• More active use of Social Media such as Instagram to help improve brand awareness of smaller players.
S$ Mn 2012 20132013-18
CAGR
Beauty and Personal Care 14.5 16.8 21%
Apparel and Footwear 252.1 267.6 10%
Consumer Electronics 103.2 110.9 1%
Consumer Healthcare 17.3 19.1 16%
Consumer Applicances 2.9 3.6 0%
House Care 1 1 6%
Home Improvement and
Gardening1.9 2.1 4%
Housewares and Home
Furnishings 0.3 0.3 5%
Media Products 45.7 50.7 9%
Food and Drink 59.8 63.9 2%
Traditional Toys and
Games3.3 3.9 11%
Other Internet Retailing 353.5 420.4 15%
Internet Retailing 855.4 960.3 11%