the future of chemical and pharmaceutical production in ... · >> perspectives_2012 the...
TRANSCRIPT
>> PERSPECTIVES_2012 THE FUTURE OF CHEMICAL AND PHARMACEUTICAL PRODUCTION IN GERMANY CMF JUNE 19, 2012 – FACILITATED BY DR. MICHAEL REUBOLD, CHEMANAGER

>> A BUSINESS PERSPECTIVE. THE FUTURE OF VALUE CREATION IN THE GERMAN CHEMICAL & PHARMACEUTICAL INDUSTRY
Dr. Udo Jung The Boston Consulting Group ACHEMA PERSPECTIVES 2012

The future of value creation in the German chemical and pharmaceutical industry
Frankfurt , June 19, 2012 Dr. Udo Jung
145420-34-18-AchemaPräsentation-June18-JF-FRA-RBHS.pptx 3
Cop
yrig
ht ©
201
1 by
The
Bos
ton
Con
sulti
ng G
roup
, Inc
. All
right
s re
serv
ed.
Draft—for discussion only
40
30
20
10
0 1 year
32
30%
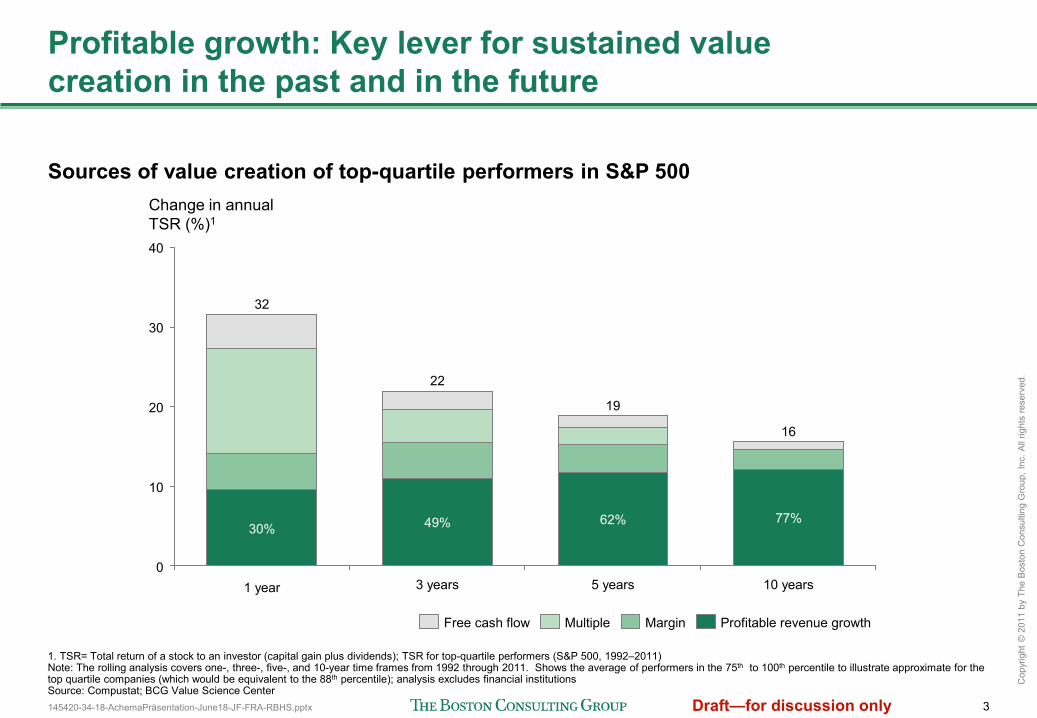
Change in annual TSR (%)1
Profitable growth: Key lever for sustained value creation in the past and in the future
Sources of value creation of top-quartile performers in S&P 500
Profitable revenue growth Margin Multiple Free cash flow
1. TSR= Total return of a stock to an investor (capital gain plus dividends); TSR for top-quartile performers (S&P 500, 1992–2011) Note: The rolling analysis covers one-, three-, five-, and 10-year time frames from 1992 through 2011. Shows the average of performers in the 75th to 100th percentile to illustrate approximate for the top quartile companies (which would be equivalent to the 88th percentile); analysis excludes financial institutions Source: Compustat; BCG Value Science Center
10 years
16
5 years
19
3 years
22
77% 62% 49%
145420-34-18-AchemaPräsentation-June18-JF-FRA-RBHS.pptx 4
Cop
yrig
ht ©
201
1 by
The
Bos
ton
Con
sulti
ng G
roup
, Inc
. All
right
s re
serv
ed.
Draft—for discussion only
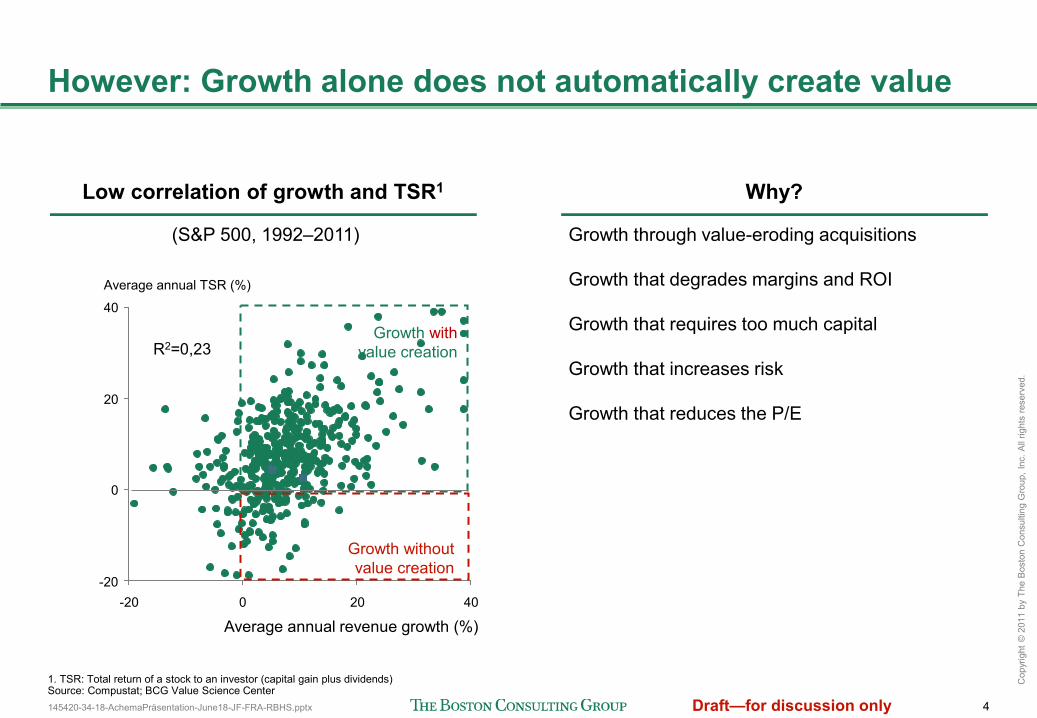
However: Growth alone does not automatically create value
Low correlation of growth and TSR1
(S&P 500, 1992–2011)
Why?
Growth through value-eroding acquisitions Growth that degrades margins and ROI Growth that requires too much capital Growth that increases risk Growth that reduces the P/E
Average annual TSR (%)
40
20
0
-20
Average annual revenue growth (%) 40 20 0 -20
Growth without value creation
Growth with value creation R2=0,23
1. TSR: Total return of a stock to an investor (capital gain plus dividends) Source: Compustat; BCG Value Science Center

145420-34-18-AchemaPräsentation-June18-JF-FRA-RBHS.pptx 5
Cop
yrig
ht ©
201
1 by
The
Bos
ton
Con
sulti
ng G
roup
, Inc
. All
right
s re
serv
ed.
Draft—for discussion only
Note: GDP as $ in Purchasing Power Parity (PPP) Source: EIU; BCG analysis
Capturing profitable growth in Asia drives business model changes of German chemical and pharmaceutical companies
3.1
Rest of
Latam
3.4
World
3.5
Russia
3.7
Middle East
3.9
C.E. Europe
4.0
China
2010–2025, GDP growth (%) 6
4
2
0
Japan
2.0
EU-15
2.4
USA
2.8
Brazil
4.6
Rest of
Asia
5.2
India
5.5
Middle East
2.7
Rest of
Latam
2.0
EU-15
5.4
USA
9.3
0 World
4.6
RoW
2.9
Brazil
1.2
C.E. Europe
1.3
Japan
Russia
1.6 1.4
7.7
China
7.8
India
2010–2025, GDP growth (Trillion US$) 50 47.9
40
20
10
30
Rest of
Asia
World GDP (K US$)
2010 70.6
2025 118.5 3.5%
x% CAGR
Asia
We are in a two speed world: Asia expected to contribute 45% of global GDP growth until 2025
Asian economies growth compensate for OECD countries underperformance
Asia (ex-Japan) accounts for 45% of overall GDP growth until 2025

145420-34-18-AchemaPräsentation-June18-JF-FRA-RBHS.pptx 6
Cop
yrig
ht ©
201
1 by
The
Bos
ton
Con
sulti
ng G
roup
, Inc
. All
right
s re
serv
ed.
Draft—for discussion only
16%
55%
6%
2010
Asia Pacific
Western Europe North America South America Rest of World
17%
6% 7%
2030
5% 19%
21%
49%
More than 60% of the total global demand growth in chemicals until 2030 contributed by Asia Pacific
Source: CEFIC Fact and Figures 2011; various analyst reports; company presentations; BCG analysis
+1,310
+224
+305
+132
+180
9% Rest of World
6% South America
14% North America
10% Western Europe
61% Asia Pacific
+2,151
Global chemical demand (€B) 2,353
4,504
Annual growth rate
4.1%
1.9%
2.6%
3.6% 4.4%
3.3%
Growth contribution
Backup
145420-34-18-AchemaPräsentation-June18-JF-FRA-RBHS.pptx 7
Cop
yrig
ht ©
201
1 by
The
Bos
ton
Con
sulti
ng G
roup
, Inc
. All
right
s re
serv
ed.
Draft—for discussion only
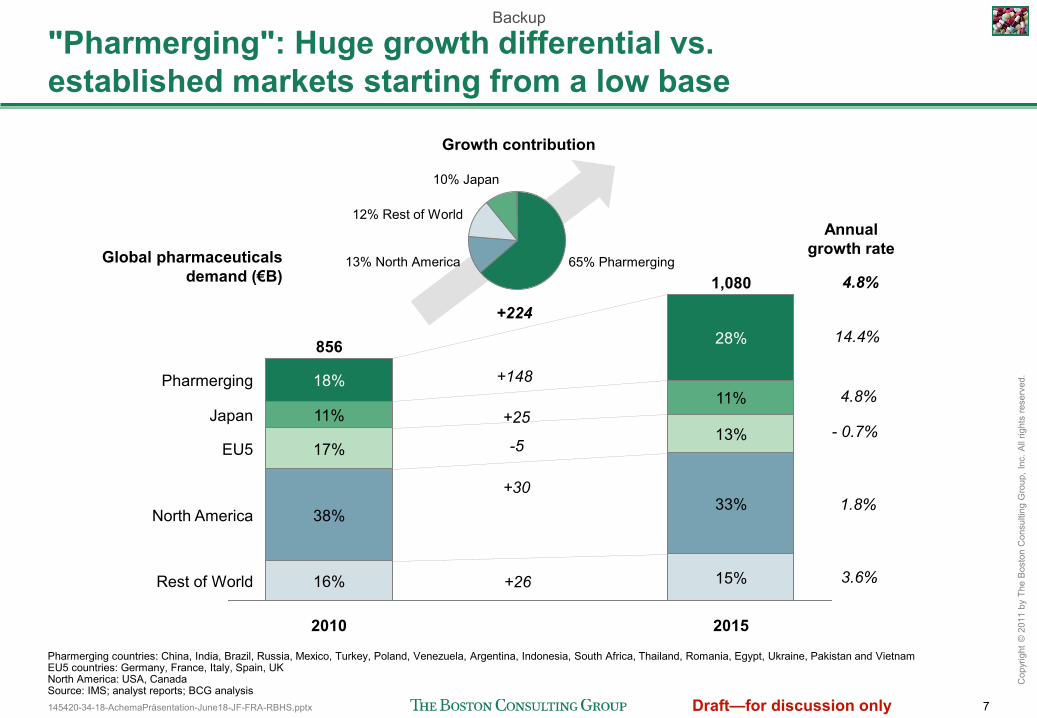
Rest of World
North America
EU5
Japan
Pharmerging
2015
1,080
15%
33%
13%
11%
28%
2010
856
16%
38%
17%
11%
18%
"Pharmerging": Huge growth differential vs. established markets starting from a low base
Pharmerging countries: China, India, Brazil, Russia, Mexico, Turkey, Poland, Venezuela, Argentina, Indonesia, South Africa, Thailand, Romania, Egypt, Ukraine, Pakistan and Vietnam EU5 countries: Germany, France, Italy, Spain, UK North America: USA, Canada Source: IMS; analyst reports; BCG analysis
+148
+25
-5
+30
+26
12% Rest of World
10% Japan
13% North America 65% Pharmerging
+224
Global pharmaceuticals demand (€B)
Annual growth rate
14.4%
4.8%
- 0.7%
1.8%
3.6%
4.8%
Growth contribution
Backup
145420-34-18-AchemaPräsentation-June18-JF-FRA-RBHS.pptx 8
Cop
yrig
ht ©
201
1 by
The
Bos
ton
Con
sulti
ng G
roup
, Inc
. All
right
s re
serv
ed.
Draft—for discussion only
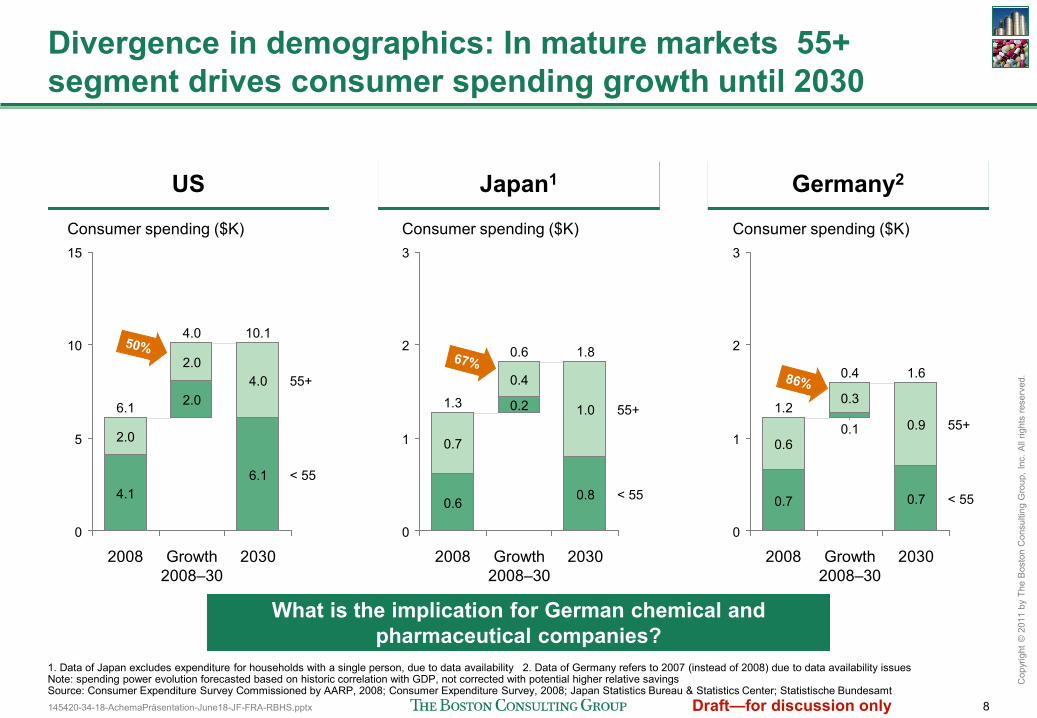
Divergence in demographics: In mature markets 55+ segment drives consumer spending growth until 2030
1. Data of Japan excludes expenditure for households with a single person, due to data availability 2. Data of Germany refers to 2007 (instead of 2008) due to data availability issues Note: spending power evolution forecasted based on historic correlation with GDP, not corrected with potential higher relative savings Source: Consumer Expenditure Survey Commissioned by AARP, 2008; Consumer Expenditure Survey, 2008; Japan Statistics Bureau & Statistics Center; Statistische Bundesamt
US Japan1 Germany2
2030
10.1
6.1
4.0
Growth 2008–30
4.0
2.0
2.0
2008
6.1
4.1
2.0
Consumer spending ($K) 15
10
5
0
< 55
55+
Consumer spending ($K) 3
2
1
0
< 55
55+
2030
1.8
0.8
1.0
Growth 2008–30
0.6
0.2
0.4
2008
1.3
0.6
0.7 0.1
0.3
2008
1.2
0.7
0.6
Growth 2008–30
0.4
2
1
0
< 55
55+
2030
1.6
0.7
0.9
3
Consumer spending ($K)
What is the implication for German chemical and pharmaceutical companies?
145420-34-18-AchemaPräsentation-June18-JF-FRA-RBHS.pptx 9
Cop
yrig
ht ©
201
1 by
The
Bos
ton
Con
sulti
ng G
roup
, Inc
. All
right
s re
serv
ed.
Draft—for discussion only
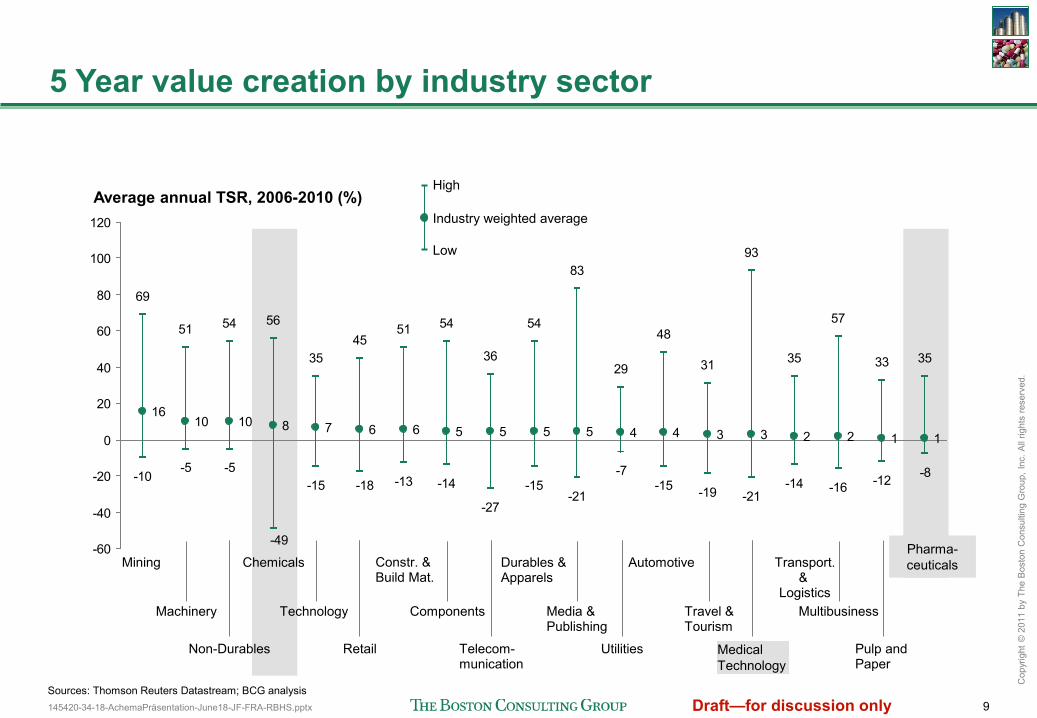
5 Year value creation by industry sector
69
51 54 56
3545
51 54
36
54
83
29
48
31
93
35
57
33 35
1610 10 8 7 6 6 5 5 5 5 4 4 3 3 2 2 1 1
-10-5 -5
-15 -13 -14
-27
-15-21
-7-15 -19 -21
-14 -16 -12 -8-18
-49-60
-40
-20
0
20
40
60
80
100
120
Average annual TSR, 2006-2010 (%) High
Low
Industry weighted average
Chemicals
Machinery
Non-Durables
Mining
Media & Publishing
Travel & Tourism
Pharma- ceuticals
Telecom- munication
Utilities Retail Pulp and Paper
Multibusiness
Automotive
Sources: Thomson Reuters Datastream; BCG analysis
Technology Components
Durables & Apparels
Medical Technology
Transport. &
Logistics
Constr. & Build Mat.
145420-34-18-AchemaPräsentation-June18-JF-FRA-RBHS.pptx 11
Cop
yrig
ht ©
201
1 by
The
Bos
ton
Con
sulti
ng G
roup
, Inc
. All
right
s re
serv
ed.
Draft—for discussion only
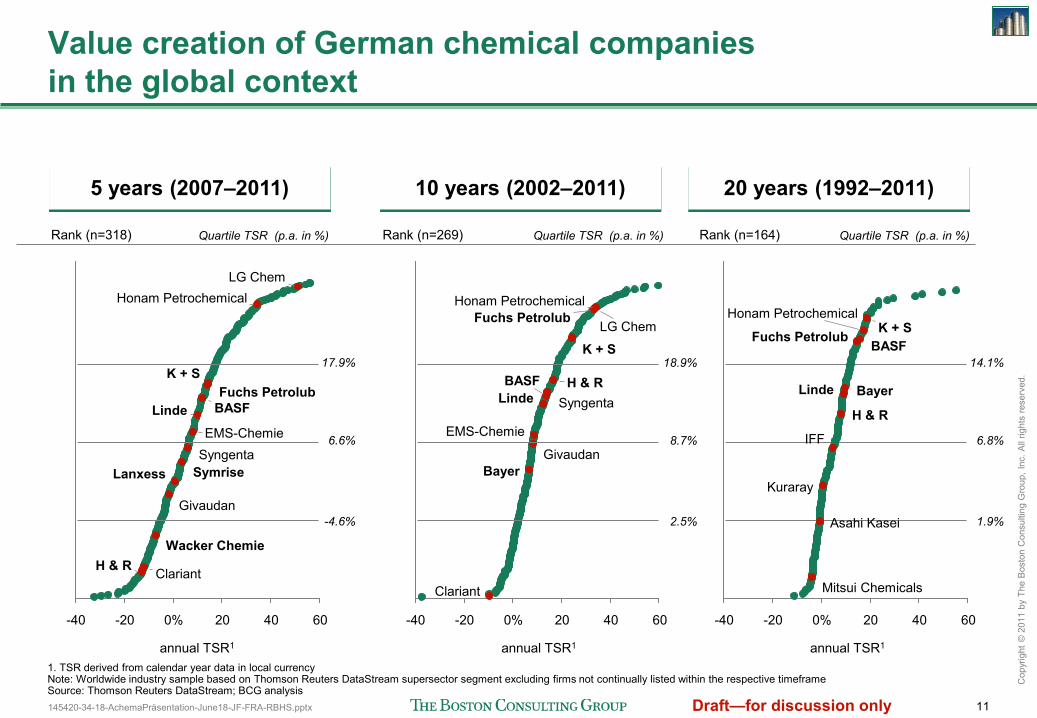
annual TSR1
Rank (n=164) Quartile TSR (p.a. in %)
20 years (1992–2011)
Rank (n=318)
annual TSR1
5 years (2006–2010)
Quartile TSR (p.a. in %)
5 years (2007–2011)
annual TSR1
Rank (n=269)
10 years (2002–2011)
Quartile TSR (p.a. in %)
Fuchs Petrolub K + S
Honam Petrochemical LG Chem
60 40 20 0% -20 -40
H & R Clariant
Wacker Chemie
Givaudan
Lanxess Symrise Syngenta EMS-Chemie
Linde BASF
-40
Clariant
Bayer Givaudan
EMS-Chemie
60 40 20 0% -20
Linde BASF
Syngenta H & R
K + S
Fuchs Petrolub LG Chem
Honam Petrochemical
1. TSR derived from calendar year data in local currency Note: Worldwide industry sample based on Thomson Reuters DataStream supersector segment excluding firms not continually listed within the respective timeframe Source: Thomson Reuters DataStream; BCG analysis
Value creation of German chemical companies in the global context
17.9%
6.6%
-4.6%
18.9%
8.7%
2.5%
14.1%
6.8%
1.9%
60 40 20 0% -20 -40
Mitsui Chemicals
Asahi Kasei
Kuraray
IFF
H & R
Linde Bayer
Fuchs Petrolub BASF
Honam Petrochemical K + S

145420-34-18-AchemaPräsentation-June18-JF-FRA-RBHS.pptx 13
Cop
yrig
ht ©
201
1 by
The
Bos
ton
Con
sulti
ng G
roup
, Inc
. All
right
s re
serv
ed.
Draft—for discussion only
Observations in value creation patterns in the global chemical industry in the past 5 years
Observation
• Overall Asian chemical companies lead in value creation—especially in base chemicals
• Agro related chemical businesses with superior value creation
• Japan with specific challenges in value creation
• German & European chemical companies with a good track record in diversified and specialty chemicals business models—driven by the ability to manage differentiated business models
1
2
3
4

145420-34-18-AchemaPräsentation-June18-JF-FRA-RBHS.pptx 14
Cop
yrig
ht ©
201
1 by
The
Bos
ton
Con
sulti
ng G
roup
, Inc
. All
right
s re
serv
ed.
Draft—for discussion only
Global energy and geopolitical trends create challenges for the European and German based chemical industry
Feedstock advantaged countries will continue investing in a scenario of lower gas prices vs. higher naphtha prices
• No great expectations for cheap unconventional gas in Europe • Shale gas revolution in the US reduces European competitiveness in Chemicals
Countries will growing Chemicals demand and advantaged feedstock will increasingly drive their own economic development agenda, which includes localization of chemicals supply sources
• Increase value added to local economies • Reduce imports and increase self sustainability
For specialty chemicals customer proximity (in emerging markets) provides competitive advantage, thus favoring new capacity in demand centers—successful European chemical companies will have to "localize" their global business models Regulatory pressure on the chemical and adjacent sectors (e.g., power) will lead to increased costs in Europe and a potential reduction of European industry competitiveness Larger and integrated new "megasites" in the Middle East and in Asia copy successful European examples Are there unique advantages for European based value add
in production, innovation and business management?
1
2
3
4
5
145420-34-18-AchemaPräsentation-June18-JF-FRA-RBHS.pptx 16
Cop
yrig
ht ©
201
1 by
The
Bos
ton
Con
sulti
ng G
roup
, Inc
. All
right
s re
serv
ed.
Draft—for discussion only
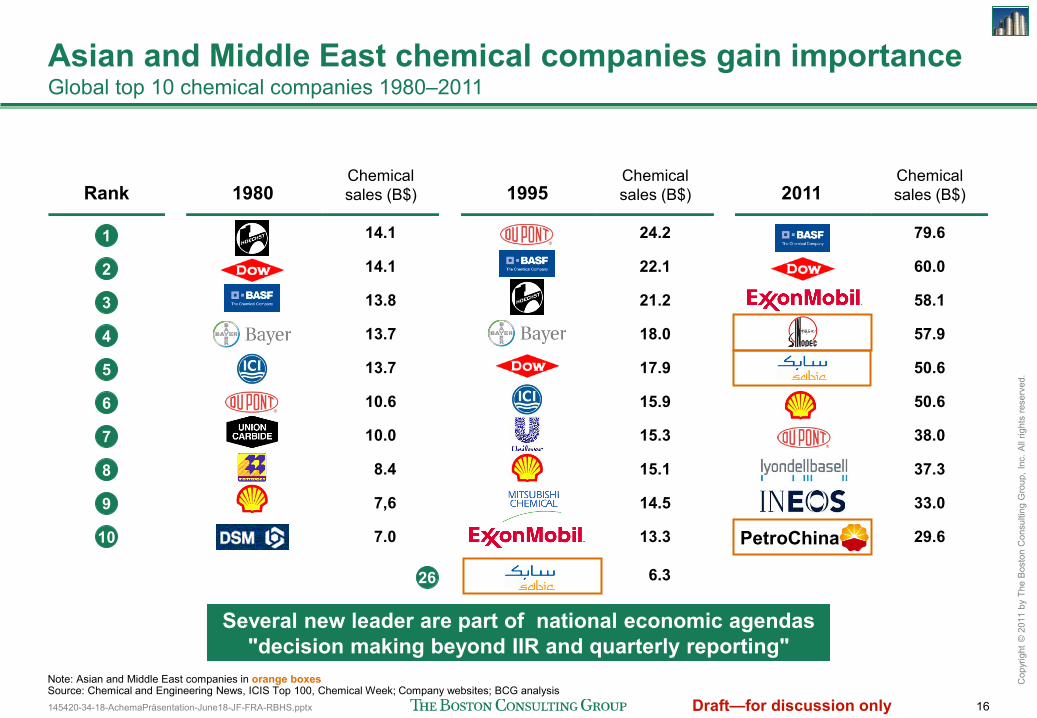
Asian and Middle East chemical companies gain importance Global top 10 chemical companies 1980–2011
Note: Asian and Middle East companies in orange boxes Source: Chemical and Engineering News, ICIS Top 100, Chemical Week; Company websites; BCG analysis
Several new leader are part of national economic agendas "decision making beyond IIR and quarterly reporting"
Rank 1980 Chemical sales (B$) 1995
Chemical sales (B$) 2011
Chemical sales (B$)
79.6
60.0
58.1
57.9
50.6
50.6
38.0
37.3
33.0
29.6
14.1
14.1
13.8
13.7
13.7
10.6
10.0
8.4
7,6
7.0
24.2
22.1
21.2
18.0
17.9
15.9
15.3
15.1
14.5
13.3
6.3
PetroChina
1
2
3
4
5
6
7
8
9
10
26
145420-34-18-AchemaPräsentation-June18-JF-FRA-RBHS.pptx 18
Cop
yrig
ht ©
201
1 by
The
Bos
ton
Con
sulti
ng G
roup
, Inc
. All
right
s re
serv
ed.
Draft—for discussion only
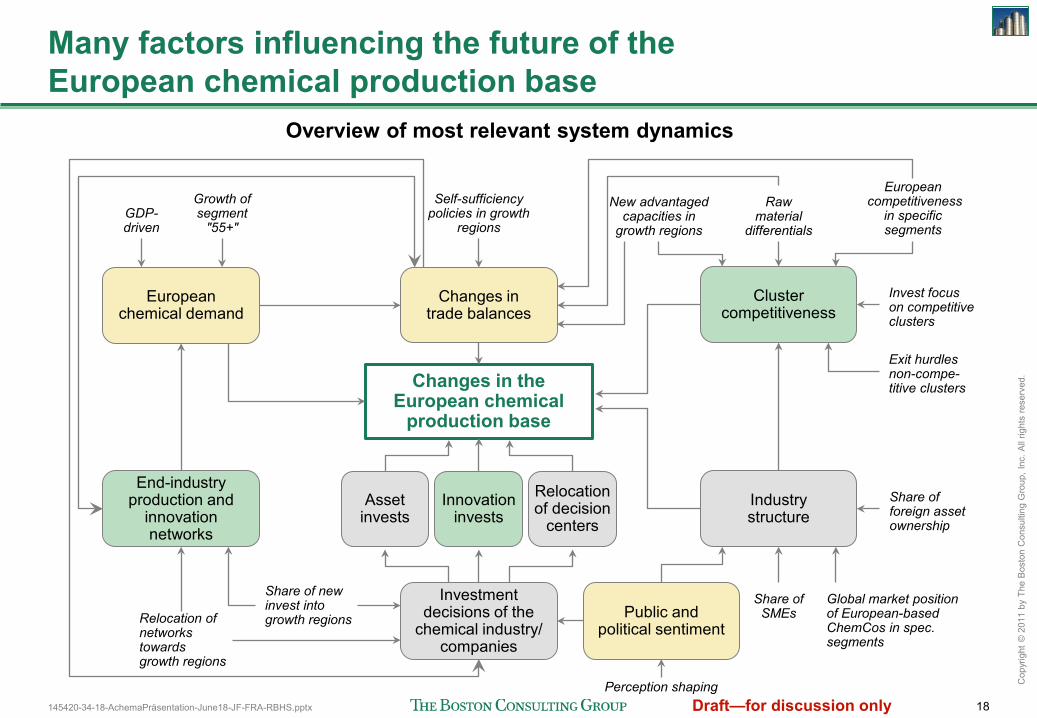
Many factors influencing the future of the European chemical production base
Overview of most relevant system dynamics
Changes in the European chemical
production base
Asset invests
Innovation invests
Relocation of decision
centers
Investment decisions of the
chemical industry/ companies
Public and political sentiment
Industry structure
End-industry production and
innovation networks
Relocation of networks towards growth regions
Share of new invest into growth regions
European chemical demand
GDP- driven
Growth of segment
"55+"
Self-sufficiency policies in growth
regions
Perception shaping
Share of SMEs
Global market position of European-based ChemCos in spec. segments
Share of foreign asset ownership
Cluster competitiveness
New advantaged capacities in
growth regions
Raw material
differentials
European competitiveness
in specific segments
Invest focus on competitive clusters
Exit hurdles non-compe-titive clusters
Changes in trade balances

145420-34-18-AchemaPräsentation-June18-JF-FRA-RBHS.pptx 19
Cop
yrig
ht ©
201
1 by
The
Bos
ton
Con
sulti
ng G
roup
, Inc
. All
right
s re
serv
ed.
Draft—for discussion only
European Advantage (I): The competiveness of chemical sites and clusters in Europe will become even more decisive
Large
Small to medium size Region
Rheinland-Pfalz (Mainz), DE
Düsseldorf, DE
Vlaams Gewest (Antwerpen), BE
Rhône-Alpes (Lyon), FR
Istanbul, TR
Darmstadt (Frankfurt am Main), DE
Köln, DE
Ege (izmir), TR
Münster, DE
Cheshire (Chester), UK
Nordwestschweiz (Basel), CH
Size (employees)
40,075
25,284
21,937
20,361
18,133
16,250
15,928
10,587
9,590
9,108
8,549
Source: The role of clusters in the chemical industry; BCG analysis
Value added provided by industrial parks and industry cluster • Better access to raw materials
(for chemical industries) • Easier movement of final outputs as
inputs to other downstream sectors • Reduction in energy footprint and
increased efficiency • Common investment in required
infrastructures (rail, ports, pipe- lines, …) reduce investment requirements and minimizes environmental footprint
• Opportunities to coordinate and cooperate in key fields (distribution, R&D, purchasing, …)
• Option to leverage larger scale projects though associations
• .......
A unique "German advantage": cross-industry production, innovation and supply chain clusters—driven by the "Mittelstand champions"
145420-34-18-AchemaPräsentation-June18-JF-FRA-RBHS.pptx 20
Cop
yrig
ht ©
201
1 by
The
Bos
ton
Con
sulti
ng G
roup
, Inc
. All
right
s re
serv
ed.
Draft—for discussion only
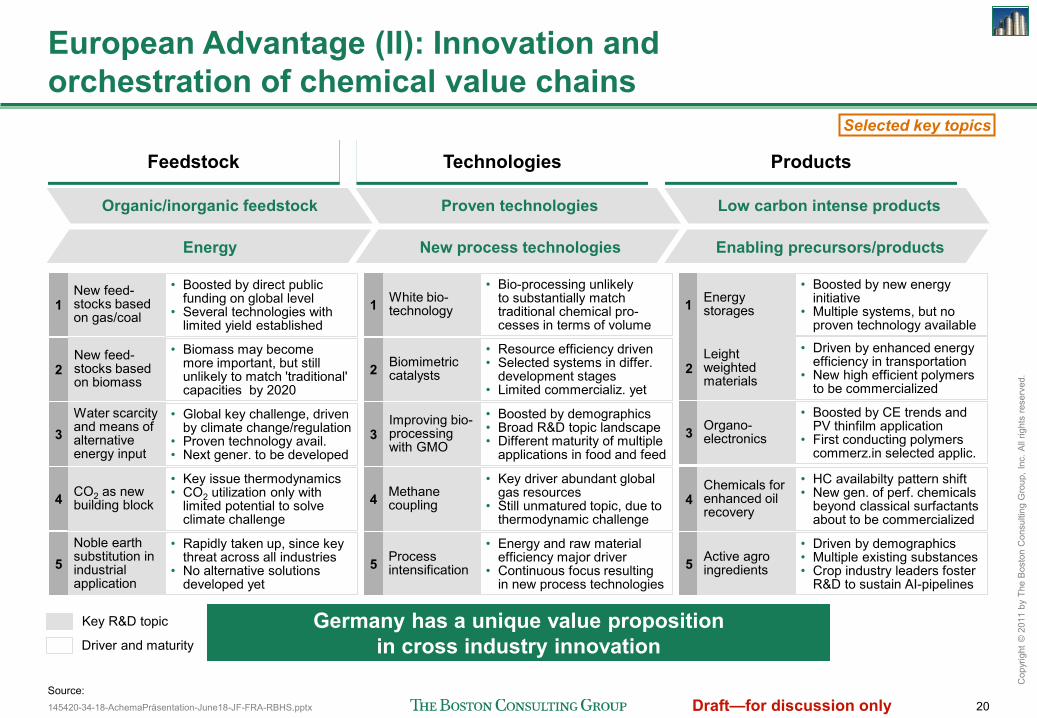
CO2 as new building block
Noble earth substitution in industrial application
• Key issue thermodynamics • CO2 utilization only with
limited potential to solve climate challenge
• Rapidly taken up, since key threat across all industries
• No alternative solutions developed yet
New feed-stocks based on biomass
New feed- stocks based on gas/coal
• Biomass may become more important, but still unlikely to match 'traditional' capacities by 2020
• Boosted by direct public funding on global level
• Several technologies with limited yield established
Water scarcity and means of alternative energy input
• Global key challenge, driven by climate change/regulation
• Proven technology avail. • Next gener. to be developed
Process intensification
Methane coupling
• Energy and raw material efficiency major driver
• Continuous focus resulting in new process technologies
• Key driver abundant global gas resources
• Still unmatured topic, due to thermodynamic challenge
3
• Bio-processing unlikely to substantially match traditional chemical pro-cesses in terms of volume
• Resource efficiency driven • Selected systems in differ.
development stages • Limited commercializ. yet
1
2
5
4
• Boosted by demographics • Broad R&D topic landscape • Different maturity of multiple
applications in food and feed
• Driven by demographics • Multiple existing substances • Crop industry leaders foster
R&D to sustain AI-pipelines
• HC availabilty pattern shift • New gen. of perf. chemicals
beyond classical surfactants about to be commercialized
3
• Boosted by new energy initiative
• Multiple systems, but no proven technology available
• Driven by enhanced energy efficiency in transportation
• New high efficient polymers to be commercialized
1
2
5
4
• Boosted by CE trends and PV thinfilm application
• First conducting polymers commerz.in selected applic.
White bio-technology
Improving bio-processing with GMO
Biomimetric catalysts
Organo-electronics
Leight weighted materials
Active agro ingredients
Chemicals for enhanced oil recovery
Source:
Energy storages
European Advantage (II): Innovation and orchestration of chemical value chains
Products Feedstock
Chemical reactions Energy efficiency
Organic/inorganic feedstock
Energy Energy efficiency
Low carbon intense products
Enabling precursors/products Energy efficiency
Proven technologies
New process technologies
Technologies
3
1
2
5
4
Selected key topics
Key R&D topic
Driver and maturity Germany has a unique value proposition
in cross industry innovation
145420-34-18-AchemaPräsentation-June18-JF-FRA-RBHS.pptx 21
Cop
yrig
ht ©
201
1 by
The
Bos
ton
Con
sulti
ng G
roup
, Inc
. All
right
s re
serv
ed.
Draft—for discussion only
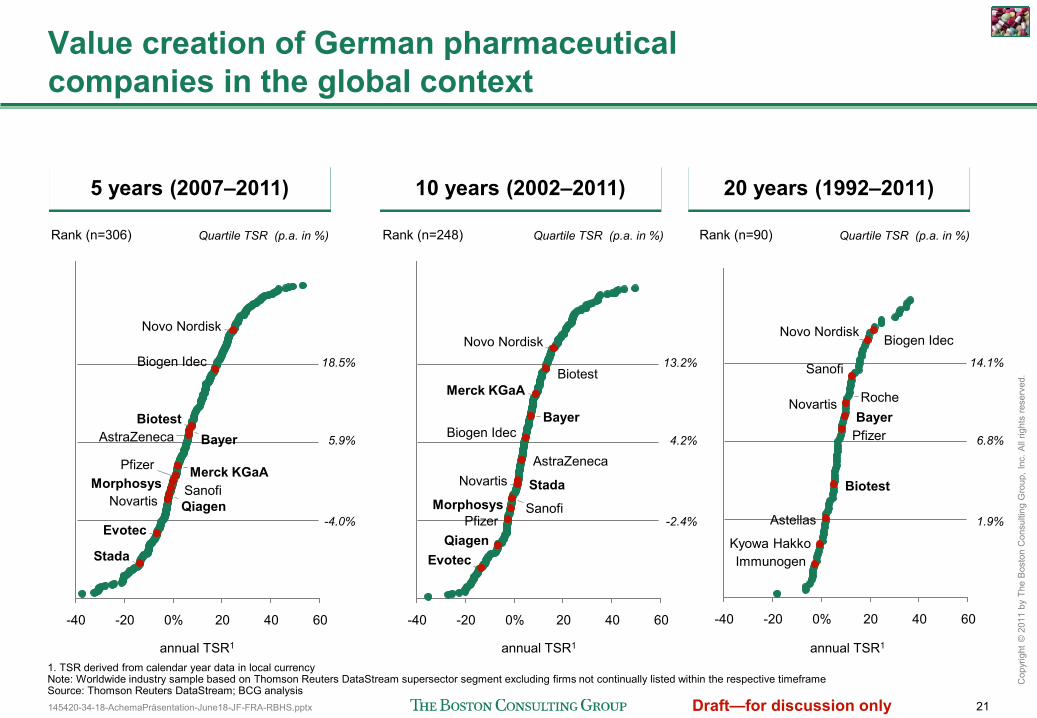
60 40 20 0% -20 -40
Immunogen Kyowa Hakko
Astellas
Biotest
Pfizer Bayer
Novartis Roche
Sanofi
Novo Nordisk Biogen Idec
60 40 20 0% -20 -40
Evotec Qiagen
Pfizer Morphosys Sanofi
Novartis Stada
AstraZeneca
Biogen Idec Bayer
Merck KGaA Biotest
Novo Nordisk
60 40 20 0% -20 -40
Stada
Evotec
Novartis Qiagen Morphosys Sanofi
Pfizer Merck KGaA
AstraZeneca Bayer Biotest
Biogen Idec
Novo Nordisk
Value creation of German pharmaceutical companies in the global context
annual TSR1
Rank (n=90) Quartile TSR (p.a. in %)
20 years (1992–2011)
Rank (n=306)
annual TSR1
5 years (2006–2010)
Quartile TSR (p.a. in %)
5 years (2007–2011)
annual TSR1
Rank (n=248)
10 years (2002–2011)
Quartile TSR (p.a. in %)
1. TSR derived from calendar year data in local currency Note: Worldwide industry sample based on Thomson Reuters DataStream supersector segment excluding firms not continually listed within the respective timeframe Source: Thomson Reuters DataStream; BCG analysis
18.5%
5.9%
-4.0%
13.2%
4.2%
-2.4%
14.1%
6.8%
1.9%
145420-34-18-AchemaPräsentation-June18-JF-FRA-RBHS.pptx 23
Cop
yrig
ht ©
201
1 by
The
Bos
ton
Con
sulti
ng G
roup
, Inc
. All
right
s re
serv
ed.
Draft—for discussion only
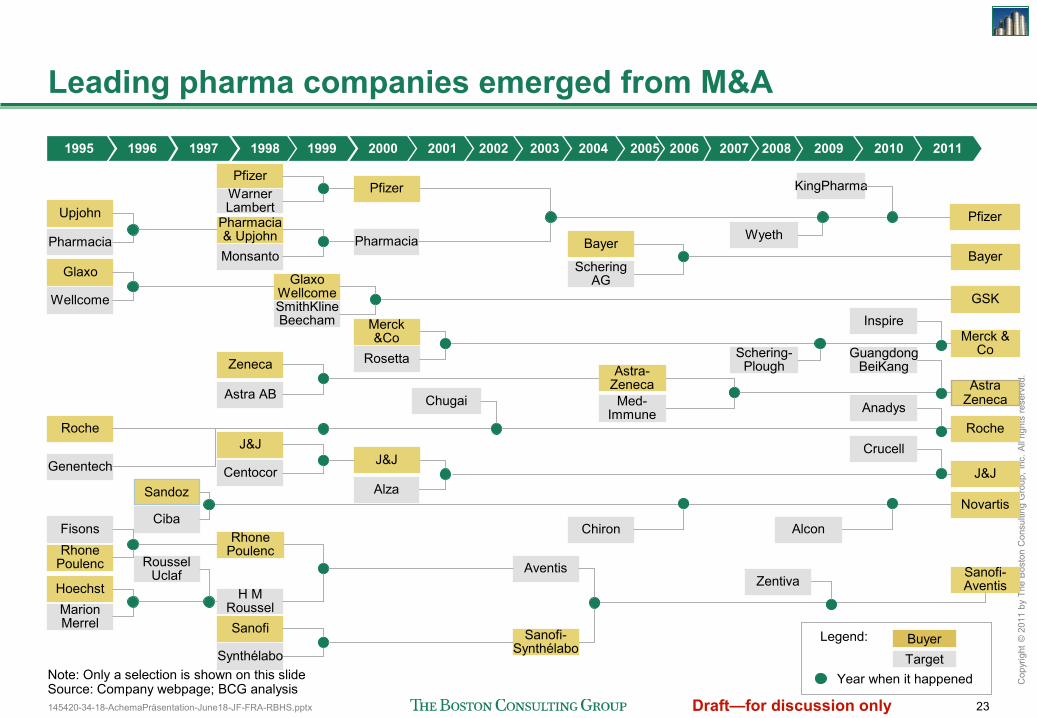
Leading pharma companies emerged from M&A
Note: Only a selection is shown on this slide Source: Company webpage; BCG analysis
Legend:
Target Buyer
Year when it happened
GSK
Merck & Co
Novartis Sandoz
Ciba
Glaxo
Wellcome
Marion Merrel
Hoechst
Roussel Uclaf
Fisons Rhone
Poulenc
Upjohn
Pharmacia
Pfizer
J&J
Sanofi-Aventis
Bayer
Roche Roche
Genentech
Pfizer
J&J
Aventis
Pfizer Warner Lambert
Glaxo Wellcome SmithKline Beecham
Zeneca
Astra AB
J&J
Centocor
Rhone Poulenc
H M Roussel
Merck &Co
Rosetta
Pharmacia Pharmacia & Upjohn Monsanto
Alza
Sanofi
Synthélabo Sanofi-
Synthélabo
Astra-Zeneca Med-
Immune
Bayer
Schering AG
Chugai
Chiron
Astra Zeneca
Wyeth
Schering-Plough
1995 1996 1997 2005 2006 2007 2008 2009 1998 1999 2000 2001 2002 2003 2004 2010 2011
KingPharma
Inspire
Guangdong BeiKang
Anadys
Crucell
Alcon
Zentiva
145420-34-18-AchemaPräsentation-June18-JF-FRA-RBHS.pptx 24
Cop
yrig
ht ©
201
1 by
The
Bos
ton
Con
sulti
ng G
roup
, Inc
. All
right
s re
serv
ed.
Draft—for discussion only
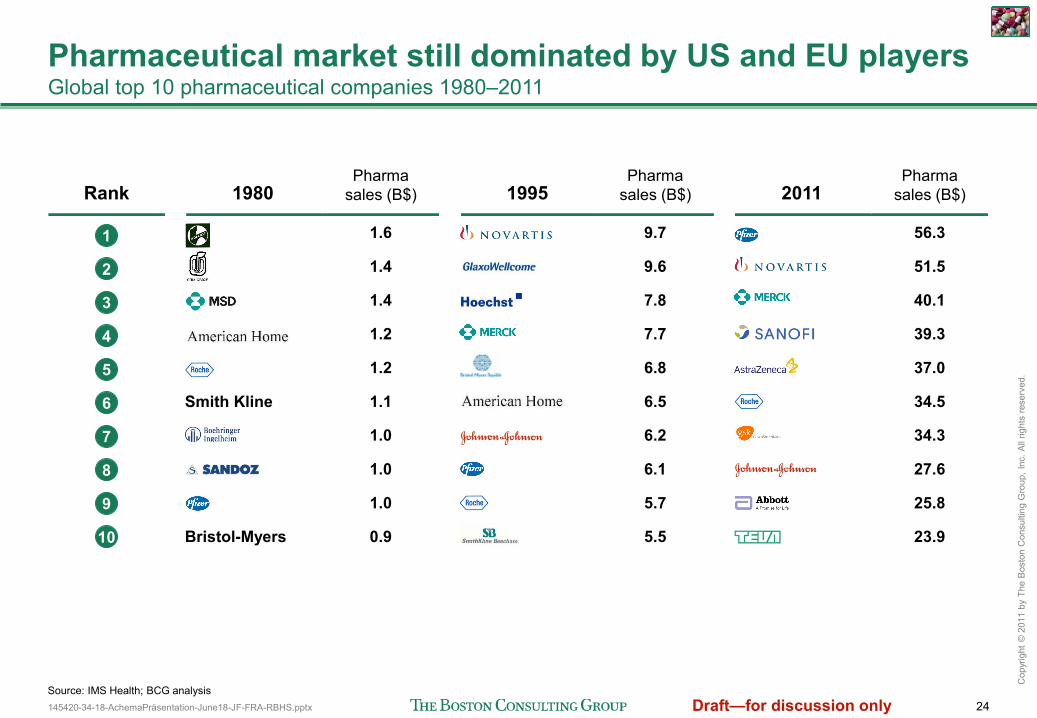
Pharmaceutical market still dominated by US and EU players Global top 10 pharmaceutical companies 1980–2011
Source: IMS Health; BCG analysis
Rank 1980 Pharma
sales (B$) 1995 Pharma
sales (B$) 2011 Pharma
sales (B$)
56.3
51.5
40.1
39.3
37.0
34.5
34.3
27.6
25.8
23.9
1.6
1.4
1.4
1.2
1.2
1.1
1.0
1.0
1.0
0.9
9.7
9.6
7.8
7.7
6.8
6.5
6.2
6.1
5.7
5.5
1
2
3
4
5
6
7
8
9
10
Smith Kline
Bristol-Myers

145420-34-18-AchemaPräsentation-June18-JF-FRA-RBHS.pptx 25
Cop
yrig
ht ©
201
1 by
The
Bos
ton
Con
sulti
ng G
roup
, Inc
. All
right
s re
serv
ed.
Draft—for discussion only
The future of value creation in the German chemical and pharmaceutical industry
Obviously the global context matters • 2-speed global economy, the rise of state owned enterprises in chemicals, self-sustainability
agenda in pharma and in chemicals in many growth regions Company perspective • To grow profitably and to create value European and German based chemical and
pharmaceutical companies will continue to globalize their business models—and invest in "localization" in the growth regions (production, R&D, decision center relocation)
Location perspective • European chemical and pharmaceutical company have proven their ability to create value with
differentiated and diverse business model (management of complexity) • The attractiveness of Europe and Germany as a location for innovation and production is
driven by the "integrated attractiveness" (infrastructure, logistics, resource efficiency) of sites and clusters
• Cross-industry innovation and production cluster are largely a unique German advantage driven by the unmatched density of "Mittelstand-champions"