the future for zero emissions transport
TRANSCRIPT

The Future for Zero Emissions TransportWinton Symposium - November 2017
Prof. David Greenwood
Advanced Propulsion Systems
WMG, The University of Warwick [email protected]
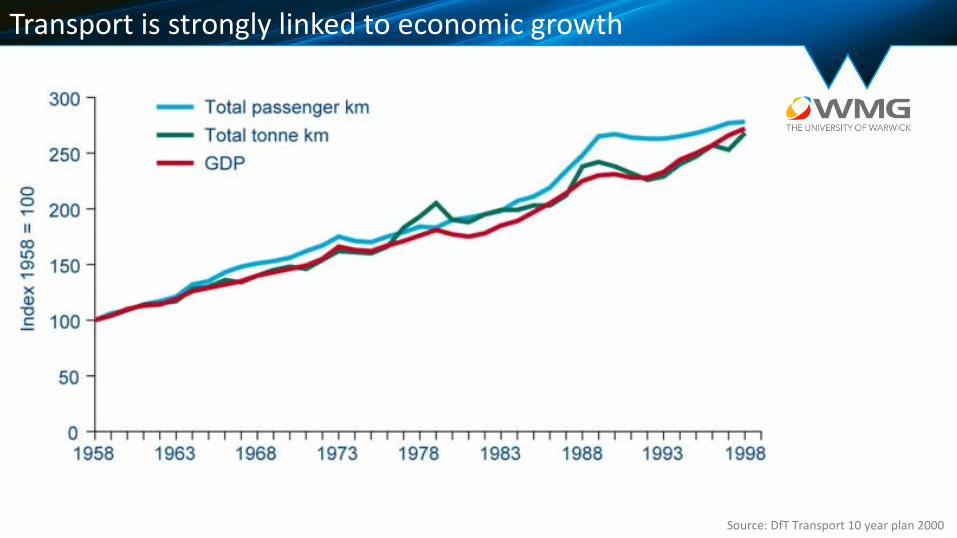
Transport is strongly linked to economic growth
Source: DfT Transport 10 year plan 2000

It is essential to our personal and business lives
Moving People
Shopping / Personal – 25%
Work / Business – 25%
Social / Leisure – 30%
Education – 15%
Source: UK Department for Transport National Travel Survey 2014
Moving Goods
Industrial
Domestic
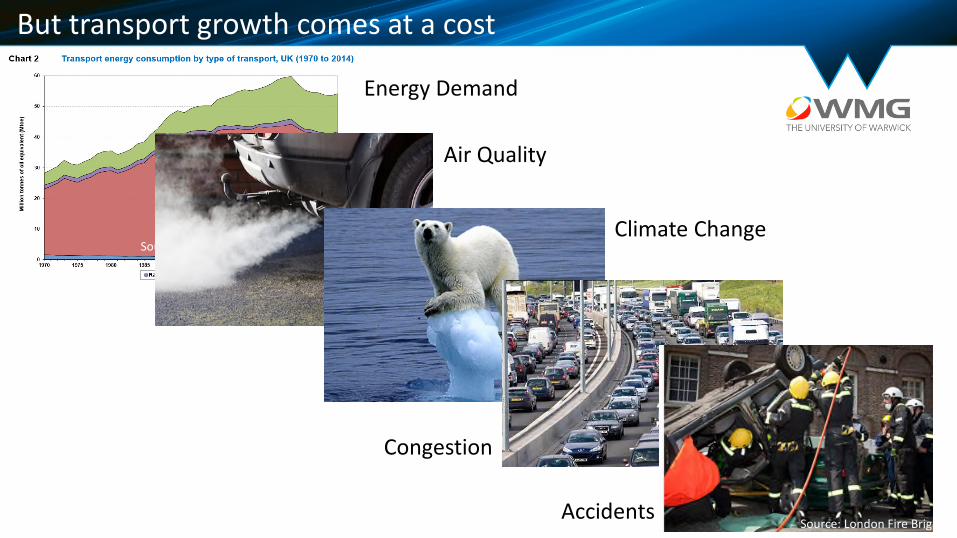
But transport growth comes at a cost
Source: DECC ECUK 2015 Chapter 2
Energy Demand
Air Quality
Climate Change
Congestion
Source: London Fire BrigadeAccidents
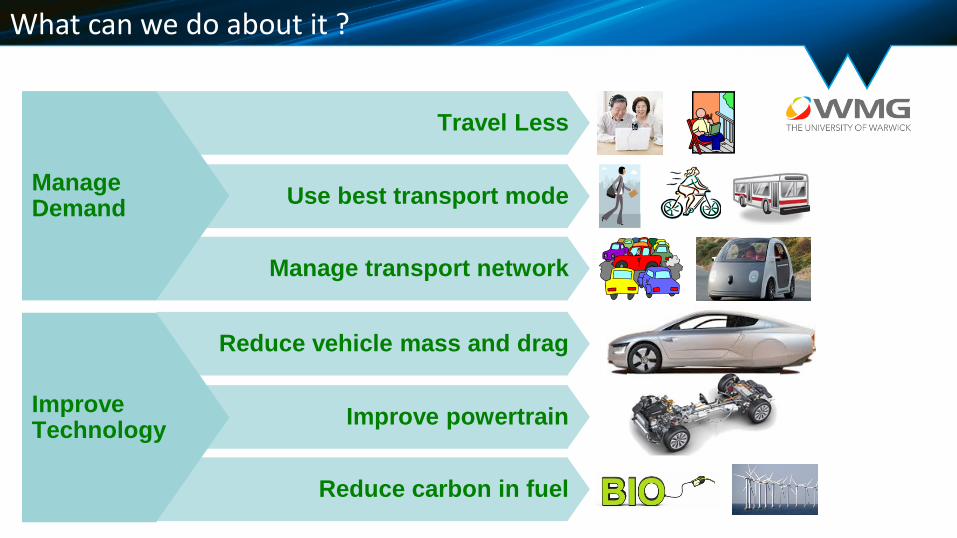
What can we do about it ?
Travel Less
Use best transport mode
Reduce vehicle mass and drag
Improve powertrain
Reduce carbon in fuel
ImproveTechnology
Manage transport network
ManageDemand
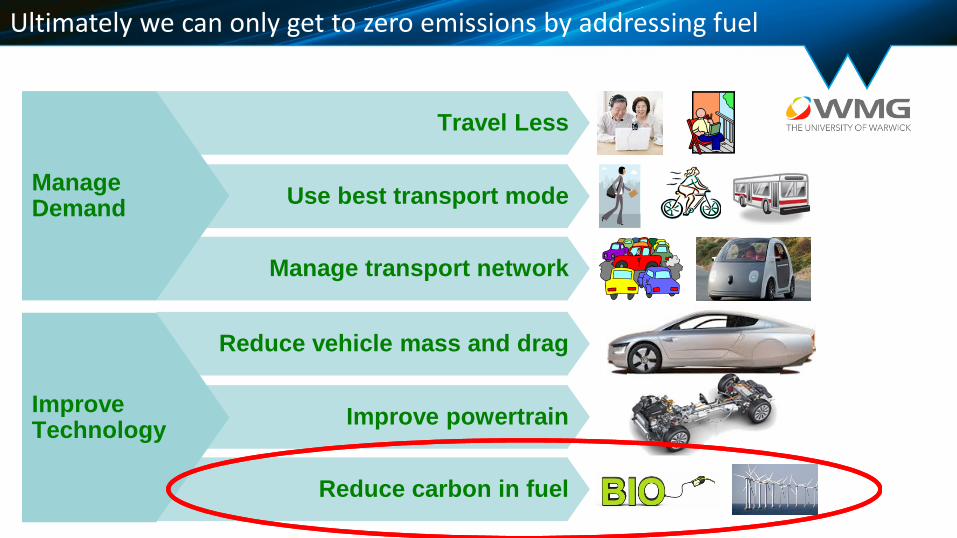
Ultimately we can only get to zero emissions by addressing fuel
Travel Less
Use best transport mode
Reduce vehicle mass and drag
Improve powertrain
Reduce carbon in fuel
ImproveTechnology
Manage transport network
ManageDemand
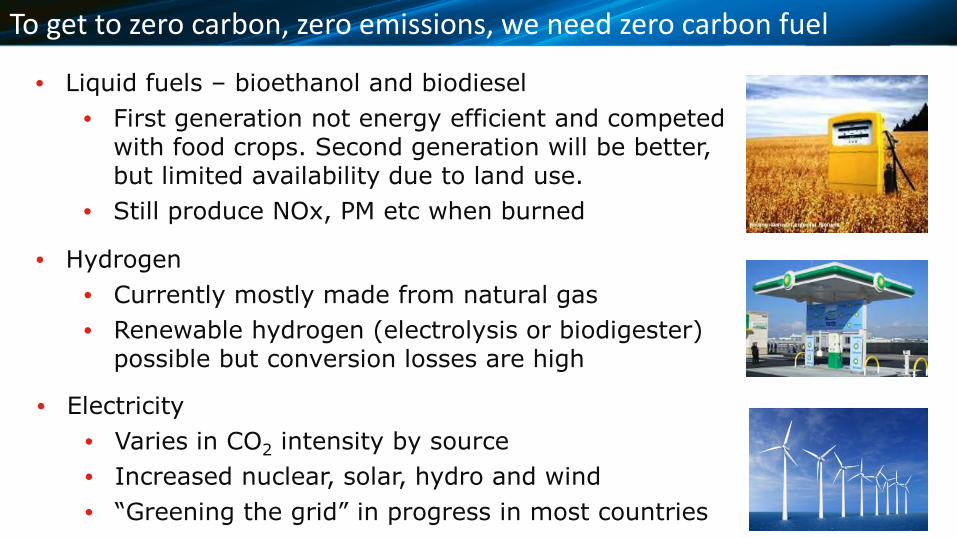
To get to zero carbon, zero emissions, we need zero carbon fuel
• Liquid fuels – bioethanol and biodiesel
• First generation not energy efficient and competedwith food crops. Second generation will be better,but limited availability due to land use.
• Still produce NOx, PM etc when burned
• Electricity
• Varies in CO2 intensity by source
• Increased nuclear, solar, hydro and wind
• “Greening the grid” in progress in most countries
• Hydrogen
• Currently mostly made from natural gas
• Renewable hydrogen (electrolysis or biodigester)possible but conversion losses are high
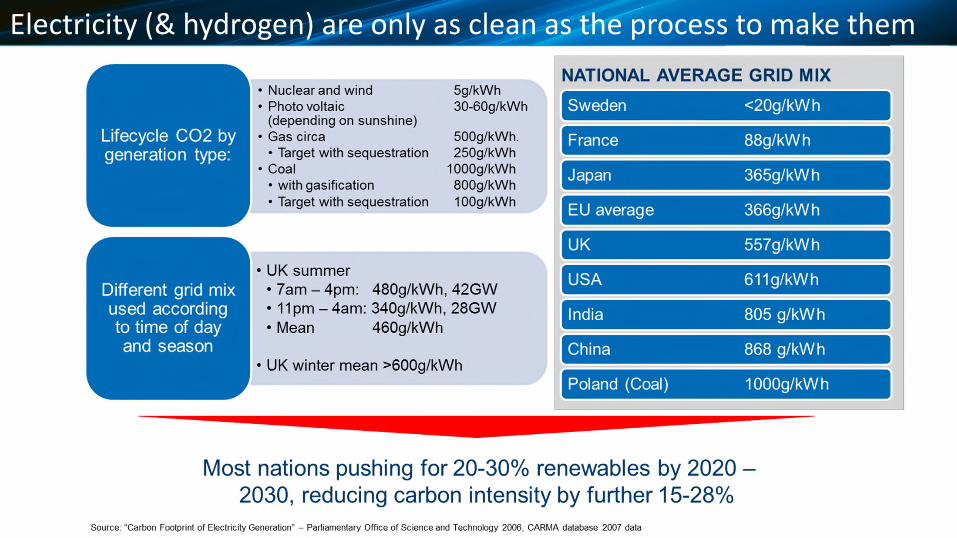
Electricity (& hydrogen) are only as clean as the process to make them
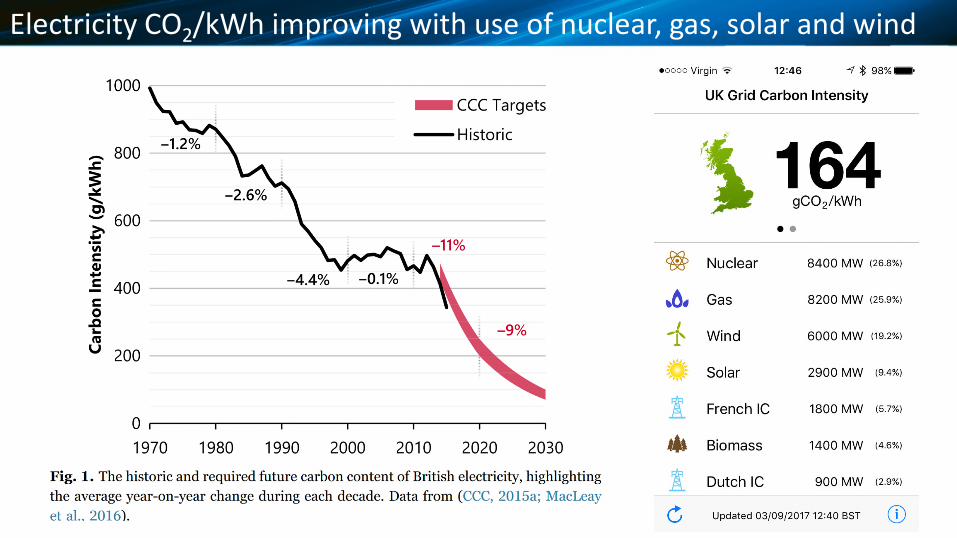
Electricity CO2/kWh improving with use of nuclear, gas, solar and wind
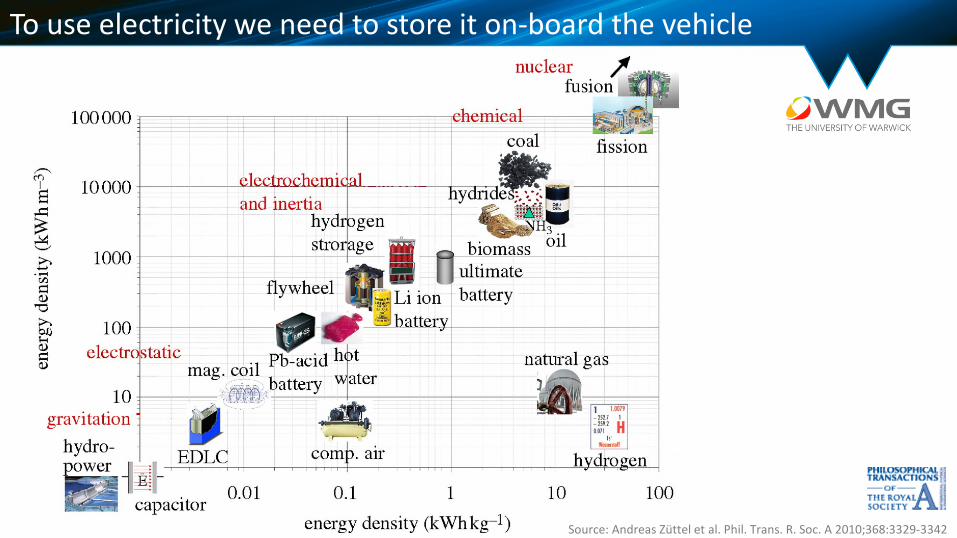
To use electricity we need to store it on-board the vehicle
Source: Andreas Züttel et al. Phil. Trans. R. Soc. A 2010;368:3329-3342
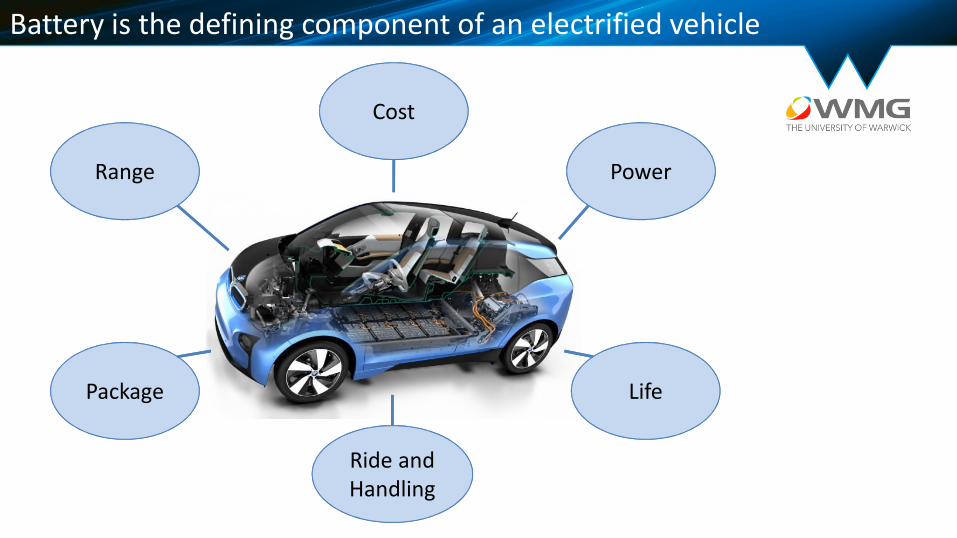
Battery is the defining component of an electrified vehicle
PowerRange
Cost
Life
Ride andHandling
Package
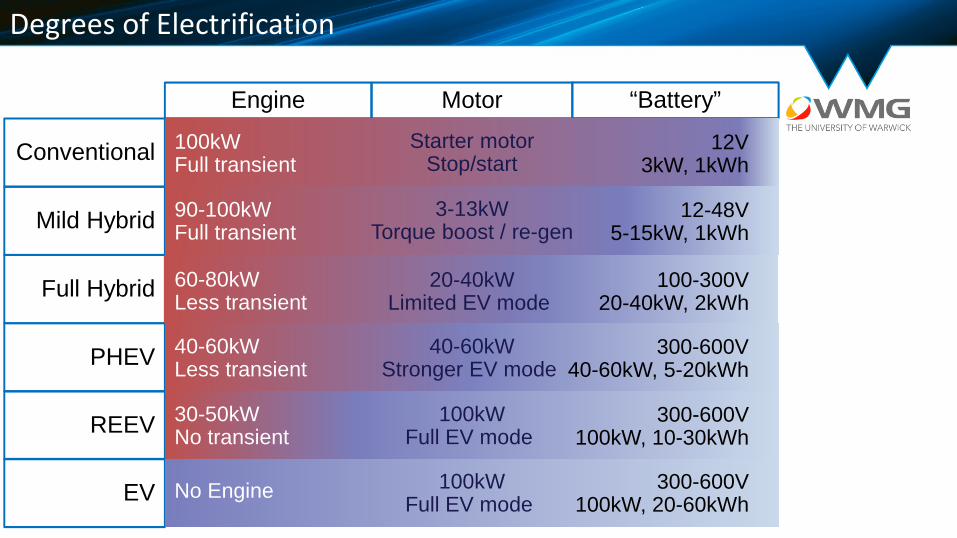
Degrees of Electrification
Conventional
Mild Hybrid
Full Hybrid
PHEV
EV
Engine Motor
REEV
“Battery”
100kWFull transient
Starter motorStop/start
12V3kW, 1kWh
90-100kWFull transient
3-13kWTorque boost / re-gen
12-48V5-15kW, 1kWh
60-80kWLess transient
20-40kWLimited EV mode
100-300V20-40kW, 2kWh
40-60kWLess transient
40-60kWStronger EV mode
300-600V40-60kW, 5-20kWh
30-50kWNo transient
100kWFull EV mode
300-600V100kW, 10-30kWh
No Engine 100kWFull EV mode
300-600V100kW, 20-60kWh
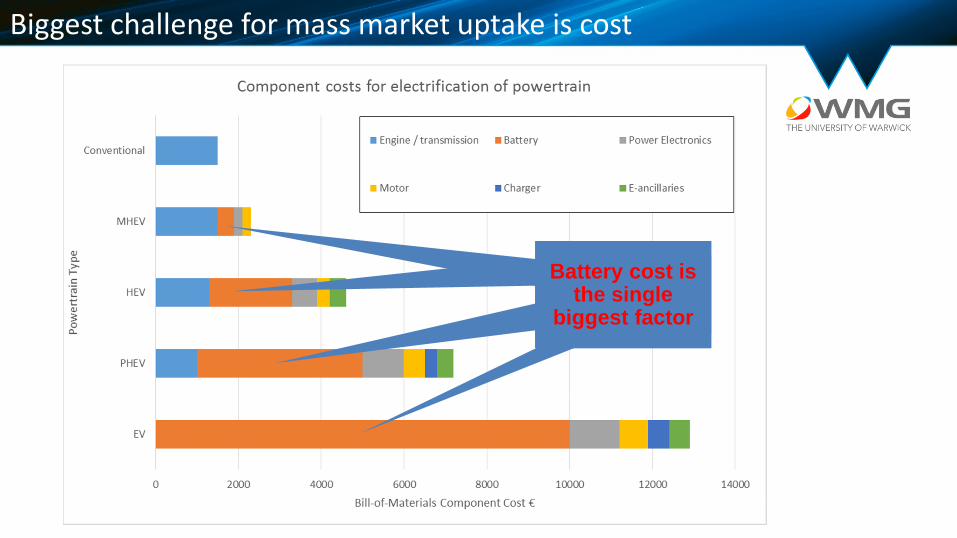
Biggest challenge for mass market uptake is cost
Battery cost isthe single
biggest factor
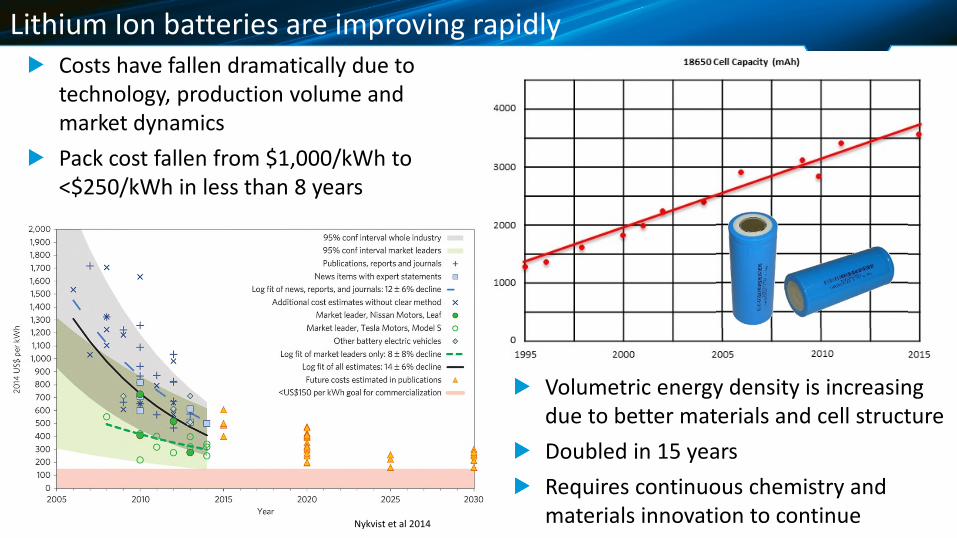
Lithium Ion batteries are improving rapidlyCosts have fallen dramatically due totechnology, production volume andmarket dynamics
Pack cost fallen from $1,000/kWh to<$250/kWh in less than 8 years
Nykvist et al 2014
Volumetric energy density is increasingdue to better materials and cell structure
Doubled in 15 years
Requires continuous chemistry andmaterials innovation to continue
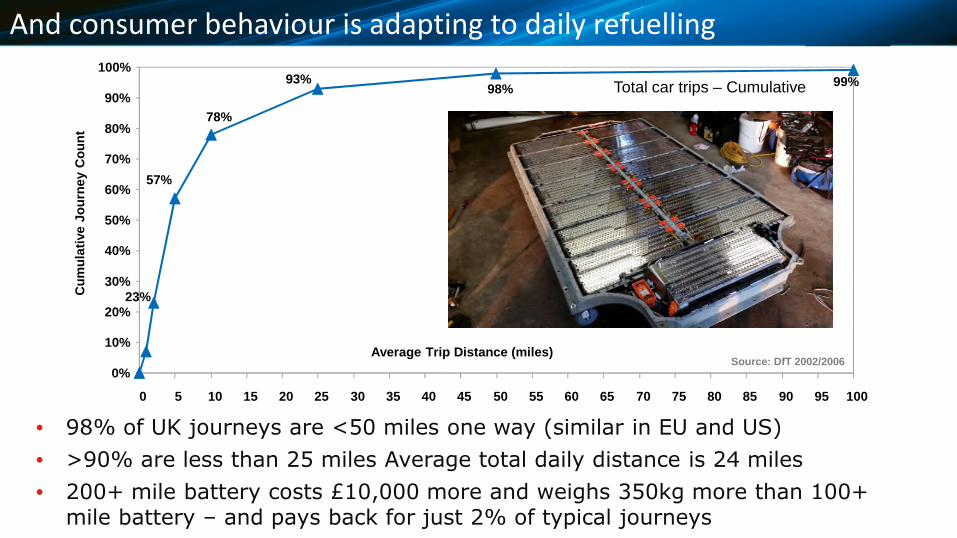
And consumer behaviour is adapting to daily refuelling
99%93%
78%
57%
98%
23%
0%
10%
20%
30%
40%
50%
60%
70%
80%
90%
100%
0 5 10 15 20 25 30 35 40 45 50 55 60 65 70 75 80 85 90 95 100
Average Trip Distance (miles)
Total car trips – Cumulative
Source: DfT 2002/2006
• 98% of UK journeys are <50 miles one way (similar in EU and US)
• >90% are less than 25 miles Average total daily distance is 24 miles
• 200+ mile battery costs £10,000 more and weighs 350kg more than 100+mile battery – and pays back for just 2% of typical journeys
Cu
mu
lati
ve
Jo
urn
ey
Co
un
t
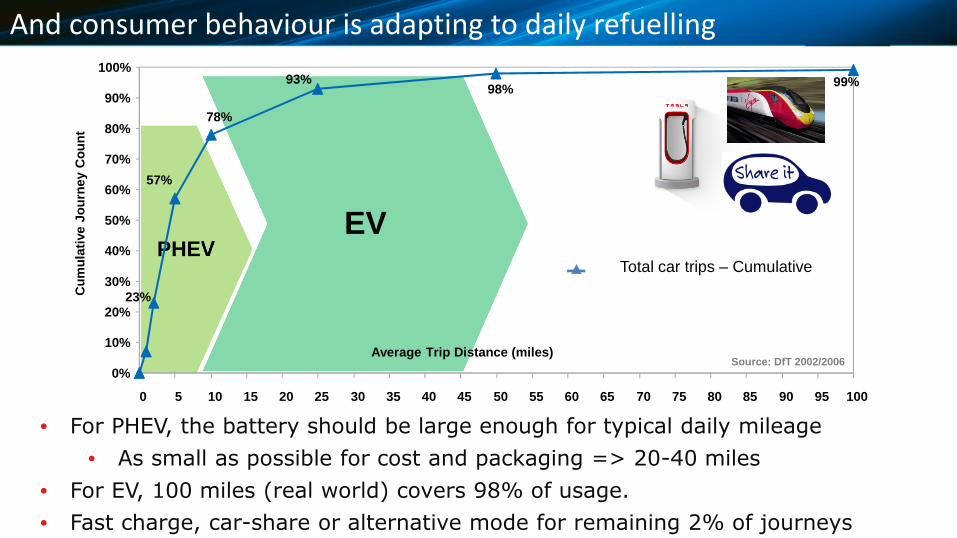
And consumer behaviour is adapting to daily refuelling
PHEVEV
99%93%
78%
57%
98%
23%
0%
10%
20%
30%
40%
50%
60%
70%
80%
90%
100%
0 5 10 15 20 25 30 35 40 45 50 55 60 65 70 75 80 85 90 95 100
Average Trip Distance (miles)
Total car trips – Cumulative
Source: DfT 2002/2006
• For PHEV, the battery should be large enough for typical daily mileage
• As small as possible for cost and packaging => 20-40 miles
• For EV, 100 miles (real world) covers 98% of usage.
• Fast charge, car-share or alternative mode for remaining 2% of journeys
Cu
mu
lati
ve
Jo
urn
ey
Co
un
t
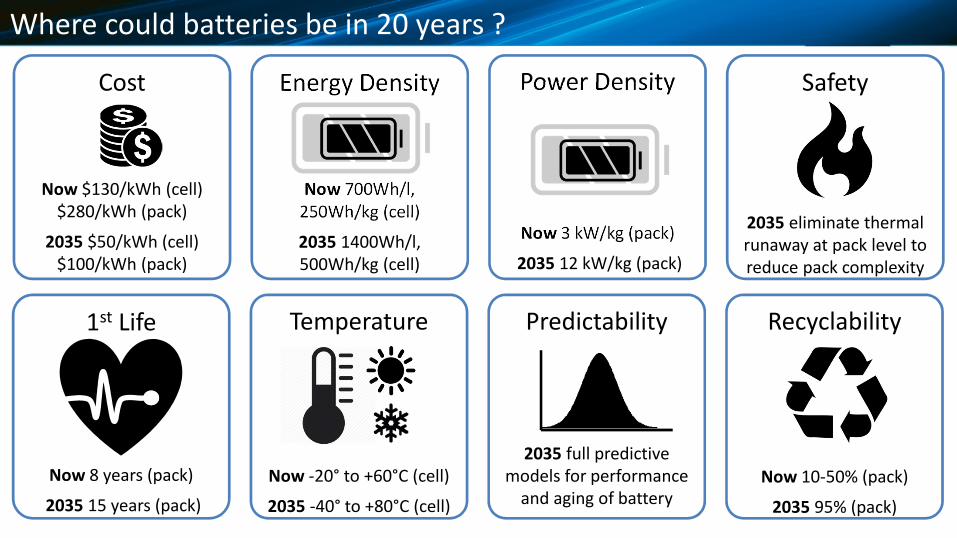
Where could batteries be in 20 years ?
Cost
Now $130/kWh (cell)$280/kWh (pack)
2035 $50/kWh (cell)$100/kWh (pack)
Energy Density
Now 700Wh/l,250Wh/kg (cell)
2035 1400Wh/l,500Wh/kg (cell)
Power Density
Now 3 kW/kg (pack)
2035 12 kW/kg (pack)
Safety
2035 eliminate thermalrunaway at pack level toreduce pack complexity
1st Life
Now 8 years (pack)
2035 15 years (pack)
Temperature
Now -20° to +60°C (cell)
2035 -40° to +80°C (cell)
Predictability
2035 full predictivemodels for performance
and aging of battery
Recyclability
Now 10-50% (pack)
2035 95% (pack)
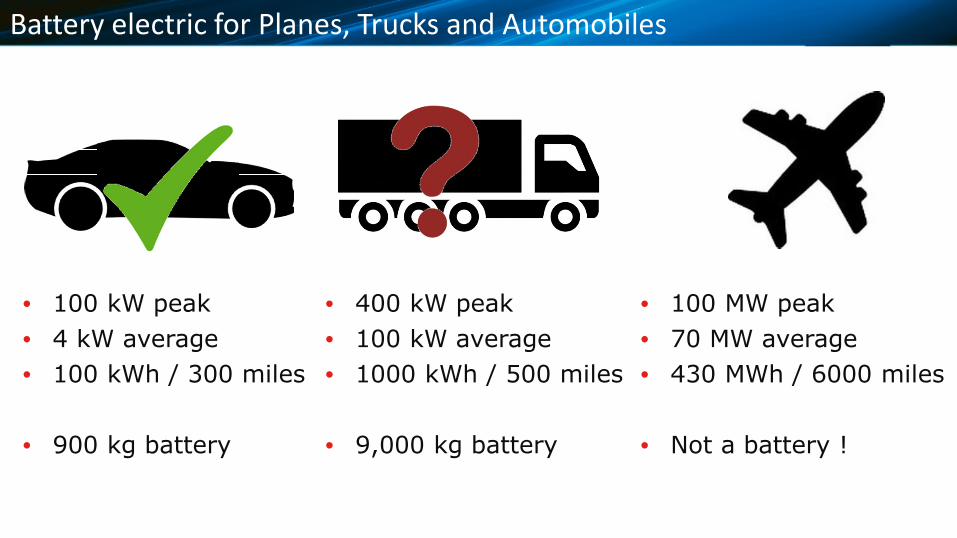
Battery electric for Planes, Trucks and Automobiles
• 100 MW peak
• 70 MW average
• 430 MWh / 6000 miles
• Not a battery !
• 100 kW peak
• 4 kW average
• 100 kWh / 300 miles
• 900 kg battery
• 400 kW peak
• 100 kW average
• 1000 kWh / 500 miles
• 9,000 kg battery
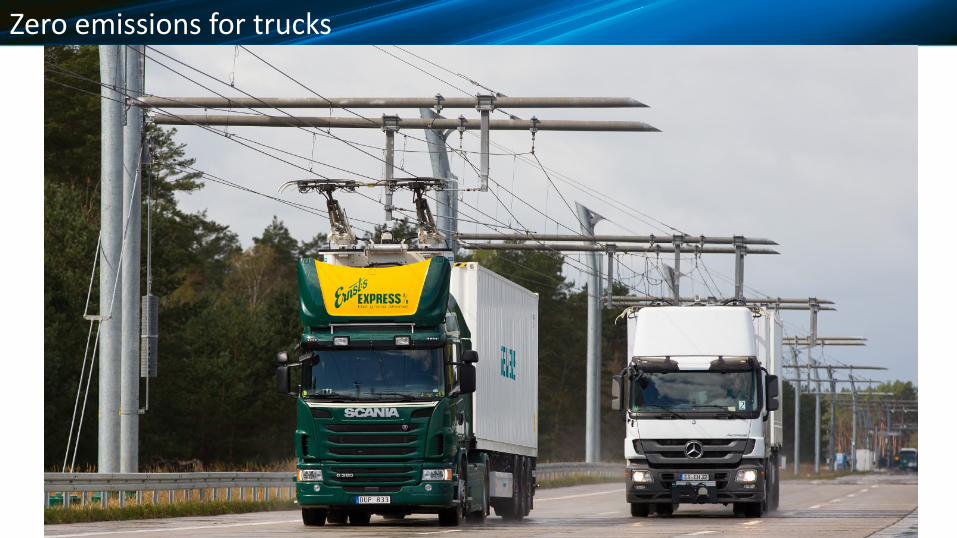
Zero emissions for trucks
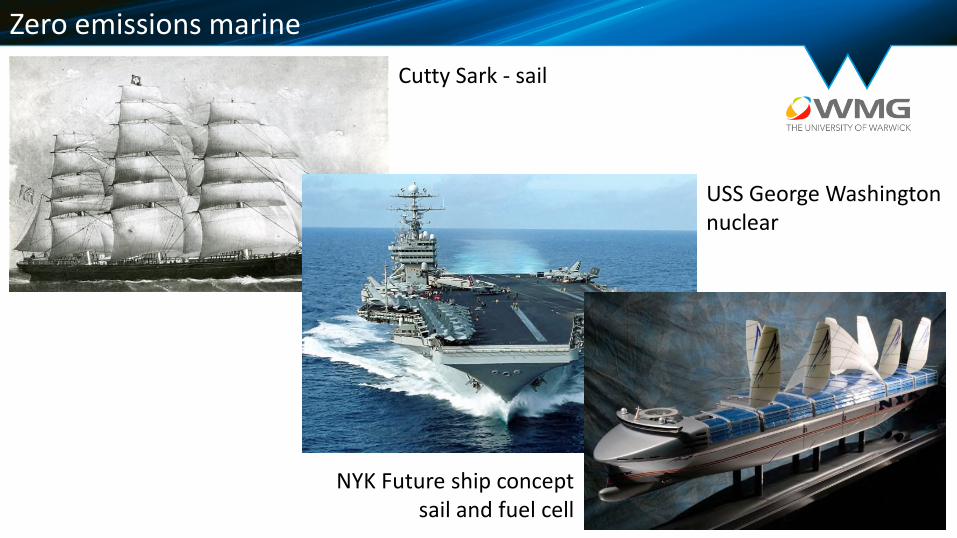
Zero emissions marine
Cutty Sark - sail
USS George Washingtonnuclear
NYK Future ship conceptsail and fuel cell
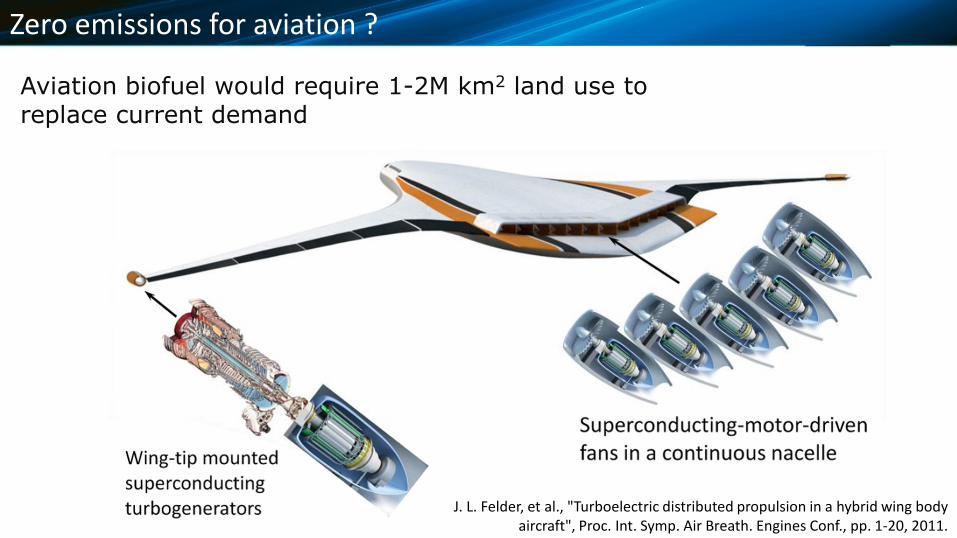
Zero emissions for aviation ?
J. L. Felder, et al., "Turboelectric distributed propulsion in a hybrid wing bodyaircraft", Proc. Int. Symp. Air Breath. Engines Conf., pp. 1-20, 2011.
Aviation biofuel would require 1-2M km2 land use toreplace current demand

Thank you
Prof. David Greenwood
Advanced Propulsion Systems
WMG, The University of Warwick [email protected]