the full day kindergarten early learning program final report
TRANSCRIPT

The Full Day Kindergarten Early Learning Program Final Report
By Magdalena Janus, Eric Duku, and Amanda Schell with assistance from: Anna DeSimone, Jessica Peter, and Ashley Gaskin
Offord Centre for Child Studies McMaster University Hamilton, Ontario
Submitted to the Ontario Ministry of Education October 2012

FDK ELP Final Report
2
Table of Contents
Introduction ……………………………………………………………………………………………………. 3Methods …………………………………………………………………………………………………………. 3
Measures ……………………………………………………………………………………………. 7Procedure …………………………………………………………………………………………… 8Sample ……………………………………………………………………………………………….. 8
Section I: Year 1 descriptive analyses ………………………………………………………………. 9Part A: Year 1 Junior Kindergarten …………………………………………………….. 10Part B: Year 1 Senior Kindergarten …………………………………………………….. 26
Section II: Year 2 descriptive analyses …………………………………………………………….. 42Part A: Year 2 Junior Kindergarten ……………………………………………………… 43Part B: Year 2 Senior Kindergarten ……………………………………………………... 59
Section III: Year 1 and 2 analyses …………………………………………………………………….. 75Analyses …………………………………………………………………………………………..…. 76
Cross‐sectional analyses ……………………………………………………..…. 76School‐based longitudinal analyses ………………………………….….... 77
Results ………………………………………………………………………………………….….… 78Social Risk Index ………………………………………………………………..….. 78Cross‐ sectional ……………………………………………………………..………. 78
At‐risk group comparisons …………………………………..……. 81School‐based longitudinal …………………………………………………..…. 81
Limitations ……………………………………………………………………………………….… 84Summary of findings ……………………………………………………………………….... 86Conclusions ........................................................................................... 87
References .......................................................................................................... 89Appendices ......................................................................................................... 90
Appendix A: School names .................................................................... 90Appendix B: Year 1 JK domain scores controlling for SRI ...................... 92Appendix C: Year 1 JK vulnerability controlling for SRI .......................... 93Appendix D: Year 1 SK domain scores controlling for SRI ...................... 94Appendix E: Year 1 SK vulnerability controlling for SRI .......................... 95Appendix F: Year 2 JK domain scores controlling for SRI ....................... 96Appendix G: Year 2 JK vulnerability controlling for SRI .......................... 97Appendix H: Year 2 SK domain scores controlling for SRI ...................... 98Appendix I: Year 2 SK vulnerability controlling for SRI ........................... 99Appendix J: At‐risk group comparisons: Boys ....................................... 100Appendix K: At‐risk group comparisons: E/FSL ..................................... 101Appendix L: At‐risk group comparisons: Below mean age ................... 102Appendix M: MLM – JK cohort comparisons ........................................ 103Appendix N: MLM – SK cohort comparisons ........................................ 104Appendix O: MLM – 2 years FDK group comparisons ........................... 105Appendix P: MLM – 1 year FDK group comparisons ............................. 106Appendix Q: MLM – No FDK group comparisons................................... 107

FDK ELP Final Report
3
Introduction
In June 2009, a report authored by Charles Pascal, a Special Advisor to the Premier of Ontario, “With their best future in mind” (Pascal, 2009), recommended full‐day kindergarten and wrap‐around care for 4‐ and 5‐year‐olds. This program has been legislated and will be implemented over the course of five years to eventually include every primary school in Ontario. The Full Day Kindergarten (FDK) Early Learning Program (ELP) is being phased‐in, the first phase of which started in the 2010/2011 school year.
The described project was a 2‐year investigation of children’s developmental outcomes measured with the Early Development Instrument (EDI) in relation to individual, school, and neighbourhood factors within the context of the ELP. The goal of this study was to document possible early impact, if any, of the FDK on children’s developmental status.
The ELP is a population‐based, universal program. As such, its advantage is in reaching all children, rather than targeting children deemed at most need due to factors established through previous research and practice. At the same time, however, its disadvantage is in lack of specificity. Research indicates that universal programs rarely show distinct advantageous outcomes over a short period of time. While this report addresses results of a two‐year evaluation project, it is imperative that the children participating in this study are followed over longer periods of time to facilitate more in‐depth long‐term investigations.
Report structure
This final study report is presented in three sections. Section 1 includes Year 1 descriptive analyses; Section 2 includes Year 2 descriptive analyses; and Section 3 includes analyses for both years of study in cross‐sectional design and school‐based longitudinal design.
Methods
Project design
The ideal design to measure impacts of a program is to randomize units (children, or in this case schools) into treatment groups. Due to the constraints in the way the FDK was implemented, this methodology was not possible. As closely as possible, a matched and longitudinal control design was applied.
There were several major school/community characteristics that were taken into account. These are, not exhaustively: official language of the school board (English/French), type of school board (public/separate), geographical location, and most importantly, year of implementation of the FDK (phase). Schools were selected from the pool of those where the

FDK ELP Final Report
4
FDK was in Phase 1 (implemented in 2010/11), those where the FDK was in Phase 2 (implemented in 2011/12), and those where the FDK was implemented later than 2012.
In each of the selected schools, teachers of Junior and Senior Kindergarten children were asked to complete the EDI. The Kindergarten Parent Survey (KPS) was subsequently sent to the children’s parents for whom the EDI was completed.
Selection of schools
Schools have been selected in the following way:
1. All schools in the Phase 1 of FDK were identified and sorted by their Ministry of Education (EDU) region.
2. The address, size, and percentage of families in the school neighbourhood with income below national average were noted.
3. Schools from the later Phases (i.e., not 1 or 2), and from the same school boards as Phase 1 schools were identified.
4. From these possible “control” schools, potential matches to Phase 1 schools were identified based on four criteria:
a. same board type and language of instruction (Catholic/Public; English/French), b. within no more than 20 km from each other, c. same above‐below % low income category, d. similar school size (within approximately 50 for small schools and 100 for large
school). 5. The actual selection of the boards was made collaboratively between EDU and OCCS,
based on recent EDI data collection status a. with two exceptions, sites scheduled to complete the EDI in 2010/11 roll‐out
were excluded b. the “concurrent” sites were included only if there was no alternative and
comparable sites within the EDU region to choose (Toronto and Ottawa) 6. The following school boards/regions were selected (a total of 126 schools):

FDK ELP Final Report
5
EDU Region CYS Site School BoardsTotal N of schools
Barrie Simcoe ‐ Simcoe County DSB‐ Simcoe Muskoka Catholic DSB
24
London Waterloo ‐ Waterloo Catholic DSB ‐ Waterloo Region DSB
23
London Sarnia‐Lambton ‐ Lambton Kent DSB ‐ St. Clair Catholic DSB
4
London Chatham‐Kent ‐ Lambton Kent DSB ‐ St. Clair Catholic DSB
4
Ottawa Ottawa ‐ CSD catholique du Centre‐ Est de l'Ontario ‐ CSD des écoles publiques de l'Est de l'Ontario ‐ Ottawa Catholic DSB ‐ Ottawa‐Carleton DSB
39
Ottawa Renfrew ‐ CSD des écoles publiques de l'Est de l'Ontario
1
Ottawa Stormont Dundas Glengarry Prescott Russell
‐ CSD des écoles publiques de l'Est de l'Ontario
2
Sudbury/North Bay Timiskaming ‐ DSB Ontario North East ‐ CSD du Nord‐Est de l'Ontario ‐ CSD catholique des Grandes Rivières
5
Sudbury/North Bay Timmins‐James Bay ‐ CSD catholique des Grandes Rivières ‐ CSD du Nord‐Est de l'Ontario ‐ DSB Ontario North East
6
Thunder Bay Thunder Bay‐Atikokan
‐ Rainy River DSB ‐Northwest Catholic DSB
2
Thunder Bay Kenora‐Rainy River ‐ Rainy River DSB 1
Toronto Chatham‐Kent ‐ CSD des écoles catholiques du Sud‐Ouest
2
Toronto London‐Fanshawe ‐ CSD des écoles catholiques du Sud‐Ouest
1
Toronto SDGPR ‐ CSD des écoles publiques de 1

FDK ELP Final Report
6
l'Est de l'Ontario
Toronto Simcoe ‐ CSD catholique Centre‐Sud 2
Toronto Toronto ‐ CS Viamonde (CSD du Centre Sud‐Ouest)
2
Toronto Waterloo ‐ CSD catholique Centre‐Sud 2
Toronto Wellington ‐ CSD catholique Centre‐Sud 1
Toronto York ‐ CS Viamonde (CSD du Centre Sud‐Ouest) ‐ CSD catholique Centre‐Sud
3
The list of participating schools is found in Appendix A.
The study groups
This project compares participants in three separate groups. The first group consists of children who attended full day Junior (JK) and Senior Kindergarten (SK) in year 1 and full day Junior and Senior Kindergarten in year 2 (2 years FDK group). The second group is comprised of children who did not attend full day Junior or Senior Kindergarten in year one, but attended full day Junior and Senior Kindergarten in year 2 (1 year FDK group). The third group of children did not attend full day Kindergarten, Junior or Senior, at any time (No FDK group).
Abbreviation Definition
EDI Early Development Instrument
FDK Full Day Kindergarten
ELP Early Learning Project
OCCS Offord Centre for Child Studies
JK Junior Kindergarten
SK Senior Kindergarten
2 years FDK group Children in group with Full Day Kindergarten in Year 1 and Year 2
1 year FDK group Children in group with Full Day Kindergarten in Year 2 only
No FDK group Children in group with no Full Day Kindergarten
E/FSL English/French as a Second Language
KPS Kindergarten Parent Survey
ANOVA Analysis of Variance
MLM Multi‐Level Modelling
SRI Social Risk Index
s.e. Standard error

FDK ELP Final Report
7
Measures
Early Development Instrument (EDI) The Early Development Instrument, a teacher‐completed, population‐level
questionnaire, was developed at the Offord Centre for Child Studies at McMaster University, to measure children’s ability to meet age appropriate developmental expectation at school entry (Janus & Offord, 2007). The EDI focuses on the outcomes for children as a health‐relevant, measurable concept that has long‐term consequences for both individual outcomes and population health in five developmental domains relevant to children’s success at school: physical health and well‐being, social competence, emotional maturity, language and cognitive development, and communication skills and general knowledge. The data derived from the collection of the EDI facilitates and encourages community, provincial, national and international monitoring of the developmental health of our young learners.
By the year 2010, two 3‐year waves of provincial EDI implementations in Ontario have been completed, and these data have been frequently used by various Ontario government branches. The majority of Ontario kindergarten teachers have had experience in completing the instrument.
Kindergarten Parent Survey (KPS) While the EDI alone can provide information on children’s abilities and skills as they
enter school, a well‐rounded picture of the health of a community’s children is only possible when it is used in conjunction with other measures. In Ontario, the need for more information on family characteristics and experiences of children before entering kindergarten led to the development of the Kindergarten Parent Survey (KPS), a parent‐completed survey which can be used as a companion document to the EDI (Janus et al, 2007). In Ontario, the survey is completed by the parents of children for whom the teacher is completing the EDI. The KPS is an 8‐page questionnaire that provides information on the environment and familial influences on children’s developmental health at school entry such as: child health and development, child care, children’s experiences before kindergarten, regular activities, services and programs accessed, kindergarten experiences, and family and neighbourhood characteristics.
Social Risk Index (SRI) The Social Risk Index (SRI) has commonly been used to examine the relationship
between EDI and socioeconomic information. The index is comprised of nine indicators that are calculated using Census data, including unemployment rate, percent of income from government transfer payments, percent of low income, percent without a high school diploma, percent of families with a lone parent, percent of homes that are rented, percent that speak neither English nor French, percent that have moved in the previous year, and percent that have immigrated in the previous five years. The SRI is an average of each of these nine variables, with a higher number indicating higher risk and therefore, lower socio‐economic status.

FDK ELP Final Report
8
Study procedure
Ethical approval for the study was secured through the Review Ethics Board of McMaster University. The recruitment of participants was carried out by the Ministry of Education. School boards and school principals had to agree for their schools to be included, and once this was achieved, letters of invitation to participate in the study were sent by schools to the families of all eligible children. Parents who wanted their children to be included sent the letter of consent back to the school, and this information was communicated to a school board representative. Demographic data for children whose parents completed letters of consent were sent to the OCCS in order to be uploaded to the electronic EDI page. This was done only when a consent return deadline passed, and only then the teacher was able to complete the EDI for these children. Due to unexpected delays, data collection in Year 1 did not start until mid‐April 2011 and was not completed until late June. All parents who consented for the EDI to be completed also agreed to complete the Kindergarten Parent Survey (KPS). However, less than half of the parents in the study returned the KPS, rendering the data based on KPS not representative. The EDI data were scored and analysed each year (Section 1 and Section 2 of the report). Once all data were collected, additional analyses were carried out with results based on both years (Section 3 of the report).
Overall project sample
There were a total of 16,736 children eligible to participate in the ELP FDK project, 8,640 in Year 1 and 8,096 in Year 2. Parental consent was required for participation in the project and was received for 8,577 children from 126 schools across Ontario. The total number of children consented per year were 4,007 Year 1 children (2,423 Junior Kindergarteners, 1,584 Senior Kindergarteners) and 4,570 Year 2 children (2,237 Junior Kindergarteners, 2,333 Senior Kindergarteners). In order to be valid for analyses, children had to be in class for more than one month, a minimum number of items had to be completed on the EDI, and children needed to be assigned to an FDK Group. Also, special needs children were not included in the overall analyses. There were 3,740 Year 1 children (2,255 JK and 1,479 SK) and 4,321 Year 2 children (2,124 JK and 2,197 SK) who met the inclusion criteria. For exact details on Year 1 and Year 2 EDI and KPS‐based samples please see Part A and B of Section I and Section II.

FDK ELP Final Report
9
Section I Descriptive Analyses of EDI and KPS data
Year 1 (2010/2011)

Section I: Part A
10
Section I: Year 1 Part A. Junior Kindergarten
Number of Junior Kindergarten Children in ELP EDI and KPS Analyses
1. Total JK (with consent) questionnaires completed. 2. Questionnaires for children in class more than 1 month. 3. Questionnaires for children in class other than in class more than 1 month
a. in class <1 month b. moved out of class c. moved out of school d. other
4. Questionnaires without Special Needs. 5. Questionnaires labelled as Special Needs or missing Special Needs assignation. 6. Special Needs children with incomplete questionnaires (missing more than one domain). 7. Questionnaires missing Special Needs assignation. 8. Questionnaires valid for analyses in reports for children with Special Needs. 9. Non Special Needs children with incomplete questionnaires (missing more than one domain) 10. Children missing an FDK status group. 11. Questionnaires valid for analyses in reports for children without Special Needs.
a. 2‐years FDK group b. 1‐year FDK group c. No FDK group
1.) 2423
2.) 2387
4.) 2276
9.) 15
11.) 2255
11.a) 913
11.b) 636
11.c) 706
10.) 6
5.) 111
6.) 0
7.) 16
8.) 95
3.) 36
3.a) 3
3.b) 5
3.c) 9
3.d) 19

Section I: Part A
11
Descriptive Statistics for Year 1 Junior Kindergarten by FDK Group
Overall, out of 2,423 EDIs completed for children in Junior Kindergarten, 2,255 contained valid data for summary analyses (93.1%). 95 out of 2,423 (approximately 5%) of children were reported as having Special Needs. These rates were similar across the three study groups.
The tables below describe the composition of each of the three different FDK groups. These tables demonstrate that the groups are relatively similar in their demographic composition.
Gender Count (%)
2 years FDK group 1 year FDK group No FDK group
Girl 468 (51.3 %) 321 (50.5%) 354 (50.1%)
Boy 445 (48.7%) 315 (49.5%) 352 (49.9%)
English/French as a Second Language
Count (%)
2 years FDK group 1 year FDK group No FDK group
E/FSL 252 (27.6%) 130 (20.4%) 193 (27.3%)
No E/FSL 659 (72.2%) 506 (79.6%) 513 (72.7%)
Missing 2 (0.2%) 0.0 (0.0%) 0.0 (0.0%)
First Language Count (%)
2 years FDK group 1 year FDK group No FDK group
English 581 (63.6%) 434 (68.2%) 420 (59.5%)
French 71 (7.8%) 53 (8.3%) 66 (9.3%)
Other only 110 (12.0%) 53 (8.3%) 62 (8.8%)
English & French 78 (8.5%) 58 (9.1%) 104 (14.7%)
English & Other 17 (1.9%) 6 (0.9%) 21 (3.0%)
French & Other 5 (0.5%) 5 (0.8%) 3 (0.4%)
Two other languages 7 (0.8%) 3 (0.5%) 4 (0.6%)
Missing 44 (4.8%) 24 (3.8%) 26 (3.7%)
French Immersion Count (%)
2 years FDK group 1 year FDK group No FDK group
French Immersion 14.0 (1.5%) 62.0 (9.7%) 109.0 (15.4%)
Non‐French Immersion 897.0 (98.2%) 572.0 (89.9%) 597.0 (84.6%)
Missing 2.0 (0.2%) 2.0 (0.3%) 0.0 (0.0%)
Aboriginal Count (%)
2 years FDK group 1 year FDK group No FDK group
Aboriginal 13 (1.4%) 3 (0.5%) 4 (0.6%)
Not Aboriginal 767 (84.0%) 558 (87.7%) 616 (87.3%)
Missing 133 (14.6%) 75 (11.8%) 86 (12.2%)

Section I: Part A
12
ELP Year 1 Junior Kindergarten Results 2010/2011
Overall Comparisons by FDK Group
The EDI was completed for 2,255 non‐Special Needs Junior Kindergarten students in Year 1 of the ELP FDK project. The tables and graph below illustrate descriptive statistics by FDK group.
2 years FDK group
1 year FDK group
No FDK group
p‐value
Girls 468 321 354 .898
Boys 445 315 352
2 years FDK group
1 year FDK group
No FDK group
p‐value
N 913 636 706
.277 Mean Age 4.98 5.01 4.98
SD 0.38 0.42 0.39
The p‐values in the above tables demonstrate that the three groups do not differ statistically in terms of the composition of gender or age.
The table below outlines the mean scores and standard deviations for each domain by FDK group. The p‐values in this table indicate that there is a significant difference between the three groups in the domain of Language and Cognitive Development. Post‐hoc analyses did not demonstrate any differences when comparing the groups individually to each other.
Note: As of the late summer 2012, neighbourhood‐level index of socioeconomic status (Social Risk Index, or SRI), became available. The domain score comparisons by FDK group were repeated with SRI as a covariate, and the results are in Appendix B.

Section I: Part A
13
0
2
4
6
8
10
Physical Health& Well‐being
SocialCompetence
EmotionalMaturity
Language &Cognitive
Development
CommunicationSkills & GeneralKnowledge
2 years FDK group
1 year FDK group
No FDK group
Domains Mean (SD)
p‐value 2 years FDK group
1 year FDK group No FDK group
Physical Health & Well‐being 8.39 (1.52) 8.45 (1.48) 8.53 (1.46) .171
Social Competence 8.07 (1.93) 8.26 (1.82) 8.19 (1.94) .140
Emotional Maturity 7.72 (1.59) 7.91 (1.50) 7.82 (1.56) .063
Language & Cognitive Development
8.08 (1.88) 7.81 (2.02) 7.96 (2.04) .034
Communication Skills & General Knowledge
7.37 (2.62) 7.15 (2.71) 7.40 (2.67) .177
Comparison of Means

Section I: Part A
14
Percentage of Vulnerable Children (JK Year 1)
“Vulnerable” describes children whose domain scores are in the lowest 10th percentile of a distribution. The table and graph below illustrate the percentage of children in each FDK group who score is in the lowest 10th percentile based on the Ontario Baseline distribution. Please note that the Ontario Baseline 10th percentile cut‐offs are based on data collected for Senior Kindergarten children, therefore it is to be expected that this Junior Kindergarten cohort of children would have higher rates of vulnerability.
The p‐values in the below table illustrate that there is a significant difference in vulnerability between the three groups in the domain of Physical Health and Well‐being. Post hoc analyses demonstrated that the 2 years FDK group had a significantly higher percentage of vulnerability in the Physical Health and Well‐being domain than the 1 year FDK group and the No FDK group.
Note: As of the late summer 2012, neighbourhood‐level index of socioeconomic status (Social Risk Index, or SRI), became available. The vulnerability comparisons by FDK group were repeated with SRI as a covariate, and the results are in Appendix C.
Domains % Vulnerable (ON Baseline cut‐offs)
2 years FDK group
1 year FDK group
No FDK group
p‐value
Physical Health & Well‐being 26.6% 18.6% 20.7% < 0.001
Social Competence 12.7% 9.4% 11.6% 0.136
Emotional Maturity 15.8% 11.9% 14.6% 0.099
Language & Cognitive Development 12.7% 16.5% 15.8% 0.076
Communication Skills & General Knowledge 15.2% 17.3% 15.6% 0.525
Vulnerable on one or more EDI domains 40.6% 36.0% 36.5% 0.111

Section I: Part A
15
0
10
20
30
40
50
60
70
80
90
100
Physical Health &Well‐being
SocialCompetence
EmotionalMaturity
Language &Cognitive
Development
CommunicationSkills & GeneralKnowledge
2 years FDK group
1 year FDK group
No FDK group
Vulnerability (%) by domain

Section I: Part A
16
Group Comparisons (JK) ELP Year 1 2010/2011
The tables below compare factors that influence EDI results. Comparisons are by demographic information (i.e. gender, age, etc.) and FDK group. Please note that higher mean scores indicate better levels of developmental health at school entry.
The effect size is an accepted indicator of the strength of the relationship between two variables and assesses whether the differences are meaningful or not. Since it is independent of the measurement or sample size, the effect size of a difference between two groups is the best indicator of how meaningful this difference is. In this report, the effect size is computed as follows:
mean(comparison group) – mean(reference group) SD(reference group)
It is customary to interpret the effect sizes of 0 to 0.3 as small, 0.3 to 0.8 as moderate, and greater than 0.8 as large. Negative effect sizes mean the comparison group has a lower mean score than the reference group.
*Note that the reference group used in the calculations of effect size is indicated with an asterisk.
1. Gender
2 years FDK group 1 year FDK group No FDK group
Girls* Boys Effect Size
Girls* Boys Effect Size
Girls* Boys Effect Size Mean SD Mean SD Mean SD Mean SD Mean SD Mean SD
Physical health & Well‐being
8.55 1.45 8.22 1.58 0.23 8.60 1.44 8.30 1.50 0.20 8.62 1.38 8.44 1.53 0.13
Social Competence
8.40 1.74 7.72 2.05 0.40 8.65 1.65 7.86 1.91 0.48 8.57 1.69 7.82 2.10 0.44
Emotional Maturity
8.07 1.47 7.37 1.63 0.48 8.31 1.24 7.50 1.63 0.66 8.25 1.32 7.39 1.66 0.65
Language & Cognitive development
8.29 1.76 7.86 1.97 0.24 8.03 1.91 7.59 2.11 0.23 8.14 1.91 7.77 2.15 0.19
Communication & General knowledge
7.77 2.47 6.94 2.71 0.34 7.64 2.54 6.65 2.78 0.39 7.66 2.58 7.13 2.73 0.21

Section I: Part A
17
2. Age of Child (mean age is 4.96 years)
2 years FDK group 1 year FDK group No FDK group
Above mean age*
Below mean age Effect
Size
Above mean age*
Below mean age Effect
Size
Above mean age*
Below mean age Effect
Size Mean SD Mean SD Mean SD Mean SD Mean SD Mean SD
Physical health & Well‐being
8.57 1.50 8.21 1.52 0.24 8.68 1.27 8.23 1.63 0.36 8.71 1.40 8.35 1.49 0.25
Social Competence
8.26 1.90 7.88 1.93 0.20 8.49 1.75 8.03 1.86 0.26 8.46 1.77 7.94 2.06 0.30
Emotional Maturity
7.84 1.59 7.61 1.57 0.14 8.13 1.42 7.69 1.55 0.31 8.03 1.51 7.62 1.59 0.27
Language & Cognitive development
8.35 1.75 7.81 1.96 0.31 8.29 1.79 7.34 2.12 0.53 8.38 1.77 7.55 2.19 0.47
Communication & General knowledge
7.74 2.53 7.00 2.66 0.29 7.38 2.69 6.92 2.71 0.17 7.78 2.42 7.03 2.84 0.31
3. Children with E/FSL status
2 years FDK group 1 year FDK group No FDK group
Not E/FSL* E/FSL Effect Size
Not E/FSL* E/FSL Effect Size
Not E/FSL* E/FSL Effect Size Mean SD Mean SD Mean SD Mean SD Mean SD Mean SD
Physical health & Well‐being
8.34 1.51 8.52 1.55 ‐0.12 8.44 1.49 8.49 1.41 ‐0.03 8.51 1.45 8.58 1.47 ‐0.05
Social Competence
8.03 1.90 8.17 1.99 ‐0.07 8.34 1.78 7.95 1.95 0.22 8.27 1.92 7.98 1.99 0.15
Emotional Maturity
7.71 1.60 7.75 1.55 ‐0.03 7.96 1.52 7.74 1.40 0.15 7.93 1.52 7.54 1.65 0.26
Language & Cognitive development
8.27 1.82 7.57 1.93 0.38 7.96 1.92 7.24 2.31 0.37 8.14 1.92 7.47 2.26 0.35
Communication & General knowledge
7.78 2.39 6.29 2.89 0.62 7.50 2.54 5.78 2.92 0.68 7.83 2.40 6.25 3.00 0.66

Section I: Part A
18
Subdomain Profiles (Year 1 JK)
Each of the five domains is divided into sub‐domains, except for Communication Skills and General Knowledge. Based on skills and abilities that each sub‐domain represents, children are classified as being at/above developmental expectations (reach the expectations for all or most of the sub‐domain items), in the middle (reach the expectations for some of the sub‐domain items), and below developmental expectations (reach expectations for none or few of the sub‐domain items). Note that the Physical Readiness for School Day and the Physical Independence subdomains do not feature a middle category because of the definitive nature of the questions they are comprised of. The graphs below provide a comparison between the three FDK groups for each of the 16 subdomains. The graphs below are percentages of children in each subdomain category.
Physical Health & Well‐being
Physical readiness for school dayChildren who reach all or almost all of the developmental expectations never or almost never experienced being dressed inappropriately for school activities, or coming to school tired, late or hungry
Physical independenceChildren who reach all or almost all of the developmental expectations are independent in looking after their needs, have an established hand preference, are well coordinated, and do not suck a thumb/finger
Gross and fine motor skillsChildren who reach all or almost all of the developmental expectations have an excellent ability to physically tackle the school day and have excellent or good gross and fine motor skills.
8
92
4
96
5
95
0
20
40
60
80
100
Few / None All / Almost all
2 yrs FDK group
1 yr FDK group
No FDK group
18
82
17
83
14
86
0
20
40
60
80
100
Few / None All / Almost
2 yrs FDK group
1 yr FDK group
No FDK group
2824
48
38
19
43
3022
48
0
20
40
60
Few / None Some All / Almost
2 yrs FDK group
1 yr FDK group
No FDK group

Section I: Part A
19
Social Competence
Overall social competenceChildren who reach all or almost all of the developmental expectations have excellent or good overall social development, very good ability to get along with other children and play with various children; usually cooperative and self‐confident.
Responsibility and respectChildren who reach all or almost all of the developmental expectations always or most of the time show respect for others and for property, follow rules and take care of materials, accept responsibility for actions, and show self‐control.
Approaches to learning Children who reach all or almost all of the developmental expectations always or most of the time work neatly, work independently, solve problems, follow instructions and class routines, and easily adjust to changes.
Readiness to explore new thingsChildren who reach all or almost all of the developmental expectations are curious about the surrounding world and are eager to explore new books, toys, and games.
11
45 44
8
48 45
9
44 47
0
20
40
60
80
100
Few / None Some All / Almost
2 yrs FDK group
1 yr FDK group
No FDK group
719
74
417
79
717
76
0
20
40
60
80
100
Few / None Some All / Almostall
2 yrs FDK group
1 yr FDK group
No FDK group
12
32
57
11
28
61
11
28
61
0
20
40
60
80
100
Few / None Some All / Almostall
2 yrs FDK group
1 yr FDK group
No FDK group
3
19
78
316
81
418
78
0
20
40
60
80
100
Few / None Some All / Almostall
2 yrs FDK group
1 yr FDK group
No FDK group

Section I: Part A
20
Emotional Maturity
Prosocial and helping behaviourChildren who reach all or almost all of the developmental expectations show most of the helping behaviours: helping someone hurt, sick or upset, offering to help spontaneously, invite bystanders to join in
Anxious and fearful behaviourChildren who reach all or almost all of the developmental expectations rarely or never show most of the anxious behaviours; they are happy and able to enjoy school, and are comfortable being left at school by caregivers
Aggressive behaviour Children who reach all or almost all of the developmental expectations rarely or never show most of the anxious behaviours; they are happy and able to enjoy school, and are comfortable being left at school by caregivers
Hyperactivity and inattentionChildren who reach all or almost all of the developmental expectations never show most of the hyperactive behaviours; they are able to concentrate, settle to chosen activities, wait their turn, and most of the time think before doing something
3832
263139
2938
25 30
0
20
40
60
80
100
Few / None Some All / Almostall
2 yrs FDK group
1 yr FDK group
No FDK group
212
85
312
85
212
86
0
20
40
60
80
100
Few / None Some All / Almostall
2 yrs FDK group
1 yr FDK group
No FDK group
11 9
80
8 8
84
10 7
83
0
20
40
60
80
100
Few / None Some All / Almostall
2 yrs FDK group
1 yr FDK group
No FDK group
14 14
72
13 14
73
15 16
69
0
20
40
60
80
100
Few / None Some All / Almostall
2 yrs FDK group
1 yr FDK group
No FDK group

Section I: Part A
21
Language and Cognitive Development
Basic literacy Children who reach all or almost all of the developmental expectations have all the basic literacy skills: know how to handle a book, can identify some letters and attach sounds to some letters, show awareness of rhyming words, know the writing directions, and are able to write their own name
Interest in literacy / numeracy and memory Children who reach all or almost all of the developmental expectations show interest in books and reading, math and numbers, and have no difficulty with remembering things name
Advanced literacy Children who reach all or almost all of the developmental expectations have at least half of the advanced literacy skills: reading simple, complex words or sentences, writing voluntarily, writing simple words or sentences
Basic numeracy Children who reach all or almost all of the developmental expectations have all the basic numeracy skills: can count to 20 and recognize shapes and numbers, compare numbers, sort and classify, use one‐to‐one correspondence, and understand simple time concepts
1422
64
17 21
62
17 19
64
0
20
40
60
80
100
Few / None Some All / Almostall
2 yrs FDK group
1 yr FDK group
No FDK group
12 13
73
15 13
69
15 11
74
0
20
40
60
80
100
Few / None Some All / Almostall
2 yrs FDK group
1 yr FDK group
No FDK group
2314
61
2916
53
2615
55
0
20
40
60
80
100
Few / None Some All / Almostall
2 yrs FDK group
1 yr FDK group
No FDK group
19 14
65
2111
68
2010
69
0
20
40
60
80
100
Few / None Some All / Almostall
2 yrs FDK group
1 yr FDK group
No FDK group

Section I: Part A
22
Communications Skills and General Knowledge
Communication skills and General knowledge Children who reach all or almost all of the developmental expectations have excellent or very good communication skills; can communicate easily and effectively, can participate in story‐telling or imaginative play, articulates clearly, show adequate general knowledge, and are proficient in their native language
32 284038
24
383424
42
0
20
40
60
80
100
Few / None Some All / Almostall
2 yrs FDK group
1 yr FDK group
No FDK group

Section I: Part A
23
Descriptive Statistics (JK Year 1)
Comparisons of KPS Groups
The children participating in the FDK ELP project received a Kindergarten Parent Survey (KPS) for their parent/guardian to complete. Out of the 2,255 Junior Kindergarten children that were valid for ELP analyses, 924 had a KPS completed by their parent/guardian. The table below compares demographic variables for JK children with KPS and those without KPS.
Gender Count (%)
p‐value KPS No KPS
Girl 454 49.1% 689 51.8% .219
Boy 470 50.9% 642 48.2%
KPS No KPS p‐value
N 924 1331 0.943
Mean Age 4.99 4.99
English / French as a second language
Count (%)
KPS No KPS
No E/FSL 711 76.9% 967 72.7%
E/FSL 212 22.9% 363 27.3%
Missing 1 0.1% 1 0.1%
French Immersion Count (%)
KPS No KPS
Not French Immersion 836 90.5% 1230 92.4%
French Immersion 86 9.3% 99 7.4%
Missing 2 0.2% 2 0.2%
Aboriginal status Count (%)
KPS No KPS
Not Aboriginal 814 88.1% 1127 84.7%
Aboriginal 7 0.8% 13 1.0%
Missing 103 11.1% 191 14.4%

Section I: Part A
24
The table below illustrates the average domain scores for those children with a completed KPS and those without. Children in the No KPS group have significantly lower mean domain scores in all five EDI domains than children in the KPS group.
Domain KPS No KPS
p‐value N Mean SD N Mean SD
Physical Health & Well‐being 924 8.70 1.37 1330 8.27 1.54 <.001
Social Competence 924 8.49 1.73 1331 7.94 1.98 <.001
Emotional Maturity 917 8.01 1.45 1323 7.67 1.61 <.001
Language & Cognitive Development 918 8.32 1.71 1327 7.72 2.10 <.001
Communication Skills & General Knowledge
924 7.75 2.43 1331 7.01 2.77 <.001
The table below indicates the percentage of children that are in the lowest 10th percentile for each domain, based on the number of children valid for analyses. Children in the No KPS group have significantly higher vulnerability rates than children in the KPS group.
KPS No KPS p‐value
N vuln. % vuln. N vuln. % vuln.
Physical Health & Well‐being 149 16.1% 358 26.9% <.001
Social Competence 75 8.1% 183 13.7% <.001
Emotional Maturity 98 10.7% 223 16.9% <.001
Language & Cognitive Development 84 9.2% 247 18.6% <.001
Communication Skills & General Knowledge
109 11.8% 250 18.8% <.001
Vulnerable on one or more EDI domains 275 29.8% 583 43.8% <.001

Section I: Part A
25
Domain Scores by FDK Group and KPS Group
2 years FDK group 1 year FDK group No FDK group
No KPS KPS No KPS KPS No KPS KPS
Mean SD Mean SD Mean SD Mean SD Mean SD Mean SD
Physical Health & Well‐being
8.22 1.59 8.63 1.39 8.30 1.50 8.71 1.40 8.32 1.53 8.79 1.32
Social Competence
7.82 2.02 8.44 1.71 8.02 1.96 8.66 1.48 8.02 1.95 8.41 1.91
Emotional Maturity
7.58 1.63 7.94 1.50 7.75 1.59 8.18 1.29 7.72 1.61 7.95 1.50
Language & Cognitive Development
7.83 1.98 8.45 1.64 7.53 2.19 8.29 1.61 7.76 2.17 8.20 1.84
Communication Skills & General Knowledge
7.05 2.70 7.83 2.42 6.83 2.84 7.68 2.39 7.13 2.79 7.72 2.48
Vulnerability by FDK Group and KPS group
2 years FDK group 1 year FDK group No FDK group
KPS No KPS KPS No KPS KPS No KPS
N vuln.
% vuln.
N vuln.
% vuln.
N vuln.
% vuln.
N vuln.
% vuln.
N vuln.
% vuln.
N vuln.
% vuln.
Physical Health & Well‐being
73 19.8 170 31.2 30 12.7 88 22.1 46 14.4 100 25.8
Social Competence
33 9.0 83 15.2 10 4.2 50 12.5 32 10.0 50 12.9
Emotional Maturity
44 12.0 100 18.3 20 8.4 56 14.0 34 10.7 67 17.3
Language & Cognitive Development
26 7.1 89 16.3 20 8.4 85 21.3 38 11.9 73 18.9
Communication Skills & General Knowledge
39 10.6 100 18.3 29 12.2 81 20.3 41 12.9 69 17.8
Vulnerable on one or more EDI domains
116 31.5 255 46.8 62 26.2 167 41.9 97 30.4 161 41.6

Section I: Part B
26
Section I: Year 1 Part B. Senior Kindergarten
Number of Senior Kindergarten Children in ELP EDI and KPS Analyses
1. Total SK ELP (with consent) questionnaires completed. 2. Questionnaires for children in class more than 1 month. 3. Questionnaires for children in class other than in class more than 1 month
a. in class <1 month b. moved out of class c. moved out of school d. other
4. Questionnaires without Special Needs. 5. Questionnaires labelled as Special Needs or missing Special Needs assignation. 6. Special Needs children with incomplete questionnaires (missing more than one domain). 7. Questionnaires missing Special Needs assignation. 8. Questionnaires valid for analyses in reports for children with Special Needs. 9. Non Special Needs children with incomplete questionnaires (missing more than one domain) 10. Children missing an FDK status group. 11. Questionnaires valid for analyses in reports for children without Special Needs.
a. 2 years FDK group b. 1 year FDK group c. No FDK group
1.) 1584
2.) 1576
4.) 1481
9.) 2
11.) 1477
11.a) 724
11.b) 383
11.c) 370
10.) 2
5.) 95
6.) 1
7.) 14
8.) 80
3.) 8
3.a) 1
3.b) 0
3.c) 7
3.d) 0
Section I: Part B
27
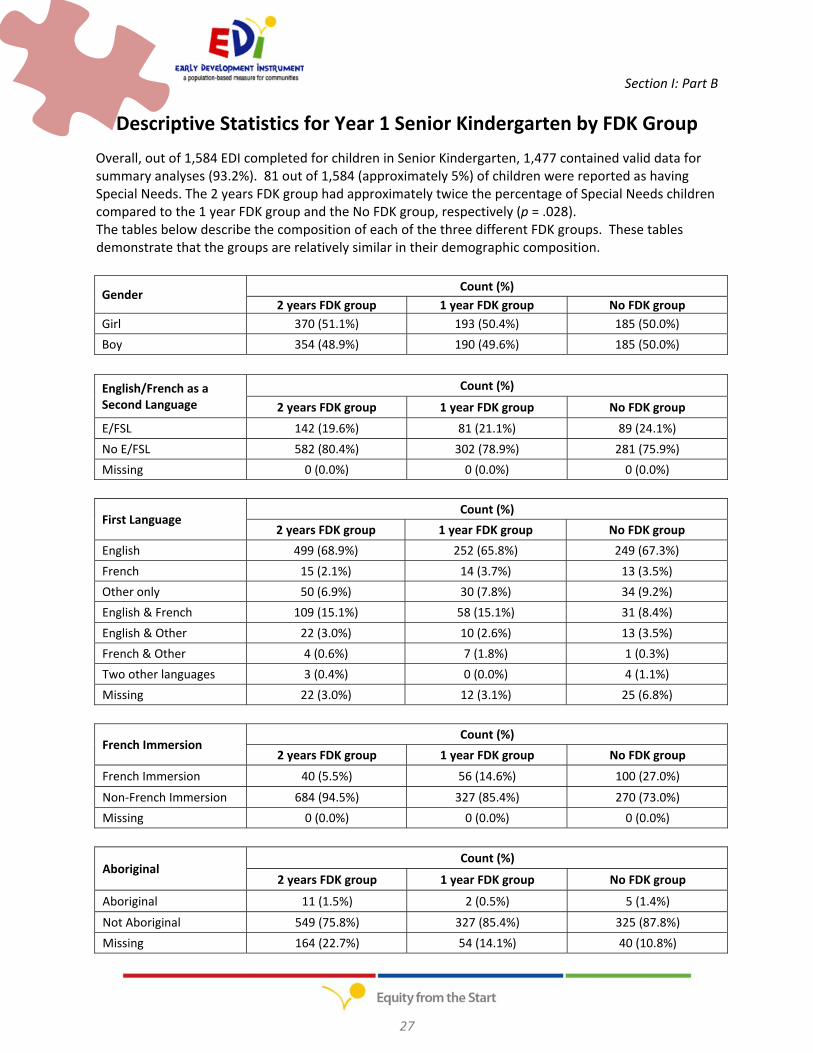
Descriptive Statistics for Year 1 Senior Kindergarten by FDK Group
Overall, out of 1,584 EDI completed for children in Senior Kindergarten, 1,477 contained valid data for summary analyses (93.2%). 81 out of 1,584 (approximately 5%) of children were reported as having Special Needs. The 2 years FDK group had approximately twice the percentage of Special Needs children compared to the 1 year FDK group and the No FDK group, respectively (p = .028). The tables below describe the composition of each of the three different FDK groups. These tables demonstrate that the groups are relatively similar in their demographic composition.
Gender Count (%)
2 years FDK group 1 year FDK group No FDK group
Girl 370 (51.1%) 193 (50.4%) 185 (50.0%)
Boy 354 (48.9%) 190 (49.6%) 185 (50.0%)
English/French as a Second Language
Count (%)
2 years FDK group 1 year FDK group No FDK group
E/FSL 142 (19.6%) 81 (21.1%) 89 (24.1%)
No E/FSL 582 (80.4%) 302 (78.9%) 281 (75.9%)
Missing 0 (0.0%) 0 (0.0%) 0 (0.0%)
First Language Count (%)
2 years FDK group 1 year FDK group No FDK group
English 499 (68.9%) 252 (65.8%) 249 (67.3%)
French 15 (2.1%) 14 (3.7%) 13 (3.5%)
Other only 50 (6.9%) 30 (7.8%) 34 (9.2%)
English & French 109 (15.1%) 58 (15.1%) 31 (8.4%)
English & Other 22 (3.0%) 10 (2.6%) 13 (3.5%)
French & Other 4 (0.6%) 7 (1.8%) 1 (0.3%)
Two other languages 3 (0.4%) 0 (0.0%) 4 (1.1%)
Missing 22 (3.0%) 12 (3.1%) 25 (6.8%)
French Immersion Count (%)
2 years FDK group 1 year FDK group No FDK group
French Immersion 40 (5.5%) 56 (14.6%) 100 (27.0%)
Non‐French Immersion 684 (94.5%) 327 (85.4%) 270 (73.0%)
Missing 0 (0.0%) 0 (0.0%) 0 (0.0%)
Aboriginal Count (%)
2 years FDK group 1 year FDK group No FDK group
Aboriginal 11 (1.5%) 2 (0.5%) 5 (1.4%)
Not Aboriginal 549 (75.8%) 327 (85.4%) 325 (87.8%)
Missing 164 (22.7%) 54 (14.1%) 40 (10.8%)

Section I: Part B
28
ELP Year 1 Senior Kindergarten Results 2010/2011 Overall Comparisons by FDK Group
The EDI was completed for 1,477 non‐Special Needs Senior Kindergarten students in Year 1 of the ELP FDK project. The tables and graph below illustrate descriptive statistics by FDK group.
2 years FDK group
1 year FDK group
No FDK group
p‐value
Girls 370 193 185 0.936
Boys 354 190 185
2 years FDK group
1 year FDK group
No FDK group
p‐value
N 724 383 370
0.500 Mean Age 5.87 5.86 5.89
SD 0.36 0.37 0.33
The p‐values in the above tables demonstrate that the three groups do not statistically differ in terms of the composition of gender or age.
The table below outlines the mean scores and standard deviations for each domain by FDK group. The p‐values in this table indicate that there are significant group differences in the Physical Health and Well‐being domain, the Language and Cognitive Development domain, and the Communication and General knowledge domain. Results from post hoc analyses revealed no significant differences on the Physical Health and Well‐being domain between the 2 years FDK group and the 1 year FDK group (p=.059), between the 2 years FDK group and the No FDK group (p=.161), or between the 1 year FDK group and the No FDK group (p=.927). Similarly, post hoc analyses found no significant differences in the Language and Cognitive Development domain between the 2 years FDK group and the 1 year FDK group (p=.162), between the 2 years FDK group and the No FDK group (p=.069), or between the 1 year FDK group and the No FDK group (p=.929). Post hoc analyses revealed that the 2 years FDK group had significantly higher Communication Skills and General Knowledge domain scores than the No FDK group (p=.023).
Note: As of the late summer 2012, neighbourhood‐level index of socioeconomic status (Social Risk Index, or SRI), became available. The domain score comparisons by FDK group were repeated with SRI as a covariate, and the results are in Appendix D.

Section I: Part B
29
.00
2.00
4.00
6.00
8.00
10.00
Physical Health& Well‐being
SocialCompetence
EmotionalMaturity
Language &Cognitive
Development
CommunicationSkills & GeneralKnowledge
2 yrs FDK group
1 yr FDK group
No FDK group
Domains Mean (SD)
p‐value 2 years FDK group
1 year FDK group
No FDK group
Physical Health & Well‐being 8.83 (1.35) 8.63 (1.37) 8.66 (1.48) 0.040
Social Competence 8.39 (1.83) 8.49 (1.92) 8.51 (1.72) 0.483
Emotional Maturity 8.00 (1.51) 8.11 (1.61) 8.18 (1.49) 0.190
Language & Cognitive Development 9.09 (1.31) 8.93 (1.45) 8.90 (1.46) 0.045
Communication Skills & General Knowledge
7.99 (2.42) 7.77 (2.42) 7.58 (2.51) 0.027
Comparison of Means

Section I: Part B
30
Percentage of Vulnerable Children (Year 1 SK)
“Vulnerable” describes children whose domain scores are in the lowest 10th percentile of a distribution. The table and graph below illustrate the percentage of children in each FDK group who score is in the lowest 10th percentile based on the Ontario Baseline distribution.
The p‐values in the below table illustrate that there are no significant differences in vulnerability between the three groups in any of the five domains.
Note: As of the late summer 2012, neighbourhood‐level index of socioeconomic status (Social Risk Index, or SRI), became available. The vulnerability comparisons by FDK group were repeated with SRI as a covariate, and the results are in Appendix E.
EDI Domains
% Vulnerable (ON Baseline cut‐offs)
2 years FDK group
1 year FDK group
No FDK group
p‐value
Physical Health & Well‐being 14.7% 16.2% 17.8% 0.393
Social Competence 9.7% 9.4% 9.2% 0.966
Emotional Maturity 10.7% 13.1% 9.5% 0.271
Language & Cognitive Development 4.3% 6.8% 5.4% 0.201
Communication Skills & General Knowledge 11.9% 10.2% 12.7% 0.539
Vulnerable on one or more EDI domains 28.5% 28.7% 28.1% 0.983

Section I: Part B
31
0
20
40
60
80
100
Physical Health& Well‐being
SocialCompetence
EmotionalMaturity
Language &Cognitive
Development
CommunicationSkills & GeneralKnowledge
Vulnerable onone or more
2 yrs FDK group
1 yr FDK group
No FDK group
Vulnerability (%) by Domain

Section I: Part B
32
Group Comparisons (SK) ELP Year 1 2010/2011
The tables below compare factors that influence EDI results. Comparisons are by demographic information (i.e. gender, age, etc.) and FDK group. Please note that higher mean scores indicate better levels of readiness‐to‐learn at school
The effect size is an accepted indicator of the strength of the relationship between two variables and assesses whether the differences are meaningful or not. Since it is independent of the measurement or sample size, the effect size of a difference between two groups is the best indicator of how meaningful this difference is. In this report, the effect size is computed as follows:
mean(comparison group) – mean(reference group) SD(reference group)
It is customary to interpret the effect sizes of 0 to 0.3 as small, 0.3 to 0.8 as moderate, and greater than 0.8 as large. Negative effect sizes mean the comparison group has a lower mean score than the reference group.
*Note that the reference group used in the calculations of effect size is indicated with an asterisk.
1. Gender
2 years FDK group 1 year FDK group No FDK group
Girls* Boys Effect Size
Girls* Boys Effect Size
Girls* Boys Effect Size Mean SD Mean SD Mean SD Mean SD Mean SD Mean SD
Physical health & Well‐being
8.90 1.35 8.75 1.34 0.11 8.70 1.44 8.55 1.29 0.10 8.72 1.46 8.61 1.50 0.08
Social Competence
8.73 1.72 8.03 1.87 0.41 8.72 1.85 8.26 1.96 0.25 8.74 1.67 8.28 1.75 0.28
Emotional Maturity
8.37 1.38 7.62 1.55 0.54 8.42 1.49 7.80 1.67 0.42 8.49 1.48 7.86 1.43 0.43
Language & Cognitive development
9.25 1.22 8.93 1.39 0.26 9.02 1.43 8.85 1.47 0.12 9.05 1.45 8.75 1.46 0.21
Communication & General knowledge
8.29 2.31 7.67 2.49 0.27 7.97 2.38 7.56 2.44 0.17 7.84 2.52 7.31 2.48 0.21

Section I: Part B
33
2. Age of Child (mean age is 5.89 years)
2 years FDK group 1 year FDK group No FDK group
Above mean age*
Below mean age Effect
Size
Above mean age*
Below mean age Effect
Size
Above mean age*
Below mean age Effect
Size Mean SD Mean SD Mean SD Mean SD Mean SD Mean SD
Physical health & Well‐being
8.97 1.23 8.68 1.44 0.24 8.76 1.32 8.50 1.40 0.20 8.78 1.42 8.54 1.54 0.17
Social Competence
8.55 1.82 8.23 1.82 0.18 8.67 1.74 8.32 2.07 0.20 8.50 1.74 8.53 1.71 ‐0.02
Emotional Maturity
8.08 1.54 7.92 1.48 0.10 8.27 1.58 7.95 1.63 0.20 8.21 1.51 8.14 1.47 0.05
Language & Cognitive development
9.25 1.24 8.94 1.37 0.25 9.18 1.23 8.69 1.60 0.40 8.98 1.44 8.81 1.48 0.12
Communication & General knowledge
8.15 2.37 7.82 2.46 0.14 8.11 2.25 7.44 2.53 0.30 7.75 2.45 7.39 2.56 0.15
3. Children with E/FSL status
2 years FDK group 1 year FDK group No FDK group
Not E/FSL* E/FSL Effect Size
Not E/FSL* E/FSL Effect Size
Not E/FSL* E/FSL Effect Size Mean SD Mean SD Mean SD Mean SD Mean SD Mean SD
Physical health & Well‐being
8.81 1.40 8.91 1.11 ‐0.07 8.59 1.38 8.75 1.32 ‐0.12 8.55 1.53 9.03 1.23 ‐0.31
Social Competence
8.51 1.78 7.89 1.94 0.35 8.42 1.95 8.75 1.78 ‐0.17 8.50 1.72 8.56 1.75 ‐0.03
Emotional Maturity
8.08 1.51 7.69 1.49 0.26 8.10 1.65 8.14 1.46 ‐0.02 8.18 1.51 8.18 1.42 0.00
Language & Cognitive development
9.17 1.29 8.79 1.39 0.29 8.98 1.45 8.77 1.45 0.14 8.93 1.48 8.79 1.40 0.09
Communication & General knowledge
8.26 2.26 6.89 2.72 0.61 7.97 2.33 7.01 2.57 0.41 7.78 2.34 6.95 2.91 0.35

Section I: Part B
34
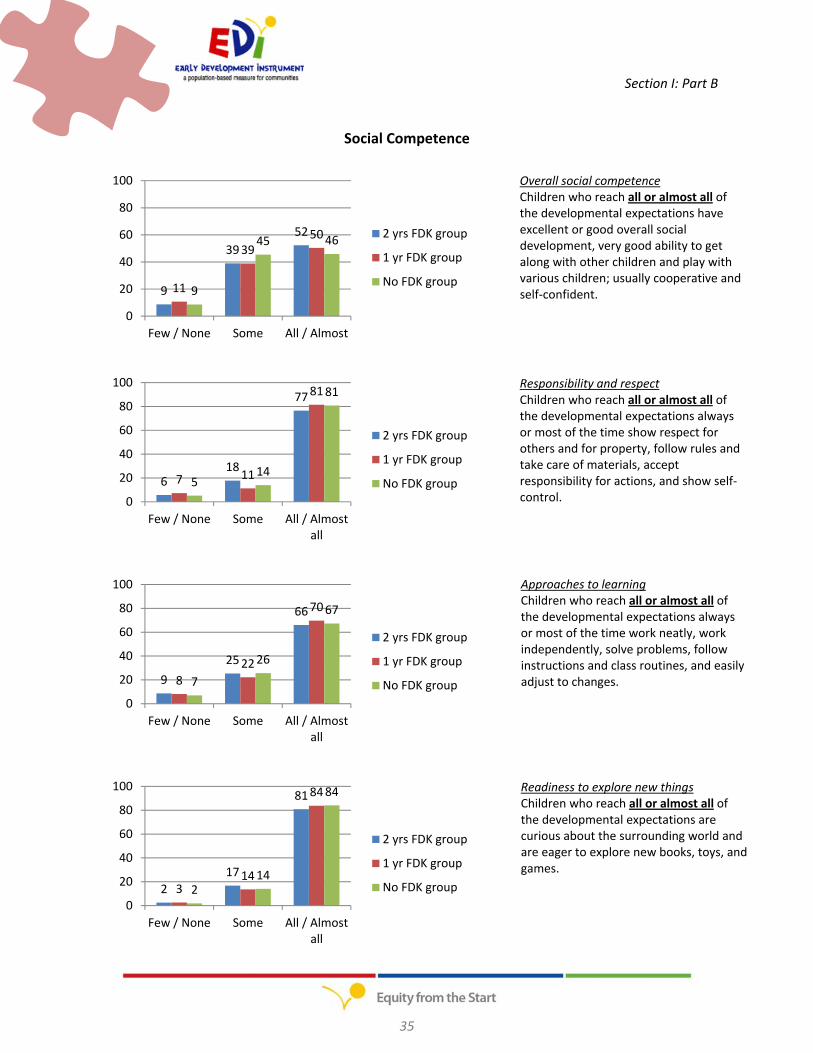
Subdomain Profiles (Year 1 SK)
Each of the five domains is divided into sub‐domains, except for Communication Skills and General Knowledge. Based on skills and abilities that each sub‐domain represents, children are classified as being at/above developmental expectations (reach the expectations for all or most of the sub‐domain items), in the middle (reach the expectations for some of the sub‐domain items), and below developmental expectations (reach expectations for none or few of the sub‐domain items). Note that the Physical readiness for school day and the Physical independence subdomains do not feature a middle category because of the definitive nature of the questions they are comprised of.
The graphs below provide a comparison between the three FDK groups for each of the 16 subdomains. The graphs below are percentages of children in each subdomain category.
Physical Health & Well‐being
Physical readiness for school dayChildren who reach all or almost all of the developmental expectations never or almost never experienced being dressed inappropriately for school activities, or coming to school tired, late or hungry
Physical independenceChildren who reach all or almost all of the developmental expectations are independent in looking after their needs, have an established hand preference, are well coordinated, and do not suck a thumb/finger
Gross and fine motor skillsChildren who reach all or almost all of the developmental expectations have an excellent ability to physically tackle the school day and have excellent or good gross and fine motor skills.
5
94
5
95
5
95
0
20
40
60
80
100
Few / None All / Almost all
2 yrs FDK group
1 yr FDK group
No FDK group
10
90
16
84
10
90
0
20
40
60
80
100
Few / None All / Almost
2 yrs FDK group
1 yr FDK group
No FDK group
19 17
64
23 22
55
2820
51
0
20
40
60
80
Few / None Some All / Almost
2 yrs FDK group
1 yr FDK group
No FDK group
Section I: Part B
35
Social Competence
Overall social competenceChildren who reach all or almost all of the developmental expectations have excellent or good overall social development, very good ability to get along with other children and play with various children; usually cooperative and self‐confident.
Responsibility and respectChildren who reach all or almost all of the developmental expectations always or most of the time show respect for others and for property, follow rules and take care of materials, accept responsibility for actions, and show self‐control.
Approaches to learning Children who reach all or almost all of the developmental expectations always or most of the time work neatly, work independently, solve problems, follow instructions and class routines, and easily adjust to changes.
Readiness to explore new thingsChildren who reach all or almost all of the developmental expectations are curious about the surrounding world and are eager to explore new books, toys, and games.
9
39
52
11
3950
9
45 46
0
20
40
60
80
100
Few / None Some All / Almost
2 yrs FDK group
1 yr FDK group
No FDK group
618
77
7 11
81
514
81
0
20
40
60
80
100
Few / None Some All / Almostall
2 yrs FDK group
1 yr FDK group
No FDK group
9
25
66
8
22
70
7
26
67
0
20
40
60
80
100
Few / None Some All / Almostall
2 yrs FDK group
1 yr FDK group
No FDK group
2
17
81
314
84
214
84
0
20
40
60
80
100
Few / None Some All / Almostall
2 yrs FDK group
1 yr FDK group
No FDK group

Section I: Part B
36
Emotional Maturity
Prosocial and helping behaviourChildren who reach all or almost all of the developmental expectations show most of the helping behaviours: helping someone hurt, sick or upset, offering to help spontaneously, invite bystanders to join in
Anxious and fearful behaviourChildren who reach all or almost all of the developmental expectations rarely or never show most of the anxious behaviours; they are happy and able to enjoy school, and are comfortable being left at school by caregivers
Aggressive behaviour Children who reach all or almost all of the developmental expectations rarely or never show most of the anxious behaviours; they are happy and able to enjoy school, and are comfortable being left at school by caregivers
Hyperactivity and inattentionChildren who reach all or almost all of the developmental expectations never show most of the hyperactive behaviours; they are able to concentrate, settle to chosen activities, wait their turn, and most of the time think before doing something
29 33 3525
3341
32 2740
0
20
40
60
80
100
Few / None Some All / Almostall
2 yrs FDK group
1 yr FDK group
No FDK group
313
84
29
88
311
86
0
20
40
60
80
100
Few / None Some All / Almostall
2 yrs FDK group
1 yr FDK group
No FDK group
9 7
83
10 7
83
7 6
87
0
20
40
60
80
100
Few / None Some All / Almostall
2 yrs FDK group
1 yr FDK group
No FDK group
13 14
73
12 15
72
10 9
80
0
20
40
60
80
100
Few / None Some All / Almostall
2 yrs FDK group
1 yr FDK group
No FDK group

Section I: Part B
37
Language and Cognitive Development
Basic literacy Children who reach all or almost all of the developmental expectations have all the basic literacy skills: know how to handle a book, can identify some letters and attach sounds to some letters, show awareness of rhyming words, know the writing directions, and are able to write their own name
Interest in literacy / numeracy and memory Children who reach all or almost all of the developmental expectations show interest in books and reading, math and numbers, and have no difficulty with remembering things name
Advanced literacy Children who reach all or almost all of the developmental expectations have at least half of the advanced literacy skills: reading simple, complex words or sentences, writing voluntarily, writing simple words or sentences
Basic numeracy Children who reach all or almost all of the developmental expectations have all the basic numeracy skills: can count to 20 and recognize shapes and numbers, compare numbers, sort and classify, use one‐to‐one correspondence, and understand simple time concepts
314
83
411
84
512
83
0
20
40
60
80
100
Few / None Some All / Almostall
2 yrs FDK group
1 yr FDK group
No FDK group
10 9
80
147
78
11 13
76
0
20
40
60
80
100
Few / None Some All / Almostall
2 yrs FDK group
1 yr FDK group
No FDK group
8 6
85
10 7
84
12 7
79
0
20
40
60
80
100
Few / None Some All / Almostall
2 yrs FDK group
1 yr FDK group
No FDK group
6 6
87
7 5
87
7 8
85
0
20
40
60
80
100
Few / None Some All / Almostall
2 yrs FDK group
1 yr FDK group
No FDK group

Section I: Part B
38
Communications Skills and General Knowledge
Communication skills and General knowledge Children who reach all or almost all of the developmental expectations have excellent or very good communication skills; can communicate easily and effectively, can participate in story‐telling or imaginative play, articulates clearly, show adequate general knowledge, and are proficient in their native language
26 21
53
28 28
4433
23
44
0
20
40
60
80
100
Few / None Some All / Almostall
2 yrs FDK group
1 yr FDK group
No FDK group

Section I: Part B
39
Descriptive Statistics (Year 1 SK) Comparisons of KPS Groups
The children participating in the FDK ELP project received a Kindergarten Parent Survey (KPS) for their parent/guardian to complete. Out of the 1,477 Senior Kindergarten children that were valid for ELP analyses, 581 had a KPS completed by their parent/guardian. The table below compares demographic variables for SK children with KPS and those without KPS.
Gender Count (%)
p‐value KPS No KPS
Girl 299 51.5% 449 50.1% 0.632
Boy 282 48.5% 447 49.9%
KPS No KPS p‐value
N 581 896 .612
Mean Age 5.87 5.87
English / French as a second language
Count (%)
KPS No KPS
No E/FSL 485 83.5% 680 75.9%
E/FSL 96 16.5% 216 24.1%
Missing 0 0% 0 0%
French Immersion Count (%)
KPS No KPS
Not French Immersion 463 79.7% 818 91.3%
French Immersion 118 20.3% 78 8.7%
Missing 0 0% 0 0%
Aboriginal status Count (%)
KPS No KPS
Not Aboriginal 474 81.6% 727 81.1%
Aboriginal 7 1.2% 11 1.2%
Missing 100 17.2% 158 17.6%

Section I: Part B
40
The table below illustrates the average domain scores for those children with a completed KPS and those without. Children in the No KPS group have significantly lower mean domain scores on all five EDI domains than children in the KPS group.
Domain KPS No KPS
p‐value N Mean SD N Mean SD
Physical Health & Well‐being 580 8.91 1.19 895 8.62 1.49 < .001
Social Competence 581 8.69 1.61 896 8.29 1.94 < .001
Emotional Maturity 580 8.27 1.40 892 7.94 1.60 < .001
Language & Cognitive Development
581 9.22 1.24 894 8.87 1.46 < .001
Communication Skills & General Knowledge
581 8.21 2.29 896 7.58 2.51 < .001
The table below indicates the percentage of children that are in the lowest 10th percentile for each domain, based on the number of children valid for analyses. Children in the No KPS group have significantly higher vulnerability rates than children in the KPS group in every domain except for the Language and Cognitive Development domain.
Domains
KPS No KPS
p‐value N vuln.
%
vuln.
N vuln.
%
vuln.
Physical Health & Well‐being 67 11.6% 167 18.7% < .001
Social Competence 36 6.2% 104 11.6% 0.001
Emotional Maturity 46 7.9% 116 13.0% 0.002
Language & Cognitive Development 23 4.0% 54 6.0% 0.093
Communication Skills & General Knowledge
51 8.8% 121 13.5% 0.006
Vulnerable on one or more EDI domains 124 21.3% 296 33.0% < .001

Section I: Part B
41
Domain Scores by FDK Group and KPS Group
2 years FDK group 1 year FDK group No FDK group
KPS No KPS KPS No KPS KPS No KPS
Mean SD Mean SD Mean SD Mean SD Mean SD Mean SD
Physical Health & Well‐being
9.01 1.15 8.71 1.45 8.70 1.17 8.58 1.47 8.89 1.26 8.50 1.60
Social Competence 8.63 1.68 8.71 1.90 8.74 1.45 8.34 2.14 8.74 1.61 8.35 1.79
Emotional Maturity 8.23 1.40 7.86 1.56 8.30 1.33 8.00 1.75 8.34 1.48 8.06 1.49
Language & Cognitive Development
9.30 1.23 8.97 1.35 9.09 1.32 8.84 1.52 9.19 1.19 8.69 1.60
Communication Skills & General Knowledge
8.40 2.23 7.72 2.50 8.02 2.23 7.62 2.51 8.02 2.43 7.25 2.52
Vulnerability by FDK Group and KPS group
2 years FDK group 1 year FDK group No FDK group
KPS No KPS KPS No KPS KPS No KPS
N % N % N % N % N % N %
Physical Health & Well‐being
31 11.0 75 17.0 18 12.6 44 18.3 18 11.5 48 22.4
Social Competence 18 6.4 52 11.8 6 4.2 30 12.5 12 7.7 22 10.3
Emotional Maturity 23 8.2 54 12.2 12 8.4 38 15.8 11 7.1 24 11.2
Language & Cognitive Development
10 3.5 21 4.8 6 4.2 20 8.3 7 4.5 13 6.1
Communication Skills & General Knowledge
25 8.9 61 13.8 9 6.3 30 12.5 17 10.9 30 14.0
Vulnerable on one or more EDI domains
58 20.6 148 33.5 32 22.4 78 32.5 34 21.8 70 32.7

Section II
42
Section II Descriptive Analyses of EDI and KPS data
Year 2 (2011/2012)

Section II: Part A
43
Section II. Year 2 Part A. Junior Kindergarten
Number of Junior Kindergarten Children in ELP EDI Analyses
1. Total JK ELP (with consent) questionnaires completed. 2. Questionnaires for children in class more than 1 month. 3. Questionnaires for children in class other than in class more than 1 month
a. in class <1 month b. moved out of class c. moved out of school d. other
4. Questionnaires without Special Needs. 5. Questionnaires labelled as Special Needs or missing Special Needs assignation. 6. Special Needs children with incomplete questionnaires (missing more than one domain). 7. Questionnaires missing Special Needs assignation. 8. Questionnaires valid for analyses in reports for children with Special Needs. 9. Non Special Needs children with incomplete questionnaires (missing more than one domain) 10. Children missing an FDK status group. 11. Questionnaires valid for analyses in reports for children without Special Needs.
a. 2 years FDK group b. 1 year FDK group c. No FDK group
1.) 2237
2.) 2218
4.) 2128
9.) 4
11.) 2124
11.a) 831
11.b) 629
11.c) 664
10.) 0
5.) 90
6.) 0
7.) 0
8.) 90
3.) 19
3.a) 2
3.b) 2
3.c) 15
3.d) 0

Section II: Part A
44
Descriptive Statistics for Year 2 Junior Kindergarten by FDK Group
Overall, out of 2,237 EDIs completed for children in Junior Kindergarten, 2,124 contained valid data for summary analyses (94.9%). 90 out of 2,237 (approximately 4%) of children were reported as having Special Needs. These rates were similar across the three study groups.
The tables below describe the composition of each of the three different FDK groups. These tables demonstrate that the groups are relatively similar in their demographic composition.
Gender Count (%)
2 years FDK group 1 year FDK group No FDK group
Girl 408 (49.1%) 303 (48.2%) 357 (53.8%)
Boy 423 (50.9%) 326 (51.8%) 307 (46.2%)
English/French as a Second Language
Count (%)
2 years FDK group 1 year FDK group No FDK group
E/FSL 187 (22.5%) 105 (16.7%) 209 (31.5%)
No E/FSL 644 (77.5%) 524 (83.3%) 454 (68.4%)
Missing 0 (0%) 0 (0%) 1 (0.2%)
First Language Count (%)
2 years FDK group 1 year FDK group No FDK group
English 537 (64.6%) 468 (74.4%) 345 (52.0%)
French 72 (8.7%) 41 (6.5%) 57 (8.6%)
Other only 59 (7.1%) 36 (5.7%) 72 (10.8%)
English & French 92 (11.1%) 33 (5.2%) 123 (18.5%)
English & Other 29 (3.5%) 12 (1.9%) 21 (3.2%)
French & Other 19 (2.3%) 3 (0.5%) 22 (3.3%)
Two other languages 1 (0.1%) 1 (0.2%) 0 (0%)
Missing 22 (2.6%) 35 (5.6%) 0 (0%)
French Immersion Count (%)
2 years FDK group 1 year FDK group No FDK group
French Immersion 13 (1.6%) 2 (0.3%) 105 (15.8%)
Non‐French Immersion 818 (98.4%) 627 (99.7%) 559 (84.2%)
Missing 0 (0%) 0 (0%) 0 (0%)
Aboriginal Count (%)
2 years FDK group 1 year FDK group No FDK group
Aboriginal 18 (2.2%) 7 (1.1%) 4 (0.6%)
Not Aboriginal 744 (89.5%) 552 (87.8%) 625 (94.1%)
Missing 69 (8.3%) 70 (11.1%) 35 (5.3%)

Section II: Part A
45
ELP Year 2 Junior Kindergarten Results 2011/2012
Overall Comparisons by FDK Group
The EDI was completed for 2,124 non‐Special Needs Junior Kindergarten students in Year 2 of the ELP FDK project. The tables and graph below illustrate descriptive statistics by FDK group.
2 years FDK group
1 year FDK group
No FDK group
p‐value
Girls 408 303 357 0.090
Boys 423 326 307
2 years FDK group
1 year FDK group
No FDK group
p‐value
N 831 629 663
0.009 Mean Age 4.76 4.81 4.77
SD 0.30 0.31 0.31
The p‐values in the above tables demonstrate that the three groups do not statistically differ in terms of the composition of gender. However, there was a significant difference between the groups in age, with the 1 year FDK group having the highest mean age.
The table below outlines the mean scores and standard deviations for each domain by FDK group. The p‐values in this table indicate that there is a significant difference between the three groups in the domains of Physical Health and Well‐being, Social Competence, Language and Cognitive Development, and Communication Skills and General Knowledge. Post‐hoc analyses demonstrated that the No FDK group had significantly higher domain scores than the 2 years FDK group and the 1 year FDK group in Physical Health and Well‐being (The 2 years FDK group p = .001 and The 1 year FDK group p < .001) and Social Competence (The 2 years FDK group p < .001 and The 1 year FDK group p < .001). Post hoc analyses for the Language and Cognitive Development domain revealed that the 1 year FDK group had significantly higher domain scores than the 2 years FDK group (p = .021). Post hoc analyses for the Communication Skills and General Knowledge domain revealed that the No FDK group had significantly higher domain scores than the 2 years FDK group (p = .024).
Note: As of the late summer 2012, neighbourhood‐level index of socioeconomic status (Social Risk Index, or SRI), became available. The domain score comparisons by FDK group were repeated with SRI as a covariate, and the results are in Appendix F.

Section II: Part A
46
0
2
4
6
8
10
Physical Health& Well‐being
SocialCompetence
EmotionalMaturity
Language &Cognitive
Development
CommunicationSkills & GeneralKnowledge
2 yrs FDK group
1 yr FDK group
No FDK group
Domains Mean (SD)
p‐value 2 years FDK group
1 year FDK group No FDK group
Physical Health & Well‐being 8.47 8.30 8.75 < 0.001
Social Competence 7.96 7.85 8.41 < 0.001
Emotional Maturity 7.52 7.56 7.71 0.072
Language & Cognitive Development
7.42 7.71 7.49 0.023
Communication Skills & General Knowledge
7.30 7.07 7.46 0.031
Comparison of Means
Section II: Part A
47
Percentage of Vulnerable Children (Year 2 JK)
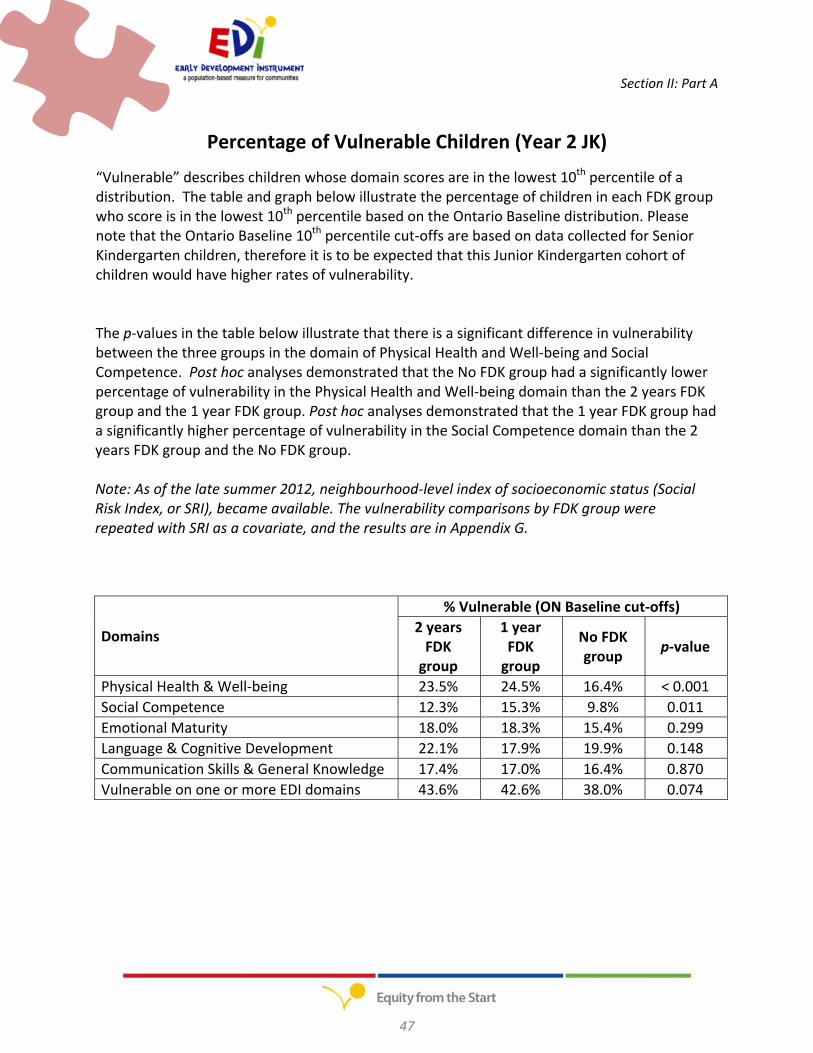
“Vulnerable” describes children whose domain scores are in the lowest 10th percentile of a distribution. The table and graph below illustrate the percentage of children in each FDK group who score is in the lowest 10th percentile based on the Ontario Baseline distribution. Please note that the Ontario Baseline 10th percentile cut‐offs are based on data collected for Senior Kindergarten children, therefore it is to be expected that this Junior Kindergarten cohort of children would have higher rates of vulnerability.
The p‐values in the table below illustrate that there is a significant difference in vulnerability between the three groups in the domain of Physical Health and Well‐being and Social Competence. Post hoc analyses demonstrated that the No FDK group had a significantly lower percentage of vulnerability in the Physical Health and Well‐being domain than the 2 years FDK group and the 1 year FDK group. Post hoc analyses demonstrated that the 1 year FDK group had a significantly higher percentage of vulnerability in the Social Competence domain than the 2 years FDK group and the No FDK group.
Note: As of the late summer 2012, neighbourhood‐level index of socioeconomic status (Social Risk Index, or SRI), became available. The vulnerability comparisons by FDK group were repeated with SRI as a covariate, and the results are in Appendix G.
Domains
% Vulnerable (ON Baseline cut‐offs)
2 years FDK group
1 year FDK group
No FDK group
p‐value
Physical Health & Well‐being 23.5% 24.5% 16.4% < 0.001
Social Competence 12.3% 15.3% 9.8% 0.011
Emotional Maturity 18.0% 18.3% 15.4% 0.299
Language & Cognitive Development 22.1% 17.9% 19.9% 0.148
Communication Skills & General Knowledge 17.4% 17.0% 16.4% 0.870
Vulnerable on one or more EDI domains 43.6% 42.6% 38.0% 0.074

Section II: Part A
48
0
10
20
30
40
50
60
70
80
90
100
Physical Health &Well‐being
SocialCompetence
EmotionalMaturity
Language &Cognitive
Development
CommunicationSkills & GeneralKnowledge
2 yrs FDK group
1 yr FDK group
No FDK group
Vulnerability (%) by domain

Section II: Part A
49
Group Comparisons (JK) ELP Year 2 2011/2012
The tables below compare factors that influence EDI results. Comparisons are by demographic information (i.e. gender, age, etc.) and FDK group. Please note that higher mean scores indicate better levels of readiness‐to‐learn at school.
The effect size is an accepted indicator of the strength of the relationship between two variables and assesses whether the differences are meaningful or not. Since it is independent of the measurement or sample size, the effect size of a difference between two groups is the best indicator of how meaningful this difference is. In this report, the effect size is computed as follows:
mean(comparison group) – mean(reference group) SD(reference group)
It is customary to interpret the effect sizes of 0 to 0.3 as small, 0.3 to 0.8 as moderate, and greater than 0.8 as large. Negative effect sizes mean the comparison group has a lower mean score than the reference group.
*Note that the reference group used in the calculations of effect size is indicated with an asterisk.
4. Gender
2 years FDK group 1 year FDK group No FDK group
Girls* Boys Effect Size
Girls* Boys Effect Size
Girls* Boys Effect Size Mean SD Mean SD Mean SD Mean SD Mean SD Mean SD
Physical health & Well‐being
8.71 1.40 8.24 1.52 0.34 8.41 1.58 8.19 1.37 0.14 8.98 1.24 8.49 1.57 0.40
Social Competence
8.42 1.74 7.52 2.09 0.52 8.27 1.84 7.46 2.08 0.44 8.82 1.54 7.93 1.96 0.58
Emotional Maturity
7.98 1.39 7.08 1.69 0.65 7.94 1.51 7.22 1.71 0.48 8.20 1.40 7.15 1.70 0.75
Language & Cognitive development
7.89 1.92 6.98 2.15 0.47 7.98 1.89 7.46 2.01 0.28 7.69 2.02 7.25 2.12 0.22
Communication & General knowledge
7.69 2.55 6.92 2.71 0.30 7.33 2.58 6.82 2.68 0.20 7.76 2.58 7.10 2.80 0.26

Section II: Part A
50
5. Age of Child (mean age is 4.77 years)
2 years FDK group 1 year FDK group No FDK group
Above mean age*
Below mean age Effect
Size
Above mean age*
Below mean age Effect
Size
Above mean age*
Below mean age Effect
Size Mean SD Mean SD Mean SD Mean SD Mean SD Mean SD
Physical health & Well‐being
8.65 1.41 8.30 1.52 0.25 8.43 1.41 8.14 1.55 0.21 8.94 1.19 8.57 1.60 0.31
Social Competence
8.19 1.89 7.75 2.03 0.23 7.97 2.01 7.72 2.00 0.12 8.60 1.69 8.21 1.88 0.23
Emotional Maturity
7.72 1.65 7.34 1.56 0.23 7.67 1.71 7.44 1.57 0.13 7.90 1.58 7.53 1.66 0.23
Language & Cognitive development
7.91 1.84 6.96 2.20 0.52 8.14 1.79 7.21 2.06 0.52 7.89 1.94 7.09 2.13 0.41
Communication & General knowledge
7.71 2.44 6.91 2.80 0.33 7.43 2.48 6.65 2.76 0.31 7.89 2.62 7.03 2.72 0.33
6. Children with E/FSL status
2 years FDK group 1 year FDK group No FDK group
Not E/FSL* E/FSL Effect Size
Not E/FSL* E/FSL Effect Size
Not E/FSL* E/FSL Effect Size Mean SD Mean SD Mean SD Mean SD Mean SD Mean SD
Physical health & Well‐being
8.35 1.52 8.88 1.22 ‐0.35 8.27 1.48 8.41 1.49 ‐0.09 8.72 1.42 8.82 1.44 ‐0.07
Social Competence
7.90 2.03 8.18 1.76 ‐0.14 7.88 2.00 7.73 2.07 0.07 8.46 1.74 8.27 1.93 0.11
Emotional Maturity
7.49 1.63 7.65 1.53 ‐0.10 7.61 1.65 7.35 1.66 0.16 7.83 1.63 7.45 1.61 0.23
Language & Cognitive development
7.40 2.15 7.49 1.87 ‐0.04 7.87 1.90 6.92 2.12 0.50 7.80 1.87 6.79 2.34 0.54
Communication & General knowledge
7.54 2.61 6.44 2.65 0.42 7.40 2.50 5.40 2.74 0.80 7.87 2.43 6.54 3.03 0.55

Section II: Part A
51
Subdomain Profiles (Year 2 JK)
Each of the five domains is divided into sub‐domains, except for Communication Skills and General Knowledge. Based on skills and abilities that each sub‐domain represents, children are classified as being at/above developmental expectations (reach the expectations for all or most of the sub‐domain items), in the middle (reach the expectations for some of the sub‐domain items), and below developmental expectations (reach expectations for none or few of the sub‐domain items). Note that the Physical readiness for school day and the Physical independence subdomains do not feature a middle category because of the definitive nature of the questions they are comprised of. The graphs below provide a comparison between the three FDK groups for each of the subdomains. The graphs below are percentages of children in each subdomain category.
Physical Health & Well‐being
Physical readiness for school dayChildren who reach all or almost all of the developmental expectations never or almost never experienced being dressed inappropriately for school activities, or coming to school tired, late or hungry
Physical independenceChildren who reach all or almost all of the developmental expectations are independent in looking after their needs, have an established hand preference, are well coordinated, and do not suck a thumb/finger
Gross and fine motor skillsChildren who reach all or almost all of the developmental expectations have an excellent ability to physically tackle the school day and have excellent or good gross and fine motor skills.
5
95
5
95
3
97
0
20
40
60
80
100
Few / None All / Almost all
2 yrs FDK group
1 yr FDK group
No FDK group
18
82
19
81
17
83
0
20
40
60
80
100
Few / None All / Almost
2 yrs FDK group
1 yr FDK group
No FDK group
3021
4939
23
38
2514
61
0
20
40
60
80
Few / None Some All / Almost
2 yrs FDK group
1 yr FDK group
No FDK group

Section II: Part A
52
Social Competence
Overall social competenceChildren who reach all or almost all of the developmental expectations have excellent or good overall social development, very good ability to get along with other children and play with various children; usually cooperative and self‐confident.
Responsibility and respectChildren who reach all or almost all of the developmental expectations always or most of the time show respect for others and for property, follow rules and take care of materials, accept responsibility for actions, and show self‐control.
Approaches to learning Children who reach all or almost all of the developmental expectations always or most of the time work neatly, work independently, solve problems, follow instructions and class routines, and easily adjust to changes.
Readiness to explore new thingsChildren who reach all or almost all of the developmental expectations are curious about the surrounding world and are eager to explore new books, toys, and games.
11
45 43
13
51
36
8
36
56
0
20
40
60
80
100
Few / None Some All / Almost
2 yrs FDK group
1 yr FDK group
No FDK group
819
73
1022
68
614
80
0
20
40
60
80
100
Few / None Some All / Almostall
2 yrs FDK group
1 yr FDK group
No FDK group
13
31
56
14
31
55
9
26
65
0
20
40
60
80
100
Few / None Some All / Almostall
2 yrs FDK group
1 yr FDK group
No FDK group
4
22
75
4
20
77
2
17
81
0
20
40
60
80
100
Few / None Some All / Almostall
2 yrs FDK group
1 yr FDK group
No FDK group

Section II: Part A
53
Emotional Maturity
Prosocial and helping behaviourChildren who reach all or almost all of the developmental expectations show most of the helping behaviours: helping someone hurt, sick or upset, offering to help spontaneously, invite bystanders to join in
Anxious and fearful behaviourChildren who reach all or almost all of the developmental expectations rarely or never show most of the anxious behaviours; they are happy and able to enjoy school, and are comfortable being left at school by caregivers
Aggressive behaviour Children who reach all or almost all of the developmental expectations rarely or never show most of the anxious behaviours; they are happy and able to enjoy school, and are comfortable being left at school by caregivers
Hyperactivity and inattentionChildren who reach all or almost all of the developmental expectations never show most of the hyperactive behaviours; they are able to concentrate, settle to chosen activities, wait their turn, and most of the time think before doing something
4131
23
4431
22
43
25 27
0
20
40
60
80
100
Few / None Some All / Almostall
2 yrs FDK group
1 yr FDK group
No FDK group
413
83
412
84
212
85
0
20
40
60
80
100
Few / None Some All / Almostall
2 yrs FDK group
1 yr FDK group
No FDK group
13 8
79
13 9
79
10 8
82
0
20
40
60
80
100
Few / None Some All / Almostall
2 yrs FDK group
1 yr FDK group
No FDK group
19 16
66
15 14
70
15 13
72
0
20
40
60
80
100
Few / None Some All / Almostall
2 yrs FDK group
1 yr FDK group
No FDK group

Section II: Part A
54
Language and Cognitive Development
Basic literacy Children who reach all or almost all of the developmental expectations have all the basic literacy skills: know how to handle a book, can identify some letters and attach sounds to some letters, show awareness of rhyming words, know the writing directions, and are able to write their own name
Interest in literacy / numeracy and memory Children who reach all or almost all of the developmental expectations show interest in books and reading, math and numbers, and have no difficulty with remembering things name
Advanced literacy Children who reach all or almost all of the developmental expectations have at least half of the advanced literacy skills: reading simple, complex words or sentences, writing voluntarily, writing simple words or sentences
Basic numeracy Children who reach all or almost all of the developmental expectations have all the basic numeracy skills: can count to 20 and recognize shapes and numbers, compare numbers, sort and classify, use one‐to‐one correspondence, and understand simple time concepts
19 16
66
15 14
70
15 13
72
0
20
40
60
80
100
Few / None Some All / Almostall
2 yrs FDK group
1 yr FDK group
No FDK group
18 13
68
2112
67
13 14
73
0
20
40
60
80
100
Few / None Some All / Almostall
2 yrs FDK group
1 yr FDK group
No FDK group
18 13
68
2112
67
13 14
73
0
20
40
60
80
100
Few / None Some All / Almostall
2 yrs FDK group
1 yr FDK group
No FDK group
28
13
56
2412
63
2714
58
0
20
40
60
80
100
Few / None Some All / Almostall
2 yrs FDK group
1 yr FDK group
No FDK group

Section II: Part A
55
Communications Skills and General Knowledge
Communication skills and General knowledge Children who reach all or almost all of the developmental expectations have excellent or very good communication skills; can communicate easily and effectively, can participate in story‐telling or imaginative play, articulates clearly, show adequate general knowledge, and are proficient in their native language
3525
403927
3431 26
43
0
20
40
60
80
100
Few / None Some All / Almostall
2 yrs FDK group
1 yr FDK group
No FDK group

Section II: Part A
56
Descriptive Statistics (Year 2 JK)
Comparisons of KPS Groups
The children participating in the FDK ELP project received a Kindergarten Parent Survey (KPS) for their parent/guardian to complete. Out of the 2,124 Junior Kindergarten children that were valid for ELP analyses, 992 had a KPS completed by their parent/guardian. The table below compares demographic variables for JK children with KPS and those without KPS.
Gender Count (%)
p‐value KPS No KPS
Girl 505 50.9% 563 49.7% 0.602
Boy 487 49.1% 569 50.3%
KPS No KPS p‐value
N 992 1131 0.822
Mean Age 4.78 4.78
English / French as a second language
Count (%)
KPS No KPS
No E/FSL 780 78.6% 842 74.4%
E/FSL 211 21.3% 290 25.6%
Missing 1 0.1% 0 0%
French Immersion Count (%)
KPS No KPS
Not French Immersion 930 93.8% 1074 94.9%
French Immersion 62 6.2% 58 5.1%
Missing 0 0% 0 0%
Aboriginal status Count (%)
KPS No KPS
Not Aboriginal 902 90.9% 1019 90.0%
Aboriginal 6 0.6% 23 2.0%
Missing 84 8.5% 90 8.0%
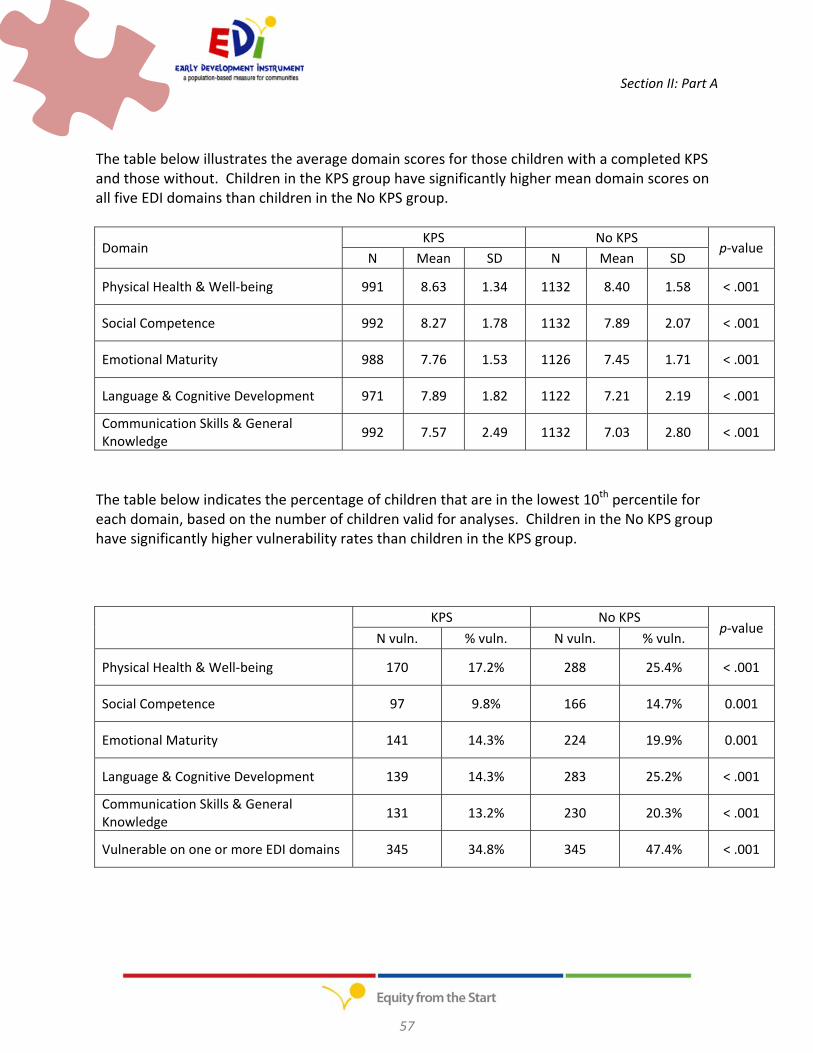
Section II: Part A
57
The table below illustrates the average domain scores for those children with a completed KPS and those without. Children in the KPS group have significantly higher mean domain scores on all five EDI domains than children in the No KPS group.
Domain KPS No KPS
p‐value N Mean SD N Mean SD
Physical Health & Well‐being 991 8.63 1.34 1132 8.40 1.58 < .001
Social Competence 992 8.27 1.78 1132 7.89 2.07 < .001
Emotional Maturity 988 7.76 1.53 1126 7.45 1.71 < .001
Language & Cognitive Development 971 7.89 1.82 1122 7.21 2.19 < .001
Communication Skills & General Knowledge
992 7.57 2.49 1132 7.03 2.80 < .001
The table below indicates the percentage of children that are in the lowest 10th percentile for each domain, based on the number of children valid for analyses. Children in the No KPS group have significantly higher vulnerability rates than children in the KPS group.
KPS No KPS p‐value
N vuln. % vuln. N vuln. % vuln.
Physical Health & Well‐being 170 17.2% 288 25.4% < .001
Social Competence 97 9.8% 166 14.7% 0.001
Emotional Maturity 141 14.3% 224 19.9% 0.001
Language & Cognitive Development 139 14.3% 283 25.2% < .001
Communication Skills & General Knowledge
131 13.2% 230 20.3% < .001
Vulnerable on one or more EDI domains 345 34.8% 345 47.4% < .001

Section II: Part A
58
Domain Scores by FDK Group and KPS Group
2 years FDK group 1 year FDK group No FDK group
No KPS KPS No KPS KPS No KPS KPS
Mean SD Mean SD Mean SD Mean SD Mean SD Mean SD
Physical Health & Well‐being
8.36 1.57 8.62 1.33 8.17 1.68 8.41 1.26 8.66 1.46 8.86 1.38
Social Competence
7.81 2.04 8.18 1.86 7.67 2.18 8.02 1.83 8.20 1.97 8.63 1.57
Emotional Maturity
7.42 1.66 7.66 1.53 7.39 1.76 7.72 1.53 7.53 1.72 7.91 1.51
Language & Cognitive Development
7.10 2.25 7.88 1.75 7.40 2.09 8.01 1.80 7.21 2.19 7.79 1.91
Communication Skills & General Knowledge
7.08 2.75 7.60 2.50 6.78 2.83 7.33 2.43 7.17 2.83 7.77 2.53
Vulnerability by FDK Group and KPS group
2 years FDK group 1 year FDK group No FDK group
KPS No KPS KPS No KPS KPS No KPS
N vuln.
% vuln.
N vuln.
% vuln.
N vuln.
% vuln.
N vuln.
% vuln.
N vuln.
% vuln.
N vuln.
% vuln.
Physical Health & Well‐being
66 18.9 129 26.8 65 19.9 89 29.5 39 12.3 65 19.9
Social Competence
41 11.7 61 12.7 35 10.7 61 20.2 21 6.6 44 12.6
Emotional Maturity
53 15.2 96 19.9 51 15.6 64 21.2 37 11.7 64 18.4
Language & Cognitive Development
49 14.0 131 27.2 40 12.2 71 23.5 50 15.8 81 23.3
Communication Skills & General Knowledge
47 13.5 98 20.3 45 13.8 62 20.5 39 12.3 70 20.1
Vulnerable on one or more EDI domains
125 35.8 237 49.2 115 35.2 153 50.7 105 33.2 147 42.2

Section II: Part B
59
Section II. Year 2 Part B. Senior Kindergarten
Number of Senior Kindergarten Children in ELP EDI Analyses
1. Total SK ELP (with consent) questionnaires completed. 2. Questionnaires for children in class more than 1 month. 3. Questionnaires for children in class other than in class more than 1 month
a. in class <1 month b. moved out of class c. moved out of school d. other
4. Questionnaires without Special Needs. 5. Questionnaires labelled as Special Needs or missing Special Needs assignation. 6. Special Needs children with incomplete questionnaires (missing more than one domain). 7. Questionnaires missing Special Needs assignation. 8. Questionnaires valid for analyses in reports for children with Special Needs. 9. Non Special Needs children with incomplete questionnaires (missing more than one domain) 10. Children missing an FDK status group. 11. Questionnaires valid for analyses in reports for children without Special Needs.
a. 2 years FDK group b. 1 year FDK group c. No FDK group
1.) 2333
2.) 2317
4.) 2197
9.) 0
11.) 2197
11.a) 847
11.b) 643
11.c) 707
10.) 0
5.) 120
6.) 0
7.) 6
8.) 114
3.) 16
3.a) 2
3.b) 2
3.c) 12
3.d) 0

Section II: Part B
60
Descriptive Statistics for Year 2 Senior Kindergarten by FDK Group
Overall, out of 2,333 EDI completed for children in Senior Kindergarten, 2,197 contained valid data for summary analyses (94.2%). 114 out of 2,333 (approximately 5%) of children were reported as having
Special Needs. These rates were similar across the three study groups. The tables below describe the composition of each of the three different FDK groups. These tables demonstrate that the groups are relatively similar in their demographic composition.
Gender Count (%)
2 years FDK group 1 year FDK group No FDK group
Girl 439 (51.8%) 313 (48.7%) 357 (50.5%)
Boy 408 (48.2%) 330 (51.3%) 350 (49.5%)
English/French as a Second Language
Count (%)
2 years FDK group 1 year FDK group No FDK group
E/FSL 166 (19.6%) 90 (14.0%) 188 (26.6%)
No E/FSL 681 (80.4%) 553 (86.0%) 518 (73.3%)
Missing 0 (0%) 0 (0%) 1 (0.1%)
First Language Count (%)
2 years FDK group 1 year FDK group No FDK group
English 535 (63.2%) 478 (74.3%) 377 (53.3%)
French 74 (8.7%) 39 (6.1%) 82 (11.6%)
Other only 35 (4.1%) 49 (7.6%) 49 (6.9%)
English & French 119 (14.0%) 44 (6.8%) 141 (19.9%)
English & Other 29 (3.4%) 7 (1.1%) 13 (1.8%)
French & Other 18 (2.1%) 3 (0.5%) 12 (1.7%)
Two other languages 1 (0.1%) 1 (0.2%) 2 (0.3%)
Missing 36 (4.3%) 22 (3.4%) 31 (4.4%)
French Immersion Count (%)
2 years FDK group 1 year FDK group No FDK group
French Immersion 51 (6.0%) 89 (13.8%) 186 (26.3%)
Non‐French Immersion 796 (94.0%) 554 (86.2%) 520 (73.6%)
Missing 0 (0%) 0 (0%) 1 (0.1%)
Aboriginal Count (%)
2 years FDK group 1 year FDK group No FDK group
Aboriginal 20 (2.4%) 11 (1.7%) 8 (1.1%)
Not Aboriginal 765 (90.3%) 559 (86.9%) 646 (91.4%)
Missing 62 (7.3%) 73 (11.4%) 53 (7.5%)

Section II: Part B
61
ELP Year 2 Senior Kindergarten Results 2011/2012 Overall Comparisons by FDK Group
The EDI was completed for 2,197 non‐Special Needs Senior Kindergarten students in Year 2 of the ELP FDK project. The tables and graph below illustrate descriptive statistics by FDK group.
2 years FDK group
1 year FDK group
No FDK group
p‐value
Girls 439 313 357 0.484
Boys 408 330 350
2 years FDK group
1 year FDK group
No FDK group
p‐value
N 847 643 707
0.461 Mean Age 5.72 5.74 5.74
SD 0.32 0.29 0.31
The p‐values in the above tables demonstrate that the three groups do not statistically differ in terms of the composition of gender or age.
The table below outlines the mean scores and standard deviations for each domain by FDK group. The p‐values in this table indicate that there are significant group differences in the Social Competence domain. Post hoc analyses demonstrated that the 1 year FDK group had significantly lower domain scores than the No FDK group (p = .049).
Note: As of the late summer 2012, neighbourhood‐level index of socioeconomic status (Social Risk Index, or SRI), became available. The domain score comparisons by FDK group were repeated with SRI as a covariate, and the results are in Appendix H.

Section II: Part B
62
0
2
4
6
8
10
Physical Health& Well‐being
SocialCompetence
EmotionalMaturity
Language &Cognitive
Development
CommunicationSkills & GeneralKnowledge
2 yrs FDK group
1 yr FDK group
No FDK group
Domains Mean (SD)
p‐value 2 years FDK group
1 year FDK group
No FDK group
Physical Health & Well‐being 8.89 8.85 8.98 0.162
Social Competence 8.47 8.44 8.66 0.034
Emotional Maturity 8.06 8.13 8.12 0.613
Language & Cognitive Development 8.92 8.99 8.93 0.602
Communication Skills & General Knowledge
8.18 8.13 8.01 0.381
Comparison of Means

Section II: Part B
63
Percentage of Vulnerable Children (Year 2 SK)
“Vulnerable” describes children whose domain scores are in the lowest 10th percentile of a distribution. The table and graph below illustrate the percentage of children in each FDK group who score is in the lowest 10th percentile based on the distribution of the Ontario Baseline.
The p‐values in the below table illustrate that there are no significant differences in vulnerability between the three groups in any of the five domains.
Note: As of the late summer 2012, neighbourhood‐level index of socioeconomic status (Social Risk Index, or SRI), became available. The vulnerability comparisons by FDK group were repeated with SRI as a covariate, and the results are in Appendix I.
EDI Domains
% Vulnerable (ON Baseline cut‐offs)
2 years FDK group
1 year FDK group
No FDK group
p‐value
Physical Health & Well‐being 14.2% 15.2% 12.0% 0.211
Social Competence 8.3% 9.8% 7.5% 0.305
Emotional Maturity 10.6% 10.9% 8.7% 0.315
Language & Cognitive Development 6.6% 4.8% 5.8% 0.344
Communication Skills & General Knowledge 8.3% 8.7% 10.7% 0.212
Vulnerable on one or more EDI domains 25.7% 28.5% 23.5% 0.113

Section II: Part B
64
0
20
40
60
80
100
Physical Health& Well‐being
SocialCompetence
EmotionalMaturity
Language &Cognitive
Development
CommunicationSkills & GeneralKnowledge
2 yrs FDK group
1 yr FDK group
No FDK group
Vulnerability (%) by Domain

Section II: Part B
65
Group Comparisons (Year 2 SK) ELP Year 2 2011/2012
The tables below compare factors that influence EDI results. Comparisons are by demographic information (i.e. gender, age, etc.) and FDK group. Please note that higher mean scores indicate better levels of developmental health at school entry.
The effect size is an accepted indicator of the strength of the relationship between two variables and assesses whether the differences are meaningful or not. Since it is independent of the measurement or sample size, the effect size of a difference between two groups is the best indicator of how meaningful this difference is. In this report, the effect size is computed as follows:
mean(comparison group) – mean(reference group) SD(reference group)
It is customary to interpret the effect sizes of 0 to 0.3 as small, 0.3 to 0.8 as moderate, and greater than 0.8 as large. Negative effect sizes mean the comparison group has a lower mean score than the reference group.
*Note that the reference group used in the calculations of effect size is indicated with an asterisk.
1. Gender
2 years FDK group 1 year FDK group No FDK group
Girls* Boys Effect Size
Girls* Boys Effect Size
Girls* Boys Effect Size Mean SD Mean SD Mean SD Mean SD Mean SD Mean SD
Physical health & Well‐being
9.04 1.23 8.73 1.35 0.25 8.91 1.18 8.78 1.29 0.11 9.11 1.18 8.84 1.38 0.23
Social Competence
8.90 1.44 8.01 1.89 0.62 8.82 1.59 8.07 1.88 0.47 8.98 1.49 8.32 1.70 0.44
Emotional Maturity
8.47 1.29 7.62 1.54 0.66 8.51 1.47 7.76 1.61 0.51 8.49 1.36 7.75 1.43 0.54
Language & Cognitive development
9.18 1.38 8.65 1.67 0.38 9.22 1.07 8.78 1.52 0.41 9.08 1.36 8.78 1.53 0.22
Communication & General knowledge
8.60 2.07 7.72 2.46 0.43 8.56 2.10 7.71 2.50 0.40 8.20 2.36 7.82 2.51 0.16

Section II: Part B
66
2. Age of Child (mean age is 5.74 years)
2 years FDK group 1 year FDK group No FDK group
Above mean age*
Below mean age Effect
Size
Above mean age*
Below mean age Effect
Size
Above mean age*
Below mean age Effect
Size Mean SD Mean SD Mean SD Mean SD Mean SD Mean SD
Physical health & Well‐being
9.04 1.21 8.75 1.35 0.24 9.04 1.14 8.64 1.31 0.35 9.12 1.23 8.82 1.34 0.24
Social Competence
8.64 1.76 8.30 1.68 0.19 8.73 1.60 8.13 1.92 0.38 8.75 1.57 8.55 1.69 0.13
Emotional Maturity
8.26 1.41 7.87 1.52 0.28 8.31 1.48 7.94 1.67 0.25 8.15 1.45 8.08 1.43 0.05
Language & Cognitive development
9.16 1.32 8.70 1.71 0.35 9.20 1.16 8.78 1.47 0.36 9.13 1.34 8.71 1.54 0.31
Communication & General knowledge
8.54 2.14 7.83 2.40 0.33 8.53 2.13 7.71 2.51 0.38 8.35 2.28 7.65 2.55 0.31
3. Children with E/FSL status
2 years FDK group 1 year FDK group No FDK group
Not E/FSL* E/FSL Effect Size
Not E/FSL* E/FSL Effect Size
Not E/FSL* E/FSL Effect Size Mean SD Mean SD Mean SD Mean SD Mean SD Mean SD
Physical health & Well‐being
8.85 1.33 9.07 1.15 ‐0.17 8.87 1.24 8.72 1.24 0.12 8.99 1.27 8.95 1.34 0.03
Social Competence
8.46 1.72 8.52 1.74 ‐0.03 8.43 1.78 8.49 1.84 ‐0.03 8.84 1.47 8.18 1.89 0.45
Emotional Maturity
8.04 1.51 8.14 1.32 ‐0.07 8.08 1.59 8.40 1.51 ‐0.20 8.26 1.43 7.74 1.40 0.36
Language & Cognitive development
8.96 1.56 8.77 1.50 0.12 9.04 1.31 8.70 1.51 0.26 9.11 1.31 8.47 1.69 0.49
Communication & General knowledge
8.32 2.25 7.58 2.44 0.33 8.32 2.24 6.94 2.70 0.62 8.43 2.12 6.90 2.84 0.72

Section II: Part B
67
Subdomain Profiles (Year 2 SK)
Each of the five domains is divided into sub‐domains, except for Communication Skills and General Knowledge. Based on skills and abilities that each sub‐domain represents, children are classified as being at/above developmental expectations (reach the expectations for all or most of the sub‐domain items), in the middle (reach the expectations for some of the sub‐domain items), and below developmental expectations (reach expectations for none or few of the sub‐domain items). Note that the Physical readiness for school day and the Physical independence subdomains do not feature a middle category because of the definitive nature of the questions they are comprised of.
The graphs below provide a comparison between the three FDK groups for each of the subdomains. The graphs below are percentages of children in each subdomain category.
Physical Health & Well‐being
Physical readiness for school dayChildren who reach all or almost all of the developmental expectations never or almost never experienced being dressed inappropriately for school activities, or coming to school tired, late or hungry
Physical independenceChildren who reach all or almost all of the developmental expectations are independent in looking after their needs, have an established hand preference, are well coordinated, and do not suck a thumb/finger
Gross and fine motor skillsChildren who reach all or almost all of the developmental expectations have an excellent ability to physically tackle the school day and have excellent or good gross and fine motor skills.
5
95
3
97
4
96
0
20
40
60
80
100
Few / None All / Almost all
2 yrs FDK group
1 yr FDK group
No FDK group
13
87
11
89
9
91
0
20
40
60
80
100
Few / None All / Almost
2 yrs FDK group
1 yr FDK group
No FDK group
19 15
66
22 18
60
19 17
64
0
20
40
60
80
Few / None Some All / Almost
2 yrs FDK group
1 yr FDK group
No FDK group

Section II: Part B
68
Social Competence
Overall social competenceChildren who reach all or almost all of the developmental expectations have excellent or good overall social development, very good ability to get along with other children and play with various children; usually cooperative and self‐confident.
Responsibility and respectChildren who reach all or almost all of the developmental expectations always or most of the time show respect for others and for property, follow rules and take care of materials, accept responsibility for actions, and show self‐control.
Approaches to learning Children who reach all or almost all of the developmental expectations always or most of the time work neatly, work independently, solve problems, follow instructions and class routines, and easily adjust to changes.
Readiness to explore new thingsChildren who reach all or almost all of the developmental expectations are curious about the surrounding world and are eager to explore new books, toys, and games.
8
4052
9
4349
6
38
57
0
20
40
60
80
100
Few / None Some All / Almost
2 yrs FDK group
1 yr FDK group
No FDK group
417
78
616
77
413
82
0
20
40
60
80
100
Few / None Some All / Almostall
2 yrs FDK group
1 yr FDK group
No FDK group
7
24
69
7
26
66
6
22
71
0
20
40
60
80
100
Few / None Some All / Almostall
ELP Group 1
ELP Group 2
ELP Group 3
3
18
79
215
83
313
85
0
20
40
60
80
100
Few / None Some All / Almostall
2 yrs FDK group
1 yr FDK group
No FDK group

Section II: Part B
69
Emotional Maturity
Prosocial and helping behaviourChildren who reach all or almost all of the developmental expectations show most of the helping behaviours: helping someone hurt, sick or upset, offering to help spontaneously, invite bystanders to join in
Anxious and fearful behaviourChildren who reach all or almost all of the developmental expectations rarely or never show most of the anxious behaviours; they are happy and able to enjoy school, and are comfortable being left at school by caregivers
Aggressive behaviour Children who reach all or almost all of the developmental expectations rarely or never show most of the anxious behaviours; they are happy and able to enjoy school, and are comfortable being left at school by caregivers
Hyperactivity and inattentionChildren who reach all or almost all of the developmental expectations never show most of the hyperactive behaviours; they are able to concentrate, settle to chosen activities, wait their turn, and most of the time think before doing something
2936 3131 29
383427
36
0
20
40
60
80
100
Few / None Some All / Almostall
2 yrs FDK group
1 yr FDK group
No FDK group
210
88
29
89
39
88
0
20
40
60
80
100
Few / None Some All / Almostall
2 yrs FDK group
1 yr FDK group
No FDK group
9 8
83
9 7
83
8 6
86
0
20
40
60
80
100
Few / None Some All / Almostall
2 yrs FDK group
1 yr FDK group
No FDK group
11 12
78
12 13
76
10 12
78
0
20
40
60
80
100
Few / None Some All / Almostall
2 yrs FDK group
1 yr FDK group
No FDK group

Section II: Part B
70
Language and Cognitive Development
Basic literacy Children who reach all or almost all of the developmental expectations have all the basic literacy skills: know how to handle a book, can identify some letters and attach sounds to some letters, show awareness of rhyming words, know the writing directions, and are able to write their own name
Interest in literacy / numeracy and memory Children who reach all or almost all of the developmental expectations show interest in books and reading, math and numbers, and have no difficulty with remembering things name
Advanced literacy Children who reach all or almost all of the developmental expectations have at least half of the advanced literacy skills: reading simple, complex words or sentences, writing voluntarily, writing simple words or sentences
Basic numeracy Children who reach all or almost all of the developmental expectations have all the basic numeracy skills: can count to 20 and recognize shapes and numbers, compare numbers, sort and classify, use one‐to‐one correspondence, and understand simple time concepts
615
79
314
83
514
81
0
20
40
60
80
100
Few / None Some All / Almostall
2 yrs FDK group
1 yr FDK group
No FDK group
137
79
12 9
79
9 11
79
0
20
40
60
80
100
Few / None Some All / Almostall
2 yrs FDK group
1 yr FDK group
No FDK group
137
79
12 9
79
9 11
79
0
20
40
60
80
100
Few / None Some All / Almostall
2 yrs FDK group
1 yr FDK group
No FDK group
7 7
85
6 6
88
6 8
85
0
20
40
60
80
100
Few / None Some All / Almostall
2 yrs FDK group
1 yr FDK group
No FDK group
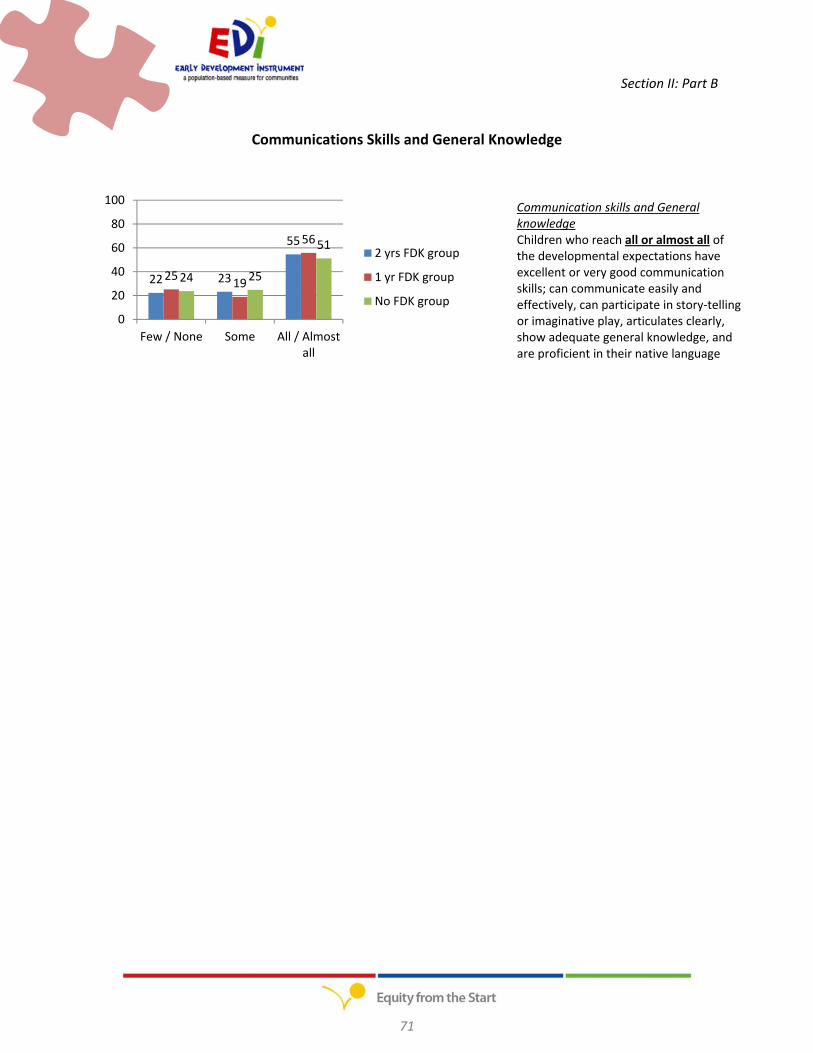
Section II: Part B
71
Communications Skills and General Knowledge
Communication skills and General knowledge Children who reach all or almost all of the developmental expectations have excellent or very good communication skills; can communicate easily and effectively, can participate in story‐telling or imaginative play, articulates clearly, show adequate general knowledge, and are proficient in their native language
22 23
55
2519
56
24 25
51
0
20
40
60
80
100
Few / None Some All / Almostall
2 yrs FDK group
1 yr FDK group
No FDK group

Section II: Part B
72
Descriptive Statistics (Year 2 SK) Comparisons of KPS Groups
The children participating in the FDK ELP project received a Kindergarten Parent Survey (KPS) for their parent/guardian to complete. Out of the 2,197 Senior Kindergarten children that were valid for ELP analyses, 1,104 had a KPS completed by their parent/guardian. The table below compares demographic variables for SK children with KPS and those without KPS.
Gender Count (%)
p‐value KPS No KPS
Girl 549 49.7% 560 51.2% 0.495
Boy 555 50.3% 533 48.8%
KPS No KPS p‐value
N 1104 1093 0.044
Mean Age 5.72 5.75
English / French as a second language
Count (%)
KPS No KPS
No E/FSL 904 81.9% 848 77.6%
E/FSL 200 18.1% 244 22.3%
Missing 0 0% 1 0.1%
French Immersion Count (%)
KPS No KPS
Not French Immersion 869 78.7% 1001 91.6%
French Immersion 235 21.3% 91 8.3%
Missing 0 0% 1 0.1%
Aboriginal status Count (%)
KPS No KPS
Not Aboriginal 1007 91.2% 963 88.1%
Aboriginal 11 1.0% 28 2.6%
Missing 86 7.8% 102 9.3%

Section II: Part B
73
The table below illustrates the average domain scores for those children with a completed KPS and those without. Children in the KPS group have significantly higher mean domain scores on all five EDI domains than children in the KPS group.
Domain KPS No KPS
p‐value N Mean SD N Mean SD
Physical Health & Well‐being 1103 9.05 1.12 1092 8.75 1.40 < .001
Social Competence 1104 8.75 1.55 1093 8.28 1.84 < .001
Emotional Maturity 1104 8.26 1.40 1084 7.93 1.57 < .001
Language & Cognitive Development
1104 9.09 1.29 1093 8.80 1.60 < .001
Communication Skills & General Knowledge
1104 8.34 2.17 1093 7.87 2.52 < .001
The table below indicates the percentage of children that are in the lowest 10th percentile for each domain, based on the number of children valid for analyses. Children in the No KPS group have significantly higher vulnerability rates than children in the KPS group in every domain.
Domains
KPS No KPS
p‐value N vuln.
%
vuln.
N vuln.
%
vuln.
Physical Health & Well‐being 104 9.4% 199 18.2% < .001
Social Competence 63 5.7% 123 11.3% < .001
Emotional Maturity 89 8.1% 131 12.1% 0.002
Language & Cognitive Development 50 4.5% 78 7.1% 0.011
Communication Skills & General Knowledge
74 6.7% 128 11.7% < .001
Vulnerable on one or more EDI domains 225 20.4% 342 31.3% < .001

Section II: Part B
74
Domain Scores by FDK Group and KPS Group
2 years FDK group 1 year FDK group No FDK group
KPS No KPS KPS No KPS KPS No KPS
Mean SD Mean SD Mean SD Mean SD Mean SD Mean SD
Physical Health & Well‐being
9.04 1.19 8.75 1.38 8.98 1.09 8.71 1.36 9.14 1.06 8.80 1.47
Social Competence 8.65 1.60 8.29 1.83 8.73 1.61 8.15 1.91 8.90 1.42 8.41 1.79
Emotional Maturity 8.17 1.42 7.94 1.53 8.35 1.40 7.90 1.73 8.29 1.38 7.94 1.48
Language & Cognitive Development
9.05 1.45 8.80 1.64 9.07 1.21 8.92 1.46 9.15 1.16 8.71 1.68
Communication Skills & General Knowledge
8.34 2.16 8.01 2.43 8.35 2.22 7.90 2.47 8.33 2.15 7.68 2.67
Vulnerability by FDK Group and KPS group
2 years FDK group 1 year FDK group No FDK group
KPS No KPS KPS No KPS KPS No KPS
N % N % N % N % N % N %
Physical Health & Well‐being
48 11.3 72 17.0 30 9.3 68 21.2 26 7.3 59 16.9
Social Competence 28 6.6 42 9.9 19 5.9 44 13.8 16 4.5 37 10.6
Emotional Maturity 37 8.7 52 12.3 25 7.7 45 14.1 27 7.5 34 9.7
Language & Cognitive Development
23 5.4 33 7.8 14 4.3 17 5.3 13 3.6 28 8.0
Communication Skills & General Knowledge
25 5.9 45 10.6 23 7.1 33 10.3 26 7.3 50 14.3
Vulnerable on one or more EDI domains
91 21.5 127 30.0 72 22.3 111 34.7 62 17.3 104 29.8

Section III
75
Section III Analyses of EDI and KPS data
Year 1 & 2 (2010/2011,2011/2012)

Section III
76
Part III: Year 1 and Year 2
In this section of the report we focus on consistencies and differences between the two years of the study in relation to group and grade. Where appropriate, analyses are controlling for the neighbourhood‐level indicators of socioeconomic status measured with the Social Risk Index (SRI).
Analyses
Analyses for this section included both cross sectional analyses by cohort year, and school‐based longitudinal matched analyses.
Cross sectional analyses. Cross sectional analyses enable the comparison of groups for which observations took place at one specific point in time. Cross sectional analyses compared the JK cohort from Year 1 to the JK cohort from Year 2, as well as the SK children in both years. This was done to determine if differences could be attributed to the ELP FDK program, or were a result of differences within the children themselves.
In the first step of the cross sectional analyses, data were aggregated by school and study year. Data were aggregated by school so that schools could be used as the unit of analyses in the evaluation of differences in JK and SK cohorts across the three FDK groups. There were 2,242 Year 1 JK children and 2,100 Year 2 JK children, as well as 1,465 Year 1 SK children and 2,162 Year 2 SK children included in the aggregated data set. Gender, age, and Social Risk Index (SRI), a census derived neighbourhood‐based measure of socioeconomic status, were compared first for both JKs and SKs separately, using repeated measures ANOVAs, to determine any demographic differences between the years. Differences in demographic composition of the schools could affect the domain scores as, for example, girls tend to have higher scores than boys. If there was a significant difference in the demographic composition between the years, this could affect domain scores. Repeated measures ANOVAs were then performed by Kindergarten year (JK, SK) and by FDK group, using the domain scores and vulnerability as the outcomes. These analyses were performed controlling for age, gender, and SRI. Controlling for demographic variables allows for a more non‐biased comparison of groups.
Multilevel modelling (MLM) was used as a complementary approach in the cross sectional analyses, to examine the differences between groups in comparison to the group which did not have full day kindergarten in either of the two study years (No FDK). MLM is a technique that takes into account the clustering of children within schools and allows us to estimate the amount of variance in the dependent variables that can be attributed to the two levels (Rasbash et al., 2012). This technique utilizes the correlated structure of the data to examine differences across the FDK groups between Year 1 and Year 2 JKs and between Year 1 and Year 2 SKs controlling for differences in age, differences in sex composition (reference group females) and differences in E/FSL composition (reference group non E/FSL) between the cohorts within schools over the two years. The reference for the analyses by study group was

Section III
77
the No FDK group. Socioeconomic status was not included in these analyses since the individual level socioeconomic status information was not available for most of children (due to low uptake of the Kindergarten Parent Survey (KPS)). Limiting the sample to those with both EDI and KPS data only would have impeded the statistical power of the analyses.
As children who are more at risk and those who have had the longest exposure to the program should benefit most, a separate set of analyses was performed for Year 2 Senior Kindergarten children exclusively for groups which have been identified in past research as more at risk for poor outcomes: boys, younger children, and children in the EFSL group. The differences among the three study groups were investigated using ANOVA controlling for SRI.
School‐based longitudinal analyses. The second stage of analyses was the school‐based longitudinal component. Longitudinal analysis is a type of analysis that includes the same units of study observed at two or more time points (such as Junior and Senior kindergarten level). For these analyses, schools were matched between Year 1 and Year 2. No matching of individual children was possible. The matching procedure started by selecting JK children from Year 1 and SK children from Year 2. The data from these children were then aggregated by school and year, and then matched based on schools. Any school that did not have JK children in Year 1 or SK children in Year 2 was dropped during the aggregation process. There were nine schools excluded from the school‐based longitudinal analyses because they did not have data from both years of implementation. By selecting only the JK children from Year 1 and the SK children from Year 2 and matching by school, it was assumed that the majority of children did not change schools from JK to SK, and therefore the Year 1 JKs were the same children as the Year 2 SKs.
Repeated measures ANOVA were performed to compare FDK Groups and years with domain scores and vulnerability rates as the outcomes. The analyses were all performed controlling for age, gender, and SRI. These analyses compared the JK Year 1 children to the SK Year 2 children by their FDK group. The purpose of these analyses was to determine if there were differences in outcomes by FDK group as well as by year.
Multilevel modelling was also performed as a complementary approach for the school‐based longitudinal component, to examine the change in domain scores and vulnerability for each of the three FDK groups separately across the two years. These MLM analyses examined the changes in domain scores and vulnerability rates from JK to SK by FDK group controlling for possible effects of differences in age, differences in sex composition, and E/FSL composition on overall vulnerability and the domain scores. The reference group for the analyses were the Year 1 vulnerability and scores. Clearly, a major limitation in this approach is that individual students were not matched within schools over the two years of available data.

Section III
78
Results
Social Risk Index. The comparison of SRI among the groups and grades for each year of the study indicate that only children in Year 1 SK groups came from neighbourhoods with similar SES indicators. For the three remaining comparisons (Year 1 JK, Year 2 JK and Year 2 SK), there was a significant difference among the study groups, with the No FDK group having the highest mean SRI indicating the highest risk and thus lowest SES among the groups. Table 1 below displays average SRI by year of implementation, FDK group, and class assignment.
Table 1. SRI by ELP year, FDK Group, and Class assignment
ELP Year 1 ELP Year 2
2 years FDK group
1 year FDK group
No FDK group
2 years FDK group
1 year FDK group
No FDK group
Mean JK 3.84 3.46 4.49 3.60 2.62 4.39
Mean SK 3.62 3.61 3.69 3.49 2.93 4.17
Note: higher SRI means are indicative of higher risk (lower SES)
Cross sectional analyses. Table 2 depicts the average domain scores for Year 1 JK children and Year 2 JK children. Table 3 presents the percentage of JK children that were vulnerable on one or more domain, by year. Repeated measures ANOVA were performed for JK children by FDK Group for each of the five domains, as well as for those vulnerable on one or more domains. These analyses revealed no significant differences between the Year 1 JKs and the Year 2 JKs in the domain of physical health and well‐being (p = .732), social competence (p = .852), emotional maturity (p = .490), language and cognitive development (p = .439), communication and general knowledge (p = .357), or vulnerability on one or more domain (p = .816). These analyses were performed controlling for age, gender, and SRI. These findings demonstrate that the children in JK Year 1 of the ELP project did not significantly differ from the Year 2 children in any of the five domains or vulnerability.

Section III
79
Table 2 Descriptive analyses of the five EDI domains for JK Year 1 and JK Year 2 (mean and standard deviation, SD).
Domain
2 years FDK group 1 year FDK group No FDK group
Year 1 Year 2 Year 1 Year 2 Year 1 Year 2
Mean SD Mean SD Mean SD Mean SD Mean SD Mean SD
Physical health & well‐being
8.29 1.10 8.35 0.88 8.30 0.85 8.25 0.86 8.43 0.91 8.38 0.94
Social competence 7.89 1.11 7.80 0.91 7.95 1.29 7.73 1.21 8.01 1.10 7.94 1.17
Emotional Maturity 7.58 0.95 7.47 0.69 7.69 0.87 7.48 0.94 7.77 0.77 7.45 1.01
Language & cognitive
development 7.93 0.98 7.33 0.97 7.82 0.84 7.45 1.26 7.85 1.15 7.26 1.20
Communication & general knowledge
7.16 1.71 7.07 1.19 6.82 1.56 7.00 1.52 7.27 1.60 6.94 1.36
Table 3 Percentage of JK children vulnerable on 1 or more domains
2 years FDK group 1 year FDK group No FDK group
Year 1 Year 2 Year 1 Year 2 Year 1 Year 2 Vulnerable on 1 or more domain
40.89% 44.56% 38.20% 43.23% 35.08% 41.88%
The cross‐sectional analyses using MLM (Appendix M), showed no differences in vulnerability across the FDK groups over the two cohorts of JK children by FDK group with the exception of social competence and language and cognitive development domains. The difference in the change in scores in the social competence domain was significantly lower for JK children in schools with FDK compared to JK children in schools with no FDK (‐0.395, s.e.= 0.156, p<0.05). On the other hand, the difference in change in scores in the language and cognitive development domain was significantly higher for JK children in schools with FDK in Year 2 compared to children in schools with no FDK (0.521, s.e.=0.163, p<0.05).

Section III
80
Table 4 depicts the average domain scores for Year 1 SK children and Year 2 SK children. Table 5 presents the percentage of SK children that were vulnerable on one or more domain, by year. Repeated measures ANOVA were performed for SK children by FDK Group for each of the five domains, as well as for vulnerability on one or more domains. Repeated measures ANOVA for SK children by FDK Group revealed no significant differences between the Year 1 SKs and the Year 2 SKs in the domain of physical health and well‐being (p = .068), social competence (p = .653), emotional maturity (p = .790), language skills and cognitive development (p = .784), communication and general knowledge (p = .603), or vulnerability on one or more domain (p = .764). These analyses were performed controlling for age, gender, and SRI. These findings demonstrate that the children in SK Year 1 of the ELP project did not significantly differ from the Year 2 children in any of the five domains, or vulnerability.
Table 4 Descriptive analyses of the five EDI domains for SK Year 1 and SK Year 2 (mean and standard deviation, SD).
Domain
2 years FDK 1 year FDK No FDK
Year 1 Year 2 Year 1 Year 2 Year 2 Year 1
Mean SD Mean SD Mean SD Mean SD Mean SD Mean SD
Physical health & well‐being
8.69 0.83 8.80 0.74 8.41 0.89 8.68 0.68 8.59 0.98 8.73 0.85
Social competence 8.25 0.92 8.34 0.74 8.42 1.17 8.26 0.85 8.26 1.13 8.45 0.89
Emotional Maturity
7.93 0.75 8.00 0.69 8.13 0.97 7.98 0.87 8.04 0.96 8.01 0.67
Language & cognitive
development 8.99 0.56 8.82 0.83 8.92 0.76 8.82 0.71 8.77 0.86 8.80 0.56
Communication & general knowledge
7.76 1.34 8.05 1.04 7.41 1.42 7.78 1.40 7.54 1.70 7.74 1.29
Table 5 Percentage of SK children vulnerable on 1 or more domains
2 years FDK 1 year FDK No FDK
Year 1 Year 2 Year 1 Year 2 Year 1 Year 2 Vulnerable on 1 or more
domain 25.98% 27.15% 28.08% 29.99% 28.02% 26.76%

Section III
81
Similar to the results obtained for the JK cross‐sectional analyses, there were no differences in vulnerability and domain scores for the SK cohorts across the two years by FDK group with the exception of the physical health and well‐being domain. The difference in change in scores in the physical health and well‐being domain was significantly higher for children in schools with FDK in Year 2 compared to children in schools with no FDK (0.302, s.e.=0.126, p<0.05).
At‐risk Year 2 SK group comparisons. The tables in Appendix J, Appendix K, and Appendix L show mean scores for the at‐risk groups across the three FDK study groups. There were no statistically significant results for any of the EDI domains when boys were compared, and the No FDK group tended to have the highest scores. There were no statistically significant outcomes in comparison of the E/FSL groups, however, children from the 2 years FDK group had consistently highest scores among the three study groups, with the exception of Emotional maturity where the 1 year FDK group had the highest scores. Among the children younger than the mean age, children in the No FDK group had significantly highest scores in Physical, Social, and Emotional domains. They also had marginally highest scores in Language and Cognitive development, while children in the 2 years FDK group had highest scores in Communication Skills and General Knowledge domain, but these two results were not statistically significant.
School‐based longitudinal analyses. Table 6 presents the average domain scores by group for the Year 1 JK children and the Year 2 SK children. It is expected that the SK children would have higher scores than the JK children, however the purpose of the analyses was to see if any of the individual groups grew more than the others. There was a significant group difference in the change in emotional maturity domain scores (p = .022) with the 2 years FDK group having the greatest increase in mean domain scores from Year 1 to Year 2 (see Figure 1).

Section III
82
7.3
7.4
7.5
7.6
7.7
7.8
7.9
8
8.1
Year 1 Year 2
2 years FDK
1 year FDK
No FDK
Table 6 Descriptive analyses of the five EDI domains at the school level for groups in the school‐based longitudinal analyses (Year 1 JK & Year 2 SK)
2 years FDK 1 year FDK No FDK
JK Year 1 SK Year 2 JK Year 1 SK Year 2 JK Year 1 SK Year 2
Mean SD Mean SD Mean SD Mean SD Mean SD Mean SD
Physical health & well‐being
8.27 1.11 8.75 0.75 8.27 0.84 8.72 0.70 8.43 0.93 8.71 0.84
Social competence
7.90 1.12 8.34 0.77 7.94 1.30 8.25 0.85 8.00 1.12 8.43 0.90
Emotional Maturity
7.58 0.96 8.03 0.67 7.70 0.87 7.98 0.87 7.73 0.78 8.01 0.68
Language & cognitive
development 7.95 0.99 8.88 0.83 7.84 0.84 8.79 0.71 7.85 1.18 8.79 0.56
Communication & general
knowledge 7.16 1.73 8.04 1.08 6.76 1.54 7.78 1.41 7.29 1.62 7.71 1.29
Figure 1. Emotional Maturity domain scores by FDK Group and year
Emotional Maturity
Note: Figure 1 is for illustration purposes only, as it does not depict the minimum and maximum values (0 to 10).

Section III
83
0
5
10
15
20
25
30
35
40
45
Year 1 Year 2
2 years FDK
1 year FDK
No FDK
Table 7 presents the percent of children that were vulnerable on one or more domains
for Year 1 JKs and Year 2 SKs. There was a significant group difference in the change in overall
vulnerability (p = .003), with the 2 years FDK group having the largest decrease in percent
vulnerable (see table 6 and figure 2).
Table 7 Percentage of children vulnerable on 1 or more domains
2 years FDK 1 year FDK No FDK
Year 1 Year 2 Year 1 Year 2 Year 1 Year 2
Vulnerability on 1 or more domain
41.99% 29.03% 41.27% 31.89% 38.62% 29.67%
Figure 2. Vulnerability by FDK Group and year
Vulnerable on one or more domains
These findings indicate that the group with 2 years FDK had more growth in emotional maturity domain scores than the other two groups. Additionally, the group with 2 years FDK had a greater decrease in vulnerability than the other two groups.
Multilevel analyses of School‐based Longitudinal (JK to SK cohort) data by FDK group. These analyses focused on changes in EDI scores and vulnerability separately for schools in each

Section III
84
of the three study groups. For these analyses, the assumption was that children within schools at JK attended the same schools at SK and the impact of the FDK program could be assessed. The results are presented in Appendices M.1 to M.3 and control for the effects of the age of the children, sex composition and E/FSL composition.
There were no statistically significant changes in mean scores and vulnerability for children attending schools in the 2 years FDK group (Appendix M.1). There were increases in the mean scores over the two years for the domains of physical health & wellbeing (0.145, s.e.=0.105), emotional maturity (0.057, s.e.=0.111), and language & cognitive development (0.139, s.e.=0.130) and decreases in mean scores for the social competence (‐0.016, s.e.=0.137), communication & general knowledge domains (‐0.041, s.e.=0.175). There was also a decrease in the odds of overall vulnerability (‐0.09, s.e.=0.173; OR=0.92).
There was a statistically significant decline in the mean social competence score (0.369, s.e.=0.148) and a significant increase in the mean language & cognitive development domain score (0.321, s.e.=0.143) for the children attending schools in the 1 year FDK group (Appendix M.2). However, for children in these groups of schools, there were increased odds of overall vulnerability (0.278, s.e.=0.2; OR=1.32).
Finally, although not statistically significant, there were increases in the mean scores for the domains of the EDI, with the exception of the communication & general knowledge domain (‐0.218, s.e.=0.205) for children attending schools in the No FDK group. Moreover, there were decreased odds of overall vulnerability (‐0.056, s.e.=0.201; OR=0.95) for children in this group.
Limitations
The study described above was based on a naturalistic experiment with little opportunity for manipulation of study groups for the sake of scientific consistency. Therefore, it is important to point out the limitations.
First, the selection of schools for the phases of FDK implementation was not random, and neither was the selection of boards and schools to be included in the study. The regions of Ontario were chosen to represent the mix of characteristics present in the province; and then school boards were chosen within the regions. Schools in 2 years FDK and No FDK groups were selected based on matching on several demographic characteristics (see Study Procedures), and therefore can be considered to conform to a matched design. However the 1‐year FDK group schools belonged to the Phase 2 of FDK implementation, which was carried out at a much smaller scale than Phase 1, and therefore no purposeful matching was possible – all schools in Phase 2 in the designated boards needed to be selected. While the school selection strategy was the best possible under the circumstances, it may have inadvertently contributed to some non‐conclusive results in the study.

Section III
85
A second important limitation was the requirement of active parental consent for the EDI to be completed by the teacher. Combined with the unexpected delays in implementation of the study, this likely influenced the participation rates, which in both years were only around 50%. As there is solid research evidence suggesting that active consent results in a biased sample, it is difficult to estimate how the low recruitment rate and participant bias might have influenced the study outcomes. Moreover, less than half of the parents who agreed to their children being included in the EDI data collection returned the KPS, while it should have been all of them. This low response rate greatly influenced the usefulness of the KPS data, and is a reason why they are only reported on in Parts 1 and 2 of the Report. Inability to include the family information (SES, activities, child preschool history) as a confounding factor in analyses for all participants was also an important limitation. In addition, the active consent procedure caused some confusion in three school boards and resulted in the loss of SK data from Year 1 in those boards.
Several other individual and school‐level factors, difficult to account for, may have had an impact on the outcomes. For example, for children in the No FDK group there was not sufficient information regarding the arrangements for the second half of their week, spent at school by children in FDK groups. The quality of those arrangements may have influenced the results. Also, school‐level factors like class size – generally smaller in No FDK classes – may need to be included in future investigations.
In this report, analyses were also limited by the inability to match children directly from Year 1 to Year 2. We understand that this type of analyses is possible in the future and encourage the Ministry to ensure that it is carried out. The school‐based longitudinal analyses conducted here were limited by a loss of variation at the child level and statistical power in assessing change over time with the data.
Finally, due to the very nature of the program, the study respondents (teachers) were not blinded to the “treatment” category (FDK or not), and their own belief in the program could have subconsciously affected the way they completed the EDI. Based on the results, we expected that this was not the case, but only a long‐term longitudinal data collection can unequivocally address this limitation.

Section III
86
Summary
The findings of the study are summarized below.
1) Based on the neighbourhood indicators of SES (SRI), the most precise measure that was available for all children with valid EDI data, SES appeared to be the highest in the 1‐year FDK group and the lowest in the No FDK group. This finding seems somewhat contrary to expectation, considering that the 2‐years FDK group was selected among schools who were chosen to be in the first Phase of implementation due to socioeconomic disadvantage. However, taken together with the known bias of consented study participation towards families with higher SES, it is likely that the study reached families with higher SES despite the selected schools’ population having on average relatively low SES indicators.
2) In Year 1 of implementation, SK children in the FDK program had statistically significantly better outcomes than the two other groups in Physical health and well‐being, Language and cognitive development, and Communication skills and general knowledge (p.29). Among children in JK in Year 1, scores in Language and cognitive development were the highest in the 2‐years FDK group. These analyses were controlling for children’s age, gender and neighbourhood Social Risk Index (p.12).
3) In Year 2 of implementation, this pattern was not replicated. In almost all domains, children in the No FDK group had better scores than children in either of the groups with FDK, and sometimes this difference was statistically significant. Only among SK children, those in 2‐years FDK group had the highest scores in Communication skills and general knowledge, but this failed to reach statistical significance. These analyses were controlling for children’s age, gender and neighbourhood Social Risk Index. It is worth noting that the results most in accordance to the expectations based on the assumed advantage of FDK program are in the only year/grade combination where the three study groups were equal in terms of socioeconomic status.
4) When children with known demographic risk factors were compared separately in their SK grade in Year 2, some support for the advantageous impact of FDK emerged for the E/FSL group (the learners of the language of instruction). Among the E/FSL children, those in 2‐years FDK or even 1‐year FDK group had consistently higher scores than those in No FDK group on all five EDI domains. With the exception of Communication skills domain, where children below the mean age in the 2‐years FDK group had better scores than others, no expected patterns emerged in relation to gender or age. In fact, children below mean age in the No FDK group had significantly highest scores in Physical, Social, and Emotional domains on the EDI.
5) The difference between scores per grade level (JK Year1 to JK Year 2, and SK Year 1 to SK Year 2) showed that there were larger differences between the two years for children in FDK groups than those in No FDK group for JK Language and Cognitive Development

Section III
87
domain and SK Physical health and well‐being domain. However, there was a larger difference between the years in Social competence for JK No FDK children than for FDK groups.
6) The school‐based longitudinal analyses (JK Year 1 to SK Year 2) showed that the highest increase in Emotional maturity scores happened for children in the 2‐years FDK group. Also, the highest drop in vulnerability occurred in the 2‐years FDK group. These promising findings make it imperative to repeat the longitudinal analyses with individual‐level matching of the children.
7) There was a growth in Physical health, Emotional maturity, and Language and cognitive development domains, and decrease in vulnerability for children in 2‐years FDK group from the Year 1 JK to Year 2 SK, though none of them was statistically significant. There was a statistically significant increase in Language and cognitive development in the 1‐year FDK group and a statistically significant decrease in Social competence. None of the changes for the No FDK group were statistically significant.
Conclusions
While some results reported here are promising in indicating a small advantage for children who participate in the FDK learning, most of the outcomes are inconclusive, or even opposite to expectations. It is crucial to view these results in the appropriate perspective. The study at best examines changes over only one full year of FDK, during the first two phases of program implementation, which have likely been challenging due to its novelty.
There is a huge potential for more detailed analyses of the data collected for the study through several channels of which the results presented in this report are just one. Such analyses will likely elucidate some of the consistencies in the present findings. The recommendations of the authors are as follows:
o Priority should be given to linking Year 1 JK data to Year 2 SK data at the individual level, with other potential school‐ or board‐based data, in order to allow for precise path analyses. As emphasized in the project design submitted to Ministry of Education in late 2010 by OCCS, this type of analysis is the most powerful one.
o An effort should be made to continue tracking the families who agreed to participate at least through assessments in Grade 1 and 2, and in particular Grade 3. Population‐level programs such as FDK tend to show positive outcomes after several years of implementation.
o Wherever possible, school‐level feedback on the implementation of the program should be added to the databases. Information such as class size, infrastructure

Section III
88
challenges, and other barriers that may have influenced smooth implementation could have contributed to the outcomes of this study.
o Finally, there are many more complex and informative statistical techniques that could be applied to ensure the highest possible return of useful information. One such possibility is a technique called “propensity score matching” which could be used with the linked data files to compare children similar in most characteristics across the three study groups. We encourage the Ministry to promote the use of data collected in the course of this study both internally and by external researchers within the parameters of data confidentiality.

References
89
References
Janus, M. & Offord, D.R. (2007). Development and psychometric properties of the Early Development Instrument (EDI): A measure of children’s school readiness. Canadian Journal of Behavioural Science, 39, p. 1‐22.
Pascal, C. (2009). With our best future in mind: Implementing early learning in Ontario. Report to the Premier by the Special Advisor on Early Learning. Toronto, ON: Queen’s Printer of Ontario.
Rasbash, J., Charlton, C., Browne, W.J., Healy, M. and Cameron, B. (2012). MLwiN Version 2.2.5. Centre for Multilevel Modelling, University of Bristol.

Appendix A
90
Appendix A: List of Participating Schools in the FDK ELP
1. A R Kaufman Public School 2. Académie de la Moraine 3. Admiral Collingwood E.S. 4. Alain Fortin 5. Allandale Heights P.S. 6. Angus Morrison E.S. 7. Ardtrea‐Cumberland Beach P.S. 8. Assikinack P.S. 9. Ayr Public School 10. Barrhaven PS 11. Bayshore PS 12. Bells Corners PS 13. Blessed Kateri Tekakwitha 14. Blessed Sacrament 15. Bridgeport Public School 16. Bridlewood ES 17. Canadian Martyrs CS ‐ SMC 18. Cedar Creek Public School 19. Central Public School 20. Chalmers Street Public School 21. Charles H Hulse 22. Cochrane Public School 23. Connaught PS 24. Cookstown P.S. 25. De la Découverte 26. Des Pins 27. Dunlop PS 28. École catholique Assomption (Earlton) 29. École catholique Sainte Croix 30. École Louis Rheaume 31. ÉÉC Cardinal‐Léger ‐ Kitchener 32. ÉÉC Frère‐André ‐ Barrie
33. ÉÉC Marguerite‐Bourgeois ‐ Borden 34. ÉÉC Mère‐Élisabeth‐Bruyère ‐
Waterloo 35. ÉÉC Saint‐René‐Goupil ‐ Guelph 36. ÉÉC Sainte‐Marguerite‐Bourgeoys ‐
Markham 37. Élémentaire Publique Des Sentiers 38. Élémentaire Publique L'Académie de la
Seigneurie 39. Élémentaire Publique L'Équinoxe 40. Élémentaire Publique Marie‐Curie 41. Élémentaire Publique Rose des Vents 42. Élémentaire Publique Séraphin‐Marion 43. ÉP des Navigateurs 44. ÉP Étoile du Nord 45. ÉP Lionel Gauthier 46. Fallingbrook ES 47. Federal Public School 48. Forest Hill Public School 49. Gabrielle‐Roy 50. George‐Étienne‐Cartier 51. Hillcrest P.S. 52. Holy Cross Catholic School‐SMC 53. Horizon Jeunesse 54. Howard Robertson Public School 55. Iroquois Falls Public School 56. Jockvale ES 57. King Edward Public School 58. L'Envol 59. La Fontaine 60. Lamoureux 61. Lansdowne 62. Le Petit Prince
63. Lions Oval Public School 64. Marius Barbeau 65. Monsignor Gleason Catholic
Elementary School 66. Monsignor J.E. Ronan CS ‐ SMC 67. Mooretown‐Courtright 68. Mountain View E.S. 69. Munster ES 70. NorthStar Community School 71. Oakley Park P.S. 72. Orchard Park P.S. 73. Our Lady Of Peace School 74. Pierre‐Elliott‐Trudeau 75. Pope John Paul II SS ‐ SMC 76. Portage View P.S. 77. Prince of Peace School 78. Prince of Wales P.S. 79. Prueter Public School 80. Queen Elizabeth‐Sarnia 81. Queen Mary St.PS 82. R.E. Wilson PS 83. Robert Hopkins 84. Robert Moore School 85. Rockway Public School 86. Rosedale 87. Sacred Heart School ‐ SMC 88. Saint‐Jean‐de‐Brébeuf 89. Saint‐Philippe 90. Sainte‐Anne 91. Sainte‐Catherine 92. Sainte‐Geneviève 93. Sir Edgar Bauer 94. St Gregory
Appendix A
91
95. St John 96. St Joseph 97. St Michael 98. St Nicholas 99. St Teresa 100. St Vincent de Paul 101. St. Augustine School 102. St. Bernard School 103. St. Elizabeth Ann Seton School 104. St. Elizabeth School 105. St. Joseph 106. St. Marguerite d'Youville 107. St. Mary's (Collingwood) 108. St. Matthew 109. St. Michael (Corkery) School 110. St. Michael (Fitzroy) School 111. St. Monica's Separate School 112. St. Noel Chabanel 113. St. Patrick School 114. St. Patrick's School 115. St. Paul's Separate School‐SMC 116. Stewart Avenue Public School 117. Sunnybrae P.S. 118. Tilbury 119. Timmins Centennial Public Scho 120. Victor Lauriston 121. W.E. Johnston PS 122. Warnica P.S. 123. Westwind PS 124. Wilson Avenue Public School 125. Winston Churchill 126. Winston Churchill Public School

Appendix B
92
Appendix B: Year 1 JK Domains score Comparisons controlling for SRI
Domains Mean (SD)
p‐value 2 years FDK group
1 year FDK group No FDK group
Physical Health & Well‐being 8.39 (1.52) 8.45 (1.48) 8.53 (1.46) .071
Social Competence 8.07 (1.93) 8.26 (1.82) 8.19 (1.94) .181
Emotional Maturity 7.72 (1.59) 7.91 (1.50) 7.82 (1.56) .115
Language & Cognitive Development
8.08 (1.88) 7.81 (2.02) 7.96 (2.04) .023
Communication Skills & General Knowledge
7.37 (2.62) 7.15 (2.71) 7.40 (2.67) .053

Appendix C
93
Appendix C: Year 1 JK Vulnerability Comparisons controlling for SRI
Domains
% Vulnerable (ON Baseline cut‐offs)
2 yrs FDK group
1 yr FDK group
No FDK group
p‐value
2 years FDK vs. No FDK
1 year FDK vs. No FDK
Physical Health & Well‐being 26.6 18.6 20.7 .941 .651
Social Competence 12.7 9.4 11.6 .048 .715
Emotional Maturity 15.8 11.9 14.6 .007 .222
Language & Cognitive Development 12.7 16.5 15.8 .370 .048
Communication Skills & General Knowledge
15.2 17.3 15.6 .269 .013
Vulnerable on one or more EDI domains 40.6 36.0 36.5 .343 .274

Appendix D
94
Appendix D: Year 1 SK Domain scores comparisons controlling for SRI
Domains Mean (SD)
p‐value 2 years FDK group
1 year FDK group
No FDK group
Physical Health & Well‐being 8.83 (1.35) 8.63 (1.37) 8.66 (1.48) .039
Social Competence 8.39 (1.83) 8.49 (1.92) 8.51 (1.72) .449
Emotional Maturity 8.00 (1.51) 8.11 (1.61) 8.18 (1.49) .174
Language & Cognitive Development 9.09 (1.31) 8.93 (1.45) 8.90 (1.46) .049
Communication Skills & General Knowledge
7.99 (2.42) 7.77 (2.42) 7.58 (2.51) .021

Appendix E
95
Appendix E: Year 1 SK Vulnerability Comparisons controlling for SRI
EDI Domains
% Vulnerable (ON Baseline cut‐offs)
2 years FDK group
1 year FDK group
No FDK group
p‐value
2 years FDK
vs. No FDK
1 year FDK vs. No FDK
Physical Health & Well‐being 14.7 16.2 17.8 .448 .774
Social Competence 9.7 9.4 9.2 .831 .539
Emotional Maturity 10.7 13.1 9.5 .137 .110
Language & Cognitive Development
4.3 6.8 5.4 .139 .972
Communication Skills & General Knowledge
11.9 10.2 12.7 .472 .330
Vulnerable on one or more EDI domains
28.5 28.7 28.1 .257 .812

Appendix F
96
Appendix F: Year 2 JK Domains score Comparisons controlling for SRI
Domains Mean (SD)
p‐value 2 years FDK group
1 year FDK group No FDK group
Physical Health & Well‐being 8.47 8.30 8.75 < .001
Social Competence 7.96 7.85 8.41 < .001
Emotional Maturity 7.52 7.56 7.71 .042
Language & Cognitive Development
7.42 7.71 7.49 .118
Communication Skills & General Knowledge
7.30 7.07 7.46 .004

Appendix G
97
Appendix G: Year 2 JK Vulnerability Comparisons controlling for SRI
EDI Domains
% Vulnerable (ON Baseline cut‐offs)
2 years FDK group
1 year FDK group
No FDK group
p‐value
2 yrs FDK vs. No FDK
1 yr FDK vs. No FDK
Physical Health & Well‐being 23.5% 24.5% 16.4% .019 .012
Social Competence 12.3% 15.3% 9.8% .486 .156
Emotional Maturity 18.0% 18.3% 15.4% .225 .504
Language & Cognitive Development
22.1% 17.9% 19.9% .220 .352
Communication Skills & General Knowledge
17.4% 17.0% 16.4% .355 .105
Vulnerable on one or more EDI domains
43.6% 42.6% 38.0% .122 .047

Appendix H
98
Appendix H: Year 2 SK Domains score Comparisons controlling for SRI
Domains Mean (SD)
p‐value 2 years FDK group
1 year FDK group
No FDK group
Physical Health & Well‐being 8.89 8.85 8.98 .031
Social Competence 8.47 8.44 8.66 .002
Emotional Maturity 8.06 8.13 8.12 .452
Language & Cognitive Development 8.92 8.99 8.93 .718
Communication Skills & General Knowledge
8.18 8.13 8.01 .690
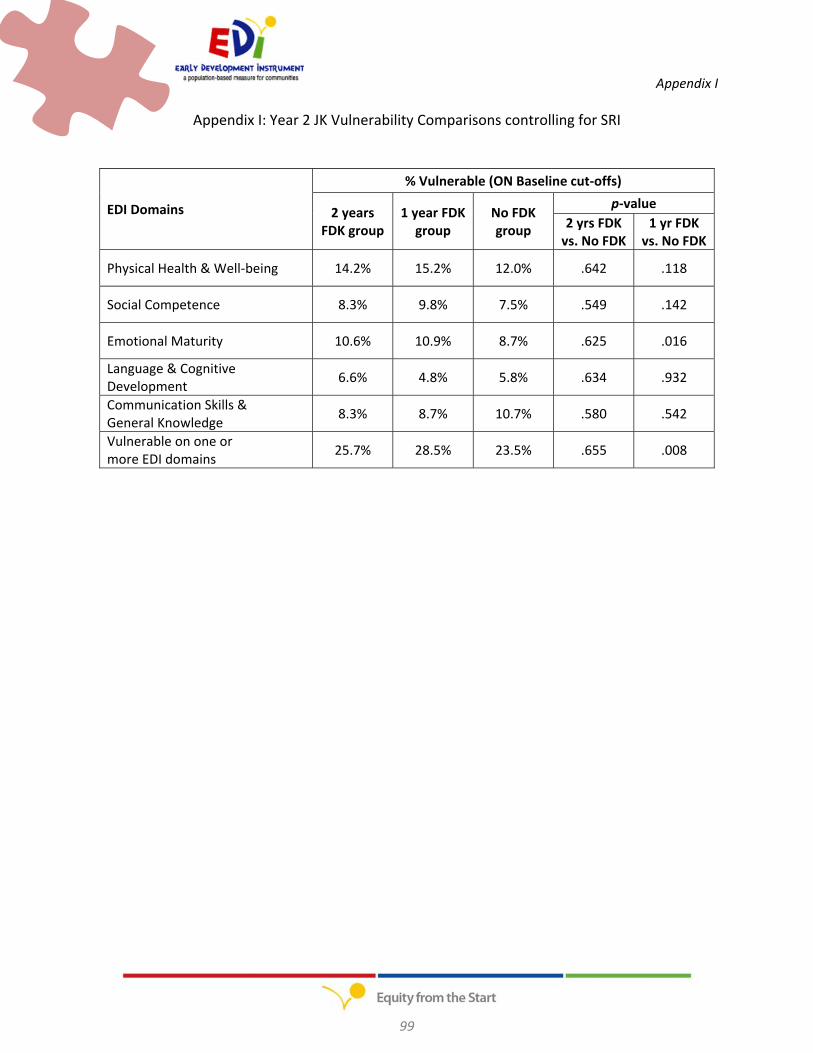
Appendix I
99
Appendix I: Year 2 JK Vulnerability Comparisons controlling for SRI
EDI Domains
% Vulnerable (ON Baseline cut‐offs)
2 years FDK group
1 year FDK group
No FDK group
p‐value
2 yrs FDK vs. No FDK
1 yr FDK vs. No FDK
Physical Health & Well‐being 14.2% 15.2% 12.0% .642 .118
Social Competence 8.3% 9.8% 7.5% .549 .142
Emotional Maturity 10.6% 10.9% 8.7% .625 .016
Language & Cognitive Development
6.6% 4.8% 5.8% .634 .932
Communication Skills & General Knowledge
8.3% 8.7% 10.7% .580 .542
Vulnerable on one or more EDI domains
25.7% 28.5% 23.5% .655 .008

Appendix J
100
Appendix J: Year 2 JK At‐risk group comparisons: Boys
Domains Mean
p‐value 2 years FDK group
1 year FDK group
No FDK group
Physical Health & Well‐being 8.72 8.78 8.84 .438
Social Competence 8.02 8.06 8.34 .462
Emotional Maturity 7.63 7.76 7.77 .072
Language & Cognitive Development 8.64 8.77 8.80 .041
Communication Skills & General Knowledge
7.75 7.71 7.88 .204

Appendix K
101
Appendix K: Year 2 JK At‐risk group comparisons: E/FSL children
Domains Mean
p‐value 2 years FDK group
1 year FDK group
No FDK group
Physical Health & Well‐being 9.06 8.72 8.93 .412
Social Competence 8.51 8.49 8.18 .175
Emotional Maturity 8.13 8.40 7.74 .056
Language & Cognitive Development 8.75 8.70 8.50 .822
Communication Skills & General Knowledge
7.56 6.94 6.97 .001

Appendix L
102
Appendix L: Year 2 JK At‐risk group comparisons: Children below the mean age (Mean Age = 5.74 years)
Domains Mean (SD)
p‐value 2 years FDK group
1 year FDK group
No FDK group
Physical Health & Well‐being 8.74 8.64 8.80 .165
Social Competence 8.28 8.11 8.53 .472
Emotional Maturity 7.85 7.94 8.07 .060
Language & Cognitive Development 8.68 8.76 8.71 .188
Communication Skills & General Knowledge
7.83 7.69 7.68 .455

Appendix M
103
Appendix M: Cross‐sectional analyses of differences in outcomes between the two JK cohorts
PHWB SOC EMOT LANGCOG COMGEN LOW
Response coeff S.E. coeff S.E. coeff S.E. coeff S.E. coeff S.E. coeff S.E.
Fixed Part
cons 5.37 0.42 4.936 0.545 5.731 0.448 2.161 0.569 2.526 0.735 3.329 0.697
Year 2 ‐0.159 0.629 0.223 0.833 ‐0.442 0.686 ‐2.274 0.872 ‐1.912 1.103 1.786 1.054
FDK year 1 and year 2 0.015 0.175 ‐0.131 0.178 ‐0.023 0.139 0.011 0.179 0.039 0.302 0.155 0.198
FDK year 2 only ‐0.067 0.179 ‐0.042 0.184 0.063 0.144 ‐0.305 0.185 ‐0.5 0.309 0.045 0.205
age 0.643 0.08 0.74 0.106 0.507 0.087 1.261 0.111 1.157 0.14 ‐0.872 0.138
M ‐0.274 0.06 ‐0.725 0.08 ‐0.816 0.066 ‐0.434 0.084 ‐0.758 0.106 0.625 0.098
E/FSL status ‐0.067 0.078 ‐0.316 0.102 ‐0.269 0.084 ‐0.763 0.107 ‐2.274 0.137 0.47 0.121
Year 2.FDK year 1 and year 2 ‐0.173 0.11 ‐0.07 0.145 ‐0.131 0.119 ‐0.073 0.152 0.024 0.193 0.037 0.176
Year 2.FDK year 2 only ‐0.212 0.118 ‐0.395 0.156 ‐0.21 0.128 0.521 0.163 0.174 0.208 0.176 0.19
Year 2.M ‐0.152 0.086 ‐0.17 0.114 ‐0.073 0.094 ‐0.232 0.119 0.1 0.151 0.279 0.14
Year 2.E/FSL status 0.142 0.103 0.201 0.136 0.166 0.112 0.28 0.142 0.416 0.181 0.152 0.164
Year 2.age 0.116 0.128 0.003 0.17 0.094 0.14 0.415 0.178 0.408 0.225 ‐0.432 0.217
Random Part
Level: sch_id
cons/cons 0.484 0.072 0.408 0.068 0.233 0.041 0.393 0.068 1.429 0.213 0.446 0.081
Level: id
bcons.1/bcons.1 1 0
cons/cons 1.712 0.04 3.02 0.07 2.055 0.048 3.314 0.077 5.27 0.123
‐2*loglikelihood: 13106.722 15193.737 13712.823 15535.053 17381.102
DIC:
pD:
Units: sch_id 124 124 124 124 124 124Units: id 3806 3806 3806 3806 3806 3806

Appendix N
104
Appendix N: Cross‐sectional analyses of differences in outcomes between the two SK cohorts
PHWB SOC EMOT LANGCOG COMGEN LOW
Response coeff S.E. coeff S.E. coeff S.E. coeff S.E. coeff S.E. coeff S.E.
Fixed Part
cons 5.311 0.581 5.496 0.795 5.084 0.675 4.357 0.669 3.146 1.055 3.309 1.111
Year 2 0.781 0.754 ‐0.072 1.044 0.681 0.886 ‐0.11 0.882 ‐1.29 1.381 0.399 1.485
FDK year 1 and year 2 0.237 0.183 0.021 0.194 ‐0.006 0.17 0.161 0.145 0.461 0.279 ‐0.127 0.244
FDK year 2 only ‐0.304 0.189 ‐0.008 0.204 0.061 0.178 0.005 0.154 ‐0.112 0.292 0.162 0.256
M ‐0.229 0.067 ‐0.648 0.093 ‐0.663 0.079 ‐0.31 0.079 ‐0.661 0.123 0.527 0.135
age 0.596 0.096 0.566 0.133 0.569 0.113 0.809 0.112 0.87 0.176 ‐0.796 0.187
E/FSL status 0.118 0.092 ‐0.211 0.127 ‐0.161 0.108 ‐0.231 0.106 ‐1.44 0.168 0.54 0.171
Year 2.FDK year 1 and year 2 ‐0.204 0.113 ‐0.191 0.156 ‐0.108 0.132 ‐0.167 0.13 ‐0.261 0.207 0.179 0.225
Year 2.FDK year 2 only 0.302 0.126 ‐0.178 0.172 ‐0.036 0.146 0.007 0.144 0.167 0.229 ‐0.037 0.245
Year 2.M 0.013 0.085 ‐0.08 0.118 ‐0.113 0.1 ‐0.103 0.1 0.032 0.156 0.152 0.173
Year 2.age ‐0.102 0.128 0.059 0.178 ‐0.086 0.151 0.052 0.15 0.306 0.235 ‐0.122 0.255
Year 2.E/FSL status ‐0.139 0.111 0.048 0.152 0.122 0.129 ‐0.081 0.128 0.057 0.202 ‐0.189 0.21
Random Part
Level: sch_id
cons/cons 0.484 0.072 0.41 0.07 0.329 0.055 0.183 0.035 0.953 0.154 0.494 0.098
Level: id
bcons.1/bcons.1 1 0
cons/cons 1.296 0.033 2.509 0.064 1.803 0.046 1.802 0.046 4.377 0.112
‐2*loglikelihood: 10058.011 12069.89 11034.505 10982.821 13856.472
DIC:
pD:
Units: sch_id 121 121 121 121 121 121
Units: id 3164 3164 3164 3164 3164 3164

Appendix O
105
Appendix O: Analyses of change in domain scores and vulnerability for the JK to SK cohort in the 2 years FDK group
PHWB SOC EMOT LANGCOG COMGEN LOW
Response coeff S.E. coeff S.E. coeff S.E. coeff S.E. coeff S.E. coeff S.E.
Fixed Part
cons 5.798 0.526 5.262 0.68 6.052 0.551 3.361 0.646 2.448 0.873 3.288 0.862
Year 2 0.145 0.105 ‐0.016 0.137 0.057 0.111 0.139 0.13 ‐0.041 0.175 ‐0.09 0.173
age 0.541 0.103 0.632 0.134 0.405 0.109 1.002 0.127 1.152 0.171 ‐0.816 0.171
M ‐0.307 0.068 ‐0.751 0.09 ‐0.784 0.073 ‐0.509 0.085 ‐0.85 0.114 0.672 0.113
E/FSL status 0.148 0.1 ‐0.056 0.128 ‐0.025 0.104 ‐0.366 0.122 ‐1.577 0.166 0.135 0.158
Random Part
Level: sch_id
cons/cons 0.433 0.108 0.319 0.093 0.201 0.059 0.332 0.094 0.938 0.245 0.564 0.16
Level: id
bcons.1/bcons.1 1 0
cons/cons 1.777 0.064 3.083 0.112 2.023 0.073 2.765 0.1 4.956 0.18
‐2*loglikelihood: 5421.213 6252.721 5593.238 6087.698 7014.371
DIC:
pD:
Units: sch_id 43 43 43 43 43 43
Units: id 1562 1562 1562 1562 1562 1562

Appendix P
106
Appendix P: Analyses of change in domain scores and vulnerability for the JK to SK cohort in the 1 year FDK group
PHWB SOC EMOT LANGCOG COMGEN LOW
Response coeff S.E. coeff S.E. coeff S.E. coeff S.E. coeff S.E. coeff S.E.
Fixed Part
cons 5.44 0.542 3.757 0.727 4.657 0.611 1.659 0.7 2.289 0.975 4.622 0.988
Year 2 0.086 0.11 ‐0.369 0.148 ‐0.198 0.124 0.321 0.143 0.355 0.198 0.278 0.2
Age 0.607 0.106 0.959 0.143 0.717 0.12 1.269 0.138 1.095 0.191 ‐1.113 0.198
M ‐0.196 0.074 ‐0.754 0.1 ‐0.796 0.084 ‐0.439 0.097 ‐0.854 0.133 0.689 0.131
E/FSL status ‐0.121 0.109 ‐0.305 0.144 ‐0.061 0.122 ‐0.566 0.137 ‐1.935 0.196 0.396 0.18
Random Part
Level: sch_id
cons/cons 0.332 0.09 0.232 0.078 0.173 0.057 0.115 0.048 0.875 0.244 0.292 0.108
Level: id
bcons.1/bcons.1 1 0
cons/cons 1.583 0.065 2.932 0.121 2.07 0.085 2.766 0.114 5.151 0.213
‐2*loglikelihood: 4073.835 4792.831 4371.671 4707.152 5498.25
DIC:
pD:
Units: sch_id 41 41 41 41 41 41
Units: id 1213 1213 1213 1213 1213 1213

Appendix Q
107
Appendix Q: Analyses of change in domain scores and vulnerability for the JK to SK cohort in No FDK group
PHWB SOC EMOT LANGCOG COMGEN LOW
Response coeff S.E. coeff S.E. coeff S.E. coeff S.E. coeff S.E. coeff S.E.
Fixed Part
cons 6.533 0.56 6.432 0.701 6.646 0.576 2.841 0.728 2.997 0.988 2.465 0.966
Year 2 0.164 0.116 0.054 0.146 0.098 0.12 0.192 0.152 ‐0.218 0.205 ‐0.056 0.201
age 0.408 0.109 0.45 0.137 0.333 0.113 1.094 0.144 1.008 0.192 ‐0.702 0.192
M ‐0.269 0.075 ‐0.771 0.095 ‐0.834 0.078 ‐0.414 0.1 ‐0.392 0.133 0.578 0.131
E/FSL status ‐0.11 0.095 ‐0.424 0.119 ‐0.271 0.098 ‐0.675 0.123 ‐1.897 0.168 0.699 0.158
Random Part
Level: sch_id
cons/cons 0.553 0.144 0.457 0.131 0.274 0.08 0.229 0.079 1.485 0.395 0.649 0.198
Level: id
bcons.1/bcons.1 1.627 0.067 2.628 0.109 1.782 0.074 2.922 0.121 5.104 0.211
cons/cons 1 0
‐2*loglikelihood: 4109.299 4668.203 4194.576 4774.51 5487.65
DIC:
pD:
Units: sch_id 40 40 40 40 40 40
Units: id 1210 1210 1210 1210 1210 1210