the foundation of our understanding of metabolic physiology is built on discoveries in fundamental,...
TRANSCRIPT

The foundation of our understanding of metabolic physiology is built on discoveries in fundamental, but isolated model systems.
Results from genes to organelles and cells may belie the physiognome.
A mechanism is only as important as its functional impact in the whole organism.

Well-Controlled Animal Models Bridge Cell Biology to
the Physiology of Exercise

The Study of Glucoregulation

Provocative or Sensitizing Tests
• Physical Exercise
• Hormone and Metabolic Challenges (e.g. hyperinsulinemic, euglycemic glucose clamps)
• Etcetera
Four Grams of GlucoseFour Grams of Glucose

Maintaining 4 Grams of Glucose in the Blood
Sedentary, Postabsorptive
Brain
Muscle
Liver
Fat
Liver
Blood
Glucose~4 grams

Maintaining 4 Grams of Glucose in the Blood
Feeding
Brain
Muscle
Liver
Fat
Liver
Blood
Glucose~4 grams
GI Tract
Stimulus(Insulin)
Suppression(Insulin)

Maintaining 4 Grams of Glucose in the Blood
Exercise
Brain
Muscle
Stimulus
Liver
Fat
Liver
Blood
Glucose~4 grams
Stimulus

Why don’t we get hypoglycemic when we exercise?
Exercise
Time (minutes)
-30
6
06
0100
0
GlucoseUtilization
Hepatic GlucoseProduction
Arterial PlasmaGlucose
mg·dl-1
mg ・ kg-1 ・min-1
mg ・ kg-1 ・min-1
If the liver does not release more glucose
during exercise
. . . Hypoglycemiarapidly ensues
0 60

Five Guiding Principles to Study of Metabolism in vivo
• Glucose metabolism is all about flux control.
• Glucose flux control is distributed amongst distinct systems that require an in vivo model to be fully understood.
• Glucose fluxes are most sensitively regulated and therefore best studied in the conscious state.
• Novel animal models can be used to bridge basic and clinical research.
• Provocative tests are often necessary to precipitate phenotypes and reveal functional limitations.

Endocrine and Sympathetic Nerve Response to Exercise
ArterialGlucagon
pg·ml-1
ArterialCatecholamines
pg·ml-1
Arterial Insulin
µU·ml-1
0
40
80
120
0
100
200
300
-60 -30 0 30 60 90 120 150
Exercise
Time (min)
Glucagon
Insulin
Norepinephrine
Epinephrine
0
8
12
16

A Minimal Overview of the Circulation
trunkand
lowerextremities
venous
arterial
portal vein
pancreasgutliver
Investigator sees…
Liver sees…
headand
upper extremities
heartandlungs

Chronically-Catheterized Conscious Dog Model

-50 0 50 100 150
PlasmaEpinephrine
(pg·ml-1)
Time (min)
ExerciseBasal
0
100
200
300
Arterial
Portal Vein
Hepatic Vein
-50 0 50 100 1500
100
200
300
Portal Vein
Hepatic Vein
Artery
Time (min)
ExerciseBasal
PlasmaGlucagon(pg·ml-1)
trunkand
lowerextremities
venous
arterial
portal vein
pancreasgutliver
Investigator sees…
Liver sees…
headand
upper extremities
heartandlungs

Protocols: Role of Glucagon
Equilibration Basal Moderate Treadmill Exercise
Basal Intraportal InsulinExercise-Simulated Intraportal Insulin
Saline Variable Glucose
Basal Intraportal Glucagon
Basal Intraportal GlucagonExercise-Simulated Intraportal Glucagon
-120 min -40 0 150
Protocol A
Protocol B
Somatostatin + [3-3H]glucose + [U-14C]alanine

0
50
100
150
Arterial Glucagon
pg/ml
Simulated Glucagon
Basal Glucagon
0
5
10
15
-60 -30 0 30 60 90 120 150
Time (min)
Arterial Insulin
µU/ml
Exercise
Exercise as a model to study glucagon action
Basal Glucagon
Simulated Glucagon

-40 0 30 60 90 120 1500
2
4
6
8
10
40
80
120
Arterial Plasma Glucose
mg·dl-1
Exercise
Basal Glucagon
SimulatedGlucagon
Basal Glucagon
Simulated Glucagon
Hepatic Glucose
Production
mg·kg-1·min-1
0
Exercise-induced Increment in Glucagon Stimulates Hepatic Glucose Production

Simulated Glucagon
Basal Glucagon
Exercise-induced Increment in Glucagon Stimulates Gluconeogenesis from Alanine
0
100
200
300
400
0
100
200
300
400
Gluconeogenesisfrom Alanine
(% Basal)
IntrahepaticGluconeogenicEfficiency
from Alanine
(% Basal)
Simulated Glucagon
Basal Glucagon
-60 -30 0 30 60 90 120 150
Time (min)
Exercise

0
1
2
3
4
5
6
Rest
Increase in Endogenous
GlucoseProduction
(mg·kg-1·min-1)
Exercise
Comparison of the Effects of Similar
Increases in Glucagon at Rest
and during Exercise

Why is Glucagon so Effective during Exercise?
Liver
Insulin
Glucagon
Adipose
WorkingMuscleWorkingMuscle
GlycerolNEFA
LactateAmino Acids
GlyGly
GNGGNG
Autonomic Nerve Activity
Epi
?
AminoAcids
Substrates
Signals
PancreasPancreas
IntestineIntestine
AdrenalAdrenal
Glucose4 gramsGlucose4 grams
BrainBrain
IL6
RBP4
Body is in a ‘Gluconeogenic Mode’
Effects are Potentiated by the Fall in Insulin
Glucose Uptake Prevents Hyperglycemia
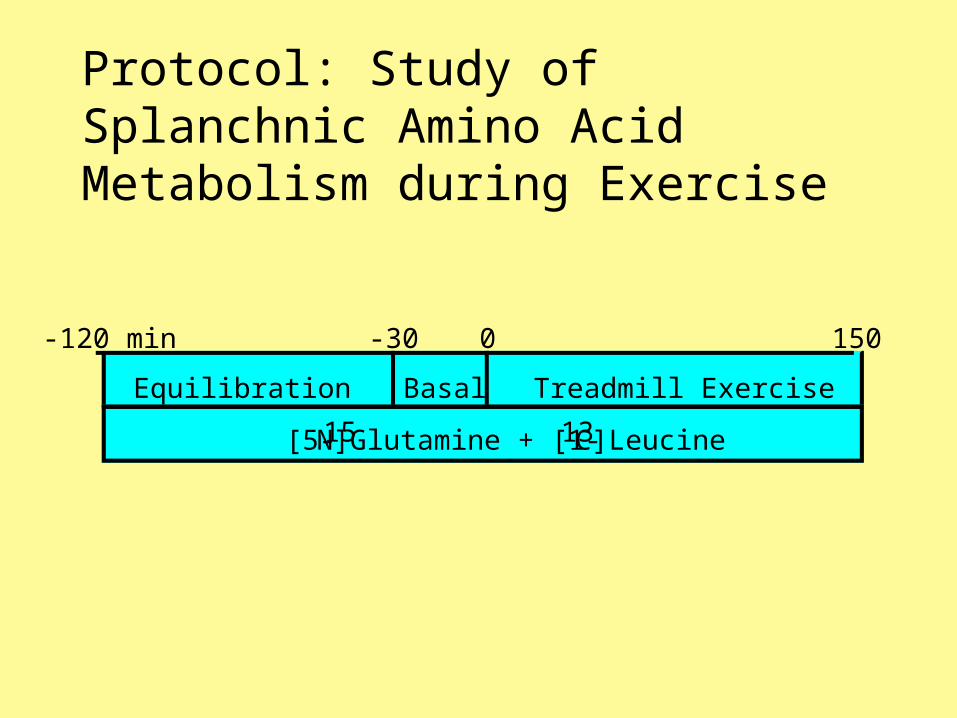
Protocol: Study of Splanchnic Amino Acid Metabolism during Exercise
Equilibration Basal Treadmill Exercise
-120 min -30 0 150
[5-15N]Glutamine + [1-13C]Leucine

The Exercise-induced Glucagon Response is Essential to the Increment in Hepatic Glutamine Extraction
0.00
0.20
0.40
0.60
25-50 75-100 125-150
Exercise Duration(min)
Basal 25-50 75-100 125-150
Exercise Duration(min)
Basal
HepaticFractionalGlutamineExtraction
Simulated Glucagon Basal Glucagon
**
*
††

The Exercise-induced Glucagon Response Drives Urea Formation in the Liver
Simulated Glucagon
0
5
10
15
20
25-50 75-100 125-150
Exercise Duration (min)
Basal 25-50 75-100 125-150
Exercise Duration (min)
Basal
Net HepaticUrea Output(mol·kg-1・ min-1)
**
*
Basal Glucagon
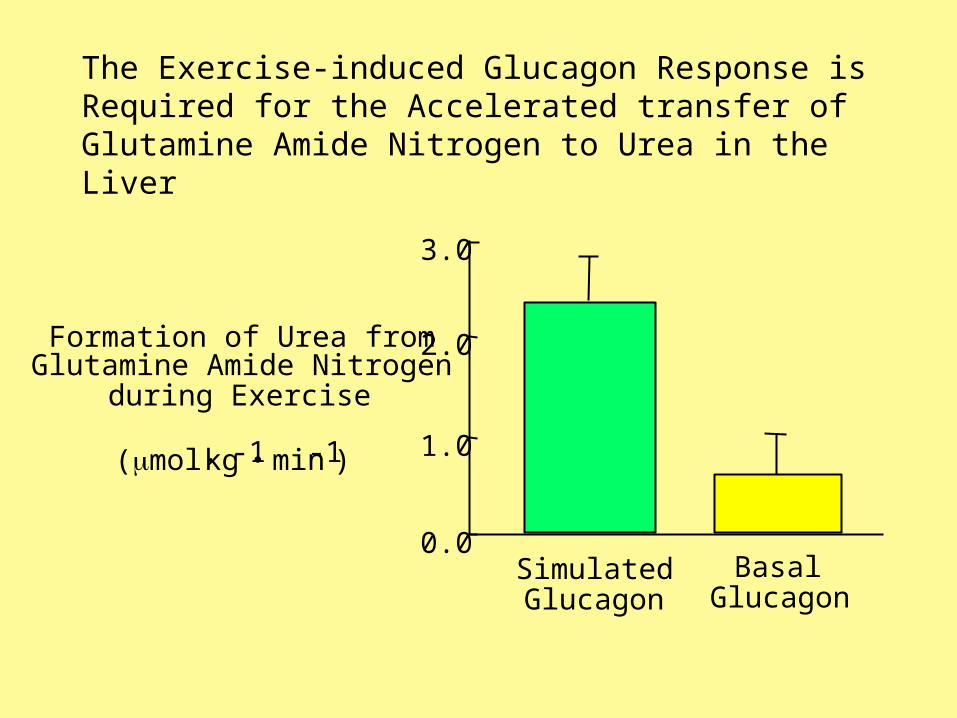
The Exercise-induced Glucagon Response is Required for the Accelerated transfer of Glutamine Amide Nitrogen to Urea in the Liver
Formation of Urea fromGlutamine Amide Nitrogen
during Exercise
(mol·kg-1・ min-1)
SimulatedGlucagon
BasalGlucagon
0.0
1.0
2.0
3.0

Energy State and the Liver

Energy State in the Liver is Controlled by Glucagon

*
Studies using the Phloridzin-Euglycemic Clamp further Illustrate the Role of Glucagon in Liver Energy Balance

Blood is Regulated like a Homeostat
Liver is the Battery (rechargeable)
RBP4
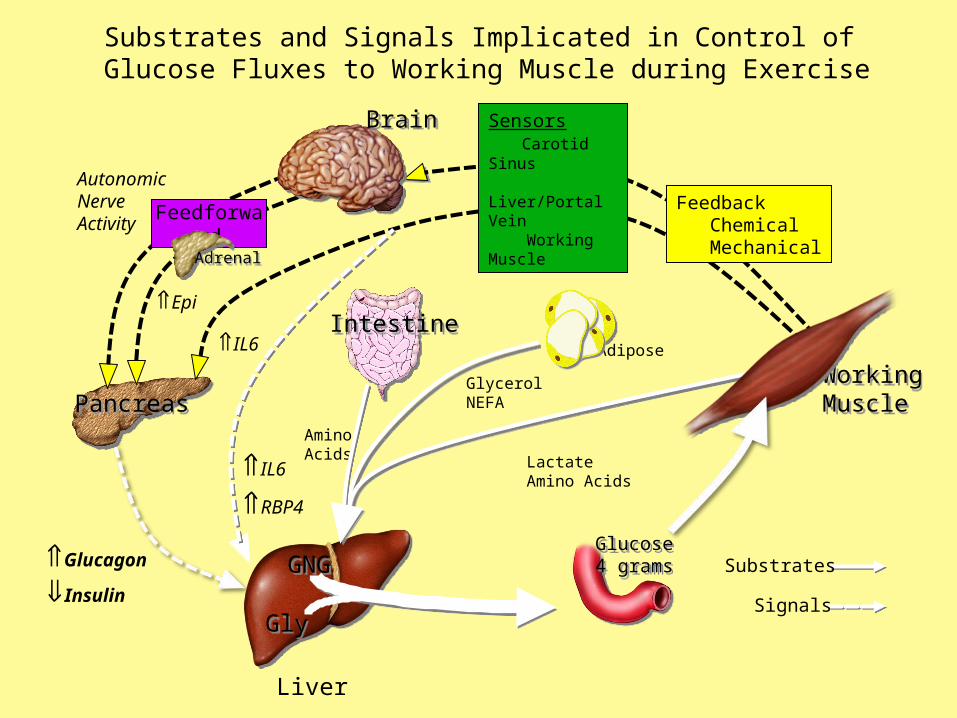
Substrates and Signals Implicated in Control of Glucose Fluxes to Working Muscle during Exercise
Liver
Adipose
GlycerolNEFA
LactateAmino Acids
GlyGly
GNGGNG
Epi
AminoAcids
Substrates
Signals
PancreasPancreas
IntestineIntestine
Glucose4 gramsGlucose4 grams
BrainBrain
IL6
Sensors Carotid Sinus Liver/Portal Vein Working Muscle
Feedforward
Feedback Chemical Mechanical
WorkingMuscleWorkingMuscle
Autonomic Nerve Activity
AdrenalAdrenal
Insulin
Glucagon
IL6

What about the Famous Catecholamine Response to Exercise?
• Epinephrine plays little to no role in control of glucose production during exercise. Moates et al Am J Physiol 255: E428-E436, 1988.
• Hepatic nerves are not necessary for the exercise-induced rise in glucose production. Wasserman et al Am J Physiol 259: E195-E203, 1990.
• Liver specific blockade of both - and -adrenergic receptors do not attenuate the increase in glucose production during exercise. Coker et al Am J Physiol 273: E831-E838, 1997. Coker et al Am J Physiol 278: 444-451, 2000.

Catecholamines
Essential, in association with the fall in insulin, for extrahepatic substrate mobilization during exercise.
Muscle glycogenolysis
Adipose tissue lipolysis

Glycerol
NE
TG
NEFA Flux is Accelerated during Moderate Exercise by Increased Lipolysis and Decreased Re-esterification
Glucose
FFA
TG
Glycerol
TG
FFA
FFA
TG
Glycerol
G3P
ATP

Glycerol
NE
TG
NEFA Flux is Accelerated during Moderate Exercise by Increased Lipolysis and Decreased Re-esterification
Glucose
FFA
TG
Glycerol
TG
FFA
FFA
TG
Glycerol
G3P
ATP

Four Grams of GlucoseControlling Rate of Removal
• blood flow• capillary recruitment• spatial barriers
Extracellular Membrane
• hexokinase #• hexokinase compartmentation• spatial barriers
Intracellular
glucose 6-phosphate
glucose
• transporter #• transporter activity

Strategy
Selectively remove sites of resistance to MGU in conscious mice by using transgenic mice or pharmacological methods.

Ohm’s Law Applied to Glucose Influx
V1 V2 V3 V4Resistor1 Resistor3Resistor2
Current (I)
V1 = I · Resistor1
Gextracell= Ig · Rextracell
Ga Ge Gi 0RExtracell RTransport RPhosp
Glucose Influx (Ig)
Gtransport= Ig · Rtransport Gphos = Ig · RPhosp
V2 = I · Resistor2 V3 = I · Resistor3

Ohm’s Law to Determine Sites of Resistance to Muscle Glucose Uptake
Ga Ge Gi 0
Glucose Influx
WT
GLUT4Tg
HKTg
GLUT4Tg
HKTg
Transgenics

ptf 2002/jea 2005
Chronically Catheterized, Conscious Unstressed Mouse
[2-14C]DG
Vein Artery
Sample
Insulin
Glucose
Blood
[3-3H]Glc
From: Glucose Clamping the Conscious Mouse by Vanderbilt MMPC 2005

Metabolic Control Analysis of MGU
• Control Coefficient ( C ) = lnRg/ln[E]
• Sum of Control Coefficients in a Defined Pathway is 1
i.e. Cd + Ct + Cp = 1

Control Coefficients for MGU by Mouse Muscle Comprised of Type II Fibers
Rest
Insulin(~80 µU/ml)
Delivery Transport Phosphorylation
0.1 0.9 0.0
0.5 0.1 0.4

Exercise Protocol
Acclimation Sedentary or Exercise
-90 30 min50
[2-3H]DG Bolus
Excise Tissues

Sedentary and Exercising Mice
WTHKTg
GLUT4Tg
HKTg + GLUT4Tg
0
50
100
150
200
250
0 5 10 15 20 25 30
Time (min)
Sedentary
0 5 10 15 20 25 30
Time (min)
Exercise
* * * ** *
* *
**
Blood Glucose (mg·dl-1)
Fueger et al. Am J Physiol; 286: E77-84, 2004

Sedentary and Exercising Mice
0
20
40
0
10
20Muscle Glucose Uptake
(mol·100g-1·min-1)
Sedentary
Exercise
SVL
Gastrocnemius
0
50
100Soleus
GLUT4Tg
†
†
WT
†
†
†
HKTg
+ GLUT4Tg
HKTG
†
†
†
Fueger et al. Am J Physiol; 286: E77-84, 2004

Control Coefficients for MGU by Mouse Muscle Comprised of Type II Fibers
Exercise
Delivery Transport Phosphorylation
0.1 0.9 0.0
0.5 0.1 0.4
0.2 0.0 0.8
Rest
Insulin(~80 µU/ml)
Distributed Control of Muscle Glucose Uptake
• Transport is clearly the primary barrier to muscle glucose uptake in the fasted, sedentary state.
• Transport is so effectively regulated by exercise and insulin that the membrane is no longer the primary barrier to muscle glucose uptake.
• The resistance to insulin-stimulated muscle glucose uptake with high fat feeding is due, in large part, to defects in the delivery of glucose to the muscle.
The vast majority of the literature on the regulation of glucose uptake is comprised of studies in isolated muscle tissue or cells that are blind to fundamental control mechanisms involved in muscle glucose uptake.

Four Grams of Glucose
Extracellular Membrane IntracellularLivergluconeogenic precursorsglycogen
glucose 6-phosphate
The distributed control of blood glucose allows for more precise control of glucose homeostasis, multiple mechanisms of glucose flux control, and multiple targets to correct dysregulation of metabolism such as is seen in diabetes
Carefully conducted studies in the whole animal are necessary to
ascribe function to putative controllers of glucose homeostasis.
Extracellular Membrane Intracellular
glucose 6-phosphate
glucose