the forensic analysis of skin-safe stamp pad inks
TRANSCRIPT

City University of New York (CUNY) City University of New York (CUNY)
CUNY Academic Works CUNY Academic Works
Student Theses John Jay College of Criminal Justice
Spring 5-2019
The Forensic Analysis of Skin-Safe Stamp Pad Inks The Forensic Analysis of Skin-Safe Stamp Pad Inks
Swetha Rajagopal CUNY John Jay College, [email protected]
How does access to this work benefit you? Let us know!
More information about this work at: https://academicworks.cuny.edu/jj_etds/110
Discover additional works at: https://academicworks.cuny.edu
This work is made publicly available by the City University of New York (CUNY). Contact: [email protected]
The Forensic Analysis of Skin-Safe Stamp Pad Inks
A Thesis Presented in Partial Fulfillment of the Requirements for the Degree of
Master of Science in Forensic Science
John Jay College of Criminal Justice
The City University of New York
Swetha Rajagopal
May, 2019

The Forensic Analysis of Skin-Safe Stamp Pad Inks
Swetha Rajagopal
This thesis has been presented to and accepted by the office of Graduate Studies, John
Jay College of Criminal Justice in partial fulfillment of the requirements for the degree of
Master of Science in Forensic Science.
Thesis Committee:
Thesis Advisor: Dr. Thomas A. Kubic
Second Reader: Dr. Michelle D. Miranda
Third Reader: Dr. John R. Lombardi

Table of Contents Pages
Acknowledgments i
Abstract ii – iii
Introduction 01 – 08
Literature Review 08 – 16
Chemistry of Pigments and Dyes 16 – 21
Theory of Instrumental Approach 21 – 38
Methods and Materials 38 – 52
Results and Discussion 52 – 105
Conclusion 105 – 112
References 113 – 121
Appendix 122 – 123

i
Acknowledgements
I have been guided and supported by several members of the John Jay College
faculty and staff, friends and colleagues during the course of my research and would like
to acknowledge and thank the following people.
I am very grateful to Dr. Michelle Miranda who presented me with the wonderful
opportunity to work with her for my Master’s thesis; her guidance and support was very
encouraging during the course of my research, Dr. Thomas Kubic for dedicating time to
critique my writing and providing me with knowledge that allowed me to explore
additional avenues for my research and finally, Dr. John Lombardi for agreeing to
critically review the thesis.
A lot of the research work was performed at John Jay College, and I would like to
specifically thank Argeliz Pomales, who provided a lot of instrumental guidance and
support as well as other adjunct faculty or staff in the instrumental as well as
criminalistics laboratories who provided me with access to instruments so that I could
complete my research in a timely fashion.
Lastly, I would like to thank my friends and family for being a great support
system throughout my time at John Jay College.
ii
Abstract
Skin-safe stamp pad inks are currently being used at locations such as clubs, zoos
and other events with the purpose of stamping individuals that visit the location. This is
done in an attempt to monitor the number and activity of visitors. Ink manufacturing
companies generally tend to experiment with a number of different combinations of the
different components of ink, in order to obtain desirable properties. The combinations are
usually proprietary and that very nature of the inks end up making them, possibly unique
and individual. The analysis, identification and possible individualization of the chemical
composition of these inks could play a significant role in providing crucial evidential
information to investigators in forensic cases. The aim of this research was to
scientifically evaluate these inks by documenting the physical properties of the inks both
macroscopically and microscopically and by identifying the optical and chemical
properties of the ink components spectroscopically. The application of Ultraviolet-Visible
(UV-VIS) Spectroscopy and Fourier-transform Infrared Spectroscopy (FT-IR) to the
analysis of skin safe stamp pad inks sold for temporary tattooing purposes, has been
explored in this project.
Results from this study indicated that each step of the analysis and each technique
used by itself, was powerful to get us closer and closer to a full discrimination of the ink
samples and by combining the steps, all the analyzed samples were successfully
discriminated. The results from this research can be used as reference spectra for
potential skin-safe stamp pad ink forensic evidence. Furthermore, the use of the Bio-Rad
software to make positive correlations with the reference samples listed in the software’s
extensive database acted as a key first step towards possibly determining the identity of

iii
the components in the ink samples. Additional analysis using other techniques such as X-
Ray fluorescence or Raman Spectroscopy could reveal more information about the
different components of skin-safe inks.

1
Introduction
Stamps and seals have served numerous purposes in the past, and continue to do
so in the present. Historically, ink-based stamp pads were used as a transfer medium in
the authentication of official and non-official documents in the form of printing seals or
fingerprints (Barns, 2010). The earliest example of stamp inks comes from Asia, in the
form of woodblock printing, where a craftsman would carve an image into the surface of
a wood block, which would then be inked and applied to fabric or paper to create an
image (Hind, 1963). The invention of block printing necessitated the sister invention,
printing ink, for use with the blocks. Numerous modifications to this historical block
printing design as well as the inks used with the blocks, resulted in the invention of stamp
pads (Kelly, 2002, Yao et al., 2009). Presently, in addition to their application to paper,
ink pads and uniquely designed rubber stamps have found use in various venues such as
night clubs, bars, concerts, zoos, amusement parks, children’s themed restaurants,
hospitals and a myriad of locations where the need to identify an individual or track an
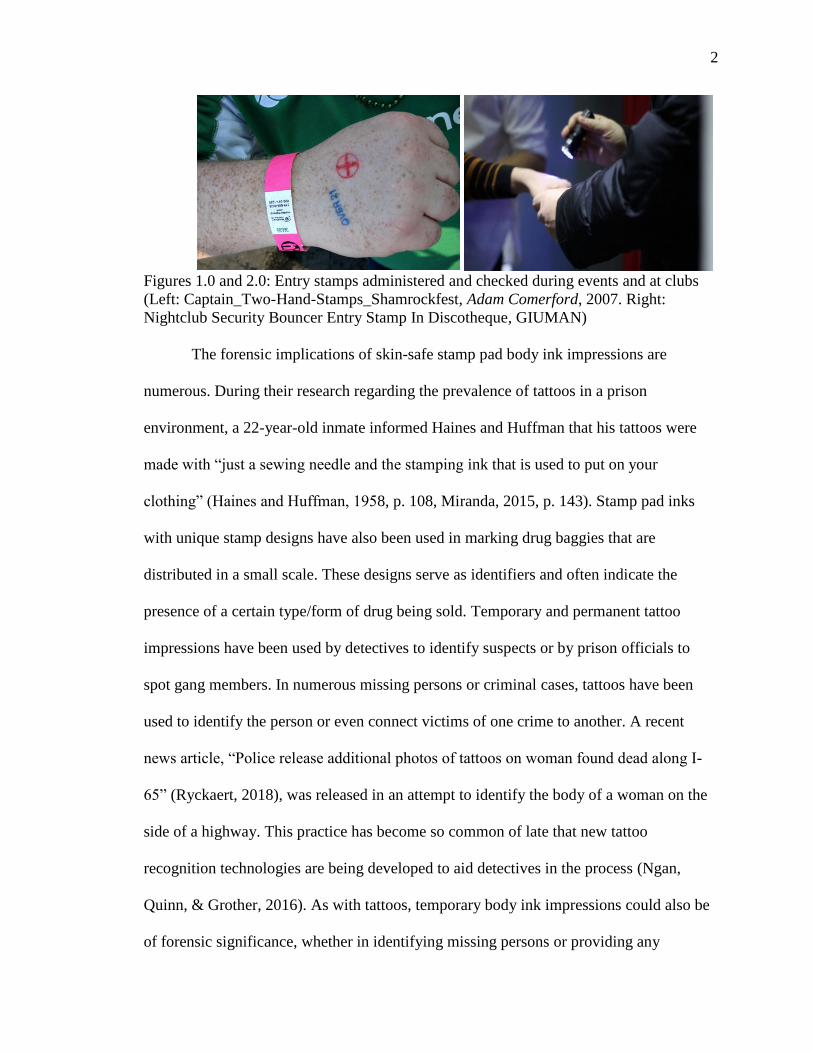
individual’s movement arises (Figures 1.0 and 2.0). For example, Chuck E. Cheese’s®, a
family-oriented restaurant and game room, has a Kid Check® program stating, “Every
member of a party—adult and kid; family or group—who enters Chuck E. Cheese’s gets
a unique hand stamp that is verified upon their exit to assist in our objective that families
who come together leave together” (Miranda, 2015, p. 143). These hand stamps at any of
the above-mentioned venues may be latent or patent; the latent stamps often employing a
luminescent dye that can be detected using a “black light” or alternate light source and
the patent stamps being any color based on the stamp pad employed (Miranda, 2015, p.
144).
2
Figures 1.0 and 2.0: Entry stamps administered and checked during events and at clubs
(Left: Captain_Two-Hand-Stamps_Shamrockfest, Adam Comerford, 2007. Right:
Nightclub Security Bouncer Entry Stamp In Discotheque, GIUMAN)
The forensic implications of skin-safe stamp pad body ink impressions are
numerous. During their research regarding the prevalence of tattoos in a prison
environment, a 22-year-old inmate informed Haines and Huffman that his tattoos were
made with “just a sewing needle and the stamping ink that is used to put on your
clothing” (Haines and Huffman, 1958, p. 108, Miranda, 2015, p. 143). Stamp pad inks
with unique stamp designs have also been used in marking drug baggies that are
distributed in a small scale. These designs serve as identifiers and often indicate the
presence of a certain type/form of drug being sold. Temporary and permanent tattoo
impressions have been used by detectives to identify suspects or by prison officials to
spot gang members. In numerous missing persons or criminal cases, tattoos have been
used to identify the person or even connect victims of one crime to another. A recent
news article, “Police release additional photos of tattoos on woman found dead along I-
65” (Ryckaert, 2018), was released in an attempt to identify the body of a woman on the
side of a highway. This practice has become so common of late that new tattoo
recognition technologies are being developed to aid detectives in the process (Ngan,
Quinn, & Grother, 2016). As with tattoos, temporary body ink impressions could also be
of forensic significance, whether in identifying missing persons or providing any

3
information that may help in the establishment of a timeline. Hence, body ink plays
multiple roles in the investigative process, the most important one being the provision of
leads that could help connect discontinuous pieces of information.
The ink sold for the purpose of use on skin is marketed and advertised as being
“skin safe”. This differentiates it from inks and ink pads that are sold for artistic purposes
i.e. for use on any media other than skin, that don’t indicate on their packaging whether
the ink is okay for use on skin. Although a lot of the original stamp pad inks were used in
fingerprinting official documents in the past, no attempts were made then to develop and
use inks that were “skin safe”. The relatively recent knowledge of consumerism and
consumer health may have created this recent need for inks that are “skin-safe”, due to
which these inks now exist and must be evaluated. Figures 3.0-5.0 below show the
advertisements of various temporary tattoo ink brands.
Figures 3.0-4.0: Advertisement on online websites that promotes the non-toxic, skin safe
use of the temporary tattoo inks. The advertisement also highlights the use of such inks
that are sold specifically for the purpose of being used to track a person at social
gatherings and amusement parks. Left: Screenshot of Aero brand ink product
specifications showing “skin” as a surface of application, obtained from Marking Device
Inks (n.d.), Right: Screenshot of Tattoo brand ink showing the message, “For use on
skin” obtained from Tattoo Ink Stamp Pads (n.d.)

4
Figure 5.0: Screenshot of invisible ink samples that says, “tested and approved for safe
use on skin” and also provides recommendations for the use of the ink, obtained from:
RubberStampChamp.com (n.d.)
The first stamp pad inks that were invented were natural, oil-based spreads,
usually prepared using linseed oil and developed for the purpose of use on documents
(Kelly, 2002, Mitchell & Hepworth, 1904). An oil-based media was initially employed
since they stuck easily to the metal surface of the blocks, but they were hard to use as the
oil made the blocks slippery due to the lengthy time that the ink took to dry (Kelly,
2002). To combat those problems, components such as litharge (one of the natural
mineral forms of Lead (II) Oxide, frequently used in the manufacture of glass, paints,
inks and pottery) and vegetable oils were used to shorten the drying process (Kelly,
2002). The 19th century saw the rise of petroleum distillation and the formation of by-
products that were used as solvents in these inks (Todd, Chessin, Colman & U.S, 1999).
These solvents not only shortened the drying process even further, their discovery was
also important in the invention of color printing inks. Addition of these solvents also
helped keep the stamp pad inks from drying up or becoming watery while still in the pad
(Waters, 1940). A petroleum shortage in the 1970s resulted in the creation of water and
pigment-based inks (Erhan & Bagby, 1992). Inks have since gone through a variety of

5
developments, starting with lamp black added to natural gum being used as writing ink in
2500 BC to modern ink formulations today that contain not just the pigment or dye but
also additional ingredients that are collectively known as the vehicle (Kelly, 2002). These
alterations and adjustments were solely made in an attempt to improve inks that were
meant to be used on surfaces other than skin. With the new found purpose of inks and
stamps in creating temporary tattoos, manufacturers have had to design inks that are
“safe” for use on skin, i.e. a recipe that would not cause any severe reactions when they
were used for that purpose. This meant that the usual harsh solvents that may be used in
artistic and writing inks, could not be added to skin-safe inks and manufacturers had to
turn to more natural ingredients. The unique combination of the vehicle ingredients with
the main pigment or dye, is what gives each of these “skin-safe” inks their
individualizing characteristics, providing scientists the potential power to discriminate
between different types of inks. Ink companies also tend not to reveal their formulations
in entirety in order to safeguard proprietary information therefore there are multiple
unknown components of the ink that can be identified and consequently used for the
purpose of characterizing it.
The forensic examination of ink is not recent since reports indicate that the first
report in court of the results of a chemical examination of ink on a questioned document,
occurred in 1889 in New York County (Neumann, Ramotowski, & Genessay, 2011). Ink
analysis revolves around the classification and identification of the various components
of ink the make up the two main portions: the colorant and the vehicle. The recent
increase in demand for skin-safe inks and a resulting increase in competition, has
compelled manufacturers to develop various formulations of these inks in order to keep

6
up with the changes in technological features, various cost considerations and the
availability of raw material. The use of different ingredients means higher discriminating
power between various brands and colors, which lends more reliability to the forensic
examination of these inks.
Most of the literature in the current forensic science community pertains to
analysis and discrimination of printing or writing inks. Body inks could also be analyzed
using the techniques that have been applied to printing or writing ink. There is also
currently, a lack of an established and systematic method of analysis of these types of
inks for identification and comparison. While there have been numerous studies
conducted regarding permanent tattoo ink and stamp pad ink analysis as well as its
detection and visualization on skin and documents respectively, none have explored the
ink sold for the purpose of temporary use on skin. Additionally, forensic science
literature has largely focused on reflected infrared and ultraviolet radiation photography
techniques with regard to the visualization of obscured tattoo impressions on various
surfaces, but mainly skin (Miranda, 2012). While this is a fast and relatively simple first-
step analysis it may not always be useful in cases where the body has been burnt or
drowned or time since death has been long enough for the forces of nature to affect the
tattoo or body ink in a negative manner (Miranda, 2012). In that scenario, spectroscopic
techniques that explore the ink itself are useful as they may be able to detect residual
pigments, dyes or solvents that have seeped into the lower layers of the skin and are
relatively protected from outside elements and invisible to the naked eye (Miranda,
2012).
7
The research of temporary body ink serves to provide important information
regarding the type of analysis to perform and the nature of information that one could
possibly gain from it. The results could add to the growing instrumental database for
pigment as well as dye-based inks. Creating a visual, microscopic and spectroscopic
analysis database of body inks along with describing the interactions of the organic and
inorganic pigments or dyes with various extraction solvents will allow for the
development of a thorough analytical method that can be validated to conform to current
forensic laboratory accreditation standards and the satisfaction of legal standards for
court cases such as Frye, Daubert and the Federal Rules of Evidence (Miranda, 2012).
Forensic ink examination serves to contribute to the determination of facts in civil and
criminal investigations but surely every ink analysis presented in court is susceptible to
the rules of admissibility. Therefore, it is the responsibility of the forensic scientist to
utilize a validated method for the assessment of inks in a forensic scenario (Miranda,
2012).
The aim of this research is to scientifically evaluate inks sold for the purpose of
being safely used on skin by documenting the physical properties of the inks both
macroscopically and microscopically and by identifying the optical and chemical
properties of the ink components spectroscopically. This will be done in an effort to
qualitatively identify the different ink samples and may result in the ability to
discriminate between similar colors, different lot numbers of same color and between
different brands of inks. Possible identifications can be made using spectral comparison
software that contain databases with UV-VIS and IR spectra information for various ink
components. The research also hopes to fill the informational gaps that exist regarding
8
the use of skin safe ink in forensic science as well as in ink chemistry. The visual and
microscopy techniques would inform us about the components of the ink- organic or
inorganic dyes/pigments, vehicles, solvents and other added components that lend
stability to the ink. Comparison of the material safety data sheet (MSDS) to the results
obtained post-analysis would inform us about the consistency between the two as well as
any inconsistencies that could make the inks unsafe for skin. Using that information,
additional research can be done to evaluate the reactions, if any, that these inks have on
skin. That information could potentially be of investigative importance to detectives or
pathologists in cases involving unidentified remains. Finally, the spectroscopy results will
provide more details about the components of the inks in a molecular and atomic scale as
well as the behavior of the dye or pigments under various conditions. Understanding the
behavior of these inks under these various conditions could aid pathologists and
detectives in the development and identification of the unique patterns/ designs of the
tattoo. Knowing the tattoo design will provide further investigatory information that can
be used in a missing person’s case.
Literature Review
Some research has been done, focusing on stamp pad inks that are used in
documents or for artistic purposes. In 1989, Jasuja, Singla, & Seema, examined black,
violet, green, and red stamp inks from India using thin layer chromatography (TLC).
Different shades of the dye spots and their Rf values were reported by the authors. The
authors reported that
It is evident … that the dye constituents of all the four brands could be
successfully separated with four different solvent systems using one system for

9
each colour. Among these inks, the black, green, and red inks of four brands were
found to be non-identical in their dye compositions, whereas all the four violet
inks showed [the] same dye constituents as is evident from the same number of
color spots with [the] same shades and Rf values. After trying a number of solvent
systems and their mixtures in various proportions, it was also observed that the
dye constituents of all the four colour[s] could not be separated with one solvent
system, rather different solvent system[s] for each color had to be evolved. (Jasuja
et al., 1989, p. 256)
These authors did not attempt to identify the chemical compositions of the inks or
the individual constituents resolved on the TLC plates. Refer to figure 6.0 below for the
various shades of dye spots and their respective Rf values for the examined brands and
colors.
Figure 6.0: Table 1 from “Thin-Layer Chromatographic Analysis of Indian Stamp Pad
Inks (Jasuja, Singla, & Seema, 1989). This figure illustrates the Rf value and dye spot
information for four different brands of black, green, red and violet stamp pad ink
examined by the authors.
In a similar study, Dirwono et al. (2010) studied 13 red sealing inks from Korean
stores (manufacturers included those from Korea, Japan, and China) by applying micro-
10
attenuated total reflectance FTIR spectroscopy. The authors reasoned that due to the
highly subjective nature of visual color identification and analysis, a nondestructive and
objective method of analysis such as micro-ATR FTIR spectroscopy, would be most
desirable. Upon visual examination, the authors reported that the colors of the inks
varied, some exhibiting a red color and others exhibiting a purple red color (Dirwono et
al., 2010). Results showed that micro-ATR FTIR can differentiate seal inks having the
same color but different manufacturer. Additionally, the authors compared spectra in
blind studies to determine whether or not the inks could be differentiated by analytical
means and concluded that an accurate identification was possible using this method. The
authors further conducted studies comparing the intersection of seal inks to ballpoint pen
inks and found that the pen inks had some bands that were characteristic to pen ink
samples only and were missing in the stamp sealing ink samples. (Dirwono et al., 2010).
Figure 7.0 shows the typical ATR-FTIR spectra for seal inks of the same color but
different manufacturer.

11
Figure 7.0: Figure 1.0 from “Application of micro-attenuated total reflectance FTIR
spectroscopy in the forensic study of questioned documents involving red seal inks”
Dirwono et al. (2010). The figure illustrates the typical ATR-FTIR spectra that one would
expect for seal inks. As you can see in the fingerprint region of the IR spectra (~1500 cm-
1 – 500 cm-1), samples from different manufacturers for the same color of seal ink, show
individualizing characteristic bands.
In their 2013 publication, Raza and Saha examined nine blue color stamp inks
manufactured in India using both Raman spectroscopic and high-performance TLC
methods; the authors reported that upon initial examination, the colors appeared different
when stamped on a piece of paper, with some appearing violet, one appearing blue-black
and one appearing blue. The authors reported crystal violet as being a component in some
of the stamp pads analyzed and that classification of the inks based on Raman
spectroscopy resulted in the ability to classify the nine stamp inks into five groups. The
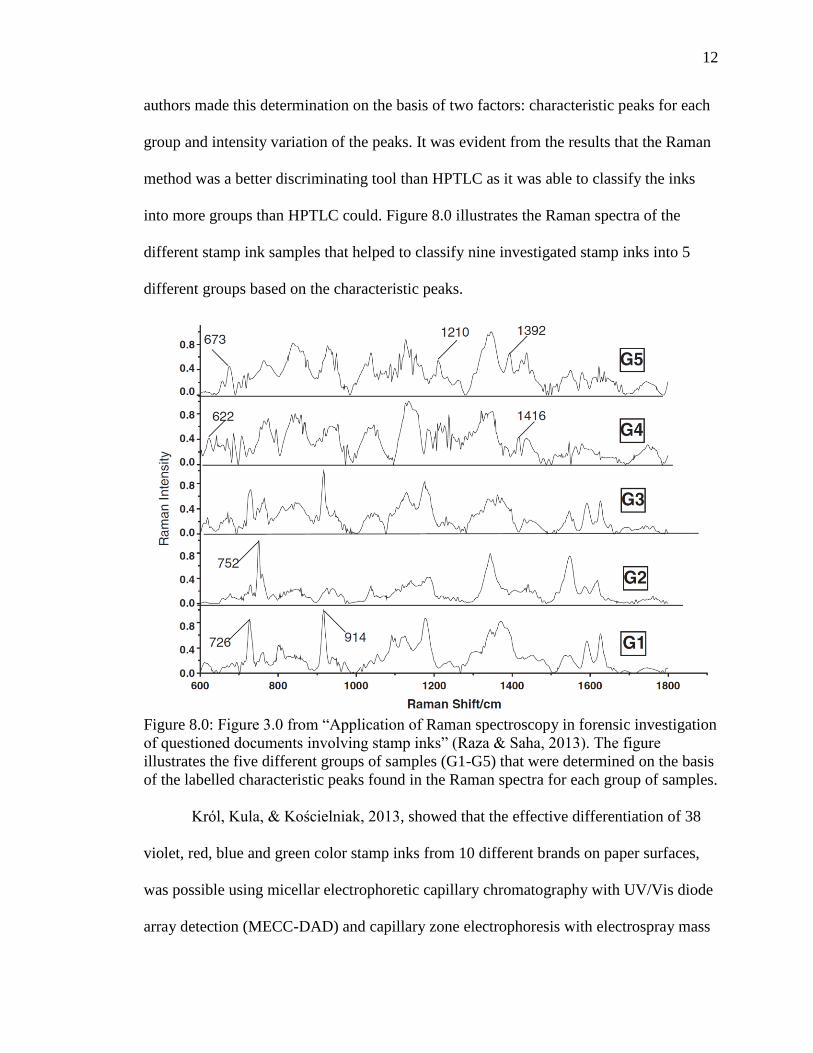
12
authors made this determination on the basis of two factors: characteristic peaks for each
group and intensity variation of the peaks. It was evident from the results that the Raman
method was a better discriminating tool than HPTLC as it was able to classify the inks
into more groups than HPTLC could. Figure 8.0 illustrates the Raman spectra of the
different stamp ink samples that helped to classify nine investigated stamp inks into 5
different groups based on the characteristic peaks.
Figure 8.0: Figure 3.0 from “Application of Raman spectroscopy in forensic investigation
of questioned documents involving stamp inks” (Raza & Saha, 2013). The figure
illustrates the five different groups of samples (G1-G5) that were determined on the basis
of the labelled characteristic peaks found in the Raman spectra for each group of samples.
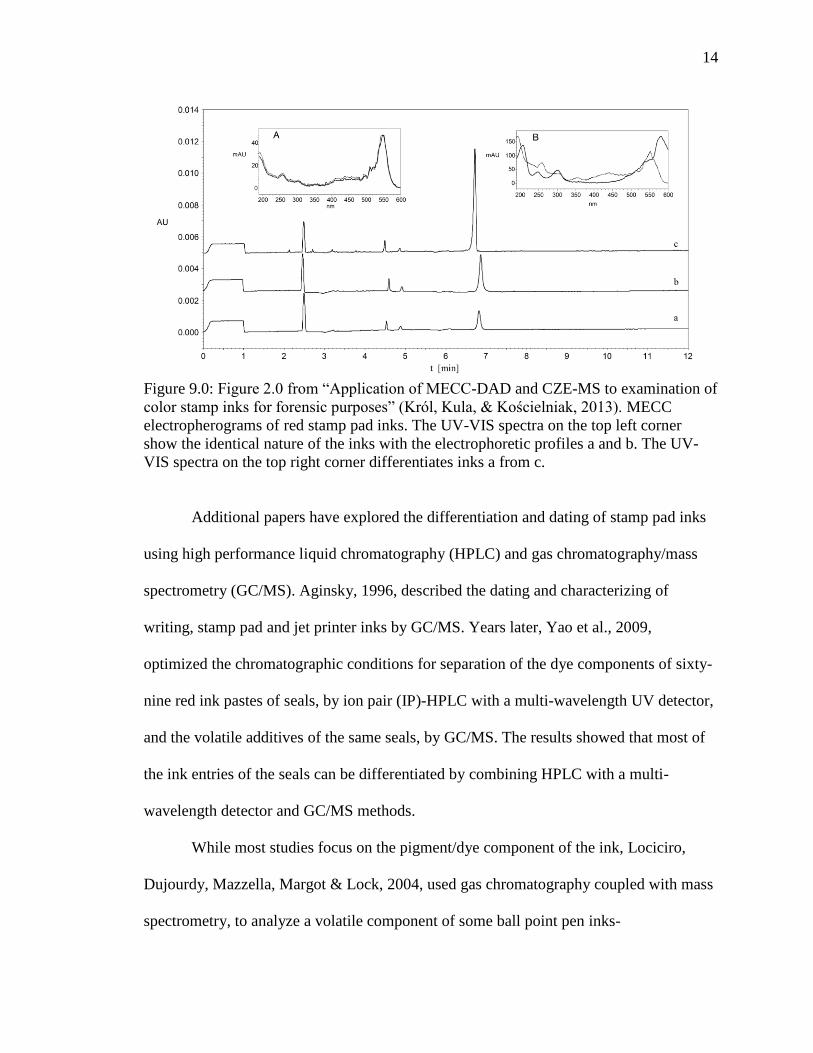
Król, Kula, & Kościelniak, 2013, showed that the effective differentiation of 38
violet, red, blue and green color stamp inks from 10 different brands on paper surfaces,
was possible using micellar electrophoretic capillary chromatography with UV/Vis diode
array detection (MECC-DAD) and capillary zone electrophoresis with electrospray mass
13
spectrometric detection (CZE-ESI/MS). The authors found that the different colored inks
that they analyzed could be differentiated on the basis of migration time and their UV/Vis
spectra, provided that there was more than one characteristic peak for each sample. Inks
that had only one dye component that was similar to each other were more difficult to
characterize and had to be additionally differentiated using CZE-MS. The electrophoretic
profiles for the group of nine green inks were different from each other in terms of
number of peaks and their relative migration times. The UV/Vis spectra obtained for their
respective peaks were also different. The authors explain that this could be due to the fact
that the composition of green ink was sufficiently complex to provide an opportunity for
relatively easy differentiation. A similar result was seen with the red stamp inks.
Dissimilarities between electrophoretic profiles of most of the samples were great enough
to allow them to be distinguished from each other. Two of the samples that had similar
retention times were confirmed as being identical using UV-VIS spectrometry. Figure 9.0
shows the electrophoretic profiles and UV-VIS spectra for some of the red ink samples.
The authors could also identify basic violet as being the main colorant used in the two
identical red samples. The violet samples were classified into single, two and three
element groups. Violet and red inks could be differentiated on the basis of the UV/Vis
spectra of the main dyes, even if it was not possible to detect a difference between them
in their electropherograms. For the blue ink samples, only two samples had sufficiently
different retention times such that they could be distinguished from each other and the
rest based on that factor solely. The rest of the inks could further be classified into 3 sub-
groups on the basis of their UV/Vis spectra.
14
Figure 9.0: Figure 2.0 from “Application of MECC-DAD and CZE-MS to examination of
color stamp inks for forensic purposes” (Król, Kula, & Kościelniak, 2013). MECC
electropherograms of red stamp pad inks. The UV-VIS spectra on the top left corner
show the identical nature of the inks with the electrophoretic profiles a and b. The UV-
VIS spectra on the top right corner differentiates inks a from c.
Additional papers have explored the differentiation and dating of stamp pad inks
using high performance liquid chromatography (HPLC) and gas chromatography/mass
spectrometry (GC/MS). Aginsky, 1996, described the dating and characterizing of
writing, stamp pad and jet printer inks by GC/MS. Years later, Yao et al., 2009,
optimized the chromatographic conditions for separation of the dye components of sixty-
nine red ink pastes of seals, by ion pair (IP)-HPLC with a multi-wavelength UV detector,
and the volatile additives of the same seals, by GC/MS. The results showed that most of
the ink entries of the seals can be differentiated by combining HPLC with a multi-
wavelength detector and GC/MS methods.
While most studies focus on the pigment/dye component of the ink, Lociciro,
Dujourdy, Mazzella, Margot & Lock, 2004, used gas chromatography coupled with mass
spectrometry, to analyze a volatile component of some ball point pen inks-

15
phenoxyethanol. An ink ageing curve was built based on the ratio of an evaporating
compound to a stable compound of the ink, with time. The ratio allowed independence of
the quantity of ink being sampled and the authors were able to obtain a curve depicting
the exponential decay of the chosen volatile compound. They found that different
combinations of the components of ink (i.e the matrix for the volatile compound and its
partition coefficient in the matrix) as well as the substrate on which it is deposited,
affected the rate of decay in a way that an estimation of the dating of these inks was not
possible since different behaviors were observed based on the condition in which the
observations was made. Additionally, majority of the volatile components evaporated in
the first minutes following the affixing of the ink to the paper. Therefore, a more
sensitive technique would be required to detect the minor leftover molecules of the
solvent whose activity can then be tracked with time. The authors did however reveal a
different technique that could be used in the analysis of body stamp ink: GC/MS of a
volatile component. This method however would be limited by the time since application
of the stamp, due to the immediate loss of the volatile compounds, followed by their
exponential decay that takes place once the stamped ink is exposed to air.
Virtually, no literature exists that focuses on temporary skin safe inks that are
used with stamp pads. Miranda (2015), mentions in her book, Forensic Analysis of
Tattoos and Tattoo Inks, that while current literature does exist, surrounding the
examination and analysis of stamp pad inks, further research investigating the inorganic
pigments, organic pigments and dyes, both natural and synthetic, in artistic and skin safe
stamp pad ink, would provide a more thorough understanding of chemical composition

16
that is necessary to evaluate the pigment’s role in forensic investigations. Miranda
(2015), pointed out that,
By determining tattoo ink composition, specifically with regard to the pigment
portion, it may be possible to detect the pigments in human tissue and thus
determine the presence or absence of a tattoo as well as its physical
characteristics. It may also be possible to determine whether or not residues are
consistent with a tattoo ink, which can aid in criminal investigations. (Miranda,
2015, p.145)
Chemistry of Pigments and Dyes
Gürses, Açıkyıldız, Güneş & Gürses, 2016 and LaPorte & Stephens, 2011,
provided a brief overview of the chemistry of dyes and pigments. The two basic
components of inks are the colorant and the vehicle that the colorant is suspended in.
Other organic and inorganic ingredients that may be present include oxidants,
preservatives, wetting agents, lubricants and trace elements. Of these components, the
colorant would be of utmost importance as it lends the ink the most distinguishing
characteristic, its color. The molecular composition of these colorants usually dictates
what range of the electromagnetic spectrum they absorb and reflect, thereby influencing
their color. Colorants can be divided into two categories based on the way they interact
with the solvent: dyes and pigments. The general definition of dyes would include any
compound with a highly conjugated resonance structure. Their molecular weights can
range from the low hundreds to the high thousands. Dyes can further be classified based
on their chemical structure and how they are applied to the material. The Color Index is a
comprehensive volume containing dye information. Of the many types of dyes listed in
17
the Color Index, solvent dyes are the most common type of dye that are used in stamp
and writing inks (Gürses, Açıkyıldız, Güneş & Gürses, 2016, LaPorte & Stephens, 2011).
The authors also describe the major distinguishing feature between dyes and
pigments. Pigments consist of finely divided, colored, colorless or fluorescent organic or
inorganic particles (salts and oxides) of varying solubility (generally insoluble) that are
suspended in the vehicle and are generally unaffected by the medium that they are
suspended in. Pigments are generally hardier (durable, heat stable, solvent resistant and
light fast) than dyes since they are less susceptible to photodecomposition and therefore
more long-lasting. The color for pigments is derived from metal centered complexes.
This makes pigments less vibrant than dyes, yet more opaque, thereby making them more
stable and efficient at masking underlying material. At the same time, dyes are more
easily absorbed and dispersed at a molecular level by the substance they are deposited on,
compared to pigments. Therefore, pigments are a surface only coloration. Compared to
pigments, dyes have poor durability and poor heat and solvent stability. There are five
major categories of pigments: organic, toner, lakes, extended and inorganic. Toners, lakes
and extended pigments are precipitated from an aqueous solution in conjunction with
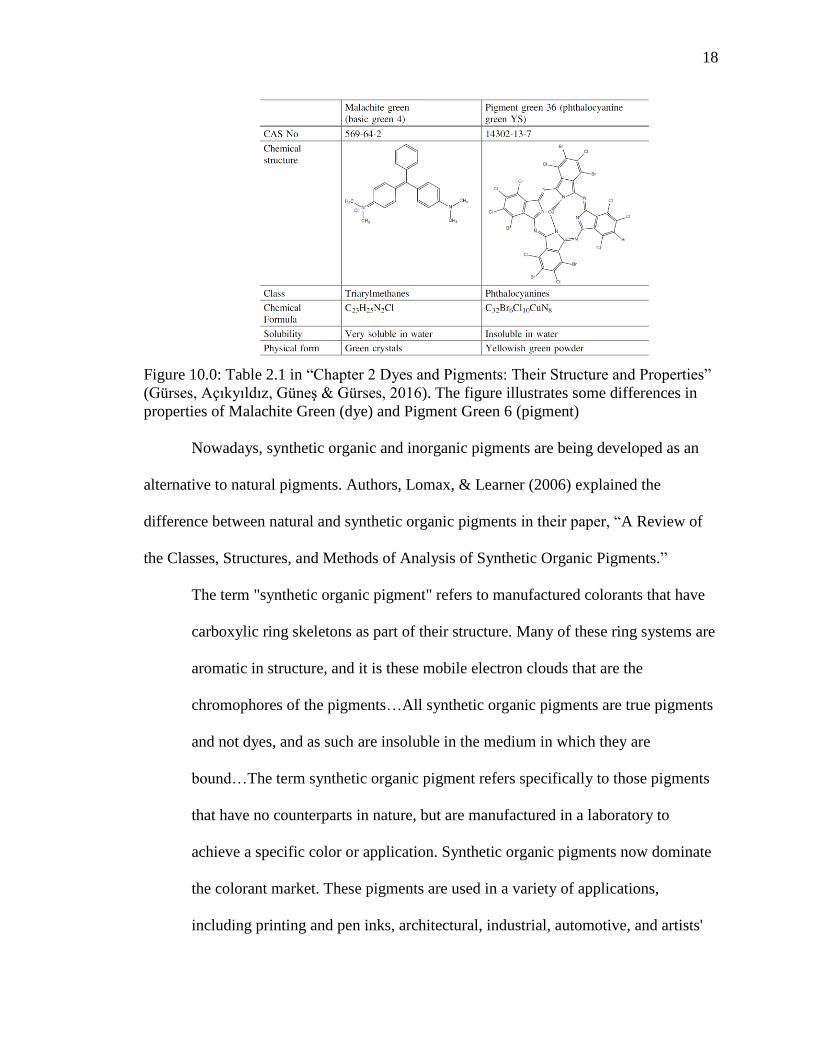
some catalyst. Figure 10.0 shows some key property differences between a dye and
pigment of the same color, green. Due to the fact that pigments tend to remain as a solid,
rather than dissolving into the vehicle, they are more often used to develop artistic inks
and less often seen in stamp pads (Kelly, 2002, Gürses, Açıkyıldız, Güneş & Gürses,
2016, LaPorte & Stephens, 2011).
18
Figure 10.0: Table 2.1 in “Chapter 2 Dyes and Pigments: Their Structure and Properties”
(Gürses, Açıkyıldız, Güneş & Gürses, 2016). The figure illustrates some differences in
properties of Malachite Green (dye) and Pigment Green 6 (pigment)
Nowadays, synthetic organic and inorganic pigments are being developed as an
alternative to natural pigments. Authors, Lomax, & Learner (2006) explained the
difference between natural and synthetic organic pigments in their paper, “A Review of
the Classes, Structures, and Methods of Analysis of Synthetic Organic Pigments.”
The term "synthetic organic pigment" refers to manufactured colorants that have
carboxylic ring skeletons as part of their structure. Many of these ring systems are
aromatic in structure, and it is these mobile electron clouds that are the
chromophores of the pigments…All synthetic organic pigments are true pigments
and not dyes, and as such are insoluble in the medium in which they are
bound…The term synthetic organic pigment refers specifically to those pigments
that have no counterparts in nature, but are manufactured in a laboratory to
achieve a specific color or application. Synthetic organic pigments now dominate
the colorant market. These pigments are used in a variety of applications,
including printing and pen inks, architectural, industrial, automotive, and artists'
19
paints, and for the coloration of plastics, rubber, and textiles…The first synthesis
of an organic colorant of commercial note occurred in 1856 when William Henry
Perkin combined aniline, toluidine, potassium dichromate, and sulfuric acid.
Instead of synthesizing expected quinine, a black solid was produced, which after
washing with mineral spirits, dissolved [to] produce a purple dye (Lomax, &
Learner, 2006, p. 108).
The vehicle is the fluid portion of the ink that suspends and delivers the colorant
to the substrate. Solvents would be considered the more volatile portion of the vehicle
and in forensic scenarios, they may not be very informative for characterizing purposes
due to that very nature. Their high volatility causes them to be the first component of the
ink to dissipate with time since application. This makes them highly unreliable in terms
of providing any kind of individualizing investigative information. Besides volatilization,
other changes that the solvent-ink combination can undergo include polymerization,
oxidation and photodecomposition. While these changes affect the overall original
composition of the total ink, the progression of these changes are what document
examiners use in the dating of evidential documents. The most commons solvents that are
known to be found in writing inks are glycol, alcohol and water (Gürses, Açıkyıldız,
Güneş & Gürses, 2016, LaPorte & Stephens, 2011). In the case of skin safe inks, the
MSDS of the samples used in this research specified some or all of the solvent cocktail
that is included in the inks, but left out information regarding the type of organic or
inorganic pigment or dye that gave the inks the visible color.
In addition to the vehicle, writing inks are also known to contain resin and
additives. Resins can be natural or synthetic and can provide inks with the desired
20
viscosity and means to bond the ink and the substrate. Additives such as biocides,
surfactants, lubricants, corrosion inhibitors, preservatives, buffers and diluting agents
may also be included to enhance properties of the ink. (Gürses, Açıkyıldız, Güneş &
Gürses, 2016, LaPorte & Stephens, 2011). Body safe ink samples may or may not contain
these additives in the same proportion as in writing samples since they are meant to be
temporary and therefore should practically, not bind to the surface of the skin too
strongly. Instructions provided with the inks generally suggest that the inks can be
removed from the skin using water, acetone, soap or a combination of these solvents.
This would suggest that the inks do not contain any strong binding agents that makes it
difficult to take them off. Additionally, normal inks that are developed for the purpose of
being used with stamps are done so while keeping the properties of the stamp in mind so
that the ink does not adversely affect the stamp with use. The American Coding and
Marking Ink Company Inc. for example utilizes over 6000 different ink formulas (Kelly,
2002). Over the years, some of these ink formulas have been further modified to be
“skin-safe”.
Invisible inks are a little bit different from visible inks, in that they don’t really
contain a chromophore in the true sense. Current patents of invisible ink formulas have
suggested that they comprise a water-soluble organic fluorescent fluorophore (meaning a
component that generates fluorescence or phosphorescence) which when dried on a
surface is invisible to the eye at the concentrations employed and fluoresces when
irradiated with UV radiation. In addition, the inks include the vehicle for dispersion, as is
seen with visible stamp pad inks (Auslander, 2005). Other patents have indicated the use
of certain phenoxazine derivative dyes that are visible to the unaided eye and fluoresce in
21
the near infrared region (650 to 800 nm) upon activation using an activating light having
a wavelength in the range of 550 to 700 nm (Zhu, 1998). Since the MSDS for the
invisible samples tend to leave out proprietary chromophore/fluorophore information, it
would be hard to comment on the nature of these molecules prior to doing additional
research.
The color that is imparted to the ink is highly dependent on the chemical and
physical properties of matter and is the result of the interaction between light and the
substance. The coloristic properties of dyes only depend on their chemical structure but
that of pigments, depend on the chemical as well as the physical properties of its
particles. The true color of the inks may only be apparent after the stamp has been
imprinted and may differ, based on the surface (Kelly, 2002). Due to the subjectivity of
color perception, any support to macroscopic or microscopic visual inspection provided
by instrumental techniques would help in developing a more generally accepted
discrimination of the different colors and brands.
Theory of the Instrumental Approach
The perception of color is based on the way the light is absorbed, transmitted or
scattered by the ink. For the use of the methods mentioned below, the tattoo would have
to be accessible enough on the skin, so that it can be appropriately extracted and thereby
determined using the techniques described here or used with a suitable matrix for
toxicological studies. Alternatively, the methods below can also be used in determining
the composition of the reference ink. Sampling of the reference for our purpose is not
constrained by any factors.

22
Electromagnetic Spectrum
The color imparted by dye stuffs (another term for dyes) and pigments to the
resulting solution depends on the electronic properties of the chromophore/fluorophore
molecules. Visible light is that part of the electromagnetic spectrum (figure 11.0), with
wavelengths between the red limit at about 700 nm and the violet limit of 400 nm.
Ultraviolet (UV) designates a band of the electromagnetic spectrum with wavelength
from 10 nanometers (nm) to 400 nm, shorter than that of visible light but longer than X-
rays. Infrared radiation (IR), is electromagnetic radiation with longer wavelengths than
those of visible light that extends from the nominal red edge of the visible spectrum at
700 nm to 1 millimeter. Color is the part of perception that is carried to the eye from our
surroundings by differences in the wavelengths of light. This is dependent on the nature
and spectral power of distribution in the light from the illuminating light sources and
other interrelated processes derived from the interaction of the illumination with matter
including absorption, reflection, refraction, diffraction, scattering, and luminescence.
Finally, there is the perception system, involving the eye and the transmission system
from eye to brain, leading to the final interpretation reached in the brain (Gürses,
Açıkyıldız, Güneş & Gürses, 2016). The different regions of the electromagnetic
spectrum mentioned above, are important to pay attention to because by using the
instrumental techniques mentioned below, we would be able to visually see (visible
region) or instrumentally detect (IR and UV region) the different interactions that these
inks samples have with the light source.

23
Figure 11.0: Figure 2.2 in “Chapter 2 Dyes and Pigments: Their Structure and Properties”
(Gürses, Açıkyıldız, Güneş & Gürses, 2016). The figure illustrates the different regions
of the electromagnetic spectrum.
The absorption of UV or visible radiation by an atomic or molecular species can
be considered to be a two-step process. The first step involves an electronic excitation
caused by a photon. The lifetime of the excited species is brief (10-8 – 10-9 seconds) and
there are several relaxation processes by which deexcitation can occur. The most
common type of relaxation involves conversion of the excitation energy to heat.
Relaxation may also occur by a photochemical process such as decomposition of the
excited species to form new species. And finally, relaxation can involve reemission in a
different wavelength than the excitation wavelength, a process termed as luminescence.
These different scenarios will be important to remember when talking about the theory of
UV-Visible and Infrared spectroscopy (Nieman, Skoog & Holler, 1998).
Microscopy: Stereo Microscope and Polarized Light Microscope
Stereomicroscopes is an optical microscope that functions at a low magnification
(10X eyepiece, 0.75-5.0X objective). It works by using two separate optical paths and the
objective(s) and two eyepieces provide the eyes with slightly different viewing angles
which is perceived as a 3D image in our brain (Nothnagle, Chambers, Parry-Hill, Fellers
& Davidson, 2015). In this research, the Motic SMZ 171 model was used, shown in

24
figure 12.0. Stereomicroscopes have characteristics that are valuable in the general
examination of the ink samples using reflected light (Nothnagle, Chambers, Parry-Hill,
Fellers & Davidson, 2015). Using the stereomicroscope for the purpose of examining
inks would provide us with information regarding the perceived color under the selected
light source, nature of the consistency of the inks, nature of the drying process of the inks
and the surface features of the dried ink stains. It also aids in finding any obvious
additives that are present in the inks.
Polarized light is a contrast-enhancing technique that improves the quality of the
image obtained for birefringent materials and are designed to observe and photograph
specimens that are visible primarily due to their optically anisotropic character. Polarized
light microscopes have a high degree of sensitivity and can be utilized for both
quantitative and qualitative studies targeted at a wide range of anisotropic specimens.
Polarized light microscopy (PLM) is capable of providing information on absorption
color and can also distinguish between isotropic and anisotropic substances. Furthermore,
the contrast-enhancing technique exploits the optical properties specific to anisotropy and
reveals detailed information concerning the structure and composition of materials that is
invaluable for identification and diagnostic purposes (Robinson, & Davidson, n.d.). PLM
was used for the ink samples in order to observe them using a transmitted light source
and at a higher magnification than that achievable by the stereomicroscope. Additionally,
the nature of crystals (if present) and the drying patterns of the ink samples was noted. To
investigate the nature of any crystal present, the samples were viewed under crossed
polars (analyzer and polarizer’s principal vibration directions at 90 degrees relative to
each other) and features such as the retardation colors and the sign of elongation were

25
noted. In this research the Olympus BH-2 model PL microscope was utilized (shown in
figure 13.0) after being set up for Kohler-like Illumination (Davidson, nd).
Figure 12.0 (left): Obtained from Motic (n.d.). Figure illustrates the SMZ-171 model
stereomicroscope. Figure 13.0 (right): Obtained from Olympus Corporation (n.d.). Figure
illustrates the BH-2 model polarized light microscope.
Molecular Luminescence Spectrometry: Theory and Practice - Alternate Light
Source (ALS)
Fluorescence is a type of luminescence that occurs in gas, liquid or solid chemical
systems. When a molecule in the singlet ground state absorbs a photon, it gets promoted
to a singlet excited state (Nieman, Skoog & Holler, 1998, Physics of Fluorescence - the
Jablonski Diagram, n.d.). As the excited molecule returns to ground state, it involves the
emission of a photon of lower energy, which corresponds to a longer wavelength, than
the absorbed photon. This is termed as fluorescence.
The energy loss is due to vibrational relaxation while in the excited state. Due to
the energy loss, the fluorescent bands occur at wavelengths longer than the resonance line
(Nieman, Skoog & Holler, 1998, Physics of Fluorescence - the Jablonski Diagram, n.d.).
This shift toward longer wavelengths is called a Stokes shift. Excited states are short-
lived with a lifetime at about 10-8 seconds (Nieman, Skoog & Holler, 1998, Physics of

26
Fluorescence - the Jablonski Diagram, n.d.). Molecular structure and chemical
environment affect whether or not a substance luminesces and they also decide the
intensity of the emission, when it does occur. Generally, molecules that fluoresce are
conjugated systems (Nieman, Skoog & Holler, 1998, Physics of Fluorescence - the
Jablonski Diagram, n.d.). A conjugated system is a system of connected p-orbitals with
delocalized electrons in compounds with alternating single and multiple bonds, which in
general may lower the overall energy of the molecule and increase stability (Libretexts,
2019). The process of fluorescence is depicted by the Jablonski Plot in figure 14.0 below.
In the diagram electronic (energy) states are indicated by bold horizontal lines. The thin
horizontal lines above them represent vibrational/rotational sublevels. Electrons are
normally at the lowest energy state, indicated by S0. When a photon (indicated by the
blue line entering from the left) with appropriate energy (an amount corresponding to the
energy difference between the ground and excited states) interacts with a molecule the
photon may be absorbed, causing an electron to jump to one of the levels of an excited
state (S1 or S2 in the diagram). Thus not all incident photons are equally likely to be
absorbed. This transition process is very fast, on the order of 10-15 seconds.The specific
frequencies of excitation and emission are dependent on the molecule or atom (Nieman,
Skoog & Holler, 1998, Physics of Fluorescence - the Jablonski Diagram, n.d.).
Figure 14.0: Retrieved from
https://www.nightsea.com/articles/jablo
nski-diagram-for-fluorescence/ (Physics
of Fluorescence - the Jablonski
Diagram, n.d.) Figure illustrates the
Jablonski plot that shows the energy
conversion occurring during
fluorescence.

27
The probability that a photon will be absorbed varies with wavelength (energy).
Even for those photons that are absorbed there are other processes that compete with
fluorescence for de-excitation of the excited-state electrons (Nieman, Skoog & Holler,
1998, Physics of Fluorescence - the Jablonski Diagram, n.d.).
In this research an alternate light instrument was used to generate the various
wavelengths required to observe possible fluorescence. A combination of the
wavelengths and different colored goggles (yellow, red, orange and clear) further helps
elucidate the structure, based on whether fluorescence is observed with a particular
wavelength-goggle combination and what amount of fluorescence is observed. Figure
15.0 shows one of the alternate light source generators used in this research.
Extractions
When an ink stamp is applied to skin a number of processes occur that contribute
to the level of permanence of the ink on the skin. The dye or pigment component is
carried by the vehicle component onto the surface, in this case, skin. Due to the layered
nature of skin, the ink components are dispersed through the different layers at varying
rates that are dependent on their nature (Miranda, 2012). Most of the solvent components
will volatize right after application and the remaining portion will either disperse among
the upper squamous epithelial cells of the epidermis or seep deeper into the epidermis
Figure 15.0: Retrieved from
CrimeScope CS-16 Forensic Light
Source - Product - SPEX Forensics.
(n.d.). Figure illustrates the CS 16
CrimeScope used as an alternate light
source.

28
(Miranda, 2012). In doing so, the dye or pigment component of the ink is fixed
temporarily to the skin. Right from the moment that these inks are manufactured, their
process of degradation begins. The stability of the components would decide what
percentage of the total ink impression that it contributes to. A number of factors affect
how well the ink is fixed to the surface, the major one being the vehicle portion of the
ink. Other factors also include environmental conditions posed by the skin itself and the
actual nature of the environment in which the ink is applied. These factors also affect
whether the stamp design is smudged after application or transferred to another article,
like clothing.
In order to investigate the nature of the dye or pigment component deposited on
the skin, the dye or pigment needs to be successfully extracted and separated from the
surface of the skin. Based on how permanent the ink is on the skin, a number of different
strength solvents can be employed. The chosen extraction procedure must not only be
able to safely extract the dye or pigment from the skin but also be able to separate them
from interferences present in the skin (Osselton & Watts, 2011). The ability of a
substance to dissolve in a particular solvent is referred to as its solubility. Solubility
affects how much of the dye or pigment will be extracted into the solvent. For liquid-
liquid or liquid-solid extractions, the state of ionization of the component should be
considered (Osselton & Watts, 2011). Due to this reason, extraction efficiencies for the
different colored components would be different in different pH solvents (Osselton &
Watts, 2011). The extraction step would thus enable us to separate the colored
components, and possibly the vehicle component of the ink, from the skin and analyze
them using UV-Visible spectroscopy or FTIR-ATR spectroscopy. The behavior of the

29
colored components in the different pH solvents could contribute in the elucidation of the
chemical structure of these components, as would the downstream spectroscopic
techniques.
In this research liquid-liquid extractions were conducted using a pure aliquot of
the ink sample. In a forensic case scenario, these inks would have to be extracted from
skin that has undergone various environmental insults. Therefore, care has to be taken to
maximize the amount of ink being extracted while ensuring that the colored component
stays stable during the process so that it can be analyzed and possibly individualized
using a downstream spectroscopic process.
Molecular Absorption Spectroscopy: Theory and Practice - UV-Visible
Spectroscopy
Molecular Absorption Spectroscopy is based on the measurement of the
transmittance T or the absorbance A of solutions contained in transparent cells having a
path length of b centimeters. Normally, the concentration of an absorbing analyte is
linearly related to absorbance given by Beer’s Law (Nieman, Skoog & Holler, 1998).
A= -log T =log P0 / P = εbc
T=Transmittance, P0= Power of radiation of the light source after passing through the cell
containing the solvent, P= Power of the radiation of the light source after passing through
the cell containing the analyte solution, ε= Molar absorptivity, b= Path length of the
sample, c= concentration of the absorber
The absorption of UV or Visible radiation generally results from the excitation of
bonding electrons. Due to this, the wavelength of absorption bands can be correlated with
the types of bonds under study (Nieman, Skoog & Holler, 1998). Therefore, molecular
absorption spectroscopy can be used in this case, to identify the functional groups of a
molecule.
30
All organic compounds are capable of absorbing electromagnetic radiation
because they contain valence electrons that can be excited to higher energy levels. Most
applications of absorption spectroscopy to organic compounds are based on transitions
for n or π electrons to the π* excited state because the energies required for these
processes bring the absorption bands into the UV-Visible region (200-700nm) where it
can be measured with fewer experimental difficulties compared to the vacuum UV region
(Nieman, Skoog & Holler, 1998, Gürses, Açıkyıldız, Güneş & Gürses, 2016). Both π →
π* and n → π* transitions require the presence of an unsaturated functional group to
provide the π-orbitals (Nieman, Skoog & Holler, 1998). Molecules containing such
functional groups, for example, C=C, C≡C, C=O, C≡N, N=N, NO2 etc., and capable of
absorbing UV radiation are called chromophores. Chromophores like C=C or C≡C
having π electrons undergo π → π* transitions and those having both π and non-bonding
electrons, e.g., C=O, C≡N or N=N, undergo π → π*, n → π* and n → σ* transitions
(Gürses, Açıkyıldız, Güneş & Gürses, 2016). Since the wavelength and intensity of
absorption depend on a number of factors, there are no set rules for the identification of a
chromophore (Gürses, Açıkyıldız, Güneş & Gürses, 2016).
If a compound absorbs light in the visible region (400–800 nm), only then does it
appear colored. The compound will exhibit the color that is complementary to the color
being absorbed. A chromophore may or may not impart color to a compound depending
on whether the chromophore absorbs radiation in the visible or UV region. The electronic
spectra of organic molecules containing chromophores are usually complex, because of
the presence of both vibrational and electronic transitions. The result of superposition of

31
the individual bands caused by the two transitions is a continuous broad band (Nieman,
Skoog & Holler, 1998).
Table 2.0 lists the common chromophores and the approximate region of the
electromagnetic spectrum in which they absorb. The data for λmax and εmax can be used
to roughly identify the chromophore that may be causing the absorption but these effects
are also influenced by solvent effects as well as other structural details of the molecule.
Therefore, at best, the data serves as a rough estimation of the type of molecule.
Conjugation between two or more chromophores also tends to cause shifts in the
absorption maxima to longer wavelengths. Overall vibrational effects also broaden
absorption peaks in the UV and Visible regions, making precise determinations of a true
absorption maxima impossible (Nieman, Skoog & Holler, 1998).
Figure 16.0: Table 2.3 Characteristics of some common unconjugated chromophores,
obtained from Chapter 2 Dyes and Pigments: Their Structure and Properties (Gürses,
Açıkyıldız, Güneş & Gürses, 2016). This figure illustrates all the important information
for some of the important unconjugated chromophores. The choice of the solvent
employed can change the wavelength maximum for the same transition for a particular
chromophore, as shown in the table.

32
A covalently saturated group which, when attached to a chromophore, changes
both the wavelength and the intensity of the absorption maximum is known as
auxochrome, e.g., NH2, OH, SH, halogens etc (Gürses, Açıkyıldız, Güneş & Gürses,
2016). Saturated organic compounds containing such heteroatoms as oxygen, nitrogen,
sulfur or halogens have nonbonding electrons that can be excited by radiation in the range
of 170-250nm. A number of inorganic anions also exhibit UV absorption bands that are a
result of exciting non-bonding electrons. For example, nitrates absorb at 313 nm, nitrites
at 360 and 280 nm and azido group at 230nm (Gürses, Açıkyıldız, Güneş & Gürses,
2016). The ions and complexes of elements in the first two transition series generally
absorb broad bands of visible radiation in at least one of their oxidation states and are
colored. For inorganic species absorption involves transition between filled and un-filled
d-orbitals with energies that depend on the ligand bonded to the metal ions (Gürses,
Açıkyıldız, Güneş & Gürses, 2016). Solvents also tend to affect the wavelength of
maximum absorbance due to the effects that the solvent functional groups have on the
solute functional groups.
Figure 17.0: Right: Obtained from European Virtual Institute for Speciation Analysis.
(n.d.)., illustrates the UV-VIS 2450/2550 spectrophotometer. Left: Obtained from
Shimadzu. (2017), illustrates the UV-VIS 2600/2700 spectrophotometer. The two models
shown here were used in this research.

33
The spectrophotometer for UV-VIS spectroscopy measurements functions in a
relatively simple manner. A beam of light from a visible and/or UV light source is
separated into its component wavelengths by a prism or diffraction grating. Each
monochromatic (single wavelength) beam in turn is split into two equal intensity beams
by a half-mirrored device. One beam, the sample beam, passes through a small
transparent container (cuvette) containing a solution of the compound being studied in a
transparent solvent. The other beam, the reference, passes through an identical cuvette
containing only the solvent. The intensities of these light beams are then measured by
electronic detectors and compared. The intensity of the reference beam, which should
have suffered little or no light absorption, is defined as P0. The intensity of the sample
beam is defined as P. Over a short period of time, the spectrometer automatically scans
all the component wavelengths in the manner described. The ultraviolet (UV) region
scanned is normally from 200 to 400 nm, and the visible portion is from 400 to 800 nm
(Nieman, Skoog & Holler, 1998, UV-Visible Spectroscopy, n.d.).
FTIR-ATR Spectroscopy: Theory and Practice
The theory and practice for FTIR-ATR spectroscopy is obtained from “The
Chemical Analysis of Modern Tattoo Inks” by Miranda, 2012, p. 49-54 and from
“Chemical - instrumental analysis for forensic scientists: a laboratory manual” by Kubic,
Petraco, & Miranda, 2012, p. 27, 31-32. Infrared spectrometry is a branch of vibrational
spectroscopy that provides important information about a compound's chemical nature
and molecular structure. For a molecule to absorb infrared radiation, it must undergo a
change in dipole moment (that occurs when atoms within a molecule are chemically
different so as to result in an asymmetric distribution of electron density because of

34
unequal electron sharing) brought about by its vibrational or rotational motion. The
magnitude of the moment is determined by the distance between the centers of charge of
the atoms and the charge distribution between the atoms. If the frequency of incident
infrared radiation is equivalent to the molecule's natural vibrational or rotational
frequency, then a net transfer of energy occurs. This energy transfer causes a change in
the amplitude of the molecular vibration or rate of rotation, resulting from absorption of
the incident infrared radiation. Energy transfer occurs because there is an electronic
transition from one vibrational or rotational energy level up to another. The incident
infrared radiation will be composed of a continuum of various wavelengths, and thus
various frequencies. The frequencies that meet the above criteria will be absorbed by the
molecule, while the frequencies that do not will be transmitted. Vibrational modes which
do not involve a change in dipole moment are said to be infrared inactive (Miranda,
2012).
Figure 18.0: Figures obtained ThermoFisher Scientific. (2017). Figure illustrates the
Nicolet™ iS10 FTIR Spectrometer (left) used for this research as well as the ATR
attachment (right).
In this research the Nicolet iS10 FT-IR instrument with the ATR attachment was
used. Fourier transform spectroscopy utilizes an interferometer for the purpose of
achieving useable frequency-domain spectroscopy from time-domain (changes in radiant

35
power with time) data through a series of mathematical computations and signal
modulations. The interferometer splits a beam of radiation into two beams of nearly equal
power and then recombines them such that intensity variations of the combined beam can
be measured as a function of differences in the path lengths of the two beams. After a
signal called an interferogram is generated, the mathematical Fourier transform of this
signal occurs and is plotted. These interference patterns undergo data processing to
produce a 'readable' spectrum; the interferogram shifts from the faster light frequency to a
slower audio frequency, which can be “read” by the detector and subsequently plotted.
The common Michelson interferometer possesses both a fixed and a movable mirror. The
movable mirror travels away from and toward the beamsplitter with a constant velocity
allowing for its location to be determined by fluctuations in the power of the reference
laser radiation incident on a detector. The difference in pathlength that the infrared light
travels can be determined at any point in time by reference to the interference pattern
generated by the laser. The difference between this pathlength and the pathlength that the
infrared light travels to the fixed mirror part of the interferometer is called the optical
path difference (OPD). As the optical path difference changes as the moving mirror is
moved, the power at the infrared radiation also changes due to the constructive and
destructive interferences of the various wavelengths. An interferogram is the result,
which is the plot of the infrared energy power (or detector signal) versus the time (a
function of the OPD) (Miranda, 2012).
Although routine infrared spectroscopic analysis is done in absorbance mode, the
technique employed in this research used internal reflection, an infrared reflection
method. Internal reflection spectroscopy is based on total internal reflection of radiation

36
within an internal reflection crystal. Reflection will occur when radiation moves from a
more refractive to a less refractive media, or vice versa. In this method, the more
refractive media is the internal reflection element (IRE) and the less refractive is the
sample. If the radiation is applied at an angle greater than the critical angle, reflection is
described as being complete and total internal reflection occurs. The electric field of the
radiation (the evanescent wave (Nieman, Skoog & Holler, 1998)) penetrates some
distance into the less refractive material and thus can interact with the less refractive
material. This distance the field extends into the less refractive media is called the depth
of penetration. This depth of penetration depends upon the refractive indices of the
sample and IRE, the angle of the incident radiation, and the wavelength of the incident
radiation. As the wavelength increases, the wave number decreases and the depth of
penetration increases. If the evanescent wave is absorbed by the sample, the reflected
radiation will be attenuated at the wavelengths corresponding to the sample's absorption
bands. Thus, this technique is called attenuated total reflection (ATR) (illustrated in
figure 19.0). Using attenuated total reflection spectroscopy, the sample is placed into
direct contact with an internal reflection crystal. For ATR to occur efficiently, the sample
must come into contact with an IRE (also called an ATR crystal), which has a higher
refractive index than the sample. Typical IRE's are zinc selenide (ZnSe), which has a
refractive index (RI) of 2.2, Germanium (Ge), which has a refractive index of 4 and a
composite IRE in which diamond (RI of 2.4) comes into contact with the sample. Most
samples have refractive indices between 1.0 and 1.5, so typical IREs are suitable for most
sample analysis. (Miranda, 2012, Kubic, Petraco, & Miranda, 2012).
37
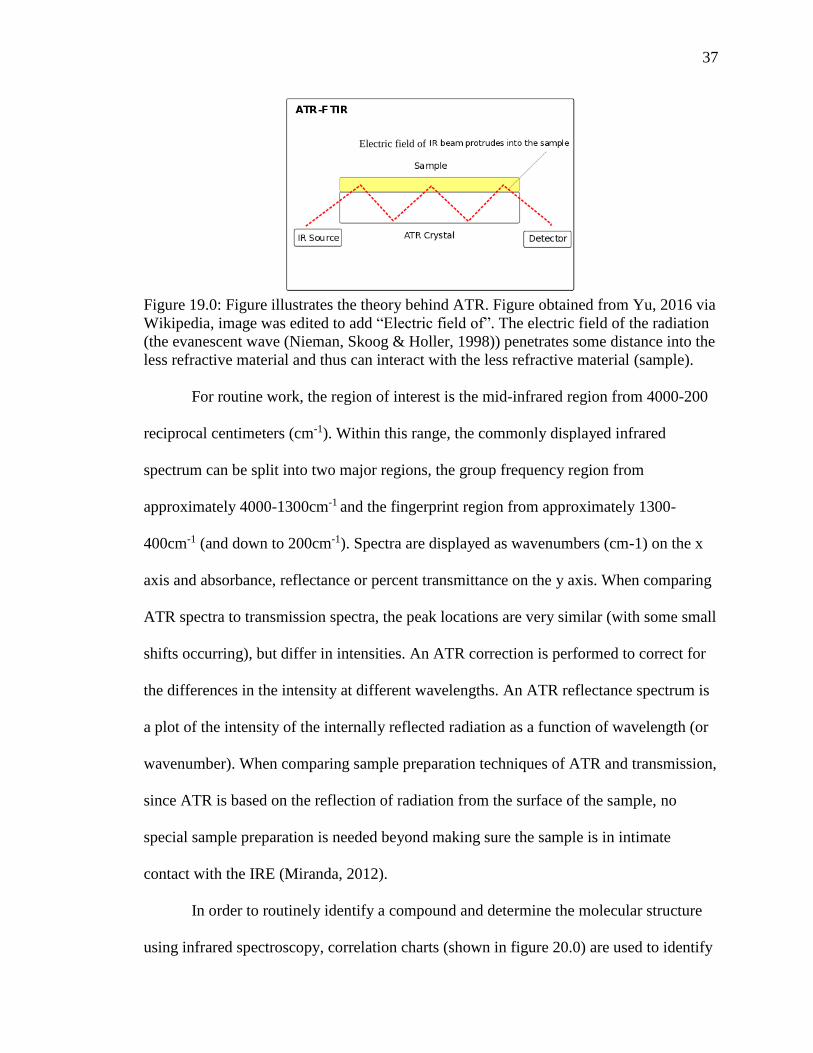
Figure 19.0: Figure illustrates the theory behind ATR. Figure obtained from Yu, 2016 via
Wikipedia, image was edited to add “Electric field of”. The electric field of the radiation
(the evanescent wave (Nieman, Skoog & Holler, 1998)) penetrates some distance into the
less refractive material and thus can interact with the less refractive material (sample).
For routine work, the region of interest is the mid-infrared region from 4000-200
reciprocal centimeters (cm-1). Within this range, the commonly displayed infrared
spectrum can be split into two major regions, the group frequency region from
approximately 4000-1300cm-1 and the fingerprint region from approximately 1300-
400cm-1 (and down to 200cm-1). Spectra are displayed as wavenumbers (cm-1) on the x
axis and absorbance, reflectance or percent transmittance on the y axis. When comparing
ATR spectra to transmission spectra, the peak locations are very similar (with some small
shifts occurring), but differ in intensities. An ATR correction is performed to correct for
the differences in the intensity at different wavelengths. An ATR reflectance spectrum is
a plot of the intensity of the internally reflected radiation as a function of wavelength (or
wavenumber). When comparing sample preparation techniques of ATR and transmission,
since ATR is based on the reflection of radiation from the surface of the sample, no
special sample preparation is needed beyond making sure the sample is in intimate
contact with the IRE (Miranda, 2012).
In order to routinely identify a compound and determine the molecular structure
using infrared spectroscopy, correlation charts (shown in figure 20.0) are used to identify
Electric field of

38
the functional groups in a molecule based upon the observed vibrational bands. After
determination of the functional groups based upon the band locations, reference libraries
and computer-based searches can be used to aid in the compound identification. For
structural determination, calculations can be conducted to provide information about the
expected infrared active modes wherein predictions are made about the structure and
symmetry of a molecule. These calculations are based upon molecular symmetry and
group theory considerations (Miranda, 2012).
Figure 20.0: Figure illustrates the common functional group frequencies. Obtained from
Pongpiachan, 2014.
Methods and Materials
Materials
Ink samples were obtained after researching online to find websites that advertise
and sell skin-safe inks. Only those inks that were advertised as being skin safe and/ or
sold for the purpose of being used as temporary hand stamp ink in events or clubs, were
39
selected. Both visible and invisible samples were selected for this study. Additionally, for
one of the visible ink brands, samples were obtained from two different websites, with
same, similar and different lot numbers. For both the invisible and visible inks, different
color ink samples were obtained. Each sample was obtained in its original bottle and the
details of the bottle were recorded from the label.
The temporary stamp inks included in this study are detailed below:
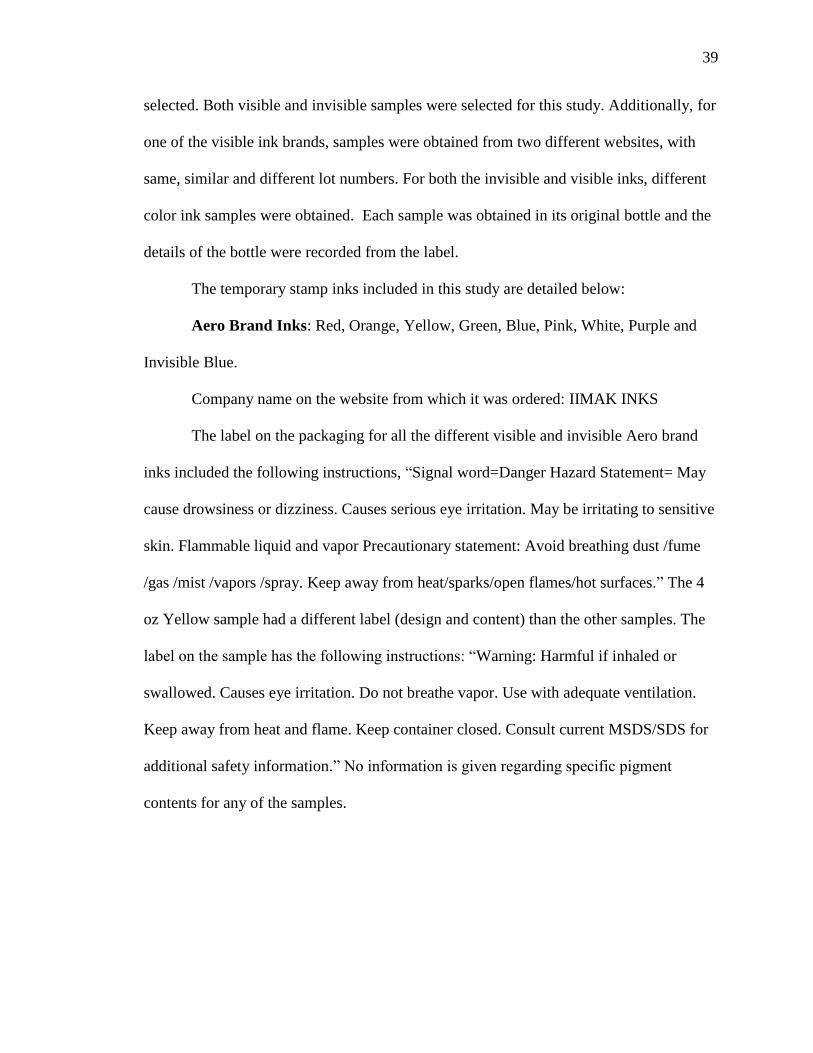
Aero Brand Inks: Red, Orange, Yellow, Green, Blue, Pink, White, Purple and
Invisible Blue.
Company name on the website from which it was ordered: IIMAK INKS
The label on the packaging for all the different visible and invisible Aero brand
inks included the following instructions, “Signal word=Danger Hazard Statement= May
cause drowsiness or dizziness. Causes serious eye irritation. May be irritating to sensitive
skin. Flammable liquid and vapor Precautionary statement: Avoid breathing dust /fume
/gas /mist /vapors /spray. Keep away from heat/sparks/open flames/hot surfaces.” The 4
oz Yellow sample had a different label (design and content) than the other samples. The
label on the sample has the following instructions: “Warning: Harmful if inhaled or
swallowed. Causes eye irritation. Do not breathe vapor. Use with adequate ventilation.
Keep away from heat and flame. Keep container closed. Consult current MSDS/SDS for
additional safety information.” No information is given regarding specific pigment
contents for any of the samples.
40
Figure 21.0: Illustrates the different Aero brand 4oz Visible and Invisible samples: From
left to right: Red, Green, Orange, Yellow, Blue and Invisible Blue.
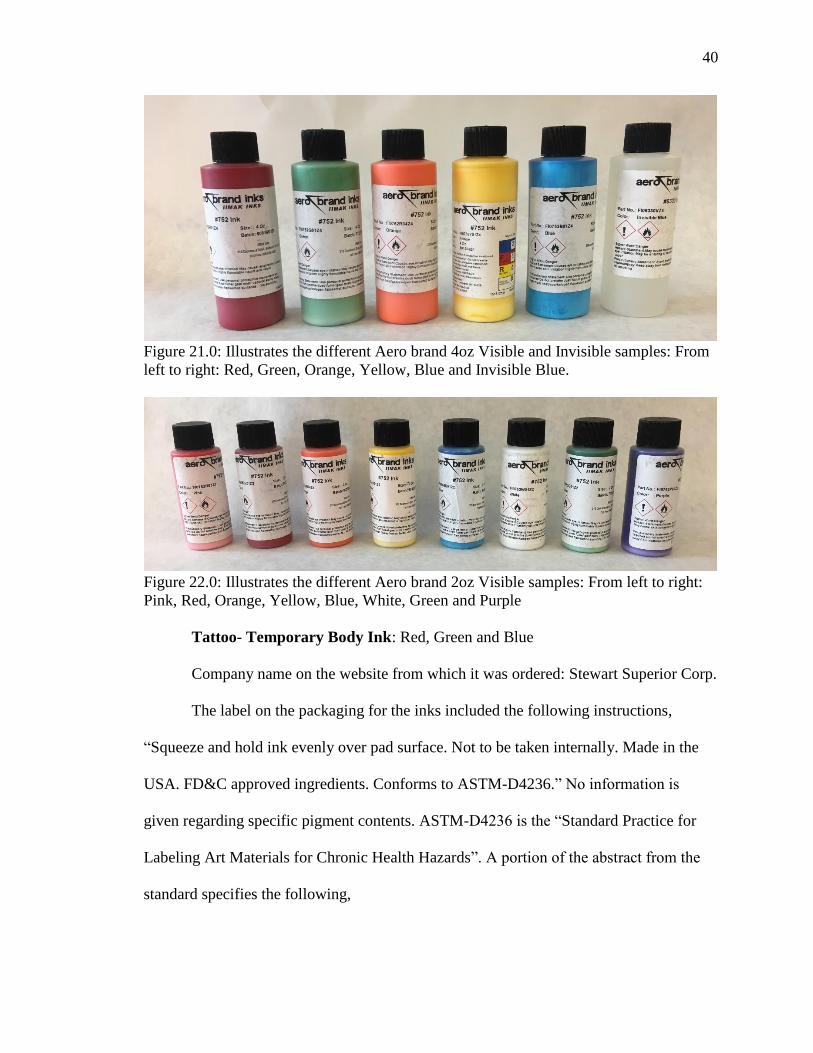
Figure 22.0: Illustrates the different Aero brand 2oz Visible samples: From left to right:
Pink, Red, Orange, Yellow, Blue, White, Green and Purple
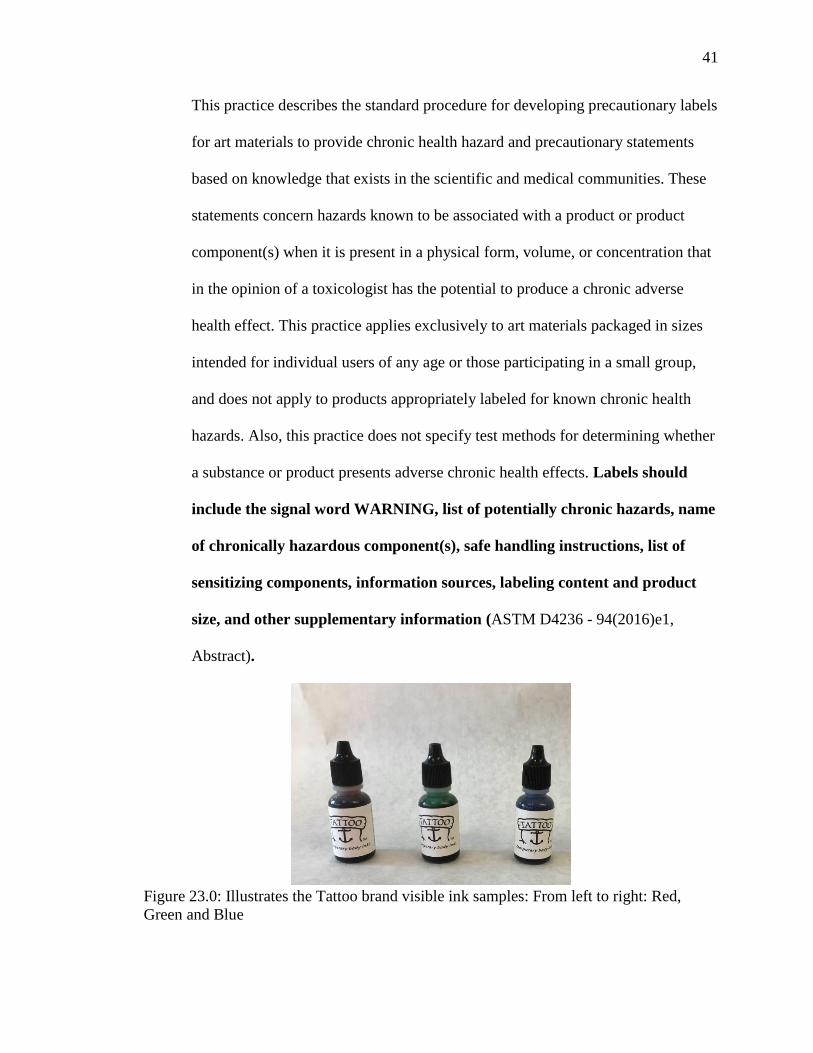
Tattoo- Temporary Body Ink: Red, Green and Blue
Company name on the website from which it was ordered: Stewart Superior Corp.
The label on the packaging for the inks included the following instructions,
“Squeeze and hold ink evenly over pad surface. Not to be taken internally. Made in the
USA. FD&C approved ingredients. Conforms to ASTM-D4236.” No information is
given regarding specific pigment contents. ASTM-D4236 is the “Standard Practice for
Labeling Art Materials for Chronic Health Hazards”. A portion of the abstract from the
standard specifies the following,
41
This practice describes the standard procedure for developing precautionary labels
for art materials to provide chronic health hazard and precautionary statements
based on knowledge that exists in the scientific and medical communities. These
statements concern hazards known to be associated with a product or product
component(s) when it is present in a physical form, volume, or concentration that
in the opinion of a toxicologist has the potential to produce a chronic adverse
health effect. This practice applies exclusively to art materials packaged in sizes
intended for individual users of any age or those participating in a small group,
and does not apply to products appropriately labeled for known chronic health
hazards. Also, this practice does not specify test methods for determining whether
a substance or product presents adverse chronic health effects. Labels should
include the signal word WARNING, list of potentially chronic hazards, name
of chronically hazardous component(s), safe handling instructions, list of
sensitizing components, information sources, labeling content and product
size, and other supplementary information (ASTM D4236 - 94(2016)e1,
Abstract).
Figure 23.0: Illustrates the Tattoo brand visible ink samples: From left to right: Red,
Green and Blue
42
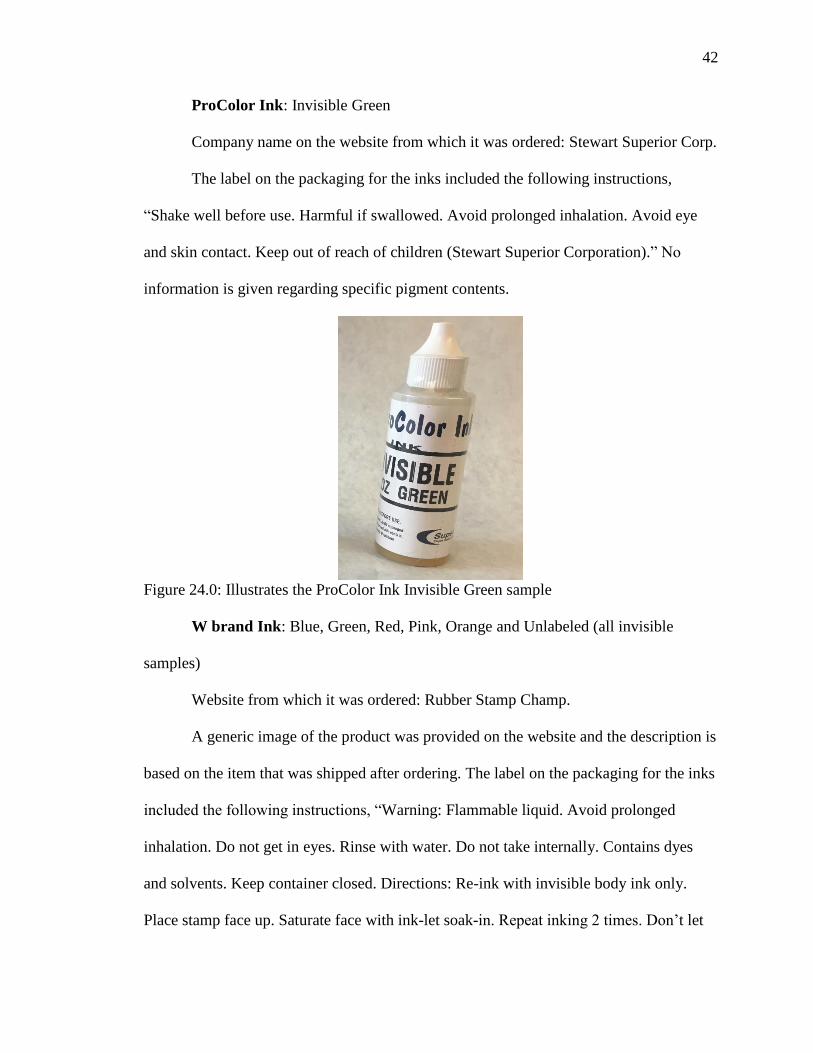
ProColor Ink: Invisible Green
Company name on the website from which it was ordered: Stewart Superior Corp.
The label on the packaging for the inks included the following instructions,
“Shake well before use. Harmful if swallowed. Avoid prolonged inhalation. Avoid eye
and skin contact. Keep out of reach of children (Stewart Superior Corporation).” No
information is given regarding specific pigment contents.
Figure 24.0: Illustrates the ProColor Ink Invisible Green sample
W brand Ink: Blue, Green, Red, Pink, Orange and Unlabeled (all invisible
samples)
Website from which it was ordered: Rubber Stamp Champ.
A generic image of the product was provided on the website and the description is
based on the item that was shipped after ordering. The label on the packaging for the inks
included the following instructions, “Warning: Flammable liquid. Avoid prolonged
inhalation. Do not get in eyes. Rinse with water. Do not take internally. Contains dyes
and solvents. Keep container closed. Directions: Re-ink with invisible body ink only.
Place stamp face up. Saturate face with ink-let soak-in. Repeat inking 2 times. Don’t let

43
ink overflow. Stamp a few times before using. Stamp is ready for thousands of
impressions.” No information is given regarding specific pigment contents. One sample
was unlabeled but visually, its color looked similar to the orange sample.
Figure 25.0: Illustrates the W brand invisible ink samples: From left to right: Orange
(Label at the back), Unlabeled, Green, Pink, Red and Blue
Methods
Visual Macroscopic Documentation and Preparation of Slides
As soon as the samples were obtained, they were photo-documented. The samples
were then aliquoted into 1.5ml clear Eppendorf® tubes. A pipette tip and/or a toothpick
was used to sample a small amount of the ink from the aliquot onto a clean and labelled
glass slide. Color, consistency, viscosity and separation was documented. Three (3) sets
of spots were prepared on the glass slide (in duplicates to account for any contaminants
that may be present on the slide). The first spot was created by dropping a small amount
of the ink onto the glass slide and then tilting the glass slide in order to create a strip of
varying consistency that can be observed for differences under the microscope. This also
provided information regarding the drying patterns and viscosity of the inks. The other
two spots were prepared individually by letting a drop of the ink fall straight down onto
the slide.

44
Another set of slides (duplicates) were created by using the same method as
described above but instead of directly dropping the ink onto the slide, it was dropped
onto a drop of distilled water and covered with a glass cover slip. Two separate spots
were created, one spot was from the top layer, before vortexing the samples to create a
uniform representation of the sample and one was after briefly vortexing the aliquot to
mix the sample. All slides, samples and sample aliquots were stored away from direct
sunlight, at room temperature and left over a week to dry.
Review of MSDS
The MSDS was obtained either from the respective sample websites or by
reaching out to the providers listed on the websites for all the samples except ProColor
Ink. A summarized table of the important information for all the samples is provided in
the results section. Refer to the Appendix for a more comprehensive table of sample
MSDS. For every component that was listed as an ingredient in the MSDS for each
sample, a table of structures was created, that may be useful to refer to while assigning
functional groups to the infrared spectroscopic bands in an effort to try and determine the
chemical structure of the pigment or the component that is being detected by the
spectroscopic methods.
Alternate Light Source
A CrimeScope CS-16-500W (SPEX Forensics) alternate light source and an
Entela (UVP) certified long and short UV wavelength handheld alternate light source
with a C-10 mini cabinet was utilized to investigate the fluorescent properties of the ink
samples. The slide preparations for Aero brand visible samples and aliquots for the rest of
the samples were arranged on a table and observed using the following wavelengths (in

45
nm) on the CrimeScope and the handheld light source: 254, 365, 415, 430, 445, 455, 475,
495, Crime Scene Search (540), 515, 535, 555, 575, 600, 635, 670 and White Light using
clear, red, orange and yellow goggles. A few slide samples were picked to be done in
duplicates to account for any contamination introduced by the slide. The samples that
showed low to high level of fluorescence in any combination of light source and goggles,
were separated and photographed using a Nikon D7100 digital camera with a 60mm lens
(or a phone camera in case of the Entela light source) and the respective red, yellow or
orange Tiffen® filter. All results were recorded in a table.
Figure 26.0: Illustrates the set up for fluorescence determination using the alternate light
sources.
Microscopy
The slides were observed using stereo microscopy as well as polarized light
microscopy. A Motic brand SMZ-171 model stereo microscope was used with an
external LED light source. The slides were viewed at total magnifications ranging from
7.5X to 50X and important observations such as color, thickness, consistency and drying
patterns were photo documented.
46
An Olympus brand BH-2 model polarized light microscope was used to document
other characteristics of the ink samples that were not easily observed using the
stereomicroscope. The microscope was set up for Kohler-like illumination to make initial
observations and minor modifications were made later to the Kohler set up, in order to
better observe some important characteristics of the samples. The samples were viewed at
total magnifications ranging from 50X to 400X and also under crossed polars. The
anisotropy or isotropy as well as the sign of elongation was photo documented when
necessary.
Extraction
Each ink sample was extracted using eight different solvents that were chosen on
the basis of their pH and on the basis of the solvents that were already present in the
samples, as indicated by the MSDS. In a study conducted by Jasuja, Singla, & Seema
(1989), the overall results of extraction of common stamp pad inks indicated that pyridine
was a better solvent than distilled water. Groves, Palenik & Palenik, (2016) highlighted
that the successful isolation of a dye from its matrix permits detailed characterization,
comparison and sometimes identification using chromatographic and spectroscopic
methods. They surveyed multiple dye extraction publications and found that from the 36
solvent systems that were used, a mix of pyridine and distilled water was among the most
commonly cited extraction solvent. Their results also revealed that about 82% of
commonly used fiber dyestuffs was extractable using that mixture.
The list of solvents used are as follows: 10% Sulfuric Acid (pH=0-1), 10%
Glacial Acetic Acid (pH=2-3), Reverse Osmosis (RO) water (pH= 4-5), Dimethyl
Sulfoxide (DMSO, pH= 4-5), Ethanol (pH=5), Acetone (pH= 5-6), Pyridine (pH=6-7)
47
and 10% Sodium Hydroxide (pH=14). Extractions were performed in clean glass test
tubes by mixing approximately 25 μL of the neat inks sample with 1mL of the solvent
and all observations were photo documented. Extractions with the RO water were also
warmed gently using a hot plate. Extractions were observed after one week to check for
any changes to the initial observations. All extractions were stored at room temperature,
away from direct sunlight.
For Aero brand visible samples that showed a clear separation of distinct layers
(blue, green, yellow, pink, purple and white), an additional extraction was performed
using RO water and ethanol in an attempt to isolate and identify the whitish bottom layer.
Prior to extraction, a toothpick was used to get to the ink portion that consisted of the
whitish layer and the whitish layer part of the sample that adhered to the toothpick was
subsequently smeared onto a clean glass slide. For the extraction process, first the
samples were spun for approximately 10 minutes on a microcentrifuge. A white layer was
observed on the side of the tubes. The top colored layer was aliquoted into another tube.
RO water was added to the samples, and the samples were vortexed and centrifuged for
another 10 minutes. The top layer was discarded. Four more extractions were performed
in the same manner as indicated above, but using ethanol as a solvent instead of water.
After the final extraction and discarding of the top solvent layer, fresh toothpicks were
used to smear the bottom leftover whitish layer from each extraction onto clean slides.
The tubes that contained the whitish layer were left open to be dried. The dried, whitish
powdery substance in the tube was then viewed using stereo microscopy and the slides
were viewed using stereo microscopy, polarized light microcopy and the alternate light
source.
48
UV-Visible Spectroscopy
The Shimadzu UV 2600/2700 and UV 2450/2550 UV-VIS Spectrophotometers
were used to obtain UV-VIS spectra of the extracted samples. A Holmium Oxide
standard was used to check for wavelength accuracy. Clean silica cuvettes were used to
make sample determinations. Cuvettes were cleaned with acetone and distilled water
between samples in order to avoid cross-contamination. The samples were prepared in a
manner that provided an absorbance reading between 2.0 and 0.5. The wavelength range
for determination was from 190 nm to 1100 nm. Other specifications included: a medium
range scan speed, a sampling interval of 1.0 and a slit width of 1.0 nm. Sample
determinations were made using the extraction solvent as a reference. The spectra for
each extracted sample was analyzed on the Shimadzu UVProbe (version 2.42) software.
In order to check for reproducibility, some sample extractions were repeated on a
different day using the same solvents and spectra were determined using the same UV-
VIS spectrophotometer as before.
Dried samples (samples were scrapped off from replicate slides of the neat sample
and added directly to the cuvette containing the solvent)) were also analyzed using the
UV-VIS spectroscopy technique. This was performed in an attempt to determine if the
spectra obtained from the neat samples has interference from the other vehicle
components that are also present in the samples. Pyridine was chosen as the extraction
solvent as it had the best results among the different solvents that were previously tested.
All the Aero brand visible samples, Aero brand invisible blue, one Tattoo brand sample
(that started to show some drying on the edges) and one W brand sample, were analyzed
in this manner. ProColor invisible green could not be analyzed as a dried sample since it

49
did not dry completely. A UV-VIS spectrum for Pyridine against water was also
determined.
FTIR-ATR Spectroscopy
The Thermo Scientific™ Nicolet™ iS10 FTIR Spectrometer with Smart™ iTX
ATR Accessory was used to obtain IR spectra of the ink samples. The Thermo
Scientific™ OMNIC™ FTIR Software 9.3.32 was used to view and analyze the spectra
generated. In order to prepare the samples for FTIR-ATR spectroscopy, a glass pipette
was used to drop a few drops (5-6) of the neat ink on a clean, dry spot plate and was
allowed to dry (figure 27.0). The drying properties were documented. For the Aero brand
colored samples, all samples were spotted as per the separation of the layers that was
observed; T for top, M for middle and B for bottom. The samples were then scraped off
of the spot plate and placed directly on top of the diamond using a clean (cleaned with
distilled water and acetone) spatula. The ProColor Ink and Tattoo brand samples would
not air-dry or dry with slow heating and hence were dropped directly onto the ATR
diamond in order to make a spectral determination. The resolution for the scans was set at
4cm-1 and 256 total scans were taken for each sample. Advanced ATR correction was
applied to each sample (Crystal: Diamond, Angle of Incidence= 45˚, number of
bounces=1, sample refractive index= 1.50). The data spacing was set to 0.482 cm-1. A
polystyrene reference standard was used to check for wavelength accuracy and a
background spectrum was taken whenever required. The spectra were obtained in percent
(%) transmittance. Random samples were picked to be determined as duplicates on the
same day as well as on a different day in order to test for reproducibility and the results

50
have been summarized in the results section. ATR sampling areas were cleaned with
acetone and distilled water in between samples to avoid cross-contamination.
The FTIR-ATR spectra for most of the vehicle components listed for each sample
in its MSDS was downloaded from the NIST website. These spectra were overlaid with
their respective samples to check for any band correlations.
Figure 27.0: Illustrates the set up for FTIR-ATR spectra determination.
Comparison of sample IR spectra to reference spectra using a software
The KnowItAll® Informatics System 2018 software by Bio-Rad Laboratories, Inc.
was used to perform comparisons between the sample spectra and the reference spectra
provided in the databases in the software. This software contains fully verified spectral
databases, with a collection that contains over 2.5 million spectra (IR, Raman,
NIR, NMR, MS, and UV-VIS) covering pure compounds and a broad range of
commercial products (Bio-Rad, 2018, a,b). The software consists of different functions
that allow the user to process the IR spectra, perform mixture deconvolutions and finally
obtain a possible identification for a sample spectrum. The results are also displayed as 1-
51
component, 2-component, 3-component and sometimes 4-component mixtures (when
applicable) as well as peak results and functional groups that are combined with scores
(out of a 100, 100 being the best correlation and 0 being no correlation) which allows the
user to understand the strength of the correlation that the software makes. The difference
between component result and peak result is that for a component search the whole
spectrum is searched against the references whereas for peak results the searches are done
for segments of the spectrum to see if a reference correlates with a specific part of the
spectrum only. A score is provided for this as well. This is important since there might be
contribution from more than one component of the ink to the spectrum. Additionally, the
user can view an overlay of the sample and reference spectra in order to manually
interpret the correlation and make a final decision. Since the score assignment is based on
the available reference spectra in the library which may be limited and incomplete, a high
score (close to 100) doesn’t necessarily mean a good correlation, so the actual spectra
correlation was analyzed to make the final decision. For the purpose of the samples
analyzed in this research, all previously mentioned IR (ATR as well as other techniques)
databases that were a part of the software were included in the search. The IR libraries
weren’t limited to just the dyes or pigments libraries but other kinds of libraries that
contained spectra information about polymers, binder, resins, adhesives and solvents
were also included in order to see if any of the vehicle components can also be identified
(if present).
Only the IR sample spectra were searched against the references on the software
by directly uploading the spectra into the software and allowing the software to use its
search algorithm to generate a hit list. The results have been summarized in a table that

52
indicates the possible reference sample/peak result that correlates with the research
sample, the score for the correlation and finally the functional groups that are labelled by
the software. This table would then be a comprehensive guide that can be used to make
other correlations as it contains important functional group information. The UV spectra
were not analyzed by directly uploading it into the software due to file compatibility
issues and because the solvent utilized to generate the reference spectra was methanol
(solvent was not used in this research). Nonetheless, the reference spectra (specifically
those related to dyes and pigments) were compared to the spectra observed for the
samples (for water, ethanol or acetone extractions) on UVProbe and comments were
made regarding correlation.
Results and Discussion
Visual Macroscopic Documentation and Preparation of Slides
First visual observation of the Aero brand visible samples indicated that they
appear as the color that is advertised. When observed after a week, all Aero brand
samples and aliquots showed separation into three layers: a top dark layer, a middle
consistent layer and a bottom white layer (Figures 28.0 and 29.0). The separation was not
very distinct for orange and red color samples. The ink sample aliquots were hard to mix
and did not seem uniform even after vortexing for a minute. The Aero brand invisible
blue sample was a clear solution that did not exhibit any separation.

53
Figure 28.0: Left: Illustrates the separation of layers in the Aero brand visible green and
purple ink sample. Notice how the top most layer is much darker than the other layers.
Figure 29.0: Right: Sample slide preparation. The sample slides shown in the picture
from top to bottom belong to Tattoo Green, ProColor Invisible Green, W Blue, Tattoo
Blue and Tattoo Red. These samples did not air-dry and required additional heating after
which only the W Blue sample dried. The other samples did not dry even after the
additional heating step.
First observation of the Tattoo brand ink samples indicated that they exhibit a
thicker and darker version of their advertised color. The ink samples also seemed oily and
had a certain degree of luster. The ink samples were too dark to exhibit any noticeable
separation.
The W brand blue sample was a clear solution. The pink sample was a light neon
pink and the red sample was a slightly darker version of the pink sample. The W green
sample was a neon green color. The W orange and W unlabeled samples were a neon
orange color. None of the samples exhibited any levels of separation.
The ProColor Invisible Green sample was a light olive-green oily solution that did
not exhibit any degree of separation.
Initial observations made during the preparation of slides are as below: Aero
Green, Blue, Orange and Red samples were more viscous than the other colored samples
54
of the Aero brand. The orange sample was the thickest and white and purple samples
were the thinnest (least viscous). The orange sample did not spread out too much, even
when the slide was held at an angle for about a minute. Compared to that, the white and
purple samples spread out as soon as they were dropped onto the slide. Same
observations were made for colors with duplicate samples. All samples were dry when
observed after a week and exhibited the advertised color when dry. The red sample
showed some transparency on drying.
The Tattoo brand samples were oily and less viscous compared to the Aero brand
samples and did not air dry or dry with slow consistent heating (starting at 60˚C and
going up to 90 ˚C). The drops on the slide remained thick and dark and did not spread out
on the slide.
The ProColor ink sample was also an oily liquid with viscosity similar to the
Tattoo brand samples and also did not air dry or dry with slow consistent heating (starting
at 60˚C and going up to 90 ˚C).
The W brand ink samples and the Aero Invisible Blue ink sample had the least
viscosity among all the samples. The W brand samples dried almost immediately into
small colored spots whereas the Aero invisible Blue brand ink took longer to air dry.
Additionally, this sample formed a distinct pattern on the slide when dry. The pattern
showed multiple focal points branching outwards as lines originating from a single point.
The slide became opaque (pale white) when the sample dried. All W brand samples,
except W blue dried to oblivion and were very hard to find on the slide. Additional drops
had to be added and dried in order to notice a color. The pink sample was a light pink
color when dried and the red sample was a darker version of the pink sample. The green

55
sample seemed to exhibit an olive-green color when dry. The orange and unlabeled
samples showed separation into yellow, orange and red color when dry and also showed a
branching drying pattern. The W blue and Aero Invisible Blue samples dried to form a
flaky, powdery white substance on the slide.
The second set of slides prepared with water were done in an effort to obtain a
thinner layer of the ink sample to be observed under the microscope. For all Aero brand
visible ink samples, the ink did not mix with the water drop and stayed on top of the
water as a floating layer. The floating layer had to be broken up with a pipette tip. The
slide dried to exhibit different layers of thickness for the ink samples.
For the W brand samples, the ink almost immediately caused the water drop to
separate into tiny droplets but easily mixed with water, compared to the Aero visible
samples. The samples dried to give thin lines of the sample, which were still hard to find
on the slides. The dried W blue sample was easier to see than the rest.
For the Tattoo brand samples, the ink mixed well with water and became lighter.
The color of the ink was more noticeable after having been mixed with water. The
samples did not dry completely.
For the ProColor brand sample, the ink did not mix at all with water and remained
as an oily droplet, separated from the water. The oily droplet never dried.
For the Aero invisible sample, the ink mixed well with water, as opposed to the
Aero visible samples. The slide dried to produce a white flakey and powdery substance.
Review of MSDS
For each sample except ProColor ink, an MSDS (Table 1.0) was obtained and the
information in the MSDS is tabulated below. A more comprehensive version of the

56
MSDS table can be found in the appendix. Refer to table 2.0, for the chemical structures
of the ingredients in each sample, as indicated by the MSDS. The MSDS for the samples
did not provide any information regarding the type of dye or pigment that was used to
give color to the ink sample. Only solvent information of the vehicle part of the ink was
provided. The Aero brand visible samples also indicated the presence of additional
components that can be classified as binders or resins that may have been added to lend
stability to the ink samples.
Table 1.0: MSDS information for all the samples
Serial No. Brand Components Molecules
1. Aero Brand Inks
(IIMAK INKS)-752-
Visible Ink
Ethanol
Dipropylene Glycol
Monomethyl Ether

57
n-Butanol
Diacetone Alcohol
Ethyl Acetate
Nitrocellulose
Isopropanol
Modified
polymer/binders
N/A
Carbon Black N/A
Color Pigments N/A
2. Aero Brand Inks
(IIMAK INKS)-6330-
Invisible Ink
Isopropanol
Water
Fluorescent
Brightener
N/A
3. “W” Isopropyl alcohol
Water
4. Tattoo- Temporary
Body Ink (Stewart
Superior Corp.)
Propylene Glycol
Glycerin
Table 2.0: The table illustrates the structure of the various ingredients listed in the MSDS
for the different samples. Chemical structure images have been retrieved from the
following websites: Wikipedia, Pubchem, ChemSpider, Arkema and chem.ucla.edu.

58
Alternate Light Source
The initial results using alternate light source is organized in table 3.0. None of
the Aero brand samples, except Yellow, White and Orange, exhibited fluorescence in any
combination of wavelength and goggle. The Aero Invisible Blue and W Blue samples
showed fluorescence only in the UV region (short and long wavelength). Only Tattoo
Red showed some fluorescence in the UV region, whereas the other Tattoo brand samples
showed no fluorescence in any combination of wavelength and goggle. All other samples
exhibited a range of fluorescence from 575nm down to 254nm. Most of those samples
also exhibited minimum fluorescence in white light.

59
Table 3.0: The table indicates the fluorescence results for all the samples using different
combinations of wavelength and goggles. N indicates no fluorescence, PF indicates
partial fluorescence, F indicates full fluorescence and Min F indicates minimum
fluorescence. Samples that exhibited no fluorescence are shaded in red and samples that
exhibited minimum to high levels of fluorescence are shaded in green with the different
shades indicating the levels of fluorescence.

60
Table 3.0: The table indicates the fluorescence results for all the samples using different
combinations of wavelength and goggles. N indicates no fluorescence, PF indicates
partial fluorescence, F indicates full fluorescence and Min F indicates minimum
fluorescence. Samples that exhibited no fluorescence are shaded in red and samples that
exhibited minimum to high levels of fluorescence are shaded in green with the different
shades indicating the levels of fluorescence.
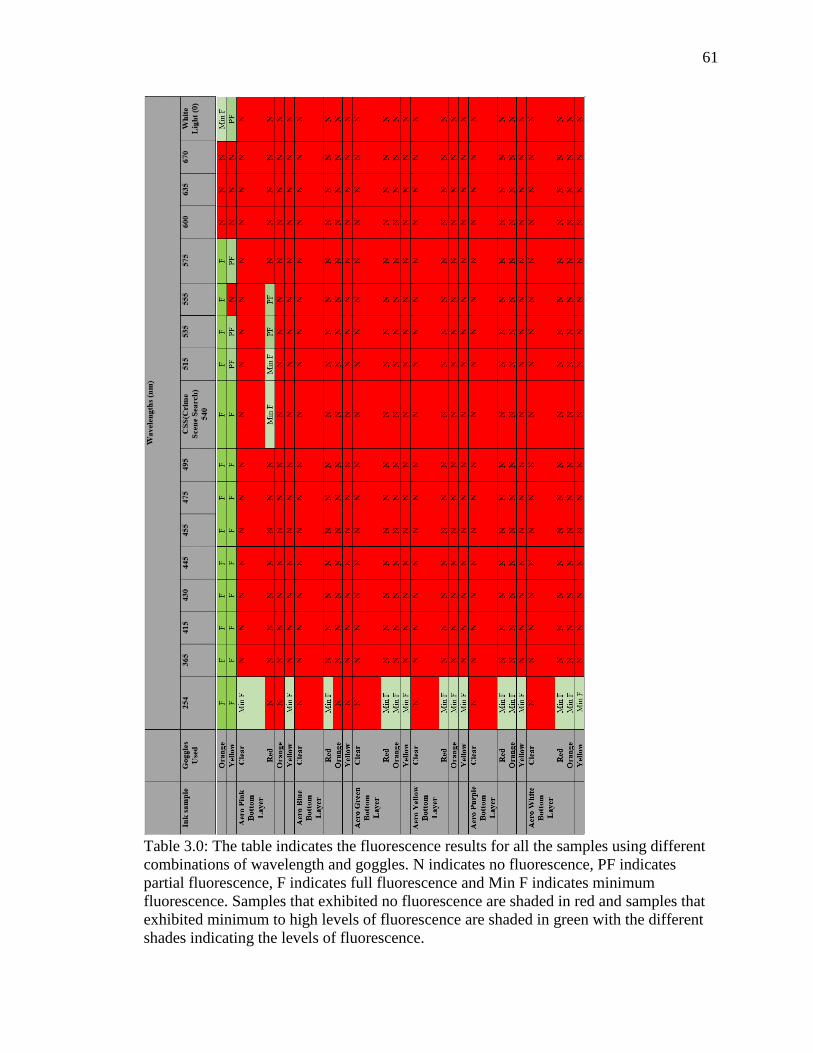
61
Table 3.0: The table indicates the fluorescence results for all the samples using different
combinations of wavelength and goggles. N indicates no fluorescence, PF indicates
partial fluorescence, F indicates full fluorescence and Min F indicates minimum
fluorescence. Samples that exhibited no fluorescence are shaded in red and samples that
exhibited minimum to high levels of fluorescence are shaded in green with the different
shades indicating the levels of fluorescence.

62
Figures 30.0- 34.0 below are photographs of the samples that exhibited some level
of fluorescence under a wavelength of 455nm, using a clear filter (or no filter), yellow
filter, red filter and orange filter. The different combination of filter and light source
changed the overall color and degree of fluorescence for the ink samples. The
combination of the color of fluorescence, degree of fluorescence and wavelength/goggle
under which each sample fluoresced, was unique enough that this closed set of samples
could be individualized on the basis of alternate light source.
Figures 30.0 and 31.0: Left (30.0): samples that fluoresced on first observation,
photographed with white light and no filter, right (31.0): with no filter at 455nm
Figures 32.0 and 33.0: Left (32.0): samples that fluoresced on first observation,
photographed with yellow filter at 455nm, right (33.0): with red filter at 455nm

63
Figure 34.0: samples that fluoresced on first observation, photographed with orange filter
at 455nm. The samples are as follow: first row from left to right: ProColor Invisible
Green, W Green, W Blue, Aero Invisible Blue, second row from left to right: W Pink, W
Red, W Orange, W Unlabeled, third row: duplicate slides of Aero Orange, fourth row:
slide showing the smear of the extracted white portion of the Aero pink sample that
showed separation into layers (refer to the extraction section for more details). Notice
how different filters illustrate different colors for the samples being observed. These
colors stayed the same, except for clear, (depending on the filter being used) and only the
intensity of fluorescence changed with wavelengths. For clear googles/no goggles, the
color shade of the fluorescence got darker as the wavelength decreased.
Extraction
Observations for each ink sample for all eight solvents have been documented in
table 4.0. Each sample gave a unique combination of observations for the eight solvents.
These observations allowed for the distinction of samples of same color but different
brands and invisible and visible samples of same color. Aero brand visible samples of the
same color but different lot numbers gave the same results. In general, Aero brand visible
samples tended to dissolve best in Pyridine, DMSO, Acetone and Ethanol. Very high or
very low pH solutions and water were unable to dissolve the Aero visible brand ink
samples. For the Tattoo, ProColor Ink, Aero Invisible Blue and W brand samples, all the
solvents were able to dissolve the ink sample and provide solutions that could be
64
analyzed using UV-VIS spectrophotometry. The diverse way in which each solvent
affects different ink samples is related to the solvent or the solvatochromic effect.
The solvatochromic effect is the way the spectrum (as observed via UV-VIS
spectroscopy) of a substance (the solute) varies when the substance is dissolved in a
variety of solvents (Marini, Munoz-Losa, Biancardi & Mennucci, 2010, Reichardt &
Welton, 2011). The dielectric constant and hydrogen bonding capacity are the most
important properties of the solvent. With various solvents there is a different effect on the
electronic ground state and excited state of the solute, so that the size of energy gap
between them changes as the solvent changes (Marini, Munoz-Losa, Biancardi &
Mennucci, 2010, Reichardt & Welton, 2011). This is reflected in the absorption or
emission spectrum of the solute and appears as differences in the position, intensity, and
shape of the spectroscopic bands. When the spectroscopic band occurs in the visible part
of the spectrum, solvatochromism is observed as a change of colour (Marini, Munoz-
Losa, Biancardi & Mennucci, 2010, Reichardt & Welton, 2011). These phenomenon are
seen in molecular spectra, not atomic spectra; thus, this change in color may be able to
tell us a little bit about the structure of the pigment or dye in the ink sample based on how
its functional groups are reacting to the different types of solvents (Marini, Munoz-Losa,
Biancardi & Mennucci, 2010, Reichardt & Welton, 2011).
An additional extraction was performed for the Aero Visible samples that
exhibited layer separation. At each step of the extraction with water and later ethanol, it
was observed that the colored component was being separated from the possible pigment
component. The pigment component was a pale version of the color of the sample. After
a number of extractions, the supernatant started to get clear but the pigment precipitate

65
still exhibited the color of the ink sample. It may be possible that this is either the ink
component that is harder to extract and separate from the possible white pigment
component or that the pigment itself has the color of the sample. Miranda, 2015 has
reported Zinc Oxide and Titanium Dioxide as some inorganic compounds that are added
to tattoo ink samples to provide the white color. The downstream XRF or FTIR-ATR
determinations of these dried pale pigment precipitates may help elucidate their nature.
Ink Sample Solvent Type Observation
2/4 oz Aero Orange 10% Sulfuric Acid
Colorless solution, orange
undissolved ink clump floating on
top, few flakes suspended in solution
10% Glacial Acetic Acid
Colorless solution, undissolved ink
clump settled to the bottom, few
flakes suspended in solution and on
the surface
RO water
Colorless solution, undissolved ink
clump settled at the bottom
Dimethyl Sulfoxide (DMSO)
Light orange tinge to solution,
undissolved ink clump settled at the
bottom, few flakes suspended and
floating on the surface or precipitated
on the wall of the test tube
Ethanol
New extraction: Colorless-orange
tinge to solution, older extraction
showed precipitated layers when the
solution dried up: bottom large pale
white layer → thin layer of orange on
top of it
Acetone
Old extraction: Solution evaporated,
white precipitate on the bottom and
orange thick ink layer on the top
New extraction: Orange solution
Pyridine
New extraction: Light orange tinge to
solution, older extraction showed
precipitated layers when the solution
dried up: bottom center white → pale
orange layer → orange layer (from
bottom to top)
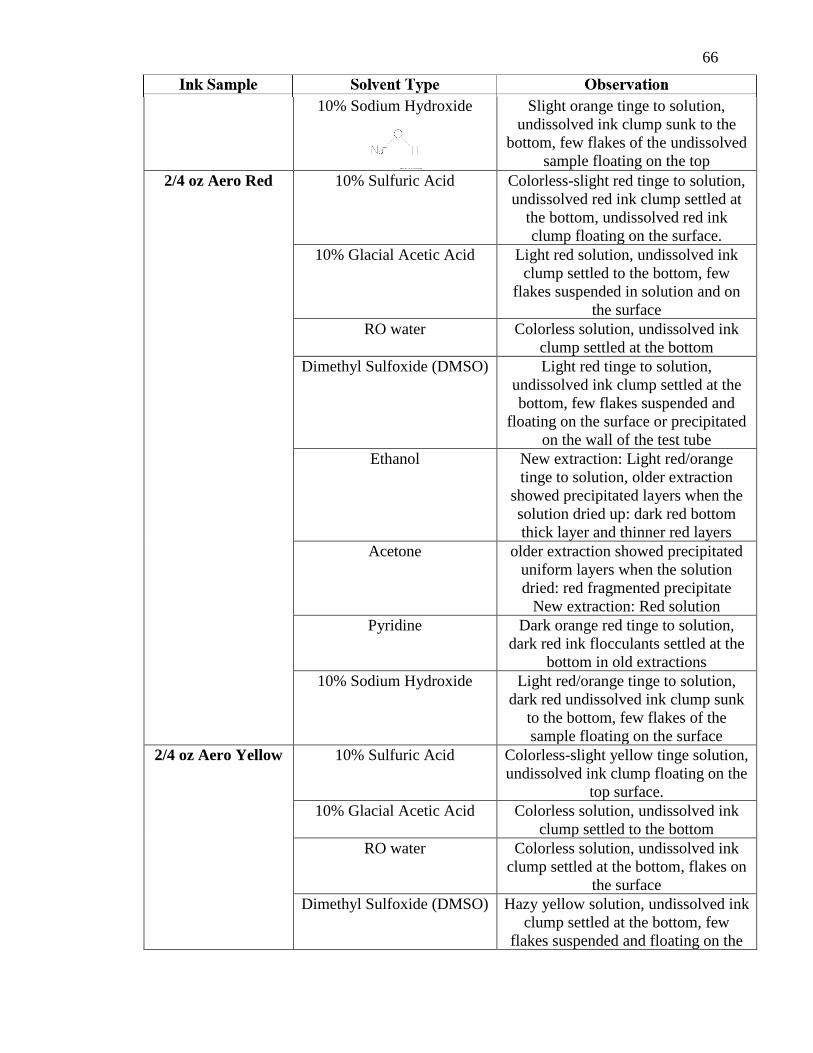
66
10% Sodium Hydroxide
Slight orange tinge to solution,
undissolved ink clump sunk to the
bottom, few flakes of the undissolved
sample floating on the top
2/4 oz Aero Red 10% Sulfuric Acid Colorless-slight red tinge to solution,
undissolved red ink clump settled at
the bottom, undissolved red ink
clump floating on the surface.
10% Glacial Acetic Acid Light red solution, undissolved ink
clump settled to the bottom, few
flakes suspended in solution and on
the surface
RO water
Colorless solution, undissolved ink
clump settled at the bottom
Dimethyl Sulfoxide (DMSO) Light red tinge to solution,
undissolved ink clump settled at the
bottom, few flakes suspended and
floating on the surface or precipitated
on the wall of the test tube
Ethanol New extraction: Light red/orange
tinge to solution, older extraction
showed precipitated layers when the
solution dried up: dark red bottom
thick layer and thinner red layers
Acetone older extraction showed precipitated
uniform layers when the solution
dried: red fragmented precipitate
New extraction: Red solution
Pyridine Dark orange red tinge to solution,
dark red ink flocculants settled at the
bottom in old extractions
10% Sodium Hydroxide Light red/orange tinge to solution,
dark red undissolved ink clump sunk
to the bottom, few flakes of the
sample floating on the surface
2/4 oz Aero Yellow 10% Sulfuric Acid Colorless-slight yellow tinge solution,
undissolved ink clump floating on the
top surface.
10% Glacial Acetic Acid Colorless solution, undissolved ink
clump settled to the bottom
RO water
Colorless solution, undissolved ink
clump settled at the bottom, flakes on
the surface
Dimethyl Sulfoxide (DMSO) Hazy yellow solution, undissolved ink
clump settled at the bottom, few
flakes suspended and floating on the

67
surface or precipitated on the wall of
the test tube
Ethanol Colorless-pale yellow tinge to
solution, older extraction showed
precipitated layers when the solution
dried up: bottom thick pale yellow-
white → thin layer of yellow on top
of it and on the walls of the test tube.
Acetone Old extraction: Solution evaporated,
precipitated layers remained: pale
yellow bottom spot → fragmented
yellow precipitate on top and on the
walls
New extraction: Yellow solution
Pyridine Pale yellow tinge to solution, older
extraction showed precipitated layers
when the solution dried up: bottom
center white → pale yellow layer →
yellow layer (from bottom to top)
10% Sodium Hydroxide Light yellow tinge to solution, yellow
and pale white ink flakes sunk to the
bottom, few flakes of the sample
floating on the top surface, few flakes
suspended in solution
2/4 oz Aero Blue 10% Sulfuric Acid Colorless solution, large blue-white
undissolved ink clump sunk to the
bottom
10% Glacial Acetic Acid Colorless solution, undissolved ink
clump settled to the bottom, few
flakes floating on the surface
RO water
Colorless solution, undissolved ink
clump settled at the bottom, few
flakes on the surface and suspended
in the solution
Dimethyl Sulfoxide (DMSO) Light blue tinge to solution,
undissolved ink clump settled at the
bottom, few flakes suspended and
floating on the surface or precipitated
on the wall of the test tube
Ethanol New extraction: Colorless-pale blue
tinge to solution, older extraction
showed precipitated layers when the
solution dried up: pale blue → pale
white → pale blue → thin pale white
→ thick layer of blue ink settled on
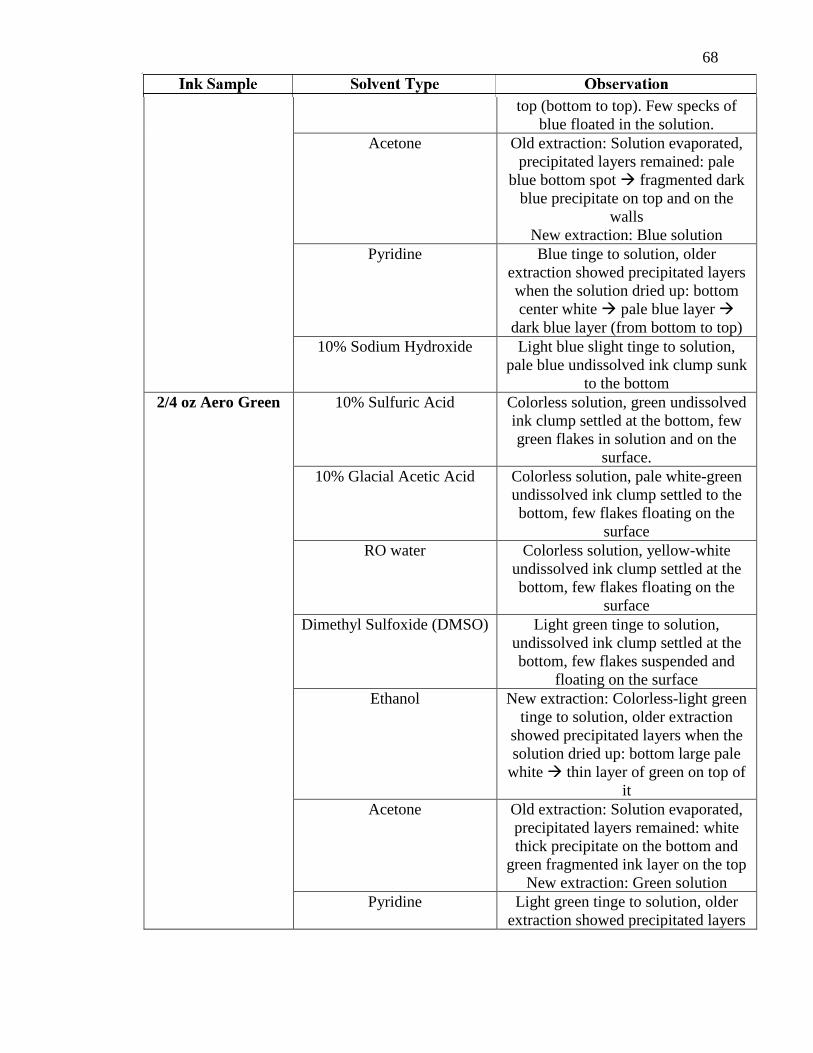
68
top (bottom to top). Few specks of
blue floated in the solution.
Acetone Old extraction: Solution evaporated,
precipitated layers remained: pale
blue bottom spot → fragmented dark
blue precipitate on top and on the
walls
New extraction: Blue solution
Pyridine Blue tinge to solution, older
extraction showed precipitated layers
when the solution dried up: bottom
center white → pale blue layer →
dark blue layer (from bottom to top)
10% Sodium Hydroxide Light blue slight tinge to solution,
pale blue undissolved ink clump sunk
to the bottom
2/4 oz Aero Green 10% Sulfuric Acid Colorless solution, green undissolved
ink clump settled at the bottom, few
green flakes in solution and on the
surface.
10% Glacial Acetic Acid Colorless solution, pale white-green
undissolved ink clump settled to the
bottom, few flakes floating on the
surface
RO water
Colorless solution, yellow-white
undissolved ink clump settled at the
bottom, few flakes floating on the
surface
Dimethyl Sulfoxide (DMSO) Light green tinge to solution,
undissolved ink clump settled at the
bottom, few flakes suspended and
floating on the surface
Ethanol New extraction: Colorless-light green
tinge to solution, older extraction
showed precipitated layers when the
solution dried up: bottom large pale
white → thin layer of green on top of
it
Acetone Old extraction: Solution evaporated,
precipitated layers remained: white
thick precipitate on the bottom and
green fragmented ink layer on the top
New extraction: Green solution
Pyridine Light green tinge to solution, older
extraction showed precipitated layers

69
when the solution dried up: two
layers: pale green and dark green
10% Sodium Hydroxide Slight green tinge to solution,
undissolved ink clump sunk to the
bottom, few flakes of the sample
floating on the top and suspended in
solution
2 oz Aero Pink 10% Sulfuric Acid Pink solution with pink precipitate
10% Glacial Acetic Acid Hazy pink solution with pink
precipitate
RO water Hazy solution, floating pink flakes
Dimethyl Sulfoxide (DMSO) Pink solution
Ethanol Pink solution with pink precipitate
Acetone Pink solution
Pyridine Pink solution with white precipitate
on the bottom
10% Sodium Hydroxide Red solution with ink floating flakes
2 oz Aero Purple 10% Sulfuric Acid Hazy lilac solution with purple
precipitate
10% Glacial Acetic Acid Hazy lilac solution with purple
precipitate
RO water
Hazy solution, fine floating purple
flakes
Dimethyl Sulfoxide (DMSO) Purple solution
Ethanol Purple solution with purple fine
precipitate
Acetone Purple solution
Pyridine Purple solution
10% Sodium Hydroxide Hazy lilac solution with purple
floating flakes
2oz Aero White 10% Sulfuric Acid Clear solution with white precipitate
10% Glacial Acetic Acid Clear solution with white precipitate
RO water Clear solution, white floating flakes
Dimethyl Sulfoxide (DMSO) White solution
Ethanol White solution formed by fine white
flakes
Acetone White solution formed by fine white
flakes
Pyridine White solution
10% Sodium Hydroxide Hazy white solution with white
floating flakes
Aero Invisible Blue 10% Sulfuric Acid Hazy white precipitate in colorless
solution
10% Glacial Acetic Acid Colorless solution
RO water Colorless solution

70
Dimethyl Sulfoxide (DMSO) Slight bluish tinge to solution
Ethanol Solution evaporated; layers of pale
white precipitate formed
Acetone Old extraction: Solution evaporated;
pale white-yellow precipitate
remained. More acetone re-added to
the sample. Hazy white solution.
Pyridine Lilac violet pale solution, lilac white
layers precipitated on the walls
10% Sodium Hydroxide Colorless-slight pale yellow tinge
solution
Tattoo Green 10% Sulfuric Acid Green solution
10% Glacial Acetic Acid Green solution
RO water Green solution
Dimethyl Sulfoxide (DMSO) Green solution with green precipitate
Ethanol Green solution
Acetone Green solution with green precipitate
Pyridine Deep green solution
10% Sodium Hydroxide Dull green solution
Tattoo Blue 10% Sulfuric Acid Green solution
10% Glacial Acetic Acid Dark blue solution
RO water Blue color solution
Dimethyl Sulfoxide (DMSO) Blue solution with blue precipitate
Ethanol Blue solution
Acetone Blue solution with blue precipitate
Pyridine Deep blue solution
10% Sodium Hydroxide Dark violet, navy blue solution
Tattoo Red 10% Sulfuric Acid Yellow green solution with floating
red precipitate
10% Glacial Acetic Acid Olive green solution with red
precipitate
RO water Dark red-orange brown solution
Dimethyl Sulfoxide (DMSO) Deep pink solution with deep red
precipitate
Ethanol Dark red-orange brown solution
Acetone Dark red-orange brown solution and
red precipitate
Pyridine Deep red solution
10% Sodium Hydroxide Scarlet light red solution
W Red 10% Sulfuric Acid Orange pink solution
10% Glacial Acetic Acid Dark pink solution
RO water Pink solution
Dimethyl Sulfoxide (DMSO) Dark pink solution

71
Ethanol Solution evaporated, dark pink
precipitate, spots and layers along the
side of the test tube
Acetone Dark pink solution
Pyridine Pink solution
10% Sodium Hydroxide Pink solution
W Pink 10% Sulfuric Acid Light pink solution
10% Glacial Acetic Acid Dark pink solution
RO water Pink solution
Dimethyl Sulfoxide (DMSO) Pink solution
Ethanol Solution evaporated, pink precipitate
Acetone Hazy white solution
Pyridine Very faint pink solution
10% Sodium Hydroxide Light pink solution, flocculent pink
precipitate
W Green 10% Sulfuric Acid Colorless solution, slight yellow tinge
10% Glacial Acetic Acid Light green tinge to solution
RO water Light green solution
Dimethyl Sulfoxide (DMSO) Colorless solution, slight bluish tinge
Ethanol Solution evaporated, yellow-brown
precipitate, spots and layers along the
wall of the test tube
Acetone Colorless solution, yellow precipitate
Pyridine Old extraction: Solution evaporated;
green yellow powdery residue left
behind in layer. Pyridine was re-
added to the tube that resulted in a
hazy green solution.
10% Sodium Hydroxide Bright fluorescent green solution
W Blue 10% Sulfuric Acid Hazy solution with floating flocculent
orange precipitate, also on the walls
of test tube
10% Glacial Acetic Acid Colorless solution, white-pink
flocculent residue in solution and
precipitated on the walls
RO water Colorless solution
Dimethyl Sulfoxide (DMSO) Colorless, slight bluish tinge to
solution
Ethanol Solvent evaporated, characteristic
needle shaped hazy yellow precipitate
along sides and on the bottom of the
test tube
Acetone Colorless solution flocculent white
precipitate
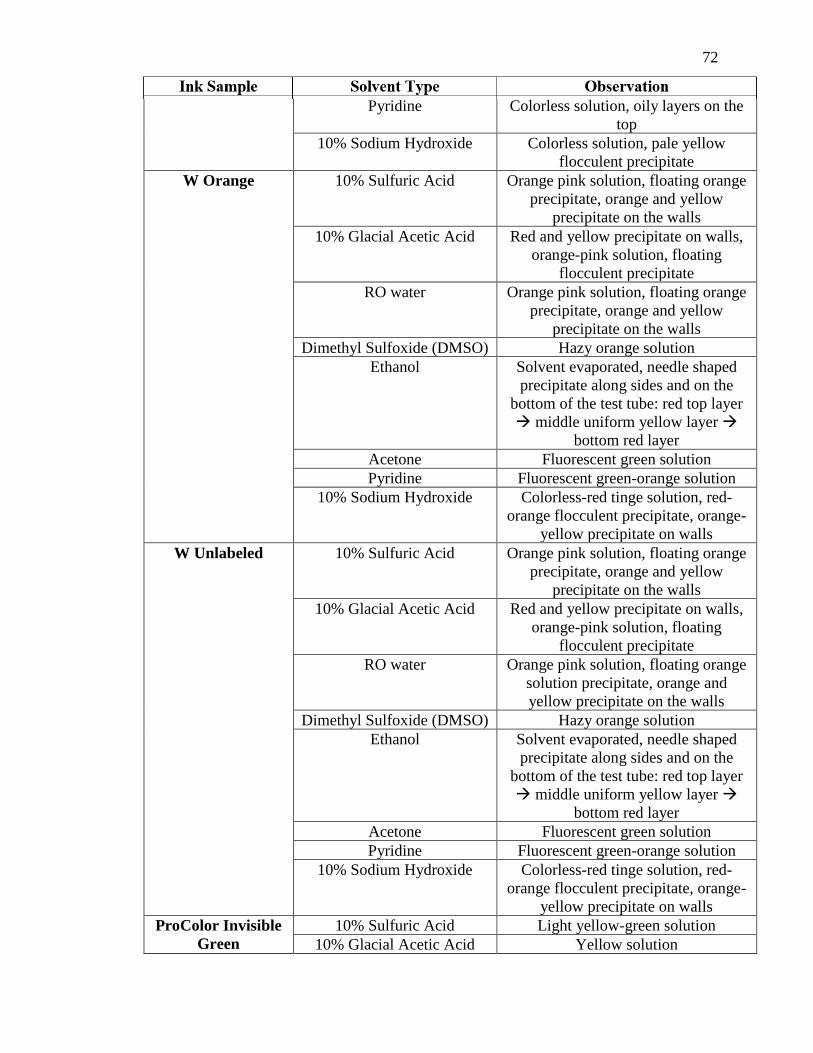
72
Pyridine Colorless solution, oily layers on the
top
10% Sodium Hydroxide Colorless solution, pale yellow
flocculent precipitate
W Orange 10% Sulfuric Acid Orange pink solution, floating orange
precipitate, orange and yellow
precipitate on the walls
10% Glacial Acetic Acid Red and yellow precipitate on walls,
orange-pink solution, floating
flocculent precipitate
RO water
Orange pink solution, floating orange
precipitate, orange and yellow
precipitate on the walls
Dimethyl Sulfoxide (DMSO) Hazy orange solution
Ethanol Solvent evaporated, needle shaped
precipitate along sides and on the
bottom of the test tube: red top layer
→ middle uniform yellow layer →
bottom red layer
Acetone Fluorescent green solution
Pyridine Fluorescent green-orange solution
10% Sodium Hydroxide Colorless-red tinge solution, red-
orange flocculent precipitate, orange-
yellow precipitate on walls
W Unlabeled 10% Sulfuric Acid Orange pink solution, floating orange
precipitate, orange and yellow
precipitate on the walls
10% Glacial Acetic Acid Red and yellow precipitate on walls,
orange-pink solution, floating
flocculent precipitate
RO water
Orange pink solution, floating orange
solution precipitate, orange and
yellow precipitate on the walls
Dimethyl Sulfoxide (DMSO) Hazy orange solution
Ethanol Solvent evaporated, needle shaped
precipitate along sides and on the
bottom of the test tube: red top layer
→ middle uniform yellow layer →
bottom red layer
Acetone Fluorescent green solution
Pyridine Fluorescent green-orange solution
10% Sodium Hydroxide Colorless-red tinge solution, red-
orange flocculent precipitate, orange-
yellow precipitate on walls
ProColor Invisible
Green
10% Sulfuric Acid Light yellow-green solution
10% Glacial Acetic Acid Yellow solution
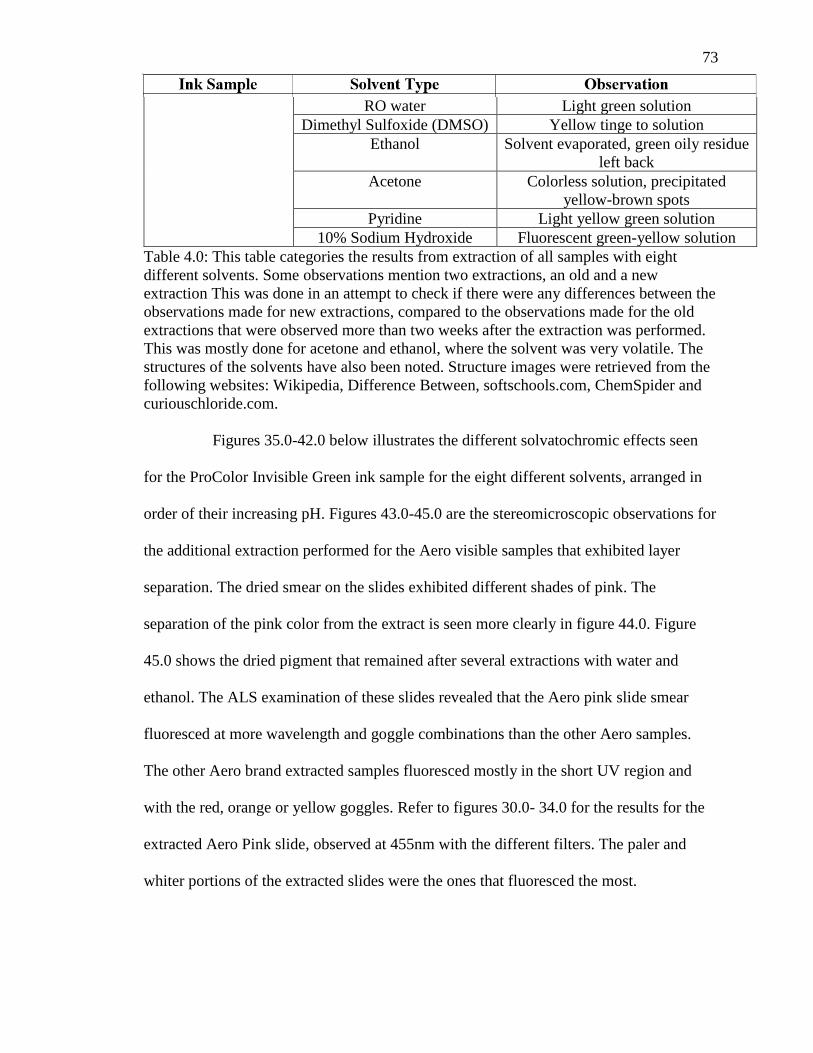
73
RO water Light green solution
Dimethyl Sulfoxide (DMSO) Yellow tinge to solution
Ethanol Solvent evaporated, green oily residue
left back
Acetone Colorless solution, precipitated
yellow-brown spots
Pyridine Light yellow green solution
10% Sodium Hydroxide Fluorescent green-yellow solution
Table 4.0: This table categories the results from extraction of all samples with eight
different solvents. Some observations mention two extractions, an old and a new
extraction This was done in an attempt to check if there were any differences between the
observations made for new extractions, compared to the observations made for the old
extractions that were observed more than two weeks after the extraction was performed.
This was mostly done for acetone and ethanol, where the solvent was very volatile. The
structures of the solvents have also been noted. Structure images were retrieved from the
following websites: Wikipedia, Difference Between, softschools.com, ChemSpider and
curiouschloride.com.
Figures 35.0-42.0 below illustrates the different solvatochromic effects seen
for the ProColor Invisible Green ink sample for the eight different solvents, arranged in
order of their increasing pH. Figures 43.0-45.0 are the stereomicroscopic observations for
the additional extraction performed for the Aero visible samples that exhibited layer
separation. The dried smear on the slides exhibited different shades of pink. The
separation of the pink color from the extract is seen more clearly in figure 44.0. Figure
45.0 shows the dried pigment that remained after several extractions with water and
ethanol. The ALS examination of these slides revealed that the Aero pink slide smear
fluoresced at more wavelength and goggle combinations than the other Aero samples.
The other Aero brand extracted samples fluoresced mostly in the short UV region and
with the red, orange or yellow goggles. Refer to figures 30.0- 34.0 for the results for the
extracted Aero Pink slide, observed at 455nm with the different filters. The paler and
whiter portions of the extracted slides were the ones that fluoresced the most.

74
Figures 35.0-42.0 (from left to right): ProColor Invisible Green in 10% Sulfuric Acid
(pH=0-1), 10% Glacial Acetic Acid (pH=2-3), Reverse Osmosis (RO) water (pH= 4-5),
Dimethyl Sulfoxide (DMSO, pH= 4-5), Ethanol (pH=5), Acetone (pH= 5-6), Pyridine
(pH=6-7) and 10% Sodium Hydroxide (pH=14). The figures have been arranged in
increasing pH of the solvents so as to illustrate the effect of increasing pH on the color
and form of the solution formed.
Figures 43.0- 45.0: (43.0) Left: Figure shows the extracted white component smear on
slide at 7.5X magnification, (44.0) Middle: Extracted white component smear on slide at
50X magnification. (45.0) Right: Extracted pale pink dried solid at 50X magnification.
Microscopy
The stereo microscopy of the neat Aero brand visible samples revealed a
characteristic fracture-like and scale-like drying pattern. The pattern was more obvious
for the thicker portions of the dried ink compared to the thinner portions. The consistency
of the ink itself also affected the drying pattern of the ink. For the Aero Green sample, a
yellow and light-green color was observed in the edges of the dried ink stain and in
between the fracture lines (figure 46.0). The observations from the samples extracted
with water, exhibited a sheet like nature of the inks (this was seen in the extraction step as

75
well) that showed different variations of the sample color and also revealed a grainy
texture of the sample itself (figure 47.0). These characteristics could be attributed to the
polymer, binder or pigments that may be insoluble in water. The grainy nature of the inks
was confirmed using higher magnifications in the polarized light microscope (figure
48.0). These samples were all isotropic and remained dark under crossed polars.
The Tattoo brand samples, due to their previously mentioned oily nature, had not
completely dried. Using the stereo microscope, a characteristic branching drying pattern
was observed for the blue sample. The preparation of the blue sample in water exhibited
variations of blue and purple color when dry. The green sample in water also dried and
exhibited variations of blue, green and yellow colors, which was not seen in the neat
sample slide (figure 49.0). The red sample in water exhibited variations of pink, red and
orange colors whereas the neat sample looked deep pink to red under the stereo
microscope. The polarized light observations of the sample was able to support and
improve on the observations made using the stereo microscope. The green sample in
water showed golden color branching features that ran in between the green and blue
colors (figure 50.0). Both the green and blue samples were isotropic. The red sample in
water showed rod-shaped and branching structures in variations of red and pink (figure
51.0). These features were anisotropic with parallel extinction. The branches exhibited a
variety of colors under crossed polars including green, pink, orange, purple and red
(figure 52.0).
The invisible samples on the other hand, gave a wide range of different results for
all the samples. The stereo microscopy results solidified visual observations made for
each invisible sample as it did for the visible samples. For ProColor brand, the sample

76
remained as an oily liquid and hence a comment could not be made on the drying pattern.
W pink dried as a uniform pink film whereas W red dried to show variations of red and
purple. The orange and unlabeled samples gave similar results and revealed variations of
red, pink orange and yellow colors in the dried stain. The green sample dried to reveal
shiny green-golden residue on the slide. The W blue sample and the Aero invisible
sample gave similar results and dried as white flakes, the only difference being that the
flakes were larger for the Aero brand whereas the W brand showed smaller flakes with a
branching drying pattern. The results for the samples in water revealed nothing new.
With the polarized light microscope, additional observations were obtained, that helped
further distinguish samples of same color but different brand. The ProColor Invisible
Green and W orange, unlabeled, red and pink samples were isotropic. Features that were
previously observed under the stereo microscope could be documented at higher
magnification using the PLM. No additional information was obtained via the PLM. The
Aero Invisible Blue sample showed white, grainy precipitate with branching
characteristics and fracture patterned drying (figure 53.0). The precipitate was anisotropic
and had parallel extinction (figure 54.0). The W Blue sample showed rod shaped crystals
for the neat sample and fanned brush type crystals for the sample in water (figure 55.0),
both of which were mostly invisible unless observed with crossed polars. Since they were
anisotropic, the crystals remained bright (white-orange retardation colors), and showed
parallel extinction (figure 56.0). Lastly, the W Green sample showed branching crystals
under high magnification on the PLM (figure 57.0). The crystals were anisotropic (white-
orange retardation colors) and exhibited parallel extinction (figure 58.0). Refer to the

77
figures below for the comparison (unless mentioned otherwise, the figures represent the
slides for the neat samples.
Figures 46.0- 48.0: (46.0) Left: Aero brand green, 50X magnification, (47.0) Middle:
Aero brand green in water, 50X magnification, (48.0) Right: Aero brand green in water,
400X magnification.
Figures 49.0 and 50.0: (49.0) Left: Tattoo brand green, 400X magnification, (50.0) Right:
Tattoo brand green in water, 400X magnification.
Figures 51.0 and 52.0: (51.0) Left: Tattoo brand red, 400X magnification, (52.0) Right:
Tattoo brand red in water, 400X magnification, with crossed polars.

78
Figures 53.0 and 54.0: (53.0) Left: Aero brand Invisible Blue, 400X magnification, (54.0)
Right: Aero brand Invisible Blue, 400X magnification, with crossed polars.
Figures 55.0 and 56.0: (55.0) Left: W brand Invisible Blue in water, 400X magnification,
(56.0) Right: W brand Invisible Blue in water, 400X magnification, with crossed polars.
Figures 57.0 and 58.0: (57.0) Left: W Green, 400X magnification, (58.0) Right: W
Green, 400X magnification, with crossed polars.
79
UV-Visible Spectroscopy
The UV-VIS spectra were determined for all the samples and for all extractions.
For the Aero brand visible samples that had two sizes of the same color, sample
extractions were picked from the 2oz group, 4 oz group or both, in order to cover all Aero
brand visible sample extractions. A number of comparisons were possible and the results
have been explained below.
Comparison of same color invisible sample of different brands
For this comparison the following samples could be compared: Aero Brand
Invisible Blue with W blue and ProColor Invisible Green with W Green. For both
comparisons, water was picked as the extraction solvent to be compared since it is a
relatively neutral solvent. Spectrum 1.0 illustrates the comparison of Aero Invisible Blue
in water compared to W Blue in water. Both samples were clear solutions and seem to
absorb in the UV region. While the overall UV-VIS spectrum looks similar for the two
different brands, minor differences in the 300nm-200nm region can be used to tell them
apart. Comparing these results to what expected based on the MSDS for the samples, it
can be hypothesized that atleast for the Aero brand sample, the fluorescent brightener
could have contributed to the spectrum in the UV region. Since the W brand samples’
MSDS do not indicate anything else other than some or all of the solvents that are present
in the sample, a conclusion cannot be made on the origin of the bands in the UV region.
Just comparing the spectrum from W blue to Aero Invisible Blue, it can be hypothesized
that the W blue sample may also contain a similar fluorescent brightener. Most of the
other solvents also showed differences for the two samples.

80
Spectrum 1.0: Illustrates the differences between Aero Invisible Blue and W Blue, both
extracted in water.
Spectrum 2.0 illustrates the comparison of ProColor Invisible Green in water to
W Green in water. Both samples had the same spectra, not just in water, but in every
other extracted solvent as well. Since the same absorbance maximum wavelength values
were identified for both the samples their individual intra peak absorbance maximum
wavelength ratios were very similar. This could indicate that the samples may contain the
same pigment or dye component. Both samples were green to look at, W green being
fluorescent green and ProColor Invisible Green being light olive green. Both samples
showed absorbance in the visible 400nm-430nm region. This is the violet region of the
visible spectrum. This indicates that both samples have some component of the yellow
color in them since that is the region complementary to violet. Both samples also
exhibited absorbance in the UV region but this region could not be used to distinguish
between the two samples that were of same color but different brands.

81
Spectrum 2.0: Illustrates the similarities between the W Green ink sample and Procolor
Invisible Ink sample, both extracted in water.
Comparison of same color visible sample of different brands
For this comparison criteria, the following sample could be compared: 4oz/2oz
Aero Blue with Tattoo Blue, 4oz/2oz Aero Red with Tattoo Red and 4oz/2oz Aero Green
with Tattoo Green. Spectrum 3.0 illustrates the comparison of the Aero Red samples with
the Tattoo Red brand. Acetone was chosen as the extraction solvent to compare the UV-
VIS spectra of the two brands. Tattoo Red showed absorbance between 490nm and 580
nm (yellow-green region of the visible range). This is explained by the deep red color of
the sample. The two Aero brand red samples showed absorbance at approximately 580nm
and 490nm. This would indicate that the Aero brand red samples consisted of red and
violet colored components, with a little bit of orange. The two brands were
distinguishable using the other solvents as well. No much information was present in the
UV region.
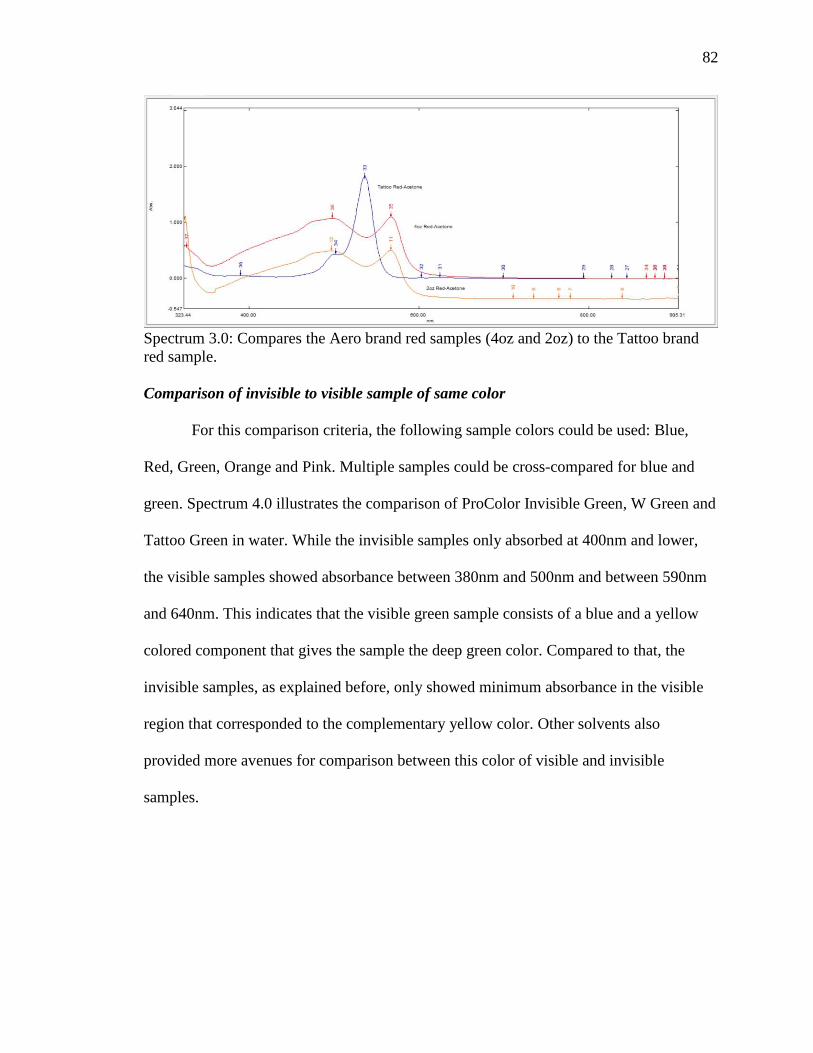
82
Spectrum 3.0: Compares the Aero brand red samples (4oz and 2oz) to the Tattoo brand
red sample.
Comparison of invisible to visible sample of same color
For this comparison criteria, the following sample colors could be used: Blue,
Red, Green, Orange and Pink. Multiple samples could be cross-compared for blue and
green. Spectrum 4.0 illustrates the comparison of ProColor Invisible Green, W Green and
Tattoo Green in water. While the invisible samples only absorbed at 400nm and lower,
the visible samples showed absorbance between 380nm and 500nm and between 590nm
and 640nm. This indicates that the visible green sample consists of a blue and a yellow
colored component that gives the sample the deep green color. Compared to that, the
invisible samples, as explained before, only showed minimum absorbance in the visible
region that corresponded to the complementary yellow color. Other solvents also
provided more avenues for comparison between this color of visible and invisible
samples.

83
Spectrum 4.0: Compares the invisible green samples to a visible green sample.
Spectrum 5.0 below illustrates the differences between the Aero brand visible
orange samples and W orange sample extracted in pyridine. Both samples showed
absorbance between 400nm and 480nm that corresponded to the complementary yellow
and orange colors. This is as expected since both samples were visibly orange. The Aero
brand samples also showed absorbance between 540nm and 570nm which indicates the
sample also consists of a red-violet colored component. This correlated with the previous
observations made for W orange, during microscopy and extractions that pointed towards
the presence of red, yellow and orange components (not very obvious for Aero orange as
it was very viscous and did not show any layer separation). Other solvents also showed
differences between the two samples and even provided additional information that may
be helpful in the elucidation of the pigment or dye structure.

84
Spectrum 5.0: Compares the Aero brand visible orange samples (4oz and 2oz) to W
invisible orange sample.
Comparison of different extraction solvents for an invisible sample
The results for this comparison are important as they help us understand how the
particular solvent that was used, affects the structure of the pigment or dye component
and thus the resulting spectrum. As explained before, a chromophore is usually an
electron-withdrawing group, while an auxochrome is commonly an electron-donating
group and the two are linked through a conjugated system (Gürses, Açıkyıldız, Güneş &
Gürses, 2016). For example, it can be considered that an organic dye molecule contains
three main components such as chromogen, chromophore and auxochrome (Gürses,
Açıkyıldız, Güneş & Gürses, 2016). When any one of these features is lacking from the
molecular structure the color is lost. In addition, resonance also exists across molecules
with delocalization of electrical charge among the conjugated atoms and this in turn
affects the color. Consequently, there is always more than one way to predict the
structure of a dye. In general, the longer the conjugated system of the colored component,
the higher are the values of λmax and εmax (Gürses, Açıkyıldız, Güneş & Gürses, 2016).
Thus, a compound with sufficient conjugation absorbs in the visible region (400–800 nm)
and becomes colored (Gürses, Açıkyıldız, Güneş & Gürses, 2016).

85
Different solvents at different pH seemed to affect the samples in different ways
and this is explained by the theory of UV-VIS spectrophotometry. Bathochromic shift is a
change of spectral band position in the absorption, reflectance, transmittance, or emission
spectrum of a molecule to a longer wavelength (lower frequency). Because the red color
in the visible spectrum has a longer wavelength than most other colors, the effect is also
commonly called a red shift (Kamlet & Taft, 1976, Buncel & Rajagopal, 1990). The
combination of chromophore and auxochrome behaves as a new chromophore having
different values of λmax and εmax. For example, OH group is an auxochrome which
extends the conjugation involving the lone pair of electrons on the oxygen atom resulting
in the increased values of λmax and as εmax (Gürses, Açıkyıldız, Güneş & Gürses,
2016). When two or more chromophoric groups are conjugated, the absorption maximum
is shifted to a longer wavelength (lower energy) and usually to a greater intensity
compared to the simple unconjugated chromophore (Gürses, Açıkyıldız, Güneş &
Gürses, 2016). Hypsochromic shift is a change of spectral band position in the
absorption, reflectance, transmittance, or emission spectrum of a molecule to a shorter
wavelength (higher frequency). Because the blue color in the visible spectrum has a
shorter wavelength than most other colors, this effect is also commonly called a blue shift
(Kamlet & Taft, 1976, Buncel & Rajagopal, 1990). Both these processes can occur
because of a change in environmental conditions: for example, a change in solvent
polarity will result in solvatochromism (Kamlet & Taft, 1976, Buncel & Rajagopal, 1990,
Marini, Munoz-Losa, Biancardi & Mennucci, 2010, Reichardt & Welton, 2011).
The figure illustrates the spectra for ProColor Invisible Green in the eight
different solvents. The spectra for some solvents seem to be more similar to each other

86
compared to others, where a solvent like 10% Sodium Hydroxide (pH=14) caused a very
big shift of the main peaks. There was no real correlation between the pH and the kind of
spectra that can be expected since water, acetone and ethanol that had similar pH gave
three different spectra with absorbance maximums and other additional peaks at different
wavelengths. This could relate back to the minor shifts in spectra caused by the
interaction of the functional groups of the solvent with the solute.
Spectrum 6.0: Compares the eight different extractions for the ProColor Invisible Green
sample.
Comparison of different extraction solvent for a visible sample
A similar comparison was done for visible samples, as was performed for the
different extractions of the invisible samples. Spectrum 7.0 illustrates the different
spectra generated for Tattoo Green, using the eight different types of solvents. Here we
can see that except for 10% Sulfuric Acid and 10% Sodium Hydroxide, all other solvents
provide spectra that are very similar in shape and peak absorbance maximum
wavelengths. Once again, solvent effects play a major role in determining the spectra
since different solvents will interact with the pigment or dye molecules in distinct ways.
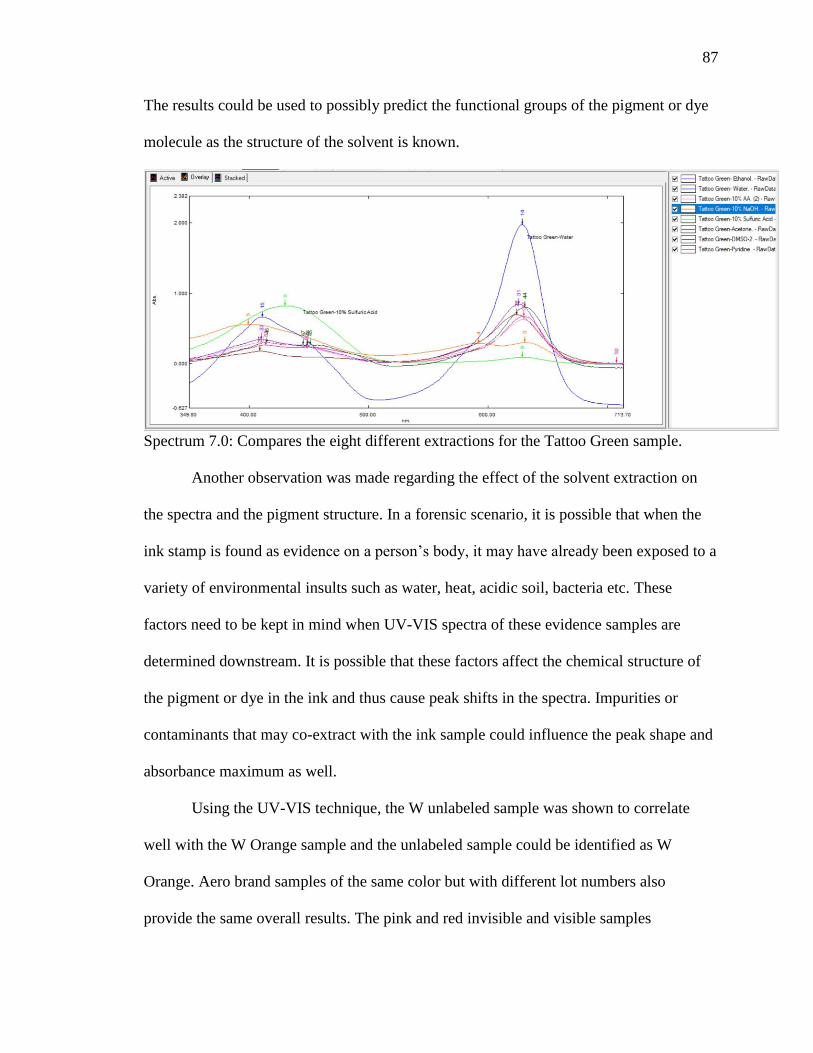
87
The results could be used to possibly predict the functional groups of the pigment or dye
molecule as the structure of the solvent is known.
Spectrum 7.0: Compares the eight different extractions for the Tattoo Green sample.
Another observation was made regarding the effect of the solvent extraction on
the spectra and the pigment structure. In a forensic scenario, it is possible that when the
ink stamp is found as evidence on a person’s body, it may have already been exposed to a
variety of environmental insults such as water, heat, acidic soil, bacteria etc. These
factors need to be kept in mind when UV-VIS spectra of these evidence samples are
determined downstream. It is possible that these factors affect the chemical structure of
the pigment or dye in the ink and thus cause peak shifts in the spectra. Impurities or
contaminants that may co-extract with the ink sample could influence the peak shape and
absorbance maximum as well.
Using the UV-VIS technique, the W unlabeled sample was shown to correlate
well with the W Orange sample and the unlabeled sample could be identified as W
Orange. Aero brand samples of the same color but with different lot numbers also
provide the same overall results. The pink and red invisible and visible samples
88
(compared within its own group) gave the same spectra for all eight solvents, except for a
difference in the absorbance value, red being at a higher absorbance value than pink for a
similar concentration of the extract being determined. The technique also provided
reference spectra for the different colors for invisible as well as visible samples in eight
different types of solvents. This could be useful to compare unknown evidence samples
that could hypothetically be found in a forensic scenario.
The dried invisible and visible samples that were re-run in pyridine to check for
interference from vehicle components showed that the spectra for the neat (not dried)
samples were the same as the spectra for the dried samples for all tested samples in
pyridine. This could convey that the spectra that was obtained from the neat samples was
generated by the colorant component or the additives but not by the solvent component of
the ink sample. Therefore, it can be hypothesized that there was no interference from the
ink’s solvent components in their UV-VIS spectra.
Overall the UV-VIS technique using the eight different solvents proved to be
highly discriminatory for the skin-safe stamp pad ink samples that were assessed. There
was additional cost and time efficiency as well as fewer room for errors since sample
preparation was very simple. This indicates that results could be reproducible. These
results can also be used with a software, like the KnowItAll® Informatics System 2018
software by Bio-Rad Laboratories, Inc. to look for correlations with pigments or dyes
spectra listed in their libraries.
FTIR-ATR Spectroscopy
The sample drying results on the spot plate were documented first. The Aero
brand samples were separated into three layers. The top layer was darker than the other
89
two layers (except for white where the top layer was clear to pale yellow). The middle
layer dried to exhibit the representative color of the sample, a uniform mix of the top and
bottom layer. The bottom layer was a paler-whitish version of the color. The red and
orange Aero brand samples showed no differences in color intensity among the three
layers. The W green sample dried to exhibit an olive green-yellow dried spot, the W pink
sample showed a light pink spot, the W red sample showed a deep red-purple colored
spot, the W orange and unlabeled samples showed red, yellow and orange colored spots
with a characteristic branching drying pattern and the W blue sample dried to exhibit a
pale white-yellow waxy solid. The Aero Invisible Blue sample dried to produce a white
powdery, flaky residue. The Tattoo brand samples did not air or heat dry and remained as
a gummy, oily residue on the spot plate. The ProColor Invisible Green sample also did
not air or heat dry and remained as an oily residue on the spot plate. The FTIR-ATR
spectrum was determined for all the sample (for all layers where applicable). A number
of comparisons were possible and the results have been explained below.
Comparison of the top, middle and bottom layer to each other for the samples that
exhibited layer separation
For this comparison criteria all the Aero visible samples that could be separated
into three distinct layers were compared. Spectrum 8.0 illustrates the stacked comparison
of the three different layers of the 2oz Aero Blue sample (M-Middle, B-Bottom, T-Top).
The overall spectra looked the same for all three layers. The wavenumbers for all
significant bands are consistent throughout the spectrum. This was observed for the
orange, red and green samples as well. For the Aero white sample, only the top layer
provided a good quality spectrum whereas the middle and bottom layer provided
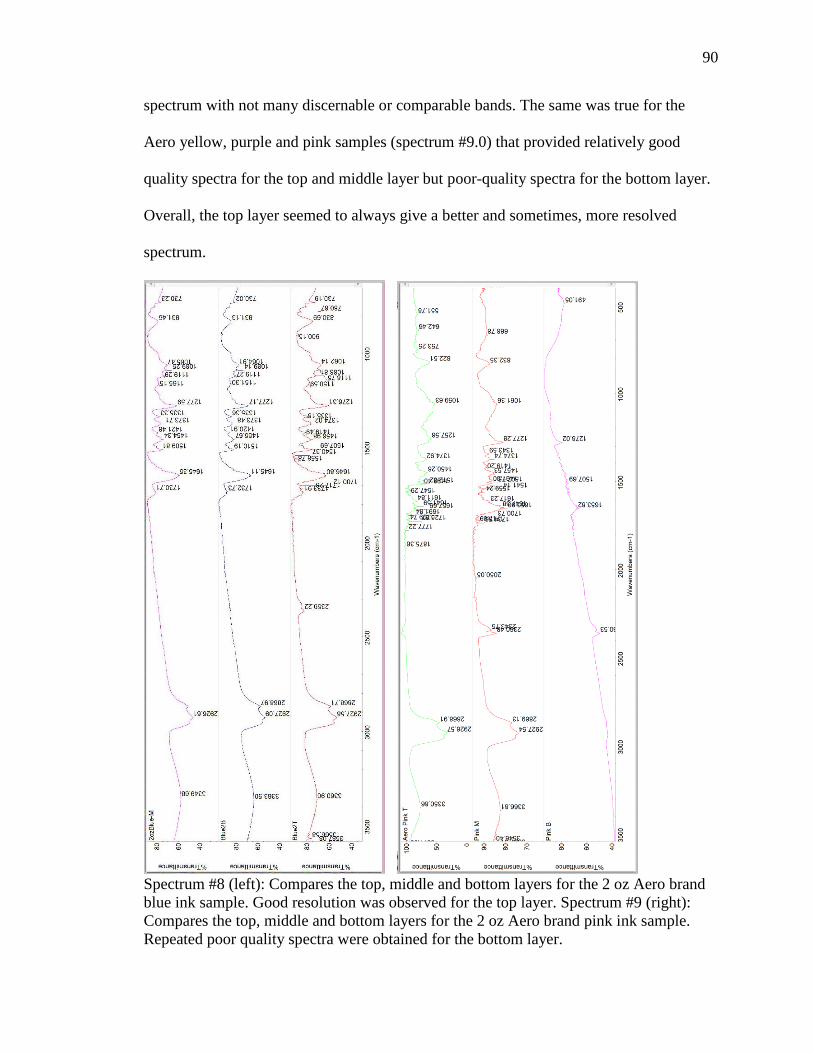
90
spectrum with not many discernable or comparable bands. The same was true for the
Aero yellow, purple and pink samples (spectrum #9.0) that provided relatively good
quality spectra for the top and middle layer but poor-quality spectra for the bottom layer.
Overall, the top layer seemed to always give a better and sometimes, more resolved
spectrum.
Spectrum #8 (left): Compares the top, middle and bottom layers for the 2 oz Aero brand
blue ink sample. Good resolution was observed for the top layer. Spectrum #9 (right):
Compares the top, middle and bottom layers for the 2 oz Aero brand pink ink sample.
Repeated poor quality spectra were obtained for the bottom layer.
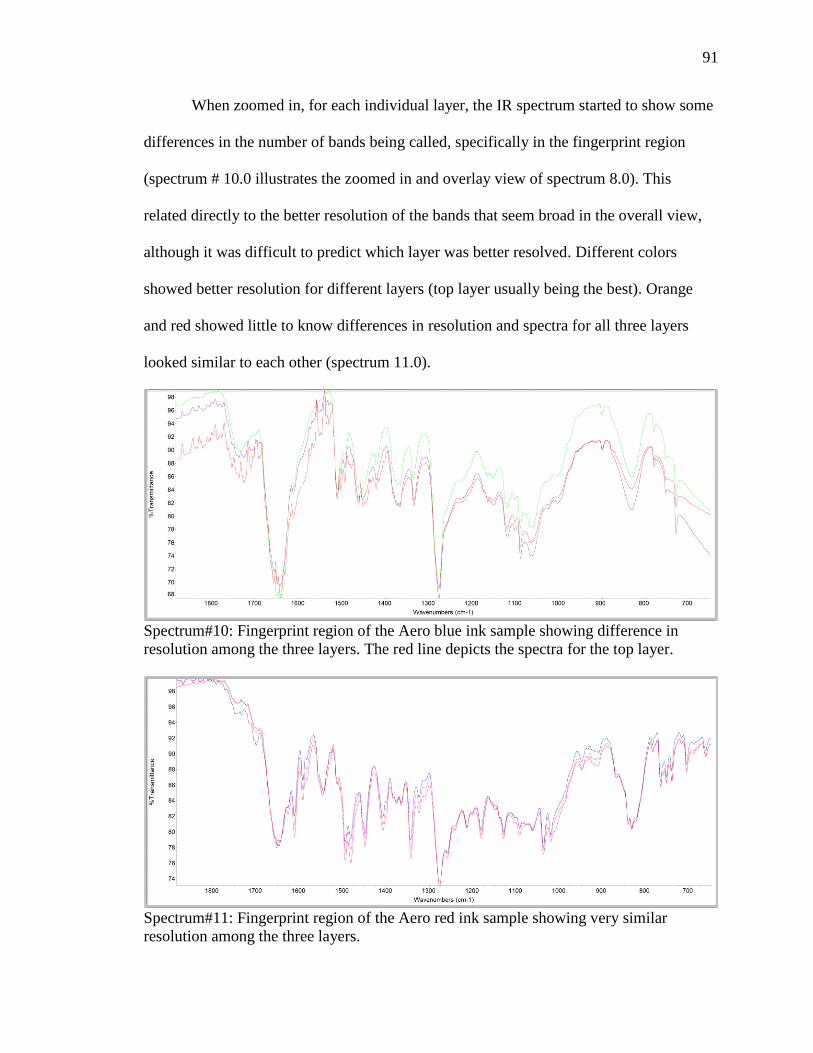
91
When zoomed in, for each individual layer, the IR spectrum started to show some
differences in the number of bands being called, specifically in the fingerprint region
(spectrum # 10.0 illustrates the zoomed in and overlay view of spectrum 8.0). This
related directly to the better resolution of the bands that seem broad in the overall view,
although it was difficult to predict which layer was better resolved. Different colors
showed better resolution for different layers (top layer usually being the best). Orange
and red showed little to know differences in resolution and spectra for all three layers
looked similar to each other (spectrum 11.0).
Spectrum#10: Fingerprint region of the Aero blue ink sample showing difference in
resolution among the three layers. The red line depicts the spectra for the top layer.
Spectrum#11: Fingerprint region of the Aero red ink sample showing very similar
resolution among the three layers.

92
Comparison of same color invisible sample of different brands
For this criterion the, Aero Invisible Blue was compared to W band ProColor
Invisible Green was compared to W green. A quick view of the overall spectral overlay
for the two sets of comparisons indicated that same colored samples of different brands
are distinguishable using FTIR-ATR analysis. The spectra of all the samples provided
discernable peaks that could be assigned functional groups, perhaps a key first step
towards pigment or dye chemical structure identification. Spectrum 12.0 illustrates the
overlay spectra for the two invisible blue samples and spectrum 13.0 illustrates the
stacked spectra for the same samples. Spectrum 14.0 illustrates the overlay spectra for the
two green samples and spectrum 15.0 illustrates the stacked spectra for the same.
Spectrum#12: Overlay spectra for W blue (red colored bands) and Aero Invisible Blue
(green colored bands) samples.
Spectrum#13: Stacked spectra for W blue and Aero Invisible Blue samples.

93
Spectrum #14: Overlay spectra for ProColor Invisible Green (pink colored bands) and W
green samples (red colored bands).
Spectrum #15: Stacked spectra for ProColor Invisible Green and W green samples.
Comparison of same color visible sample of different brands
For this criterion, the Aero brand blue, red and green (2 or 4 oz) top layer spectra
were compared to their respective colors of the Tattoo brand samples. Spectra 16.0 and
17.0 illustrate the stacked and overlay spectra for the red samples, respectively. Once
again, same colored samples of different brands were easily distinguishable. Functional
groups could also be assigned to the peaks in the spectra that could contribute to the
overall prediction of the chemical structure of the pigment or dye component of the ink
sample. This was observed for blue and green ink samples as well.

94
Spectrum #16: Stacked spectra for Tattoo Red and Aero 4 oz Red samples.
Spectrum #17: Overlay spectra for Tattoo Red and Aero 4 oz Red samples.
Comparison of invisible to visible sample of same color
The following colors were compared for this criterion: blue, green, red, orange
and pink. Spectrum #18 illustrates the stacked spectra comparison for green invisible and
visible samples. As we had already seen with the previously mentioned criteria, same
colored samples within a group (invisible or visible) were deemed as being
distinguishable from each other. The current criterion adds on to that information and
hints at a possibility of being able to tell invisible samples from visible samples. While it
is obvious that same colored samples from the two different groups can be told apart just
by visual observation, microscopy or alternate light source, this may not always be
Red 4T
Tattoo Red
Red 4T
Tattoo Red
Red 4T
Tattoo Red

95
possible due to the state in which the evidence is found in a real forensic case scenario.
The ink samples investigated in this research will be often discovered on skin, on some
part of the body (mainly the back of the hands or the wrists). These areas and the ink
evidence on them are in direct contact with the environment and therefore it is possible
that the degradation of the ink sample begins almost immediately, post-stamping. This
means that within a couple of hours, all the helpful and easy to observe macroscopic
characteristics of the ink evidence will start to deteriorate. It is under these circumstances,
that FTIR-ATR and UV-VIS will come through as helpful alternatives to macroscopy or
microscopy.
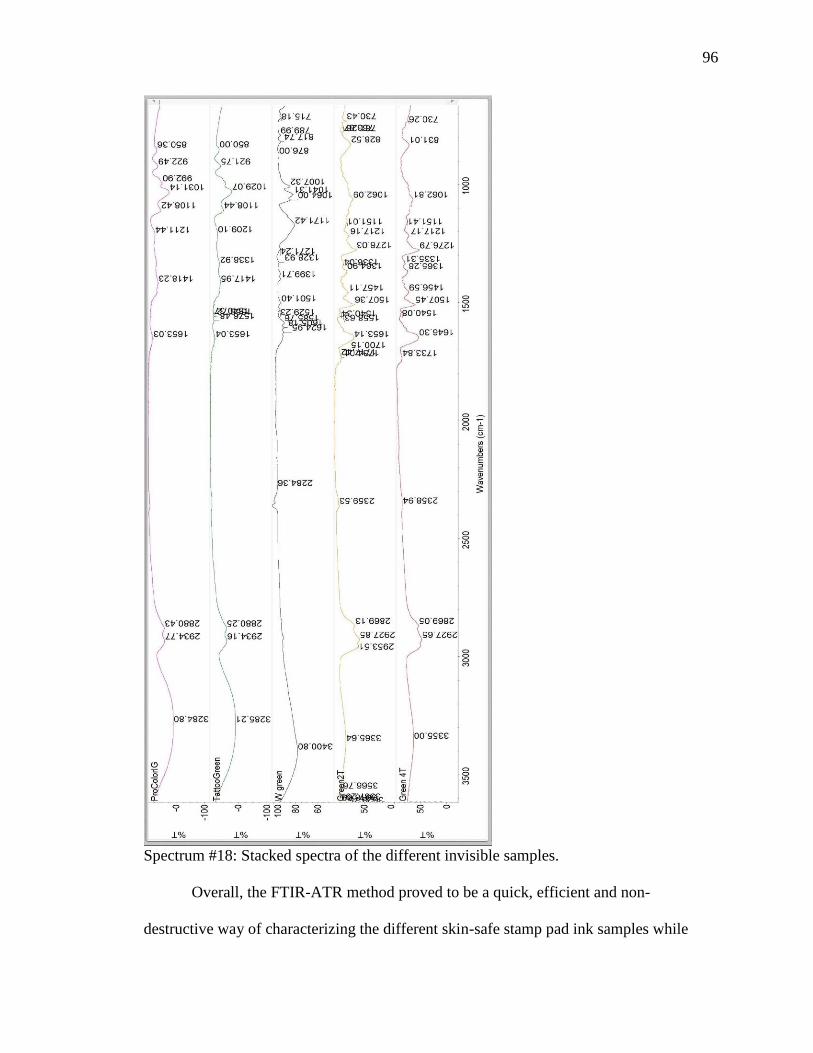
96
Spectrum #18: Stacked spectra of the different invisible samples.
Overall, the FTIR-ATR method proved to be a quick, efficient and non-
destructive way of characterizing the different skin-safe stamp pad ink samples while

97
providing helpful information that would go towards chemical structure identification of
the dye or the pigment. All the different ink samples were able to be distinguished based
on their spectra, whether or not there was an obvious visual distinction between them.
The spectra obtained via this method were of good quality and resolution, therefore
predictions about the pigment or dye structure could be possible. For some or all of the
ink brands (especially Aero brand visible samples, since the MSDS mentions the
presence of binders and polymers), we may be obtaining some interfering bands
contributed by components of the vehicles as opposed to the colorant alone. Spectrum
#19.0 below provides an example of how functional groups can be assigned to the spectra
on the basis of the group frequencies tables, mentioned before. In this example we are
assigning groups to the called bands for the Tattoo Red sample. The MSDS can be used
in conjunction to see if we are finding groups related to the vehicle components of the ink
sample. For Tattoo brand samples and ProColor Ink it is especially important to keep the
MSDS in mind as these were the samples that did not dry and therefore were sampled
directly onto the diamond as a neat sample. Therefore, it is possible that we have
contribution from these components as well. For Tattoo Red, it would be from glycerin or
propylene glycol. Both molecules contain –OH groups. The broad, strong band at 3288
cm-1 may be contributed by these –OH groups. The two medium bands at 2933 cm-1 and
2879 cm-1 are probably contributed by alkane (C-H) groups. The medium 1031 cm-1 can
be attributed to C-N group. The 1652 cm-1 and 1540 cm-1 bands can be attributed to the
C=C group belonging to an alkene or aromatic compound. Finally, the two peaks at 1441
cm-1 and 1341 cm-1 can be attributed to either C=C aromatic group or C-N groups.

98
In the manner described above, all individual spectra for the samples can be
annotated at first glance, with possible functional groups and used as an aid in the overall
goal of finding the chemical structure of the pigment or dye component that gives them
their color. The software used in this research, was an additional way of checking the
assignment of the functional groups as well as a method of finding possible components
that correlate to the spectra obtained from the ink samples investigated here. The results
are discussed and summarized in the next section. Additonally, the spectra that were
obtained from NIST for the vehicle components were used to check if they were
contributing to the spectra. This was explored using the software and the results are
discussed in the next section.
Spectrum #19: Tattoo Red spectrum used for functional group determination.
As seen for the UV-VIS method, the W orange results correlated well with the W
unlabeled results and therefore W unlabeled was shown to be the same as W orange.
Aero brand samples that were the same color but with different lot numbers gave the
same results. The analysis also provided potential reference IR spectra that can be used to
compare to evidence skin-safe stamp pad ink samples that may be obtained in a real
forensic scenario. A few samples were also picked to be run in duplicates and on different

99
IR instruments or on different days. The same samples always gave the same results,
even if they were analyzed on different days or on different instruments. All the results
obtained indicated that the method was not just simple, but also error-free and repeatable.
Comparison of sample IR spectra to reference spectra using a software
Each of the sample spectra were uploaded individually and the ID Expert tool was
used to conduct the searches. The only form of processing done for a spectrum (if
applicable) was either a baseline correction or a correction to exclude contaminants such
as carbon dioxide or water vapor from the search. The corrections were manually
checked to make sure that no major modifications were performed on the spectra. The
results have been summarized in table 5.0. For the component/ peak results, only those
results were reported for which the spectra correlated well with the sample spectra. The
score was used as a reference to understand the strength of the correlation, but all of the
results in the hit list were reviewed for correlation and a result was manually picked,
irrespective of its score in the hit list.
Sample name Component/ peak
result from
IDExpert search
(use)
Score Structure Possible functional
groups or compounds
contributing to the
spectra
Aero Invisible
Blue
Tinopal BOP
(fluorescent
whitening agent by
BASF)
92.31 Proprietary Alcohol
Sulfur
Polyethylene
Alkane
Alkene
ProColor
Invisible Green
Glycerol (solvent) 99.63
Alcohol
Alkane
Oxime
Phosphorus
Silicon

100
Peroxide
Sulfur
Ether
W blue Tinopal UP
(fluorescent
whitening agent by
BASF)
92.0 Proprietary Hydrazine
Carbo-acid
Urea
Amide
Alcohol
Alkene
Ketone
Nitrile
W green 1-Naphthol-3,6-
disulfonic acid
disodium salt
97.33
Cellulose
Sulfur
Alcohols
Alkane
Aromatic
W pink Polyvinylpyrrolidon
e (binder/stabilizer)
80.0
Polyethylene
Polyamide
Cellulose Nitrate
Nitro
Urea
Alkane
W red Rhodamine B
Isothiocyanate
(Red-Purple
fluorone dye)
58.33
Alkane
Amide
Amine
Sulfur
Phosphate
Urea
Polyethylene
Hydrazine
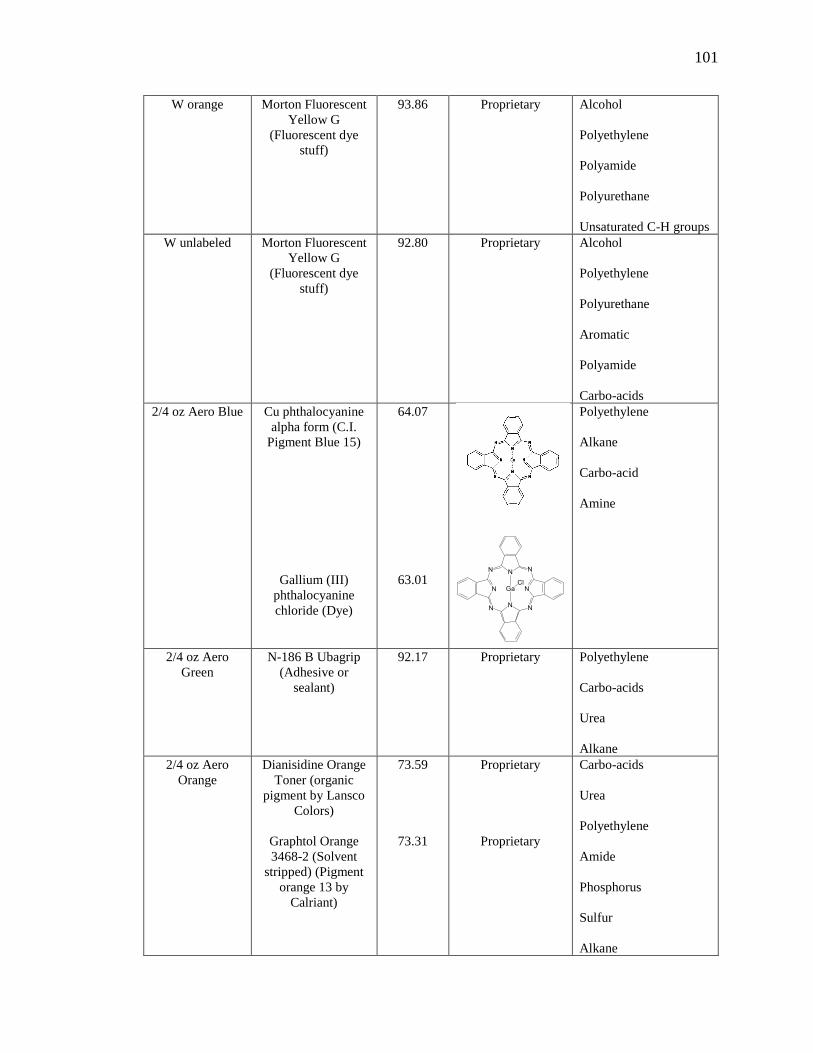
101
W orange Morton Fluorescent
Yellow G
(Fluorescent dye
stuff)
93.86 Proprietary Alcohol
Polyethylene
Polyamide
Polyurethane
Unsaturated C-H groups
W unlabeled Morton Fluorescent
Yellow G
(Fluorescent dye
stuff)
92.80 Proprietary Alcohol
Polyethylene
Polyurethane
Aromatic
Polyamide
Carbo-acids
2/4 oz Aero Blue Cu phthalocyanine
alpha form (C.I.
Pigment Blue 15)
Gallium (III)
phthalocyanine
chloride (Dye)
64.07
63.01
Polyethylene
Alkane
Carbo-acid
Amine
2/4 oz Aero
Green
N-186 B Ubagrip
(Adhesive or
sealant)
92.17 Proprietary Polyethylene
Carbo-acids
Urea
Alkane
2/4 oz Aero
Orange
Dianisidine Orange
Toner (organic
pigment by Lansco
Colors)
Graphtol Orange
3468-2 (Solvent
stripped) (Pigment
orange 13 by
Calriant)
73.59
73.31
Proprietary
Proprietary
Carbo-acids
Urea
Polyethylene
Amide
Phosphorus
Sulfur
Alkane

102
3,3’-
dimethoxybenzidine
->acetoacetic anilide
(plastics additive)
71.49
Amine
2/4 oz Aero
Yellow
2-Cyclohexen-1-
one, 5-[4,5-dihydro-
5-methyl-3-(2-
methylpropyl)-5-
isoxazolyl]-3-
hydroxy-2-[1-[(2-
propenyloxy) imino]
propyl]- (Industrial
chemical)
Sunfast Yellow
AADMCA 275-
0005 (pigment)
61.17
60.03
Proprietary
Alkane
Polyethylene
Urea
Alcohol
Amine
Phosphorus
2/4 oz Aero Red Watchung Red B
RT-428-D
(Monoazo pigment)
Lithol fast Scarlet L
4300 (Pigment)
Duplex Bonadur
Red 20-6470
(Monoazo Pigment)
DCC 2780 Barium
Red 2 B (Monoazo
organic pigment)
60.14
59.12
59.04
58.79
Proprietary
Proprietary
Proprietary
Proprietary
Alcohol
Alkane
Nitrate
Amine
Carbo-acids
Sulfur
Phosphorus
2 oz Aero Purple N-186 B Ubagrip
(Adhesive or
sealant)
Zonarez Type B-55
Polyterpene Resin
(resin by Arizona
Chemical Company)
91.12
91.10
Proprietary
Proprietary
Polyethylene
Urea
Alkane
Alcohol
Amine
Carbo-acids
2 oz Aero Pink POE (1) C18-C24
Tert-amine
(surfactant)
Zonarez Type 7125
Polyterpene Resin
(resin by Arizona
Chemical Company)
64.91
63.34
Proprietary
Proprietary
Alkane
Unsaturated C-H groups
Amine
Alcohol
2 oz Aero White Alresen 191 R
(Terpene phenolic
resin)
62.22
Proprietary
Unsaturated C-H groups
Alkanes
Amine

103
Alcohol
Tattoo Red Glycerol (solvent)
Pure yellowish
erythrosine (food
color)
Rose, new (brilliant
rose shade bluish)
(food color)
66.02
58.09
57.41
Proprietary
Proprietary
Polyethylene
Alcohol
Polyurethane
Alkane
Oxime
Tattoo Green Glycerol (solvent)
Moon Glycerin USP
(solvent by Proctor
and Gamble
Distributing
company)
81.58
71.64
Proprietary
Alcohol
Alkane
Tattoo Blue Glycerol (solvent)
Moon Glycerin USP
(solvent by Proctor
and Gamble
Distributing
company)
Elacid Indocyanine
G (cyanine dye)
73.99
57.42
57.35
Proprietary
Proprietary
Alcohol
Cellulose
Alkane
Oxime
Phosphorus
Silicon
Table 5.0: Summarizes the search results for the samples using the IDExpert tool in the
software. Images were retrieved from the software and Pubchem website.
Just based on the preliminary search results from the software, it was seen that
better visual correlations were obtained for invisible samples compared to visible
samples. W orange and unlabeled were the only two samples that gave a good visual
correlation as well as a good score for their result (spectrum 20.0). ProColor Invisible
green indicated the presence of glycerol but did not provide any information about the
colorant component. For the Aero brand (top layer spectra was used for visible sample
comparison purposes) and Tattoo brand visible samples, the reported reference was

104
obtained as peak results, since the peak results visually made more sense than the total
component results for these samples. While multiple results have been reported for some
samples, it is possible that the ink sample may or may not contain all of the reported
results. It may also be possible that the samples contain components that are absent from
the database or that did not make it to the hit list due to a low score (could be a result of
the poor spectral quality of the reference spectra or due to contamination of the reference
spectra). It is also possible the other layers of the Aero brand samples may provide more
information on the nature of the white bottom layer. Due to these reasons, the results
reported here, obtained from the Bio-Rad software must be tested further to confirm the
identity of the ink samples. This could be performed by obtaining the actual reference
samples and determining their UV-VIS spectra using the set of eight solvents used in this
paper and correlating those results with the UV-VIS results obtained for the samples.
Alternatively, the use of additional techniques mentioned in the conclusion section, may
help further elucidate the chemical structure of the ink sample components. Another
source, “High resolution spectra of inorganic pigment and extenders in the mid-infrared
region from 1500 cm-1 to 200 cm-1.” by Afremow & Vandeberg, 1966, was also
considered to find potential correlations for the colorant or the vehicle spectra. Strong
positive correlations could not be absolutely determined due to the inability to overlay
and compare sample and reference spectra, although some similarities were found
between some of the references and the samples.
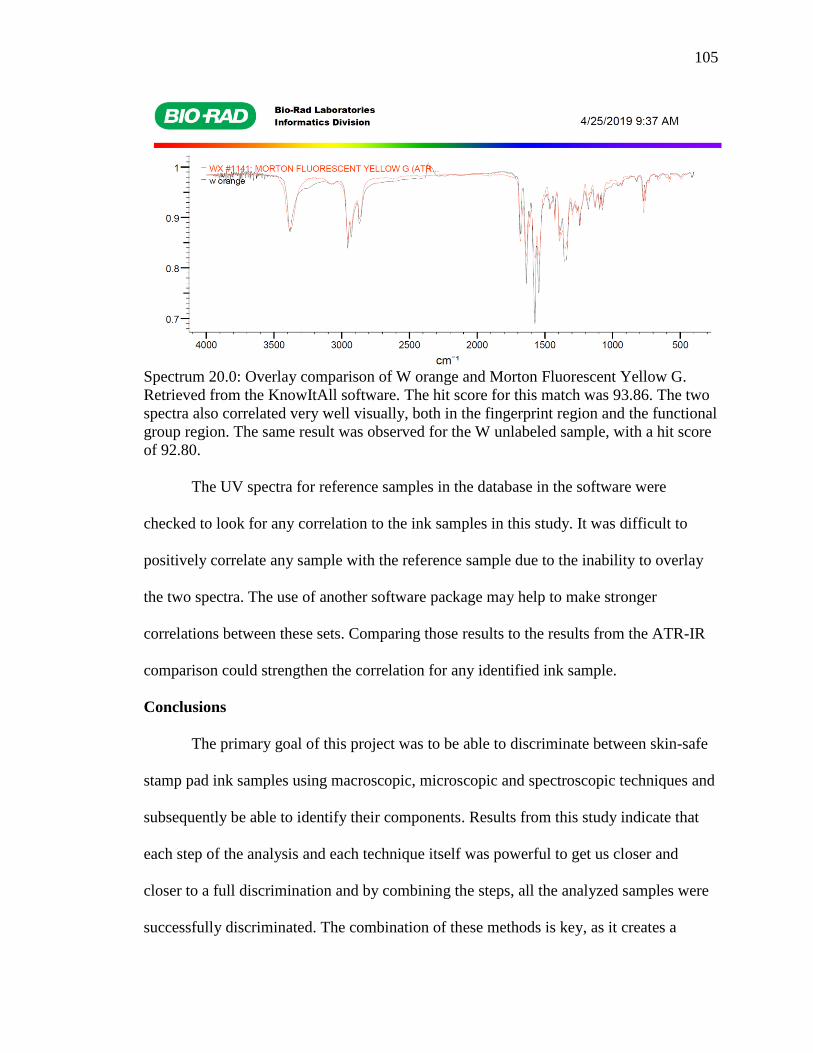
105
Spectrum 20.0: Overlay comparison of W orange and Morton Fluorescent Yellow G.
Retrieved from the KnowItAll software. The hit score for this match was 93.86. The two
spectra also correlated very well visually, both in the fingerprint region and the functional
group region. The same result was observed for the W unlabeled sample, with a hit score
of 92.80.
The UV spectra for reference samples in the database in the software were
checked to look for any correlation to the ink samples in this study. It was difficult to
positively correlate any sample with the reference sample due to the inability to overlay
the two spectra. The use of another software package may help to make stronger
correlations between these sets. Comparing those results to the results from the ATR-IR
comparison could strengthen the correlation for any identified ink sample.
Conclusions
The primary goal of this project was to be able to discriminate between skin-safe
stamp pad ink samples using macroscopic, microscopic and spectroscopic techniques and
subsequently be able to identify their components. Results from this study indicate that
each step of the analysis and each technique itself was powerful to get us closer and
closer to a full discrimination and by combining the steps, all the analyzed samples were
successfully discriminated. The combination of these methods is key, as it creates a
106
unique array of results that a forensic analyst may use to confirm his findings. Including a
molecular analytical technique and an atomic analytical technique ensured that all facets
of the pigment or dye as well as any possible vehicle component are being thoroughly
investigated. The results from this research can be used as reference spectra for potential
skin-safe stamp pad ink forensic evidence. Furthermore, the use of the Bio-Rad software
to make positive correlations with the reference samples listed in the software’s extensive
database acted as a key first step towards possibly determining the identity of the
components in the ink samples. Further analysis would have to be conducted to
investigate and strengthen the veracity of the correlations.
The research of skin-safe stamp pad inks can be furthered in a number of different
ways. Studies involving skin-ink interaction under various conditions would provide a lot
of information regarding how various factors such as temperature, light, personal hygiene
and other environmental factors affect the quality and quantity of ink deposited on the
skin over a period of hours to a couple of days and that in turn would help downstream in
deciding the type of extraction process and instrumental technique that would be best
suited to obtain good quality results. Interaction of these inks with skin can also educate
the analyst on the possible presence of unreported (left out from the MSDS) dyes,
pigments or chemicals that may cause adverse reactions on the skin. Since ultimately, the
actual forensic evidence itself would be found on skin, analysis of these inks starts from
the morgue where an autopsy would be collected. This research could educate coroners or
medical examiners on techniques that they could use to observe and document visible or
possibly invisible hand stamp skin safe ink samples and also equip them with information
on extraction techniques that ensures that good quality and sufficient amount of ink

107
evidence is collected from the body, so it can be analyzed using any combination of
techniques mentioned in this paper.
Another important avenue to investigate would be the design of the stamp itself
and how different ink samples reproduce the design of the stamp on skin. A key first step
would be to try and identify the design as that may provide investigators with quick
information related to the event or place at which the person received the stamp
impression. The reproduction of the exact design of the stamp onto a surface depends on
various factors such as ink consistency, stamp type and stamp application pressure
(Kelly, 2002), all of which can potentially become different streams of research to
pursue. This would also ideally be the first step of analysis as it involves no destruction
of evidence and can be simply achieved by the use of alternate light source or infrared
photography.
The techniques mentioned in this research targeted a quality-based approach for
possible identification. For samples that are very similar in color and of the same brand, a
quantity-based approach can be used, wherein the amount of each type of pigment or dye
contained in each sample can be quantified. This could potentially also provide
individualizing features for the ink samples.
Adding the capabilities of X-Ray Fluorescence (XRF) as well as gas or liquid
chromatography-mass spectrometry to the current tested instrumental techniques could
amplify the discrimination potential by numerous folds. XRF is a non-destructive
analytical technique used to determine the elemental composition of materials. XRF
analyzers determine the chemistry of a sample by measuring the fluorescent (or
secondary) X-ray emitted from a sample when it is excited by a primary X-ray source.

108
Each of the elements present in a sample produces a set of characteristic fluorescent X-
rays ("a fingerprint") that is unique for that specific element, which is why XRF
spectroscopy is an excellent technology for qualitative and quantitative analysis of
material composition (XRF Technology, ThermoFisher Scientific website). Most
research done on XRF related to the analysis of ink samples involves pen ink and
additionally, uses Raman spectrophotometry as a complementary first step of analysis.
Raman spectrophotometry has historically and theoretically proven to be a good
complementary technique to FTIR-ATR. Miranda (2015) was able to use this technique
to identify IR spectra complementary to those obtained via FTIR-ATR for permanent
tattoo samples. Zieba-Palus & Kunicki (2005) compared the discriminating powers of
Raman Spectroscopy, to micro-FTIR spectroscopy and X-Ray Fluorescence (XRF)
techniques. The authors explained that while routine spectroscopic measurements provide
transmission, reflection and fluorescence data in the 220-900nm region of the
electromagnetic spectra, they do not provide information on all of the components of the
ink and therefore limit the capabilities of individualization based on determining the total
chemical composition of the ink. Paper chromatography, thin layer chromatography,
spectrometric methods and capillary electrophoresis are quick and reproducible methods
to determine all the different dyes or pigments in the ink, but they may involve the
additional sampling step that could result in a minor destruction of a part of the evidence
that could be problematic downstream in the forensic analysis based on the nature of the
evidence. Compared to those techniques, Raman spectroscopy is quick, easy and non-
destructive. In the analysis of 69 samples of blue and black ink originating from ballpoint
and gel pens of various and brands and manufacturers, the authors, Zieba-Palus &
109
Kunicki, found that IR analysis could identify most but not all components of the
different samples. For Raman spectroscopy analysis, only a part of the samples could be
analyzed since the remaining had strong luminesce that made it impossible to obtain a
spectrum suitable for analysis. XRF analysis revealed the presence of a number of
different elements that differed quantitatively rather than qualitatively, between samples.
Since IR spectroscopy and Raman spectroscopy work on a complementary theory, the
combination of the two techniques increases the power of analysis by several folds. By
calculating the discriminating power, it was found that about 90% of the investigated
samples of same type and color could be distinguished using IR and Raman Spectroscopy
alone. The power increases when elemental composition information is added.
Lee, Lee, Lee & Lee (2008) studied five red sealing inks from Korean markets
(manufacturers included those from Korea, Japan, and China), and using time-of-flight
secondary ion mass spectrometry (TOF-SIMS), atomic absorption spectroscopy (AAS),
and inductively coupled plasma mass spectrometry (ICP-MS), determined elemental
composition and evaluated the use of instrumental methods to differentiate ink samples.
On the basis of inorganic elemental analysis and organic analysis, the authors concluded
that with its extended mass range and high sensitivity, TOF-SIMS can be a useful tool for
the nondestructive analysis of red sealing inks on paper (Lee, Lee, Lee & Lee 2008).
Characteristic ions from all the tested samples are summarized in figure 59.0. Inorganic
elements of zinc, lead, and calcium were confirmed with the analyses of AAS and ICP-
AES. The quantitative results showed that some specific peaks in the TOF-SIMS spectra
for each sample (relative to the blank control) could be used as representative elements
for the sample.

110
Figure 59.0: Table 1 from “TOF-SIMS study of red sealing-inks on paper and its forensic
applications” (Lee, Lee, Lee & Lee 2008). The figure illustrates the positive and negative
fingerprint ions that were identified for the different samples using TOF-SIMS. Some of
these ions were then confirmed using AAS and ICP-AES.
Kher, Green and Mullholland, 2006 analyzed several varieties of blue ballpoint
pen ink using high performance liquid chromatography (HPLC) and infrared
spectroscopy (IR) and concluded that HPLC coupled with chemometrics provided a
better discrimination of the samples that they investigated. Adam, Sherratt &
Zholobenko, 2008, published a paper regarding the classification and individualization of
black ballpoint pen ink using principal component analysis (PCA) of UV-VIS absorption
spectra. The PCA of UV-VIS data showed good repeatability and with close attention
paid towards sample preparation and solvent extraction along with an extensive
investigation of the statistical variation, it could be possible to make the uncertainties in
the loadings of the PCA small enough that the inks are distinguishable. Similarly, Senior,
Hamed, Masoud & Shehata, (2012), characterized blue ballpoint pen inks using principal
component analysis (PCA) of UV-VIS Absorption Spectra, IR Spectroscopy and HPTLC.
The results indicated that the UV-VIS spectra for a sample is more effective at
discriminating it from other samples of the same color but from a different brand,
compared to its IR and HPTLC results. Chemometrics and particularly, multivariate
analysis has been used successfully in the past to aid in the forensic examination of inks.
PCA was one of the common methods used for the interpretation of visible
spectrophotometry data and in this case too it was instrumental in revealing that UV-VIS

111
is more effective at discriminating inks of the same color, compared to the other methods
discussed in the paper. This leads us to the final level of individualization, inclusion of
statistics for the techniques used. A statistical measure for the discrimination potential
can be provided in the form of principal component analysis, as seen in the research of
pen ink. Several other research of ink samples have also made use of deconvolution
programs in an attempt to pick apart the various peaks in UV-VIS analysis (Causin et. al.,
2008).
The forensic analysis of skin-safe stamp pad inks can provide investigators with
quick and simple investigatory clues for a relevant forensic case. Therefore, it is
important that a thoroughly tested method be developed in order to help analysts quickly
make a determination regarding the quality and origin of the evidence and subsequently
be able to testify their findings in a court while upholding the Frye and Daubert standards
and following the Federal Rules of Evidence. This research serves as a preliminary step
towards the establishment of such an analytical method. The results from this research
and the sequence of methods used here highlight their usefulness as quick and easy first
steps that an analyst or a medical examiner can take in order to collect and analyze these
kinds of samples. The multitude of spectra obtained for the samples from the four major
techniques used here can act as references for actual forensic evidence. As emphasized
before, due to the large amount of results obtained, the samples can easily be
distinguished from each using any combination of the methods that generated these
results. Therefore, the analyst has been provided with different avenues (tried and tested)
to explore, when presented with this kind of forensic evidence. The ease of use, minimal
training and economic features of these methods allow for their installment in any kind of
112
a crime laboratory, compared to more expensive methods such as X-Ray fluorescence
and GC/MS. Sample preparation methods also showed how the sample itself can be used
very economically and a single sample preparation could be used for multiple techniques.
This overall non-destructive feature just lends more favor in support of it being used for
skin-safe stamp pad ink analysis. The correlations obtained from the Bio-Rad software by
using the result obtained from ATR-FTIR, illustrates the power of a simple technique
such as ATR-FTIR when combined with a well-assembled database. Overall this research
has exposed several low effort techniques that can be used in the forensic analysis of
skin-safe stamp pad inks.
113
References
Adam, C. D., Sherratt, S. L., & Zholobenko, V. L. (2008). Classification and
individualisation of black ballpoint pen inks using principal component analysis
of UV–vis absorption spectra. Forensic Science International, 174(1), 16-25.
Afremow, L. C., & Vandeberg, J. T. (1966). High resolution spectra of inorganic pigment
and extenders in the mid-infrared region from 1500 cm-1 to 200 cm-1. Journal of
Paint Technology, 38(495), 169-202.
Aginsky, V. N. (1996). Dating and characterizing writing, stamp pad and jet printer inks
by gas chromatography/mass spectrometry. International Journal of Forensic
Document Examiners, 2(2), 103-116.
ASTM D4236 - 94(2016)e1: Standard Practice for Labeling Art Materials for Chronic
Health Hazards. (n.d.). Retrieved March 29, 2019, from http://www.astm.org/cgi-
bin/resolver.cgi?D4236
Auslander, J. D. (2005). U.S. Patent No. 6,905,538. Washington, DC: U.S. Patent and
Trademark Office.
Barnes, J. G. (2011). History. In The Fingerprint SourceBook (pp. 7-24). U.S.
Department of Justice, Office of Justice Programs, National Institute of Justice.
Bio-Rad. (2018a). KnowItAll® Informatics System 2018: KnowItAll® Analytical Edition.
Bio-Rad Laboratories, Inc., Informatics Division: Philadelphia, Pennsylvania.
Bio-Rad. (2018b). KnowItAll® Informatics System 2018: Installation Instructions
& Quick Start Guide. Bio-Rad Laboratories, Inc., Informatics Division:
Philadelphia, Pennsylvania.
114
Buncel, E., & Rajagopal, S. (1990). Solvatochromism and solvent polarity
scales. Accounts of Chemical Research, 23(7), 226-231.
Causin, V., Casamassima, R., Marega, C., Maida, P., Schiavone, S., Marigo, A., &
Villari, A. (2008). The discrimination potential of ultraviolet‐visible
spectrophotometry, thin layer chromatography, and Fourier transform infrared
spectroscopy for the forensic analysis of black and blue ballpoint inks. Journal of
Forensic Sciences, 53(6), 1468-1473.
Comerford, Adam (Photographer). (2007, March). Captain_Two-Hand-
Stamps_Shamrockfest [digital image]. Retrieved from:
http://www.flickr.com/photos/adamcomerford/419135686/
CrimeScope CS-16 Forensic Light Source - Product - SPEX Forensics. (n.d.). Retrieved
from https://spexforensics.com/products/item/crimescope-cs-16-500w
Davidson, M. W. (n.d.). Education in Microscopy and Digital Imaging. Retrieved April 8,
2019, from http://zeiss-campus.magnet.fsu.edu/articles/basics/kohler.html
Dirwono, W., Park, J. S., Agustin-Camacho, M. R., Kim, J., Park, H. M., Lee, Y., & Lee,
K. B. (2010). Application of micro-attenuated total reflectance FTIR spectroscopy
in the forensic study of questioned documents involving red seal inks. Forensic
Science International, 199(1-3), 6-8.
Erhan, S. Z., & Bagby, M. O. (1992). U.S. Patent No. 5,122,188. Washington, DC: U.S.
Patent and Trademark Office.
European Virtual Institute for Speciation Analysis. (n.d.). Shimadzu Europe - UV-
115
2550/UV-2450. Retrieved April 12, 2019, from
http://www.speciation.net/Database/Instruments/Shimadzu-
Europe/UV2550UV2450-;i1301
GIUMAN (Photographer). Nightclub Security Bouncer Entry Stamp In Discotheque
[screenshot of a video]. Retrieved from: https://www.pond5.com/stock-
footage/88325426/nightclub-security-bouncer-entry-stamp-discotheque.html
Groves, E., Palenik, C. S., & Palenik, S. (2016). A survey of extraction solvents in the
forensic analysis of textile dyes. Forensic Science International, 268, 139-144.
Gürses, A., Açıkyıldız, M., Güneş, K., & Gürses, M. S. (2016). Dyes and pigments: their
structure and properties. In Dyes and Pigments (pp. 13-29). Cham, Switzerland,
Springer.
Haines, W. H., & Huffman, A. V. (1958). Tattoos found in a prison environment. Journal
of Social Therapy, 4, 104-113
Hind, A. M. (1963). An introduction to a history of woodcut: with a detailed survey of
work done in the fifteenth century (Vol. 2). New York, Dover publications.
Jasuja, O. P., Singla, A. K., & Seema, B. L. (1989). Thin-layer chromatographic analysis
of Indian stamp pad inks. Forensic Science International, 42(3), 255-262.
Kamlet, M. J., & Taft, R. W. (1976). The solvatochromic comparison method. I. The.
beta.-scale of solvent hydrogen-bond acceptor (HBA) basicities. Journal of the
American Chemical Society, 98(2), 377-383.
Kelly, J. (2002). Forensic examination of rubber stamps: A practical guide. Springfield,

116
Ill.: C.C. Thomas.
Kher, A. A., Green, E. V., & Mulholland, M. I. (2001). Evaluation of principal
components analysis with high-performance liquid chromatography and
photodiode array detection for the forensic differentiation of ballpoint pen
inks. Journal of Forensic Science, 46(4), 878-883.
Król, M., Kula, A., & Kościelniak, P. (2013). Application of MECC-DAD and CZE-MS
to examination of color stamp inks for forensic purposes. Forensic Science
International, 233(1-3), 140-148.
Kubic, T., Petraco, Nicholas, & Miranda, Michelle D. (2012). Chemical - instrumental
analysis for forensic scientists: A laboratory manual.
LaPorte, G. M., & Stephens, J. C. (2011). Analysis techniques used for the forensic
examination of writing and printing inks. Forensic Chemistry Handbook, 225-
250.
Lee, J., Lee, C., Lee, K., & Lee, Y. (2008). TOF-SIMS study of red sealing-inks on paper
and its forensic applications. Applied Surface Science, 255(4), 1523-1526.
Libretexts. (2019, April 23). 1.10: Pi Conjugation. Retrieved April 27, 2019, from
https://chem.libretexts.org/Courses/Purdue/Purdue:_Chem_26505:_Organic_Che
mistry_I_(Lipton)/Chapter_1._Electronic_Structure_and_Chemical_Bonding/1.10
:_Pi_Conjugation
Lociciro, S., Dujourdy, L., Mazzella, W., Margot, P., & Lock, E. (2004). Dynamic of the
ageing of ballpoint pen inks: quantification of phenoxyethanol by GC-MS.
Science and Justice, 44(3), 165-171.
Lomax, S. Q., & Learner, T. (2006). A review of the classes, structures, and methods of

117
analysis of synthetic organic pigments. Journal of the American Institute for
Conservation, 45(2), 107-125.
Marini, A., Munoz-Losa, A., Biancardi, A., & Mennucci, B. (2010). What is
solvatochromism?. The Journal of Physical Chemistry B, 114(51), 17128-17135.
Marking Device Inks. (n.d.). Retrieved May 20, 2019, from
https://www.iimak.com/Products/IIMAK-Inks/Coding-and-Marking-
Inks/Marking-Device-Inks
Miranda, M. D. (2015). Forensic Analysis of Tattoos and Tattoo Inks. Boca Raton, Crc
Press.
Miranda, M. (2012). The Chemical Analysis of Modern Tattoo Inks (Doctoral
dissertation). Available from ProQuest Dissertations and Theses. ISBN:
9781267236241
Mitchell, C. A., & Hepworth, T. C. (1904). Inks: their composition and manufacture.
London, C. Griffin & company, limited.
Motic. (n.d.). SMZ-171-TLED (Trinocular LED Stereo Microscope). Retrieved March
29, 2019, from https://moticmicroscopes.com/products/smz-171-tled-bled-stereo-
microscope-1?variant=37518560272
Neumann, C., Ramotowski, R., & Genessay, T. (2011). Forensic examination of ink by
high-performance thin layer chromatography—The United States Secret Service
Digital Ink Library. Journal of Chromatography A, 1218(19), 2793-2811.
Ngan, M., & Grother, P. (2015, March). Tattoo recognition technology-challenge (Tatt-

118
C): an open tattoo database for developing tattoo recognition research. In IEEE
International Conference on Identity, Security and Behavior Analysis (ISBA
2015) (pp. 1-6). IEEE.
Nieman, T. A., Skoog, D. A., & Holler, F. J. (1998). Principles of instrumental
analysis. Pacific Grove, CA: Brooks/Cole ISBN 0-03-002078-6.
Nothnagle, P. E., Chambers, W., Parry-Hill, M. J., Fellers, T. J., & Davidson, M. W.
(2015, November 13). Fundamentals of Stereomicroscopy. Retrieved March 28,
2019, from https://micro.magnet.fsu.edu/primer/anatomy/stereohome.html
Olympus Corporation. (n.d.). Olympus Polarizing Microscope. Instruction Manual.
Model BHSP. Retrieved from http://www.alanwood.net/downloads/olympus-bh-
2-bhsp-manual.pdf
Osselton, M. D., & Watts, J. (2011). Clarke's analysis of drugs and poisons (Vol. 3). A.
C. Moffat, & B. Widdop (Eds.). London: Pharmaceutical press.
Pongpiachan, S. (2014). FTIR spectra of organic functional group compositions in PM2.
5 collected at Chiang-Mai City, Thailand during the haze episode in March
2012. J. Appl. Sci, 14(22), 2967-2977.
Physics of Fluorescence - the Jablonski Diagram. (n.d.). Retrieved April 12, 2019, from
https://www.nightsea.com/articles/jablonski-diagram-for-fluorescence/
Raza, A., & Saha, B. (2013). Application of Raman spectroscopy in forensic
investigation of questioned documents involving stamp inks. Science &
Justice, 53(3), 332-338.
Reichardt, C., & Welton, T. (2011). Solvents and solvent effects in organic chemistry.
Weinheim, Germany, John Wiley & Sons.

119
Robinson, P. C., & Davidson, M. W. (n.d.). Polarized Light Microscopy. Retrieved
March 29, 2019, from https://www.microscopyu.com/techniques/polarized-
light/polarized-light-microscopy
RubberStampChamp.com. (n.d.). Retrieved May 20, 2019, from
https://www.rubberstampchamp.com/products/uv-refill-ink-for-skin-1-2-oz
Ryckaert, V. (2018, September 22). Police identify a woman found dead along I-65.
Retrieved March 26, 2019, from
https://www.indystar.com/story/news/crime/2018/09/19/look-these-tattoos-help-
police-identify-woman-found-dead-along-65/1355843002/
Senior, S., Hamed, E., Masoud, M., & Shehata, E. (2012). Characterization and dating of
blue ballpoint pen inks using principal component analysis of UV–Vis absorption
spectra, IR spectroscopy, and HPTLC. Journal of Forensic Sciences, 57(4), 1087-
1093.
Shimadzu. (2017). UV-2600/2700 UV-VIS Spectrophotometers. Japan: Shimadzu
Corporation.
Tattoo Ink Stamp Pads. (n.d.). Retrieved May 20, 2019, from
https://www.stampin.com/stamp-supplies/stamp-pads-inks/tattoo-ink-stamp-pads/
ThermoFisher Scientific. (2017). Thermo Scientific Nicolet iS10 FTIR Spectrometer:
Complete infrared spectroscopy system for routine analytical needs. Thermo
Fisher Scientific Inc.
120
Todd, G. D., Chessin, R. L., & Colman, J., & United States. (1999). Toxicological profile
for total petroleum hydrocarbons (TPH), U.S. Department of Health and Human
Services, retrieved from cdc.org.
UV-Visible Spectroscopy. (n.d.). Retrieved April 12, 2019, from
https://www2.chemistry.msu.edu/faculty/reusch/virttxtjml/spectrpy/uv-
vis/uvspec.htm
Waters, C. E. (1940). U.S. Patent No. 2,208,551. Washington, DC: U.S. Patent and
Trademark Office.
XRF Technology. (n.d.). Retrieved from
https://www.thermofisher.com/us/en/home/industrial/spectroscopy-elemental-
isotope-analysis/spectroscopy-elemental-isotope-analysis-learning-
center/elemental-analysis-information/xrf-technology.html
Yao, Y. T., Song, J., Yu, J., Wang, X. F., Hou, F., Zhang, A., Liu, Y., Han, J & Xie, M.
X. (2009). Differentiation and dating of red ink entries of seals on documents by
HPLC and GC/MS. Journal of Separation Science, 32(17), 2919-2927.
Yu, J. (2016, November 18). ATR-FTIR Spectroscopy. Retrieved May 17, 2019, from
https://en.wikipedia.org/wiki/File:ATR-FTIR_Spectroscopy.png
Zhu, L. (1998). U.S. Patent No. 5,755,860. Washington, DC: U.S. Patent and Trademark
Office
Zięba-Palus, J., & Kunicki, M. (2006). Application of the micro-FTIR spectroscopy,

121
Raman spectroscopy and XRF method examination of inks. Forensic Science
International, 158(2-3), 164-172

122
Appendix
Table 6.0 below, tabulates all the information for each examined sample.
Table 6.0: An extensive organization of the sample information.
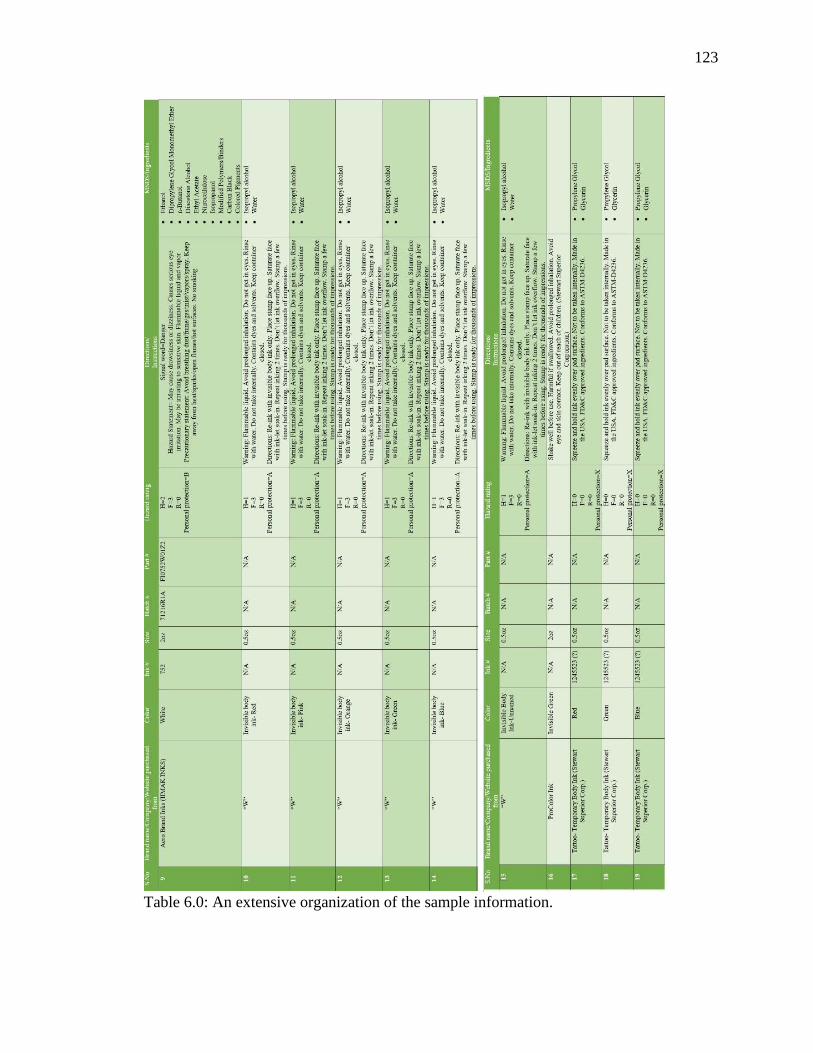
123
Table 6.0: An extensive organization of the sample information.