the foreign-born population in the united states: 2010 ... · pdf fileforeign-born population...
TRANSCRIPT

American Community Survey Reports
U.S. Department of CommerceEconomics and Statistics Administration
U.S. CENSUS BUREAU
The Foreign-Born Population in the United States: 2010
INTRODUCTION
This report presents a portrait of the foreign-born population in the United States. The U.S. Census Bureau uses the term foreign born to refer to anyone who is not a U.S. citizen at birth. This includes naturalized citizens, lawful permanent residents, temporary migrants (such as foreign students), humanitarian migrants (such as refugees), and undocumented migrants. The term native born refers to anyone born in the United States, Puerto Rico, or a U.S. Island Area, or those born abroad of at least one U.S. citizen parent.1
Information on the demographic, social, economic, and housing characteristics presented in this report is based on data from the 2010 American Community Survey (ACS).2
In this report, data on the foreign born are presented by broad region of birth, including Africa, Asia, Europe, Latin America and the Caribbean, Northern America, and Oceania. More detail is shown for Latin America and the Caribbean—including Mexico, Other Central America, South America, and the Caribbean. For this report, the category Other Central America excludes Mexico but includes the remaining countries of Central America.3 In the graphs display-ing information by nativity and place
1 The terms native and native born are used inter-changeably in this report. U.S. Island Areas include Guam, American Samoa, the U.S. Virgin Islands, and the Commonwealth of the Northern Mariana Islands.
2 Additional information about the ACS is avail-able on the Census Bureau’s Web site at www.census.gov/acs/www/.
3 Other Central America includes the countries of Belize, Costa Rica, El Salvador, Guatemala, Honduras, Nicaragua, and Panama.
of birth, data on the total, native, and foreign-born populations as well as the regions of birth are shown in light green, while the areas within Latin America are shown in light blue.4
Data are shown for population (e.g., age, marital status, occupation) and house-hold (e.g., size, type, income) character-istics. A household is a person or a group of people who occupy a housing unit as their current residence. College residence halls, military barracks, correctional facili-ties, and other group quarters are not included. A householder is usually the person, or one of the people, in whose name the home is owned, being bought, or rented. A family household consists of a householder and one or more people living together in the same household who are related to the householder by birth, marriage, or adoption. It may also include people unrelated to the house-holder. The nativity status and place of birth of a household are determined by the nativity status and place of birth of the householder. A household with a foreign-born householder may also contain native residents, and a house-hold with a native householder may also contain foreign-born residents.
The 2010 ACS estimated the number of foreign born in the United States to be
4 The term Latin America and the Caribbean includes countries in Central and South America and the Caribbean. Throughout the remainder of this report, the term Latin America is used to refer to all of these areas. A complete list of the countries included in the regions and subregions is available on the Census Bureau’s Web site at www.census.gov /acs/www/Downloads/data_documentation /CodeLists/Foreign_Country_Code_List_062310.pdf.
Issued May 2012
ACS-19
By Elizabeth M. Grieco, Yesenia D. Acosta, G. Patricia de la Cruz, Christine Gambino, Thomas Gryn, Luke J. Larsen, Edward N. Trevelyan, and Nathan P. Walters

2 U.S. Census Bureau
nearly 40 million, or 13 percent of the total population (Table 1).5
The foreign-born population from Latin America was the largest region-of-birth group, accounting for over half (53 percent) of all foreign born (Table 2). By compari-son, 28 percent of the foreign born were born in Asia, 12 percent in Europe, 4 percent in Africa, 2 per-cent in Northern America, and less than 1 percent in Oceania.6 Among the 21.2 million foreign born from Latin America, 11.7 million, or over half (55 percent), were born in Mexico. Of the total foreign-born population, 29 percent were born in Mexico.
5 This report discusses data about resi-dents of the United States, including the 50 states and the District of Columbia; it does not include data about residents of Puerto Rico. Population totals shown in this report are as of July 1, 2010.
6 The majority of the foreign born from Northern America were from Canada (99 percent). About two-thirds of the foreign born from Oceania were from Australia and New Zealand (48 percent) and Fiji (18 percent).
Table 1. Population by Nativity Status and Citizenship: 2010(Numbers in thousands. Data based on sample. For information on confidentiality protection, sampling error, nonsampling error, and definitions, see www.census.gov /acs/www/)
Nativity and citizenshipPopulation1
Margin of error2 (±) Percent
Margin of error2 (±)
Total . . . . . . . . . . . . . . . . . . . . . . . . . 309,350 (X) 100 .0 (X)Native . . . . . . . . . . . . . . . . . . . . . . . . . . 269,394 115 87 .1 –Foreign born . . . . . . . . . . . . . . . . . . . . . 39,956 115 12 .9 – Naturalized citizen . . . . . . . . . . . . . . . . 17,476 82 5 .6 – Noncitizen . . . . . . . . . . . . . . . . . . . . . . 22,480 120 7 .3 –
(X) Not applicable . – Represents or rounds to zero . 1 Population as of July 1, 2010 . 2 Data are based on a sample and are subject to sampling variability . A margin of error is a measure
of an estimate’s variability . The larger the margin of error in relation to the size of the estimates, the less reliable the estimate . When added to and subtracted from the estimate, the margin of error forms the 90 percent confidence interval .
Source: U .S . Census Bureau, American Community Survey, 2010 .
Table 2. Foreign-Born Population by Region of Birth: 2010 (Numbers in thousands. Data based on sample. For information on confidentiality protection, sampling error, nonsampling error, and definitions, see www.census.gov /acs/www/)
Region of birthPopulation
Margin of error1 (±) Percent
Margin of error1 (±)
Total2 . . . . . . . . . . . . . . . . . . . . . . . . 39,956 115 100 .0 (X)Africa . . . . . . . . . . . . . . . . . . . . . . . . . . . 1,607 33 4 .0 0 .1Asia . . . . . . . . . . . . . . . . . . . . . . . . . . . . 11,284 47 28 .2 0 .1Europe . . . . . . . . . . . . . . . . . . . . . . . . . . 4,817 44 12 .1 0 .1Latin America and the Caribbean . . . . . 21,224 90 53 .1 0 .1 Mexico . . . . . . . . . . . . . . . . . . . . . . . . 11,711 83 29 .3 0 .2 Other Central America . . . . . . . . . . . . 3,053 46 7 .6 0 .1 South America . . . . . . . . . . . . . . . . . . 2,730 42 6 .8 0 .1 Caribbean . . . . . . . . . . . . . . . . . . . . . . 3,731 42 9 .3 0 .1Northern America . . . . . . . . . . . . . . . . . 807 16 2 .0 –Oceania . . . . . . . . . . . . . . . . . . . . . . . . . 217 10 0 .5 –
(X) Not applicable . – Represents or rounds to zero . 1 Data are based on a sample and are subject to sampling variability . A margin of error is a measure
of an estimate’s variability . The larger the margin of error in relation to the size of the estimates, the less reliable the estimate . When added to and subtracted from the estimate, the margin of error forms the 90 percent confidence interval .
2 Excludes 181 persons who reported they were born at sea .Note: Percentages do not sum to 100 .0 due to rounding . Source: U .S . Census Bureau, American Community Survey, 2010 .

U.S. Census Bureau 3
SUMMARY HIGHLIGHTS
Geographic Distribution
While the foreign born resided in every state in 2010, over half lived in just four states: California, New York, Texas, and Florida. Over one-fourth of the total foreign-born population lived in California. California, New York, and New Jersey had the highest foreign-born proportions in their total popula-tions. Over 1 in 4 residents of California and over 1 in 5 residents of New York and New Jersey were foreign born.
Age, Marital Status, Fertility, and Household Size and Type
Half of the foreign born were between the ages of 18 and 44, compared with about one-third of the native born. The foreign born were also more likely than natives to be married and less likely to be divorced. Foreign-born house-holds were, on average, larger than native households and were more
likely to be family households, to include children under 18, and to be multigenerational. Foreign-born women were more likely to have given birth in the last 12 months than native women.
Year of Entry, Naturalization Rate, and English-Speaking Ability
Over half of the foreign born came to live in the United States since 1990, with about one-third enter-ing the country in 2000 or later. Overall, about 2 in 5 foreign born were naturalized citizens. For those foreign born who entered before 1980, about 4 of 5 were natural-ized citizens. About half of all for-eign born either spoke only English at home or spoke a language other than English at home and spoke English “very well.”
Educational Attainment, Labor Force Participation, and Occupation
Compared with the native-born population, the foreign born were
less likely to be high school gradu-ates. However, over 2 in 3 foreign born were high school graduates and more than 1 in 4 aged 25 years and older attained at least a bachelor’s degree. The foreign born were more likely than the native born to be in the labor force. Over one-fourth of the foreign born worked in management, business, science, and art occupations with an additional one-fourth working in service occupations.
Household Income, Health Insurance Coverage, and Percent in Poverty
About two-thirds of the foreign born had some form of health insurance coverage and, of those, three-fourths were covered by a private insurer. The median income of foreign-born households was less than that of native households, and the foreign born were more likely than the native born to live in poverty.

4 U.S. Census Bureau
• Thestateswiththehighestper-centage of foreign born in their populations were California (27 percent), New York (22 percent), and New Jersey (21 percent).
• In14statesandtheDistrictof Columbia, the percentage of foreign born was equal to or greater than the national average of 13 percent. With the exception of Texas, Florida, and Illinois, these states were primarily in the western and
northeastern parts of the country.
• WiththeexceptionofIllinois (14 percent), the percentage of foreign born in all states of the Midwest region was below 8 percent, including North Dakota and South Dakota, each with about 3 percent.7
7 The Midwest region includes the states of Illinois, Indiana, Iowa, Kansas, Michigan, Minnesota, Missouri, Nebraska, North Dakota, Ohio, South Dakota, and Wisconsin.
• SouthCentralstatesalsotendedto have relatively low propor-tions of foreign born in their populations. With the exception of Texas and Oklahoma, all states in this division had less than 5 percent foreign born.8
8 The South Central Census division includes Alabama, Arkansas, Kentucky, Louisiana, Mississippi, Oklahoma, Tennessee, and Texas.
MT
AK
NM
OR MN
KS
SD
ND
MO
WA
FL
IL IN
WI NY
PA
MI
OHIA
ME
MA
CT
AZ
HI
NV
TX
COCA
WY
UT
ID
NE
OK
GA
AR
AL
NC
MS
LA
TN
KYVA
SC
WV
RI
DE MD DC
NJ
Figure 1.Foreign-Born Population as Percent of State Population: 2010
VT NH
U.S. percent: 12.9
Percent
20.0 or higher
15.0 to 19.9
10.0 to 14.9
5.0 to 9.9
Less than 5.0
Source: U.S. Census Bureau, American Community Survey, 2010.
(Data based on sample. For information on confidentiality protection, sampling error, nonsampling error, and definitions, see www.census.gov/acs/www/)
The foreign born represented 13 percent of the U.S. population. By state, the percentage of foreign born ranged from just over 1 percent in West Virginia to 27 percent in California.

U.S. Census Bureau 5
• In2010,morethan1in4foreign-born residents lived in California.
• NewYork,Texas,andFloridaaccounted for 30 percent of the foreign-born population. Including California, these four states were home to more than half of all foreign born.
• About74percentofallforeignborn lived in 10 states. The remaining 26 percent was dispersed among 40 states and the District of Columbia, each with 2 percent or less of the foreign-born population.
• Thefourstateswiththelargestproportions of the foreign-born
population were also the four states with the largest proportions of the total popula-tion, regardless of nativity.9
9 In 2010, the states with the largest total populations included California (37.3 million), Texas (25.3 million), New York (19.4 million), and Florida (18.8 million). Together, their populations represented 33 percent of the total U.S. population.
Figure 2.Foreign-Born Population by State: 2010
Note: Percentages do not sum to 100.0 due to rounding.Source: U.S. Census Bureau, American Community Survey, 2010.
(Percent distribution. Data based on sample. For information on confidentiality protection, sampling error, nonsampling error, and definitions, see www.census.gov/acs/www/)
California 25.4
Georgia 2.4
Washington 2.2
Virginia 2.3
Texas 10.4
New York 10.8
Florida 9.2
All other states26.0
New Jersey 4.6
Massachusetts 2.5
Illinois 4.4
One-fourth of the foreign-born population was concentrated in a single state, while over half was distributed among just four states.

6 U.S. Census Bureau
• Over80percentoftheforeign-born population was between the ages of 18 to 64, including 50 percent between the ages of 18 to 44. Among the native born, 60 percent were between the ages of 18 to 64, including 35 percent between 18 and 44.
• Thenativepopulationhadahigher proportion under the age of 18 than the foreign-born population. About 27 percent of the native population was under age 18, compared with 7 percent of the foreign born. This difference reflects the fact
that children of immigrants born in the United States are, by definition, native.
• Comparedwiththenativebornand foreign born from other regions, the proportion of people aged 65 and older was highest among those born in Europe. Over 28 percent of the population born in Europe was aged 65 and older.
• Theforeignbornhadamedianage of 41.4 years, about 5 years older than the median age of the native population,
35.9 years. The higher median age of the foreign-born popula-tion reflects the higher propor-tion of children in the native population than in the foreign-born population.
• Amongtheworldregionsofbirth, the foreign-born popula-tion from Europe (51.7) and Northern America (51.3) had the highest median age, while those born in Africa (38.0) had the lowest median age.10
10 The estimates for Europe and Northern America are not statistically different.
Figure 3.Selected Age Groups and Median Age: 2010
Note: Some percentages do not sum to 100.0 due to rounding.Source: U.S. Census Bureau, American Community Survey, 2010.
(Percent distribution. Data based on sample. For information on confidentiality protection, sampling error, nonsampling error, and definitions, see www.census.gov/acs/www/)
Under 18 18 to 44 65 and over45 to 64
Total
Native
Foreign born
Africa
Asia
Europe
Northern America
Oceania
Latin America
Mexico
Other Central America
South America
Caribbean
Median age (years)
37.2
35.9
41.4
38.0
42.7
51.7
51.3
40.6
39.1
37.2
37.0
42.2
46.7
24.0 36.5 26.4 13.1
26.5 34.5 25.8 13.2
7.1 50.3 30.2 12.4
10.6 54.9 28.2 6.3
7.0 47.6 32.8 12.7
5.6 32.9 33.0 28.4
7.3 30.7 36.1 25.9
7.8 51.7 30.3 10.3
7.2 56.1 28.1 8.6
7.9 61.2 24.6 6.3
6.0 62.4 25.9 5.7
7.2 48.8 33.7 10.3
5.8 40.2 36.7 17.2
Half of the foreign born were between the ages of 18 and 44, compared with about one-third of the native born.
U.S. Census Bureau 7
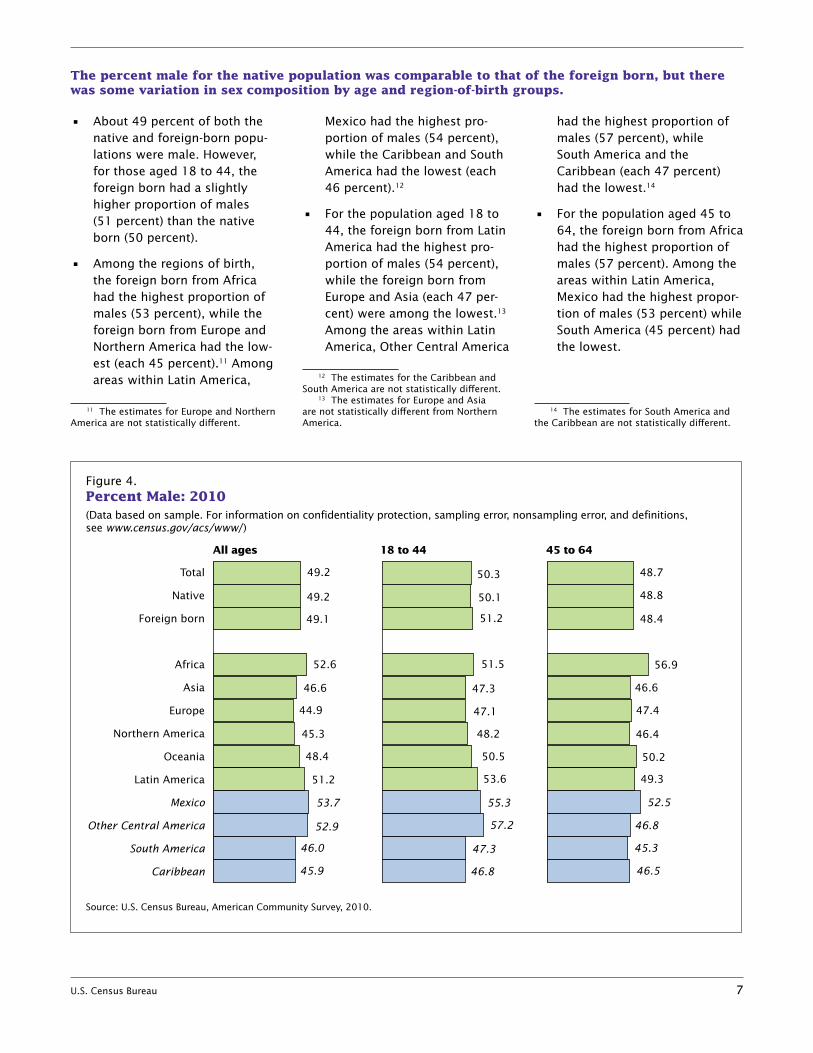
• About49percentofboththenative and foreign-born popu-lations were male. However, for those aged 18 to 44, the foreign born had a slightly higher proportion of males (51 percent) than the native born (50 percent).
• Amongtheregionsofbirth,the foreign born from Africa had the highest proportion of males (53 percent), while the foreign born from Europe and Northern America had the low-est (each 45 percent).11 Among areas within Latin America,
11 The estimates for Europe and Northern America are not statistically different.
Mexico had the highest pro-portion of males (54 percent), while the Caribbean and South America had the lowest (each 46 percent).12
• Forthepopulationaged18to44, the foreign born from Latin America had the highest pro-portion of males (54 percent), while the foreign born from Europe and Asia (each 47 per-cent) were among the lowest.13 Among the areas within Latin America, Other Central America
12 The estimates for the Caribbean and South America are not statistically different.
13 The estimates for Europe and Asia are not statistically different from Northern America.
had the highest proportion of males (57 percent), while South America and the Caribbean (each 47 percent) had the lowest.14
• Forthepopulationaged45to64, the foreign born from Africa had the highest proportion of males (57 percent). Among the areas within Latin America, Mexico had the highest propor-tion of males (53 percent) while South America (45 percent) had the lowest.
14 The estimates for South America and the Caribbean are not statistically different.
Figure 4.Percent Male: 2010
Source: U.S. Census Bureau, American Community Survey, 2010.
(Data based on sample. For information on confidentiality protection, sampling error, nonsampling error, and definitions, see www.census.gov/acs/www/)
All ages 18 to 44 45 to 64
Total
Native
Foreign born
Africa
Asia
Europe
Northern America
Oceania
Latin America
Mexico
Other Central America
South America
Caribbean
Percent female in total
labor force
47.3
48.1
42.9
42.3
46.8
47.6
47.2
44.1
40.0
34.9
39.7
48.3
50.5
49.2 50.3 48.7
49.2 50.1 48.8
49.1 51.2 48.4
52.6 56.951.5
46.6 47.3 46.6
44.9 47.1 47.4
45.3 48.2 46.4
48.4 50.5 50.2
51.2 53.6 49.3
53.7 52.555.3
52.9 46.857.2
46.0 47.3 45.3
45.9 46.8 46.5
The percent male for the native population was comparable to that of the foreign born, but there was some variation in sex composition by age and region-of-birth groups.

8 U.S. Census Bureau
• In2010,58percentoftheforeign born aged 15 and older were married, while 26 percent were never married. By compar-ison, the native born aged 15 and older were less likely to be married (47 percent) and more likely to never have been mar-ried (33 percent). However, the native born were more likely to be separated or divorced
(14 percent) than the foreign born (11 percent).
• Amongtheregionsofbirth,theforeign-born population from Asia had the highest propor-tion married (66 percent), while those born in Africa and Latin America (each 54 percent) had the lowest.
• WithinLatinAmerica,thoseborn in Mexico were the most likely to be married (58 percent), while those born in the Caribbean were the most likely to be separated or divorced (18 percent). Among those born in Other Central America, about one-third (38 percent) were never married.
Figure 5.Marital Status: 2010
Note: Some percentages do not sum to 100.0 due to rounding.Source: U.S. Census Bureau, American Community Survey, 2010.
(Percent distribution of population 15 and older. Data based on sample. For information on confidentiality protection, sampling error, nonsampling error, and definitions, see www.census.gov/acs/www/)
Never married Married Divorced WidowedSeparated
Total
Native
Foreign born
Africa
Asia
Europe
Northern America
Oceania
Latin America
Mexico
Other Central America
South America
Caribbean
32.1 48.8 2.2 10.9
33.2
25.8 58.5
47.0 2.1
3.1 7.5
29.7 54.0
11.5
8.5
21.8
61.5
66.0
4.0
5.7
16.4
1.5
1.6 9.7
17.9 61.9 1.4 9.9
22.5 63.5 2.1 6.6
30.2 53.9 4.2 7.9
57.7 3.9 5.529.6
11.3
7.338.3 47.3 4.2
28.4
25.8
46.9
54.9
5.1
4.0
13.2
6.0
5.1
6.2
3.7
5.1
10.8
8.8
5.4
3.8
3.2
4.0
2.9
6.4
About three-fifths of the foreign born were married, compared with less than half of the native born.

U.S. Census Bureau 9
• Foreign-bornwomenhadahigher fertility rate than native women.15 About 70 of every 1,000 foreign-born women aged 15 to 50 had given birth in the 12 months prior to being surveyed, compared with
15 Of every 1,000 women aged 15 to 50, the number who had given birth in the 12 months preceding the date of the survey, whether in 2009 or 2010.
about 52 of every 1,000 native women aged 15 to 50.
• Amongtheregionsofbirth,foreign-born women aged 15 to 50 from Africa had the highest fertility rate, with 97 of every 1,000 women having given birth in the 12 months prior to being surveyed.
• About85ofevery1,000foreign-born women aged 15 to 50 from Mexico had given birth during the 12 months prior to being surveyed.
• About39percentofnativewomen who had given birth in the past 12 months were unmarried, compared with 25 percent of foreign-born women.
Figure 5.Marital Status: 2010
Note: Some percentages do not sum to 100.0 due to rounding.Source: U.S. Census Bureau, American Community Survey, 2010.
(Percent distribution of population 15 and older. Data based on sample. For information on confidentiality protection, sampling error, nonsampling error, and definitions, see www.census.gov/acs/www/)
Never married Married Divorced WidowedSeparated
Total
Native
Foreign born
Africa
Asia
Europe
Northern America
Oceania
Latin America
Mexico
Other Central America
South America
Caribbean
32.1 48.8 2.2 10.9
33.2
25.8 58.5
47.0 2.1
3.1 7.5
29.7 54.0
11.5
8.5
21.8
61.5
66.0
4.0
5.7
16.4
1.5
1.6 9.7
17.9 61.9 1.4 9.9
22.5 63.5 2.1 6.6
30.2 53.9 4.2 7.9
57.7 3.9 5.529.6
11.3
7.338.3 47.3 4.2
28.4
25.8
46.9
54.9
5.1
4.0
13.2
6.0
5.1
6.2
3.7
5.1
10.8
8.8
5.4
3.8
3.2
4.0
2.9
6.4
Figure 6.Fertility: 2009–2010
Source: U.S. Census Bureau, American Community Survey, 2010.
(Based on women aged 15 to 50 years. Data based on sample. For information on confidentiality protection, sampling error, nonsampling error, and definitions, see www.census.gov/acs/www/)
Births per 1,000 women in the past 12 months
Total
Native
Foreign born
Africa
Asia
Europe
Northern America
Oceania
Latin America
Mexico
Other Central America
South America
Caribbean
Percent of women with a birth in the past 12 months
who were unmarried
54.6
51.5
70.3
97.3
62.5
55.0
57.3
77.8
75.0
85.2
78.0
56.9
51.0
36.0
39.1
24.5
16.5
8.5
9.9
7.9
21.3
34.4
33.7
41.7
23.4
38.7
Foreign-born women were more likely to have given birth in the past 12 months than native women.
10 U.S. Census Bureau
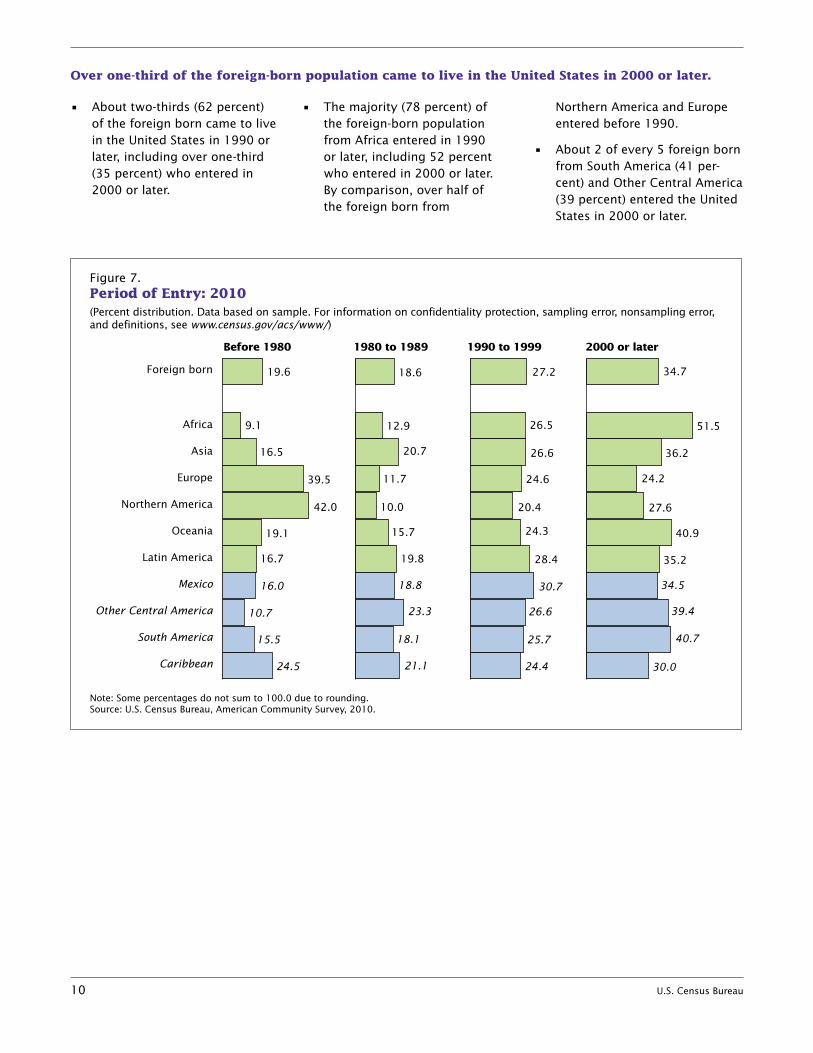
• Abouttwo-thirds(62percent)of the foreign born came to live in the United States in 1990 or later, including over one-third (35 percent) who entered in 2000 or later.
• Themajority(78percent)of the foreign-born population from Africa entered in 1990 or later, including 52 percent who entered in 2000 or later. By comparison, over half of the foreign born from
Northern America and Europe entered before 1990.
• About2ofevery5foreignbornfrom South America (41 per-cent) and Other Central America (39 percent) entered the United States in 2000 or later.
Figure 7.Period of Entry: 2010
Note: Some percentages do not sum to 100.0 due to rounding.Source: U.S. Census Bureau, American Community Survey, 2010.
(Percent distribution. Data based on sample. For information on confidentiality protection, sampling error, nonsampling error, and definitions, see www.census.gov/acs/www/)
Before 1980 1980 to 1989 1990 to 1999 2000 or later
Foreign born
Africa
Asia
Europe
Northern America
Oceania
Latin America
Mexico
Other Central America
South America
Caribbean
19.6 18.6 27.2 34.7
9.1 12.9 26.5 51.5
16.5 20.7 26.6 36.2
39.5 11.7 24.6 24.2
42.0 10.0 20.4 27.6
19.1 15.7 24.3 40.9
16.7 19.8 28.4 35.2
16.0 18.8 30.7 34.5
23.3 26.6 39.410.7
40.715.5 18.1 25.7
24.5 21.1 24.4 30.0
Over one-third of the foreign-born population came to live in the United States in 2000 or later.
U.S. Census Bureau 11
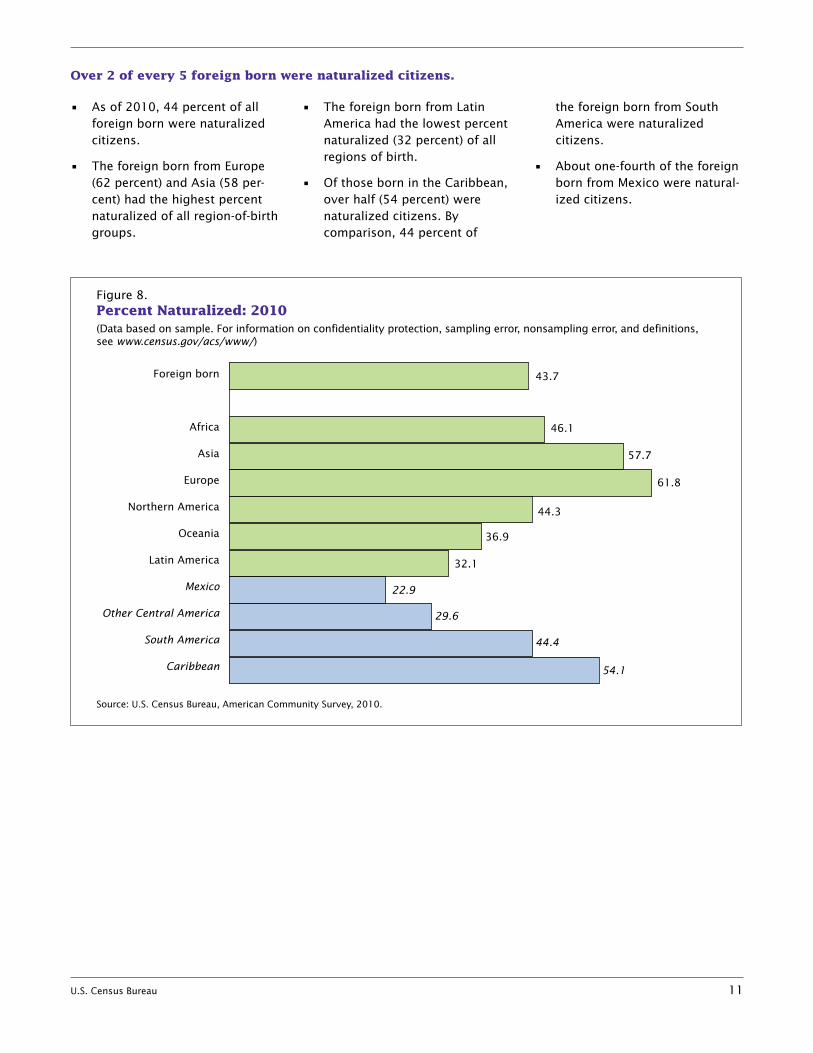
• Asof2010,44percentofallforeign born were naturalized citizens.
• TheforeignbornfromEurope(62 percent) and Asia (58 per-cent) had the highest percent naturalized of all region-of-birth groups.
• TheforeignbornfromLatinAmerica had the lowest percent naturalized (32 percent) of all regions of birth.
• OfthosebornintheCaribbean,over half (54 percent) were naturalized citizens. By comparison, 44 percent of
the foreign born from South America were naturalized citizens.
• Aboutone-fourthoftheforeignborn from Mexico were natural-ized citizens.
Figure 8.Percent Naturalized: 2010
Source: U.S. Census Bureau, American Community Survey, 2010.
(Data based on sample. For information on confidentiality protection, sampling error, nonsampling error, and definitions, see www.census.gov/acs/www/)
Foreign born
Africa
Asia
Europe
Northern America
Oceania
Latin America
Mexico
Other Central America
South America
Caribbean
43.7
61.8
46.1
57.7
44.3
36.9
32.1
22.9
29.6
44.4
54.1
Over 2 of every 5 foreign born were naturalized citizens.
12 U.S. Census Bureau
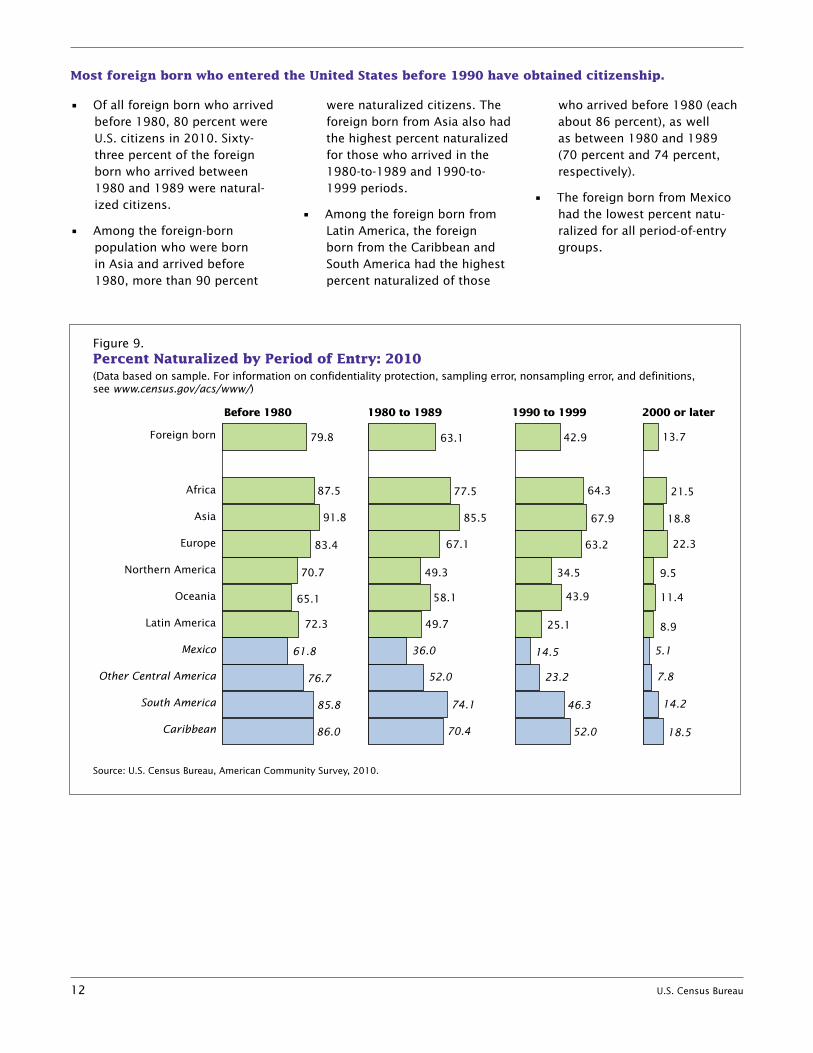
• Ofallforeignbornwhoarrivedbefore 1980, 80 percent were U.S. citizens in 2010. Sixty-three percent of the foreign born who arrived between 1980 and 1989 were natural-ized citizens.
• Amongtheforeign-born population who were born in Asia and arrived before 1980, more than 90 percent
were naturalized citizens. The foreign born from Asia also had the highest percent naturalized for those who arrived in the 1980-to-1989 and 1990-to-1999 periods.
• AmongtheforeignbornfromLatin America, the foreign born from the Caribbean and South America had the highest percent naturalized of those
who arrived before 1980 (each about 86 percent), as well as between 1980 and 1989 (70 percent and 74 percent, respectively).
• TheforeignbornfromMexicohad the lowest percent natu-ralized for all period-of-entry groups.
Figure 9.Percent Naturalized by Period of Entry: 2010
Source: U.S. Census Bureau, American Community Survey, 2010.
(Data based on sample. For information on confidentiality protection, sampling error, nonsampling error, and definitions, see www.census.gov/acs/www/)
Before 1980 1980 to 1989 1990 to 1999 2000 or later
Foreign born
Africa
Asia
Europe
Northern America
Oceania
Latin America
Mexico
Other Central America
South America
Caribbean
79.8 63.1 42.9 13.7
87.5 77.5 64.3 21.5
91.8 85.5 67.9 18.8
83.4 67.1 63.2 22.3
70.7 49.3 34.5 9.5
65.1 58.1 43.9 11.4
72.3 49.7 25.1 8.9
61.8 36.0 14.5 5.1
52.0 23.2 7.876.7
14.285.8 74.1 46.3
86.0 70.4 52.0 18.5
Most foreign born who entered the United States before 1990 have obtained citizenship.

U.S. Census Bureau 13
• Morethanthree-fourths (77 percent) of foreign-born households and almost two-thirds (65 percent) of native households were family households.
• Ahigherproportionofforeign-born (55 percent) than native (48 percent) households were maintained by a married couple. Among the regions of birth, householders born in Asia (63 percent) and Oceania (62 percent) were the most
likely to be in a married-couple household.16 Within Latin America, households with a householder born in Mexico were the most likely to be main-tained by a married couple (58 percent).
• Comparedwithotherregions,householders born in Latin America were more likely to be female with no husband pres-ent. This is especially true for
16 The estimates for Asia and Oceania are not statistically different.
Caribbean households, where 1 out of every 4 were families with a female householder with no husband present.
• Overone-thirdofhouseholdswith a householder born in Northern America (40 percent) and Europe (37 percent) were nonfamily households, such as a person living alone or unre-lated individuals living together.
Figure 10.Household Type: 2010
Note: Some percentages do not sum to 100.0 due to rounding.Source: U.S. Census Bureau, American Community Survey, 2010.
(Percent distribution. Households are classified by nativity and region of birth of the householder. Data based on sample. For information on confidentiality protection, sampling error, nonsampling error, and definitions, see www.census.gov/acs/www/)
Married coupleMale householder,no wife present
Nonfamily householdsFemale householder,
no husband present
Total
Native
Foreign born
Africa
Asia
Europe
Northern America
Oceania
Latin America
Mexico
Other Central America
South America
Caribbean
48.6 4.7 13.1 33.6
47.6
55.2 7.1
4.3 12.8
14.6 23.1
47.8 7.8
35.3
29.2
63.1 4.6
15.2
22.9
52.3 2.9
9.4
8.2 36.6
51.9 2.2 6.4 39.5
62.4 4.0 9.6 24.0
52.4 9.9 19.8 17.8
10.9 17.7 13.058.4
23.8
18.447.0 12.8 21.7
41.2
51.4
7.3
7.3
25.5
17.5
26.0
Family households
Foreign-born households were more likely than native households to be family households.
14 U.S. Census Bureau
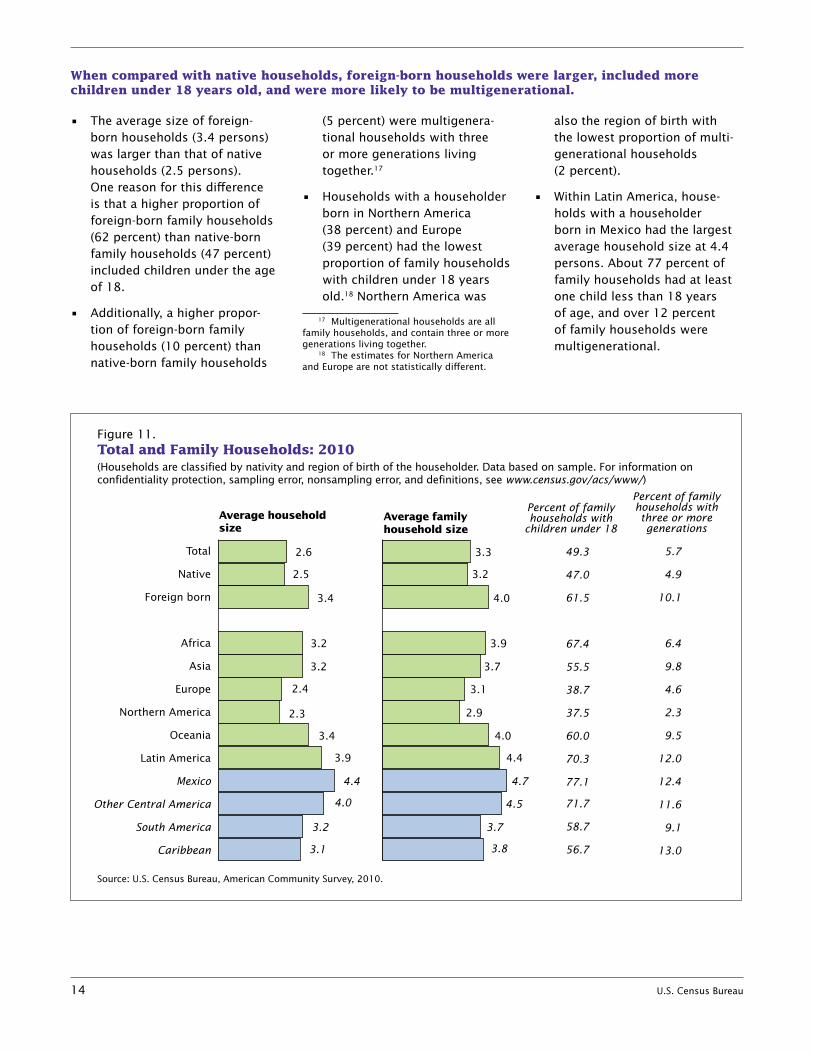
• Theaveragesizeofforeign-born households (3.4 persons) was larger than that of native households (2.5 persons). One reason for this difference is that a higher proportion of foreign-born family households (62 percent) than native-born family households (47 percent) included children under the age of 18.
• Additionally,ahigherpropor-tion of foreign-born family households (10 percent) than native-born family households
(5 percent) were multigenera-tional households with three or more generations living together.17
• Householdswithahouseholderborn in Northern America (38 percent) and Europe (39 percent) had the lowest proportion of family households with children under 18 years old.18 Northern America was
17 Multigenerational households are all family households, and contain three or more generations living together.
18 The estimates for Northern America and Europe are not statistically different.
also the region of birth with the lowest proportion of multi-generational households (2 percent).
• WithinLatinAmerica,house-holds with a householder born in Mexico had the largest average household size at 4.4 persons. About 77 percent of family households had at least one child less than 18 years of age, and over 12 percent of family households were multigenerational.
Figure 11.Total and Family Households: 2010
Source: U.S. Census Bureau, American Community Survey, 2010.
(Households are classified by nativity and region of birth of the householder. Data based on sample. For information on confidentiality protection, sampling error, nonsampling error, and definitions, see www.census.gov/acs/www/)
Average householdsize
Average family household size
Total
Native
Foreign born
Africa
Asia
Europe
Northern America
Oceania
Latin America
Mexico
Other Central America
South America
Caribbean
2.6 3.3
2.5
3.4 4.0
3.2
3.2 3.9
3.2 3.7
2.4 3.1
2.3 2.9
3.4 4.0
3.9 4.4
4.74.4
4.0 4.5
3.1
3.2
3.8
3.7
49.3
47.0
61.5
67.4
55.5
38.7
37.5
60.0
70.3
77.1
71.7
58.7
56.7
5.7
4.9
10.1
6.4
9.8
4.6
2.3
9.5
12.0
12.4
11.6
9.1
13.0
Percent of familyhouseholds with
children under 18
Percent of familyhouseholds withthree or more generations
When compared with native households, foreign-born households were larger, included more children under 18 years old, and were more likely to be multigenerational.

U.S. Census Bureau 15
• About85percentofthe foreign-born population spoke a language other than English at home, compared with about 10 percent of the native population.
• Fifteenpercentoftheforeign-born population spoke only English at home. An additional 33 percent spoke a language other than English at home and spoke English “very well.”
• Oneintenforeignborndidnotspeak English at all.
• Atleast70percentoftheforeign-born population from Northern America, Oceania, Africa, and Europe spoke either only English at home or a language other than English at home and spoke English “very well,” compared with about 53 percent and 37 percent of the foreign-born population born in Asia and Latin America, respectively.
• Amongtheforeign-bornpopula-tion from Latin America, those born in the Caribbean were
more likely to speak only English at home (32 percent) than the foreign born from South America (15 percent), Other Central America (7 percent), and Mexico (3 percent).
• Overhalfoftheforeignbornfrom the Caribbean and South America spoke either only English at home or a language other than English at home and spoke English “very well.”
Figure 12.Language Spoken at Home and English-Speaking Ability: 2010
Note: Some percentages do not sum to 100.0 due to rounding.Source: U.S. Census Bureau, American Community Survey, 2010.
(Percent distribution of population 5 and older. Data based on sample. For information on confidentiality protection, sampling error, nonsampling error, and definitions, see www.census.gov/acs/www/)
Spoke only English at home Very well Not wellWell
Total
Native
Foreign born
Africa
Asia
Europe
Northern America
Oceania
Latin America
Mexico
Other Central America
South America
Caribbean
79.4 11.9 4.0 3.2
89.6
15.3 33.1
8.5 1.3
21.4 20.0
21.8 49.0
0.5
7.9
10.9 42.5
19.0
16.1
33.0 37.8
25.1
17.4 9.4
78.7 17.0 2.8 1.2
49.9 29.6 13.6 5.9
10.4 26.6 21.3 26.3
24.7 22.2 30.93.2
17.4
28.76.7 25.6 22.4
31.9
15.4
24.7
38.1
15.9
23.2
16.5
Not at all
1.5
0.1
10.1
2.3
5.4
2.4
0.3
1.0
15.5
18.9
16.6
5.9
10.9
Spoke a language other than English at home and spoke English
Half of all foreign born either spoke only English at home or spoke a language other than English at home and spoke English “very well.”

16 U.S. Census Bureau
• Amongtheforeignbornaged25 and older, 68 percent were high school graduates or higher, including 27 percent who had a bachelor’s degree or higher. By comparison, 89 percent of the native born aged 25 and older were high school graduates, including 28 percent who had a bachelor’s degree or higher.
• Over80percentoftheforeign-born population born in Africa, Asia, Europe, Northern America, and Oceania were high school graduates or higher, compared with about 53 percent of those born in Latin America.
• Justunderhalf(49percent)of the foreign born from Asia completed a bachelor’s degree or higher.
• About40percentofthe foreign-born population born in Mexico and half (50 percent) born in Other Central America were high school graduates or higher, compared with 83 percent born in South America and 73 percent born in the Caribbean.
Figure 13.Educational Attainment: 2010
Note: Some percentages do not sum to 100.0 due to rounding.Source: U.S. Census Bureau, American Community Survey, 2010.
(Percent distribution of population 25 and older. Data based on sample. For information on confidentiality protection, sampling error, nonsampling error, and definitions, see www.census.gov/acs/www/)
Less than high schoolgraduate
High schoolgraduate orequivalency
Some collegeor associate’sdegree
Bachelor’s degreeor higher
Total
Native
Foreign born
Africa
Asia
Europe
Northern America
Oceania
Latin America
Mexico
Other Central America
South America
Caribbean
14.4 28.5 28.9 28.2
28.411.0 29.7
22.5
30.9
27.0
12.1
31.7
20.0
18.8
40.3
16.2 16.6
27.7
48.5
15.2 25.2
18.7
36.4
10.0 20.1
23.3
42.5
14.0 23.2
27.5
32.9
46.8 25.3
30.0
5.3
11.2
23.0
16.7
9.0
60.1
27.8
49.7 24.8
30.1
11.6
17.3
26.7
28.5
16.5
26.4
24.8 18.5
About two-thirds of the foreign born were high school graduates or higher.

U.S. Census Bureau 17
• Oftheforeign-bornpopulationaged 16 and older, 68 percent participated in the labor force. By comparison, 64 percent of the native population aged 16 and older participated in the labor force.
• Foreign-bornmales(79percent)were more likely to be in the labor force than native males (68 percent). In contrast, native females (60 percent) were more likely to have participated in the labor force compared with
foreign-born females (57 percent).
• About70percentormoreofthe foreign born from Africa, Latin America, and Oceania were in the labor force. Over 80 percent of foreign-born males from these three regions participated in the labor force.
• AmongtheforeignbornfromLatin America, those born in Other Central America had the highest total (77 percent),
male (88 percent), and female (65 percent) labor force partici-pation rate.19
• Forty-eightpercentofthe native labor force was female, compared with 43 percent of the foreign-born labor force. About half of the foreign-born labor force from the Caribbean was female.
19 The estimate for Other Central America females is not statistically different from the estimate for South America females.
Figure 14.Labor Force Participation: 2010
Source: U.S. Census Bureau, American Community Survey, 2010.
(Percent of population 16 and older. Data based on sample. For information on confidentiality protection, sampling error, nonsampling error, and definitions, see www.census.gov/acs/www/)
Both sexes Male Female
Total
Native
Foreign born
Africa
Asia
Europe
Northern America
Oceania
Latin America
Mexico
Other Central America
South America
Caribbean
Percent female in total
labor force
47.3
48.1
42.9
42.3
46.8
47.6
47.2
44.1
40.0
34.9
39.7
48.3
50.5
64.4 69.8 59.3
63.8 68.1 59.7
67.7 78.9 57.0
75.1 67.082.4
66.2 75.6 58.0
57.5 67.5 49.4
57.4 67.5 49.2
71.3 82.5 60.9
70.7 82.9 58.0
70.0 52.884.6
77.2 65.188.0
72.6 82.2 64.6
66.5 72.0 61.7
The labor force participation rate of the foreign-born population was higher than that of the native born.

18 U.S. Census Bureau
• Overhalfofthecivilianemployed foreign-born population aged 16 and older worked in either management, business, science, and arts occupations (29 percent) or service occupations (25 percent).
• Overone-thirdofthecivilianemployed native population aged 16 and older worked in management, business, science, and arts occupa-tions (37 percent), with about
one-fourth working in sales and office occupations (26 percent).
• Management,business,science,and arts occupations accounted for the largest share of the civilian employed foreign born aged 16 and older from Northern America (59 percent), Asia (47 percent), Europe (45 percent), Oceania (41 percent), and Africa (38 percent).
• TheforeignbornfromLatinAmerica were the least likely of all region-of-birth groups to work in management, business, science, and arts occupations (14 percent), but the most likely to work in service occupations (31 percent).
• WithinLatinAmerica, the foreign born from Mexico were the least likely to work in management, business, science, and arts occupations (9 percent).
Figure 15.Occupation: 2010
Note: Some percentages do not sum to 100.0 due to rounding.Source: U.S. Census Bureau, American Community Survey, 2010.
(Percent distribution of civilian employed population 16 and older. Data based on sample. For information on confidentiality protection, sampling error, nonsampling error, and definitions, see www.census.gov/acs/www/)
Management,business,science, and arts Service
Sales and office
Natural resources,construction, andmaintenance
Total
Native
Foreign born
Africa
Asia
Europe
Northern America
Oceania
Latin America
Mexico
Other Central America
South America
Caribbean
35.9 18.0 25.0 9.1
8.437.4 16.6
25.1
26.4
13.0
37.7
28.6
24.8
17.8
3.3
47.4 17.5
19.8
3.4
44.6 16.7
21.0
8.5
59.0 9.3
19.4
4.6
40.9 19.5
21.1
6.8
14.1 31.2
22.6
25.2
19.8
31.3
15.6
20.5
8.6
10.6
10.9 34.6
30.4
12.6
27.5
24.8
27.5
14.5
21.7
21.7
Production,transportation,and materialmoving
11.9
11.2
15.5
14.4
10.6
10.7
6.0
10.3
19.3
22.3
19.5
12.7
14.78.4
The foreign born were more likely than the native born to work in service, construction, and production jobs.
U.S. Census Bureau 19
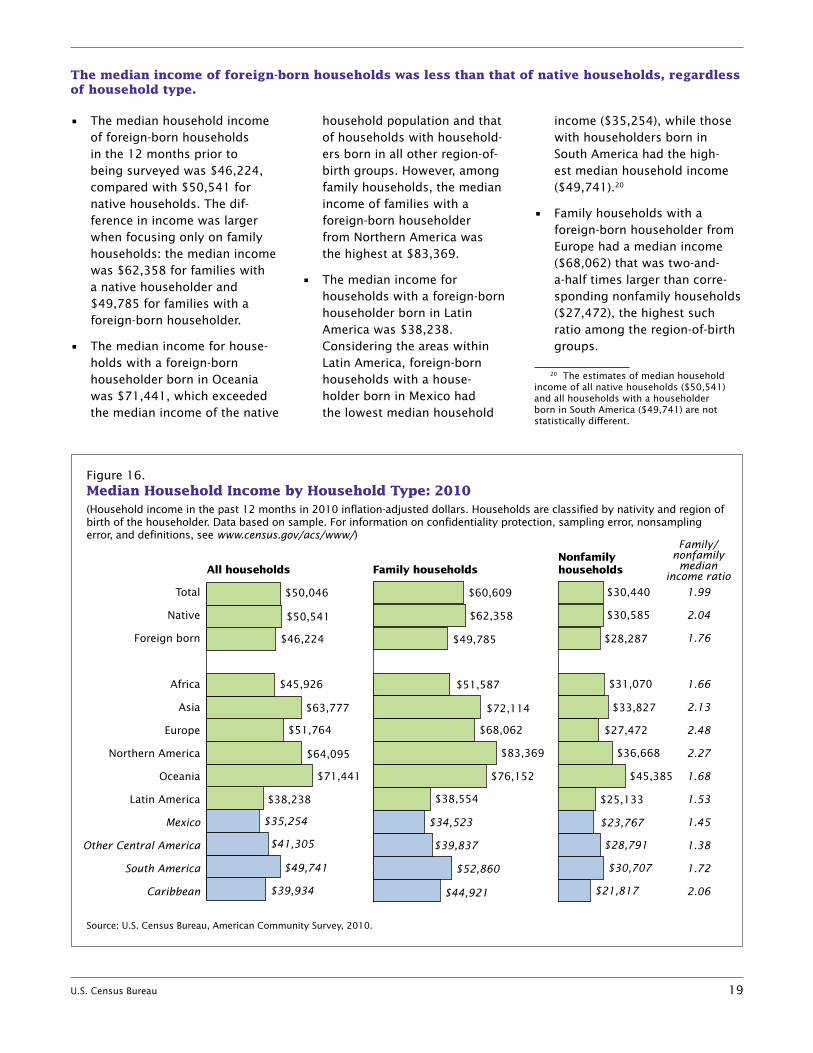
• Themedianhouseholdincomeof foreign-born households in the 12 months prior to being surveyed was $46,224, compared with $50,541 for native households. The dif-ference in income was larger when focusing only on family households: the median income was $62,358 for families with a native householder and $49,785 for families with a foreign-born householder.
• Themedianincomeforhouse-holds with a foreign-born householder born in Oceania was $71,441, which exceeded the median income of the native
household population and that of households with household-ers born in all other region-of-birth groups. However, among family households, the median income of families with a foreign-born householder from Northern America was the highest at $83,369.
• Themedianincomefor households with a foreign-born householder born in Latin America was $38,238. Considering the areas within Latin America, foreign-born households with a house- holder born in Mexico had the lowest median household
income ($35,254), while those with householders born in South America had the high-est median household income ($49,741).20
• Familyhouseholdswithaforeign-born householder from Europe had a median income ($68,062) that was two-and-a-half times larger than corre-sponding nonfamily households ($27,472), the highest such ratio among the region-of-birth groups.
20 The estimates of median household income of all native households ($50,541) and all households with a householder born in South America ($49,741) are not statistically different.
Figure 16.Median Household Income by Household Type: 2010
Source: U.S. Census Bureau, American Community Survey, 2010.
(Household income in the past 12 months in 2010 inflation-adjusted dollars. Households are classified by nativity and region of birth of the householder. Data based on sample. For information on confidentiality protection, sampling error, nonsampling error, and definitions, see www.census.gov/acs/www/)
All households Family householdsNonfamilyhouseholds
Total
Native
Foreign born
Africa
Asia
Europe
Northern America
Oceania
Latin America
Mexico
Other Central America
South America
Caribbean
1.99
2.04
1.76
1.66
2.13
2.48
2.27
1.68
1.53
1.45
1.38
1.72
2.06
$50,046 $60,609 $30,440
$50,541 $62,358 $30,585
$46,224 $49,785 $28,287
$45,926 $51,587 $31,070
$63,777 $72,114 $33,827
$51,764 $68,062 $27,472
$71,441
$64,095 $83,369
$45,385$76,152
$25,133$38,238 $38,554
$36,668
$35,254 $34,523 $23,767
$41,305 $39,837 $28,791
$49,741 $52,860 $30,707
$39,934 $44,921 $21,817
Family/nonfamily
median income ratio
The median income of foreign-born households was less than that of native households, regardless of household type.
20 U.S. Census Bureau
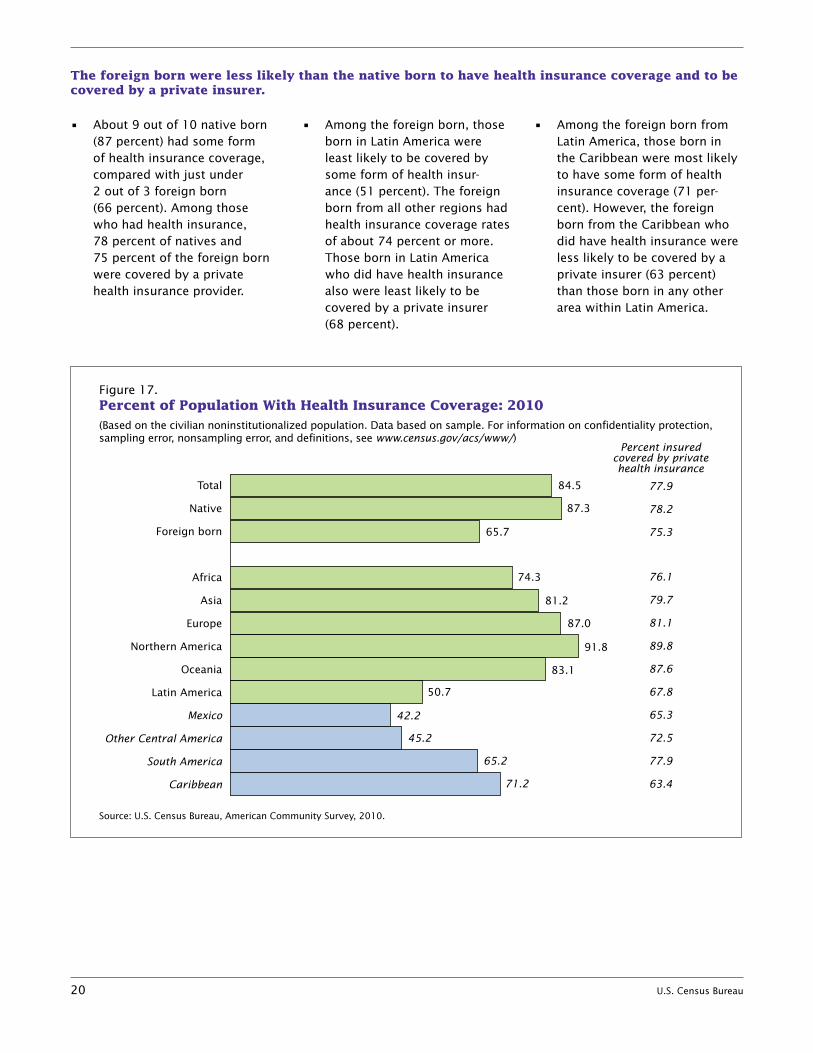
• About9outof10nativeborn(87 percent) had some form of health insurance coverage, compared with just under 2 out of 3 foreign born (66 percent). Among those who had health insurance, 78 percent of natives and 75 percent of the foreign born were covered by a private health insurance provider.
• Amongtheforeignborn,thoseborn in Latin America were least likely to be covered by some form of health insur-ance (51 percent). The foreign born from all other regions had health insurance coverage rates of about 74 percent or more. Those born in Latin America who did have health insurance also were least likely to be covered by a private insurer (68 percent).
• AmongtheforeignbornfromLatin America, those born in the Caribbean were most likely to have some form of health insurance coverage (71 per-cent). However, the foreign born from the Caribbean who did have health insurance were less likely to be covered by a private insurer (63 percent) than those born in any other area within Latin America.
Figure 17.Percent of Population With Health Insurance Coverage: 2010
Source: U.S. Census Bureau, American Community Survey, 2010.
(Based on the civilian noninstitutionalized population. Data based on sample. For information on confidentiality protection, sampling error, nonsampling error, and definitions, see www.census.gov/acs/www/)
Total
Native
Foreign born
Africa
Asia
Europe
Northern America
Oceania
Latin America
Mexico
Other Central America
South America
Caribbean
Percent insuredcovered by privatehealth insurance
77.9
78.2
75.3
76.1
79.7
81.1
89.8
87.6
67.8
65.3
72.5
77.9
63.4
84.5
87.3
65.7
74.3
81.2
87.0
91.8
83.1
50.7
42.2
45.2
65.2
71.2
The foreign born were less likely than the native born to have health insurance coverage and to be covered by a private insurer.
U.S. Census Bureau 21
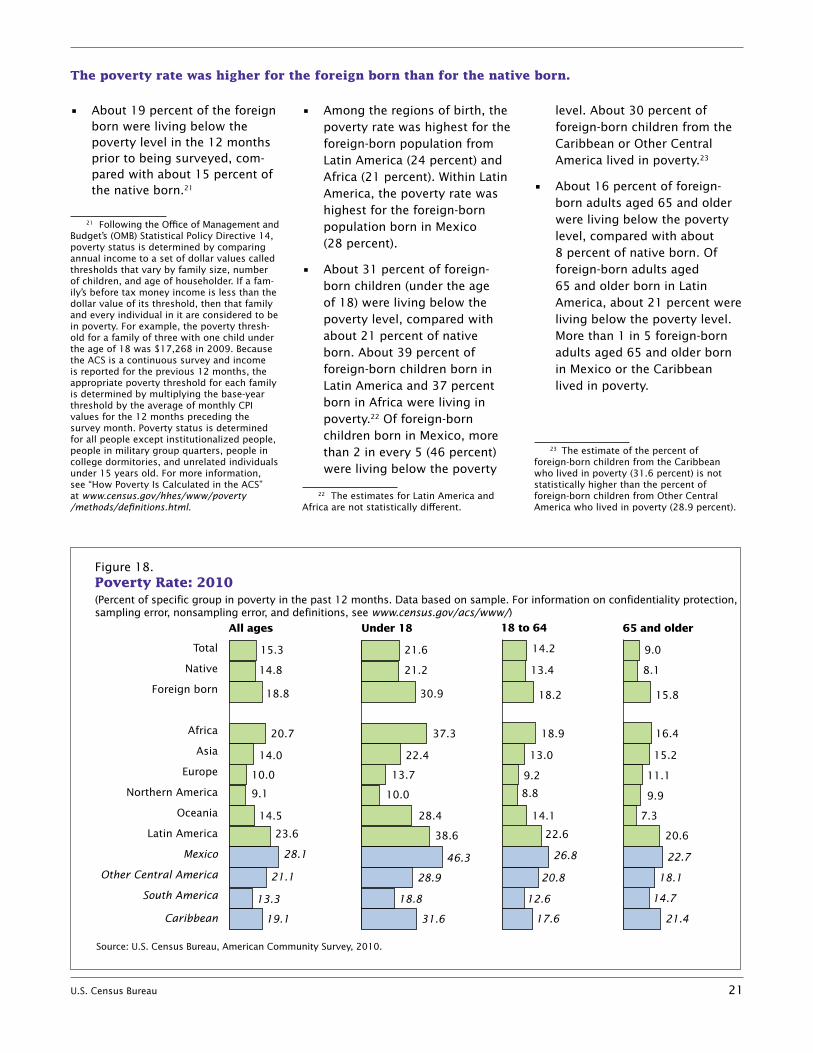
• About19percentoftheforeignborn were living below the poverty level in the 12 months prior to being surveyed, com-pared with about 15 percent of the native born.21
21 Following the Office of Management and Budget’s (OMB) Statistical Policy Directive 14, poverty status is determined by comparing annual income to a set of dollar values called thresholds that vary by family size, number of children, and age of householder. If a fam-ily’s before tax money income is less than the dollar value of its threshold, then that family and every individual in it are considered to be in poverty. For example, the poverty thresh-old for a family of three with one child under the age of 18 was $17,268 in 2009. Because the ACS is a continuous survey and income is reported for the previous 12 months, the appropriate poverty threshold for each family is determined by multiplying the base-year threshold by the average of monthly CPI values for the 12 months preceding the survey month. Poverty status is determined for all people except institutionalized people, people in military group quarters, people in college dormitories, and unrelated individuals under 15 years old. For more information, see “How Poverty Is Calculated in the ACS” at www.census.gov/hhes/www/poverty /methods/definitions.html.
• Amongtheregionsofbirth,thepoverty rate was highest for the foreign-born population from Latin America (24 percent) and Africa (21 percent). Within Latin America, the poverty rate was highest for the foreign-born population born in Mexico (28 percent).
• About31percentofforeign-born children (under the age of 18) were living below the poverty level, compared with about 21 percent of native born. About 39 percent of foreign-born children born in Latin America and 37 percent born in Africa were living in poverty.22 Of foreign-born children born in Mexico, more than 2 in every 5 (46 percent) were living below the poverty
22 The estimates for Latin America and Africa are not statistically different.
level. About 30 percent of foreign-born children from the Caribbean or Other Central America lived in poverty.23
• About16percentofforeign-born adults aged 65 and older were living below the poverty level, compared with about 8 percent of native born. Of foreign-born adults aged 65 and older born in Latin America, about 21 percent were living below the poverty level. More than 1 in 5 foreign-born adults aged 65 and older born in Mexico or the Caribbean lived in poverty.
23 The estimate of the percent of foreign-born children from the Caribbean who lived in poverty (31.6 percent) is not statistically higher than the percent of foreign-born children from Other Central America who lived in poverty (28.9 percent).
Figure 18.Poverty Rate: 2010
Source: U.S. Census Bureau, American Community Survey, 2010.
(Percent of specific group in poverty in the past 12 months. Data based on sample. For information on confidentiality protection, sampling error, nonsampling error, and definitions, see www.census.gov/acs/www/)
All ages Under 18 65 and older18 to 64
Total
Native
Foreign born
Africa
Asia
Europe
Northern America
Oceania
Latin America
Mexico
Other Central America
South America
Caribbean
15.3 21.6 14.2 9.0
8.114.8 21.2
30.9
13.4
15.8
20.7
18.8
37.3
18.2
16.4
14.0 22.4
18.9
15.2
10.0 13.7
13.0
11.1
9.1 10.0
9.2
9.9
14.5 28.4
8.8
7.3
23.6 38.6
14.1
22.7
20.6
46.3
22.6
18.1
28.1
14.7
21.1 28.9
31.6
26.8
13.3
19.1
18.8
20.8
12.6
17.6 21.4
The poverty rate was higher for the foreign born than for the native born.
22 U.S. Census Bureau
SOURCE OF THE DATA AND ACCURACY OF THE ESTIMATES
Data presented in this report are based on people and households that responded to the ACS in 2010. The resulting estimates are repre-sentative of the entire population. All comparisons presented in this report have taken sampling error into account and are significant at the 90 percent confidence level unless otherwise noted. Due to rounding, some details may not sum to totals. For information on sampling and estimation methods, confidentiality protection, and sampling and nonsampling errors, please see the “2010 ACS Accuracy of the Data” document located at www.census.gov/acs/www /Downloads/data_documentation /Accuracy/2010ACS_Accuracy_of _Data.pdf.
WHAT IS THE AMERICAN COMMUNITY SURVEY?
The American Community Survey (ACS) is a nationwide survey designed to provide communities with reliable and timely demographic, social, economic, and housing data for the nation, states, congressional districts, counties, places, and other localities every year. It has an annual sample size of about 3 million addresses across the United States and Puerto Rico and includes both housing units and group quarters (e.g., nursing facilities and prisons). The ACS is conducted in every county through-out the nation, and every municipio in Puerto Rico, where it is called the Puerto Rico Community Survey. Beginning in 2006, ACS data for 2005 were released for geographic areas with populations of 65,000 and greater. For information on the ACS sample design and other topics, visit www.census.gov/acs /www.
FOR MORE INFORMATION
Additional information about the foreign-born population is available on the Census Bureau’s Web site at www.census.gov/population /foreign/.
CONTACT
For additional information on these topics, please call 1-866-758-1060 (toll free) or visit www.census.gov.
USER COMMENTS
The Census Bureau welcomes the comments and advice of users of our data and reports. Please send comments and suggestions to:
Chief, Population DivisionU.S. Census BureauWashington, DC 20233-8800