the foreign aid effectiveness debate: evidence from...
TRANSCRIPT
The Foreign Aid Effectiveness Debate: Evidence from Malawi
Abstract:
Working Paper 6March 2015
Rajlakshmi De and Charles Becker
Understanding the role of foreign aid in poverty alleviation is one of the central inquiries of development economics. To augment past cross-country studies, this paper offers a first step toward addressing the absence of disaggregated estimates of the allocation and impact of foreign aid. Newly geocoded aid project data from Malawi are used in combination with multiple rounds of living standards data to assess the allocation and impact of health aid, water aid, and education aid. Allocation is modeled using living standards variables, geographic indicators, and other aid bundling. Significant, positive effects of health aid on decreasing disease severity and of water aid on decreasing diarrhea incidence were estimated through both IV and PSM difference-in-differences approaches. An appropriate instrument for education aid could not be determined, but propensity score matching methods indicate a potential positive effect of education aid on school enrollment. Different aid donors’ allocation behaviors are also assessed. The aid impact results suggest that a sub-national framework provides sufficient granularity for detecting the impacts of foreign aid on poverty alleviation in Malawi and that policymakers and governments should use geographic living standards information to inform future aid allocation.
Acknowledgement: The views that we express are our own and do not necessarily represent those of the Federal Reserve Bank of New York or the Federal Reserve System. We are grateful for comments and suggestions received at the 7th Annual Southeastern International Development Economics Workshop (Federal Reserve Bank of Atlanta, December 2013) and the Economics Department seminar at the College of William & Mary (November 2014). We thank Kehinde Ajayi, Ariel BenYishay, David Feldman, Lori Leachman, Laura Paul, Felix Rioja, Susan Steiner, Duncan Thomas, Ed Tower, and Elizabeth Wilke for detailed and useful comments. We also thank aiddata.org, the World Bank, and the National Statistical Office of Malawi for the data used in our study. All errors of fault and interpretation remain our own.
Keywords: Foreign aid, Development, Health, Water, Education, Malawi
The views expressed in AidData Working Papers are those of the authors and should not be attributed to AidData, funders of AidData’s work, or to the institutions the authors represent.

Working Paper 6March 2015
Rajlakshmi De is a Senior Research Analyst in the Research & Statistics Group of the Federal Reserve Bank of New York. Her research at the Fed focuses on topics of financial intermediation, including banking growth, reorganization and failure. In particular, she is interested in the intersections of finance, entrepreneurship and international development, and has presented a research paper on the optimal conditions for innovation using data on Kenyan and Ugandan firms at the 9th African Economic Conference in Addis Ababa. She was previously a Research Fellow at Stanford Law School, and graduated High Distinction in Economics from Duke University.
AidData – a joint venture of the College of William and Mary, Development Gateway and Brigham Young University – is a research and innovation lab that seeks to make development finance more transparent, accountable, and effective. Users can track over $40 trillion in funding for development including remittances, foreign direct investment, aid, and most recently US private foundation flows all on a publicly accessible data portal on AidData.org. AidData’s work is made possible through funding from and partnerships with USAID, the World Bank, the Asian Development Bank, the African Development Bank, the Islamic Development Bank, the Open Aid Partnership, DFATD, the Hewlett Foundation, the Gates Foundation, Humanity United, and 20+ finance and planning ministries in Asia, Africa, and Latin America.
The Foreign Aid Effectiveness Debate:Evidence from Malawi
Rajlakshmi DeCorrespondence to: [email protected]
AidDataCorrespondence to:[email protected]
Charles Becker joined the Duke faculty in 2003, where he directed the American Economic Association’s Summer Program and Minority Scholarship Program (2003-2007). He previously taught at the University of Colorado at Denver, Vanderbilt, and CU-Boulder, where he directed the Economics Institute from 1990-96. Becker’s research interests include social security system forecasting, the economics of transition, economic demography, and urban and real estate economics. He has written books on social security reform in Kazakhstan, urbanization in India and in sub-Saharan Africa, the impact of sanctions in South Africa and neighboring countries, and a computable general equilibrium simulation model of India.
Charles BeckerCorrespondence to: [email protected]

Contents
Abstract . . . . . . . . . . . . . . . . . . . . . . . . . . . . . . . . . . . . . . . . . . 1
1. Introduction . . . . . . . . . . . . . . . . . . . . . . . . . . . . . . . . . . . . . . 4
2. Previous Research . . . . . . . . . . . . . . . . . . . . . . . . . . . . . . . . . . 9
3. Theoretical Framework . . . . . . . . . . . . . . . . . . . . . . . . . . . . . . . . 13
4. Data and Background on Aid to Malawi . . . . . . . . . . . . . . . . . . . . . . 16
5. Empirical Specification . . . . . . . . . . . . . . . . . . . . . . . . . . . . . . . 18
5.1 Allocation Models . . . . . . . . . . . . . . . . . . . . . . . . . . . . . . . . . 19
5.2 Impact Models - Instrumentation Methods . . . . . . . . . . . . . . . . . . . 21
5.3 Impact Models - Propensity Score Matching Methods . . . . . . . . . . . . . 23
5.4 Average Treatment Effects . . . . . . . . . . . . . . . . . . . . . . . . . . . . 26
5.5 Varying Aid Effectiveness . . . . . . . . . . . . . . . . . . . . . . . . . . . . 26
5.6 Donor Aid Allocation . . . . . . . . . . . . . . . . . . . . . . . . . . . . . . . 28
6. Conclusion . . . . . . . . . . . . . . . . . . . . . . . . . . . . . . . . . . . . . . . 30
7. Appendix . . . . . . . . . . . . . . . . . . . . . . . . . . . . . . . . . . . . . . . . 32
References . . . . . . . . . . . . . . . . . . . . . . . . . . . . . . . . . . . . . . . . . 44
3

1. Introduction
This paper offers a first, small step in addressing the absence of disaggregated estimatesof the impact of aid on beneficiaries, and in the process suggests an approach that maylead to more systematic assessments of at least a substantial portion - project aid withclearly measurable outcomes - of foreign aid. In contrast to cross-country studies, thissub-national approach stems from the need to assess aid on living standards indicatorsthat are likely to be directly targeted by aid projects, such as disease reduction and in-creases in educational attainment. Employing sub-national variation also should reducethe vast unobservable differences that may be present in cross-country variation. In ad-dition, using disaggregated variation within Malawi allows a less tenuous assumption ofwho is treated versus untreated by aid, compared with the assumptions in studies withoutthis level of granularity.
Newly geocoded aid data for Malawi allow for sub-national variation. Aid projects aresegmented by aid type and geographic administrative boundary and their allocations andimpacts within Malawi are explored through living standards indicators such as diseaseincidence and severity. We also discuss donor allocation strategy. We find non-randomaid allocation models as well as differences between whether donor agencies disburseaid to areas based on the level of poverty. We find evidence for positive impacts of allthree aid types, suggesting that aid plays a useful role in poverty alleviation when it isassessed on the living standards variables targeted directly by the aid type and when theimpact is measured using sub-district granularity. These impacts are economically signif-icant. The average population for our geographic units is 36,000, and our local averagetreatment effects imply that a health aid project of $100,000 increases the economic pro-ductivity of one of these units by 33,000 days of increased economic activity as a resultof less disease burden. We also estimate significant economic impacts of water aid onwater-related diseases – a typical $200,000 project leads to 150 fewer cases of diarrhea,and most likely reduces other water-related illnesses and provides other lifestyle benefitsthrough improved sanitation. We further find that an education project of $150,000 leadsto an additional 300 people attending school at some point in their lives.
Many studies have explored the questions of aid allocation and impact using aggregate,cross-country variation. UNU-WIDER (2014) uses meta-analysis of an array of recent
4

macro-economic studies to find consistent support that aid has a positive average effecton growth. They assert that a sustained aid inflow of 10 percent of GDP can be expectedto raise growth rates by approximately one percentage point on average (p.15). However,the literature skeptical of the value of foreign aid, at least to the poor in recipient coun-tries, is voluminous, damning, and replete with entertaining stories. The most prominentcritic today may well be William Easterly (2002), but the literature began more than halfa century ago, virtually concurrent with the first large scale aid projects (in particular, seeDumont, 1966). Feyzioglu et al. (1998) finds substantial and possibly full fungibility inforeign aid in certain sectors, though this paper is based on data from 1970-1990; sincethen, donors have imposed more restrictions on recipients. Brautigam and Knack (2004)emphasize the increased dependency that results from foreign aid, which is particularlyrelevant because Malawi has the second highest ODA as a share of government expendi-ture in their sample of 27 selected sub-Saharan African countries in 1999. Jackson (2014)uses the response of shared donors to aid neighbors as an instrumental variable and findsno long-run effects of aid on national accounts. Similarly to Brautigam and Knack, Page(2012) warns about the effect of aid on retarding structural change. Yet, establishing thatthere are many ill-conceived and ill-administered projects or that there is massive corrup-tion is not the same as establishing that targeted foreign assistance projects as a classhave zero or negative impacts.
The problems with aggregate estimates are numerous. Obviously, they are very coarse:small projects will be drowned in measurement noise, even if in fact they are highly suc-cessful. Consequently, aggregation levels must be high - but, clearly, not all project aid isremotely alike, nor does all aid have immediate impacts: the idea that education projectswill affect current or near term GDP is completely unfounded, for example. And GDP isoften badly measured. Indeed, even relatively well measured GDP in low-income African,Asian, or Latin American countries is unlikely to respond to gradual health improvements.Not only do these improvements tend to lead to a diffuse set of practices, only a few ofwhich will be captured in near term GDP, but they are likely to be drowned out by fluc-tuations in weather, political disturbances, traded goods’ prices, and a myriad of otherfactors. A finer lens is needed.
At the other end of the spectrum, there has been an explosion of carefully constructedrandomized control trials (RCTs) that examine individuals’ responses to specific interven-tions and, when well conducted, clearly delineate different pathways. Examples of health
5

project assessments include Ashraf and Shapiro (2010; focusing on the use of waterpurification chemicals in Zambia), Bjorkman and Svensson (2009; analyzing community-based monitoring of health staff in Uganda), Cohen and Dupas (2010; analyzing demandfor insecticide-coated mosquito bednets in Kenya), and Kremer and Miguel (2007; ana-lyzing use of deworming drugs in Kenya).
In these cases, the question to arise concerns the extent to which one can generalizefrom the findings. Some projects have huge returns; others have virtually no return at all.Failures can occur because the interventions were ill-conceived, because they were un-sustainable, or because they failed to account for a myriad of interaction effects. However,while demonstrating both potential and also that returns would soar if all projects were onthe frontier, the literature gives little sense as to whether there is a high return to an av-erage project. Doing that requires abstracting over idiosyncratic differences of individualprojects and assessing the average treatment effects of large numbers of interventions.
An intermediate lens is the topic of this paper. Our goals are modest. We seek to identifywhether impacts can be found in a setting of considerable need, and in which effects arefairly readily measurable and attributable. We do not attempt to estimate a social return toall foreign aid, or even to targeted assistance projects in one country during one period,and we do not attempt to estimate losses due to corruption, incompetence, failure to followthrough or to provide for maintenance, or due to poor selection. Rather, we simply seek toestablish a lower bound – that some positive outcomes do appear – and hint at possiblegains due to apparent differential behaviors by different donors.
Malawi is the country of interest in this research for several reasons. It is the first countryto have comprehensive, geocoded data on aid projects. This dataset is compiled by Aid-Data and is publicly available at aiddata.org1. Malawi received 5.3 billion dollars in foreignaid during the aid project data’s time period of 2004 to 2011. The nation’s population andGDP in 2011 were 15.4 million and 5.8 billion dollars, respectively. These figures reflect arelatively small population for a developing nation and aid inflows over eight years that arealmost equivalent to current annual economic output. Together with substantial popula-tion homogeneity and a very large number of administrative units, the combination of high
1Peratsakis, Christian, Joshua Powell, Michael Findley, and Catherine Weaver. 2012. Geocoded Activity-Level Data from the Government of Malawi’s Aid Management Platform. Washington D.C. AidData and theRobert S. Strauss Center for International Security and Law.
6
aid and low population makes Malawi an appealing country in which to attempt to detectan effect of aid from sub-national variation across time. For this project, aid is investigatedthrough three different sub-categories of aid: health aid, water and sanitation aid (whichis referred to simply as water aid), and education aid. The geographic variation in aid allo-cations is based on the administrative boundaries of the 216 Traditional Authorities (TAs)monitored by the National Statistical Office of Malawi. The aid project data were capturedin the Malawi Aid Management Platform (AMP) and geocoded by AidData and CCAPS.Living standards data were taken from the IHS2 and IHS3 rounds of the Malawi LivingStandards Measurement Study (LSMS) from the National Statistical Office of Malawi andthe World Bank2. The timing of these two rounds of living standards data enclose the timeperiod of aid projects, providing before and after snapshots of living standards conditions.
By employing the sub-national model, this study contributes empirical results for the allo-cation and impact of health aid, water aid, and education aid. The allocation models arefound to vary greatly in terms of the relationships with living standards and geographicindicators. However, all aid types have positive relationships with allocations of othertypes of aid, which we use as evidence of aid bundling when it occurs by a single donoragency3. By comparing t0 and t1 conditions between those untreated and treated by aid,
2Malawi 2010-2011 Third Integrated Household Survey and Malawi 2004-2005 Second IntegratedHousehold Survey, conducted as part of the Living Standards Measurement Study – Integrated Surveyson Agriculture (LSMS-ISA) project, executed by Malawi National Statistics Office, and available through theWorld Bank.
3A limitation of our study is that our data are restricted to projects funded under official developmentassistance (ODA) from bilateral and multilateral donors and therefore exclude aid from private voluntaryorganizations (PVOs). This is an inherent limitation of the study that cannot be easily addressed. It ispossible that some official donors incur costs in order to reduce expenditure burdens for PVOs and thatapparent inefficiency in selection and modest returns simply reflects measurement error on our part, sincewe are not capturing the whole benefit. On the other hand, given the very large extent of ODA in Malawi- more than 10 percent of GDP - it seems unlikely that PVOs are comparable in scale, especially on anet basis. Many PVOs receive a large share of their funding by bidding on contracts to implement ODAprojects, in which case the AidData database will include the projects. We do not have a general figure forthe importance of subcontracting, but do note a painstaking effort by Dreher et al. (2012) that finds thatGerman PVOs involved in development assistance receive 39 percent of their funding from public sources.Also noteworthy is the finding by Koch et al. (2009) that NGOs tend to follow the location choices of theirofficial supporters (”backdonors”) and also to cluster with other NGOs. Thus, in a small country like Malawi,it seems likely that most ODA ends up being coordinated with religious bodies.
We can think of no reason to believe that ODA projects are modified to make independent PVO projects”look good”. Nonetheless, an obvious extension to the work here would involve identifying privately fundeddevelopment projects in these areas. A second, comparably thorny issue is that we do not consider possiblecoordination by different PVOs. The authors’ (Becker’s) field experience is that official donors tend to bemutually supportive (when not engaging in turf or prestige wars) and make an effort not to duplicate efforts
7

the impact regressions employ a differences-in-differences (D-i-D) setting using two com-plementary methods – instrumentation and propensity score matching – that account forthe endogeneity of aid allocation. Though both forms of D-i-D identification, instrumen-tation and PSM utilize different mechanisms for reducing endogeneity bias, serving asrobustness checks of the impact estimates. Health aid is found to have a positive im-pact on decreased disease severity and water aid is found to have a positive effect ondecreased diarrhea occurrence. Propensity score matching also provides evidence thateducation aid increases school exposure, but the lack of an appropriate instrument foreducation aid prevents use of the IV method for education aid. The overall importance ofthese empirical results is that not only are these aid types beneficial to poverty alleviation,but that the sub-national granularity in Malawi and using living standards data is a usefulframework for modeling aid.
We also assess whether aid is more effective in areas with lower levels of development.We then analyze different donor organizations - African Development Bank, AustralianAid, EU, GIZ (Germany), Iceland, Ireland, JICA (Japan), KFW Bankengruppe, NORAD(Norway), DfID (UK), USAID, and the World Bank. In this donor analysis, we assesswhich organizations allocate based on need, including after controlling for the possibilityof aid project bundling. Knack et al. (2011) also uses the AidData database to assessthe performance of 38 different bilateral and multilateral aid donors, but on a nationallevel. They use 18 specific measures of selectivity (recipient poverty and governance),alignment (whether or not aid is tied, its predictability, coordination with national strate-gies, and assessment practices), harmonization, and specialization measures that cap-ture fragmentation. In their study, in terms of donors most active in Malawi, the WorldBank rates highest, followed by the UK, Norway, Australia, African Development Bank,Germany, Japan, and, near the bottom, the US. Their poor rating of the US is supported byEasterly and Williamson (2011), who assess the performance of 43 different aid donors.For donors in Malawi, their rankings are as follows, with scores from best to worst: AfricanDevelopment Bank (71), UK (70), Japan (63), Germany (62), World Bank (61), Australia(59), USA (45). Curiously, from our perspective, efficiency at the country level may havelittle relationship to local efficiency of project design, siting, and implementation within a
by deferring to first-comers in terms of locations chosen and project types. However, complete coordinationof activities seems implausible: local aid coordinators report first to superiors back at headquarters, andend up implementing projects that are consistent with a donor’s projects elsewhere and with its prevailing(though oft-changing) ideology.
8

country. Using our disaggregated method, USAID is perhaps the best overall in termsof selecting need-based sites within Malawi. Perhaps this divergence reflects the greaterpolitical considerations of a super-power coupled with greater capacity because of thesize of the US effort.
The rest of the paper is organized as follows: In Sections 2 and 3, previous research isdiscussed and a theoretical framework is established. Sections 4 and 5 describe the dataand empirical strategies. Finally, concluding remarks are provided in Section 6.
2. Previous Research
As noted in the introduction, the current literature lacks a sub-national model that predictsaid allocation or detects impact. However, there is an expansive aid literature studyingboth allocation and impact.
Allocation models have studied cross-country variation to determine the importance ofeconomic needs, policy performance, political considerations, and strategic interests inexplaining aid variation. Alesina and Dollar (2000) find that foreign aid is dictated asmuch by political considerations as by recipient economic needs and policy performance.They find that colonial past and political alliances are major determinants of foreign aid,and on the margin, countries that democratize receive more aid. Alesina and Dollar alsofind significant differences between donor countries in their aid allocation. The Nordiccountries respond more to economic incentives, like income levels, good institutions andopenness. France gives to former colonies tied by political alliances, without much regardto other factors, including poverty levels or choice of politico-economic regimes. TheUnited States’ pattern of aid giving is vastly influenced by interests in the Middle East.
In contrast, Lumsdaine (1993) concludes that the donor country’s humanitarian concernforms the basis of support for aid, not the donor’s political and economic interests. Heintroduces the concept of moral vision wherein the donor nations view themselves asinterdependent with recipient nations. Maizels and Nissanke (1984) use the notion of“strategic foreign policy” to explain patterns of bilateral foreign aid. They also find alloca-tion models to be very different for bilateral and multilateral aid. Multilateral aid appearsto compensate for shortfalls in domestic resources. In contrast, bilateral aid flows are
9

consistent with a model in which aid serves donor political, security, investment and tradeinterests. Kim and Oh (2012) focus their study on South Korea’s aid allocation to 154recipient countries, and find that South Korea provides more aid to higher-income devel-oping countries with higher growth rates. They also find that the relationship between percapita incomes of the recipient country are negatively correlated with aid allocation onlyfor middle-income or lower-middle-income group recipients and is correlated positively forthe rest. No significant differences over decades or political regimes are found.
Understanding aid’s role in poverty alleviation is one of the most central inquiries for devel-opment economists. Despite the importance of the question, economists have not agreedon whether aid policies are useful or destructive in developing economies. Burnside andDollar (2000) conduct a cross-country analysis of the role of good economic policies in aideffectiveness and find that aid has a positive impact on per capita growth in developingcountries with good fiscal, monetary, and trade policies but has little effect in the presenceof poor policies. They employ a modified neoclassical growth model that includes foreignaid receipts. Their policy variables are proxies constructed from the budget surplus, theinflation rate, and an openness dummy developed by Sachs and Warner (1995). Ra-jan and Subramanian (2005) also employ cross-country data and use instrumentation tocorrect for the endogenous allocation of aid to poorer countries, but unlike Burnside andDollar (2000), they do not find evidence for an effect of aid inflows on national economicgrowth, even when economic policies are good. An issue not addressed in this paperis the impact of macroeconomic support (usually tied to fiscal and monetary reforms) aswe focus on a single country; the absence of a visibly positive outcome is highlighted inPrzeworski and Vreeland (2000).
The two investigations by Burnside and Dollar (2000) and Rajan and Subramanian (2005)highlight the large extent of disagreement with regard to aid impact when studied throughcross-country comparisons. In part, this may be because of the difficulty of detecting im-pacts on economic growth rates, which represent many more facets of the economy thanthe bottom of the social pyramid targeted (in principle) by most aid projects. Moreover,foreign assistance is a multi-dimensional vector with potentially long and various lags,further obscuring causal links.
Collier (2006) also reviews the effectiveness of aid, and in particular argues that in theorythe impact of aid could be greater or smaller than windfall gains, due, in particular, to an
10

unanticipated increase in the price of mineral exports. He finds evidence for the oil curseand that, while aid has all sorts of problems, it does tend to have real, positive effectson average. Nonetheless, Collier acknowledges both the popular sentiment that aid isuseless, and the more common academic perspective (with empirical backing) that aid issubject to diminishing returns; he cites 8 percent of GDP as ”the point at which it ceasesto contribute to growth.”
In contrast to cross-country studies, randomized control trials have been able to focusmore on development outcomes and living standards rather than economic growth. Inaddition, their causal interpretation is more direct due to their inherent randomized de-sign. This method has been employed to study various development questions surround-ing issues such as hunger, savings, consumption, and decisions surrounding health andemployment; examples from health studies are noted in the preceding section. As a vari-ation on randomized control trials, Miguel and Kremer (2004) evaluate a Kenyan projectthat treated intestinal helminthes, including hookworm, roundworm, whipworm, and schis-tosomiasis by using the fact that the program was randomly phased into schools. Theyestimate the overall program’s effects to be that it reduced school absenteeism by one-quarter and was far cheaper than alternative ways of boosting school participation. Be-cause they used the random phasing in, rather than a randomized control trial, they wereable to find the effects of externalities as well, such as improved participation amongneighboring schools, also a feature of Kremer and Miguel (2007).
A study by Baranov, Bennett, and Kohler (2012) investigates the indirect impacts of aidprojects in Malawi. In particular, they investigate the impact of antiretroviral therapy (ART)on the indirect variables of the community’s perceptions of mortality risk, mental health,and agricultural labor supply and output. Employing a difference-in-difference identifica-tion strategy, they find that the ART availability substantially reduced subjective mortalityrisk and improved mental health in rural Malawi. However, their study lacks a selectionmodel, and hence makes the assumption that ART allocation is random or exogenous.Furthermore, because their study attempts to answer a question of indirect impact butonly analyzes ART as the exogenous project, there may be a problem of omitted variablebias. Much of the impact they find could be attributed to other simultaneous aid projects,such as other health clinics or rural development programs that may influence subjectivemortality risk and labor force participation. As with RCTs, this study also suffers from nar-rowness: even if the ART project is effective, one cannot generalize that finding to broader
11

aid measures.
Our findings of positive impacts are surprising in many ways. Thirkeldsen (1988) providesa detailed analysis of many foreign aid-funded rural water supply projects in Tanzania. Acentral point is that there is a tradeoff between delivering projects quickly and ensuringcommunity buy-in and ultimate sustainability. Furthermore, while aid agencies fund wells,piping, schools, clinics, roads, and equipment, in many cases they make no provisionfor future maintenance; nor do they ensure that the recipient communities or govern-ments have the capacity to sustain these projects. As Thirkeldsen (1998:15) concludes,“schemes often cease to function soon after being handed over to their users and the Tan-zanian authorities.” In short, aid may fail to have an impact because it is poorly designed,poorly located, fails to meet recipient demands, crowds out private supplies, and becauseit is not designed to be sustainable. Given the range of pitfalls, it is perhaps surprising thatany projects are even slightly successful. From this gloomy perspective, the high reformsidentified for example by Bjorkman and Svensson (2010) are likely anomalous rather thantypical.
Of these limitations, the most difficult to resolve in the context of a low-income country isthat between running fewer projects slowly but while achieving community involvement,which is not a guarantee, and the rapid construction and delivery of projects to meet direneeds. While early development projects were of the latter “control-oriented” (in Thirkeld-sen’s terminology) type, and have been resoundingly criticized, the “adaptive approach” isunlikely to yield quick results. Our empirical work does not identify different approaches,but it does allow us to distinguish among different funders, and hence (in future work)could shed light on the effectiveness of different styles.
It is impossible to assess the effectiveness of investment projects, or of policy measureson economic growth more broadly, without focusing on the quality of governance. It isa theme that permeates Easterly (2002), Calderisi (2006), Martens et al. (2002), andthousands of World Bank and other international financial institution, bilateral aid organi-zation, and NGO documents. As these authors show, governance quality boils down toincentives. In recent decades, incentives and transparency in public sector managementhave improved in many – likely a large majority – of developing and transition economies.If this is indeed the case, then it seems likely that specific projects that might have failed inthe 1980s will be found to alter health, productivity, and education outcomes in the 2000s.
12

Thus, the development aid skepticism of the 1990s and early 2000s may be misplaced:by learning from the failures of earlier projects, and emphasizing key complementary,necessary conditions, contemporary projects may lead to far more positive outcomes.
However, an important implication of this literature is that identifying target sites basedon need may not be optimal. Extremely needy but poorly governed districts may be lessappropriate than less needy but well-governed districts. Still, if aid is visibly linked togovernance, in the longer run aid itself may encourage improved governance in laggingregions. While we cannot assess the strategic effectiveness of linking aid to governance,to some degree we can assess the link between need and impact of outcomes given theway in which aid is currently distributed.
3. Theoretical Framework
Identifying the impact of foreign assistance is not a straightforward task. At the sub-national level, we must search for projects that have (a) reasonably immediate, measur-able outcomes; (b) that do not simply displace private initiatives or domestic governmentspending; (c) that are not confounded with other projects; and (d) that are provided se-lectively rather than ubiquitously. Furthermore, even if one does find candidate items thatmeet these criteria, the task of identifying the manner in which regions were selected fortreatment then emerges.
Schematically, consider a model with t = 1, 2, 3 three periods; three types of exposuree (e1 = private sector or NGO treatment; e2 = government treatment; e3 = foreign aid);n = 1, ..., N different types of projects; and r = 1, ..., R regions. Projects have, in principle,measurable impacts Ie,n,r,t. Then the ideal project m is one in which:
• Ie,m,r,1 = Ie,m,r,2 = 0 (no project in pre-treatment baseline period; project in period 2;measurable impact if any in period 3).
• For some r∗ ∈ {R}, Ie,m,r∗,1 = Ie,m,r∗,2 = Ie,m,r∗,3 = 0. That is, some regions must beuntreated by foreign aid.
• For some η ∈ {e1, e2}, Iη,m,r,1 = Iη,m,r,2 = Iη,m,r∗,3 = 0. That is, regions treated by
13

foreign aid must not be exposed to treatment by other agents (or, strictly, to non-ubiquitous treatment by these agents).
• For other non-ubiquitous treatments n 6= m ∈ {N}, dIe=3,m,r,t=3
dIe,n,r,t=3= 0. That is, there are
no confounding effects from other projects, whether funded by foreign aid or anothersource.
• For other regions ρ 6= r ∈ {R}, dIe=3,m,ρ,t=3
dIe,m,r,t=3= 0. That is, there are no spillover effects
from foreign aid projects into other regions.
It is fairly easy to exclude several types of financial assistance according to these criteria.First, any aid that does not directly raise physical or human capital (including health) isexcluded: this would include humanitarian relief aid, other food aid and donations of con-sumption items, military aid, and direct government budgetary aid or balance of paymentsassistance. Also excluded are longstanding projects that involve multi-year expenditurecommitments. Not only are impacts difficult to determine; it is also possible that the ef-fects of increased local hiring may confound the aid impact. Programs that are national inscope – immunization programs, electricity grids, or free textbook programs, for example– must be excluded as well since there is insufficient regional variation. Large infrastruc-ture projects (airports, dams) also are poor choices both since they are few in numberand since there are likely to be spillover effects. Policy or technical assistance also failsthe tests above since, if successful, all regions are treated.
Given this long list of excluded forms of aid, what might remain? The answer will dependon a country’s level of economic development and the nature and efforts of its governmentand NGOs. The ideal government, from the standpoint of finding an impact, is one thatensures domestic stability but is otherwise fairly indifferent to the welfare of its populace,and which is deeply hostile to both domestic and foreign NGOs. Kleptocracies and mil-itary juntas spring to mind: Myanmar under the generals and before the democratizingreforms, Zimbabwe, and Turkmenistan are all plausible candidates. Very poor countriesare generally good candidates, and Malawi fits this bill, though its government’s concernfor rather than indifference to the welfare of its citizenry is problematic for identificationpurposes.
However, the possibility of expenditures in similar areas by NGOs or national govern-ments is only a modest problem, especially in very poor countries, for two reasons. First,
14

the bias is generally downward – against finding an impact. Second, desperate fiscalsituations often lead governments to abandon entire sectors to NGOs and internationaldonor organizations. This is particularly true in the case of capital expenditures – insofaras governments are involved, they will tend to focus on meeting recurrent needs. More-over, especially in poor, small countries, international donors and NGOs (both domesticand international) tend to collaborate. Indeed, many aid projects are funded by bilateralor multilateral donors, but are contracted to NGOs.
The sorts of projects for which state abandonment in very poor countries and interna-tional donor-NGO collaboration are most readily observed include health and educationprojects. These are the subjects of our study. Water and health projects tend to bedominated by external funders, have overwhelmingly local effects, tend to have fairly im-mediate post-project impacts, and involve little displacement. Outcome measurement isalso straightforward. The same conditions hold, with only slightly greater leakage andgovernment competition, for capital projects in education.
In response to concerns over the problem of fungibility, Collier (2006) notes that whenaid is very large relative to government budgets as is often the case in Africa, fungibilityis reduced at least at the margin - once government funding of the development budgethas fallen to zero, as is the case in some countries, there is simply no further scope forfungibility. This is applicable in Malawi, where aid is a large share of the economy.
There are many policies that can have positive effects that are not measured. Agricul-tural production and marketing programs may be chief among these, but there are oth-ers as well. The key problem is that there are likely many necessary conditions Cm form = 1, ...,M to achieving a measurable boost in an economic objective O, where theseconditions are met in ascending order 1, ...,M . There are likely far fewer (or no) sufficientconditions Sn for n = 1, ..., N to achieving a measurable boost. Thus, while ∂O
∂Sn> 0 and
∂O∂Cm
> 0, conditional on other necessary conditions being met one will empirically observe∂O∂Cm
= 0 for m < M . Yet, it is unreasonable to argue that only activity M and the Sn areuseful. Consequently, the findings in this paper identify a lower bound – there may bemany more types of aid that are extremely valuable (Commins, 1998).
15

4. Data and Background on Aid to Malawi
Malawi is one of the countries in the World Bank’s International Development Association(IDA), which provides assistance for the world’s poorest countries. The Country Policy andInstitutional Assessment (CPIA)4 rates IDA countries’ economic management, structuralpolicies, and public sector management. Using the 2013 ratings, we can determine howMalawi’s administrations compare to other IDA nations. For example, Malawi ranks poorlyin the business regulatory rating, which assesses the extent to which the legal, regulatory,and policy environments help or hinder private businesses. Of the 81 countries in the IDAsample in 2013, only 6 rated lower than Malawi (Eritrea, Angola, Central African Republic,Micronesia, Timor-Leste, and Zimbabwe). In terms of public sector management, Malawiranks in the median of the IDA sample. The public sector management rating involvesproperty rights and rule-based governance, quality of budgetary and financial manage-ment, efficiency of revenue mobilization, and transparency and corruption in the publicsector. In terms of property right and rule-based governance, which measures the extentto which private economic activity is facilitated by an effective legal system, Malawi ranksahead of 57 (of the 81) countries in the sample. Overall, when considering all 20 of thevarious ratings available through the World Bank, Malawi falls slightly below the medianof the IDA countries; 52 of the 81 countries receive better scores.
This project is possible because of recent advancements in data collection and geocod-ing. Two important sources of data are used: aid project data from aiddata.org5 andliving standards data from the National Statistical Office of Malawi. Both sources have ahigh level of geographic specificity. The aid project dataset is based on information cap-tured in the Malawi Aid Management Platform (AMP), hosted by the Malawi Ministry ofFinance. In total, projects from 30 donor agencies were geocoded for 548 projects be-tween 2004 and 2011, representing 5.3 billion dollars in total commitments. This datasetrepresents the first effort to sub-nationally geocode all donors in a single partner country,making it essential for our analysis. However, the aid data are not free from limitations.
4Country Policy and Institutional Assessment, World Bank Group, http://data.worldbank.org/data-catalog/CPIA
5Peratsakis, Christian, Joshua Powell, Michael Findley, and Catherine Weaver. 2012. Geocoded Activity-Level Data from the Government of Malawi’s Aid Management Platform. Washington D.C. AidData and theRobert S. Strauss Center for International Security and Law.
16

The aid project data contain missing values for some geographic coordinates, and someprojects are geocoded but have locations in multiple traditional authorities with only onevalue for cumulative disbursement of aid. Our methodology has been to exclude projectswithout any geographic information, because the empirical analysis is entirely geography-dependent. With regard to the cumulative disbursement figure for projects spanning mul-tiple TAs, we have made an estimate of proportional project allocation by weighting aidproject allocation by TA population size. The assumption inherent with this method is thatif a project spans two TAs, with one having twice the population as the other, and the datado not give detail about how it is divided, our analysis treats the aid as allocated with two-thirds to the large TA and one-third to the smaller TA because it has one-third of the totalproject population. Though this assumption is required, it should not pose major problemsbecause there are many TAs that did not receive any aid. That means the analysis is verymuch driven by a binary presence or absence of aid, and exact allocations among theTAs that received aid are unlikely to dramatically alter findings. Insofar as there is a bias,these assumptions work against finding an impact.
Living standards data were provided by the National Statistical Office of Malawi and theWorld Bank. In particular, two rounds of the Living Standards Measurement Survey(LSMS) are used: the 2nd Integrated Household Survey (IHS2) from 2004-2005 and the3rd Integrated Household Survey (IHS3) from 2010-2011. The living standards data werealready coded by TA boundaries. The survey samples for IHS2 and IHS3 were drawnusing a stratified sampling procedure and included 11,280 households and 51,127 indi-viduals, and 12,271 households and 59,251 individuals, respectively. We rely on the 2008Malawi Census for TA population statistics.
As noted, the per capita aid measurements are calculated on the TA level. These TA-widefigures for aid per capita are merged with living standards data from IHS2 and IHS3 basedon TA boundaries. The amount of living standards data available through the IHS surveysvaries across TAs. The number of individuals surveyed in a particular TA ranges from55 to 1163. Because of variation in data comprehensiveness, we estimate two versionsof the analysis whenever possible, which we refer to as the weighted and unweightedspecifications, abbreviated as w and u, respectively. In the weighted version, the analysisis conducted on the survey-level unit of analysis, such that TAs with more data obser-vations receive greater weight in the regressions. For the unweighted specification, wecollapse the data to one observation per TA. We use both weighted and unweighted ver-
17
sions whenever possible, but Propensity Score Matching methods are not suited for theunweighted form due to small sample size.
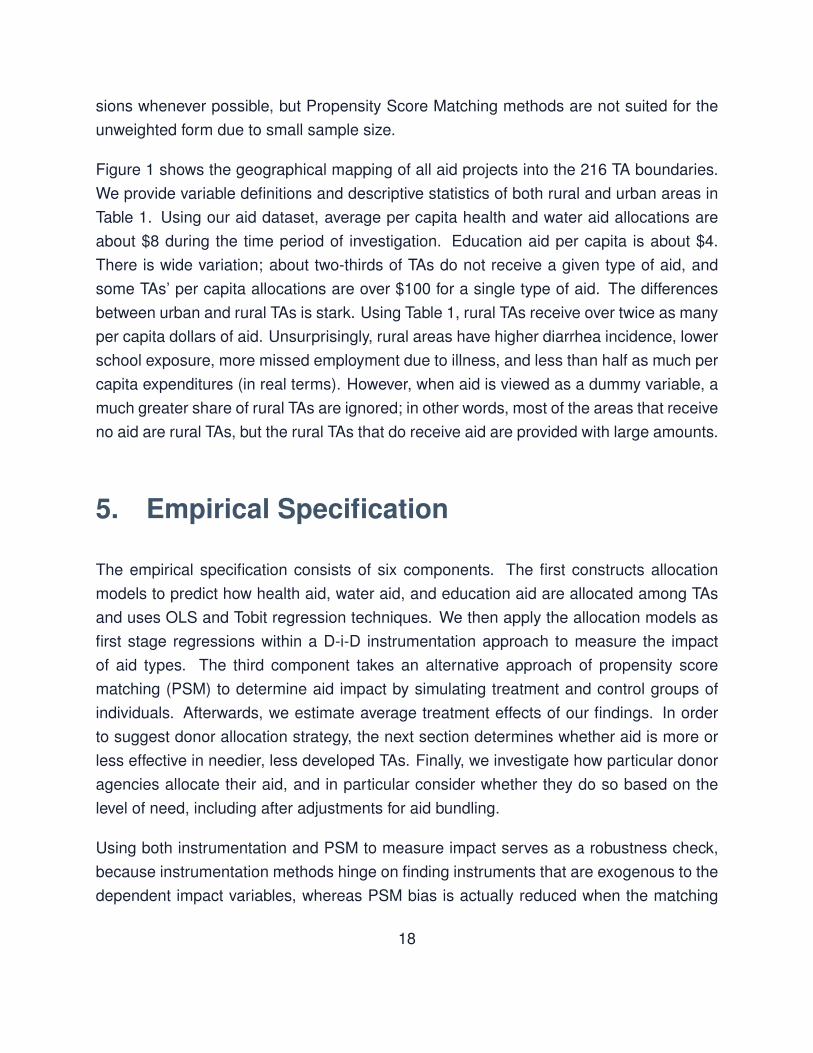
Figure 1 shows the geographical mapping of all aid projects into the 216 TA boundaries.We provide variable definitions and descriptive statistics of both rural and urban areas inTable 1. Using our aid dataset, average per capita health and water aid allocations areabout $8 during the time period of investigation. Education aid per capita is about $4.There is wide variation; about two-thirds of TAs do not receive a given type of aid, andsome TAs’ per capita allocations are over $100 for a single type of aid. The differencesbetween urban and rural TAs is stark. Using Table 1, rural TAs receive over twice as manyper capita dollars of aid. Unsurprisingly, rural areas have higher diarrhea incidence, lowerschool exposure, more missed employment due to illness, and less than half as much percapita expenditures (in real terms). However, when aid is viewed as a dummy variable, amuch greater share of rural TAs are ignored; in other words, most of the areas that receiveno aid are rural TAs, but the rural TAs that do receive aid are provided with large amounts.
5. Empirical Specification
The empirical specification consists of six components. The first constructs allocationmodels to predict how health aid, water aid, and education aid are allocated among TAsand uses OLS and Tobit regression techniques. We then apply the allocation models asfirst stage regressions within a D-i-D instrumentation approach to measure the impactof aid types. The third component takes an alternative approach of propensity scorematching (PSM) to determine aid impact by simulating treatment and control groups ofindividuals. Afterwards, we estimate average treatment effects of our findings. In orderto suggest donor allocation strategy, the next section determines whether aid is more orless effective in needier, less developed TAs. Finally, we investigate how particular donoragencies allocate their aid, and in particular consider whether they do so based on thelevel of need, including after adjustments for aid bundling.
Using both instrumentation and PSM to measure impact serves as a robustness check,because instrumentation methods hinge on finding instruments that are exogenous to thedependent impact variables, whereas PSM bias is actually reduced when the matching
18

characteristics are related to the outcome (Rosenbaum and Rubin 1983). For example,instrumenting Health Aid to find impact on disease severity cannot rely on an instrumentlike diarrhea incidence, because diarrhea incidence may affect disease severity indepen-dently of Health Aid. PSM methods, on the other hand, can successfully incorporate theseconfounding characteristics, but the limitation is that substantial overlap of the matchingcharacteristics is required between treatment and control groups. These criteria are dis-cussed in further detail below, but an important note is the complementarity of the instru-mentation and PSM methods.
5.1. Allocation Models
The per capita aid amounts by TA exhibit clumping at zero due to the nonnegative natureof cost data. As a result, both OLS and Tobit specifications (using both the weightedand unweighted versions of the data) are estimated for aid allocation models. Statisticallysignificant coefficients are found in health, water, and education aid models, indicatingthat aid allocation is nonrandom across Malawi TAs. OLS and Tobit models generallyproduce models with the same signs of coefficients, with the exception of per capita ex-penditure and regional variables, such as Northern and Central, which had different di-rections of influence on aid allocation depending on model specifications. The weightedmodels produce greater levels of statistical significance than the unweighted models, butboth versions always estimate the same signs of coefficients when both are statisticallysignificant.
Our aid allocation models implicitly presume that donors have objective functions that in-crease with (a) likely project impact, and hence target community need, (b) administrativeconvenience, and hence the presence of other projects, as they imply the existence ofaid infrastructure, especially if the projects are complementary and imply knowledge ofa region, as well as trained local staff who can be poached for one’s own projects, and(c) unit costs. Unit costs depend on the same factors as administrative convenience fac-tors mentioned above, but also may depend on an area’s receptiveness to a project. Itis possible that less needy areas are more receptive, an issue we explore in section 5.5.Administrative convenience also may include proximity to major towns; for this reason weinclude regional dummy variables in allocation tables 2-4.
19
The results for health aid allocation are summarized in Table 2. The results of the livingstandards variables are mixed. More health aid is allocated to areas with more schoolexposure and lower diarrhea incidence, both of which indicate higher levels of existingdevelopment. In terms of disease burden, areas with greater proportions of people whohave had to stop employment actually receive less health aid; however, a greater num-ber of employment days lost due to illness is positively related with health aid allocation,which seems appropriate since days lost is a measure of the severity of disease burden.As expected, the number of employment days lost due to illness and proportions of peo-ple who have had to stop employment variables share a strong positive correlation witheach other (0.88) because they are both measures of disease burden; however, includingboth of them allows distinction between many people afflicted by sickness versus peopleafflicted severely for many days. Accordingly, the signs on the variables, when controllingfor one another, may vary within a model. Areas with greater per capita expendituresreceive more health id on the margin. TAs located in Northern and Central Malawi are as-sociated with about 2 dollars less and 5 dollars less, respectively, in per capita aid (meanper capita health aid is 7.42 dollars), whereas the association between urban regions andhealth aid is unclear because the OLSw model produced a significant, negative coefficientwhereas the Tobitw model produced a significant, positive one. Finally, we find evidenceof aid projects being located in similar areas, because the coefficients on water aid percapita and education aid per capita were both positive and significant.
We present the results of water aid allocation models in Table 3. As with health aid, weagain find allocation to be non-random, including the trend that all three types of aid arecorrelated with one another in terms of geographic placement - the health aid per capitaand education aid per capita covariates were significant and positive across all four OLSand Tobit models. In terms of living standards variables, water aid is allocated more to ar-eas that have less exposure to education and greater diarrhea. More water aid goes to ar-eas with greater proportions of people who stop employment due to illness, but allocationis negatively correlated with the average number of days lost due to illness. If waterbornediseases result in short term employment lapses rather than multiple days lost, it may bereasonable to allocate based more on the proportion of people who stopped employmentrather than the number of days lost, though that would seem to require an unusually so-phisticated allocation strategy on the part of donors. The relationship between per capitaexpenditures and water aid is unclear because it varies between OLS and Tobit models.Geographic variables are conflicting in this model despite being statistically significant.
20

As with the other two types of aid, education allocation also exhibits non-random patterns,including positive relationships with health and water aid allocation. In terms of livingstandards variables, more educational aid is given to less educated areas and those withgreater diarrhea. Areas with greater proportions of people stopping employment receiveless education aid, but those with greater numbers of days lost receive more. Per capitaexpenditures are positively associated with education aid. TAs in Northern and CentralMalawi receive more aid than those in Southern Malawi, but the magnitude of this differ-ence is unclear; in the OLSw models the magnitudes are around 1-2 dollars whereas theTobitw models estimate 10 and 12 dollars of extra aid for Central and Northern, respec-tively, where the mean education per capita aid is 4.15 dollars.
5.2. Impact Models - Instrumentation Methods
Instrumentation is one method for overcoming the difficulties of endogeneity within theaid impact process. Instrumental variables (IV) techniques hinge on two assumptions:relevance and exclusion. Relevance was tested through standard first stage regressionsand exclusion was based on both theoretical knowledge–such as not using a diarrheavariable to measure the change in diarrhea incidence–and passing the overidentificationtest. The dependent variables are the changes in living standards for each TA betweentime t0 and t1, such as the change in diarrhea incidence between the two periods. Themethodology is difference-in-difference identification because we compare changes overtime between those who are treated by aid and those who are not, though the measureof aid treatment is a continuous variable of per capita aid allocation, rather than a dummyvariable as is most common in D-i-D studies. In addition, whereas many D-i-D studiesconsider the treatment group to be similar to the control group (due to geographic prox-imity, etc.), we have already shown nonrandom allocation and thus use instrumentation inorder to account for differences in initial conditions.
In these models, it is important to control for other types of aid because of the correlationsdiscussed previously, but the causal estimation can only be applied to the variable thatis being instrumented. For example, in Table 6, water and education are included in theregression because they may have a relationship with the dependent variable, but only
21

health aid is instrumented, so only its coefficient is interpreted causally.6
Table 6 shows results from a D-i-D IV estimation of the causal effects of health aid on thenumber of days lost due to illness in the two weeks before survey data were collected.Using instruments of Northern and Central regional dummies, we find that health aid de-creases disease severity with high statistical significance in the weighted model. For theresults in Table 6, the instruments passed the overidentification test, but when the sameinstruments were used to assess the impact of health aid on the proportion of people whostopped employment in the two weeks prior to survey responses due to illness, theseinstruments failed the overidentification test for exogeneity. It is difficult to understandwhy these regional instruments confound an effect on stopping employment but do notconfound the length of time that an individual stopped employment. The regional vari-ables could potentially be proxies for factors that are more closely associated to diseaseduration. For example, perhaps some of the more severe, long-lasting illnesses occur incertain geographic regions.
We present an estimate for the impact of water aid on diarrhea incidence in Table 7 usingschool exposure and the Central dummy as its instruments. These pass the overidenti-fication test for exogeneity of instruments. Table 7 shows a positive, significant effect ofwater aid on reducing diarrhea disease7. The effects are economically significant as well,as we discuss in section 5.4.
Unfortunately, despite high relevance, none of the covariates could pass the overidentifi-cation tests for Education Aid. This suggests that issues of geography and developmentare linked importantly to educational enrollment, so further research is required to findappropriate instruments for education. However, due to the differing assumptions of PSMmethods, the impact of Education Aid will be explored in the next section.
Overall, the process of instrumenting aid is tenuous at best. It is likely that any factorsthat one can conjure as predictive of aid allocation are accompanied by some theoretical
6For robustness we also estimate the IV models without other covariates int he Appendix section. Wefind similar results, except that the overidentification test for exogeneity of instruments fails, suggesting thatthe instruments may affect the outcome variable through other aid channels; it is important to control forthem.
7For robustness, we estimate the IV models with all urban areas removed, presented in the Appendix;results are similar but overidentification tests fail.
22

link through which the factor affects aid effectiveness as well, undermining the instrumen-tation assumptions. Dollar and Levin (2005) use various instruments for aid: share of thepopulation speaking English, share speaking a continental European language, distancefrom the equator, level of population, and each of the above multiplied by population. Eventhese careful instruments may threaten the exclusion principle of instrumentation; Englishor European language skills may facilitate growth for reasons of international businessor attracting foreign investment, distance from the equator may affect GDP through cli-mate, and population has a myriad of channels through which it affects national accounts- employment, economies of scale, demography, structural transformation, to name a few.Due to the difficulty of appropriate instruments, the question of aid impact may be bettersuited by methods such as Propensity Score Matching, which we discuss below.
5.3. Impact Models - Propensity Score Matching Methods
Propensity Score Matching is a separate method for assessing causality within obser-vational data. Because its assumptions are modeled differently than those for IV, thesePSM tests serve as robustness checks for the IV method. In Propensity Score Matching,confounding characteristics that both affect aid allocation and living outcomes are usedas matching characteristics between individuals who receive aid and those who do not.These matching characteristics are converted to a Propensity Score for each individualand treated individuals are compared to untreated individuals with the nearest PropensityScore.
Overall, the use of PSM in our context is a form of difference-in-difference identificationstrategy. The natural treatment is whether an individual’s TA received aid, and treatedindividuals are compared to individuals who are untreated but who have similar initialconditions in time t0 (by using the matching attributes), and the dependent variable isthe change in health or educational outcomes between t0 and t1. This before and aftersnapshot allows us to account for initial conditions by tailoring the untreated counterfactualgroup such that it is similar to the treated aid recipients. As a result, we can attribute thedifference between treated and untreated over time to the effects of aid.
Because PSM is a method for treatment and control groups, aid is converted to a dummyvariable where Health Aid=1 if any health aid was received and Health Aid=0 if none was
23
received. The same specification is used for Water Aid and Education Aid. Therefore,these average treatment effect estimates will not be directly comparable to the IV marginaleffect estimates, but the signs of impact should be consistent.
An important requirement for PSM is that the treatment and control groups’ matching at-tributes need to contain significant overlap, yet these matching attributes still need to pre-dict the treatment condition. The first step is therefore to find a specification of matchingattributes that both predicts aid allocation and is somewhat balanced between individualswho have both received and not received aid. Our results previously discussed in theallocation models showed that the neediest regions are not the only places receiving aid;this works to our advantage in estimating impacts through matching techniques. Table 8shows the Probit regression for matching characteristics that fulfill the balancing propertyfor Health Aid. It is especially important to include Water Aid because of the possibil-ity that Water Aid may affect decreased days lost due to illness, which is the dependentvariable for Health Aid impact.
Once the balancing property is satisfied, each treated individual is matched to an un-treated individual while minimizing the differences in Propensity Scores between matchedindividuals. This is referred to as nearest neighbor matching, where neighbor refers to in-dividuals with very similar Propensity Scores. In the case of Health Aid, individuals withsimilar Water Aid and Stopped Employment (the matching attributes) but different alloca-tions of Health Aid are matched with each other to find the average treatment effect. Table9 presents the results of the PSM for Health Aid treatment on days lost, the number ofdays in the past 2 weeks spent unable to work, due to disease. Whereas the IV estimatessignified a marginal effect per dollar of per capita aid, the PSM estimates need to be in-terpreted as the average effect of aid for those who received it compared to those who didnot. The Table 9 estimate therefore indicates that Health Aid, on average, causes 0.035fewer days lost every 2 weeks due to illness, which corresponds to 0.91 days per personper year of increased productivity in areas that receive health aid compared to those ar-eas that do not. The Stopped Employment variable is very well suited for inclusion in themodel. This is because we want to simulate direct comparisons between TAs that havesimilar rates of people who are too sick to work, and then exploit variation in Health Aid todetermine the differential effects on the number of days lost due to illness.
Table 10 presents the matching attributes, health aid and days lost to illness, used for
24

water aid impact. In Table 11, we present the causal estimate, finding that water aid de-creases diarrhea incidence with an average treatment effect of 0.004. Though this seemsrather low for an average treatment effect, average levels of diarrhea incidence are alsovery low because they only represent incidence in the last 2 weeks before survey datawere collected. The average diarrhea incidence for TAs is 0.019, so the average effectof 0.004 indicates a 21 percent decrease in diarrhea rates and is therefore economicallysignificant. We also expect other water-related diseases to decrease, so diarrhea amelio-ration is only one (easily measured) form of impact of water aid.
The impact of Education Aid could not be estimated in the IV model since no instrumentspassing the overidentification tests for exogeneity. However, PSM methods can be appliedto endogenous matching characteristics. In fact, PSM bias is actually reduced when thematching characteristics are related to the outcome (Rosenbaum and Rubin 1983). Table12 presents the Probit regression for Education Aid in which Water Aid, Health Aid, Urbanand Stopped Employment were used as the endogenous matching attributes to fulfill thebalancing property.
The impact of Education Aid is estimated on Increased School Exposure, where SchoolExposure is the proportion of the TA that has ever attended school. Table 13 presentsthe result of the Propensity Score Match and finds a positive impact of Education Aid onexposure to schooling and is significant at p<0.10. Though there is no IV estimate tocheck for the robustness of this estimate, the PSM results alone suggest that receivingEducation Aid causes an average treatment effect of 0.009 increase in school exposure,which considering that average TA population is 36,000 people, corresponds to 324 extrapeople receiving exposure to school for an average-treated TA. If this is representativeof the actual effect of education aid, it may suggest an important economic significancethrough more people gaining access to literacy and growth of human capital.8
8We attempted specifications that incorporated expenditures per capita as a matching attribute, to controlfor income levels, but these specifications failed the balancing criterion for all aid types. We also presentspecifications with all urban areas removed in the Appendix. Interestingly, the positive effects of water aidand education aid are amplified, whereas the positive effect of health aid reverses to become a negativeone.
25

5.4. Average Treatment Effects
Using the average treatment effect estimates from propensity score matching, we canestimate how economically large these impacts are, based on average TA populationsizes, average aid allocations in treatment areas, and average project size (in dollars). Anaverage health project is $88,373, which leads to 0.91 fewer work days lost due to illness,per person per year. Given that an average TA is 36,000 people, this corresponds to32,760 extra days of economic productivity for a single TA per year during the duration ofthe aid effect. Water projects are somewhat larger–the average size is $229,194, leadingto 144 fewer cases of diarrhea. That effect alone would be costly; it would cost over$1500 per case of diarrhea averted. However, it is extremely likely that if diarrhea is beingameliorated by water aid, that there are real economic benefits from reductions in otherwater-related diseases, as well as lifestyle benefits of improved sanitation, such as betternutrition. Finally, we estimate that an extra 324 people receive educational exposure,defined as having attended school at some point, for an average sized educational aidproject of $160,792. Similar to water aid, educational aid most likely also affects othermetrics in addition to our indicator for school exposure. School exposure measures theproportion of a TA that has ever attended school, whereas educational aid may be bettermeasured on indicators of quality or duration of education, rather than simple exposure.
5.5. Varying Aid Effectiveness
Overall, we have found evidence for positive effects of health, water, and education aid ontheir respective targeted outcomes. Are these positive effects ubiquitous, or do they varybased on how developed an area is? Dollar and Levin (2006) explore determinants ofthe allocation of foreign aid across countries during the period 1984-2003, and during thisperiod there was a dramatic change: the emphasis on providing aid to the poorest (oftendysfunctional, undemocratic, corrupt, and ill-governed in other ways as well) countriesshifted to those with better governance and more democratic institutions. This changereflects empirical evidence that the impact of aggregate aid is greater when recipientgovernments are more competent and democratic, open, and less repressive. Their paperdocuments the change for a large number of multilateral and bilateral donors using pooledTobit regressions. The multilaterals in their study for the most recent (2000-2003) period
26

seemed less concerned about democracy and governance than most; the US and UKwere most concerned about democracy, followed by Germany and Japan, then Norway,and then Australia. Rule of law mattered the most to Germany, followed by Norway andAustralia; it did not matter to the others. Poverty (low GDP per capita) mattered most to theAfrican Development Fund, then to the US, UK, and Norway, followed by Japan, Germany,and Australia in that order; the IBRD (World Bank) coefficient was not significant.
The question of whether to allocate based on highest need (higher poverty) versus bettergovernance and institutions (most likely, lower poverty) hinges partly on where aid is moreeffective. In order to investigate varying levels of effectiveness, we stratify the populationin terms of more developed and less developed areas and re-run the impact specificationsto check for differences. For example, with regards to health aid, the less developed areasare those with greater-than-average number of days lost due to illness. For water aid, lessdeveloped areas are those with higher-than-average diarrhea incidence, and for educationaid, it is areas with lower-than-average school exposure.
The results are summarized and compared to our original baseline results in Table 14.Health aid and education aid are more effective in less developed areas. Water aid isless effective in less developed areas, perhaps because of greater remoteness or lack ofnecessary complementary factors. For health and education aid, these results signify thatthe optimal strategy for donors is to allocate based on need, because the needier regionsare also the areas with greater effectiveness. In the case of water aid, we still suggestallocating based on need, despite some evidence that the returns in needier regions maybe less than more developed areas. If aid is visibly linked in part (though not fully) toimproved outcomes, in the longer run, allocating based on need can improve laggingareas such that they reach a higher level of aid effectiveness as they develop strongerinfrastructures and capacities.
Collier and Dollar (2002) estimate how aid would be reallocated across countries if povertyreduction were the sole rationale for providing foreign aid. They note that aid is allocatedinefficiently with respect to poverty alleviation because is is partly used as an inducementto policy reform and partly for a variety of historical and strategic reasons (p.1497). Usingour estimates, allocating health aid based on need would lead to an additional 9,360days of productivity annually for an average TA of 36,000 people due to reduced diseaseburden, about a 30 percent gain over the local average treatment effect. An average TA
27
would see a boost of an additional 4,752 people receiving exposure to school if educationaid were allocated purely based on need. This is not surprising, given that the TA withthe lowest school exposure had only 16 percent of its population that had ever attendedschool. It also points to the far greater effectiveness of health aid: potential efficiencygains from better-sited education projects would reach an order of magnitude more peoplethan the average actual treatment effect indicate.
5.6. Donor Aid Allocation
Rao (1997) explores the extent to which foreign aid is provided based on apparent need asdefined by per capita income differences. This paper has information from, in most cases,annual aid flows for 1970-1993 from 18 countries plus the IBRD and IDA componentsof the World Bank. Clearly, not all aid goes to the neediest places, and there is also asubstantial difference in aid-to-the-poorest from the top ranked country (usually Denmark)and the lowest ranked country (after 1975, generally the United States).
The AidData dataset for our paper contains information about which donor country ororganization funded each aid project. In order to analyze efficiency of donor allocation,we estimate two models for each donor. In one model, we regress per capita aid on thepertinent living standards variable; for example, health aid per capita versus the percent ofthe population that stopped employment due to illness. In the second model, we accountfor the presence of aid bundling by including a variable that represents all of that donor’sother aid allocations within a TA. Our rationale for the second model is that donors canmaximize resources by bundling multiple aid projects in one place, so we investigatewhether aid is going to the neediest regions after controlling for the donor’s other aidefforts in the region. Both models are estimated using both the weighted and unweightedversions of the data for robustness checks.
Table 15 shows the results of donor analysis on health aid allocation. Because the re-lationship of interest is between health aid allocation and disease severity, we considerpositive relationships to be more desirable, because they indicate higher health aid allo-cation to TAs with more severe disease burden, where disease severity is measured bythe proportion of people who stopped employment due to illness. In terms of overall allo-cation, GIZ (Germany), KFW Bankengruppe (also Germany) and USAID show desirable
28

allocation in the weighted models, whereas the African Development Bank, EU, Iceland,JICA (Japan), NORAD (Norway), and DfID (United Kingdom) have the opposite relation-ship - more aid is allocated to areas with less severe diseases. Almost half of the donorsshow evidence of aid bundling. Even after controlling for aid bundling, African Develop-ment Bank, EU, Iceland, JICA (Japan), NORAD (Norway), and DfID still allocate in theundesirable direction. USAID presents an interesting example because before controllingfor aid bundling, allocation seemed to be towards the needier areas. Once aid bundlingis controlled for, USAID allocation changes signs. This means that given two areas withequal amounts of other USAID aid, the less needy TA is more likely to get health aid onthe margin, which is not optimal. Most of the unweighted models do not produce statisticalsignificance on the percent stopped work variable, though some have significance on theaid bundling variable. The lack of significance in the unweighted versions indicates thatnone of the donors allocate with enough non-randomness to be detectable when each TAis unweighted down to one data point. Large TAs may be the ones that are exposing thedirection of statistical significance in the weighted version of the data.
Table 16 shows the results of the analogous analysis on water aid allocation with respectto diarrhea incidence. Positive relationships are again desirable, indicating higher aidfor regions with high diarrhea illness. Water aid allocation appears to be fairly efficient,with DfID, USAID, and the World Bank all allocating in the positive direction. AustralianAid, EU, and JICA (Japan) allocate undesirbly. Australian Aid only allocated to water aid,so it cannot be checked against aid bundling. African Development Bank is especiallyinteresting because it allocates randomly, but when controlling for aid bundling, allocatesin the desirable direction.
Table 17 displays results from the donor analysis on education aid allocation with respectto percent school exposure, which is the percentage of a TA’s population that has everattended schooling. Signs have the opposite interpretation for this analysis comparedto those for health and water aid. We consider negative relationships to be desirable,indicating that education aid goes to TAs with the least exposure to education. The resultsare mixed; African Development Bank, GIZ (Germany), and USAID all have the desirableallocation direction in the simple allocation model. Iceland, Ireland, JICA (Japan), DfID(UK) and the World Bank have the opposite sign, but the magnitudes of their coefficientsare much smaller than those of the desirable donors. Interestingly, once aid bundling isaccounted for, the significance on the USAID coefficient is eroded, meaning that given two
29

TAs with equal other aid allocation, education aid is allocated randomly with regards toschool exposure rates. Examination of specific TAs shows that there are very unbalancedareas. TA Mphuka in the Thyolo District had the lowest school exposure - only 16 percent,whereas the next lowest was much higher at 42 percent and with most TAs between 60to 80 percent. Despite being an outlier, Mphuka did not receive any education aid in theaid data set.
We have attempted a simple analysis of donor aid allocation, but in reality the model maybe much more complex. In addition to controlling for aid project bundling, as we havedone, it may be important to control for patterns across time. A donor may choose toallocate an aid project based on which sub-districts have not recently received exposurefrom other donor organizations. Rather than allocating to the neediest region, for exam-ple, an optimal donor allocation strategy may be to allocate to the neediest region that hasthus far been ignored. Investigating this question of first mover and second mover donorstrategies will require greater attention to the time dimension of the data. The time dimen-sion should also be employed to investigate the effects of aid over time. We address bothof these analyses in a subsequent paper.
6. Conclusion
Through a sub-national analysis of Malawi, we find that aid allocation models vary greatlyacross type of aid. Evidence of positive causal relationships between aid and living stan-dards also emerges. In particular, Health Aid reduces disease severity, Water Aid reducesdiarrhea illness, and Education Aid increases school exposure. These rather obviousseeming statements reveal one of the important aspects of the methodology used here:if the impact of aid is being investigated, the living standards variables most targeted byaid projects are the ones that should be modeled. Greater data availability can allow thisshift from cross-country macroeconomic investigations to sub-national living standardsinquiries.
One of the arguments against foreign aid is that the resources fund corruption and do notimpact poverty variables such as health and education. Easterly (2002) provides expla-nations for why foreign aid fails in many situations, such as mechanism design failures,
30

principal-agent problems, lack of coordination, warped incentives for host countries, ex-cessive bureaucracy, and unsustainable demands on host country skilled labor. Unfortu-nately, our methodology cannot validate or reject these hypotheses nor assess how muchof the aid projects are actually given to their intended recipients rather than siphoned offby corruption or bureaucracy, and in fact it is clear that many projects are not well tar-geted. However, our results do suggest that resources on the whole are being funneled topoverty efforts because the overall impact can be detected across time when controllingfor the endogeneity of aid allocation. Policymakers should attempt to design aid policiesthat are dependent on living standards data for all three of these aid categories: healthaid should be concentrated where diseases are burdening people beyond the capacity toattend to employment, water aid should be reallocated towards high diarrhea regions, andeducation aid should be funneled to the areas with the least exposure to schools.
Goal 1 of the Millennium Development Goals is to reduce extreme poverty, and projectionsused by the United Nations indicate that almost one billion people will still be living onless than 1.25 dollars per day in 2015 (United Nations). Overcoming poverty is also oneof the major goals for many different disciplines that are concerned with the economic,ethical and humanitarian implications of global suffering. However, this is an exciting timefor development economists to identify effective approaches to poverty reduction. Sub-national modeling should be further explored as a means for understanding the intricaciesof development while maintaining external validity for an entire nation. Malawi’s next roundof living standards data will contain panel observations linked to IHS3 and provide aneven stronger basis for assessing the impacts of various aid types, and as data becomeavailable for other nations’ aid projects, sub-national analyses should be employed toassess foreign aid around the world.
31
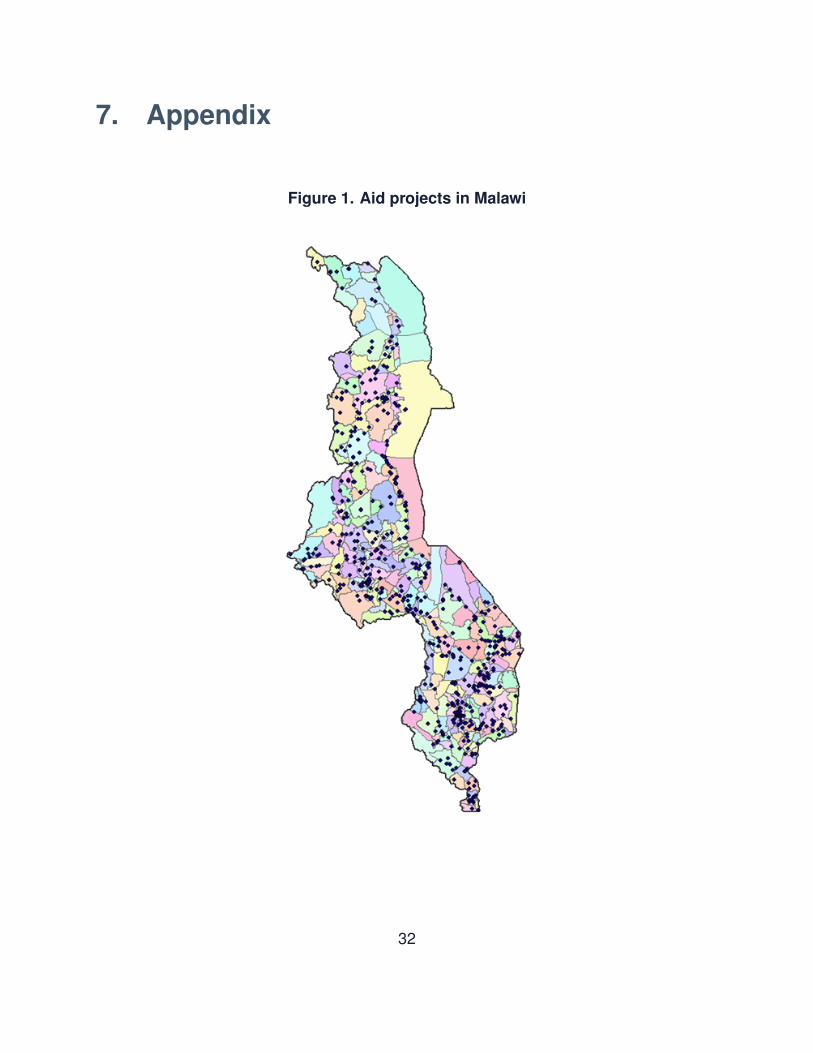
7. Appendix
Figure 1. Aid projects in Malawi
32

Table 1. Variable names and descriptive statisticsName Description Source Overall Urban RuralPer capita health aid health aid per per-
son, in USD, for agiven TA
aiddata.org andCensus data
$7.42(23.72)
$2.67(3.09)
$8.04(25.12)
Per capita water aid water and sanitationaid per person, inUSD, for a given TA
aiddata.org andCensus data
$8.85(25.28)
$1.26(0.66)
$9.82(26.70)
Per capita educationaid
education aid perperson, in USD, fora given TA
aiddata.org andCensus data
$4.15(13.07)
$1.89(1.26)
$4.44(13.86)
Diarrhea incidence the proportion of aTA that reports di-arrhea illness in thepast two weeks
LSMS 0.02(0.01)
0.01(0.01)
0.02(0.01)
School exposure the proportion of aTA that reports hav-ing ever attendedschool
LSMS 0.77(0.12)
0.92(0.06)
0.76(0.12)
Stopped employment the proportion ofa TA that had tostop employment atsome point duringthe past two weeksdue to illness
LSMS 0.15(0.07)
0.08(0.05)
0.16(0.07)
Days lost the average num-ber of days per per-son, for a given TA,of stopped employ-ment due to illnesswithin the past twoweeks
LSMS 0.68(0.38)
0.38(0.29)
0.72(0.37)
Expenditure PerCapita
the average real ex-penditures (Malaw-ian Kwacha) perperson, for a givenTA, calculated fromhousehold expen-ditures and wherechildren under 15and adults over 80are given reducedweightage of 0.8
LSMS 22073(12689)
41327(28100)
19589(5092)
Northern dummy variable forthe northern regionof Malawi
LSMS 0.16(0.37)
0.18(0.38)
0.16(0.37)
Central dummy variable forthe central region ofMalawi
LSMS 0.41(0.49)
0.31(0.46)
0.42(0.49)
Urban dummy variable forurban TAs of Malawi
LSMS 0.11(0.32)
1.0(0.0)
0.0(0.0)
Health Aid (PSM) dummy variable forTAs that receivedany health aid
aiddata.org 0.33(0.47)
0.88(0.33)
0.26(0.44)
Water Aid (PSM) dummy variable forTAs that receivedany water aid
aiddata.org 0.31(0.46)
0.88(0.33)
0.24(0.43)
Education Aid (PSM) dummy variable forTAs that receivedany education aid
aiddata.org 0.22(0.42)
0.88(0.33)
0.14(0.35)
33

Table 2. Health aid allocation modelsOLSw Tobitw OLSu Tobitu
School Exposure 9.734*** 38.832*** 12.440** 60.840*(0.313) (1.421) (5.986) (31.724)
Diarrhea Incidence -44.361*** -0.748 25.843 165.056(3.570) (13.608) (53.550) (186.838)
Stopped Employment -36.324*** -189.028*** -39.036 -160.354(1.796) (7.111) (31.420) (104.859)
Days Lost to Illness 8.243*** 22.379*** 9.579 23.938(0.482) (1.351) (8.848) (21.767)
Expenditure Per Capita 3.83e-5*** 7.77e-5*** 5.13e-6 1.47e-5
(2.15e-6) (5.43e-6) (2.91-5) (6.67e-5)Northern -2.022*** -1.370* 0.469 0.934
(0.315) (0.701) (5.551) (10.133)Central -5.897*** -6.377*** -4.159** -6.893
(0.117) (0.297) (1.656) (5.000)Urban -4.364*** 9.087*** -2.954* 18.969**
(0.121) (0.431) (1.644) (8.732)Water Aid 0.272*** 0.503*** 0.254 0.457
(0.008) (0.013) (0.199) (0.278)Education Aid 0.992*** 1.259*** 0.915*** 1.391***
(0.014) (0.015) (0.309) (0.331)Constant -3.540*** -43.379*** -7.592 -74.473**
(0.295) (1.513) (6.373) (36.580)Notes: *** indicates 1 percent significance; ** indicates 5 percent; * indicates 10 percent. Robust standard
errors are employed.
34

Table 3. Water aid allocation modelsOLSw Tobitw OLSu Tobitu
School Exposure -3.057*** -30.080*** -4.450 -31.584*(0.392) (1.300) (4.323) (16.071)
Diarrhea Incidence 39.884*** 44.914*** 10.361 -1.942(2.964) (13.552) (27.017) (113.389)
Stopped Employment 71.365*** 269.471*** 34.793 134.696(1.927) (8.024) (25.731) (92.949)
Days Lost to Illness -19.697*** -79.2151*** -9.295* -35.114*(0.485) (2.005) (5.443) (20.028)
Expenditure Per Capita -2.63e-5*** 6.07e-5*** -2.95e-6 -4.08e-6
(2.5e-6) (6.08e-6) (2.96e-5) (5.64e-5)Northern -3.727*** 0.599 -1.089 3.129
(0.241) (0.624) (3.358) (7.987)Central -0.532*** 16.352*** -0.581 7.169
(0.136) (0.416) (1.863) (5.352)Urban -3.327*** 32.004*** -2.702 29.876***
(0.139) (0.508) (1.654) (6.829)Health Aid 0.319*** 0.569*** 0.156* 0.335***
(0.009) (0.008) (0.081) (0.085)Education Aid 1.042*** 1.516*** 1.392*** 1.849***
(0.017) (0.021) (0.257) (0.346)Constant 8.224*** -4.693*** 6.142* -5.580
(0.292) (0.960) (3.602) (11.637)Notes: *** indicates 1 percent significance; ** indicates 5 percent; * indicates 10 percent. Robust standard
errors are employed.
35
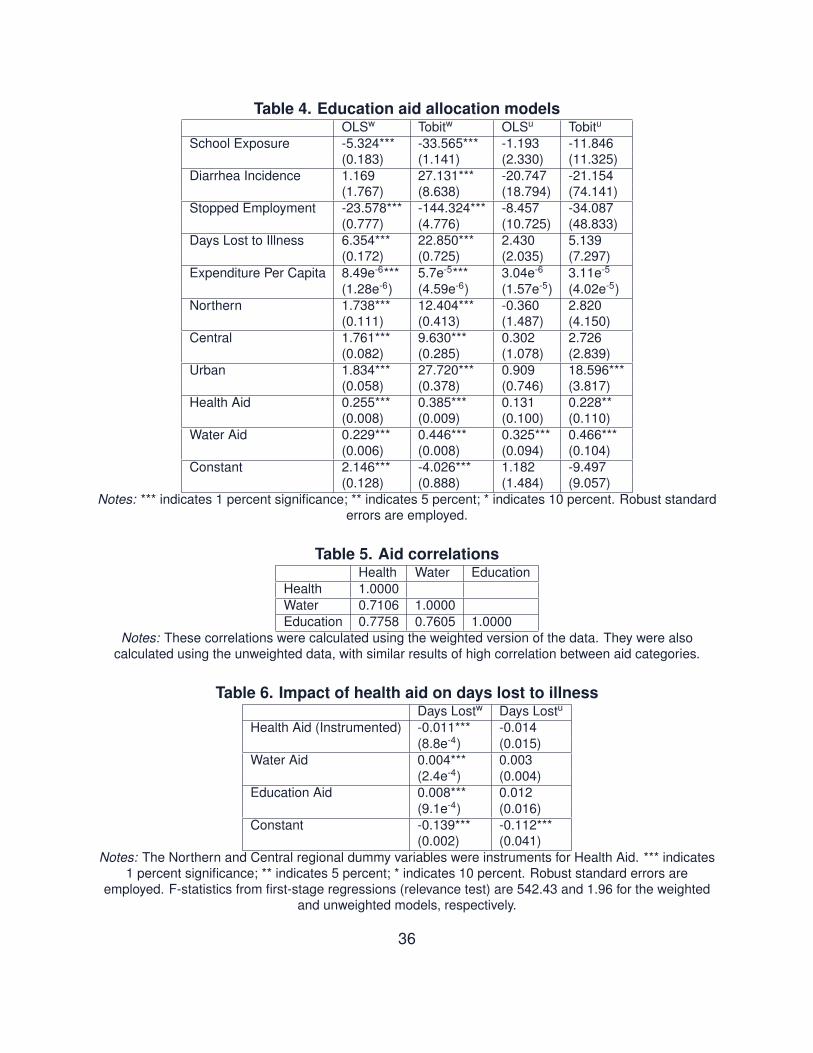
Table 4. Education aid allocation modelsOLSw Tobitw OLSu Tobitu
School Exposure -5.324*** -33.565*** -1.193 -11.846(0.183) (1.141) (2.330) (11.325)
Diarrhea Incidence 1.169 27.131*** -20.747 -21.154(1.767) (8.638) (18.794) (74.141)
Stopped Employment -23.578*** -144.324*** -8.457 -34.087(0.777) (4.776) (10.725) (48.833)
Days Lost to Illness 6.354*** 22.850*** 2.430 5.139(0.172) (0.725) (2.035) (7.297)
Expenditure Per Capita 8.49e-6*** 5.7e-5*** 3.04e-6 3.11e-5
(1.28e-6) (4.59e-6) (1.57e-5) (4.02e-5)Northern 1.738*** 12.404*** -0.360 2.820
(0.111) (0.413) (1.487) (4.150)Central 1.761*** 9.630*** 0.302 2.726
(0.082) (0.285) (1.078) (2.839)Urban 1.834*** 27.720*** 0.909 18.596***
(0.058) (0.378) (0.746) (3.817)Health Aid 0.255*** 0.385*** 0.131 0.228**
(0.008) (0.009) (0.100) (0.110)Water Aid 0.229*** 0.446*** 0.325*** 0.466***
(0.006) (0.008) (0.094) (0.104)Constant 2.146*** -4.026*** 1.182 -9.497
(0.128) (0.888) (1.484) (9.057)Notes: *** indicates 1 percent significance; ** indicates 5 percent; * indicates 10 percent. Robust standard
errors are employed.
Table 5. Aid correlationsHealth Water Education
Health 1.0000Water 0.7106 1.0000Education 0.7758 0.7605 1.0000
Notes: These correlations were calculated using the weighted version of the data. They were alsocalculated using the unweighted data, with similar results of high correlation between aid categories.
Table 6. Impact of health aid on days lost to illnessDays Lostw Days Lostu
Health Aid (Instrumented) -0.011*** -0.014(8.8e-4) (0.015)
Water Aid 0.004*** 0.003(2.4e-4) (0.004)
Education Aid 0.008*** 0.012(9.1e-4) (0.016)
Constant -0.139*** -0.112***(0.002) (0.041)
Notes: The Northern and Central regional dummy variables were instruments for Health Aid. *** indicates1 percent significance; ** indicates 5 percent; * indicates 10 percent. Robust standard errors are
employed. F-statistics from first-stage regressions (relevance test) are 542.43 and 1.96 for the weightedand unweighted models, respectively.
36

Table 7. Impact of water aid on diarrhea incidenceDiarrhea Incidencew Diarrhea Incidenceu
Water Aid (Instrumented) -0.002*** -0.003(7.7e-5) (0.002)
Health Aid 0.001*** 0.002(6.9e-5) (0.001)
Constant -0.006*** -0.004(2.5e-4) (0.005)
Notes: School Exposure and the Central dummy variable were instruments for Water Aid. *** indicates 1percent significance; ** indicates 5 percent; * indicates 10 percent. Robust standard errors are employed.
F-statistics from the first-stage regressions (relevance test) are 550.05 and 1.52 for the weighted andunweighted models, respectively.
Table 8. Health aid probit regression of balancing covariatesProbit
Water Aid Dummy 1.790***(0.015)
Stopped Employment -5.828***(0.109)
Constant -0.286***(0.017)
Notes: *** indicates 1 percent significance; ** indicates 5 percent; * indicates 10 percent.
Table 9. Impact of health aid on days lost to illnessDays Lost
Health Aid -0.035***(0.009)
Notes: Health Aid was a dummy variable. Percent who Stopped Employment and a Water Aid Dummywere the matching characteristics. ***indicates 1 percent significance; ** indicates 5 percent; * indicates 10
percent.
Table 10. Water aid probit regression of balancing covariatesProbit
Health Aid Dummy 1.780***(0.014)
Days Lost to Illness -0.318***(0.020)
Constant -0.997***(0.017)
Notes: *** indicates 1 percent significance; ** indicates 5 percent; * indicates 10 percent.
Table 11. Impact of water aid on diarrhea incidenceDiarrhea Incidence
Water Aid -0.004***(0.000)
Notes: Water Aid was a dummy variable. Days Lost to Illness and a Health Aid Dummy were the matchingcharacteristics. *** indicates 1 percent significance; ** indicates 5 percent; * indicates 10 percent.
37

Table 12. Education aid probit regression of balancing covariatesProbit
Water Aid Dummy 1.235***(0.021)
Health Aid Dummy 1.795***(0.024)
Urban 1.621***(0.039)
Stopped Employment -0.040(0.164)
Constant -2.540***(0.018)
Notes: *** indicates 1 percent significance; ** indicates 5 percent; * indicates 10 percent.
Table 13. Impact of education aid on school exposureSchool Exposure
Education Aid 0.009*(0.006)
Notes: Education Aid was a dummy variable. A Water Aid Dummy, a Health Aid Dummy, Urban andPercent who Stopped Employment were matching characteristics. *** indicates 1 percent significance; **
indicates 5 percent; * indicates 10 percent.
Table 14. Impacts of health, water and education aid in less developed areasLess Developed Area Baseline
Health Aid on Days Lost (IV) -0.020*** -0.014***Health Aid on Days Lost (PSM) -0.045*** -0.035***Water Aid on Diarrhea (IV) -0.001*** -0.002***Water Aid on Diarrhea (PSM) 0.002*** -0.004***Education Aid on School Exposure (PSM) 0.141*** 0.009*
Notes: *** indicates 1 percent significance; ** indicates 5 percent; * indicates 10 percent. Robust standarderrors are employed.
38

Table 15. Health aid allocation and percent who stopped work due to diseaseDonor Percent Stopped Work Other AidAfrican Dev Bankw -2.780***
-1.563*** 0.050***African Dev Banku -0.666
-0.626 0.075**EUw -0.387***
-0.389*** -0.0003***EUu -0.558***
-0.558*** -0.0004***GIZ (Germany)w 0.784***
0.378*** 0.136***GIZ (Germany)u 0.626
0.498 0.131**Icelandw -0.028***
-0.028*** -9.8e-5***Icelandu -0.039***
-0.039*** -0.0002**JICAw -0.002***
-0.002*** -1.5e-6
JICAu -0.003***-0.003*** -2.0e-6
KFW Bankengruppew 3.624***3.681*** -0.034***
KFW Bankengruppeu 10.21110.276 -0.086
NORAD (Norway)w -1.797***-1.720*** 0.010***
NORAD (Norway)u -0.288-0.284 0.008
DfID (UK)w -1.906***-1.897*** -0.006***
DfID (UK)u -1.362-1.357 -0.005
USAIDw 2.794***-1.050*** 0.606***
USAIDu 4.5521.775 0.678***
Notes: ***indicates 1 percent significance; ** indicates 5 percent; * indicates 10 percent. Robust standarderrors are employed.
39
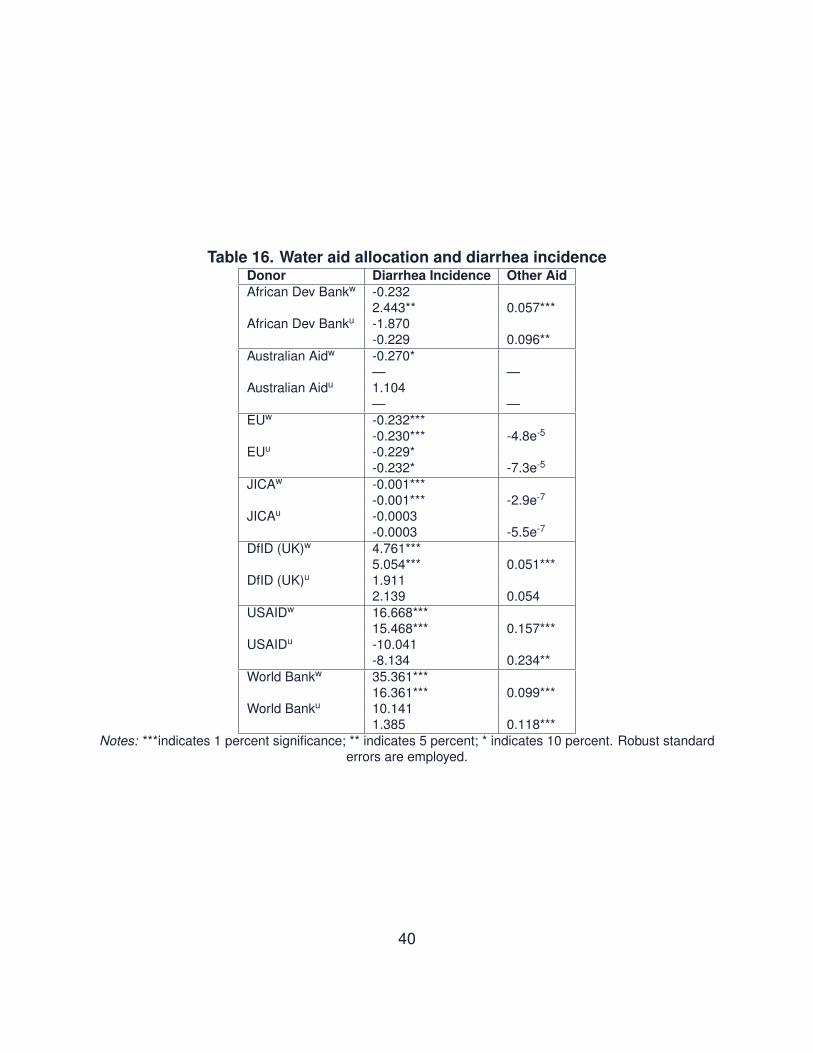
Table 16. Water aid allocation and diarrhea incidenceDonor Diarrhea Incidence Other AidAfrican Dev Bankw -0.232
2.443** 0.057***African Dev Banku -1.870
-0.229 0.096**Australian Aidw -0.270*
— —Australian Aidu 1.104
— —EUw -0.232***
-0.230*** -4.8e-5
EUu -0.229*-0.232* -7.3e-5
JICAw -0.001***-0.001*** -2.9e-7
JICAu -0.0003-0.0003 -5.5e-7
DfID (UK)w 4.761***5.054*** 0.051***
DfID (UK)u 1.9112.139 0.054
USAIDw 16.668***15.468*** 0.157***
USAIDu -10.041-8.134 0.234**
World Bankw 35.361***16.361*** 0.099***
World Banku 10.1411.385 0.118***
Notes: ***indicates 1 percent significance; ** indicates 5 percent; * indicates 10 percent. Robust standarderrors are employed.
40

Table 17. Education aid allocation and percent school exposureDonor Percent School Exposure Other AidAfrican Dev Bankw -2.357***
-2.675*** 0.031***African Dev Banku -1.496
-1.552* 0.039**GIZ (Germany)w -0.248***
-0.232*** -0.018***GIZ (Germany)u -0.416
-0.391 -0.016**Icelandw 0.012***
0.012*** -5.5e-5***Icelandu 0.016***
0.016*** -8.7e-5
Irelandw 0.119***0.118*** -0.002***
Irelandu 0.138***0.138*** -0.004**
Japanw 5.45e-5***5.63e-5*** -0.006***
Japanu 1.5e-5
1.6e-5 -0.006DfID (UK)w*** 0.007***
0.007*** -3.0e-5***DfID (UK)u*** 0.009***
0.009*** -4.9e-5*USAIDw -0.553***
0.046 0.028***USAIDu 0.115
0.391 0.025*World Bankw 1.127***
1.210*** 0.003***World Banku 1.569
1.663 0.008Notes: ***indicates 1 percent significance; ** indicates 5 percent; * indicates 10 percent. Robust standard
errors are employed.
Table 18. Impact of health aid on days lost to illnessDays Lostw Days Lostu
Health Aid (Instrumented) -0.007*** -0.009(6.1e-4) (0.011)
Constant -0.105*** -0.078(0.004) (0.072)
Notes: The Northern and Central regional dummy variables were instruments for Health Aid. *** indicates1 percent significance; ** indicates 5 percent; * indicates 10 percent. Robust standard errors are employed.This specification failed the overidentification test for exogeneity of instruments. F-statistics from first-stage
regressions (relevance test) are 542.43 and 1.96 for the weighted and unweighted models, respectively.
41

Table 19. Impact of water aid on diarrhea incidenceDiarrhea Incidencew Diarrhea Incidenceu
Water Aid (Instrumented) -0.0007*** -0.0007(2.9e-5) (0.0007)
Constant -0.006*** -0.006(2.3e-4) (0.004)
Notes: School Exposure and the Central dummy variable were instruments for Water Aid. *** indicates 1percent significance; ** indicates 5 percent; * indicates 10 percent. Robust standard errors are employed.
This specification failed the overidentification test for exogeneity of instruments.F-statistics from thefirst-stage regressions (relevance test) are 550.05 and 1.52 for the weighted and unweighted models,
respectively
Table 20. Impact of health aid on days lost to illness - urban removedDays Lostw Days Lostu
Health Aid (Instrumented) -0.012*** -0.014(8.8e-4) (0.015)
Water Aid 0.004*** 0.003(2.4e-4) (0.004)
Education Aid 0.008*** 0.012(9.1e-4) (0.016)
Constant -0.157*** -0.110***(0.002) (0.041)
Notes: The Northern and Central regional dummy variables were instruments for Health Aid. *** indicates1 percent significance; ** indicates 5 percent; * indicates 10 percent. Robust standard errors are
employed. This specification failed the overidentification test for exogeneity of instruments in the weightedmodel. F-statistics from first-stage regressions (relevance test) are 560.76 and 1.85 for the weighted and
unweighted models, respectively.
Table 21. Impact of water aid on diarrhea incidence - urban removedDiarrhea Incidencew Diarrhea Incidenceu
Water Aid (Instrumented) -0.002*** -0.003(0.0001) (0.002)
Health Aid 0.001*** 0.002(9.4e-5) (0.001)
Constant -0.006*** -0.004(4.2e-4) (0.005)
Notes: School Exposure and the Central dummy variable were instruments for Water Aid. *** indicates 1percent significance; ** indicates 5 percent; * indicates 10 percent. Robust standard errors are employed.
This specification failed the overidentification test for exogeneity of instruments in the weighted model.F-statistics from the first-stage regressions (relevance test) are 340.40 and 0.90 for the weighted and
unweighted models, respectively.
Table 22. PSM: Impact of health aid on days lost to illness - urban removedDays Lost
Health Aid 0.096***(0.008)
Notes: Health Aid was a dummy variable. Percent who Stopped Employment and a Water Aid Dummywere the matching characteristics. ***indicates 1 percent significance; ** indicates 5 percent; * indicates 10
percent.
42

Table 23. PSM: Impact of water aid on diarrhea incidence - urban removedDiarrhea Incidence
Water Aid -0.007***(0.000)
Notes: Water Aid was a dummy variable. Days Lost to Illness and a Health Aid Dummy were the matchingcharacteristics. *** indicates 1 percent significance; ** indicates 5 percent; * indicates 10 percent.
Table 24. PSM: Impact of education aid on school exposure - urban removedSchool Exposure
Education Aid 0.152***(0.004)
Notes: Education Aid was a dummy variable. A Water Aid Dummy, a Health Aid Dummy, Urban andPercent who Stopped Employment were matching characteristics. *** indicates 1 percent significance; **
indicates 5 percent; * indicates 10 percent.
43

References
Alesina, Alberto, and David Dollar, Who Gives Foreign Aid to Whom and Why?, Journal
of Economic Growth. 5 (2000), 33–63.
Ashraf, Nava, James Berry, and Jesse Shapiro, Can higher prices stimulate product use?
Evidence from a field experiment in Zambia, American Economic Review. 100
(2010), 2382-2413.
Baranov, Victoria, Daniel Bennett, and Hans-Peter Kohler, The Indirect Impact of An-
tiretroviral Therapy, PSC Working Paper Series, PSC 12-08 (2012).
Bates, Robert H., Ed. Toward a Political Economy of Development: a rational choice
perspective. (1988). Berkeley, CA: University of California Press.
Bjorkman, Martina and Jakob Svensson, Power to the people: evidence from a random-
ized field experiment on community-based monitoring in Uganda, Quarterly Jour-
nal of Economics. 124 (2009), 735-769.
Boserup, Ester The Conditions of Agricultural Growth: The Economics of Agrarian Change
under Population Pressure (1965), London, United Kingdom: G. Allen and Unwin.
Brautigam, Deborah and Stephen Knack, Foreign aid, institutions, and governance in sub-
Saharan Africa, Economic Development and Cultural Change. 52 (2004), 255-285.
Bruckner, Markus, On the Simultaneity Problem in the Aid and Growth Debate, Journal of
Applied Econometrics. 28 (2013), 126-150.
Burnside, Craig, and David Dollar, Aid, Policies, and Growth, American Economic Review.
90 (2000), 847–868.
44

Calderisi, Robert. The Trouble with Africa: why foreign aid isn’t working. (2006). New
York, NY: Palgrave Macmillan.
Cohen, Jessica and Pascaline Dupas, Free distribution or cost-sharing? Evidence from a
randomized malaria prevention experiment Quarterly Journal of Economics. 125
(2010), 1-45.
Collier, Paul, Is aid oil? An analysis of whether Africa can absorb more aid, World Devel-
opment. 34 (2006), 1482-1497.
Collier, Paul and David Dollar, Aid allocation and poverty reduction, European Economic
Review. 46 (2002), 1475-1500.
Commins, Stephen K., Ed. Africa’s Development Challenges and the World Bank: hard
questions, costly choices.(1988). Boulder, CO: Lynne Reinner.
Dollar, David and Victoria Levin, Sowing and reaping: institutional quality and project
outcomes in developing countries, Washington, DC: World Bank policy research
working paper no. 3524. (2005).
Dollar, David and Victoria Levin, The increasing selectivity of foreign aid, 1984-2003,
World Development. 34 (2006), 2034-2046.
Doucouliagos, Hristos and Martin Paldam, Finally a breakthrough? The recent rise in
the size of the estimates of aid effectiveness in Arvin, Mak, Ed., Handbook on the
Economics of Foreign Aid, Edward Elgar, forthcoming.
Dreher, Axel, Stephan Klasen, James Raymond Vreeland, and Eric Werker, The costs
of favoritism: is politically driven aid less effective? Economic Development and
Cultural Change. 62 (2013), 157-191.
45

Dreher, Axel, Peter Nunnenkamp, Susann Thiel, and Rainer Thiele, Aid allocation by
German NGOs: does the degree of official financing matter?, World Economy. 35
(2012), 1448-1472.
Dumont, Rene, False Start in Africa (1966). London, UK: Andre Deutsch.
Easterly, William, The Elusive Quest for Growth. (2002). Cambridge, MA: MIT Press.
Easterly, William, The cartel of good intentions: the problem of bureaucracy in foreign aid,
Policy Reform. 5 (2002a), 223-250.
Easterly, William and Claudia Williamson, Rhetoric versus reality: the best and worst of
aid agency practices World Development. 39 (2011), 1930-1949.
Feyzioglu, Tarhan, Vinaya Swaroop, and Min Zhu, A panel data analysis of the fungibility
of foreign aid World Bank Economic Review. 12 (1998), 29-58.
Fuchs, Andreas, Axel Dreher, and Peter Nunnenkamp, Determinants of donor generosity:
a survey of the aid budget literature, World Development. 56 (2014), 172-199.
Galiani, Sebastian, Stephen Knack, Colin Xu and Ben Zou, The Effect of Aid on Growth:
Evidence from a Quasi-Experiment, Washington, DC: World Bank policy research
working paper 6865, (2014).
Galiani, Sebastian, Paul Gertler, and Ernesto Schargrodsky, Water for Life: The Impact of
the Privatization of Water Services on Child Mortality, Journal of Political Economy.
113 (2005), 83–120.
Herzer, Dierk, and Peter Nunnenkamp, Private donations, government grants, commercial
activities, and fundraising: cointegration and causality for NGOs in international
46

development cooperation, World Development. 46 (2013), 234-251.
Jackson, Osborne, Natural Disasters, Foreign Aid and Economic Growth (2014). Boston,
MA: Northeastern University Department of Economics unpublished manuscript,
SSRN working paper id-2329404.
Kim, Eun Mee, and Jinhwan Oh, Determinants of Foreign Aid: The Case of South Korea,
Journal of East Asian Studies. 12 (2012), 251–273.
Knack, Stephen, F. Halsey Rogers, and Nicholas Eubank, Aid quality and donor rankings
World Development. 39 (2011), 1907-1917.
Koch, Dirk-Jan, Axel Dreher, Peter Nunnenkamp, and Rainer Thiele, Keeping a low profile:
what determines the allocation of aid by non-governmental organizations?, World
Development. 37 (2009), 902-918.
Kremer, Michael and Miguel, Edward, The illusion of sustainability, Quarterly Journal of
Economics. 122 (2007), 1007-1065.
Lumsdaine, David Halloran, Moral Vision in International Politics: The Foreign Aid Regime,
1949–1989 (1993), Princeton, NJ: Princeton University Press.
Maizels, Alred, and Machiko Nissanke, Motivations for Aid to Developing Countries, World
Development. 12 (2012), 251–273.
Martens, Bertin, Uew Mummert, Peter Murrell, and Paul Seabright. The Institutional
Economics of Foreign Aid. (2002). Cambridge, UK: Cambridge University Press.
Miguel, Edward, and Michael Kremer, Worms: Identifying Impacts on Education and
Health in the Presence of Treatment Externalities, Econometrica. 72 (2004), 159–
47

217.
Page, John M. Jr.,Aid, structural change and the private sector in Africa, Helsinki: UNU-
WIDER working paper 2012/021.
Page, John M. Jr. and Abebe Shimeles, Aid, employment and poverty reduction in Africa
Helsinki: UNU-WIDER working paper 2014/043.
Peratsakis, Christian, Joshua Powell, Michael Findley, Justin Baker and Catherine Weaver.
Geocoded Activity-Level Data from the Government of Malawi’s Aid Management
Platform (2012), Washington, D.C.: AidData and the Robert S. Strauss Center for
International Security and Law.
Przeworski, Adam and James Raymond Vreeland,The effect of IMF programs on eco-
nomic growth Journal of Development Economics. 62 (2000), 385-421.
Radelet, Steven, A primer on foreign aid (2006). Washington, DC: Center for Global
Development working paper no. 92.
Rajan, Raghuram, and Arvind Subramanian, Aid and Growth: What Does the Cross-
Country Evidence Really Show?, IMF Working Paper 05/127. 12 (2005), Interna-
tional Monetary Fund, Washington, D.C.
Rao, J. Mohan, Ranking foreign donors: an index combining the scale and equity of aid
giving World Development. 25 (1997), 947-961.
Rosenbaum, Paul, and Donald Rubin, The central role of the propensity score in obser-
vational studies for causal effects, Biometrika. 70 (1983), 41-55.
Tavakoli, Heidi and Edward Helger, Public expenditure in Malawi: analysis of trends and
48

performance (2009). London: Overseas Development Institute.
Therkildsen, Ole, Watering White Elephants? (1988.) Uppsala, Sweden: Scandinavian
Institute of African Studies.
United Nations Millennium Development Goals. Goal 1: Eradicate Extreme Poverty and
Hunger, <http://www.un.org/millenniumgoals/poverty.shtml>.
UNU-WIDER, Aid, Growth and Employment, (2014). Helsinki: UNU World Institute for
Development Economics Research, ReCom program position paper.
49