the fluid mechanics of natural ventilation-displacement...
TRANSCRIPT

PERGAMON Building and Environment 34 (1999) 707-720
The fluid mechanics of natural ventilation-displacement ventilation by buoyancy-driven flows assisted by wind
G.R. Hunt*, P.F. Linden
Dqmrtrmwt of’ Applied Mathematics and Theoretical Physics. Uuicersit,v of’ Cambridge, Silver Street, Cambridge, CB3 YEW. U.K.
ibstract
This paper describes the fluid mechanics of natural ventilation by the combined effects of buoyancy and wind. Attention is restricted to transient draining flows in a space containing buoyant fluid, when the wind and buoyancy forces reinforce one another. The flows have been studied theoretically and the results compared with small-scale laboratory experiments. Connections between the enclosure and the surrounding fluid are with high-level and low-level openings on both windward and leeward faces. Dense fluid enters through windward openings at low levels and displaces the lighter fluid within the enclosure through high-level, leeward openings. A strong, stable stratification develops in this case and a displacement flow is maintained for a range of Froude numbers. The rate at which the enclosure drains increases as the wind-induced pressure drop between the inlet and outlet is increased and as the density difference between the exterior and interior environment is increased. A major result of this work is the identification of the form of the nonlinear relationship between the buoyancy and wind effects. It is shown that there is a Pythagorean relationship between the combined buoyancy and wind-driven velocity and the velocities which are produced by buoyancy and wind forces acting in isolation. This study has particular relevance to understanding and predicting the air flow in a building which is night cooled by natural ventilation, and to the flushing of gas from a building after a leak. c~ 1999 Elsevier Science Ltd. All rights reserved.
Nomenclature
((1 3 aw area of leeward and windward openings, respec-
tively
.4* the ‘effective’ area of the openings
B buoyancy flux of the buoyant jet
C’,,, C, coefficients of discharge and expansion, respec- tively
(‘r1, c,, pressure coefficients at the inlet and outlet, respectively Fr Froude number Fr(t) Froude number at time t E-r(O) initial Froude number Fr,,,,(O) critical initial Froude number .rj acceleration due to gravity g’ reduced gravity, = gAp/p /? depth of the buoyant layer of fluid
11,. vertical height of the leeward opening /1* vertical distance over which the buoyancy force acts fI vertical distance between midpoints of windward and leeward openings L length of the intruding current M momentum flux of the buoyant jet P,, reference surface pressure
* Corresponding author
P, pressure inside the space at windward opening P2 pressure inside the space at leeward opening P,,, P,, wind pressure at the inlet and outlet, respec- tively Pe Peclet number
Q volume flux Re Reynolds number S cross-sectional area of the space t time [s] fe time taken for the space to empty by buoyancy forces assisted by wind
teh, few time taken for the space to empty by buoyancy forces alone and wind forces alone, respectively T absolute temperature
UtX c;, velocity associated with the buoyancy and wind force, respectively
UL, r/, velocity through the leeward and windward openings, respectively U wd average velocity of the wind
Greek symbols 2 empirical constant, = 1.85 AT temperature difference between the external and internal environment Ap density difference between the external and internal environment
0360-I 323/99/s-see front matter $8 1999 Elsevier Science Ltd. All rights reserved PIl:SO360-1323(98)00053-5

A wind pressure drop
Khrat, &It diffusivity of heat in air and salt in water.
respectively
“air, “Mtrr kinematic viscosity of air and water, respec- tively p density of the external environment p’ density of the internal environment
Subscripts
model refers to quantities used at small-scale in the laboratory full-scale refers to quantities at full-scale
1. Introduction
The use of natural ventilation has become an increas- ingly important and prominent aspect of building design and is re-emerging as a desirable alternative to mech- anical systems. Architects, building services engineers and their clients are attracted to natural ventilation as a way of providing a comfortable environment in the workplace because of the potential savings in energy costs and for wider environmental reasons. This increased interest has exposed the limitations of existing knowledge to predict how naturally ventilated buildings will perform under the wide range of atmospheric conditions typically experienced over the year.
A number of earlier experiments and theoretical studies have examined the natural ventilation of an enclosure. The majority of these studies have concentrated on ven- tilation flows which are solely driven by either (i) the buoyancy force associated with the temperature differ- ence between the fluid inside the enclosure and that of its surroundings (stack effect) [l], or (ii) the wind. Stack- driven flows are well understood and mathematical mod- els have been developed to predict the thermal strati- fication within the enclosure [2,3]. Work on wind-driven ventilation flows has received attention over many years, particularly with the use of wind tunnel models for the determination of pressure coefficients for model build- ings. Pressure coefficients have been determined for a wide range of building geometries, wind directions and exposure levels and are well documented [4,.5]. In contrast to the numerous studies on stack and wind effects in isolation, ventilation by the combined effects of stack and wind has received little attention in the open literature. Davies and Linden [6] examined the combined effect of buoyancy and wind on the ventilation of a corridor (the corridor was of rectangular cross-section with a doorway at one end that occupied the full cross-section of the corridor). However, for an enclosure with high and low- level openings the nonlinear interaction between wind and buoyancy is not well understood and provides the motivation for the present study. A preliminary inves-
tigation of natural ventilation by combined wind and buoyancy effects has previously been published [7].
Wind flow around buildings, which are typically sharp- edged and of rectangular cross-section, results in a pres- sure drop A across the building. The wind pressure is positive at the windward face and negative in the lee of the building due to separation and turbulent effects. As a consequence of this pressure drop the air in a heated room. with ventilation openings on both windward and leeward faces. is subject to both a buoyancy force and a pressure force associated with the wind. The processes are nonlinear and so the combined effects cannot be obtained simply by adding the results of the two different processes acting in isolation. The nonlinearity arises because the flows through openings are a nonlinear function of the pressure drops across them.
The extent to which the wind hinders or enhances the ventilation of the enclosure depends upon its strength and direction, as well as upon the size and location of the openings and the temperature difference between the internal and external environment. Air speeds induced by a temperature difference of 10 C in a building 5 m high are of the order of 1.3 ms’. Average wind speeds for the U.K. are of the order of 4 mss’ and therefore the effects of the wind on the buoyancy-driven flow might be expected to be considerable. There are clearly situations where the wind and buoyancy forces reinforce one another to ventilate a space, as in Fig. I (a), and situations where the buoyancy and wind forces oppose one another, as in Fig. l(b). The two situations depicted in Fig. 1 will result in very different air flows within the enclosure.
Transient ventilation flows. such as those which may occur at night in naturally ventilated buildings in which there are no internal sources of buoyancy, are considered. Night-time ventilation allows far higher ventilation rates than would be acceptable during the hours of occupancy. The aim of night cooling by natural ventilation is to remove the warm internal air and to replace it with cooler external air in order to promote heat transfer from the building fabric to the air. In this way the fabric of the building is cooled which then reduces peak daytime tem- peratures. In this paper the fluid mechanics of the flow that occurs when wind and buoyancy forces reinforce one another to ventilate an enclosure are examined. Exper-
Wind Wind
(a) (b)
Fig. I. A schematic diagram illustrating conditions for which wind and
buoyancy forces (a) reinforce one another and (b) oppose.

G.R. Hunt, P.F. Linden / Building and Environment 34 (1999) 707-720 709
imental techniques, together with simple mathematical modelling have been used to determine the temperature and stratification within the enclosure as a function of the wind speed and the temperature or other buoyancy difference.
2. A mathematical model for wind assisted buoyancy- driven displacement flows
A mathematical model for combined buoyancy and wind-driven displacement ventilation is now proposed. Consider the emptying of a space initially containing fluid of uniform density p’, which is surrounded by heavier fluid of density p = p’ +Ap. We make the Boussinesq approximation in which the density difference Ap > 0 between the fluid in the space and the surrounding fluid, is assumed to be small compared to p. We write $1’ = gAp/p for the reduced gravity. If openings, whose centres are separated by a vertical distance H, are now made at low-level and at high-level, then there will be a buoyancy-driven displacement flow through the open- ings. The dense fluid enters through the lower opening and light fluid leaves through the upper, producing a stable interface at height H-h(t). If, in addition to the buoyancy force, there is a steady external wind then the fluid inside the enclosure will also be subject to a force associated with the pressure drop A between the wind- ward and leeward openings. In the case where the wind- ward opening is at low-level and the leeward opening is at high-level the wind adds to this flow maintaining the same structure. It will be assumed, as is observed to be the case, that the interface is stable, at least for a range of A, so that no mixing occurs. The cross-sectional area of the enclosure S (independent of height), is assumed to be much larger than the area of either opening so that the velocity of the ascending interface is small. Under these assumptions we may assume that the variation in pressure within the enclosure is hydrostatic. The notation used and the geometry of the enclosure is illustrated in Fig. 2. For convenience, a reference pressure P,, has been chosen to denote the total fluid pressure at the centre of the windward opening on the outside of the enclosure.
wind -
A U’,- pi@-4
-
- H
- pO_____p,_---__ ~~._..._~~~
Fig. 2. A schematic diagram illustrating the geometry of the enclosure
and the notation used.
The fluid pressures inside the enclosure at z = H and z = 0 are denoted by P, and Pz, respectively. Using Bernoulli’s theorem we have
(la)
and
U; = ;(P, -(P,-pgH-A)). (lb)
The fluid velocity is assumed to be constant over the entire depth of the opening. In reality, there will be a variation in the fluid velocity across the vertical depth of the opening. However, this variation in pressure is likely to be small compared with the variation in pressure between the two openings due to the (large) vertical dis- tance between them. The flow will contract on flowing through an orifice and so eqn (1) should only be applied to the velocities and areas after contraction. Also, the flows are not dissipationless unless the contractions are perfectly smooth. For this reason eqn (1) is replaced with
u:, = ce; (P” - P?)
and
u: = Cc+, -(P,-pgH-A)), W)
where the expansion coefficient C, is a constant lying between one half, for a sharp expansion at the inlet, and unity, for a perfectly smooth expansion [LX]. C, is related to the discharge coefficient CD (z 0.6) by CD = Cd”, see [9]. Assuming a hydrostatic variation in pressure within the enclosure we write
PI = P, +pg(H-h)+p’gh. (3)
If the fluid is incompressible then the volume flux, Q, which enters the enclosure equals the volume flux which leaves, so that
Q = awUw = a,UL. (4)
Eliminating PO and P, from eqns (2) and (3) and using eqn (4) gives the volume flux through the openings, namely,
(3
where
A* = aWaL 1 ’ (6)
zc’c (C&z:, + Cdat) 2 e d )
is an ‘effective’ area of the openings. The respective fluid
710 G.R. Hunt, P.F. Lirdcv // Building und Environment 34 11999) 707-720
velocities through the inlet and outlet of the enclosure were considered. In the limit of purely wind-driven flow are now we have
(7)
and
(8)
The fluid velocities given in eqns (7) and (8) can be seen to be composed of the sum of the square of the buoyancy velocity, a, and of the square of the velocit associ- ated with the pressure drop due to the wind, k A/p. The total fluid velocity U through an opening is of the form
u - J-u?, (9)
where Uh and U, denote the velocity associated with the buoyancy and wind force, respectively.
The rate of ascent of the interface between the dense and light fluid is given by
dh Q -_= -~ dt S
and so, if h = H at time t = 0,
(10)
(11)
and the total time te for the space to empty is given by
te = s[(g’H+ f)‘-($1 (12)
From the general expressions (11) and (12) the fluid behaviour within the enclosure can be examined in two limiting cases of interest. The first case of interest is when the buoyancy force drives the motion in the absence of wind. The second case is when there is no density differ- ence between the fluid in the enclosure and the sur- roundings and the ventilation flow is purely wind-driven. In the absence of wind, eqns (11) and (12) reduce to
h ( i 2
-= I_;, H h
(13)
where te,, the time for the enclosure to empty under the influence of buoyancy forces alone, is given by
(14)
These equations are identical to those derived by Linden et al. [1] in which flows driven solely by buoyancy forces
(15)
where te,, the total emptying time under the influence of wind forces alone, is given by
(16)
Equation (15) assumes that a displacement mode of ven- tilation prevails within the enclosure in the absence of buoyancy. In this limit a mixing flow will develop within the enclosure as a density difference is needed to maintain the stratification. However, eqn (15) serves to describe the fluid behaviour as the wind-driven limit is approached (see Section 5). From eqns (13) and (15) we note that as the wind strength increases, from initially being zero to finally dominating the fluid motion, the descent of the interface changes from a quadratic to a linear dependence with time.
The relative sizes of the wind and the buoyancy pro- duced velocities are measured as a Froude number. namely, the ratio of the average wind velocity U,,,,,,‘, to the buoyancy velocity Jy’lz. Considering the wind pres- sures at the inlet and outlet we obtain
(17)
where C,, = p,,l(~ P %d and C,, = P,d~ P Uk) denote the pressure coefficients at the inlet and outlet. respec- tively, and P,, and P,v, denote the wind pressures at the respective openings. The Froude number may therefore be written in the form
(18)
The non-dimensional evolution of the interface height, as a function of time, becomes
where
(19)
J A Fr(0) = __
P.4’H’ (20)
denotes the initial Froude number. The total time for the enclosure to empty under the combined forces of buoyancy and wind, as a fraction of the time to empty under buoyancy alone, is then
Lc = 4’1 +Fr(O)’ - Fr(0). teh
(21)
G.R. Hunt. P.F. Linden / Buildiny and Entironnwnt 34 (1999) 707-720 711
From eqns (18) and (20) the Froude number, at time t, may be expressed as
Fr(t) = F@)
JholH’ (22)
and hence, for a constant wind velocity and density difference, the Froude number Fr(t) increases as the enclosure empties. In other words, wind effects become increasingly more dominant as the thickness h of the lighter layer decreases. In fact, the wind force begins to dominate the buoyancy force once
il <A PS’ .
(23)
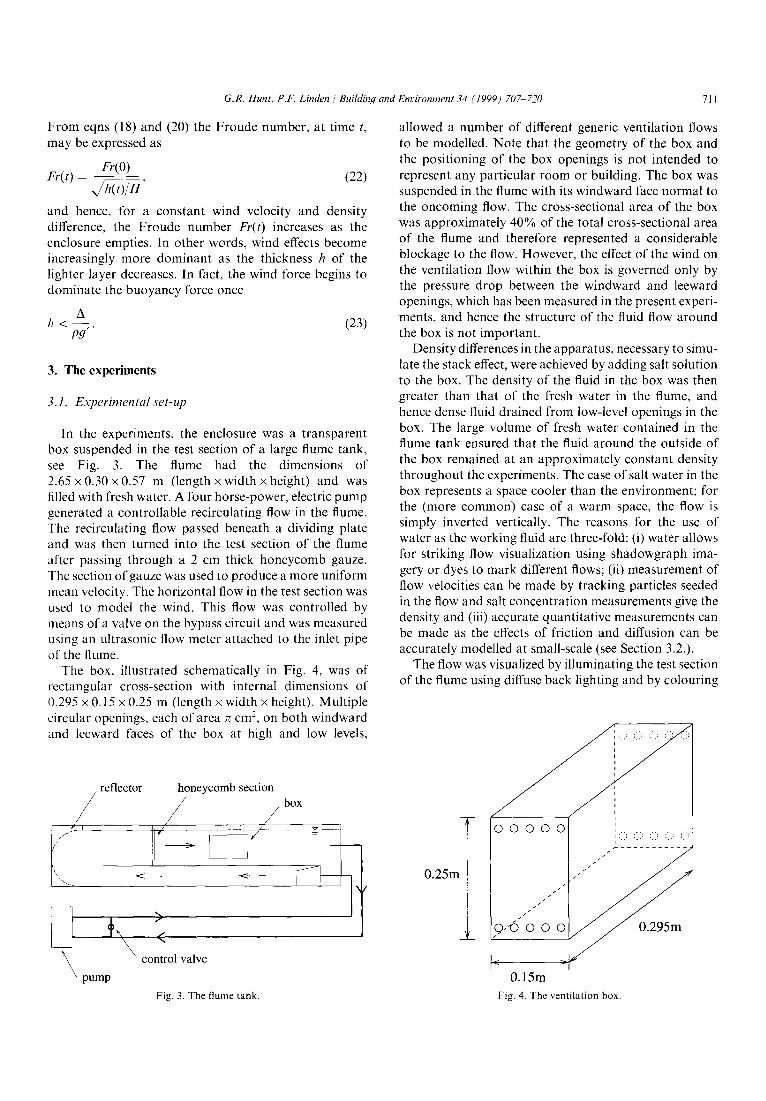
allowed a number of different generic ventilation flows to be modelled. Note that the geometry of the box and the positioning of the box openings is not intended to represent any particular room or building. The box was suspended in the flume with its windward face normal to the oncoming flow. The cross-sectional area of the box was approximately 40% of the total cross-sectional area of the flume and therefore represented a considerable blockage to the flow. However, the effect of the wind on the ventilation flow within the box is governed only by the pressure drop between the windward and leeward openings, which has been measured in the present experi- ments, and hence the structure of the fluid flow around the box is not important.
3. The experiments
3.1. E.~perimentd set-up
In the experiments, the enclosure was a transparent box suspended in the test section of a large flume tank, see Fig. 3. The flume had the dimensions of 2.65 x 0.30 x 0.57 m (length x width x height) and was filled with fresh water. A four horse-power, electric pump generated a controllable recirculating flow in the flume. The recirculating flow passed beneath a dividing plate and was then turned into the test section of the flume after passing through a 2 cm thick honeycomb gauze. The section of gauze was used to produce a more uniform mean velocity. The horizontal flow in the test section was used to model the wind. This flow was controlled by means of a valve on the bypass circuit and was measured using an ultrasonic flow meter attached to the inlet pipe of the flume.
Density differences in the apparatus, necessary to simu- late the stack effect, were achieved by adding salt solution to the box. The density of the fluid in the box was then greater than that of the fresh water in the flume, and hence dense fluid drained from low-level openings in the box. The large volume of fresh water contained in the flume tank ensured that the fluid around the outside of the box remained at an approximately constant density throughout the experiments. The case of salt water in the box represents a space cooler than the environment; for the (more common) case of a warm space, the flow is simply inverted vertically. The reasons for the use of water as the working fluid are three-fold: (i) water allows for striking flow visualization using shadowgraph ima- gery or dyes to mark different flows; (ii) measurement of flow velocities can be made by tracking particles seeded in the flow and salt concentration measurements give the density and (iii) accurate quantitative measurements can be made as the effects of friction and diffusion can be accurately modelled at small-scale (see Section 3.2.).
The box, illustrated schematically in Fig. 4, was of rectangular cross-section with internal dimensions of 0.295 x 0. I5 x 0.25 m (length x width x height). Multiple circular openings, each of area 7t cm?, on both windward and leeward faces of the box at high and low levels,
The flow was visualized by illuminating the test section of the flume using diffuse back lighting and by colouring
0.15m
Fig. 3. The flume tank. Fig. 4. The ventilation box

712 G.R. Hunt, P.F. Linden ; Building and Encirorvnent 34 ilW9) 707-720
the fluid contained in the box using a food dye. A bank of fluorescent tubes was used to light the experiments and a sheet of tracing paper diffused the light. A video camera was used to record the experiments. Each frame of the recording was then digitised in a false-colour format using the image analysis system DigImage [IO] and cor- rected for background variations in the lighting. From the resulting images the position of the interface, which corresponded to a particular concentration of dye, was tracked.
The wind pressure drop, A, across the box was deter- mined for a range of ‘wind’ speeds using a manometer tube. Four different flow rates in the flume, corresponding to pressure drops of A = 0,4.0,20.7 and 49.5 kg m-’ s2, were considered in the present experiments. The pressure drop of A = 0 kg m-’ S-I represents the case when there is no flow in the flume and A = 49.5 kg rn-’ SC’ is the wind pressure drop between the openings when the flume is operating at the maximum capacity.
The box was filled with coloured, brine solution of a known uniform density and suspended in the test section of the flume. The pump which drives the flow in the flume was then switched on and the required ‘wind’ velocity selected. Each experiment was initiated by opening sim- ultaneously both windward and leeward vents. This resulted in dense fluid leaving the box through the low- level, leeward opening and ambient fluid entering the box through the high-level, windward opening, i.e. a dis- placement flow was established.
3.2. Scaling considerations
Friction and diffusion effects are small for typical ven- tilation flows as is evident from the Reynolds, Re, and Peclet, Pe, numbers which are both of the order of IO3 (domestic)-lOh (industrial). Dynamical similarity between buoyancy-driven flows at small-scale and those at full-scale is achieved when
and
where 1’ is the kinematic viscosity of the fluid, ti is the diffusivity and H is a characteristic length scale. If air was used as the working fluid and density differences were created using heat then the Reynolds and Peclet numbers at small-scale would be reduced by a factor of (Hmodcl/HfL,,_\calc)3 ‘. Laboratory models are typically 1 : 20- 1 : 100 scale and hence the Reynolds and Peclet numbers would be reduced by two or three orders of magnitude. However, by using water as the working fluid
and brine to create density differences in the system, the reduction in the magnitude of the dimensionless groups due to the change in scale is counteracted as v,,, >> v,,ter
and Khca, >> k’s,lt, where ~~~~~~ and K,;,,, denote the diffus- ivities of heat in air and salt in water. respectively. In addition, significantly larger density differences can be achieved in the laboratory using fresh water and brine than occur in air due to temperature differences, hence
Ymodei >> ,4;lIn-\c.+ The effectiveness of this technique has
been demonstrated by Linden et al. [l] and Baker and Linden [I l] who used small-scale reproduction models of rooms and buildings and successfully predicted the temperature and stratification observed at full-scale. The scaling laws used to transform the quantities from small- scale to those at full-scale are given by Linden et al. [ 11. Dynamical similarity between wind and buoyancy forces in the experimental model and at full-scale is achieved when
where Urnode denotes the speed of the fluid driven by the flume and UFull_Sca,e( = UWlnd) denotes the wind speed. Dynamical similarity is achieved at small-scale in the
laboratory as g&,el >> .q~U,,_scale and D;nodri CC Ulull_,calz. By varying the density difference between the fluid
contained in the box and its surroundings and the ‘wind’ velocity, the ventilation of the enclosure observed during experiments can be used to predict how naturally ven- tilated buildings will perform under a wide range of con- ditions.
4. Results and discussion
4.1. Expevinzental obsercations
Images showing the development of a typical experi- ment, in which the box empties under buoyancy forces alone, are shown in Fig. 5; the density difference y’ = 0.1 m ss’ and the flow is shown at t = 45, 105, 165 and 225 s. The displacement mode of ventilation is made clearly visible by the stable descending interface. The devel- opment of a typical experiment in which the buoyancy forces are reinforced by wind forces, is shown in Fig. 6. The density difference is identical to that of the no-wind case and the wind ilow is from left to right. A dis- placement flow was maintained for a range of initial Froude numbers when the effects of wind and buoyancy reinforce one another and the ventilation rate was sig- nificantly enhanced over the corresponding no-wind case. as is clearly evident on comparing Figs 5 and 6.
In the initial stages of the experiment, turbulent mixing was observed as a jet of fluid entered through the wind- ward opening and mixed with the denser fluid contained

G. R. Hunt, P.F. Linderr I) Building md Etu~irormenf 34 i 1999) 707-720
.
.
Fig. 5. Buoyancy-driven displacement ventilation. The box was initially filled with a dense fluid (y’ = 0.1 m s I) and placed in a large reservoir tank.
The experiment was started by removing a plug from the upper left and lower right faces of the box. The digitised shadowgraph images are at (a)
I = 45, (h) 105. (c) 165 and (d) 225 s.
in the box. The incoming jet of fluid impinged on the downstream face of the box and intruded downwards into and vigorously mixed with the dense layer of fluid below. The downward momentum of the intrusion was opposed by the buoyancy forces and the intrusion increased in length until its momentum was reduced to zero. The intruding current was then reflected back across the box and a displacement flow established (see Section 5). Numerous secondary intrusions and reflections result- ing from collisions between the current and both leeward and windward internal faces of the box were observed during all experiments. During each collision the current dissipated energy, the depth of the subsequent intrusion decreased and the reflections became progressively weaker. Turbulent mixing between the intruding current
and the dense fluid layer below increased the density of the current and thin fluid layers were formed as the intrusion travelled horizontally across the enclosure; each new layer the result of a single reflection. The density of these layers was between that of the ambient fluid and the dense layer of fluid. Each new layer was denser than. and hence formed below, the previous layer. The band of
layered fluid formed during this initial mixing stage, see Figs 5 and 6, was typically 4 cm thick, i.e. approximately one sixth of the height of the enclosure. A stable strati- fication within the box was then clearly visible. The strati- fication in the layered band was very strong, so that the overall stratification in the box was essentially two-layer with the narrow intermediate layered band effectively a smearing of the interface. In both the buoyancy-driven and the wind-assisted buoyancy-driven displacement flows a small amount of mixing was observed in the region above the fluid interface. The amount of mixing increased as the initial Froude number, and hence the momentum of the incoming buoyant jet, increased. The incoming buoyant jet scoured the interface, lifting dense fluid from the lower layer which was then entrained into
the jet. The sharp curved interface formed by entrainment into the jet is visible in Figs 5(a) and (b) and 6(a) and (b).
4.2. Conlpurisons hetuvwn data and theog
The mathematical model developed in Section 2 does not incorporate the initial mixing stage of the flow. How-

Fig. 6. Buoyancy-driven displacement ventilation assisted by wind. The box was initially filled with a dense fluid (,q’ = 0.1 m SC’) and placed 111 a
flume tank. The experiment was started by removing a plug from the upper left (windward) and lower right (leeward) faces of the box. The pressure
drop across the box was A = 20.7 kg m ’ s 2 giving an initial Froude number of 0.99. The digitised shadowgraph images are at (a) t = 45, (b) 105.
(c) 165 and (d) 225 s.
ever, a correction has been made for the mixing stage by introducing a virtual origin. When the interface has descended sufficiently far, to say lz = H-h*, the mixing due to the incoming flow is negligible and a true dis- placement flow then begins. The height over which the buoyancy force acts for the displacement flow is then H-l?, where the ‘mixing length’ h* will vary according to the amount of mixing which occurs. The virtual origin is then given by 11 = H-/z* at t = 0. Equation (I 1) sug- gests that a quadratic relationship governs the time evol- ution of the interface and hence the mixing length, h*, was determined by fitting a quadratic of the form
k = h*+ht+ct’, (24)
to each of the experimental data sets while omitting all points in the ‘mixing’ phase from the set of points to be fitted. The coefficients b and c of the quadratic expression (24) represent the rate of descent of the interface and the rate of change of the rate of descent, respectively. x7-tests showed greater than 95% confidence in the goodness of the quadratic fit to each experimental data set. The value of I?* for a given ‘wind’ velocity has been taken to be the
average of the mixing lengths determined for each value of y’ at that particular ‘wind’ velocity.
Figure 7(a) depicts the position of the interface as a func- tion of time for the experiments in which only the buoy- ancy force drives the ventilation flow (A = 0 kg rn-’ s-‘) and for the density differences corresponding to 9’ = 0.02, 0.05, 0.1 and 0.2 m SY’. Also shown in Fig. 7(a) are the predicted interface positions deduced from eqn (11). The expansions and contractions at the open- ings are sharp and therefore we adopt the coefficients C, = 0.5 and Cd = 0.6’. In the no-wind experiments the rate of descent of the interface was observed to decrease with time while the total time for the box to empty decreased as the density difference increased. Figure 7(b- d) depicts the interface position as a function of time for buoyancy-driven ventilation assisted by wind for A = 4.0, 20.7 and 49.5 kg rn-’ ss’, respectively. In each figure the observed and predicted evolution of the interface is shown for 9’ = 0.02, 0.05. 0. I and 0.2 m SK’. The density differences used in the experiments and the approximate temperature differences they represent are shown in Table 1.

G.R. Hunt, P.F. Linden i Building and EnL?ronmmi 34 (1999) 707-720 715
(a) 25 1 q g’zO.02
0 g'zO.05 A gkO.1
+ g’zO.2
---------- Model, g’=o.O2
- Model, g’=O.O5 ------ Model, g’=O.l --- Model, g’=O.2
(4 25
1
0 200 400 600 800 1000 1200 0 100 200 300 400 500 600
t (seconds) t (seconds)
q g’=O.O2
0 g’zO.05
A g’=O.l
+ g’zO.2 ---------- Model, g’=o.@
- Model, g’=O.O5 ------ Model, g’=O.l
- - Model, g’=O.2
0 50 100 150 200 250 300
t (seconds)
(b) 25 13 g’=O.02
Q g’=0.05 A g’=O.l
+ gkO.2
---------- Model, g’=O.@
- Model, g’=O.O5 ------ Model, g’=O.l --- Model, g’=O.2
(4 251
0 [ <\ ‘\
\ ‘\
I I I I I 1
0 30 60 90 120 150 180
t (seconds) Fig. 7. (a)-(d). The position of interface, h, as a function of time, t, for 9’ = 0.02. 0.05. 0.1 and 0.2 m SC’: (a) A = 0 kg m -’ SK’; (b) A = 4.0 kg mm’ s ‘; (c) A = 20.7 kg mm’ s 2 and (d) A = 49.5 kg mm’ s ‘.
Table I
The density differences
temperature differences
used in the experiments and the approximate
they represent
For a 1 : 100 scale model of a building and assuming that the difference between the pressure coefficients at the inlet and outlet of the building is unity, i.e. (C,, - C,,o)fu,,_sca,e
q’ (In s-q
0.02 0.05
0.10
0.20
AT( C)
0.6 1.5
3.0
6.0
= 1, then the wind pressure drop A used in the’experi- ments scales to give the following approximate wind speeds at full-scale, see Table 2. These equivalent full- scale wind speeds are in the range of low to average United Kingdom wind speeds.
It can be seen from Fig. 7 that, for a fixed density

Table 2 The wind pressure drops used in the experiments and the approximate
wind speeds they represent for a building 25 m tall
Wind pressure drop in experiment
Akern-‘s ‘ms ’
0.0 4.0
20.7
49.5
It has been assumed that qr,,,,,,,l = ,y; ,,,,. IL/,/C and. for con\ enience. M c have
taken CC,,, - (-p,Jii,ll-.r.ilc = 1
difference, the total time for the box to empty decreases as the wind pressure drop between the openings increases. In other words, for a given density difference the rate at which the enclosure drains increases as the initial Froude number increases. The descent of the interface can also be seen to evolve from a quadratic to an approximately linear dependence with time. As the pressure force exerted by the wind becomes increasingly dominant so the effect of the buoyancy force plays a less significant role in the emptying of the box. In Figs 7(c) and (d) the displacement flow is approaching the purely wind-driven limit as only small changes in the total emptying time result from variations in y’.
At the higher ‘wind’ velocities considered, disturbances within the box, caused mainly by the incoming jet of air leading to three-dimensional effects. resulted in inter- facial fluctuations of approximately 5 mm. An error bar indicating the magnitude of the interfacial fluctuations is shown in Fig. 7(d). The accuracy with which the position of the interface could be resolved resulted in the exper- imental data points falling in a narrow band, see Figs 7(c) and (d). Displacement flows in the box were not observed at the flow rate corresponding to A = 49.5 kg m-i s-2 and with a density difference ofy’ = 0.02 m s ‘. these conditions correspond to an initial Froude number of approximately 3.43. In this case, the high speed of the incoming jet, driven by the wind. caused almost total mixing within the box (see Section 5).
In these transient. draining, ventilation flows. the rate of descent of the interface is the important quantity to predict accurately. Agreement between the experimental observations and the predictions of the present theory are good for each ‘wind’ velocity and density difference considered. The majority of the theoretical predictions are within 10% of the observed values. The theoretical predictions of interface descent rate tend to overestimate those observed during experiment. The main cause of this discrepancy is believed to be the initial mixing stage which acts to dissipate energy through turbulence, thereby hin- dering the rate at which the interface descends.
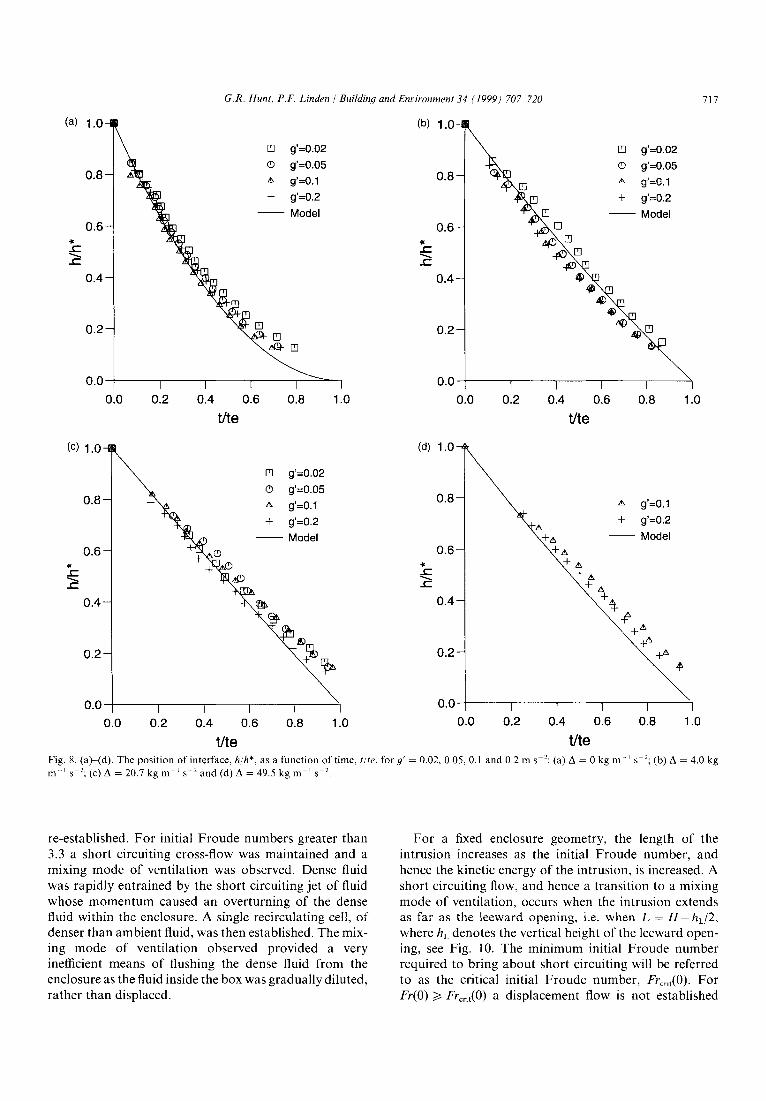
The non-dimensional form of the results presented in Fig. 7 is shown in Fig. 8 where the interface height has
been non-dimensionalised with respect to 11” and time with respect to the total emptying time tc. It can be seen from Fig. 8 that the theoretical results have collapsed onto :I single line thus confirming the scalings in eqns (I 1) and ( 12).
The initial rate of descent of the interface, deduced from eqn ( 19). namely.
is illustrated in Fig. 9 as a function of the initial Froude number. Fr(O). Also shown in Fig. 9 are the experimental observations and the theoretical wind-driven limit, i.e.
d( /l//l*)
d(f.‘%,) , ,c ,,=,, = -WY(O), F/(O) >> I,
which is shown as the dashed line. For Fr(O) < 1 the initial rate of descent of the interface is a weak function of the initial Froude number and tends to a constant value of -2, while for F/.(O) > 1 the rate of descent of the interface increases monotonically and tends to the wind-driven limit of -2Fr(O). Agreement between the theoretical results and the experimental observations is good for Froude numbers up to the order of 2.5. Ven- tilation flows examined in the parameter range I;r(O) > 1.5 were subject to considerable mixing between the incoming, wind-driven fluid and the fluid contained in the box. Despite these additional effects the data still agrees with the theory at high Fr(O). The displacement mode of ventilation broke down when the ventilation flow ‘short circuited’. which occurs when the initial
incoming current of light fluid impinges on the down- stream wall of the box and plunges through the dense layer of fluid to pass out through the low-level. leeward opening. This situation is discussed in Section 5.
5. Conditions for the transition to a mixing flow
The experiments have shown that a displacement flow persists in the enclosure for a range of initial Froude numbers from 0 to about 2.5. The initial stages of a typical displacement flow. are depicted schematically in Fig. IO. The incoming current impinges on the down- stream wall of the enclosure and intrudes downwards a distance L into the layer of dense fluid below. The current is reflected back across the enclosure and a displacement flow is established.
On increasing the initial Froude number above approximately 2.5 there was a flow transition from a displacement to a mixing mode of ventilation. During this transitional rigime. which occurred in the parameter range 2.5 < Fr(O) < 3.3. the fiow was observed to initially short circuit and then. as the intrusion was forced back upwards by the buoyancy forces. ii displacement flow was
G.R. Hunt, P.F. Linden / Building and Environment 34 11999) 707-720 717
(4 i .o
0.8-
0.6-
2 2
0.4-
g’=O.O5
g’=O. 1
g’=O.2
Model
o.o’, 0.0 0.2 0.4 0.6 0.8 1.0
0.8-
0.6-
Ik 2
0.4-
0.2-
o.o-
the
q g’zO.02
0 g’=O.O5
A g’=O.l
+ g’=O.2
m - Model
0.0 0.2 0.4 0.6 0.8 1.0 0.0 0.2 0.4 0.6 0.8 1.0
the the
04 1.0
0.8 n
0.6-
k 2
(II g’=O.O2
0 g’=O.O5
A g’=O.l
+ g’zO.2
~ Model
0.0 1 I I I
0.0 0.2 0.4 0.6 0.8 1.0
the
0.8-
0.6-
IL 2
0.4-
0.2-
o.o-
A g’=O.l
+ g’=O.2
- Model
I I I I I
Fig. 8. (at_(d). The position of interface. h/h*, as a function of time, t/w, for g’ = 0.02, 0.05, 0.1 and 0.2 m SC’: (a) A = 0 kg m-’ SC’; (b) A = 4.0 kg
m .’ SC’; (c) A = 20.7 kg m-’ SC’ and (d) A = 49.5 kg m-’ SC’,
re-established. For initial Froude numbers greater than For a fixed enclosure geometry, the length of the 3.3 a short circuiting cross-flow was maintained and a intrusion increases as the initial Froude number, and mixing mode of ventilation was observed. Dense fluid hence the kinetic energy of the intrusion, is increased. A was rapidly entrained by the short circuiting jet of fluid short circuiting flow, and hence a transition to a mixing whose momentum caused an overturning of the dense mode of ventilation, occurs when the intrusion extends ffuid within the enclosure. A single recirculating cell, of as far as the leeward opening, i.e. when L = H- hJ2, denser than ambient fluid, was then established. The mix- where h, denotes the vertical height of the leeward open- ing mode of ventilation observed provided a very ing, see Fig. 10. The minimum initial Froude number inefficient means of flushing the dense fluid from the required to bring about short circuiting will be referred enclosure as the fluid inside the box was gradually diluted, to as the critical initial Froude number, Fr,,,,(O). For rather than displaced. E(O) 3 Fr,,,,(O) a displacement flow is not established

61 /.
0.0 0.5 1.0 1.5 2.0 2.5 3.0
W) Fig. 9. The initial rate of descent of the interface as a function of the
rnitial Froude number. Fr(0). The theoretical wind-driven limit. given
by eqn (26), is shown as the dashed line.
4
A L + + +
wind
4 b) c) Fig. 10. The initial stages of a typical dtsplacement flou: (a) intrusion;
(b) reflection and (c)displacement flow established.
and a transition to mixing flow is observed; the efficiency of the ventilation flow is then lower than the no-wind
case. Fluid enters the windward opening as a buoyant jet
whose density initially differs from the interior fluid by an amount Ap. The buoyant jet has jet-like or plume-like characteristics depending on the relative strengths of the initial momentum flux M( = QU,) and initial buoyancy flux B( = Q.4’). On impact with the leeward face of the enclosure the fluid intrudes downwards into the dense layer due to the momentum of the jet. The length of the intrusion is inhibited by the buoyancy forces. If we assume that impact takes place sufficiently far from the jet origin so that the initial volume Q is not important, dimensional analysis indicates that the only characteristic length is given by
Lac BP” .
(27)
The length scale L thus determines the distance over which the buoyant jet is momentum driven and hence provides the scaling for the length of the intrusion. Intro-
ducing a constant of proportionality a, eqn (27) may be written as
(28)
and hence substituting for Q at time t = 0, see eqn (5). gives the length of the intrusion as a function of the initial Froude number. namely,
L - = ‘a$:,i(l +Fr(o)‘)’ z H w
(29)
Experiments performed by Turner [ 121, in which a source of fluid heavier than its environment and with initial
momentum vertically upwards (so that the forces of momentum and buoyancy oppose), found that the negatively buoyant jet reached a vertical height of I .85 M’ “BP’ ’ before the momentum decreased to zero. Similarly. the intrusion is driven by the opposing forces of momentum and buoyancy and hence for simplicity we assume that x = 1.85. However, in contrast to the nega- tively buoyant jet studied by Turner [ 121, the momentum of the buoyant jet which enters the enclosure will be reduced on impact with the leeward wall. The predictions of eqn (29) with a = 1.85 are therefore expected to over- estimate the observed values of the intrusion length. The length of the intrusion L;H is shown in Fig. I I as a function of the initial Froude number. The experimental results (shown by the square markers) and the theoretical predictions. eqn (29). (shown by the continuous curve) are in close agreement over the range of initial Froude numbers considered and as expected the theoretical pre- dictions slightly overestimate the observed length of the intrusion. When the intrusion extends to the leeward opening, L = H-h,/2 and Fr(0) = Fr,,,,(O) and hence,
1.0
1 / 0
0.0 0.5 1.0 1.5 2.0 2.5 3.0
WO)
Fig. Il. The experimentally observed intrusion length as it function of
the initial Froude number. The theoretically predicted intrusion length, con (29). is shown as the continuous line.

G.R. Hunt, P.F. Linden ! Bui1din.q and Environment 34 11999) 707-720 719
from eqn (29) the critical initial Froude number is defined
solely in terms of the enclosure geometry:
(30)
By increasing the ceiling height H and the area of the windward openings a, and reducing the height of the leeward opening h,_ it is therefore possible to maintain a displacement flow over a wider range of wind speeds and temperature differences. For the geometry of the box used in the experiments eqn (30) predicts a critical initial Froude number of Fr&O) = 2.18 which is in good agree- ment with the observed value of approximately 2.5.
6. Example
As an example of combined wind and stack effects, consider a room in a low-rise building on an exposed site which is to be ventilated by natural ventilation. Suppose the room occupies the entire cross-sectional area, say 100 m’, of the building, and has openings on both the windward and leeward faces whose centres are separated by a vertical distance of 6 m. The windward opening (area 6 mz) is at low-level and the leeward opening (area 1.5 m’ and vertical height 1 m) is at high-level. Let the internal and external air temperatures be 25 and 15’C, respectively, and the wind speed be 3 m ss’.
From Orme et al. [5], the pressure coefficients at the windward and leeward faces of an exposed, low-rise building, for a normally incident wind, are C,i = 0.7 and
CPO = -0.2, respectively. From eqn (17) the square of the wind-induced velocity is then A/p = 4.05 m2 sP2. For a perfect gas. density and temperature are related by the equation of state P = pRT and hence
AT Ap
T P’
where AT denotes the temperature difference and T the absolute temperature. A 10 C temperature difference results in a reduced gravity ofg’ = 0.341 m se2 and hence the square of the initial buoyancy-induced velocity is g’H = 2.05 m2 sP2. The expansions and contractions to the flow at window or door openings are normally sharp and, therefore, we take C, = 0.5 and C, = 0.6’ and the effective area of the openings A* = 1.25 m’. The initial Froude number of the flow E(O) = 1.41 and from eqn (30) the critical initial Froude number EC,,,(O) = 3.59. The initial Froude number is considerably smaller than the critical initial Froude number and hence we expect a displacement flow to be established within the enclosure. The total time te for the room to empty of the warm air by a wind-assisted buoyancy-driven displacement flow is then
te =$[(y,+ ;)‘(;j’] z 215s.
It is interesting to note that the total time taken for the room to empty by the buoyancy force alone, te,, is
2s H; teh = A*
0 2 z 671 s.
This example illustrates that when the forces of buoy- ancy and wind combine to reinforce one another, the total emptying time of an enclosure is significantly less than that for buoyancy-driven ventilation. For the con- ditions prescribed in this particular example, the time taken to empty the space by buoyancy forces alone (671 s) is considerably greater than the emptying time if the space were ventilated by the combined effects of buoyancy and wind (215 s). Here, the buoyancy force acts merely to keep the fluid stratified and provides little expelling force.
7. Conclusions
An experimental and theoretical investigation of natu- ral ventilation by the combined effects of buoyancy and wind has been conducted. We have restricted our atten- tion to transient ventilation flows in which the effects of buoyancy and wind reinforce one another to ventilate the enclosure. In this case, a displacement mode of ventilation is maintained in the enclosure for a range of wind speeds and the space empties in a time te = (2S/g’A*)(,/m-a). Increasing the wind pressure drop A between windward and leeward openings decreases the total emptying time as does increasing the density difference between the space and the exterior. For a given geometry, initial density differ- ence and wind speed, the emptying time is controlled by the effective area of the openings A*. The effective area is dependent mainly upon the smaller of the ventilation openings and so the flushing rate is determined by the vent with the smaller total area. This has implications for providing occupants of naturally ventilated buildings with a sense of control over their environment; they may open a local vent, providing the controlling vent is unaltered, without disrupting the overall ventilation of the workplace.
Another important result deduced from the theory indicates the form of the nonlinear relationship between the natural forces of wind and buoyancy. It has been shown that the wind and buoyant forces combine to drive a total volume flux openings, where U, = P
+ = A*, U;+ U;. through the g’h and (/, = fi are the air
speeds induced by the effects of buoyancy and wind, respectively. A convenient aide-memoire and graphical representation of this relationship is a ‘natural ventilation

720 G.R. Hunt, P.F. Linden / Building and Enthmnwnt 34 i1C.W) 707-720
Ub
uw Fig. 12. The ‘natural ventilation triangle’ for buoyancy-driven dis-
placement flows assisted by wind. The base and vertical sides of the
triangle are set by the magnitudes of the wind and buoyancy produced
velocities, (i, and C’,, respectively. The length of the hypotenuse deter-
mines the total fluid velocity U produced by buoyancy forces reinforced
by wind.
triangle’, see Fig. 12. The lengths of the base and vertical side of the right angled triangle are set by the magnitudes of the wind and buoyancy induced velocities, respectively. The magnitude of the velocity produced by buoyancy forces reinforced by wind is then given by the length of the hypotenuse.
On increasing the initial Froude number a transition from a displacement to a mixing mode of ventilation occurs in which the efficiency of the ventilation flow is lower than for the no-wind case. The value of the initial Froude number at which this transition occurs depends solely upon the eometry of the enclosure and is given by I+,,,,(O) = (ab4(H-/2,/2)/(A*H”‘r))’ - 1. Hence Fr,,,,(O) also determines the conditions required to drain an enclosure by displacement ventilation at the maximum possible rate. By increasing the ceiling height H and the area of the windward openings aw and reducing the height of the leeward opening h, it is possible to maintain a displacement flow over a wider range of wind speeds and temperature differences.
The simple mathematical model developed in Section 2 shows good quantitative agreement with the exper- imental observations over a wide range of density differ- ences and wind speeds. It allows the temperature and
stratification within an enclosure to be predicted as a function of time and is easily extended to consider single- sided ventilation flows by combined buoyancy and wind.
Acknowledgements
The authors would like to thank the Building Research Establishment for their financial support of this project through the Department of the Environment’s Energy Related Environmental Issues (EnREI) in Buildings pro- gramme. We would also like to thank D. Cheesely, B. Dean and D. Lipman for constructing the experimental apparatus and for their technical support.
References
[I] Linden PF. Lane-Serff GF, Smeed DA. Emptying filling boxes:
the fluid mechanics of natural ventilation. J Fluid Mech
1990;212:300-35.
[2] Cooper P, Linden PF. Natural ventilation of enclosures containing
two buoyancy sources. J Fluid Mech 1996;3 1 I: 155-76.
[3] Linden PF. Cooper P. Multiple sources of buoyancy in a naturally
ventilated enclosure. J Fluid Mech 1996;3 11: 177-92.
[4] Allen C. Wind pressure data requirements for air infiltration cal-
[51
[cl
171
Bl
[91
[lOI
[I II
[121
culations. Technical Note 13. The Air Infiltration and Ventilation
Centre, Coventry, U.K., 1986.
Orme M. Liddament M, Wilson A. An analysis and data summary
of the AIVC’s numerical database. Technical Note 44. The Air
Infiltration and Ventilation Centre. Coventry, U.K.. 1994.
Davies GMJ, Linden PF. The effects of a headwind on buoyancy-
driven flow through a door-way. In: Proceedings of ROOM-
VENT’92. Third International Conference on Air Distribution in
Rooms. Vol 3. 1992. p. 419-33.
Hunt CR, Linden PF. The natural ventilation of an enclosure by
the combined effects of buoyancy and wind. In: Proceedings of
ROOMVENT’96. Fifth Internal Conference on Air Distribution
in Rooms. Vol 3. 1996. p. 23946.
Batchelor GK. An mtroduction to fluid dynamics. Cambridge
University Press, 1967. p. 615.
Ward-Smith AJ. Internal fluid flow-the fluid dynamics of flow in
pipes and ducts. Oxford: Oxford Science Publications, Clarenden
Press. 1980. p. 566.
DalLiel SB. RayleighhTaylor instability: experiments with image
analysis. Dyn Atmos Oceans 1993:20:127753.
Baker N, Linden PF. Physical models of air flows--a new design
tool. In: Mills F, editor. Atrium Buildings Architecture and Engin-
eering. 199 I. p. 13322. Turner JS. Jets and plumes with negative or reversing buoyancy.
J Fluid Mech 1966;26:779-92.