the flat dilatometer design applications 2.pdf · the flat dilatometer : design applications...
TRANSCRIPT
--
GEOTECHNICAL ENGINEERING DIVISION FACULTY OF ENGINEERING
CAIRO UNIVERSITY
THIRD GEOTECHNICAL ENGINEERING CONFERENCE
CAIRO UNIVERSITY .
JANUARY 5-8, 1997
THE FLAT DILATOMETER DESIGN APPLICATIONS
KEYNOTE LECTURE
Silvano Marchetti L’Aquila University, Italy

Third Geotechnical Engng. Conf. Cairo University, 5-8 Jan. 1997 Keynote lecture, 26 pp.
THE FLAT DILATOMETER : DESIGN APPLICATIONS
Silvano Marchetti
Faculty of Engineering, L’Aquila University, Italy
Bsmc’I Since the writer’s 1980 ASCE paper (Marchetti, 1980). a considerable amount of literature has been published on the DMT interpretation and design applications. Scope of this report is to highlight a number of signifkant new findings and practical developments.
1. INTRODUCTION A detailed description of the DMT equipment and
of the initial correlations can be found in the 1980 AXE paper and will not be repeated herein. Recommended comprehensive references are : Lunne et al. (I989), U.S. DOT (1992), Lutenegger (1988), ASTM Subcommittee D 18.02.10 (1986), Eurocode 7 (1995), Marchetti & Crapps (198 1), Schmertmann (1988) (the latter reference, while highly informative and detailed, is bulky and unfomnately difficult lo procure). This report tries to avoid material readily found elsewhere. However a brief review of the test methods and of the 1980 correlations is given. Then a number of significant new findings and practical developments are reviewed.
2. ORGANIZATJON OF THIS REPORT
To help the reader to find the topic of interest, the following table was prepared:
3. DESCRIPTION OF EQUIPMENT AND TEST PROCEDURE
4. INTERPRETATION IN TERMS OF SOIL PROPERTIES AND PARAMETERS 4.1 INTERMEDIATE PARAMETERS
4.2 CONS- MODULUS M (SAND AND CLAY)
4.3 MODULUS E’ (SAND AND CLAY)
4.4 MAXIMUM SHEAR MODULUS Go
4.5 UNDRAINED SHEAR STRENGTH Cu
4.6 OVERCONSOLIDATION RATIO OCR
4.7 Ko IN SITU
4.8 FFUCTIONANGLE w (SAND)
4.9 DR (SAND)
4.10 FLOW -CTERIsTIcs AND PORE PRESSURES
5. PRESENTATION OF DMT RESULTS
6. DISTORTIONS CAUSED BY THE PENETRATION
7. SPECIAL CONSIDERATIONS 7.1 SOME? COMMENTS ON THE CURRENT
ROLE OF INSITU TESTING
7.2 PARAMETER DETERMINATION BY ‘TRIANGULATION”
7.3 DRAINAGE CONDITIONS DURING THE DILATOMETER TEST
8. APPLICATION TO ENGINEERING PROBLEMS 8.1 SETTLEMENTS OF SHALLOW
FOUNDATIONS
8.2 VERTICALLY LOADED PILES
8.3 LATERALLY LOADED PILES
8.4 LIQUEFACTION
8.5 DETECTING SLIP SURFACES IN OVERCONSOLIDATED CLAY SLOPES
8.6 MONITORING DENSIFICATION / STRESS INCREASE
8.7 MONITORING DENSIFlCATION/ STRESSDECREASE
8.8 SUBGRADE COMPACTION CONTROL
9. CORRELATION WITH PARAMETERS OBTAINED BY OTHER IN SITU TESTS
10. DIFFERENCES VS AXISYMMETRIC PROBES 10.1 CONSEQUENCES OF PROBE’S SHAPE.
ARCHING.
10.2 INCREASED COMPLEXITY OF THE THEORETICAL MODELS
11. CONCLUDING REMARKS
11.1 GUIDETOTHEUSEOFDMTINTHE APPLICATIONS
11.2 PERCEIVED ADVANTAGES
12. BIBLIOGRAPHY
-l-

3. DESCRIPTION OF EQUIPMENT AND TEST PROCEDURE
The dilatometer (Fig. 1) wnsists of a steel blade having a thin; expandable, circular steel membrane mountedononeface.Thebladeisconnecmd,byan electro-pneumatic tube, running through the insertion r&l& to a control unit on the s&ace. The test starts by inserting the dilatometer into the ground. By use of a control unit with a pressure regulator, a gauge and audio signals, the operator determine in about 1 min_ the pO-pressme required to just begin to move the membrane and the pi- pressunrequiredtomoveitscenterl.lmmintothe soil. The blade is then advanced into the ground of one depth incremenf typically 20 cm_ using
1 PO 1 Pl
I.1 mm
Fig. 1. General layout of the Diiatometer Test
common field equipment_ The blade can be: - Pushed, with a Cone penetrometer rig. This
method yields the highest productivity, up to 100 m of profIle per day
-Pushed, with the hydraulic capability of a drill rig -Driven, with SPT or lighter equipment @mmer
and rods). InmostcasesaDMTsoundingstartsfiomthe
ground surf&e, with the tube running inside the rods. Alternately, one can start testing from the bottom of a borehole. In this case the tubing can either run all the way up inside the rods, or can exit laterally from the rods at any point above the blade. In all cases the penetration must occur in fresh (not previously penetrated) soil.
3.1.1.1 i&h&M&r ON THE WORKING PRINCIPLE - The membrane expansion is not a load controlled
test (apply the load and observe settlement) but a displacement controlled test (impose displacement and measure the required pressure ).ThuSiIlall soils the central displacement (and at least approximately the strain system imposed to the soi.l)isthesame.Itcanbenotedthatthe 1.1 mm displacement to 60 mm diameter is proportionahy equivalent to a 1.1 m central settlement ofa 60 m diameter storage tank.
- The membrane is not a measuring organ but a passive separator soil-gas. The measuring organ is thegageatgroundsutihce.Theaccumcyisthatof gage. The zero of&et of the gage can be checked at any time, being at surf&x. The gage can be replaced with a lower scale gage, to increase the accuraq to any desired level. The method of Bm measurement is the balance of zero (null method), providing high accuraq.
- The blade works as an electric switch (on/off), and is not a transducer. The level of the Dh4T operator can be the level of an SPT operator
3S.l.2 &MAR&T ON THE ULUtRATXON
Membrane corredions aA, AB are usually
measured, as a check, in the office before moving to thefield.HowevertheinitialAA,ABtobeusedin the data reduction are those taken jus2 before the sounding (though the difference is generally negligible)_ The initial AA, AB values must be in the following ranges: AA =0.05 to 0.30 bar, AB = 0.05 to 0.80 bar (see Eunxode, 1995). The change of AA or AB, at the end of the sounding_ must not exceed o.25bar*othetwisethetestshallberepeauA Ti%e LO rephce a membrane : In essence, an old membrane should not be replaced so long as AA, AB are in tolerance. Indeed an old membrane is preferable. in principle to a new one, having more stablecLA,AB.However,incaseofbadwrinkl~ scratches etc. a membrane should be changed even if ~bBareintolemnce(but~ABarenotlikely tobeintoleranceifthemembtaneisinreallybad shape). Z, = wm&on of the gage of control bar Until recently, hA AB were sometimes determined using a sepamte vacua manometer having the range -1to3barInthiscasethezeroofBetZmofthe gage of the control box had to be input in the reduction formulae. By contrasf today, with 64 Al3 also determined with the gage of the (dual gage) control box, even in case of a possible offset Zm, Zm hasanywaytobeputeqtaltozerointhereduction formulae. In f&q when 6 AB and all subsequent A,Baretakenwiththesamegage,theZm correction is aheady aaxumted for in a4 AB.
-2-

3.1. I.3 ACCURACY AND ~&RC~DUCIBILITY
- Displacement = 1.10 mm : Is determined as the difference between the plexigks cylinder height and the sensing disk thickness. These components are machined to 0.01 mm accuraq. and being solid pieces, their dimensions cannot be altered by the operator. Likely temperature dilatation of such components are less than 0.01 mm. Hence the displacement will be 1.10 mm +/- 0.02 mm. Such accmacy in displacement is not easily obtained by a transducer, even if temperature is measured and readings corrected accordingly. Importantly, the possible maximum 0.02 mm error in displacement would cause an error in the derived ED proportional to ED (max 2% of ED even in the softest soils, i.e. negligible). unlike instruments subjected to fixed (non proporfional) amounts of zero shift_ intmducing a large percentage error in soft soils.
- Accuracy of pressure and displacement : Since the accmacy of both pressure and displacement is high, the instrumental accuracy of the DMT resuh is also high, despite the simplicity of the operations. In general the operoror does riot even suspect the high accuracy of his measurements.
- Reproducibility : The high reproducibility of the DMThasbeen unanimously remarked by all investigators.
StainlesS steel Cylinder
Electric wire
STAINLESS STEEL
k MEMBRANE
I SENSING
P- DISK
I- PLEXIGLASS
SEAT
/ 1
GAS
3.Z.Z.4 ~SHINGMXCHINE
Light rigs may be used only in soft soils or to very short depths. In all other cases light rigs are inadequate and source of problems, and heavy truck penetrometers, incomparably superior, have to be used. Examples of problems with light rigs, such as many SPT rigs, are given below :
1. Such rigs have typically a pushing capacity of only 2 tons, hence refisaf is found very soon (often at 1-2 meters depth).
2. Moreover with many of these rigs : - There is no collar near groundsmface, i.e. no
groundsurface side-guidance of the rods - There is a hinge-&,pe connection in the rods just
below the pushing head, which permits excessive freedom to the rod system
- The distance between the pushing head of the rig and the bottom of the hole is several meters, hence the buckling length of the rods is too high In some cases the loaded rods have been observed to assume a “Z” shape.
- Oscillations of the rob mqy cause wrong results. In case of short penetration it is observed sometimes that, under high loads, the “Z” shape of the rods suddenly reverts to the opposite side. This is one of the few cases in which the DMT readings may be instrumentally incorrect In fact oscillations of the rods cause tilting of the blade, and the membrane is pushed without control close to/ far from the soil.
3.1.1.5 &WY RODS More and more heavy penetrometer trucks are now
equipped with rods much stronger than the common 36 mm CPT’ rods. Such stronger rods are typically 50 mm diameter, 1 m length, same steel as CPT rods (yield strength > 10000 bar). Such rods have been introduced as a consequence of the recognition that the rods are “the weakest element in the chain” when working with heavy trucks and the current high strength DMT blades (having a working capacity of approximately 30 tons). The stronger rods have several distinct advantages : - Better lateral stability against buckling in the first
few meters in case of soft soil - Better lateral stability when the rods are pushed
inside an empty borehole - Possibility of using completely the push capacity of
the truck - Capability of penetrating through cemented layers - Reduced risk of deviation from the verticality in
deep tests. - Drastically reduced risk of loosing the rods
Fig. 2. Working principle
-3-

Users of such stronger push rods have expressed enthusiasm about their acquisition, especially for use with cemented layers or obstacles.
Obvious drawbacks are the non negligible initial, &tar+-l,theheavierweight. ,, _.
4. INTEFiPRETATlON IN TERMS OF SOIL PROPERTIES AND PARAMETERS
Theprimarywayofusing’DMTresultsisto interpret them in tetms of soil parameters for engineering practice. In this way the engineer can compare and check the parameters obtained by various methods, select the design protile% then apply his usual design methods This methodology (design via parameters) opens the door, of course, to a wide variety ofengineering applications.
DetailsconcemingtheuseofDMTresultsin specific applications are covered in Section 8.
Origin of tbe correlatioos: The original 1980 correlations were obtained by calibrating DhfI resultsvshighqualitypammemm (for details, see Marchetti 1980). Many of these correlations form the basis of today interpretation, having been confirmed by subsequent research
Intermediate and conventional soil parameters : The interpretation evolved by first identifying three intermediute DMT parameters (ID, KD, ED), then relating them to soil parameters used in engineering practice. Smce the intetmediate parameters (in particular ID and KD) have some engineering usefulness, brief comments on them are given below.
A note on deriving ?hree iotermediate parameters from twu field madings. There is of come, M creation of information. The DM’I’ is just atwo-parametertest I~,K~,E~havtktn introducedbecauseeachoneofthemhassome recognizable physical. meaning, but only two are independent (if a tree produces 70 good apples and 30 bad apples, the recognition that 70% of the apples are good does not add informationP yet can be of some use).
4.1 INTERMEDIATE PARAMETERS
4.1.1 MATE= INDEX ID - SOa TYPE h g& ID provides a expsk ptie of soil
type, and in normal soils. a reasonable soil description. In the range of cohesive soils, however, ID sometimes misdescribes Silt aS Ciay and VicevCna And of course a combination of clay and sand would generally be described by ID as a silt
When using Id, it should be kept in mind that ID is not. of course, the results of a sieve analysis but a parameter reflecting mechanical behavior, possibly
some kind of “rigidity index”. With some exaggeration it can be said that, if one is interested in mechanical behavior, it may be more relevant for his application a description based on a mechanical response than on the real grain s&e distribution.
E.g. if a clay for some masons behaves more rigid& than most clays, such clay will be .probabiy interpteted by ID as silt Such description, while incotmctfiomthegrainsizviewpoint,maybe morerelevantiftheintemstinsoiltypewassome anticipation on mechanical behavior.
If, on the other hand the interest is on permeabiity, then ID should be supplemented by the Other index UD (SeaiOn 4.10.5). In particular UD is needed in a special niche of parually draining soils, where ID could be deceivingly too low (Section 7.3) because of the partial dissipation in the first minute.
- ID is a vety sensitive and reproducible index, spanning over 3 order of magnitudes (from 0.1 to 10). An homogenous formation is very well identified by 1~.
4.13 HORIZONTAL STRESS INDEX Kn K~canbetegardedasaKoamplifledbythe
penetration. The KD profile is similar in shape to the OCR protlle, hence KD is generally helpful for understanding the deposit and its stress history. The value of KD in NC clays (i.e. KQNC) ~2, i.e. approx. 4 times Ko,NC.
4.1.3 DILATOMETER MODULUS ED EDisobtainedfiomp,andplwiththetheoryOf
elasticity, for the appropriate dimensions and boundaty conditions. ED in general is not usable alone, espe&lly because it lacks information on svcs~ history. ED should be used only in combination with KD and 1~. The symbol ED should not evoke special aJini@ with Young’s modulus E. (see Section 7.2).
4.2 CONSTRAINED MODULUS (SAND AND CLAW
M is the vertical drained amfined tangent modulus (at cf,,J and is the same modulus which. when obtained by oedometer, is called Eoed (= l/n+).
The symbol MDW will be used herein sometimes toemphasizthatapa&ularvalueofMhasbeen obtained by DMT.
Mum is obtained by applying to ED the correction fbcror RM :
MDMT = RM ED (1)
The equations defining RM = f(l~, KD) can be. found in Marchetti (1980).
4

- Comments -R~tiesmostlyintherange 1 to3. - Experience with hundreds of sites has shown
MD~valiableintherange4to4ooobar. - (Algebraically, it would be possible to express
MD~ as a function of Po and pt. But then the role of each intennediute parameter would be completely hidden).
Necessity of applying the ~orre400 RM to ED - ED is derived from soil distorted by the
penetration. - The direction ofloading is horizo$al, while M is
vertical. - ED lacks information on stress history and ‘lateral
stress, reflected to some extent by KD. The necessity of stress history for the realistic assessment of settlements has been emphasized by many Authors (e.g. Leonards and Frost, 1988). In
mstnxtive paper analyzing the settlement of a gmpacted granular fill, Massarsch (1994) illustrates the importance&or settlement calculations, of the lateral stress jnqxase after soil compaction. According to mh it is: necessary (a) Take into account the overconsolidation caused by soil densification (b) Select the tangent modulus with due consideration to the lateral stresses.
-hC&yS,E~iS&k’Cdfrol3lalIUIbid expansion, while M is a drained modulus. Hence a few comments on the correlations are appropriate. In clay ED must be primarily r&t& to Eu. But reliableEuarehardtofindAlessdilBculttarget is lb& being less di&ult to find sites with “reliable” M profiles. The comersion undrained to drainedhaspresumablyapriaintermsof dispersion, but at least can be checked. The relation M-Ed must be a complex function of many paramaers, including Skempton pore pressureparameW..incethesepalameters(and anisotropy) depend (also) on soil type and stnss hiSto~&kctedtosOmeextcntby~~andK~ (available), ‘there is some &e for expecthg some dCgICedCOddiOIlbetwccnE~-h’&tithIDand KD a~ parameters. ID short, sina ED was correlateddirecUytoM,thefkctorR~akady incolporates au the involved factors.
Theabovereasoningisofaburscnoproveofa correlation M- ED, it simply offers some basii for expecting some degree of correlation. The final word goes to real world comparisons both in terms Of MDm - M&m Or in terms Of predicted b‘s measuttd settlements. Both types of comparisons (Figs. 3 and 4, and Fig. 20) are very encouraging.
The Lunne et al. (1989) report, after reviewing the experimental work on the M- ED correlation aazumulated sina 1980, concludes with the recommendatjon .of using the original 1980 wrrelation. _, \:
CONSTRAWEO tlOOULUS. !I INhI
Fig. 3. Comparison of constrained modulus from DMT and from high quality oedometers, Oosoy clay (Lam 1986).
S
3 E 0 10 B
1s i
Fig. 4. Comparison of constrained modulus from DMT and from high quality oedometen (lwasaki et aL 1991)
4.3 MODULUS~E” (SAND AND CUy3 The Young’s modulus E’ of the soil skeleton can be
derived tirn M via theory of elasticity, both in sands and clays. For a Poisson’s mtio v = 0.25430 oneobtains FnO.SM’
4.4 MAXIMUM SHEAR MODULUS Go Correlations have been proposed relating DMI’
results to Co. A particularly well documented method has heen proposed by Hryciw (1990). Other methodsaremmmarkdinthereportsbyLunneet al. (1989) and US DOT (1992) .
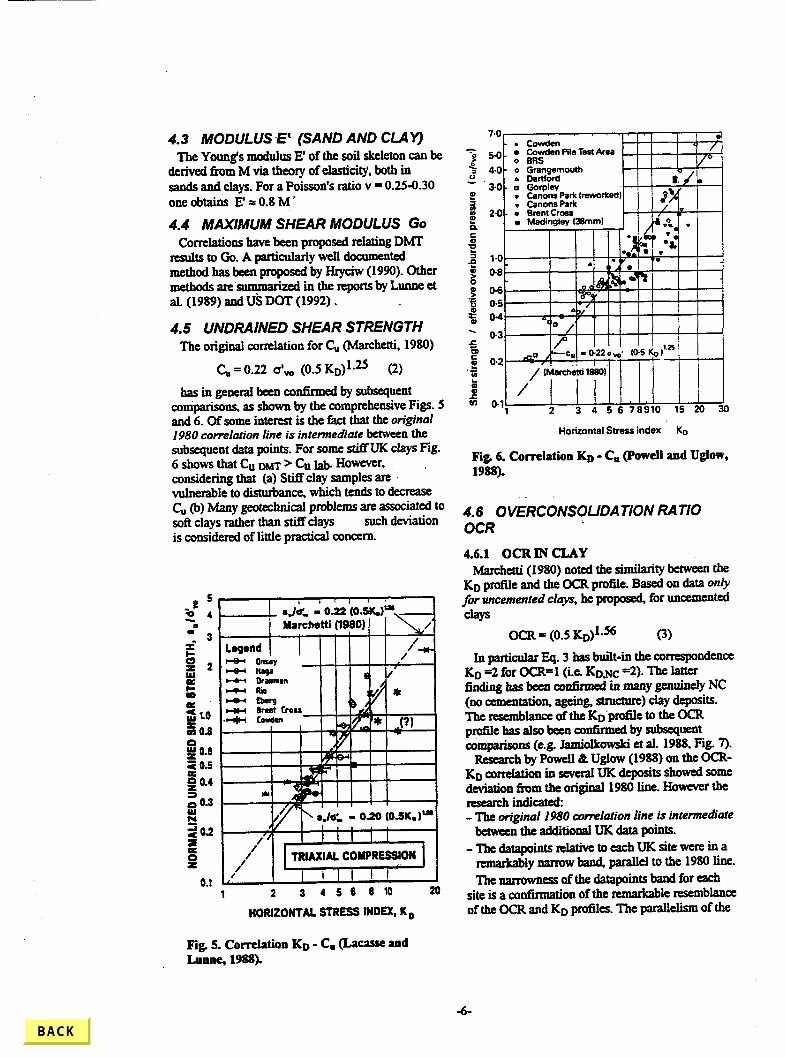
4.5 UNDRAINED SHEAR STRENGTH The original correlation for C,, (Marchetti, 1980)
C,, = 0.22 Q’, (0.5 KD)1-25 (2)
has in general been conkned by subsequent coniparisons, as shown by the comprehensive Figs. 5 and 6. Of some interest is the fact that the original 1980 correlation line is intermediate between the subsequent data points. For some stiffUK clays Fig. 6 shows that Cu Dm > Cu lab. However, , considering that (a) Stirrelay samples are vulnerable to disturbance, which tends to decrease C, (b) Many geotechnical problems are associated to soft clays rather than stiff clays such deviation is considered of little practical concern.
/* tRlAXlAL COUPRESSION
/
1 2 3 4 5 6 8 10 20
HORIZONTAL STRESS INDU(, K o
1 ii I I
Horizontal Stress index Ko
Fig. 6. Correlation KD - C, (Powell uld Uglow, 1988).
4.6 OViRCtiNSOUDA TION RA TlO OCR
4.6.1 OCR IN CLAY Marchetti (1980) noted the similarity between the
KD profile and the OCR prome. Based on data only for uncenrented clays, he proposed, for uncemented Clays
OCR = (0.5 K&.56 (3)
In particular Eq. 3 has built-in the correspondence KD =2 for OCR-1 (i.e. KD,NC ~2). The latter tiding has been confumed in many genuinely NC (no cementation, ageing structure) clay deposits. TheresemblanceoftheK~‘profiletotheCCK profile has also been confirmed by subsequent comparisons (e.g. Jamiolkowski et al. 1988, Fig. 7).
Research by Powell & Uglow (1988) on the OCR- KD correlation in several UK acposits showed some deviation from the original 1980 line. However the researchindicated: - The original 1980 cowelation line is intermediate
between the additional UK data points. -ThedatapointsrelativetoeachUKsitewereina
remarkablynarrow band, parallel to the 1980 line. The narrowness of the datapoints band for each
site is a confirmation of the remarkable resemblance of the OCR and KD profiles. The parallelism of the
Fig 5. Correlation KD - C, (LX- and Lunne, 1988).

-
datapoints for each site to the 1980 line is a cou6rmation of its slope.
The 1980 Ku - OCR correlation for clay was also continned by a recent comprehensive collection of data by Kamei and Iwasaki (Fig. 8). and,’ theoretically, by Fiio, 1993 (Fig. 29).
Ko OCR
.~alol2(IEloun o? , , / / , * 12 , I I
. OMT
2- - -+ IL-OECOMETER‘TESTS + cnSOwOMElER TE
4-
. e- .
. a-
s lo-
. .
. . .
. - e* 9 . .
tm . . . .
20- . .
22- . .
. . . .
24 - . .
a’ ’ ’ I ’ ’ I I I * I .
Fig.7. Overconsolidated Augusta clay. Left : similarity of KD to the OCR profile. Right : DMT predicted (circles) vs OCR by oedometers (Jamiolkowsk.i et al. 1988)
Fig. 8. Correlation between Ku and OCR for cohesive soils from various geographical area (Kamei and Iwasaki, 1995)
Cemented-aged-structured clays (for brevity called below “cemented clays”)
In cemented clays the matter complicates. The original 1980 line, for uncemented clays, is inapplicable. Nor can it be expecmd a unique OCR- Ku correlation for all cemented clays, because the deviation from Eq. 3 depends on the entity of the cementation. In general datapoints for cemented clays should be kept separated, without attempting to establish a unique average correlation.
NC cemented clay : Marchetti noted that in the Fucino NC cemented clay Ku was larger than 2 (say 3.5 to 4 ) and constant with depth, despite being geologicaUy NC.
Similar well >2 KD valuer. mllstant with depth, were found in several geologically NC Norwegian clays (e.g. Onsoy).
However in .&se and other similar cases the condition of normal consolidation could be easily re&gnized from the Ku profile (despite KD > 2) becauseKudoesnotdecrease witbdepth,asinOC deposits it always does.
OC cemented clay : Research in S. Barbara OC cemented clay showed that the cementation resulted in OCR predictions by Eq. 3 considerably higher than the geological OCR This confIrms that the cementation increases Ku i.e. Ku is the combined result of OCR and cementation. This did not surprised& Barbara clay investigators, who had always noti& in this clay, higher strength and sW&ss than other clays of similar geological OCR Thus,inasense,thehighOCRpredictedbyEq.3 (an extended OCR) might be for some aspects preferable to the geological OCR if it is used in correlations for esWating mechanical properties (Marchetti, 1979).
Ceuuiue NC uncemented clay : Recent research in the remo&d reconsokiated NC clay in tbe shear z4NlCattkbaseOfahDddi&hasCOnfirmedK~~~
inagenuineNC&y.Thisco&msK~a2asthe floor value in absence of “cementation”.
4.6,l.l PR4CTKAL INDIG4TIONS FOR EsTu)Iz4TING OCR IN VARIOUS CLAYS - The original 1980 correlation is a good base for
getting a first intexptetation of OCR or, at least, information on its shape.
- In general the KD prome is helpful for understanding the stress history, clearly discerns NC from OC clays, clearly detects shallow or buried desiccation crusts. The KD profile is often the6rstdiagramtoinspecttogetataglancea genetal grasp on the stress history.
- NC clays : Insp&on of Ku profile permits to distinguish genuine NC clays (Ku =2= constant with depth) from cemented NC clays (Ku = 3 to 5 = constant with depth). In these clays any excess
-7-

of KD compared with thefloor value 2 provides an indication of the intensity of cementation (struaure, ageing).
- OC days : In cemented OC clays mspection of the KD profile does not reveal ~eme~ation a~ clearly as in NC clays (though the cementation shows up intheformofalessmarked~OfK~with depth). In such clays the geological OCR will be overpredicted by Eq. 3.
-Highly aaauate and detailed profiles of in situ OCFtcanbeobtai&bycalibratingtheOCR predictionsvsafew(intbeoryevenoaeortwo- see Powell & uglow, 1988) high quality oedometem. Sii OCR is a parameter difKcult and costly to obtain, for which then are not many measuring options_ the possibility of projecting via KD a large number ofhigh quality data appears useful.
- The basic correlation KD - OCR (the one for non cemented clay, currently expressed by Eq. 3) is expectedtobenarrow, and should retain the value KD =2 for NC clay, without attempting averages including both the KD for uncemented and cemented clays. For cemented clays it, is simply recommended to combine Eq. 3. with the awareness that such Eq. 3 will overestimate OCR
4.6.1.2 OCR AT BOTHKENNAR
An insvudivc case history concerning the ability of DMT to predict OCR is available for the UK national research site of Bothkemmr. The results of a first careful hwestigation (high quality piston samples, Laval samples, Lantis pmparation technique, small increment oedometers etc..) were published in Geotechnique (June 1992). The published results (p. 17 1, Fig. 8b) included OCR by VariousmethodsandalsoocRpredictedbyD~. OnthebaseofalltheresultstheAuthorsconchtded “is apparent that [OCR] is approximately constant with depth”. Thiswns somewhat in contrast with the OCR profile pm&ted by DMT. exhibiting at 10 m depth a recntrmr~ suggesting a “a mild buried ctust”.Aftermanyadditionaltes&oneyearlater (1993). the organ&s sent to many investigatots around the world updated data on Bothkennar, inchxling a m-edited OCR profile. In this new ’ CditiO~ following the additional investigatio4 the “mild buried crust” was comirmed.
Inconclusion:inthiscasedetailsoftheOCK profile were initially missed by a high quality investigation. An additioaal investigation co&med one year later shape details that DMT had predicted atafractionofthetimeandcost.
4.6.2 OCR IN SAND The detetmination (even the definition) of OCR in
sand is more di5cult than in clay. While many textbook+verconsotidated-clay exist,.due to removal ofove&rden,OCRin&ndis~theresultofa complex history of preloading or desiccation or other e&c&. Moreover while OCR in clay can be demrmined by oedometers, sample disturbance does notpermitthesameinsand.ThereGoresome approximation must be accepted.
A way of getting some information on OCR in saadistousetberatioM~~/q~.Thebasisisthe following: 1.
22
3.
4.
Jet&by (1992) performed DMT and CPT before andaftercompactionofaloosesandfill.He found that before compaction (i.e. in nearly NC sand) the ratio MD~ / q, was 7-10, after compaction (i.e. in CC sand) 12-24. CC research (Baldi et al. 1988) comparing qf with M @oth measured on the CC specimen) found ratios Mcc/ qc : NC sands 4-7, OC sands 12-16. Additional data (Jamiolkowski, 1995) in sands i%om instrumented embankments and screw plate, indicated a ratio (in this case E’/ qc ) : in NC sands 3-8; in OC sands lo-20 The well documented finding (Section 8.5) that compaction effects are felt more sensitively by &&dQ'q,~ilII~tiC!SthatMD~/q,iS
increaSed by compaction/ pmcompression
Hence: -oCRinsandscanbeatk!astapproximately
evahWedft’omtheratioMD~/q,ttsingas tierence the following values : range 5-10 for NC sands, range 12-24 for CC sands.
-ThesimihUitybetweenMD~/qcandother mfemnceM/p,bothinNCandCCsan&isin supportofthedirectuseofMD~insettlement anal* as already being inclusive of the OCR e@ects.
Apart~mquantitativecstimaW shallowor buried desiccation crusts in sands appear well highlighted by the KD progle, as exemplified by the “KDcrusts”inFig.9. (7’heshahow”K~crusts”inFig.9amnotbeheved a consequence of their vicinity to groundsurface, i.e. dihWcyeffects,beCW&fitwaSsO,‘K~crusts” would show up in most sand proGles, which is not the case. Nor is it likely that the Dr variation with depthwassuchtogentratcaKDshapesosimilarto the typical shape Of KD in desiccation crusts).

-
Id M=l/m.v Kd
Id M=l/m.v Kd
Fig. 9. Example of ‘* KD crusty” in sands (Above : PO river ; Below : Verona)
4.7 Ko IN SITU
4.7.1’ Ko IN CLAY The original 1980 correlation for clay was
Kc, --(xp /1.5)“.47 - 0.6 (4)
The comprehensive Fig. 10 (I(ulhawy & Mayne 1990) summark the correlation K. - Kp for a variety of clay sites. It can be noted : - The agreement with Eq. 4 appears reasonable,
especially considering that, in many applications. even an approximate estimate of K. is suflkient.
- The original 1980 curve is intermediate between the subsequent data points.
Sanritiva ClOyt (&= 2.0)
Horizontal Stress Index, Kg
Fig. 10. Correlation KD - Ko in ckty (Kulhawy & Mayne, 1990).
4.7.2 K. IN SAND Eq. 4 was obtained by interpolating datapoints
reIative mostly to clay. The very few (in 1980) datapoints relative to sand seemed to plot on the same curve. However subsequent sand datapoints showed that Eq. 4 does not work acceptably in sand.
In 1983 Schmertmanq based on CC results, identified a Ko- I<& amehtion (the lengthy fhctionlike expression reported as Eq. 6.5 in US. DOT 1992), convertible into a Ko vs Kp diagram containing, in place of the unique Ko-Kp Eq. 4, a familyofKo-K&utves,OnecuWefOreach’$’.
Since (b is in general unknowtk Schmertmann suggested to use also the Durgunoglu & Mitchell theory, providing an additional condition q&o-+ if Q (or qd ), is also measured. He suggested an itera- tive computer procedure (relatively complicated) permitting the determination ofboth Ko and 0.
To facilitate calculations, Marchetti (1985) prepareda~chartinwhich+waseliminated,by combination of the 1983 Schmertmann Ko-K& relation and the D&M qc- Ko+ relation. Such chart (reported as Fig. 6.4 in US DOT 1992) provides Ko, once qc and Ku are given.
In 1986 Baldi et al. updoted such chaH by incorporating all subsequent CC work. Moreover the chart was converted into simple algebraic equations:
Ko = 0.376 + 0.095 Ku - 0.0017 qc I d, (5)
Ko = 0.376 + 0.095 Ku - 0.0046 4~ I o’vo (6)
Eq.5wasdetemtinedasthebestfitoftheCCdata (obtained oa art~~cial sand), while Eq. 6 was obtained by modifying the last cue&ient of Eq.5 to predict kotrectly’ K. for the natural PO river sand.
In practice the today recommen&tion for Ko in sandistousetheaboveequationswiththefollowing values of the last coe.Wient : - 0.005 in “seasoned” sand$ - 0.002 in “freshly deposited” sand (though such choice involves some subjectivity).
While this is one of the few methods availabIe for &mating K. in sand (or at least its shape), its reliabilityisdif6culttoestablish,duetoscarcityof feSexmavalucs.Caseshavebanrcpotiof satibtory agreement (Pig. 11, Jamiolkowski 1995). The titer found sometimes unconviucing Ko, especmlly iu cemented sand (expecmble, due to the additional unknown cementation).
An inconvenience of the method is the required availability of both DMT and CPT and the diflsculty of matching Kp and qE (e.g. of sloping layers or highly s&at&d deposits). Such matching may be interpreter dependent and time consuming. The recommendation, in case, is to choose for the match only a few well chiuacterized layers.
-9-
,O 02 0.4 0.6 0.8 1.0 12
9
11
t ‘E 13
g 15
17
19
Fig. .li. & from DMT’s and SBPT’s in natural Tiiino sand at Pavia (Jamiolkowski 1995)
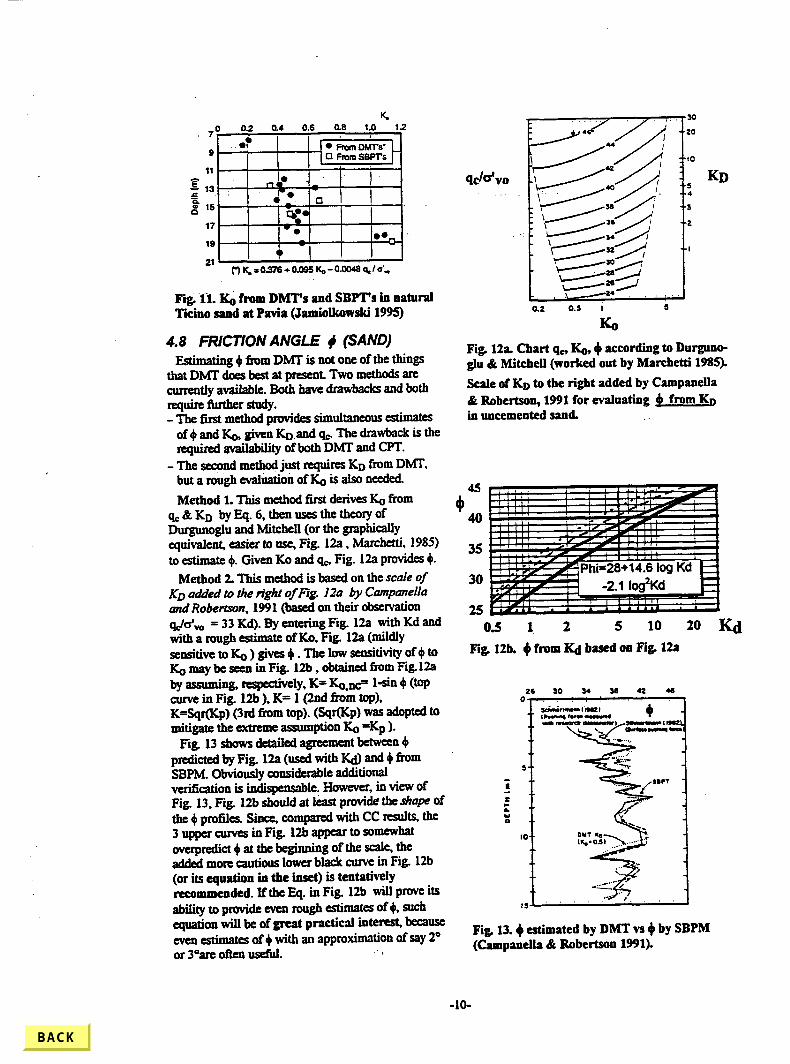
4.8 FRICTIONANGLE + (SAND) Edmating I#I fmm DMT is not one of the things
thatDh4TdoesbestatpreseWTwometiodsare currently available. Both have drawbacks and both require further study. - The first method provides simultaneous estimates
of 0 and Ko, given KD.and qe The drawback is the required av&ilability ofboth DMT and CPT.
- The second method just requires KD from DMT, but a rough evaltioi~ of Ko is alsO needed.
Method 1. This method first derives K. from ~E&KD byEq6,thenusesthetheoryof Durgunoglu and Mitchell (or the graphicaIly equivalent, easier to use, Fig. 12a. Marchetti, 1985) to estimate 4. Given Ko and 9~. Fig. 12a provides 6
Method 2. This method is based on the scale o/ Ko added to the right ofFig. 120 by Campanella and Robertson, 1991 (based on their observation q&v0 = 33 Kd). By entering Fig. 12a with Kd and with a rough estimate ofKo, Fig. 12a (mildly sensitive to KO ) gives + . The low sensitivity of 4 to KomaybeseeninFig. 12b,obtainedfromFigXa by assumia& respectivtly, KS Ko,nc l-sin + (top curve in Fig. 12b ). K= l(2nd from top), K=%rO (3rd from top). (SqrWp) was adopted to mitigate the extreme assumption Ko =Kp ).
Fig. 13 shows detailed agreement ktwan 4 pxedictedbyFig. lZa(usedwithKd)and+f?om SBPM. Obviously considerable additional verification is -le. However, in view of Fig. 13, Fig. 12b should at l&t provide the shape Of the 4 profiles. Sii compared with CC result& the 3 upper cmves in Fig. 12b appear to somewhat overpredict + at the beginning of the scalq the added more cautious lower black curve in Fig. 12b (or its equation ia the inset) is tentatively rccommeoded. If the Eq. in Fig. 12b will prove its ability to provide even rough estimates of 4, such equation will be of great practical interrst. because eveu estimates of + with an approximation of say 2O or 3%e often usetill. ‘(
s&ho KD
Fig. 122 Chart q0 Ko, + according tu Durguno- glu & Mitchell (worked out by Marchetti 1985).
Scale of KD to the right added by Campanella dk Robertson, 1991 for evaluating $ from Kr, in uncemented sand.
45
cb 40
35
30
OS 1 2 5 10 20 Ka
Fig. 12b. 4 from Kd based on Fig 12~
Fig. 13.0 estimated by DMT vs 0 by SBPM (Campanella & Robertson 1991).
-lo-

4.9 OR (SAND) For NC uncemented sands, Dr can be estimated
from KD using Fig. 14 (Reyna & Chameau). If Fig: -14 is used for OC sands, since p&t of KD is
due to the okrcksolidation rather than to Dr, Fig. 14 will overprklict Dr. The amount of tlie ove&edktion is unknown~(until Fig. 14 is completed with cwcs for OCR sands i ifit will be possible): :
I .,
Fig 14. Beiative Density vs Ku for NC uncemented sands (Fteyna & Chameau, 1991)
4.10 FLOW CHARACTERISTICS AND PORE PRESSURES
4.10.1 COEFFICIENT OF CONSOLIDATION Cll
Two methods are available for e&mating the horizontal coefllcient ofconsolidation &using the D~.I.nbothcasestheDh4Tbladeisstoppedata givendepth,thensomeformofdecaywitlltimeis observedandplottedtoinferCh.Notetbat,as shown by piezocone research the dissipation is governed in most cases predominantly by Cb rather thanbyC,whichistherrasonwhyChiSthetarget of these pmcedmes.
4.X0.1.1 DMT DISSIPATION : METHOD DMTA
This method (Marchetti &d’Totani, 1989) consists instoppingthebladeatagivendepth,thentakinga sequenaofmadingsA.(NotetbatonlyAistaken, without performing the expansion to B, i.e. deflating immediately after A is reached). In practice the methodisbasedontherateofdecayofthetotal contact horizontal Svess o,, . Such decay rate was
observed to be fist in permeable soil, slow in less permeable soils, hence the attempt to link the decay time to Cb. The suggested steps for evaluating Cb by this method are:
l Plot the A-log t curve
l Identify the contratIexure point in the curve and the associated time CTnex)
l c&iinCbs
Cqoc =7cm2/Tgw (7)
Thismethodissometimescalled”A&deflate”
The DMTA method is very similar to the “holding test” by PMI. There are some differences :
Flty:InthecaseoftheDMTblade,theflxity during the holding test is inherently insumd, being the blade a solid object (in the case ofthe expanded PMT the ilxity is obtained by adjusting the pressure based on feedbadr from diameter measurements).
‘Theoretical lnterpretatioa : For the PMT holding test the theory is available. It was developed by Carter et al. (1979) who were able to establish theoretically the law of decay for oh. The corresponding theory is not available for the decay of q, in the DMT, more di.fBcrilt to model. However, since the phenomenon is the same, the theory is expected to be similar. Waiting for the theory, the most efkctive way appears to use an experimentally calibrated relation such as the above Bq. 7.
It should be noted tbat Cl, from Bq. 7 refers to the soil behavior in the OC range. A Ct, value several times lower should be adopted for estimating the settlement rate in a problem involving loading mainly in the NC range.
4.10.I.t DMTDISSZPATION : METHOD DMTC
This method (SchmertmaM 1988, Robertson et al. 1988) consists in stopping the blade at a given depth andtakin&atsubsequenttime&tbesequence A-B-C. From the rate of decay of the closing pressureCtheaboveAuthorsobtainCt,e&nates
A detailed summary ofthe Schmertmann (1988) procedure can be found in US DOT (1992).
Awelldetailedstep-by-stepprocedmeisdescribed byRobertmnetal. 1988,similartot&tusedforthe interpretation ofCPTU dissipation tests.
BotlltheabonpNXXdmeS~basedOntlX assumption (suBlciently approximate for soft clays, but dubious in more consistent clays) that C is the current average pore pressure in the soil facing the membran~thensucbdecayisusedinasimilarway as in the piezocone interpretation.
-ll-

The problem of filter smearing or clogging does not exist witb the DMT membrane, because the membrane is anyway a non draining boundary, and what is monitored is a total contact stress (the water flows uwqv from the membrane). Similarly, loss of saturation of the gher is a non-problem in the “bloodless” (dry) DMT dissipations. The distortion (turbulence) in the soil surrounding conical tips is more severe. Around a cone there is a multiplicity of u(t) decay curves (of different shape). Generally u(t) is measmed at one location, but its represemativity of u(t) elsewhere is unknown. While u(t) vary from point to pains settlements (e.g. under an embankment - the membrane can be regarded as a mini lateral embankment) have a more stable trend beiig some kind of integral. The superior stability ofTgex (from DMIA dissipations) over T50 (CFTU dissipations) is clearly seen in Fig. 6 of the Marchetti & Totani, 1989 paper, hence the superior stability of the inferred Ch.
4.10.2 COEFFICIENT OF PERMEABILITY Schmertmann and Crapps (1988) suggest the
following tentative procedure for deriving Kh from Ch: -BstimateMhusing Mh=Eoh$nrr,i.e. .’
assumingM proportional to the effective stress in thedesireddirection .
-obtainKh=Ch yw/Mh
4.103 ACCVRACY OF Ch BY DMT Given the scarcity of reliable ref&nce values, it is
not possible today to evaluate adequately the quality of Cu predicted by DMT. It is only possible to list the physical reasons why the potentiality of the DMT dissipations appears promisiig:
4.10.4 IN SITU EQUILIBRIUM PORE PRESSURE by C-READING in SANDS
The DMT, though non provided with a pore pressure sensor, permits, in freelydraining gramdar soils (B L 2.5 A), the determination of the pre- insertion ambient equilibtium pore pressure Uo. SinceanalysisoftheDMTdatadependsonthein situ effect& stress_ water pressure is an important andusefulmeasmement.
The reason why the DMT closing pressure (C-reading) closely approximates Uo in sand (e.g. Campanella et al., 1985). is the following. During inflation, the membrane displaces the sand away from the blade. During deflation the sand has little tendency to rebound rather tends to stay there, without applying effective pressure to the membrane
(& =O, hence oh = Uo). Therefore, at closure, the
only pressure on the membrane will be Uo. This mechanism was well known to pressuremeter
investigators, who discovered long ago that the contactpress&inadisturbedpressure metertestin sand is essentially Uo.
In clay the method does not work because, during deflatio~theclaytendstoreboundandapplytothe membrane some effective stmsses, hence C > Uo.
Unfortunately several users, including the writer some years ago, have reported poor C-readings, mostly due to improper technique. A brief review is provided here as a refresher. After reaching B, the operator opens the slow vent valve (instead of the fast vent valve) and simply waits (it will take approximately 1~ 1 minute) until the pressure drops approaching the zero of the gage. When the signal returns, then the operator should take the C-reading.
The mistake often consist in this. After B, i.e. when the slow deflation starts, the signal is on. After some time the signal stops (from on to 0B). The mistake is to take this inversion as C, which is incorrect (this is the B position). The correct instant for taking C is some time later, when, completed the deflation, after say 1 minute, the membrane retutns to the “closed” A-position, thereby contacting the supporting surface and reactivuting the signal. It alsohelpstokocpinmindthasinsands,thevalue tobeexpecmdforCisalownumber,usually<1or 2 bar, i.e. 10 or 20 m of water.
InsandamissedorpoorC-readingmaybe repeated by duplicating the A-B-C sequence at a given depth, which is also a useful check.
Uo is then estimated as ~2, where
pZ’C-Zm+AA (8)
@z is C corrected for membrane stiffness and gage deviation).
In problems where, besides Uo, it is of interest to discern fmelydraining layers from non freely-dmining layers (see next Section) it is recommendedtotakecroutinely.Inabsenceof such interest, C-readings may be taken every one or twom,preferablyinthemoresandylenses.
4.10.5 DISCERNING FREELY-DBAINING FROM NON FREELY-DRAINING LAYERS. II’lI.)Ex UB
In problems involving excavations, dewaWing piping/ blowup control, flow nets etc. the identifzation of freelydmining/ non freely-draining layers is impottant-
For such identigcation, methods based on the DMT C-reading (corrected into pz by Bq. 8) have been developed (see Lutenegger and Eabir’s 1988 Bq. 2, or Schm ertmann’s 1988 Bq. 3.7).
-12-

The basii of the methods is the following. AsdiscussedinthepreviousSection,in
fnelydmining layers pz P uo. In layers not lieely-draining enough to complete
thedissipation in the say 1.5 min elapsed since insertio&some excess pore pressure will still exist atthetimeoftheCreading hencepz>Uo.
Therefore : p2 = Vo bdiudm ta nfred*aining soil” (= dissipation completed in l-l.5 min) while p2 > Vo indktes 4 “non freeily-drcrining soil”. The more p2 exceeds Uo, the lm permeable is the soil.
Indu Ud. Based On the abOve, the pore pressure index UD was defined by Lutenegger and Kabir (1988) as :
uD=@~-llO)/@o-UO) (9)
In freelydraining soils, where pz = Uo, UD P 0. br non freelydraining soils, p2 will be higher then Uo and UD too.
The example in Fig. 15 (Benoif 1989) illustrates how UD can discern “permeable” layers (UD =O), “impermeable” layers (UD =0.7) and intermediate permeability layers (UD between 0 and 0.7), in agreement with Bq from CFTU.
Note that UD , while useful for the above Scope, caonot be expef%d to offer a scale over the full range of permeabiities. In fact beyond a certain k the test will be drained anyway, below a certain k the test will be undrained anyway.
In layers recognized by UD as non freely-draining quantitative evaluation of ct, can be obtained e.g. using the DMT dissipations described earlier.
In layers recognized by UD as freelydraining, the DMT dissipations will not be performed (the Dh4T dissipations are not feasible if most of the dissipation occurs in the first minute, because readingscannotbetakenintheiirst I 15sec).
5. PRESENTATION OF RESULTS Fig. 16 shows the recommended graphical format
oftheDMToutputSuchoutputdi@ays4profiles, namely Id_ M, G, Kn. This choice is not accidental, but is the result ofa long evolutios resulting from analyzing DMT data at some 500 sites. Experience has shown that them 4 parameters are generally the most significant group to plot @alancing reliability, expressivity, usefulness). Note that KB though not a common soil pammeter, has been selected as one to be displayed being generally helpful in I uoderstanding” the site history, being Similar in shape to the OCR profile.
It is also recommended that the diagrams be presented side by side, and not separated. It is very beneficial for the user to see the diagrams together.
A key question is who should reduce the data and at what point to stop the reduction. Here two viewpoints have to be considered :
(a) If the organimtion performing the DWs stops the rcductionk ID, KD, & then it is likely that errors will be introduced at some later stag% not only by users unfamib with DMT reductions, but alsobywellorganizedusers,justbecauseofthe break in the smooth flow of data
(b) We, as engineeq want to be fke to interpret the data ourselves, and strongly dislike some test outputs giving “everything”.
The recommendation is that the organization performing the test supplies either ID, KD, ED and
CPTU : Normalid pne presswe lW.io.~ DMT :PoreprcssmhdexUd
Fig. 15. Use of UD for discerning freely draiaing layers (UD 4) from son-freely draining (Bextoit 1989)
IO C1h.v (bar) Cu (bar) Kd
Fig 16. Recommended hphical presentation of DMT results
-13-

the interpreted parameters (Possibly in the recommended graphical format) specr@ktg clecrly the correlations used. In many eases the correlations will be the ~originall980 awrelations, shown oflen in this repOrtsmostly intermediate between the : subsequent aafa’pointsl Such ititer@t&l parameters can provide a “base” ofintexpretation. Ofcourse the engineer can later perform a iiifferrntinterpretation by restarkg km 1, Ku, ED (objective parameters) using his own correlations.
A ease in point is the “Settlement of Spread Footing Prediction”, Texas A&M University, (ASCE, 1994). A prediction package, with the re- sults of various field tests, was sent to the predictors.
The writer’s group supervised the DMT field work and gave the organizers, for distribution, both ID, KD, ED, and the interpretations (using the 1980 correlations) oftwo DMTs. The organizers sent to the participants only the raw data and ID, KD, ED (recalculated by them), without the interpreted MD~. Unfottunately, in the process, the organizers mistrawxipted the initial test depth for Dh4T2 (real depth = 1.2 m, wrong depth = O.Zm), so that all the KD they rtcaiculattd (and distributed) were also wrong (list ofK~ on p. 71 of the Prediction Symposium Pro&, 1994). Hence the predictors, besides &king the interpreted Mum, had even to work with the wrong KM. Result : - Some predictors, unfamiliar with the reduction,
ended up by using ED (confused with a Young’s modulus) instead ofM (a gross mistake, see Sections 4.2 and 7.2).
- Some predictor& failing to recognize similarities between DMTl and DMT2 (Iargely mislead by the wrong depth and the ensuing wrong KD), explained the lade of similarity with the “inherent non-qwoducibili~ of sands and the inevitable vagaries in such soils”.
Fig 17.. Ptiies of M obtained in sand by two DMTs at the’prediction tests site (Texas A&M)
Had the organizers distributed Fig. 17 (included in the documents given by the writer to Texas A&M for distribution - believed a remarkable example of reproducibility in sand) every interested predictor could have produced classical settlement predictions usingMintheusualways. Restofthestoty:
Footing 33 m : Eq. 10, with MD~ in Fig. 17, predicts 4.8 mm/bar, which, afler a footing rigidity unrection of 0.8, becomes 3.84 mm/bar. Hence, to cause the lvorking conditions”settlement 0.5% B (Section 8.1), equal to 15 mm, a load of 3.91 bar has to be applied, i.e. 3519 KN on a 9 m* footing. Thus for a 3519 m load Sl_Dm -15 mm, while S* (Fig. 3 on p. 97 of AXE, 1994),was 12 mm, with an Sl_Dm OVkxpdktiOn Of +250/o. Footing 1.5x1.5 m.: Similarly, for an applied load of 844 Kl$ St_Dm = 7.5 mm (0.5% B). VS fibsawd =
6.5 mm (Fig. 6 on p. 100 of AXE, 1994), with a +15% overpredietion.
6. DISTORTIONS CAUSED BY THE PENETRATION
Fig. 18 compares the distortions caused by conical tips and by wedges. It eari be noted:
Fig. 1hDeformed grids by Baligh & Scott (1975)
-14-

- Distortions are considerably lower for wedges, reducing the amount of back-extrapolation needed to infer pm-penetration soil properties.
T The cone penetration creates considerable turbulence. Thiz strain pattern bears no
,
resemblance to that of a cylindrical cavity expansion (that would produce a deformed grid made of vertical and horizontal lines), as assumed in mauytheoretical studies.
- The strain produced by conical tips should not be of concern when looking for strength, but perhaps makes it dlfkult to investigate fzompmssibiity.
7. SPECIAL CONSIDERATIONS
7.1 SOME COMMENTS ON THE CURRENT ROLE OF INSITU TESTING
An interesting view on the today role of in&u testing was expressed by Schmertmann at the banquet talk at the Symposium CRT ‘95 in Sweden.
“I believe that...whiIe in tbe past the laboratory bad a primary role in a site investigation, and in situ testing a complementary role...we have reached a stage where in situ has a primary role, and the laboratory a complementary role”.
Schmertmann cited as an example the Sunshine S-y Suspension Tampa Bridge, where Schmertmann & Crapps were responsible for the geotechnical design. He reported that 99% of the testing was run in situ, 1% in the laboratory (and the mason of the 1% in the laboratory was to avoid colkaglle criticism).
(of course audience and speaker were well aware that the laboratory is the antral source of our basic understanding including insitu tests).
Ifthe trendtowards insitu testing continue it is foreseeable that more and more investigations will consist of penetration tests, fass economical, reproducible. In simple problems involving only soil rupture it is possiile that CP’I’ alone will sufke. In problems involving deformations and stress state, also tests able to provide such information will be
In many practical cases the availability of the 3 independent detemkmtions
&(ar) KD@~ M@MT)
should represent a mspecmble base of information.
7.2 PARAMETER DETERMINATION BY “TRIANGULATION”
Unlike laboratory tests, in situ tests are generally unable to measure “pure” soil properties. In Situ tests
generally provide responses which are a mixed function of such ‘pure” soil properties. In order to isolatethem,itisnecessary a Wangulation*.
Say that dominant soil infoimation are : stiffness, strength, state of stress. Hence thtee independent responses are needed. Conceptually:
RI = fI && Strength, oh)
R2 = f3 @‘l, Stnngth, oh)
R3 = f3 (h& Strength, oh)
Invert matrix and get
M = gI (RI&&) Strength = g2 FwQB3~
=h = 83 (Rl8233)
Mum is along these lines, being obtained as a fllIldOtlOfID,~~, ED (thOUghO~ytW0~ independent pammeters - see Section 4 ). It is foreseeablethatinthefutureweshallseemore “triangulations”.
The above concepts explain the previous recommendation to avoid correlations with En alone, i.e. not in combination with other parameters. In particular ED lacks information on stress history. Hence ED should only be used in combination with KD (and ID) to get M Then, if Young’s modulus E’ ls needed, it can lx estimated as E’ e 0.8 M
7.3 DRAINAGE CONDITIONS DURING THE DILATOMETER TEST
InacleansandtheDMTisaperfectlydrained ttstBotheXCesspo~pnssurrS Au (Au,penetration and Au,expansion) are virmally zero throughout the test, whose duration (say 1 min) is suflicient for any excess to dissipate.
In a low permeability clay the opposite is true, i.e. thete5tisundralnedandtheexcmesdonot undergo any appreciable dissipation.
It should be noted, however, that, for opposite reasons,atanygiventim~theporepressure distribution around the blade is constant in both caseS.IIlthedmk4icaSethepo~pleSstlmis everywhere Uo (the equilibrium pore pressure), in thetmdrakdCasethepotepm.ssmes donotvaiy(in absence of movement).
There is however a niche of soils (in the silts region) for which 1 min is insufficient for full dminage, but suSicient to permit some dissipation. In thesepartjal iakzinage soils the data dained can bemisleadingtoautmawareuser.Infktthe teading B, which follows A by say 15 sec. is not the “propermatch”ofA.becauseinthel5sec6romA N B, excess has been dissipating and B is too low, with the consequence that the diEerena B-A is also toolowandsoarethederivedvaluesId.Ed,MIn such soils ID will possibly end up in the extreme left handofitsscale(I~=O.lorless)andMwillalso show, at least occasionally, very low values.
-15-

This situation is not very frequent, the writer noted it only in two sites so far @nunmen clay-Norway and and Garigliano clay-Italy).
Tobesun,incaseofverylowIuandM,thereis some ambiguity because the loq, values ofB-A could just be the normal responseof a low permeability very soft clay. The ambiguity can be solved with the help 0f.Greadings (or UD - Section 4.10.5, Eq. 9). If the UD values in the “low B-A” layers are intermediate between those found in the free-draining layers and those found in the non f&draining layers_ than the above interpretation of portiol ahinuge is presumably correct Of course the purtkl drainage ucplanation can also be verified by means of laboratory sieve analysis or pemleabiity tests.
In practice, if the partial dioinage explanation of the low B-A is confirmed, all results dependent from B-A (recognizable by very depressed ID troughs) have to be ignored.
8. APPLICATION TO ENGINEERING PROBLEMS
As mentioned earlier, the primary way of using DMT results is “design via parameters”.
However this Section provides some details on the use of DMT in some specific applications.
8.1 SETTLEMENTS OF SHALLOW FOUNDATIONS
Rtdicting settlements of shallow foundations is probably the No. 1 application of the DMT, especially in sands, where high quality oedometers are rarely available. Leonards and Frost (1988) express the opinion that “the DMT is the most generally applicable practical tool for sensing soil compressibility directly”.
ti
Aav
\R. MbyDMT
Mu~istobeusedinthesamewayasifitwas obtained by other methods (say a good quality oedometer) and introduced in one of the available procedures (e.g. Fig. 19).
The classic procedm whose use is recommended in common problems, are recalled below.
It should be noted that the classic proaxbues, being based on linear elasticity, provide a settlement proportional to the 1oaQ and are unable to provide a non linear prediction. The predicted settlements is meant to be the settlement in Qorking conditionC i.e., for an isolated footing for settlements in the order of 0.5 % B, with B = width of the loaded area (orforasa&tyfhctorFs=2to3).
8.1.1 SETTLEMENTS IN SAND Settlements analysis in sand are generally carried
out using the 1-D elasticity formula (in 1-D problems, say 1-e rafts) or the 3-D elasticity formula (ii 3-D problems, say scruff isolated footings). The well known formulae are mspectively:
(10)
However, based on considerations by many Authors (e.g. Burland et al. 1977), the writer recommends to use the I-D formula in ufl cases, for the following reasons (Marchetti, 1991): - The three dimensional method (unlike the one
dimensional) involves v and makes use of the horizontal suesses that “may be grossly over- /underestimated by themy of elasticity”, while the vettical stmsses “are surprisingly well predicted by simple elastic theory”
- “For most practical casts, the conventional one- dimensional method gives settlements that are within IO!?? of the threedimensioual calculated settlements, provided v C 0.3” (the compensation derivesfrom:MinEq. 1OishigherthanEinEq. 11, but Eq. 11 contains a negative term)
- “Errors introduced by simple classical methods are small comparedwith errors in deformation parametus. Hence, the emphasis should be on the accurate determktion of simple pammeters, such as the one-dimensional compressibiity coupled with simple calculations”
Since the above two formulae give similar answers, it appears preferable to use the 1-D form* as being simpler, conventional a& above all, engineer independent (the need of subjective guesses of v or horizontal stressa is ekninated).
Fig. 19. Recommended settlement calculation
-16-

In case it is opted for the use of the 3-D formulae, Ecanbederived6romMusingthetheotyof elasticity, that, for v = 0.25, provides E = 0.83 M (a.fbctor not very far from unity). Indeed h4 and E are often used interchangeably in view of the involved approximation.
8.1.2 SEITLEMENTS IN CLAY
The primary settlement in clay is usually calculated by the classic log formulae using the coefficients Cc and Cr determined by oedometer tests Al&rnatively, and with similar results, the settlement are calculated using the average Eoed derived from the laboratory curve in correspondence of the expected stress range.
Since DMT provides M rather Cc and Cr. the method to be used is the second one, resulting again intheuseofEq. 10.
KE’ of the clay skeleton is required it can be obtained as E’ = 0.8 M.
It should be noted that in some highly structured clays, whose oedometer curves exhibit a sharp break andad.ramaticEallinslopeacrossthe ‘. preconsolidation pressure pc. M from DMT could be an inadequate average if the loading straddles pc. However in many common clays, and probably in most sands, the M fhxmation across pc is mild, and M can be considered an adequate average modulus.
8.13 MANlPULABKLTN OF THE CALCULATED SETTLEMENT
A di!Xillct Characteristic Of st_Dm (the I’CSUh Of
Eq. 10 when MD~ is used) is that SI_D~ is the end product of a seamless non subjective chain, from insitutotheoffice.Infact: - Field raw data are independent from operator - The factor for converting ED to M is not chosen by
the person making inteqxetation, but is obtained asR~=M/E~tifl~,Kn)
- St_Dm is independent from the person bang the settlements This non manipulabiity facilitates accumulation
ofam&entcomparativedata. To be sure, in 3-D problems in OC clays. some
margin of manipulation still exists and should be kept under control. As said earlier, Sr_~m is to be WeatedasifitwasobtainedbyusingEoed. Therefore if s1.D~ is used to predict the primary settlement, S~_DM~ should still be corrected for rigidity, depth, Skempton-Bjerrum correction. While the rigidity correction (ii applicable. typically 0.8) and the depth correction (ii applicable, typically 0.8 to 1) are near unity, hence no substantial. in 3-D problems in OC clays the correction f&tot could
often be 0.2 to 0.5 (<Cl). “According to the book” the latter correction should be applied. However considering that :
- The application of the Skempton-Bjerrum correction is equivalent to reducing S~_DW by a factorZto5
- Terzaghi & Peck‘s book states that “if the applied load exceeds pc. the modulus from even good oedometers may be 2 to 5 times smaller than the in situ modulus”
these two factors approximately cancei out. Therefon, pending a specific study on this particular condition, the writer is in favor of adopting as primary settlement Sc (even in 3-D problems in Cc! Clays) directly St_Dm from Eq. 10, without the Skempton-Bjemun correction (while adopting, if applicable, the rigidity and the depth corrections).
The resilience of St_Dm to manipuhuion is of course no prove of accumcy, it simply facilitates comparisons. Accuracy forms the object of next Section.
8.1.4 COMPARISON OF DMT-CALCULATED VS OBSERVED SETTLEMENTS
Many investigators have presented comparisons of obsetved vs DMT-predicted settlements, reporting generally mtisbctory agreement.
Schmertmann (1986) reports 16 cases-history at various locations and for various soil types. He found an average ratio calculate observed settlement z 1.18, with the vahre of that ratio mostly in the range 0.75 to 1.3.
Fig. 20 (Hayes, 1990) confirms the good agreement for a wide settlement range. Similar agreement has been reported by others (Lacame & Lunne 1986, Skiles 1994. Steiner 1992 and 1994).
0 50 100 150 200 250 300
DMTCalculated Settlement (mm)
Fig 20. Observed vs DMT-cakolated scttlcmcot (Hayes, 1990)
-17-

8.2 VERTICALLY LOADED PILES
8.2.1 BORED PILES No special method has been developed for the
design of ,bored piles. (An exception is the method developed by Peilfer for screw piles, described in a next Section, applicable even to bored piles). Therefore. the design of bored piles using DMT is ^ generally carried out via ,soil parameters.
8.2.2 DRIVEN P&ES
(L2.2.1 THE DMT-%=-METHOD ’
This methad (Marchetti et al. 1986) was developed for the case of piles driven in clays. The method is based on the determination of o’h (e&&e horizontal stress against the DMT blade at the end of the reconsolidation). Then a p factor is applied to dbc.arrdthcpraductisusedasanestimateofthe pile shin friction 2. The method has deep conceptual roots, being an application ofconcepts and theories developed by Baligh (1985). However the method has two drawbacks : (a) In clays, the determination of a’~ can take considerable time (the reconso- lidation around the blade of impermeable clays can take many hours if not one or two days) which makes the o& detetmination expensive, eqecially in offshore investigations for offshore piles (h) The p factor has been found to be not a constant, but a rather variable factor (mostly in the range 0.10 to 0.20). Therefo~ until methods for guiding the selection of are developed, the uncertainty in t is too wide. Nevertheless, in important jobs, the method could helpfully be used to supplement other methods, e.g. for getting information on the shape of the E profile, or to establish afroor value to L.
a222 HORUONE~ PBSiXREAGdINST PILESDRXVENINCL4YDURING INSTALLQTION
Torani et al. (1994) report a finding of practical interest for the engineers deciding the thiclcness of the shell ofmandreldriven piles in clay. These investigators describe measurem ems Of oh (total) on a pile driven in a lightly OC clay. The pile was instrumented with 12 total pressure cells, frequently measumd during driving. At each depth the pressure ot, against the pile was found to be “exactly qllal” to p0 determined by a normal DMT. This’finding is in accordance to theoretical findings by Baligh (1985). predicting Ob independent from the dimensions of the penetrating object (these results suggest indepe&nce of ob even from the shape).
a2.2.3 WARNING OF LOWSKIN FRICTION INci4LUREOUSSAND
Some calcareous sands are known to generate very low friction on pile sha& with the cons=prence of
unusually low pile bearing capacity for lateral fkktion. Methods for predicting shin fsiction in such sands are currently not available. However DMTs performed in calcareous sand (Fig. 2 1) indicate an unusually low KD in such sands. -This suggests - The low f, in these sands is largely due to low o’b -‘Ihel~KDmeasuredbyDlkiTiItcahXRZ%
sands is a potentially useful warning for expecting a low friction capacity.
Id M=l/m.v (bar) Kd
Fig. 21. DMT results in the Plouasne (Brittany) calcareous sand
8.23 SCREWPILES Peiffer (1997) developed a method for estimating
the shaft friction of Atlas screw piles based on p0 l%omDMT.TheDMTisnmintheusualway,but should be performed next to the pile (1 D away from the shaft) after its execution.
Peiffef s method is intetmediate between a real designmethodandapileloadtesLItisnotatwl design methodbecause the e&mates are obtained afterthepileisexecu~norisitaloadtestbecause the hearing capacity is estimated from soil properties and not by loading the pile.
Actually the P*er method follows the inescapable logic dictated by some well established facts. It is widely recognized that pile capacity largely depends on execution - besides soil type. Hence one cannot pretend to estimam the pile bearing capacity based only on measurements on the original soil, but should more rationally base such estimates on measurements on the soil after the kmllation.
This meth* though developed for screw piles (and a variety of other piles, all aimed to avoiding soil decompression), is in principle applicable also to bored piles, because the relaxation due to the installation will anyway be incorporated in the after-the-pile DMI’ results.
-18-

8.3 LATERALLY LOADED PILES Methods have been developed for deriving p-y
cwes~mDMTmsults.Inpruticularthewriter recommends the papers by Robettson et al. (1987) and by Mamhetti et al. (199 1).
Rober&on 1987 (the reader interested in using the methodindesignisadvisedtoprocurethefitU paper)ckarlyillusvatcsaIlthestepstoesnmatep-y CuIycs, both for sands and clays. Validations of the Rober&oa 1987 method by Mar&tti et ai. (1991) indicated rem&ably good agreemem between predictedandobservedbehavior(firsttimeloading).
Mar&ttietal.(1991)stmamEnedtheRobemron methodfbrday(anchoredtotheSkemptons~- Mattock cubic parabola approach), and proposed a mom direct procedum for predicting the p-y curves (only for clay). However, since the accumcy appears similar, use of the Robertson method (covering also =Wisadcquate.
Thepycmvesderivedusingthesemethodsam the end product of a non subjective chain from in situ to the OfIice. Actunlly the DMT was originally conceived for the objective determmauon of the parameters needed for this problem.
Various investigators have stmssed the ability of the DMT to obtain considemble data even at shallow depths, i.e. in the layers dominating pile response.
Detailed chapters on the use of DMT in this application can be found in Lunne et al. (1989) and US DOT (1992).
An extensive verii?ution program of the existing methods vs obmtved lateral pile behavior (Project BriteEuramII)iscurmntlyinpmgress,leadand coo&rated by NGI, by a group including Boyle, LuuneandMokkeIbos&
8.4 LlQUffAC77ON Fig.22sumn&zstheau?entlmowkdgeonthe
use of DMT for rvaiuating the liquefktion. The curves(themc6trecentandaJmprehe@veisthe CentiReyttaandChameau 1991 cttr=)useKDto utimatethccydicsnessmtiotocaWeliquetbcuon. nlismtioisthenusedinSeed4keproceduW.
The high sensitivity of the DMT in monitoring densiGcatio~iRusaatedinanextSectiolr.is believedtobeanimportant8actorinmakingthc DMT a suitable tool for liquefktion analysis.
VerydeepDMTprotilesintheVeneziasands(of presumably constant Dr) show KD almost “pcrkctly” cfmstmt (=1-s) with depth (uidilce qc and Nspt typically incmasing less than linearly with depth). This possibly supports viewing Kn as an index reflecting the “state parametcr” or the ksistance tovolume decmaseat ambient snesses”, i.e. reskmce to liquefaction.
NO LIQUEFACTION
0 5 IO
HORlZONTAL STRESS INDEX. Ka
Fig 22 Suggested boundary curves based on Ku (Reyna & Chameau (1991)
In many everyday problems, a full seismic liquefaction anaIysis is not justZed_ or can be avoided if the soil is clearly liquefiable or clearly non liquefiable. To help in such mugh subdivision, the writer has identified based on his experien% the following tentative categories (uncemented sands):
- Ku > 1.7 : Liquefktion is deGtely not a problem - KD < 1.3 : Liquefaction is definitely a problem
(unless KD < 1.3 is sporadic and isolated). Some kindofsoilimpKWementisnecWry.
- 1.3<Kn<l.7 :Additi~dstudyi~neas~ary.
Morranrscismicity mustbeconsiderefi _
Elements on which such subdivision is based are the foilowing : -Whewrite?sexperienceveryfcwuncemented
sandshanaKD<l.5.kWeK~<l.3~ WulsuaRy loosc’Just@g concern and the likely necessityofimprovemem
-TheZebunyMostTaiiingDaminPolandhas typic@ KD ~1.5. Various liquektion studies haveindicatedthatsuchdamisnotsufBcientiy safe. This confirms that KD ~1.5 belongs to the aRa ofadditional study.
-Yetsuchdamisstanding,andpossiilyifithad Ku ~1.7 it would be flciently safe. s ThCtUltiVClUtUEOfthC~SUbdiViSiO~k
obvious. Considemble additional verilicttion is ti But guide&s of this type would be practically helpful to engineers.
* Erratn corrige : Add the following aAer “._. would be sufficiently safe” (line 26 of column 2) : While the above limits may apply in “non seismic” regions, similar higher upper limits for Kd should be developed for sands in regions of “medium scismicity” and “high seismicity” (perhaps Kd>3.5 and Kd>5.5 mspectively).
-19-

8.5 DETECTING SLlP SURFACES IN OVERCONSOUDATED CLAY SLOPES
Totani et al. (1997) developed a quick method for dete&g slip surfaces in overconsolidated clay slop& based on.the inspeaion of the KD profiles. The method is based on the following two elements:
(a) The sequence of sliding, remoulding and reconsolidation @hurtrated in Fig. 23) generally leaves the clay in the slip zone(s) in a (nearly) NC state, with toss of structure, ageing or cementa~on.
@) Correlations established by several tesearchers inmanydifSerentclayshaveshownthatin genuinely NC clays (no structure, ageing or cementation) the horizontal stress index KD from the DMT is approximately equal to 2.
Therefore if an OC clay slopes contains layers witi. KD z 2, then these layers are likely to be part of a slip surface (active or quiescent). In essence, the method consists in identifying zones of NC clay in a slope, which. otherwise, exhibits an OC profile, using KD 22 as the identifier of the NC zones.
INSPECT UC,,
Fig. 23. Detecting slip surfaces in OC days by means of DMT- KD (Totad et d., 1997)
The method was validated by inclinometers. A point considered of interest is that the method
involves looking for a specifk numerical value KD ~2 rather than simply searching for weak zones which could be located just as easily by means of other in situ tests.
Some practical conclusion given in that paper ate: -Themethodprovidesaf&terresponsethan
inclinometers in locating slip mrfaces. - The method enables to quickly detect even
quiescent slip smfaces (not revealed by inclinome- ters), which may be reactivated by fresh activity.
- On the other hand the proposed method itself cannot establish if a slope 3 presently moving and what the movements art, while inclinometer can
- In many cases, DMT and inclinometers could helpfitllybeused incombiion.
KD~C z 2 for genuine NC clays as byproduct of ‘the slip surface research.
A byproduct of the above slip surface research was the cenf%mation of the vahre KD, NC n 2 for genuine NC clays. In faa - In all the layers where sliding was confirmed by
inclinometers, it was found KD = 2. - The clay in the remolded sliding band has
certainly lost any trace of ageing strum amentation, i.e. such clay is a good example of genuine NC clay
Thus KD a 2 appears thefloor value for KDJJC . If a gtologically NC clay has KD > 2, any excess Of KD above2isasignalofoneormoreoftheabove &ects (ageing stntn cementation)
8.6 MONITORING DENSIFICATION / STRESS INCREASE
DMT has been frequently used for monitoring soil improvement. by comparing DMT results before and after the treatment. Compaction is reflected by a brisk increase of both KD and M. However, sina often treatments aim to reducing settlements, specifications are generally set in terms of minimum M values.
Schmettmann (1986) reports a large mu&r of befote-after CPTs and DMTs carried out for monitoting dynamic compaction at a power plant site (mostly sand). The treatment increased substantially both 9~ and MD~, but the increase in MD~ was found to be approximately rwice the iwxeaseinq,
kndeby (1992) rrports before-after CPTS and DMTs carried out for monitoring the deep compaction produced in a loose sand 611 with the Y&owing”. He found a substantial increase of both q+dMD~.btttMD~increasedatafasttrrate ’ (nearly twice), a result similar to the previous case.
Higher sensitivity of MDW, compared with & was repotted by Pasqualini and Rosi (1993) in monitoring a viirotlotation treatment These Authors also noted that the DMT clearly detected the improvement even in layers marginaIly kdhzmxd by the treatment, where the benefits were tmdekctedbyCPT.
DMT has also been used extensively by Ghent investigatot~ Peiffer, Van Impe, Cortvrindt and Bottiau for comparing soil changes caused by various pile instaIlation methoak. For instance De Cock cl al. (1993) describe the use of before-after DMTs to vexi@ in terms ofKh the installation

-
Fig. 24. DMTs befomafter for comparing soil changes caused by the installation of various piles (here an Atlas pile). DeCock et aL 1993.
effects of the Atlas pile (Fig 24). Before-after CPTs were also used, but the Authors conch&d that “the DMTs before and after pile installation demonstmte moreckur&[tbancprltbc bene&ial result of the displacement effect of the Atlas pile”.
All the above resuhs concurrently suggest that the DMT is uniquely sensitive even to slight chaoges of stresses/ density in the soil and thercforc is particularly suitable when the cxpeckd changesaresosmallthatthcycannotbedeWedby other common in situ test
Sawada and sugawara (1995) used both SDI?M andDMTforcomparingtheeEectivenessofthree typesofdensificationnleWds.Theyfoundboth SBPMandDMTeffbctiveverificationtools,and pointedouttheconvenienceoftheDMPinviewof thelowtimeandcostinvofved.
Stationary DMT 45 pressure sensing elements DMTbladeshavealsobeenusedtosens
variations in stress stateI density using them not as penetmuoa tools_ but as !rtationazy spade cells. In this application DMT blades are inserted at the levels where changes are expec&4 then readings (only A) are taken with time.
Many applications of this type have been reported. Peiier et al. (1994) show (Pig. 25) representative results of such application, where a DMT blade was left in the soil waiting for the installation of a pile (a PCS auger pile in this cam). The clear distance benveen the blade and pile face was 1 pile diameter.
Fig. 25 Stationary DMT blades left ~JI place to feel stress variations caused by the nearby iostallation of a screw pile (Peiffer et aL 1994).
Sufticient time was allowed for stabilh&.ion of the DMT A-reading before starting pile insertion. Fig 25 shows that the screwing of the PCS piles was reflected by a considerable variation of 0k at the blade, and that even the casting of the concrete was captured as a substantial q, increase. Note that some other pile types (results are given in the same paper) produced an opposite e&t_ reflected by a (sometimes very marked) decrease of oh
Thehighsensitivityofthebladesusedas stationary pressure cells was also observed by Totani et al (1994). who kept under observation the q, on a previously installed instrumented pile. The pile was instrumented with 12 DMT cells (Pig. 26). in all equaltoDMTblades,butcircularinshape,installcd flush with the pile face, to measure the horizontal totalstmssagainstthepile.Thedrivingofan adjacent pile rcsuhed in : - A considerable incmase ofoh during dliVi&
persisting for several hours.
-Anetfinal pcrmanentincreaseofcr&afterafcw days (at the end of pore pressure dissipation).
Pig 26. DMT cells for measuring total stress
-21-

Concerning DMT blades used as stationary pressure cells, it may be noted that, while able to detect stress variutions, they do not provide absolute estimates of the stmsses before and after consuuction, in contlast with before-after continuous DMFs. Moreover a stationary blade can only provide information at one location. Yet then are a number of applications in which practical masons make them preferable.
8.7 MONITORING DENSlFICATlOi’U STRESS DECREASE
TheDMThasbeenusednotonlytofeelthe increase, but also the possible re&ction ofdens@ or horizontal stress.
PeifTer and his colleagues, as mentioned in the previous Section, used the DMT to monitor the decompression caused by various types of piles.
Some investigators (e.g. Hamza_ 1995 for Cairo Metro works) have used before-after DMT to get information on the decompression caused by the execution of diaphragm walls.
The use of before-after DMT has been proposed (but not used yet) for monitoring the (Probably smaU) decompresn’on effects of microboring (the technique consisting in boring inclined holes under a tilting buildings to induce settlements in the less sinking side). This use appears particularly apt (even in view of the high sensitivity of DMT), for mapping the soil volume influenced by the treatment. Leas straighdorward appears the interpretation in terms of Ko decrease.
8.8 SUBGRADE COMPACTION CONTROL
Some experience exists on the use of Dh4T for evaluating the suitability of the compacted ground (i.e. the subgnide soil) to support the road supersaucnrre (subbase, bast, pavements).
Borden (1986). based on laboratory work on molds and large calibration chamber, involving A-2-4 to A-7-5 soils, tentatively suggested to estimate CBR% (co_ lmsoaked) as :
CBR% = 0.058 ED @[email protected] (12)
Marchetti (1994) describes the use of DMT as a fast acceptance tool for the subgrade compaction in a9OkmroadinBangladesh.Theprocedurewasthe following: - Perform a few prelii DMTs in the uccepted
subgrade (i.e. satisfying the conventional specifications)
- Based on such preliminary Mum profile& defme a suitable average Mum profile. to be used as the acceptance profile (such profile should indicate eXplicidY MDMT.MAX)
For the mentioned road the original s@ikations for the subgmde were : (a) 95% of modified Proctor (b) CBR = 10 (c) Eplate (0.5-1.5 bar) = 300 bar. These specifications, after the preliminary DMTs in accepted areas, were converted into the MD~ equivalent acceptance profile in Fig. 27. The DMT could then be used as an economical production method for quality control of the compaction, with only occasional verifications. DMT testing was very fast (60 DMT profiles to a depth of 23 m, at 10 cm depth intervals, in 4 days) and avoided a large number of time anaming and tiresome laboratory and ins&u CBR tests and plate load tests.
Intemstingly, all the aftercompaction Mum profiles had the fypicuI shape of the profile shown in Fig. 27, with the maximum Mum found almost invariably at 25-26 cm depth.
It would be helpful to engineers the availability of acceptance profiles similar to Fig. 27 but applicable to roads of various classes.
Cases have been reported of after construction checks with the blade penetrating directly through asphalt
bMT(ba~)
2
2526 cm
Fig 27. Mum acceptance profile as a fast method for verifying compaction of subgrade
9. CORRELATION WlTH PARAMETERS OBTAINED BY OTHER IN SITU TESTS
RELATION DMT / SPT According to Schmettmann & Crapps (1988):
- The estimation of Nspr from DMT would be a “gross misuse of the DMT data”
-Anysuchcorrelationdependsonsoiltypeandis probably site specific, and should always be confirmed before use in design
- When using such correiation the engineer should be aware of the high variation in SPT blowcount
- Datapoints expressing graphically a possibly site specific correlation for the Gainesville FL area indicate the following
Nsm =M(bar)140 (13)
-22-

RELATION DMT / PMT Some information exists about the relation
between DMT and PMT parameters. Cross correlations, if existing and available, would be of great practical value to the engineer, permitting to tap into the vast experience accumula* especially by French Engineers, on the use ofPMT data to practical applications (design of footings, piles etc.). Prelimmary indi+ions suggest :
p& = 0.8 (Schmertmann, 1987) (14)
Epmt w 0.4 E~(Kaluzi~tis et al. 1991) (15)
Dumas (1992) used the DMT in a verification testing ofa Dynamic Compaction project. The settlement calculated with DMT was in good agreement with that caIculated with the PMT.
Ortigao et al. (19%) used both Menard-PMT and DMT for investigating the Brasilia porous clay for the Brasilia Underground Line. They report good agreement between PMT and DMT moduli.
Conttibutions DMT/PMT have also been presented by Lutenegger (1988). Sawada (1995).
10. DIFFERENCES VS AXISYMMETRIC PROBES
10.1 CONSEQUENCES OF PROBE’S SHAPE. ARCHING.
The shape of the probe (cross section and cmvature in the transition zone) has important consequences on the parameters that can be determined.
Hughes and Robertson (1985) analyzed the horizontal stremes against the CPT sleeve in sands. Theyshowedthatattheleveloftheconicaltipag reaches very high values, while, behind the tip, oh undergoes an enormous stress reduction. The penetration of the cone creates of zone of high residualstres$atsomedismncefromthesleeve. The resulting stiffanrmlus of precompressed sand is a screen limiting 4 of interface, while the enormous unloading makes undetermined a), .
(Thismecha&mmaybeviewedasaformofan arching phenomenon, possibly in part responsible of qc or Nspt mcreasmg less than linearly with depth).
A “plane” tip (DMT width/thickness ratio a 6) should ehminate (reduce) arching and improve the possibility of measuring*. Alsothestress reduction after the wedge is considerably smaller due to the streamlined shape in the transition zone.
Moreover, in the case of the CPT sleeve, what is measund is a vertical f0R.X. from which oh iS
inferred by assigning a value to 8, itself unknown and variable. By contrast DMT measures direst& horizontal stmmes.
Many investigators (e.g. An Bin Huang, 1994. using a coupled DEM-BEM numerical technique) have confirmed the difEculty of e&imaGng in sand the in situ crh by CPT :“the luteruf stress behind the cone is not expected to be sensitive to the in situ lateral stress...typical FR in sand are small and subject to signijkantjluctuations-the practicality of using FR to correlate to soil stress history may be questionable...OCR is not expected to have signljiumt eflect on qC values... (the insensitivity of qctooCRhadbeenpointedoutbeforebymany investigators, see e.g. Leonards & Frost 1988).
OfcoursethedifEcultyofestmWingcrhbyCPT does not even a bit prove the abiity of DMT to do so. Simply the above geometrical advantages support the legitimacy of better expecWions. The final worrL as usual, goes to comparisons, i.e. to the accumulation of more figures of the type of Fig. 11.
10.2 INCREASED COMPLD(Tp/ OF THE THEORETICAL MODELS
The DMT is more difficult to model than axisymmetric tips for at least two masons : 1. The penetration of the DMT blade is a truly
threedimensional problem, in contrast with the two-dimensional nature of cone penetration
2. The DMT is made of two stages - Stage 1 . Insertion. - Stage 2 . Expansion. (Moreover expansion is not
the continuation of Stage 1) As a consequence, theoretical solutions have been
developed sofar only for the first stage (insertion). The three existing solutions (to the writer’s knowledge) have been worked out by Whittle and Aubeny (1992). Yu &Booker (1992). Finno (1993).
Fig. 28 (Whittle and Aubeny) shows that the strainsinthesoilinthecentralpartofthebladeare
much less than the strains near the edges. Therefore (besides the overall distortion being lower than with cones) the membrane is located in front
Fig 28. Shear strains for simple plate due to penetration (Whittle & Aubeny, 1992).
-23-

of the least distorted soil. Fig 29 (Finuo, 1993) shows that the theoretical computed mnge for the OCR- KD correlation is in agreement with the 1980 KD - OCR CO~~OII establi~hd via calibrations.
The writer expects more theoretical confnmatiotts of correlations established via calibrations. If a correlation has a physical base, its theoretical derivation will follow.
Field measured
Computed range by strainPatbh4etbod& Anisixropic Boundiug SpaceModel
‘i -5 5 lb B
Fig 29. Theoretical Kn vs OCR (Pinno, 1993)
11. CONCLUDING REMARKS
1 I. I GUIDE TO THE USE OF DMT IN THE APPUCATIONS
The DMT best applications are believed to be : - Co- modulus M (clays and sands) - Undrained shear strength C, (clays) - Predicting settlements - Monitoring soil improvement (or nlaxation) -Recognizirlgsoiltype - Discerning &elydraining layers tirn non
fieelydraining layers - Dekting active/ quiescent slipsurbces in clay
slopes
Useful information is also obtained .on: -0CRandKoinclay
.
- c4cfficient of consolidation - P-y curves for laterally loaded piles
Rough e&mates (additional study required) am obtainedof: - Sand liquefiabiity - Friction angle in sand -KoiIlsatld
,-
17.2 PERCEIVED ADVANTAGES - Variety of insertion equipment. - Simple and economical to operate and maintain. - High reproducibility.
- Nearly continuous profiles. - Immediate availability of the results. - The results are presented in terms of familiar
geotechnical parameters, directly comparable with the same parameters obtained by existing methods.
- DMT is a two-parameter test, and one of them contains information on stress history (dominating soil behavior). Many common penetration tests just give one parameter.
- The blade, being flat, largely avoids soil arching e&c&, in contrast with cimular probes where arching is unavoidable causing insensitivity/ instabiity of the lateral strem above the cone shoulder (Section 10.1)
- Compaction control : DMT parameters M and KD are highly sensitive even to slight modifications produced in the soil. The sensitivity (and speed) of theDMTisparticularlysuitedwhentheexpeckd soil changes are so small that it is felt they cannot bedetectedbyothercommoninsitutest.
- The DMT, besides its primary scope of investigating mechanical properties, determines the equilibrium pore pressure in sand, discerns fkeelydraining f5om non freelydraining soils, provides estimates of some flow characteristics. The DMT tip is more rugged and cobbleproof than the CPTU. The DMT methods for evaluating Ct, and K are bloodkss (“dry”), by replacing the delicate task of measuring pore pressums with the simpler task of measuring a.
- Coefkient of permeability and consolidation : due to the lower distortions in the soil and the absence of problems of satuiation, filter clogging smearing, DMT is believed to provide useful estimates ofthese parameters.
SETTLEMENT CALCULATIONS DMT appears particularly suitable for settlement
analysis and in problems requirmg accumte soil wmptnvibiiiry &a The superior accuracy ofDMT mouhli compared with modrrli from peWration tests, documented by many studies (Section 8.1.4). appears due to: - The wedge-shaped tip deforms the soil
considerably less than conical tips. - The modulus obtained by expanding a membrane
(a mini load test) is more closely cormlated to insitu soil modulus than a penetration resistance.
-ThemoduliobtainedbyDMT(EdorM)are among the most reproducible moduli obtained in experimental soil mechanics
- The modulus M obtained by DMT is the only modulus that routinely takes into account the possible existence of high lateral stmsses (also felt by the instrument) that reduce considerably soil compressibility (Masmmch, 1994).
-24-

12. BIBUOGRAPHY ASCE (i994). P&ii&d aAd Meamed Behavior of Five
SpreadFootiqsChSand.ProceedingsofaRediction Syqosium Sponsmed by Fed. Highway Admin., Ascc Geot Spec. PubL No. 4 1,255 pp.
ASTMSubcmmitteeD 18.02.10(1986), J.I-L .’ ’ Schm~chairman,suggcstedMetbodfor PaformingttleFlatDilatomaaT~ASTMGeotechn. Testin8 Journal, Vol. 9, No. 2.93-101. June.
Bali&, MM. (1985). Stmin path method. ASCE J. GE, Vol. 111, Gl-9 : 1108-I 136.
Bali8h M M & Scott R F. (1975). Quasi Static Deep Penetiah in Clays. ASCE J. GE, Vol. 101. GTl 1: 1119-1133.
Baldi. G., Bellotti, R, Ghioma, V., Jamiolkowski. M., mtti, S. & Pasqualini, E. (1986). Flat Dihtometer Tests in Calibration Chambers. Pmt. In Situ ‘86 ASCE Spec. Coaf. on “Use of In Situ Tests in Geoteh. Ex@eerin8”. Vhginia Tech, Blacksbuq, VA, June 23- 25 1986. ASCE Geotech Special Pub]. No. 6: 43 1.
Bali. G.. Bellotti, R, Ghioma, V. & Jamiolkowski, M. (1988). Sti&ess of Sands hm CPT. SPT and DMT. ICE. Proc. Penetmtion Test@ in the UK. Univ. of Bimiqbam. Paper No:42 299-305. July.
Benoit J. (1989) Pesooal commticatim to the titer. Bon&n, RHet al. (1986) Evaluation of Pavement
subgrade Support charactaistics by Dilatometer Test Pm. 64th Annual Meeting of the Transportation Res. , Board., Tmnsp. Res. Record 1022. June.
Burland J.B., Broms B.B and De Mello V. F. B. (1977) Behavior of fouudations and smctum, Proc. 9th ICSIvlFE$2,495-546.
Campmnella, R.G., Robertxm, PK., Gillespie, D.G. Bt Grie8, J. (1985). Recent Developments in In-Situ ;e&&&Soils. Proc. XI ICSMFE, S. Francisco, Vol.
C~&MIXZ~~G. B Robemo&P.Ic.(l99l).useand IntexpreMon of a Reseafh Dilatanan Chad. Geotecbn. Journal, Vol. 2s: 113-126.
hter JP., Randolph M F. & Wmth C. P. (1979). Sbss andporeprrsslnrchangesinclayduriagandaRatl’e expansion of a cylindrical cavity. Int_ J. Nm. Anal. Methods Geomech 3: 305-322.
De Cock F., Van hope WE., peiffa H. (1993). Atlas SCEWpitesdtuksaeW$CSinstifftatiaryChyq
PmC. BAP II Ghalt 1993 Ba&ema, 359-367. Dumas J.C..( 1992). Cp ofsetllementsp
byFM&andD_--2mdyroifinQuckr
Eurowde7-~Cc~mitteeFmStandardizatiaa (1995). Part 3 Geotechnid design us&fed by/icld rear, Sec. 3.7: Fiat Dilatomctcr Test. (1995 draft).
Fii R. J. ( 1993). Analytical In-m of DilatometerPenetratiollmu8hSaturatedco~ve Soils, Geoteclmique 43 No.2.241~254.
Ijamza M. And Richards D.P. ( 1995). Correhtiom of DMT,CPTandSPTinNileBasinSediment.Pfoc. 11th M. Co&. sMFE$ Cairo Egypt, 437446
Hayes J.A. (1990) llx Mmhetti Dilate- and C&bility, Seminar on ” In Situ Tm and Monitori@. Southern Ont. Section Canad. Geot. Society, Sept. 2 1 pp.
Hryciw RD. (1990). SmallStrain~h=r Modulus of Soil by DiMmeter, AXE Jnl GE, Vol. 116. No. 11, Nov 1990,1700-1716.
Huang An Bin (1994) An analytical Shuiy of Cone Penet&onTstsinGranularMataial,canadGeo~ J.Vol:31.1, Feb 1994.91-103
Hu&es J.MO. de Robertson P.IC.( 1985). Full displacrmmtpressurrm eteftestinginsand.Cimad Gcot Jnl. Vol. 22,3 August : 298-307.
Ivmsaki Ic ct al (1991). Applicability of the Marchetti Dilatometer Test to Soft Grouod in Japan. GEOCOAST 91. Sept 1991, Yokohama l/6.
Jamiolkowski, M (1995) “Welcome addms”. Cn 95, Iut Symp. On Cone Penetn Test& Swedish Geot. . .
,soe.:~~ Ghioma, V Lancellotta, R & Pasqualini, ‘E. (i988). New &relations of Peoehation Tests for Design Practice. ISOPT-1. FL, V. 1: 263-296
Jendeby L. (1992). Deep Compaction by Vibrowin8. Nordic Geotechnical Meetiq NGM-92. Vol. 1,19-24
Kaltiotis, N.A., Pachkis, MD. & z”“g’annis,~XS. (199l).ApplicationsoftheFlatDilatameta (DMT) in Cohesive Soils. Pnx~~E&~~, vo1.1. m-128 @mmpahm
* ICamey T. And Iwasaki K (1995). Evaluation of drained shear wmgth of cohesive soild using a Flat Dihtometer. Soii and Foundations, Vol. 35.2.11 l- 116, June.
Kulhawy, F. & Mayne, P. (1990). Manuel on E&mat& Soil Aopaties for Fo&atio~ Des&. Report NO. EL- 6800 Electric Power Research Institute,. Cornell Univ. Ithaca, N.Y., 250 pp.
~acase, S. (1986). Inmpxtation of Dilatometer Te Fii Report m In Situ Site Investigation Techclues and InmpreMion for OfMore Pmctice. Norwegian GeotehicalIn&Sepf
~acase, S. & Lume, T. (1986). DiIatometer Tests in send Pmt. In Situ’86 ASCE Spec. Co& Via Tech, Bhckhr8.686-699
Isase, S. & Lume, T. (1988). Calibmtion of Dmomem CoKelations. Pmt. ISOPT-1. Florid& Vol. 1: 539-548.
Lume, T., Lacase, S.& Rad, N.S. (1989). State of the ArtReportonInSituTestingofSoih,proC.W ICSMFE, Rio de Janeiro, Vol.4.: 2339-2403.
~erA.J.(l988~culTentstatusofthcMarchetti I)llatometaT~GerwralRcpolfpioc.IsopTI,Mar., Grlaudo, FlclKid& Vol. 1.137-155
Lutencggrr, A.J. & ICabir, MG. (1988). Dhto&er C- tcadiq to help detemhe srxatigraphy. Pm. ISGPT-1, Grlaado, Vol. 1: 549-554.
Mardxt& S. (1979). lh in Situ Detaminatioa of au ovelnuolidation Ratio_ F?oc. 7th
z;onf Sh@E, Brighton, Vol. 2: 239-244. MarhttiS.(l98O).InSituTestsbyFlatDilatomcta
ASCE Jnl GE, Vol. 106,No. 3, Mar 1980,299-321: Mashetti S. ( 1985). Gn the Field Detemhatim of & in
Saud. Discusion Session No. 2A, Proc. 1 lth ICSMFE. S.Fcancisco, Vol.5,2667-2673.
Marche&S.(l99l),Discussi~ofthepaperbyLeollards GA. & Frost J.D. (in ASCE Jnl GE Vol. 114, No.‘l,Jul 1988.79 l-809) “Settlmunts of Shallow Foundations on Granular Soil&n ASCE J. GE, Vol. 117.1.174-179.
-25-

Marchetti S. (1994). An example of use of DMT as an help for evaluating compaction of Subgrade and uuderlying Embankment. Intemal Techn. Note, Draft.
Marchetti, S. ;Bt Crapps, D.K. (1981). Flat-DiIatometer Manual. ~lnternal Report of G.P.E. Inc. -’
Marchetti, S.,~Totani, G., Campanella, RG., Robe&on, PK. & Taddei, B. (1986). The DMT- Method for Piles Driven in Clay. Proc. In Situ ‘86 ASCE Spcc. Conf on “Use of In Situ Tests in Geotechnical . . Etugmq”. Vii Tech, Blacksburg, VA. ASCE Geoteclm. Special Publ. No. 6: 765.
uarcheoi S., Totani G. (1989). Ct, Evaluations t?om DMTA Dissipiititi’Cmv~,~Prcc. XIl ICSMFE, Rio & Janeiro, Aug.;Vol. 1.281-286.
Mar&ui S. et aL(l991). P-y Curves tinm DMTData fix Piles Driven in Clay. Pnx. 4th Int. Co& “Deep Found. Inst. on Piling and Deep Foundatioas”, Stresa
Maswrsch K.R. ( 1994). Settlement Analysis of Compacted Granular Fill. Proc. 13 ICSMFE New Delhi, Vol. 1.325-328.
Ortigao J.&R (1994). Dilatometer tests in Brasilia poroos clay, Proc. 7th Int congress Int. Assoc. Of Engineering. Geology, Lisboa Ponugal, Sept., 359-365
Chtigao J.A.R. Cunha RP. & Alves L.S. (19%). In situ tests in BrasiIia pomus clay. Can. Geot J. 33: 189-l 98
Pasqualini E. & Rosi, C. (1993). Experiences fixnn a vibroflotation treatment. (in Italian), Meeting of the Geotechnical National Research Council Group, Rome, Nov., 237-240.
Peiffer H, Van Impe W.F.,Cortvrindt G. and Bottiau U( 1994). DlvlT Messurem ents around PCS-PILES in Belgium. Prw. 13 ESMFE New Delhi, V. 2.469472.
Peifk H( 1997) Evaluation aad automat&ion of the dilatometer test and inwzpretation towards the shaft bearing capacity of piles., Dxtoral Thesis, Ghent univelxity
Powell, J.J.M & I&low. LM. (1988). The Interpretation of the Marchetti Dilatometer Test in UK Clays. ICE Proc. Penetntion Testing in the UK. Univ. of Birmiogham, Paper 34: 121-125.
Reyna F. t Chameau J.L.( 1991) Dilatometer Based Liquefaction Potential of Sites in the Impekl Valley. 2nd Int_ Conf. on Recent Advances in GeoL Earthqoake Engrg.andSoilDyn.StLouis.May.
Roberkwo P.K. and Campanella RG. (1986). E&mating Liquefactioo Potential of Sands Using the Flat Plate D&atometer. ASTM Gcot. Testing Jnl. Mar, 3840.
Robertsm, PK.. Campanella, R.G.. Gillespie, D. & By, T. (1988). Excess Pore Pressure and the Flat Dilatometer Test_ Proc. ISOPT-1, Orlando, FL. Vol. 1: 567-576.
Robertson PK. Davies UP.. Campzmella RG. (1987) Design of Laterally L.oaded Driven Piles Using the Flat Dilatometer. Geot. Testing Jnl. V-12, No. 1, Mar, 30-38
Sawada S. And Sugawan~ N. (1995). Evahiatioa of densificatioo of loose sand by SBP and DMT. Proc. 4th Int symp. on Fkwemew*lf-19 May 95, Balk- 101-107.
S&m- J.H (1983). Revised Procedure for Calculating I(0 and OCR from DMTs with ID>].2 and which Incorporates the Penetration Measwunent to Permit Calculating the Plane Strain Friction Angle. DMT Digest No. 1. GPE Inc.. Gainesville, FL. U.S.A.
Schmertmann J.HS.( 1986). Dilatometer to compute Foundation Settlement Proc. In Situ ‘86, AXE Spec. Co& Virginia Tech, Blacksburg, June 1986,303-32 1.
Scbmertmann J.HS.( 1986). Cm/ DMT Quality Control of Ground Modification at a Power Plant Proc. In Situ %4’ASCE Spec. Conf., Via Tech, Blacksburg. VA, June 1986,985-1001.
Skw&xmn J.HS.( 1987). DMT Digest No. 9 - May 1987. Schmatmann Editor. Item 9A : Some in~oxlsllip with po in clays
Schmer&mum & Cmpps, Inc. (1988). Guideline S~lmmary forUsingtheCFTandMa&ettiDMTf~ Geoteclmical Design. Rept. No. FHWA-PA-87414-84- 24 to PenoDOT, OfBce of Research and Special Studies, Harrisburg, PA, in 4 volumes with the 3 below umcuning primarily the DMT: Vol. I - Summary (78 pp.); Vol III - DMT Test Methods and Data Reduction ( 183 pp.X Vol. IV - DMT Design Method and Examples (135 pp.).
Skiles D.L. and Townsend F.C. (1994). Predicting Shallow Foundation Settlement in Sand fi=om DMT. “Settlement 94” .ASCE Conf at Texas A&M, Geot. Spec. Pub. 40,132-142
Steiner, W., MeQga, R 8 Marr, W.A (1992). An Embaokmeot On Soft Clay With An Adjacent Cut AXE Conf. 011 Stability and Paforman= of Slopes and Embankments IL Berkeley, CA, 705-720.
Steiner W. (1994). Settlement Behaviour of an Avalanche Protection Gallery Founded on Loose Sandy Silt. Settlement ‘94 ASCE Cant at Texas A&M, Vol. 1, 207-22 1
Totaai G.,Marchetti S.,Calabrese M. and Moaaco P. ( 1994). Field Studies of an instromented full-scale Pile driven in Clay. Proc. 13 ICSMFE New Delhi, Vol.2, 695-698.
Totani G., Calabrese M.. Manhetti S. and Monaco P (1997). Use of in situ tYat dilatometa (DMT) for gmond characterization in the stabiity anslysis of slopes”, Proc. XIV ICSMFE, Hamburg Session 1.2
U.S. DOT (1992) . lhparm. of T-on. The Flat Dilatometer Test. Civ. Eng_ Dept Texas A&M Univ. For Fed. Highway Administr. Wasbi@oa D.C.. Publ. FHWA-SA-91-044, by Briaud J.L. & Mirsn J., 102 pp.
WhittIe, AJ., Aubaiy, C.P. (1992) The effkcts of &talk&m disturbance on illtcrprrtatioo of in situ tests in clay. Proc. wrath Memorial symp., word, 27-29 Julv : 742-767
Yu, I& & Booker. J.R ( 1992) Aoalysis of the Dilatometer Test in Undrained Clay. Proc. Wmth Memorial Symp., Oxfii7-29 July : 783-795.
-26-