the finance alliance for sustainable trade does not accept ... 2013 impact report.pdf · investing...
TRANSCRIPT


Disclaimer: The aggregate data presented in this report results from the combination of small and medium enterprise (SME) data from partner organizations. The Finance Alliance for Sustainable Trade does not accept any liability for the accuracy, completeness, timeliness or reliability of any data from partner organizations or any conclusions in this report based thereupon. This report is provided on an “as is” basis. To the extent permitted by applicable laws, the Finance Alliance for Sustainable Trade disclaims all representations, warranties and conditions of any kind in connection with this report, whether express, legal or implied, including, without limitation, any implied or legal warranties or conditions of quality, merchantability, fitness for a particular purpose, and non-infringement of third party intellectual property rights.
Cautionary language regarding forward looking statements: This report may contain estimates, projections or other statements that are forward looking in nature (“forward looking statements”). Any such forward looking statements are inherently speculative and subject to numerous risks and uncertainties. Actual results and performance may be significantly different from historical experiences and present expectations or projections. The Finance Alliance for Sustainable Trade takes no responsibility of the use of the information and undertakes no obligation to publicly update or revise any forward looking statements.
InvestIng for Change: an analysIs of the ImpaCts of agrICultural Investments from seleCt fast soCIal lenders Cristina larrea, semida minteuan and Jason potts

This work by the Finance Alliance for Sustainable Trade is licensed under a Creative Commons Attribution-Noncommercial-Share Alike 2. 5 Canada License. To view a copy of this license, visit http://creativecommons. org/licenses/by-nc-sa/2. 5/ca/ or send a letter to the Creative Commons, 171 2nd St. , Suite 300, San Francisco, California, 94105, USA to request a copy.
FAST is an international non-profit association that represents financial institutions and sustainable producers dedicated to sustainable trade. Launched in May 2007, FAST is the pioneer in bringing together a diverse group of stakeholders, working collectively to bridge the financing gap in the sustainable Small and Medium Enterprise (SME) finance sector. Members include socially oriented and alternative lending institutions, SME producers, development institutions and other stakeholders in the agricultural commodities supply chain. FAST is the global reference for data on sustainable SME finance and related markets.
Published by:
finance alliance for sustainable trade1255 University Street, Suite 801
Montreal, QCCanada
H3B 3W3Tel: +1 (514) 759-6626
Fax: +1 (514) 759-6603Website: www.fastinternational.org

table of Contents
list of figures 1
list of acronyms 2
acknowledgements 3
executive summary 4
I. background 7
II. Key findings 14
a) analysis of reported loan disbursements for the period 2009–2011 15
b) overview of relationship between finance and fast sIamt Core Indicators 37
c) methodological findings 50
Conclusion and next steps 57
reference list 58

1 \ Finance Alliance for Sustainable Trade
lIst of fIgures
Figure 1 Annual total amount disbursed to sustainable agriculture SMEsFigure 2 Key statistics of annual amounts disbursed per SMEFigure 3 Cumulative distribution of amount disbursed per SME in 2011Figure 4 Distribution of amounts disbursed in 2011, by cropFigure 5 Annual growth of amount disbursed, by cropFigure 6 Distribution of SMEs receiving investment in 2011, by regionFigure 7 Distribution of SMEs receiving investment in 2011, by countryFigure 8 Amount disbursed in 2011, by regionFigure 9 Annual growth of amount disbursed, by regionFigure 10 Amount disbursed in 2011, by countryFigure 11 Annual growth of amount disbursed, by countryFigure 12 Annual SME revenue earnedFigure 13 Cumulative distribution of SME total revenue earned in 2011Figure 14 Key statistics of annual total assets held by SMEsFigure 15 Annual aggregate earned revenue growthFigure 16 Key statistics of SME employment dataFigure 17 Annual employment distributionFigure 18 Annual employment growthFigure 19 Percentage of certified SMEsFigure 20 Distribution of SMEs by number of certifications heldFigure 21 Classification of SMEs by type of certificationFigure 22 Distribution of main certifications reported, by cropFigure 23 Average total revenue earned by SMEs with varying number of certificationsFigure 24 The most common indicators used in 2011 for the sample of eight investorsFigure 25 Measurement of land use with different indicators applied in 2011 for the sample of eight investors
Box 1 Key achievements of FAST to dateBox 2 Timeline of FAST SIAMTBox 3 Relevant criteria required by mainstream Voluntary Sustainability InitiativesBox 4 Data collection recommendations Map 1 Amount disbursed in the period versus the Human Development Index (HDI)Map 2 Amount disbursed in the period versus the Gini CoefficientMap 3 Amount disbursed in the period versus the Environmental Performance Index (EPI)
Dashboard 1 Top exporting countries by commodity versus leading investees in 2010
Table 1 The minimum metric set: FAST’s recommended subset of core indicators at the SME level

Investing for Change: An Analysis of the Impacts of Agricultural Investments from Select FAST Social Lenders / 2
lIst of aCronyms
COSA Committee on Sustainability AssessmentEPI Environmental Performance IndexFAST Finance Alliance for Sustainable Trade FLO Fairtrade International GIIN Global Impact Investment NetworkHDI Human Development IndexIFC International Finance Corporation IFOAM International Federation of Organic Agriculture MovementsIRIS Impact Reporting and Investment Standards NGO Non-Governmental OrganizationSIAMT Shared Impact Assessment and Measurement ToolboxSMEs Small–and Medium–Sized Enterprises, including cooperatives and producer organizations

3 \ Finance Alliance for Sustainable Trade
aCKnowledgements
This report was made possible thanks to the significant contribution of the Finance Alliance for Sustainable Trade (FAST) lending members. In particular, we extend our deep gratitude to Alterfin, Conservation International’s Verde Ventures, Idepro, Pro-Rural, responsAbility, Root Capital, Triodos Bank, and Working Capital for Community Needs. The guidance provided by these lenders and their continued commitment and support, as much as their data, have been essential for ensuring the relevance and meaningfulness of this first report. The analysis and conclusions presented here would not have been possible without them.
We also extend our special thanks to all the remaining lending members and partners of FAST who have provided input with a view to contributing data in the near future. With you, we see a horizon full of opportunity!
We would like to thank Christian Novak, Mike McCreless and Sarah Gelfand for sharing their invaluable experience, insights and time during the development of the report.
Additionally, we thank COSA (Committee on Sustainability Assessment), IRIS and our core partners the Citi Foundation, FIRA and Hivos for their generous collaboration and continued support to FAST throughout its impact analysis process.

Investing for Change: An Analysis of the Impacts of Agricultural Investments from Select FAST Social Lenders / 4
exeCutIve summary
Over the past decade, impact investment has surged from serving a niche market for social investors to recognition as a distinct asset class for mainstream finance. At the same time, the recent launch of the G8 Social Impact Taskforce reveals a growing recognition by global leaders of the importance of impact investment in bringing about a global transition to sustainable economic development. Within this context, investment in rural agriculture across the developing world has a particularly important role to play.
An estimated 2.5 billion1 people depend on agricultural commodities for their livelihoods, with the vast majority living below the poverty line. At the same time, roughly 30% of global carbon dioxide emissions are linked to agricultural production. Recognizing the importance of agriculture to global sustainable development, the impact investment community has placed increasing priority on investment in sustainable agricultural supply chains over the past decade. Currently, food and agriculture is the leading investment sector among impact investors: in a survey sample of 99 investors, 57% selected food and agriculture as a sector focus.2
The growth in agricultural impact investing is led, in large part, by a desire to achieve social and environmental impact. And although the trend towards increased agricultural investment is encouraging in this respect, data on the market trends and related impact outcomes of such investments are largely non-existent.
One of the core challenges in gaining a better understanding of the impacts related to investments in agriculture pertains to the diverse ways in which different stakeholders have approached and defined sustainability within the agricultural sector. As more investors move into this field, it becomes increasingly important to understand their performance against common indicators and benchmarks.
This report presents the culmination of over two years of collaboration between FAST members and the Impact Reporting and Investment Standards (IRIS) initiative aimed at defining such a set of common indicators and methodologies for impact assessment.
1 International Finance Corporation (IFC), Scaling up access to finance for agricultural SMEs: Policy review and recommendations, October 2011.2 J. P. Morgan and The Global Impact Investment Network (GIIN), “Perspectives on progress: The impact investor survey,” Global Social Finance, January 2013. The respondents are organizations that manage, or have committed capital for, at least US$10 million of impact investments.
5 \ Finance Alliance for Sustainable Trade
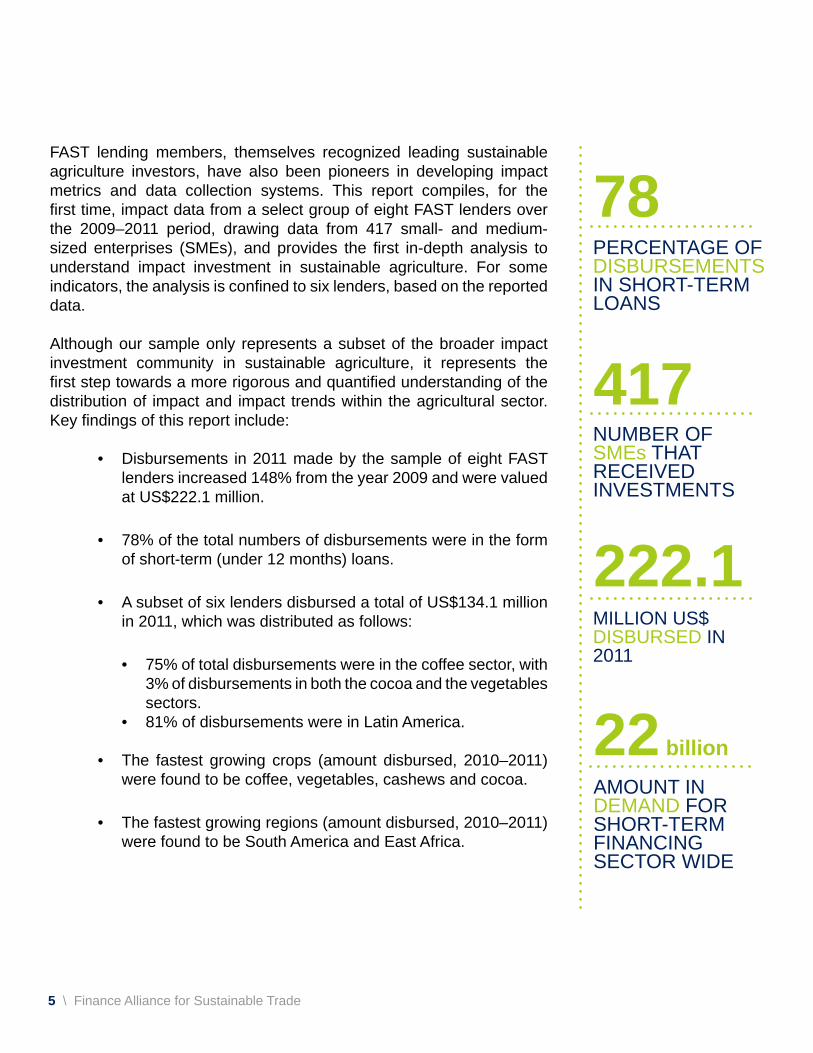
FAST lending members, themselves recognized leading sustainable agriculture investors, have also been pioneers in developing impact metrics and data collection systems. This report compiles, for the first time, impact data from a select group of eight FAST lenders over the 2009–2011 period, drawing data from 417 small- and medium-sized enterprises (SMEs), and provides the first in-depth analysis to understand impact investment in sustainable agriculture. For some indicators, the analysis is confined to six lenders, based on the reported data.
Although our sample only represents a subset of the broader impact investment community in sustainable agriculture, it represents the first step towards a more rigorous and quantified understanding of the distribution of impact and impact trends within the agricultural sector. Key findings of this report include:
• Disbursements in 2011 made by the sample of eight FAST lenders increased 148% from the year 2009 and were valued at US$222.1 million.
• 78% of the total numbers of disbursements were in the form of short-term (under 12 months) loans.
• A subset of six lenders disbursed a total of US$134.1 million in 2011, which was distributed as follows:
• 75% of total disbursements were in the coffee sector, with 3% of disbursements in both the cocoa and the vegetables sectors.
• 81% of disbursements were in Latin America.
• The fastest growing crops (amount disbursed, 2010–2011) were found to be coffee, vegetables, cashews and cocoa.
• The fastest growing regions (amount disbursed, 2010–2011) were found to be South America and East Africa.
78PERCENTAGE OFDISBURSEMENTS IN SHORT-TERM LOANS
417NUMBER OF SMEs THAT RECEIVED INVESTMENTS
222.1MILLION US$ DISBURSED IN 2011
22 billion
AMOUNT IN DEMAND FORSHORT-TERM FINANCING SECTOR WIDE

Investing for Change: An Analysis of the Impacts of Agricultural Investments from Select FAST Social Lenders / 6
• 64% of recurrent investments3 in the same SMEs were associated with increased revenue over the 2009–2011 period.
• 63% of the total sample of 417 SMEs hold at least one certification from a globally recognized sustainability initiative such as Fairtrade, Rainforest Alliance, UTZ Certified or Organic.
• In 2009, 71.39% of the total amount disbursed was associated with Fairtrade certification, followed by 52.76% linked to Organic certification.
• Based on the data from our sample, we estimate that, in 2011, 623 SMEs received investments, benefiting an estimated 1.8 million small farmers through a group of 19 leading social lenders.4
• Current investment of the group of leading social lenders, which was estimated at US$439.7 million in 2011,5 still represents a small fraction of overall financial need among smallholder agricultural production, which has been valued at US$450 billion per year6 across smallholder producers globally and at US$22 billion per year of short-term financing demand for “investment ready” smallholder producers already organized within SME producer organizations.7
The motivation underlying this report and the joint reporting process behind it has been to improve understanding and efficiency in the allocation of investment in sustainable agriculture finance. While this effort represents an unprecedented level of collaboration among financial institutions within the sector, there remains considerable opportunity for expanding the scope of the analysis through a still deeper harmonization and data collection processes with our partners. Although this report only represents the first steps in a longer journey, we hope that it can set the foundation for further collaboration in the future—this being a case where the whole is definitively greater than the sum of its parts.
3 In this context, the term “investments” refers to the annual aggregate number of disbursements made to a given SME.4 A group of 19 social lenders, which includes a selection of 16 FAST lending members: Agrofinanzas, Alterfin, Calvert Foundation, Coffee Development Fund, Conservation International’s Verde Ventures, Idepro, Merkur Development Loans, Pro-Rural, Proyecto Cambio-BCIE, Rabobank Foundation & Rabo Rural Fund, responsAbility, Root Capital, Shared Interest, Triodos Sustainable Trade Fund, Oikocredit and Working Capital for Community Needs, along with -3 additional investors:, Etimos, Acumen Fund and Grassroots Business Fund. 5 Data refer to the total amount of disbursements made in 2011. Data come from reported impact data to FAST, annual reports and data available in: Carroll, T., Stern, A., Zook, D., Funes, R., Rastegar, A., and Lien, Y., Catalyzing smallholder agriculture finance, Dalberg Global Development Advisors, 2012.6 Carroll, T., Stern, A., Zook, D., Funes, R., Rastegar, A., and Lien, Y., Catalyzing smallholder agriculture finance, Dalberg Global Development Advisors, 2012.7 Ibid.

Investing for Change: An Analysis of the Impacts of Agricultural Investments from Select FAST Social Lenders / 8
seCtIon I:BACKGROUND
Impact investment is defined by a shared commitment among investors to promote social well-being while obtaining positive financial returns. Although impact investing can target virtually any sector, a survey performed by J. P. Morgan and The Global Impact Investment Network (GIIN) in early 2013 from a sample of 99 investors ranked the “Food and Agriculture” sector as the most frequently targeted, with 57% of the sample prioritizing it ahead of healthcare and financial services including microfinance8; this is up from “second place” with respect to a similar survey conducted in 2011.9 These results confirm observed growth trends in impact investing in the agricultural sector more generally.10
This focus reflects the close linkages between agricultural production and global sustainability. On the one hand, agriculture continues to be the backbone of many developing country economies. An estimated 2.5 billion people depend on agricultural commodities for their livelihoods, with the vast majority living below the poverty line.11 On the other hand, the agricultural sector is critical for economic growth, providing about 60% of total employment and representing around 20% of GDP across many low-income countries.12 Finally, agriculture is widely recognized as a major source of greenhouse gas emissions, accounting for an estimated 15% of global emissions directly and an additional 15% through land conversion processes.13 Within a context of ongoing population growth, changing consumption patterns in emerging economies and growing consumption of biofuels, the relationship between agriculture and sustainable development can only be expected to deepen over time.
A growing recognition of the links between agriculture and global sustainability has given rise to a rapid growth in demand for “certified” sustainable agricultural products over the past decade, with several agricultural commodities experiencing growth of more than 40% per annum over the last five years.14
Across some of the more mature sectors, it is estimated that up to 20% of global production is compliant with an international sustainability standard.15 Growing commitments from mainstream players such as Cadbury’s, Kraft, Unilever, IKEA, Kimberly-Clark and Walmart point towards a continuation of this trend for the foreseeable future.
8 J. P. Morgan and The Global Impact Investment Network (GIIN), Perspectives on progress: The impact investor survey, Global Social Finance, January 2013. The respondents are organizations that manage, or have committed capital for, at least US$10 million of impact investments. 9 J. P. Morgan and The Global Impact Investment Network (GIIN), Insight into the Impact Investing Market, December 2011. 10 Food and Agriculture Organization of the United Nations (FAO), Trends and impacts of foreign investment in developing country agriculture: Evidence from case studies, 2013.11 International Finance Corporation (IFC), Scaling up access to finance for agricultural SMEs: Policy review and recommendations, October 2011.12 Cervantes-Godoy, D., and Dewbre, J., Economic importance of agriculture for poverty reduction, OECD Food, Agriculture and Fisheries Working Papers, No. 23, 2010.13 Agriculture is estimated to account for at least 81% of land conversion emissions and, when taking all direct and indirect emissions (including land conversion, agrochemical production and irrigation) from agriculture into account, total emissions from agriculture are estimated to range from 16.8% to 32.2% of global greenhouse gas emissions. See Bellarby, J., et al., Cool farming: climate impacts of agriculture and mitigation potential, Amsterdam: Greenpeace, IPCC, 2008.14 The forestry and coffee sectors are two examples. See: International Institute for Sustainable Development (IISD), The State of sustainability initiatives review 2010: Sustainability and transparency.15 Ibid.
ImpaCt InvestIng and sustaInable agrICulture smes

9 \ Finance Alliance for Sustainable Trade
16 Food and Agriculture Organization of the United Nations (FAO), Agricultural investment funds for developing countries, 2010.17 Bage, L., Supporting smallholders is crucial to food security, The International Fund for Agricultural Development (IFAD), July 8, 2008.18 Carroll, T., Stern, A., Zook, D., Funes, R., Rastegar, A., and Lien, Y., Catalyzing Smallholder Agriculture Finance, Dalberg Global Development Advisors, 2012.19 Ibid. Carroll et al. estimate that approximately 10% of smallholder producers are grouped into producer organizations or equivalent SMEs. Carroll et al. have also referred to the SME finance pathway as the “growth pathway.” There are, of course, other ways of meeting the demand for smallholder finance. The SME finance pathway represents the lowest hanging fruit, with the longest track record, for impact investment in many cases.20 Data refer to the total amount of disbursements made in 2011. Data come from reported impact data to FAST, annual reports and data available in: Carroll, T., Stern, A., Zook, D., Funes, R., Rastegar, A., and Lien, Y., Catalyzing smallholder agriculture finance, Dalberg Global Development Advisors, 2012.
In addition to growing mainstream presence, sustainable supply chains are finding their way into an ever-growing range of products, moving beyond the traditional sectors of coffee, cocoa, bananas and tea to include others such as cotton, honey, oilseeds, quinoa, timber, sugar cane, flowers, plants, nuts and rice, among others. This market growth offers the possibility of new, higher value and more stable trading relationships for producer organizations, including SMEs in developing countries. The double dividends associated with sustainable markets of growing market opportunity coupled with social and environmental benefits represent an important gateway for poverty reduction and sustainable development.
But taking advantage of these new opportunities will only be possible if accompanied by corresponding finance and/or investment. It is estimated that approximately US$83 billion of net investments per year must be made in the agricultural sector of developing countries just to secure enough food to feed the expected world population of 9.1 billion by 2050, and the major sources of capital will need to come from private investors.16 If agriculture is to adopt sustainable production practices along the way, as it must, this figure would be substantially larger in order to enable this transition.
Considered from the perspective of financing needs among existing smallholder producers, it is estimated that the world’s 450 million smallholder farmers17 are currently in need of financing in the range of US$450 billion annually.18 Even limiting short-term demand to those farmers capable of entering the “SME finance pathway”, in other words accessing finance through SMEs, demand is estimated at about US$22 billion annually.19
Regardless of the demand figure used, it is clear that current rates of impact investing fall far short of both need and opportunity. Tracked investment through the group of leading social lenders in 2011 was estimated at US$439.7 million,20 with most investment directed towards short-term financing needs.
seCtIon I:BACKGROUND

Investing for Change: An Analysis of the Impacts of Agricultural Investments from Select FAST Social Lenders / 10
In light of the growing demand for sustainable agricultural products and the promise of improved social and environmental impacts through certification, a growing number of international and local financial institutions and investors are looking at certified SMEs in developing countries as investment targets. On the one hand, sustainable agriculture represents an attractive investment opportunity due to its importance to global sustainability. On the other hand, sustainable agriculture represents an attractive investment opportunity due to its potential to provide positive financial returns under conditions of reduced risk.21
To the extent that the case for investing in sustainable agriculture depends on the sustainability returns it promises, there is a growing need to monitor the degree to which this is true and, if so, how such returns can be maximized. The first step in such a process revolves around establishing a common understanding of what impacts are most important to lenders and investors, along with the degree to which such impacts are being achieved by competing investment strategies.
Led by its proactive membership, themselves leaders in impact assessment, FAST has played a pioneering role in the development of a common language for understanding impacts and corresponding social returns. This report represents the initial social, environmental and economic results from a select group of eight leading members of FAST. It represents the first steps in a longer process of building enhanced efficiency across sustainable agriculture investments more generally.
brIef IntroduCtIon to fast and Its leadIng role In ImpaCt measurementFAST is a member-driven, non-profit association representing over 148 members in 31 countries, including financial institutions, producers, supply chain actors, development non-governmental organizations (NGOs) and certification agencies dedicated to bringing sustainable products to market. FAST aims to promote sustainable economic development by improving efficiency and transparency in financial markets for sustainable SMEs in emerging economies. Since 2008, FAST has played a leading role in facilitating the growth of impact investment in sustainable agriculture.
21 As compared with conventional agriculture. Sustainable production systems are typically associated with more stable trading relationships and better overall management practices, which are linked to reduced financial risk.
seCtIon I:BACKGROUND

11 \ Finance Alliance for Sustainable Trade
• 148 members in 31 countries including 20 financial institutions
• Facilitated disbursement of US$26 million to agriculture SMEs in developing countries through nine FAST Financial Fairs©
• Over 204 one-on-one investor–SME meetings
• Approximately 80 SMEs coached in improving their credit readiness with the aid of pioneering tools
• 15 investors trained on market performance and investment opportunities in sustainable forestry
• Over 40 prospective investors introduced to financial needs and investment opportunities in sustainable agriculture markets
• Three market reports published covering the cocoa and forestry sectors
• Directory on available guarantee facilities at the global level to financial institutions and SMEs, to support investment in the agriculture sector
• Online platform for sustainable SME finance market linkage and impact measurement tools available at http://marketplace.fastinternational.org/
• A wide range of sector events conducted in East Africa, Europe, South America, Central America, the United States and Canada, including a global forum to promote long-term investment opportunities
• The Financial Literacy Toolbox, a complete set of training materials for local consultants and SMEs to promote SME credit readiness and access to finance
Box 1: Key Achievements of FAST to Date
seCtIon I:BACKGROUND

Investing for Change: An Analysis of the Impacts of Agricultural Investments from Select FAST Social Lenders / 12
In 2011, FAST developed the Shared Impact Assessment and Measurement Toolbox (SIAMT), a wide-reaching yet concise model to measure the social, economic and environmental impacts of investments in SMEs active in sustainable agriculture value chains. This is the first framework of its kind explicitly designed for investments in agriculture SMEs in developing countries.22 FAST SIAMT’s version 1.0 was developed in partnership with the IRIS initiative and the Committee on Sustainability Assessment (COSA), with the input of more than 60 FAST members, stakeholders and experts in the field.
FAST SIAMT is a monitoring and assessment framework and a set of indicators designed to assist investors in their impact measurement practices. A selected number of agriculture-related core indicators have also been included in IRIS, ensuring consistency and harmonization across other impact measurement frameworks (e.g., alignment with IRIS for SME-level metrics and with COSA for farmer-level metrics). Since the development of SIAMT, FAST has supported more than 16 investment funds and financial institutions in the adoption of the framework and implementation of best practices in impact measurement. Since 2012, FAST has received impact data related to over 745 reported investments in 417 sustainable agriculture SMEs in developing countries.
22 One of the unique aspects of the FAST SIAMT indicator set is that it sets forth impact indicators at both the level of the producer organization (SME) and at the farmer level.
seCtIon I:BACKGROUND
• Consultation with FAST members regarding the need to have a common framework to measure impact• Research conducted on existing methodologies and frameworks
• Development of FAST SIAMT• Inclusion of a set of indicators in IRIS• Participation of more than 60 international stakeholders
• Development of data collection and reporting tools in English and Spanish• Support FAST members and partners in implementing FAST SIAMT• Data sharing partnership with investors, financial institutions and IRIS
• Development of first report on impact of FAST’s lending members on sustainable agriculture SMEs• Outreach to the larger impact investment community• FAST/GIIN joint research initiative on impact of agriculture investments • The development of impact indicators for investments in natural forest and plantations
2009-2010
2011
2012
2013
Box 2: Timeline of FAST SIAMT

13 \ Finance Alliance for Sustainable Trade
The present report is the first of a series of planned publications documenting the influence of impact investment on the agriculture sector. This report, Investing for Change: An Analysis of the Impacts of Agricultural Investments from Select FAST Social Lenders, builds from the reported impact data of eight investor members of FAST who have adopted FAST SIAMT and IRIS-aligned indicators.
Our presentation of the findings is divided into three sections. The first section provides an overview of reported loan disbursements by crop, country and region and an outline of SME investee growth. This is followed by an overview of key impact indicators related to SME performance. We conclude by analyzing investments through the window of individual certification initiatives, allowing for a better understanding of the relative association of different certification initiatives with access to finance.
seCtIon I:BACKGROUND

15 \ Finance Alliance for Sustainable Trade15 \ Finance Alliance for Sustainable Trade
A : A N A L Y S I S
During the period 2009–2011, our sample of reporting FAST lending members invested in a total of 417 agriculture SMEs, producing at least 32 different agricultural products, across 41 countries and benefiting an estimated number of 1.2 million rural farmers. Approximately 61% of the total number of SMEs were certified under one or another sustainability standard in 2011. Taking our sample as “representative” of the social finance sector more generally, we estimate the total number of SMEs and farmers to have benefited from impact investing in 2011 to be approximately 623 and 1.8 million, respectively.23 Although this only represents a small fraction of the estimated 450 million smallholders in need of finance, it nevertheless signals the importance of the trend in sustainable agricultural finance. Below we consider the trends in such investments over the 2009 to 2011 period across eight leading members of FAST as an indicator of potential trends in sustainable finance more generally.
loan dIsbursements for the perIod 2009-2011Agriculture is the main investment sector for FAST lending members. The eight investors contributing data to this report have been providing debt financing to SMEs in sustainable agriculture for more than a decade. Throughout the years, these investors have increased the total value of their disbursement amounts considerably and have expanded their outreach, in terms of type of agricultural commodities financed and countries reached. This section illustrates this scenario in an exemplary way. At the highest level, Figure 1 illustrates the evolution of the aggregate amount of reported annual amounts disbursed by the eight investors during the period 2009–2011. Notably, growth among the reporting lenders has been significant over the reported period, with growth of total disbursements over the three years being at or above 34% per annum.
seCtIon I I :KEY FINDINGS
32NUMBER OF DIFFERENT TYPES OF AGRICULTURAL GOODS PRODUCED
41NUMBER OF COUNTRIES REACHED
1.2 millionNUMBER OF RURAL FARMERS WHO BENEFITED
450 million
NUMBER OF RURAL FARMERSIN NEED OF FINANCE
23 This estimation was calculated using the ratio amount disbursed / total number of SMEs, and amount disbursed/total number of farmers calculated with the reported data, and making the extrapolation to the total number of 19 social lenders based on their amounts disbursed in 2011.
analysIs of reported loan dIsbursements for the perIod 2009-2011

Investing for Change: An Analysis of the Impacts of Agricultural Investments from Select FAST Social Lenders / 16
Multiple factors could lie behind this growth, including the increase of investment funds, the positive financial returns obtained from prior investments and the influence of commodity prices on investment trends24 (i.e., for the case of coffee, market prices increased significantly during the period 2009–2011).
Although participating members did not, as a general rule, report actual loan sizes, a simple average of the total annual amount disbursed, divided by the number of SMEs receiving investments, provides an indication of annual aggregate amount disbursed per SME. Figure 2 provides the mean and median per SME disbursement levels using this method and reveals a general trend towards greater amounts being disbursed per SME over time.
*Figures report disbursements made by the eight investors in the period, not their portfolio size. Please note that these investors tend to have multiple disbursements in a given year.24 International Coffee Organization (ICO), “Indicator Prices for coffee for the period 2009–2011,” available at: http://www.ico.org/prices/p2.htm.
Figure 1: Annual Total Amount Disbursed to Sustainable Agriculture SMEs*
2009 2010 2011
IN M
ILLI
ON
US
$
89.44
165.52
222.10
Based on data reported by 8 lending members of FAST
85%
34%
A : A N A L Y S I S
seCtIon I I :KEY FINDINGS

A : A N A L Y S I S
17 \ Finance Alliance for Sustainable Trade
seCtIon I I :KEY FINDINGS
Figure 2: Key Statistics of Annual Amounts Disbursed Per SME25
17 \ Finance Alliance for Sustainable Trade
25 It is important to note that since these data are derived from average figures, it is possible that several disbursements are made to a single SME in a given year. To the extent that this is the case, actual average loan size being granted may be expected to be somewhat smaller than the averages “per SME.”
1,200,000 -1,100,000 -1,000,000 -
900,000 -800,000 -700,000 -600,000 -500,000 - 400,000 - 300,000 -200,000 -100,000 -
0 -
343,849
200,000
392,158
220,000
424,419
229,022
2009 2010 2011
Maximum Observationexcluding outliersUpper Quartile (75th percentile)MeanMedian (50th percentile) Lower quartile (25th percentile)
Minimum observationexcluding outliers
AM
OU
NT
S D
ISB
UR
SE
D IN
US
$
Number of Reporting SMEs in 2009, 2010, 2011: 174, 255, 316Graph excludes outliers

26%
54%
74%
85%
91% 95%
97% 100%
0%
10%
20%
30%
40%
50%
60%
70%
80%
90%
100%
0
10
20
30
40
50
60
70
80
90
100
LESS T
HAN 100,0
0
100,0
01-2
50,00
0
250,0
01-5
00,00
0
500,0
01-7
50,00
0
750,0
01-1
,000,0
00
1,000
,001-
1,500
,000
1,500
,001 -
2,00
0,000
MORE THAN 2,
000,0
00
Number of SMEs receiving investment Cumulative percentage of number of SMEs
NU
MB
ER
OF
SM
ES
CU
MU
LAT
IVE
PE
RC
EN
TA
GE
OF
NU
MB
ER
OF
SM
ES
AMOUNT DISBURSED IN US$
Number of reporting SMEs: 316
Investing for Change: An Analysis of the Impacts of Agricultural Investments from Select FAST Social Lenders / 18
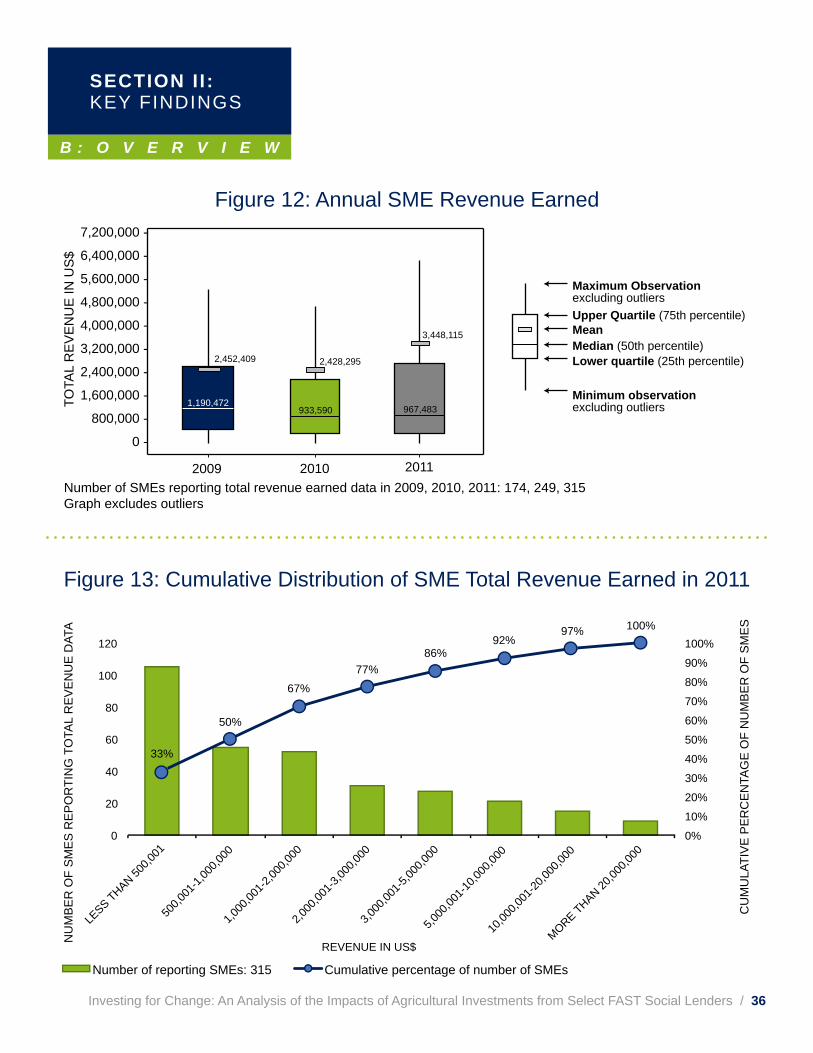
Figure 3 reveals that, in our sample of reported disbursements for the year 2011, approximately 75% of the disbursements were valued at below US$500,000. The observation in Figure 2 that the mean “per SME” contribution over the same period was also under US$500,000 would appear to corroborate this finding. However, importantly, Figure 2 also shows that the annual median of aggregate amounts disbursed per SME increased over the 2009–2011 period, suggesting that impact investors might be strategically placing larger loans over time.27
26 See previous footnote for methodological limitations of the analysis.27 Note that FAST producer members have long noted the challenge in securing longer-term finance for infrastructure development through supply chain finance vehicles. The upward trend of “per SME mean disbursements” may point towards increased efforts to provide infrastructure finance among the sample. This is a hypothesis that can only be confirmed with more robust data at the level of the individual loan.
Figure 3: Cumulative Distribution of Amount Disbursed Per SME in 201126
A : A N A L Y S I S
seCtIon I I :KEY FINDINGS

A : A N A L Y S I S
19 \ Finance Alliance for Sustainable Trade
seCtIon I I :KEY FINDINGS
Figure 4: Distribution of Amount Disbursed in 2011, By Crop28
Figure 5: Annual Growth of Amount Disbursed, by Crop*
-1,453,000(-98%)
2,119,181 (653%)
1,319,938 (47%)
21,839,982(28%)
575,807(33%)
824,090(73%)
882,443 (44%)
-1,587,474(-54%)
801,993 (2670%)
2,457,972(146%) 166,073
(27%)
-2,000,000
10,000,000
0
20,000,000
25,000,000
35,000,000 45,000,000 47,000,000
CASHEWS COCOA COFFEE HONEY QUINOA SESAME SPICES TIMBER VEGETABLES WINE & GRAPES
IN U
S$
2009-2010 Growth 2010-2011 Growth
Number of reported disbursements in 2009, 2010, 2011: 200, 255, 316; a scale break technique has been used to accommodatethe large values of coffee disbursements
948,381(47%)
939,055(125%)
455,989(267%)
1,329,251(223%)
638,000(132%)
945,349(121%)
25,391,421(47%)
353,970(14%)
116,794(56%)
* Figures show the growth of investment across different commodities. They report annual growth, referred to as the aggregated amount disbursed to correspondent SMEs in a given year, by crop.28 All data from this point on within the impact analysis presented in the report (sections IIa and IIb) is derived using data from 6 of the 8 reporting lenders due to data limitations associated with two of the reporting institutions.
COFFEE, 75%
Total amount disbursed: US$134.12 millionNumber of aggregate disbursements: 316
OTHER, 9% AMARANTHCHESTNUTSCORN, DRIED FRUITSMACADEMIAMANGOOLIVE OILPEANUTSPINEAPPLERICE, SOY, VANILLAWINE & GRAPES
QUINOA, 1%
COCOA, 3%
SEMSAME, 2%
COTTON, 1%
HONEY, 2% CASHEWS, 2%
SPICES, 1% BANANA, 1%
VEGETABLES, 3%

Investing for Change: An Analysis of the Impacts of Agricultural Investments from Select FAST Social Lenders / 20
Figures 4 and Figure 5 show investment trends across different commodities. One of the early drivers for finance to agriculture SMEs was the Fairtrade certification system.29 Sustainable finance has, accordingly, followed a parallel path to the development of Fairtrade and certification in the agriculture sector more generally, beginning with the development of markets in coffee and then expanding into other product areas. As a result, the current flows of finance to sustainable agriculture SMEs by social lenders are dominated by loans to coffee SMEs. In 2011, coffee accounted for US$100,754,264, or 75% of the total amount disbursed. Although this represents a virtual doubling of the absolute amount invested in coffee between 2009 and 2011, up from US$53,522,861 in 2009 among reporting members, the relative dominance of coffee investment has declined from 2009 levels, where coffee accounted for 79% of the total amount disbursed from our segment of lenders.
As more entrants come into the market and overall investment capacity grows, social lenders are increasingly looking for new markets in which to operate. In terms of absolute volumes disbursed, cocoa and vegetables lead the way with US$4,150,528 and US$4,147,027 being disbursed, respectively, in 2011, and with both commodities showing significant growth in total disbursements between 2010 and 2011. Although of smaller size in terms of absolute disbursements, sesame, cashews, honey, quinoa, cotton and timber all attracted significant investments in 2011. The growth in these commodities signals a growing interest in seeking, and even a growing need to seek, a more diverse investment portfolio.
Data on the number of SMEs receiving investment provide an indication of the degree and distribution of financial activity generated by reporting institutions. Figure 6 and Figure 7, for example, reveal a clear concentration of activity in Latin America. Peru, Bolivia, Mexico, Honduras and Nicaragua are the most important recipients of financial services from reporting members in 2011.30
29 Fairtrade, as defined by FLO International standards, actually specifies the provision of finance (by Fairtrade buyers) as one of the criteria for coffee certification. The pressures created by Fairtrade certification for opening access to finance provide a partial explanation for the original investment and growth in the coffee sector by social lenders.30 This outcome might be explained by a variety of factors. First, sustainable value chains are more developed in Latin America. Latin America’s leader-ship in coffee production positions it well to lead in the production of sustainable coffee. This in turn gives it an advantage in seeking access to social finance, which is still primarily associated with coffee production. Second, the Latin American region is characterized by a higher degree of producer organization (than that found in Africa and Asia), further facilitating access to finance. Finally, better access to data on SME performance as well as a higher level of stability in supply chain relations in Latin America has enabled an enhanced information base and understanding of the market in this region.
A : A N A L Y S I S
seCtIon I I :KEY FINDINGS

PERU, 21%
BOLIVIA, 19%
MEXICO, 12%
HONDURAS, 6%
NICARAGUA, 5%
GUATEMALA, 4%
RWANDA, 4%
COSTA RICA, 1% KENYA, 3%
ECUADOR, 3% TANZANIA, 3%
UGANDA, 3% HAITI, 2% USA, 2%
OTHER, 14%
Number of reporting SMEs: 317
ARGENTINABELIZEBENIN BURKINA FASOCAMEROONCHILECOLOMBIACOSTA RICA DOMINICAN REPUBLICD R CONGOGHANAIVORY COASTLAOSMALI MOZAMBIQUEPALESTINEPANAMA PARAGUAYSENEGALTOGOZAMBIA
A : A N A L Y S I S
21 \ Finance Alliance for Sustainable Trade
Figure 6: Distribution of SMEs Receiving Investment in 2011, by Region*
Figure 7: Distribution of SMEs Receiving Investment in 2011, by Country*
seCtIon I I :KEY FINDINGS
Number of reporting SMEs: 317
WESTERN ASIA,0.3%
NORTH AMERICA, 2%CARIBBEAN, 3%
WEST AFRICA, 5%
EAST AFRICA,
14%
MEXICO &CENTRAL AMERICA,
30%
SOUTH AMERICA,45%
OTHER, 1%SOUTH-EASTERN
ASIA, 0.3%
MIDDLE AFRICA,
0.6%
“As A SocIAL INveStor, Alterfin is Proud of the strong relAtionshiPs we hAve built with our PArtners over the yeArs. these relAtionshiPs Are key to understAnding their oPerAtions And to offering them finAnciAl services designed to their needs. together, we work towArds the develoPment of A SuStAINAbLe AgrIcuLture in which smAllholders PlAy A centrAl role.” - kris goossenaerts, managing director of alterfin
* We have received investment data from 317 SMEs; however, the investment value from 1 SME was unavailable.

-655,800(-25%)
478,714(22%)
14,492,515(61%)
5,634,783(15%)
992,000(1341%)
1,436,000(135%)
10,168,919(30%)
19,227,305
(43%)
99,481(33%)
1,403,746(307%)
2,685,142(144%)
4,254,026(69%)
5,753,547(55%)
223,796(100%)
557,231(249%)
511,717(178%)
-300,000(-38%)
0
23,000,000
-1,000,000
28,000,000 30,000,000
NORTH AMERICA MEXICO &CENTRAL AMERICA
CARIBBEAN SOUTH AMERICA EUROPE WEST AFRICA EAST AFRICA MIDDLE AFRICA SOUTH-EASTERN ASIA
IN U
S$
2009-2010 Growth 2010-2011 Growth Number of reported disbursements in 2009, 2010, 2011: 200, 255, 316; a scale break techniques has been employed to accommodate the large values of disbursements in South America
Investing for Change: An Analysis of the Impacts of Agricultural Investments from Select FAST Social Lenders / 22
As the financing model for impact investing in agriculture matures, lenders and investors are expanding into new markets. As a result, the virtual monopoly that Latin America once enjoyed in sustainable SME finance is now being challenged by a growing number of investments across Africa and Asia. As Figures 8 to 11 illustrate, sustainable finance is growing fastest on the African continent. Among our sample of lenders, East Africa leads the way for growth outside of Latin America, followed by West Africa. Rwanda and Uganda especially have experienced significant growth in disbursements during the period 2009–2011.31
*Figure 9 and Figure 11 report annual growth, referred to as the aggregated amount disbursed to correspondent SMEs in a given year, by region and by country.31 The growth of financial services being offered to African clients is likely a reflection of the growing penetration of Fairtrade and other sustainability certification systems in Africa rendering the market a more attractive site for impact investment.
Figure 8: Amount Disbursed in 2011, by Region
Figure 9: Annual Growth of Amount Disbursed, by Region*
SOUTH AMERICA, 48%
MEXICO & CENTRAL AMERICA,
33%
EAST AFRICA,
12% WEST AFRICA, 3%
CARIBBEAN, 2%
NORTH AMERICA, 1%
MIDDLE AFRICA, 0.6%
SOUTH-EASTERNASIA, 0.4%
WESTERN ASIA, 0.1%
OTHER, 1%
Total amount disbursed: US$134.12 million Number of aggregate disbursements: 316
A : A N A L Y S I S
seCtIon I I :KEY FINDINGS
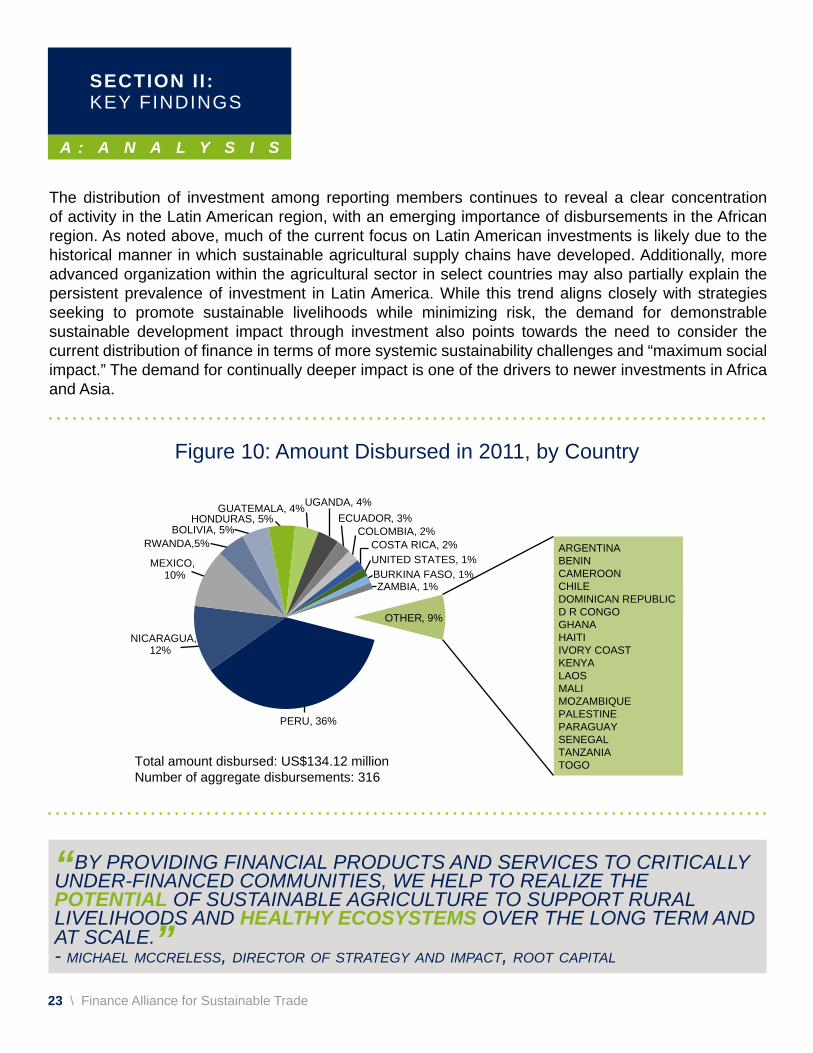
Total amount disbursed: US$134.12 millionNumber of aggregate disbursements: 316
PERU, 36%
NICARAGUA, 12%
MEXICO, 10%
RWANDA,5% BOLIVIA, 5%
HONDURAS, 5% GUATEMALA, 4% UGANDA, 4%
ECUADOR, 3% COLOMBIA, 2%
COSTA RICA, 2% UNITED STATES, 1% BURKINA FASO, 1% ZAMBIA, 1%
OTHER, 9%
ARGENTINABENINCAMEROONCHILEDOMINICAN REPUBLICD R CONGOGHANAHAITIIVORY COASTKENYALAOSMALIMOZAMBIQUEPALESTINEPARAGUAYSENEGALTANZANIATOGO
23 \ Finance Alliance for Sustainable Trade
A : A N A L Y S I S
seCtIon I I :KEY FINDINGS
Figure 10: Amount Disbursed in 2011, by Country
“by Providing finAnciAl Products And services to criticAlly under-finAnced communities, we helP to reAlize the poteNtIAL of sustAinAble Agriculture to suPPort rurAl livelihoods And heALthY ecoSYStemS over the long term And At scAle.”- michael mccreless, director of strategy and impact, root capital
The distribution of investment among reporting members continues to reveal a clear concentration of activity in the Latin American region, with an emerging importance of disbursements in the African region. As noted above, much of the current focus on Latin American investments is likely due to the historical manner in which sustainable agricultural supply chains have developed. Additionally, more advanced organization within the agricultural sector in select countries may also partially explain the persistent prevalence of investment in Latin America. While this trend aligns closely with strategies seeking to promote sustainable livelihoods while minimizing risk, the demand for demonstrable sustainable development impact through investment also points towards the need to consider the current distribution of finance in terms of more systemic sustainability challenges and “maximum social impact.” The demand for continually deeper impact is one of the drivers to newer investments in Africa and Asia.

2009-2010 Growth 2010-2011 Growth
Number of reported disbursements in 2009, 2010, 2011: 200, 255, 316A scale break technique has been employed to accommodate the large value of disbursements in Peru
-173,999 (-6%)
-2,130,000 (-48%)
-643,959 (-4%)
-1,333,285 (-55%)
-655,800 (-25%)
0 9,000,000 12,000,000 15,000,000
-3,000,000
2,587,458 (102%)
478,714 (22%)
1,786,300 (204%)
160,204 (7%)
1,434,500 (108%)
3,867,700 (140%)
14,477,957 (42%)
8,037,669 (31%)
7,906,385 (93%)
461,266 (7%)
7,077,106 (105%)
508,800 (9%)
822,836 (17%)
334,519 (11%)
2,954,779 (86%)
2,491,231 (76%)
2,111,811 (78%)
708,922 (30%)
1,521,822 (52%)
795,317 (35%)
189,399 (6%)
UNITED STATES
UGANDA
TANZANIA
RWANDA
PERU
NICARAUA
MEXICO
HONDURAS
GUATELMALA
ECUADOR
COSTA RICA
COLUMBIA
BOLIVIA
IN U
S$
Investing for Change: An Analysis of the Impacts of Agricultural Investments from Select FAST Social Lenders / 24
Figure 11: Annual Growth of Amount Disbursed, by Country*
*Figure 9 and Figure 11 report annual growth, referred to as the aggregated amount disbursed to correspondent SMEs in a given year, by region and by country.
A : A N A L Y S I S
seCtIon I I :KEY FINDINGS

25 \ Finance Alliance for Sustainable Trade
“the boliviAn AssociAtion for rurAl develoPment, Pro-rurAl, is An institution with thirteen yeArs of continuous work, suPPorting rurAl Productive initiAtives with SocIAL commItmeNt to Promote equALItY And INcLuSIoN, As well As imProving the quAlity of life for fArmers And their fAmilies.” - pro-rural
A : A N A L Y S I S
seCtIon I I :KEY FINDINGS
Maps 1 through 3 compare the regional distribution of loan disbursements during the period with the distribution of internationally recognized sustainability priorities, as depicted by the Gini coefficient, the Human Development Index (HDI) and the Environmental Performance Index (EPI). Approaching social impact from a “needs-based” definition of sustainable development,32 it would appear that the biggest opportunities for impact reside within the African and Asian regions which, as of yet, remain largely underserved by the social finance sector. As market demand for sustainable products from these regions continues to grow,33 the viability of increasing social investment in the region can also be expected to expand.
32 United Nations, Report of the World Commission on Environment and Development, Our common future, 1987.33 Some of the fastest growth in the demand for sustainable products is being witnessed across the African continent. See The state of sustainability initiatives review 2013, forthcoming.
81%OF DISBURSEMENTS IN 2011, WERE IN latIn amerICa. BASED ON THE INDExES PRESENTED, ADDITIONAL opportunItIes FOR IMPACT RESIDE WITHIN THE afrICan and asIan REGIONS WHICH, AS OF YET, REMAIN LARGELY under served BY THE SOCIAL FINANCE SECTOR.

“first, idePro funding Allowed me to Improve ANd expANd my own Production of quinoA. subsequently, it Allowed me to develoP my Activity As collector And mArketer of orgAnic quinoA, giving me cAPitAl to PAy fAIr prIceS to my suPPliers. idePro credit Allowed me to helP my suPPliers with the PurchAse of AgriculturAl mAchinery, As A PAyment of orgAnic quinoA thAt i buy from them. i Am currently working with the cAPitAl thAt idePro lent me, to collect quinoA from my suPPliers And sell it to INterNAtIoNAL mArketS. As well, my suPPliers receive idePro credit And technicAl AssistAnce services to imProve the quANtItY And the quALItY of the Product thAt they sell to me.”- tito silvestre alanoca, of oruro bolivia

Investing for Change: An Analysis of the Impacts of Agricultural Investments from Select FAST Social Lenders / 2827 \ Finance Alliance for Sustainable Trade
Amount Disbursed in the Period Versus the Human Development Index (HDI)

Amount Disbursed in the Period Versus the Gini Coefficient
Investing for Change: An Analysis of the Impacts of Agricultural Investments from Select FAST Social Lenders / 3029 \ Finance Alliance for Sustainable Trade

Investing for Change: An Analysis of the Impacts of Agricultural Investments from Select FAST Social Lenders / 3231 \ Finance Alliance for Sustainable Trade
Amount Disbursed in the Period Versus the Environmental Performance Index (EPI)

AM
OU
NT
S D
ISB
UR
SE
D IN
US
$
VO
LUM
E O
F E
XP
OR
TS
IN T
ON
NE
S
ZAMBIA TANZANIA CAMEROON CHILE
CHINA ARGENTINA MEXICO INDIA SPAIN GERMANY
BRAZIL
HONEY
Largest exporting countries Leading investees
0
30,000
60,000
90,000
120,000
0
200,000
400,000
600,000
800,000
1,000,000
PERU NICARAGUA MEXICO HONDURAS GUATEMALA COSTA RICA RWANDA COLOMBIA ECUADOR BOLIVIA
BRAZIL VIET NAM INDONESIA COLOMBIA GERMANY GUATEMALA PERU HONDURAS
COFFEE
Largest exporting countries Leading investees
0
250,000
500,000
750,000
1,000,000
1,250,000
1,500,000
1,750,000
2,000,000
VO
LUM
E O
F E
XP
OR
TS
IN T
ON
NE
S
0
5,000,000
10,000,000
15,000,000
20,000,000
25,000,000
30,000,000
AM
OU
NT
S D
ISB
UR
SE
D IN
US
$
AM
OU
NT
S D
ISB
UR
SE
D IN
US
$
VO
LUM
E O
F E
XP
OR
TS
IN T
ON
NE
S
UGANDA
UNITED STATES INDIA BRAZIL AUSTRALIA UZBEKISTAN GREECE BURKINA FASO
PAKISTAN TURKMENISTAN
ZIMBABWE
COTTON
Largest exporting countries Leading investees
0
700,000
1,400,000
2,100,000
2,800,000
3,5000,000
0
500,000
1,000,000
1,500,000
2,000,000
33 \ Finance Alliance for Sustainable Trade
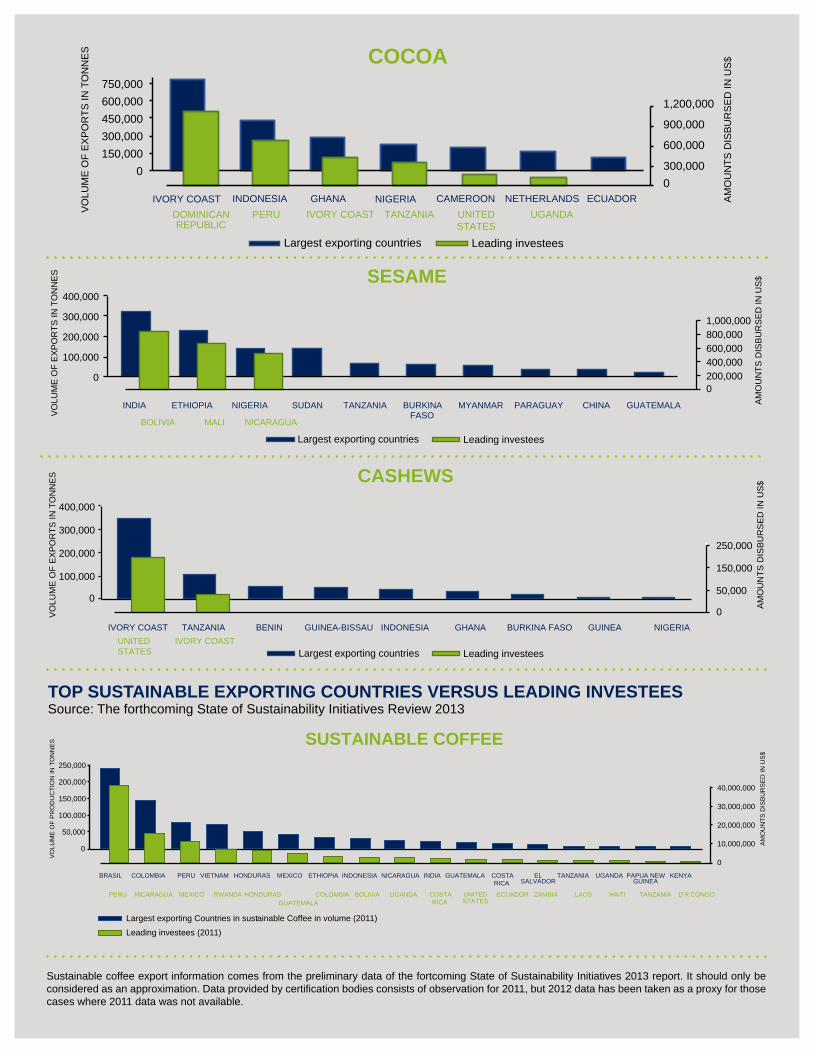
DashboarD 1The dashboard highlights potential investment opportunity for key commodities, comparing the world’s largest exporting countries to the leading investees from our sample data. The left axis of the graph corresponds to the volume of exports, which is represented by the blue bars. The right axis corresponds to the total amount disbursed during the period by FAST lenders, represented by the green bars.
Top ExporTing/proDucing counTriEs vErsus LEaDing invEsTEEs in 2010Source: FAOSTAT, Food and Agriculture Organization of the United Nations, 2010
SESAME
Largest exporting countries Leading investees
AM
OU
NT
S D
ISB
UR
SE
D IN
US
$
VO
LUM
E O
F E
XP
OR
TS
IN T
ON
NE
S
BOLIVIA MALI NICARAGUA
INDIA ETHIOPIA NIGERIA SUDAN TANZANIA BURKINA FASO
MYANMAR PARAGUAY CHINA GUATEMALA
0
100,000
200,000
300,000
400,000
200,000400,000600,000800,0001,000,000
0
AM
OU
NT
S D
ISB
UR
SE
D IN
US
$
VO
LUM
E O
F E
XP
OR
TS
IN T
ON
NE
S
UNITED STATES
IVORY COAST
IVORY COAST TANZANIA BENIN GUINEA-BISSAU INDONESIA GHANA BURKINA FASO GUINEA NIGERIA
CASHEWS
Largest exporting countries Leading investees
100,000
200,000
300,000
400,000
50,000
150,000
250,000
00
AM
OU
NT
S D
ISB
UR
SE
D IN
US
$
VO
LUM
E O
F E
XP
OR
TS
IN T
ON
NE
S
DOMINICANREPUBLIC
PERU IVORY COAST TANZANIA UNITEDSTATES
UGANDA
IVORY COAST INDONESIA GHANA NIGERIA CAMEROON NETHERLANDS
ECUADOR
COCOA
Largest exporting countries Leading investees
0
150,000
300,000
450,000
600,000
750,000
300,000
600,000
900,000
1,200,000
0
Top susTainabLE ExporTing counTriEs vErsus LEaDing invEsTEEs Source: The forthcoming State of Sustainability Initiatives Review 2013
Sustainable coffee export information comes from the preliminary data of the fortcoming State of Sustainability Initiatives 2013 report. It should only be considered as an approximation. Data provided by certification bodies consists of observation for 2011, but 2012 data has been taken as a proxy for those cases where 2011 data was not available.
PERU NICARAGUA MEXICO RWANDA HONDURAS GUATEMALA
COLOMBIA BOLIVIA UGANDA COSTARICA
UNITED STATES
ECUADOR ZAMBIA LAOS HAITI TANZANIA D R CONGO
BRASIL COLOMBIA PERU VIETNAM HONDURAS MEXICO ETHIOPIA INDONESIA NICARAGUA INDIA GUATEMALA COSTARICA
EL SALVADOR
TANZANIA UGANDA PAPUA NEW GUINEA
KENYA
AM
OU
NT
S D
ISB
UR
SE
D IN
US
$
VO
LUM
E O
F P
RO
DU
CT
ION
IN T
ON
NE
S
SUSTAINABLE COFFEE
Largest exporting Countries in sustainable Coffee in volume (2011)
Leading investees (2011)
0
50,000
100,000
150,000
200,000
250,000
0
10,000,000
20,000,000
30,000,000
40,000,000

35 \ Finance Alliance for Sustainable Trade
B : o v e r v i e w
sEcTion i i :Key FINdINgS
ovErviEw of rELaTionship bETwEEn financE anD fasT siaMT corE inDicaTorsOur analysis below is based on the recommended subset of FAST SIAMT Core Indicators at SMe level, provided in Table 1, for assessing the impacts of agricultural finance. The set of indicators presented is harmonized with IRIS and corresponds to the indicators most consistently reported across our sample of lending members, as illustrated in Figure 24: total revenue earned, employment, and availability of sustainable certification.34
It is important to note that although the FAST SIAMT indicators provide a starting point for understanding potential impact, their true value is found when applied to a particular investor’s theory of change. The absence of counterfactuals for comparison also limits one’s ability to extract causal relationships between investment and observed outcomes. As a common reference point for gathering descriptive performance statistics, the SIAMT indicators still provide important insights regarding the alignment of actual investment with investment objectives. A snapshot of current outcomes is also useful for identifying areas where further investment or shifts in investment strategies might be warranted.
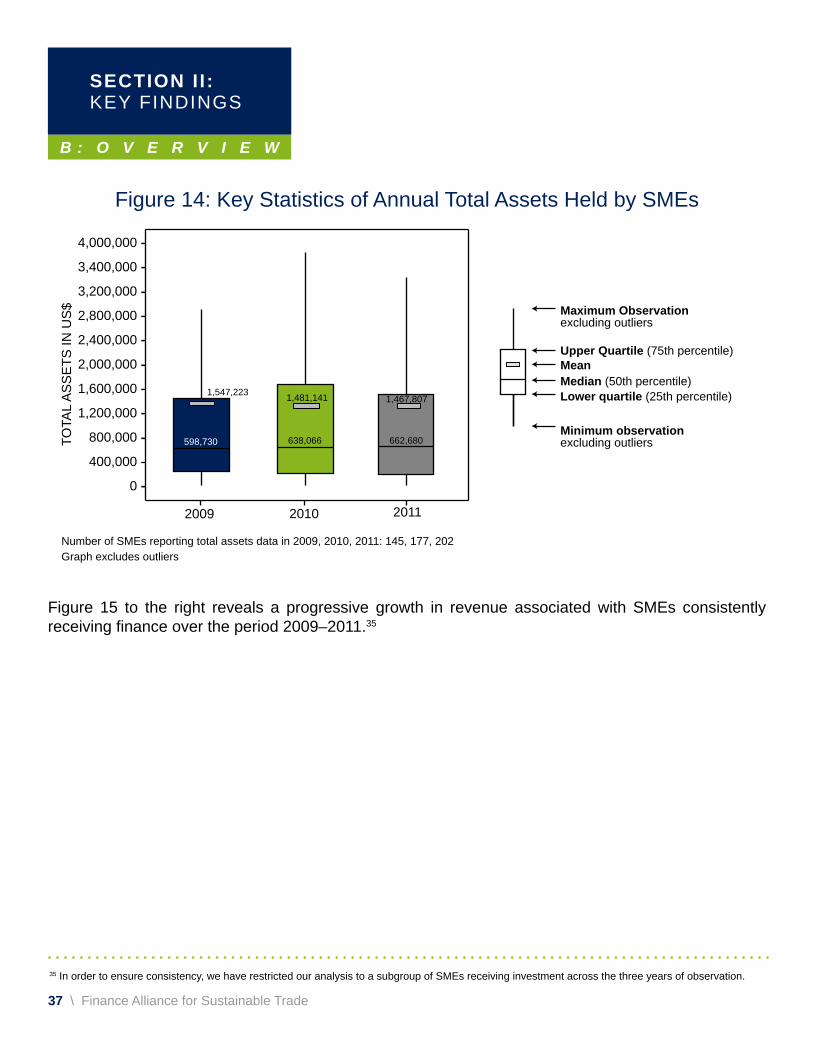
sME EconoMic viTaL sTaTisTics: ToTaL rEvEnuE EarnED anD assETs hELDIt is well understood that financial sustainability of the SME is an important component in ensuring longer-term business development and capacity for contributing to community well-being. Our sample of lenders consistently reported against total revenues earned and total assets held per SMe, providing a window for understanding financial stability over time across investment targets through the generation of positive returns with long-term perspectives. Figures 12, 13 and 14 detail the size of agriculture SMes receiving the reported disbursements in terms of the total revenue earned and total assets held, as per member reported figures.
34 data limitations allow us to report only on these three indicators, consistent with FAST’s data management terms and conditions and based on the common indicators used across the sample of reporting lenders.
2009 2010 2011
TOTA
L R
EV
EN
UE
IN U
S$
7,200,000 -
6,400,000 -
5,600,000 -
4,800,000 -
4,000,000 -
3,200,000 -
2,400,000 -
1,600,000 -
800,000 -
0 -
2,452,409
1,190,472
2,428,295
933,590
3,448,115
967,483
Number of SMEs reporting total revenue earned data in 2009, 2010, 2011: 174, 249, 315Graph excludes outliers
Maximum Observationexcluding outliersUpper Quartile (75th percentile)MeanMedian (50th percentile) Lower quartile (25th percentile)
Minimum observationexcluding outliers
33%
50%
67%
77% 86%
92% 97% 100%
0
20
40
60
80
100
120
LE
SS THAN 50
0,001
500,0
01-1
,000,0
00
1,00
0,001
-2,00
0,000
2,00
0,001
-3,00
0,000
3,00
0,001
-5,00
0,000
5,00
0,001
-10,0
00,00
0
10,00
0,001
-20,0
00,00
0
MORE T
HAN 20,00
0,000
0%
10%
20%
30%
40%
50%
60%
70%
80%
90%
100%
CU
MU
LAT
IVE
PE
RC
EN
TAG
E O
F N
UM
BE
R O
F S
ME
S
REVENUE IN US$
NU
MB
ER
OF
SM
ES
RE
PO
RT
ING
TO
TAL
RE
VE
NU
E D
ATA
Number of reporting SMEs: 315 Cumulative percentage of number of SMEs
Investing for Change: An Analysis of the Impacts of Agricultural Investments from Select FAST Social Lenders / 36
Figure 12: Annual SMe Revenue earned
Figure 13: Cumulative distribution of SMe Total Revenue earned in 2011
B : o v e r v i e w
sEcTion i i :Key FINdINgS
B : o v e r v i e w
sEcTion i i :Key FINdINgS
2009 2010 2011
Number of SMEs reporting total assets data in 2009, 2010, 2011: 145, 177, 202Graph excludes outliers
TOTA
L A
SS
ET
S IN
US
$
4,000,000 -
3,400,000 -
3,200,000 -
2,800,000 -
2,400,000 -
2,000,000 -
1,600,000 -
1,200,000 -
800,000 -
400,000 -
0 -
1,547,223
598,730
1,481,141
638,066
1,467,807
662,680
Maximum Observationexcluding outliers
Upper Quartile (75th percentile)MeanMedian (50th percentile) Lower quartile (25th percentile)
Minimum observationexcluding outliers
37 \ Finance Alliance for Sustainable Trade
Figure 14: Key Statistics of Annual Total Assets Held by SMes
Figure 15 to the right reveals a progressive growth in revenue associated with SMes consistently receiving finance over the period 2009–2011.35
35 In order to ensure consistency, we have restricted our analysis to a subgroup of SMes receiving investment across the three years of observation.

B : o v e r v i e w
sEcTion i i :Key FINdINgS
Investing for Change: An Analysis of the Impacts of Agricultural Investments from Select FAST Social Lenders / 38
It is important to note that the positive growth trend observed for total revenue earned on our subset of agricultural SMes may be the result of a wide variety of factors other than investment itself. The most obvious external variables relate to climatic and market variability within a given sector or geographic region, with commodity prices a prevailing factor. The importance of these factors in influencing overall revenue outcomes renders it impossible to determine whether or not these growth trends are actually a result of investment. This context is further complicated by the fact that the SMes in our subset (i.e., those receiving investment over the three-year period) are subject to a strong selection bias since risk management protocols driving investment are likely to select strong revenue generators for recurrent finance. Notwithstanding the above, a certain correlation between increasing revenue and access to finance suggests the symbiotic nature of investment and SME growth.
IN M
ILLI
ON
US
$
254.74 281.92
377.30
11%
34%
2009 2010 2011
Number of SMEs reporting revenue data every year: 99 Mean represents the average revenue per SME
Mean 2.85
Mean 3.81
Mean 2.75
Figure 15: Annual Aggregate earned Revenue growth

B : o v e r v i e w
sEcTion i i :Key FINdINgS
39 \ Finance Alliance for Sustainable Trade
rEgisTErED EMpLoyMEnT Access to employment under equitable terms supporting human well-being and sustainable livelihoods remains a key objective of virtually all impact investment. Most of the 1.4 billion people living on under US$1.25 a day live in rural areas and depend largely on agriculture for their livelihoods.36 In this context, agriculture SMEs have the potential to contribute significantly to poverty reduction through direct employment within the SMe itself, or by facilitating access to international markets and investment for their farmers, members or suppliers. The analysis presented below is confined to employment figures related to the SME itself due to current data limitations across reporting institutions; however, it is critical to note that this represents a significantly larger beneficiary base—as pointed out in section (a) earlier, an estimated number of 1.2 million rural farmers benefited from the investments conducted by FAST lending members during the period 2009–2011. Figure 16 below illustrates the distribution of employment for the sample of SMEs providing data during the period 2009–2011.
“On behalf Of Our investOrs and dOnOrs, WCCn is prOud tO Channelize the Capital that helps family farmers improve their farms, strengthen their COOperatives/assOCiatiOns and beCOme equal trading partners in the world economy.” - jeanne duffy, interim executive director of wccn
36 International Fund for Agriculture development (IFAd) and United Nations environment Programme (UNeP), Smallholder farmers key to lifting over one billion people out of poverty, 2013, available in: http://www.ifad.org/media/press/2013/27.htm.

Investing for Change: An Analysis of the Impacts of Agricultural Investments from Select FAST Social Lenders / 40
B : o v e r v i e w
sEcTion i i :Key FINdINgS
240225210195180165150135120105
907560453015
0
240225210195180165150135120105
907560453015
0
240225210195180165150135120105
907560453015
0
2009 2010 2011 2009 2010 2011 2009 2010 2011
TE
MP
OR
AR
Y E
MP
LOY
EE
S
PE
RM
AN
EN
T E
MP
LOY
EE
S
TOTA
L N
UM
BE
R O
F E
MP
LOY
EE
S
210
15
116
20
133
2315 10 11
3930 30 27 27 26
199
119
131
Maximum Observationexcluding outliersUpper Quartile (75th percentile)MeanMedian (50th percentile) Lower quartile (25th percentile)
Minimum observationexcluding outliers
Number of SMEs reporting employment data in 2009, 2010, 2011: 154, 242, 293Graph excludes outliers
Figure 16: Key Statistics of SMe employment data

B : o v e r v i e w
sEcTion i i :Key FINdINgS
41 \ Finance Alliance for Sustainable Trade
SMe investees ranges from 26 to 27, with temporary employees accounting for approximately 81% of the total employee base in 2011. Figures 17 and 18 illustrate the distribution between temporary and permanent employees for a subset of this sample of SMes receiving investment in all three years, and also reporting data on employment type (temporary, permanent and total number of employees).37 Although there appears to be no increase in the ratio of employee types over time, given the time-frame, namely the global financial crisis, over which these measures were taken, it is possible that financing may have enabled SMEs to at least retain permanent employees at steady levels despite the difficult economic climate.
37 Definition of terms: “Permanent employees” indicates the sum of all paid full-time and part-time employees. “Temporary employees” are seasonal and contract employees. “Seasonal employees” are primarily used in agriculture or fisheries. “Contracted employees” are generally hired for the completion of a specific task. The total number of employees is the sum of permanent and temporary employees.
Figure 17: Annual employment distribution
14,340
2,724
11,616
12,225
2,726
9,499
13,032
2,706
10,326
TOTAL NUMBER OF EMPLOYEES
PERMANENT EMPLOYEES
TEMPORARY EMPLOYEES
164
151
184
207
194
228
43
43
43
2011 2010 2009
Number of SMEs reporting temporary, permanent, and total number of employees data every year: 63Mean =

Investing for Change: An Analysis of the Impacts of Agricultural Investments from Select FAST Social Lenders / 42
B : o v e r v i e w
sEcTion i i :Key FINdINgS
-15% (-2,115 ) -18% (-2,117 )
7% (807 )
-1% (-20 )
9% (827 )
TOTAL NUMBER OF EMPLOYEE GROWTH
PERMANENT EMPLOYEE GROWTH
TEMPORARY EMPLOYEE GROWTH
2009-2010 Growth 2010-2011 Growth
Number of SMEs reporting temporary, permanent and total number of employees data every year: 63
Figure 18: Annual employment growth*
* Figure 18 reveals the possible effect on registered employment that the economic recession might have had on this sample of agriculture SMes.38 This may be due to any combination of reasons including: i) the number of temporary versus permanent workers may be relatively stable across agricultural SMEs and therefore not subject to significant change through finance; ii) the prevalence of short-term financing within the sector, in lieu of longer-term infrastructure-oriented financing, may not actually be targeted at increasing the SME employee base; iii) unchanged SME employee patterns may signal an explicit attempt by SMEs to direct the benefits of finance to their farmer base rather than to the SME organization as such. Attributing clearer causes to the employee outcomes can only be provided within the context of a more robust data set as well as a more detailed theory of change associated with such investments.
These figures confirm the predominant use of temporary employment within the agriculture sector as well as the generally stable ratio between temporary and permanent workers, even when revenue, and employment, levels experience growth. This finding suggests that the distribution between temporary and permanent workers may be a reflection of the nature of the sector rather than the absence of sufficient finance (i.e., temporary employees are seasonal workers that could be employed by the SME, for instance, for the harvest season or the product processing period).38

B : o v e r v i e w
sEcTion i i :Key FINdINgS
43 \ Finance Alliance for Sustainable Trade
cErTificaTionAs noted earlier, consumer markets for sustainable agricultural products have driven rapid growth in the certification of SMEs and corresponding member farmers over the past decade. In the coffee sector alone it is estimated that sustainable production has grown from approximately 20% of global production in 2009 to 35% of global production in 2011.39 In addition to providing assurances to consumers regarding the social and environmental performance of agricultural products, certification can also serve as a proxy for the social and environmental performance of investments in agricultural production, as described in Box 3. While this basic rationale explains a conceptual alignment between impact investing in agriculture and certification, it only touches the surface of the ways in which certification and impact investing can operate in a mutually supportive manner.
Perhaps even more important than certification’s assurances regarding positive social and environmental impacts are its role in building management systems and capacity within certified organizations. Most certification systems stipulate “management standards”—which themselves require the adoption of more robust management systems. These management systems can have positive externalities for overall risk management at the SME and farmer level, thereby reducing the social and financial risks associated with agricultural production.
Certification can also reduce exposure to market volatility by opening new and higher-value, more stable international markets for agricultural commodities. As a general rule, pricing for sustainable products tends to be less volatile than corresponding international pricing for conventional products.40 When combined with more direct trading relationships, many of the most important financial risks associated with agricultural production can be significantly reduced.41
39 See The state of sustainability initiatives review 2014, forthcoming.40 Potts, J., Alternative trade initiatives and income predictability: Theory and evidence from the coffee sector, International Institute for Sustainable development (IISd), 2007. 41 Ibid. FAST members report overall repayment rates in the range of 96% and 99%, providing one indication of the favourable risk profile of certified SMes.

Investing for Change: An Analysis of the Impacts of Agricultural Investments from Select FAST Social Lenders / 44
B : o v e r v i e w
sEcTion i i :Key FINdINgS
42 Voluntary Sustainability Initiatives, in International Institute for Sustainable development (IISd), The state of sustainability initiatives review 2010: sustainability and transparency.43 Asterisked items (*) denote criteria required by IFOAM.
Box 3: Relevant Criteria Required by Mainstream Voluntary Sustainability Initiatives:42 Fairtrade International (FLO), Rainforest Alliance, UTZ Certified and International Federation of Organic Agriculture Movements (IFOAM)43
• Social and economic
• No discrimination at work*• No forced labour*• Worst forms of child labour*• Safety at work• Healthy work conditions• Workers’ access to medical assistance/ insurance• Contract labour• Timely payment of wages• Maximum # of working hours• Minimum wage
• environmental
• Conservation / erosion of soil * (only recommended by Rainforest Alliance)• Quality of soil * (only recommended by Rainforest Alliance)• Waste pollution * (only recommended by Rainforest Alliance)• Use and management of water* (only recommended by FLO)
• governance and Management
• Adoption of a formal monitoring and evaluation system

B : o v e r v i e w
sEcTion i i :Key FINdINgS
45 \ Finance Alliance for Sustainable Trade
Year
2009
2010
2011
Certified SMEs70%
63%
61%
The different linkages between certification, sustainability and risk profile remain complex and warrant significantly further research. At the same time, trends within disbursements across our sample of lenders reveal a clear recognition of the value in linking finance to certified SMEs and farmers. During the period 2009–2011, approximately 63% of all SMEs receiving investment held at least one sustainable certification. Figures 19 through 21 show the distribution by number of certification held and by type of certification of the set of certified SMEs.
Figure 19: Percentage of Certified SMEs
38%
41%
15%
4%
2%
1 CERTIFICATION
2 CERTIFICATIONS
3 CERTIFICATIONS
4 CERTIFICATIONS
5 OR MORE CERTIFICATIONS
Data extracted from the SMEs' latest reported certification year; Number of SMEs reporting certificatin data: 262
Figure 20: Distribution of SMEs by Number of Certifications Held

Investing for Change: An Analysis of the Impacts of Agricultural Investments from Select FAST Social Lenders / 46
B : o v e r v i e w
sEcTion i i :Key FINdINgS
83%
66%
35%
8% 9% 7%
80% 75%
34%
10% 8% 6%
94%
43%
14% 13% 8% 5%
FAIR TRADE (FLO) ORGANIC OTHERS CERTIFICATIONS
RAINFOREST ALLIANCE
UTZ CERTIFIED CAFÉ PRACTICES
2009, % of total number of SMEs reporting certification data in 2009 (n=130) 2010, % of total number of SMEs reporting certification data in 2010 (n=167) 2011, % of total number of SMEs reporting certification data in 2011 (n=194)
Note: Organic certification includes all national/regional organic labels issued by certification bodies that meet the organic standards issued by the responsible government authority of each country in which they operate, such as Biolatina in Latin America or BioSuisse in Switzerland.
COCOA
COCOA 3%
2%
COCOA 4%
QUINOA 1%
QUINOA 9%
SESAME 1%
SESAME 3%
BANANA 1%
BANANA 1%
OTHER CROPS 7%
OTHER CROPS 5%
OTHER CROPS 4%
FAIR TRADE (FLO)
UTZ CERTIFIED
ORGANIC
RAINFOREST ALLIANCE
Data reported for the 2009-2011 period; Fair Trade reported values: 426; Utz Certified reported values: 42; Organic reported values: 297; Rainforest Alliance reported values: 52
COFFEE92%
COFFEE81%
COFFEE100%
COFFEE87%
Figure 21: Classification of SMEs by Type of Certification
Figure 22: Distribution of Main Certifications Reported, by Crop

B : o v e r v i e w
sEcTion i i :Key FINdINgS
47 \ Finance Alliance for Sustainable Trade
1.03 1.04 0.77
1.26
0.83
1.52 1.52 1.19
1.57
2.04 1.85
2.09 2.33 2.35
3.63
1.78
2.28 1.98
3.73
2009 2010 2011
IN M
ILLI
ON
US
D
No data/ No certification 1 certification 2 certifications
3 certifications 4 certifications 5 certifications 6 certifications
SMEs reporting both total revenue & certification, including no certification data in 2009: 160; SMEs reporting both total revenue & certification data in 2010:238; SMEs reporting both total revenue & certification data in 2011: 277
The relationship between certification and revenue generation at the SME level is a complex question warranting a variety of experimental methods. An analysis of descriptive statistics regarding the relationship between certification and revenue revealed an average increase in revenues corresponding to an increase in the number of certifications held, as shown in Figure 23. This result, however, was not found to be statistically significant.
Another analysis, a Spearman’s Rank Order correlation, was run to determine the strength and direction of association between the two variables; this revealed a weak, though statistically significant positive relationship between certification and revenue. Given the complexity of this relationship, it will be valuable to conduct further analysis with a larger data set. In coming editions of this report, we expect to have a more complete set of data for extension of the analysis, in order to provide more significant information related to this issue.
Figure 23: Average Total Revenue of SMes with Varying Number of Certifications

Investing for Change: An Analysis of the Impacts of Agricultural Investments from Select FAST Social Lenders / 48
c : f i n d i n g s
sEcTion i i :Key FINdINgS
METhoDoLogicaL finDings
The development of FAST SIAMT was a response to investor demand for a common set of indicators to measure the social, economic and environmental impact of their investments in agriculture SMes. Through a multi-stakeholder consultation process, FAST identified a list of more than 100 “key indicators” for measuring impact in agricultural investments. From the beginning, FAST made explicit efforts to ensure that any eventual FAST SIAMT indicators would be as closely aligned as possible with existing indicator frameworks. As a result, the final indicator set is closely harmonized, wherever possible, with the COSA and IRIS indicator sets. One of the unique features of FAST SIAMT, however, is its coverage of indicators dealing with (1) sustainability of the financial relationship between investors and investee, (2) sustainability of the agricultural SMe and (3) sustainability of the farming practices of SMe member farmers. FAST SIAMT indicators are thus specifically tailored to financial services in the agricultural sector.
drawing from the full list of indicators, FAST members prioritized a smaller set of core indicators applicable for immediate reporting.44 The most pressing challenge faced by lenders and investors was the current absence of data along many, if not most, of the identified indicators. Moreover, where data is being collected, it is typically in different formats, rendering actual use in common analysis a challenge. Figure 24 (on next page) reveals the rates at which data were reported on FAST core indicators among the eight participating investors, and provides some indication of the challenges faced in compiling sector-wide impact data.
44 See FAST Core Indicators at the SMe level in Larrea, C., Potts, J., and Schuite, g., FAST SIAMT 1.0, Building a common framework for impact assessment, The Finance Alliance for Sustainable Trade (FAST), 2011.

49 \ Finance Alliance for Sustainable Trade
C : F I N D I N G S
section i i :Key FindingS
investing for Change: An Analysis of the impacts of Agricultural investments from Select FAST Social Lenders / 50
6/8 6/8
5/8 5/8 5/8
4/8 4/8 4/8 4/8
3/8
6/8
5/8
4/8
3/8
2/8
1/8
0
Indicator name as defined in FAST SIAMT
Indicator data entry
Equivalent IRIS ID in brackets
Outreach
Number of farmermembers of the Coopor farmer suppliers tothe SME/Enterprise
(PI5350)
Profitability
Total revenue earned
(FP5958)
Employment
Full time employees
(OI3160)
Employment
Permanentemployees
(OI8869)
% Certified
Name of certificationheld & first date of
continuosly certified
(OI3160)
Employment
Temporary employees
(OI9028)
Techniques Used
Total land under cultivation
(OI5408 or PI3789)
Outreach - Female
Number of farmer(female) members ofthe Coop or farmer
suppliers to the SME/Enterprise
(PI1728)
Sales Volume
Amount of totalproduct sold
(PI1263)
Related to SalesVolume
Volume Exported
(PI9029)
Indicators Included in both FAST SIAMT and IRISIndicators Included only in IRISIndicators Included only in FAST SIAMT
Figure 24: The Most Common indicators used in 2011 for the Sampleof eight investors (Presented by the number of Reporting investors Using each indicator)
As Figure 24 illustrates, the use of a common set of indicators with a standard definition is still an emerging process. From the sample of data analysed, employment is the only indicator measured across the eight lenders, and even here, in different ways depending on the investor. As Figure 24 also shows, two indicators were measured across 75% of the sample: outreach, covering the number of farmer members of the cooperative or farmer suppliers to the SMe, and total revenue earned, a key data point for measuring profitability. The number and type of certifications held by investees is also a commonly collected data point, with some 63% of our sample gathering data on certification type; however, as Figure 25 illustrates, the sustainable use of land was barely measured across our sample of eight lenders.
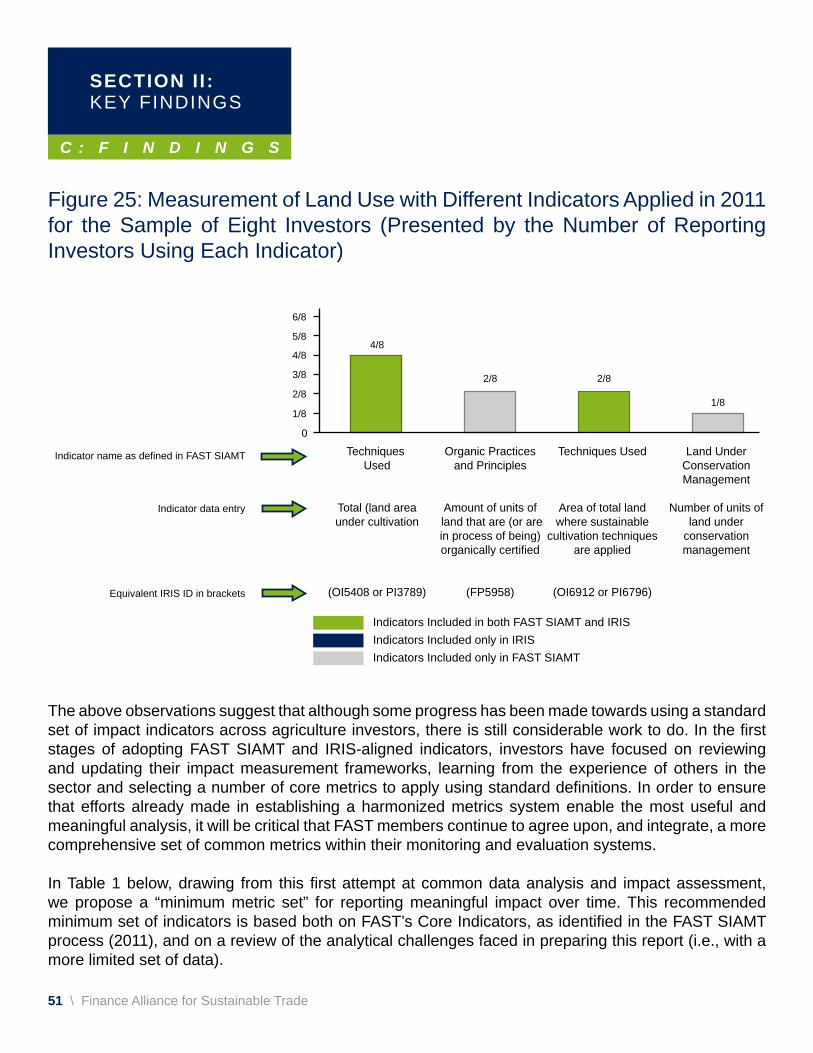
51 \ Finance Alliance for Sustainable Trade
C : F I N D I N G S
section i i :Key FindingS
4/8
2/8 2/8
1/8
6/8
5/8
4/8
3/8
2/8
1/8
Indicator name as defined in FAST SIAMT
Indicator data entry
Equivalent IRIS ID in brackets
Techniques Used
Total (land areaunder cultivation
(OI5408 or PI3789)
Organic Practicesand Principles
Amount of units of land that are (or arein process of being)organically certified
(FP5958)
Techniques Used
Area of total landwhere sustainable
cultivation techniquesare applied
(OI6912 or PI6796)
Land UnderConservationManagement
Number of units ofland under
conservationmanagement
Indicators Included in both FAST SIAMT and IRISIndicators Included only in IRISIndicators Included only in FAST SIAMT
0
Figure 25: Measurement of Land Use with different indicators Applied in 2011 for the Sample of eight investors (Presented by the number of Reporting investors Using each indicator)
The above observations suggest that although some progress has been made towards using a standard set of impact indicators across agriculture investors, there is still considerable work to do. In the first stages of adopting FAST SiAMT and iRiS-aligned indicators, investors have focused on reviewing and updating their impact measurement frameworks, learning from the experience of others in the sector and selecting a number of core metrics to apply using standard definitions. In order to ensure that efforts already made in establishing a harmonized metrics system enable the most useful and meaningful analysis, it will be critical that FAST members continue to agree upon, and integrate, a more comprehensive set of common metrics within their monitoring and evaluation systems.
In Table 1 below, drawing from this first attempt at common data analysis and impact assessment, we propose a “minimum metric set” for reporting meaningful impact over time. This recommended minimum set of indicators is based both on FAST’s Core Indicators, as identified in the FAST SIAMT process (2011), and on a review of the analytical challenges faced in preparing this report (i.e., with a more limited set of data).

Table 1: The Minimum Metric Set: FAST’s Recommended Subset of Core indicators at the SMe Level*
Indicator Name as Defined in siAMt
indicator Data entry:Data Point to be collected to Measure the correspondent indicator
equivalent to iRis iD
Outreach – Farmers number of farmer members of the Coop or farmer suppliers to the SMe/enterprise *** Pi5350
Outreach – Female Farmers number of female farmer members of the Coop or farmer suppliers to the SMe/enterprise *** Pi1728
employment – Permanent employees*
number of people employed by the organization. This indicator represents the sum of all paid full-time and part-time employees
Oi8869
employment – Permanent Female employees*
number of female employed by the organization. This indicator represents the sum of all paid full-time and part-time female employees
Oi2444
Techniques Used
Area of total land where sustainable cultivation techniques are applied *** Pi6796 or Oi6912
Total land area under cultivation Oi5408
List of sustainable cultivation techniques used n/A
Profitability – Earned RevenueTotal revenue resulting from all business activities during the reporting period. earned revenue is total revenue less contributed revenue (grants and donations)
FP5958
Profitability – Cost of Goods Sold
Total cost of products sold: direct costs attributable to the production of the goods sold by the organization during the reporting period. The cost should include all costs of purchase, cost of conversion and other direct costs related to producing and selling the organization’s products
FP9049
Capacity to generate Commercial Profitability – Net income
Total revenue earned in the year minus total expenses including interest and taxes; the bottom line of the income Statement
FP3274
Total Payments to Farmers Total value of payments to farmers for the target crop sold *** Pi1492
% Certified
Volume of each certified target crop sold per type of certification Pi7289
Indicate name of each certification/verification held, the certification body and the first date of continuously certified/verified
Pd2756
Women Representation Balance at the Board of directors level
number of women on the Board of directors or other leadership/governing body Oi881
Total number of people on the Board of directors or other leadership/governing body Oi1075
Sales Volume Amount of the total product sold of the target crop Pi1263
exported Volume ** Amount of the product exported by the SMe/enterprise *** Pi9029
* in these cases, the indicator employment is presented as defined in “IRIS: Permanent Employees,” which includes two indicators included in FAST SiAMT separately: employment full-time and employment part-time. ** in this case, the indicator volume exported is not yet included in FAST SiAMT Version 1.0; we foresee including this in a revised edition of the SiAMT indicators. At the moment, this indicator is part of the iRiS framework. *** in these cases, the corresponding indicators have also been prioritized by the Council on Smallholder Agriculture Finance.45 45 The Council on Smallholder Agriculture Finance was constituted in 2012. it is composed predominantly of FAST members and includes the following institutions: Alterfin, Oikocredit, the Rabo Rural Fund, responsAbility, Root Capital, Shared Interest, and Triodos Bank.

53 \ Finance Alliance for Sustainable Trade
C : F I N D I N G S
section i i :Key FindingS
Box 4: data Collection Recommendations
in addition to the most appropriate common metrics to measure across agriculture SMes, the harmonization of data collection methods will be equally important in ensuring accurate and meaningful analysis at the institutional and sector levels. in light of the experience in working with FAST members on this report, a series of recommendations for improving overall data quality and usability is provided in Box 4.
• establish a standard procedure for data collection and organization to improve the quality of data captured:
• Assemble data using error-eliminating data collection tools and, whenever possible, aligned classifications
• eliminate data errors by avoiding incorrect data items in data set, which may include missing values
• ensure quality through data validation controlling the type of value and applying logical tests to values entered into the database
• Ensure Data cleanliness by identifying and fixing errors , performing checks at the time of data entry in order to ensure the validity of information, and verifying extreme values
• enrich the investment analysis with the compilation of new data sets
• ensure mechanisms are in place for data collection and that information communicated includes key indicators that are essential to expand the scope of the analysis, such as amounts approved, disbursement date, loan maturity date, outstanding balance at the end of the year, etc.
• Identify and define clearly database variables or data points and their parameters
• Include provisions for the timeframes of figures (e.g. monthly, quarterly) or data type (e.g. annualized, non-annualized)
• Adopt existing definitions for selected indicators that are broadly in use
• data sets should maintain the accurate use of the measuring units throughout

55 \ Finance Alliance for Sustainable Trade
conclusion AnD next stePsThis report represents the results of more than two years of collaboration among financial institutions focused on impact investing in the agricultural sector. As the first effort towards compiling sector-representative results, it provides a singular, yet modest, window into the performance of impact investing within the agricultural sector over the 2009–2011 period.
The report is unique in its ability to point towards, for the first time and in a quantifiable manner, trends across a leading group of financial institutions related to the total size, distribution and performance of loan disbursements to agriculture SMes over time. We see it as a paradigm changing resource, which aims to improve understanding and efficiency in the allocation of investment in sustainable agriculture finance. This, in our view, is an important achievement for the sector.
The report has also helped us to identify some of the larger challenges still to address as we progress through this relatively early stage of the data harmonization process across collaborating members and across the entire sector. Future editions of this report will present a deeper and broader analysis based on data provided through greater metrics alignment. in the future, a wider data set will allow for more statistically significant results for the sector as a whole to be derived.
nevertheless, we consider the data and analysis contained in this report, in spite of these challenges, to offer important signposts—not only in terms of general trends observed across some of the key FAST members, but also as an indication of the kinds of analysis that the SiAMT impact indicator framework can enable through ongoing collaboration amongst lenders in the sustainable agriculture sector. At a minimum, the data speak to the growing importance of the agricultural sector in the impact investing arena, as well as to the significant potential for sustained growth for the foreseeable future.
c o n c l u s i o n& next stePs

investing for Change: An Analysis of the impacts of Agricultural investments from Select FAST Social Lenders / 56
Bage, L. (2008). Supporting smallholders is crucial to food security. The International Fund for Agricultural Development (IFAD).
Bellarby, J., et al. (2008). Cool farming: Climate impacts of agriculture and mitigation potential. Amsterdam: Greenpeace, IPCC.
Carroll, T., Stern, A., Zook, d., Funes, R., Rastegar, A., & Lien, y. (2012). Catalyzing smallholder agriculture finance. Dalberg Global Development Advisors.
Cervantes-godoy, d., & dewbre, J. (2010). Economic importance of agriculture for poverty reduction. Food, Agriculture and Fisheries Working Papers, No. 23. OECD.
Food and Agriculture Organization of the United nations (FAO). (2010). Agricultural investment funds for developing countries.
Food and Agriculture Organization of the United nations (FAO). (2013). Trends and impacts of foreign investment in developing country agriculture: Evidence from case studies.
international Finance Corporation (iFC). (2011). Scaling up access to finance for agricultural SMEs: Policy review and recommendations.
international Fund for Agriculture development (iFAd) and United nations environment Programme (UneP). (2013). Smallholder farmers key to lifting over one billion people out of poverty.
international institute for Sustainable development (iiSd). (2010). The State of sustainability initiatives review 2010: Sustainability and transparency.
Larrea, C., Potts, J., & Schuite, g. (2011). FAST SIAMT 1.0, Building a common framework for impact assessment. The Finance Alliance for Sustainable Trade (FAST).
J. P. Morgan and The global impact investment network (giin). (2013, January). Perspectives on progress: The impact investor survey. Global Social Finance.
J. P. Morgan and The global impact investment network (giin). (2011, december). Insight into the impact investing market.
Potts, J. (2007). Alternative trade initiatives and income predictability: Theory and evidence from the coffee sector. International Institute for Sustainable Development (IISD).
United nations. (1987). Report of the World Commission on Environment and Development: Our common future.
RefeRence list

finance Alliance for sustainable trade1255 University Street, Suite 801
Montreal, QCCanada
H3B 3W3Tel: +1 (514) 759-6626Fax: +1 (514) 759-6603
www.fastinternational.org
With the support of: