the features of radiation dose variations onboard iss and mir space station: comparative study
TRANSCRIPT

Advances in Space Research 34 (2004) 1424–1428
www.elsevier.com/locate/asr
The features of radiation dose variations onboard ISS and Mirspace station: comparative study
L.V. Tverskaya a,*, M.I. Panasyuk a, S.Ya. Reizman a, E.N. Sosnovets a, M.V. Teltsov a,V.V. Tsetlin b
a Skobeltsyn Institute of Nuclear Physics, Moscow State University, Moscow 119992, Russiab Institute of Biomedical Problems, Moscow 123007, Russia
Received 22 November 2002; received in revised form 26 February 2004; accepted 26 February 2004
Abstract
The dynamics of the ISS-measured radiation dose variations since August 2000 is studied. Use is made of the data obtained with
the R-16 instrument, which consists of two ionization chambers behind different shielding thicknesses. The doses recorded during
solar energetic particle (SEP) events are compared with the data obtained also by R-16 on Mir space station. The SEP events in the
solar maximum of the current cycle make a much smaller contribution to the radiation dose compared with the October 1989 event
recorded on Mir space station. In the latter event, the proton intensity was peaking during a strong magnetic storm. The storm-time
effect of solar proton geomagnetic cutoff decreases on dose variations is estimated. The dose variations on Mir space stations due to
formation of a new radiation belt of high-energy protons and electrons during a sudden commencement of March 24, 1991 storm are
also studied. It was for the first time throughout the ISS and Mir dose measurement period that the counting rates recorded by both
R-16 channels on ISS in 2001–2002 were nearly the same during some time intervals. This effect may arise from the decreases of
relativistic electron fluxes in the outer radiation belt.
� 2004 COSPAR. Published by Elsevier Ltd. All rights reserved.
Keywords: Radiation dose; Space stations; Solar energetic particle events; Geosynchronous satellites
1. Introduction
As before, the radiation environment of manned
space stations is urgent to appraise and predict. The
main contribution to the radiation dose on Mir space
station and on ISS is from galactic cosmic rays and from
the high-energy radiation belt electrons and protons.The contribution from the solar flare protons to the
integral dose on Mir space station was about 3%
throughout the full space station flight time. However,
allowance should be made for the radiation hazard to
spacecraft crew during short-term solar energetic parti-
cle (SEP) events generated by large solar flares. For
example, the daily absorbed dose rate induced by the 19
October 1989 flare had increased more than a hun-dredfold by as early as 20 October (Tverskaya et al.,
* Corresponding author. Tel.: +7-95-939-2488; fax: +7-95-939-0896.
E-mail address: [email protected] (L.V. Tverskaya).
0273-1177/$30 � 2004 COSPAR. Published by Elsevier Ltd. All rights reser
doi:10.1016/j.asr.2004.02.010
1991), so appropriate measures were taken to enforce
conformity to protection standards for the movements
of spacecrew members inside the space station. The SEP
event-induced radiation dose on manned spacecraft is
determined by not only the intensity and spectrum of
particles, but also the time of spacecraft residence in the
polar plateau of solar protons. During geomagneticallyquiet periods, the invariant geomagnetic cutoff latitude
of the �40 MeV protons determined by the com-
mencement of the solar proton intensity decrease from
the polar plateau level is 64–66�, depending on local
time (Biryukov et al., 1983). It is during but one or two
passes of Mir space station and ISS within a day that the
spacecraft orbits reach the invariant latitudes P 66�.(Tverskaya et al., 1991). During geomagnetic distur-bances, however, the geomagnetic cutoff latitude can
lower even to �55� for >1 MeV protons (Sosnovets and
Tverskaya, 1986). Thus, the spacecraft residence time
on the polar plateau of solar protons may increase a
ved.

L.V. Tverskaya et al. / Advances in Space Research 34 (2004) 1424–1428 1425
few-fold. The minute correlations between the geomag-
netic cutoff latitude and the geomagnetic indices were
studied using the large >1 MeV proton dataset obtained
from the Cosmos satellites in 1972–1977. The position of
the geomagnetic cutoff latitude at different local times
proved to be determined best by the parameterAD ¼ ðD2
st þ 0:02AE2Þ1=2, where Dst and AE are standard
geomagnetic activity indices (Ivanova et al., 1985). The
dependence of cutoff on geomagnetic Kp index was
model-calculated (see Nymmik, 1999; and the references
therein). In the case of protons with energies of a few
tens of MeV, the detailed data on the storm-time geo-
magnetic cutoff variations were not published until re-
cently (Leske et al., 2001). The correlation coefficientsbetween the geomagnetic cutoff latitude and the stan-
dard Kp and Dst indices have been shown to be 0.76 and
)0.77, respectively.We shall discuss the radiation dose variations on Mir
space station and on ISS during some SEP events. The
long-term radiation dose variations induced partly by
radiation belt variations will also be discussed.
1.1. Equipment
The Mir space station radiation environment was on-
line monitored by the onboard R-16 dosimetry system,
which included two ionization chambers with electro-
static relay (Yuryatin et al., 1979). Either chamber was
of an almost isotropic sensitivity and measured the do-
ses to within a high accuracy (�5%). One of the cham-bers (D2) had its own wall of �0.5 g/cm2 acrylic plastic.
Another chamber (D1), which was identical with D2,
had an additional shielding, so that D1 was behind a �3
g/cm2 total shielding. Being placed inside the space
station, the R-16 system got shielded by the space sta-
tion matter. Therefore, chamber D2 was behind a �2 g/
cm2 shielding, while chamber D1 was behind a �4.5 g/
cm2 shielding. So, chambers D2 and D1 recorded pro-tons with energies above 40 and 70 MeV and electrons
above 4 and 8 MeV, respectively.
On ISS, the arrangement of chambers D2 and D1 is
different from the above, and the mass distribution is
known within an insufficient accuracy. An attempt was
made in (Kuznetsov et al., 2004) to use the method for
Table 1
Radiation doses (mGy) and proton fluences (cm�2 sr�1) measured during
Express-AS and GOES
Date Doses
Mir D1 Mir D2 ISS D1 ISS D
19–21 October 1989 – 27.2 – –
14–17 July 2000 0.5 7.0 – –
08–11 November 2000 0.5 2.85 0.3 1.4
24–27 September 2001 – – 0.25 1.4
04–07 November 2001 – – Back-ground 0.5
calculating radiation doses in different orbits during SEP
events (Nymmik, 1999) and calculate the empirical re-
lations between the shieldings of the chambers flown on
Mir and ISS basing on the data of simultaneous mea-
surements of a SEP event with all instruments. The 9
November 2000 SEP event was selected, which occurredduring a geomagnetically quiet period. Use was made of
the solar proton flux measurement data of geosynchro-
nous GOES-8 and 10 and the ionization chamber (D)
data of geosynchronous satellite Express-A3. The effec-
tive shielding was found to be 2.5–3 g/cm2 for Express-
A3 ionization chamber and �5 g/cm2 for ISS chamber
D2 and �10 g/cm2 for chamber D1.
1.2. SEP events
Table 1 presents the data on five large SEP events and
shows the event-integrated >30 and >50 MeV proton
fluxes recorded on GOES satellites and the event-inte-
grated radiation doses measured by the Mir and ISS
ionization chambers D2 and D1, and by the Express-A3
ionization chamber (D). During the October 1989 SEPevents, the measurements were taken with the chamber
D2 alone. The October 1989 event was unique in its size
and radiation dose increase rate (Tverskaya et al., 1991).
Fig. 1 shows the radiation dose variations inside Mir
space station during that event, the solar proton fluxes
recorded on GOES-7, the highest invariant latitudes of
the Mir station orbit in the northern and southern
hemispheres, as well as the Kp index and Dst variation.The additional proton intensity peak recorded at �1530
UT on 20 October coincided with development of a
strong magnetic storm (the Dst variation was 200 nT).
The Mir residence time in the polar zones filled with
solar protons increased a few-fold because of the geo-
magnetic cutoff suppression, probably down to �55�. By1700 UT on 20 October 1989, the dose had increased by
15 mGy within 3 h. The dose increased by �27 mGythroughout the 19–21 October 1989 SEP event period.
A few large SEP events were recorded during the
solar maximum years of 2000–2001. On Mir space sta-
tion, the �7 mGy dose induced by the 14 July 2000 SEP
was �4 times as low as the dose induced by the 19 Oc-
tober 1989 flare. The 14 July 2000 SEP event was also
some SEP events on Mir station, ISS, and geosynchronous satellites
Proton fluences
2 Express-A3 D GOSE Ep > 30 MeV GOSE Ep > 50 MeV
– 2 � 108 8:2 � 107
304 3:4 � 108 1:1 � 108
286 2:5 � 108 9 � 107
59 9:5 � 107 2:5 � 107
182 2:7 � 108 7:7 � 107
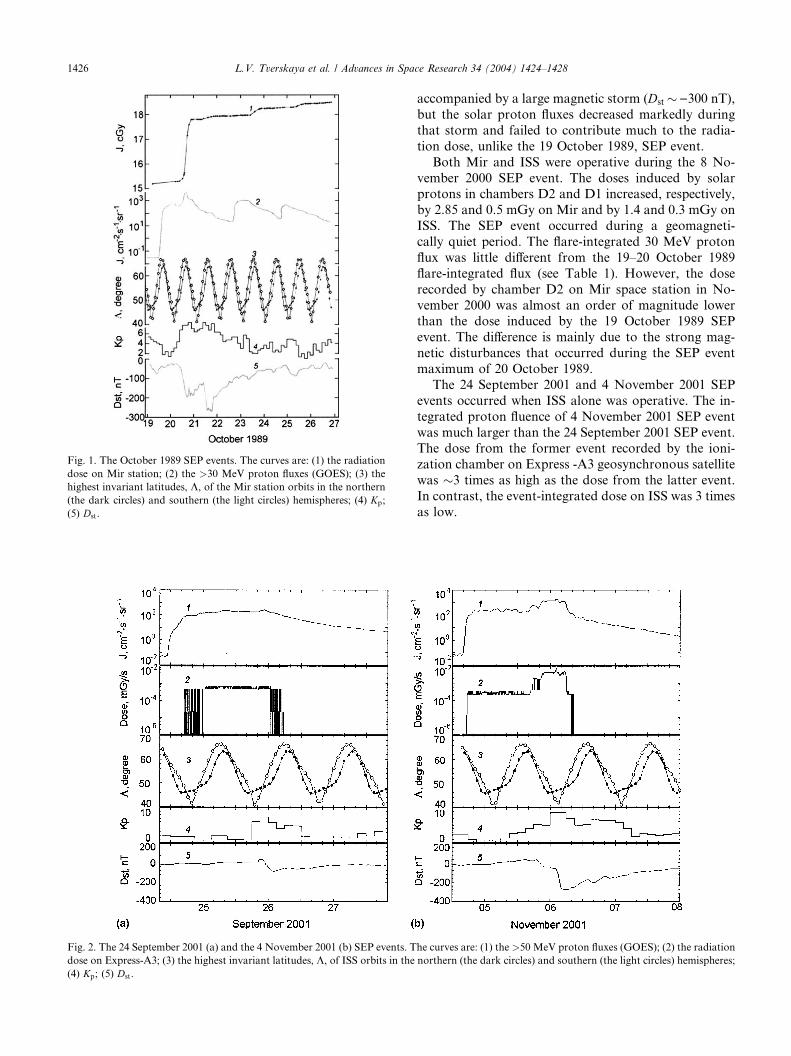
Fig. 1. The October 1989 SEP events. The curves are: (1) the radiation
dose on Mir station; (2) the >30 MeV proton fluxes (GOES); (3) the
highest invariant latitudes, K, of the Mir station orbits in the northern
(the dark circles) and southern (the light circles) hemispheres; (4) Kp;
(5) Dst.
Fig. 2. The 24 September 2001 (a) and the 4 November 2001 (b) SEP events. T
dose on Express-A3; (3) the highest invariant latitudes, K, of ISS orbits in the
(4) Kp; (5) Dst.
1426 L.V. Tverskaya et al. / Advances in Space Research 34 (2004) 1424–1428
accompanied by a large magnetic storm (Dst �)300 nT),but the solar proton fluxes decreased markedly during
that storm and failed to contribute much to the radia-
tion dose, unlike the 19 October 1989, SEP event.
Both Mir and ISS were operative during the 8 No-
vember 2000 SEP event. The doses induced by solarprotons in chambers D2 and D1 increased, respectively,
by 2.85 and 0.5 mGy on Mir and by 1.4 and 0.3 mGy on
ISS. The SEP event occurred during a geomagneti-
cally quiet period. The flare-integrated 30 MeV proton
flux was little different from the 19–20 October 1989
flare-integrated flux (see Table 1). However, the dose
recorded by chamber D2 on Mir space station in No-
vember 2000 was almost an order of magnitude lowerthan the dose induced by the 19 October 1989 SEP
event. The difference is mainly due to the strong mag-
netic disturbances that occurred during the SEP event
maximum of 20 October 1989.
The 24 September 2001 and 4 November 2001 SEP
events occurred when ISS alone was operative. The in-
tegrated proton fluence of 4 November 2001 SEP event
was much larger than the 24 September 2001 SEP event.The dose from the former event recorded by the ioni-
zation chamber on Express -A3 geosynchronous satellite
was �3 times as high as the dose from the latter event.
In contrast, the event-integrated dose on ISS was 3 times
as low.
he curves are: (1) the >50 MeV proton fluxes (GOES); (2) the radiation
northern (the dark circles) and southern (the light circles) hemispheres;

L.V. Tverskaya et al. / Advances in Space Research 34 (2004) 1424–1428 1427
Fig. 2 show some data on the above events, namely,
the >50 MeV proton fluxes recorded on GOES, the
radiation doses recorded on Express-A3, and the highest
invariant latitudes of each of the ISS orbits in the
northern and southern hemispheres. It is seen that, on 6
November 2001 SEP event, the solar proton fluxes werepeaking during the expansion phase of a strong mag-
netic storm (Dst ¼)277 nT). During that period, how-
ever, the ISS orbit latitudes were below 50�, so the orbit
was beyond reach for solar protons. Therefore, the do-
ses were received mainly in the high-latitude segment of
the orbit during quiet time (November 5) and at the
storm recovery phase (November 6). In the case of
the 24 September 2001 SEP event, when ISS traversedthe high latitudes, the Express-A3 chamber-recorded
doses were higher compared with the November 4 event.
From the above it follows that the prediction of the
ISS orbit radiation environment during SEP events re-
quires that the ISS residence time in the polar zones of
solar proton penetration should be calculated making
allowance for a possible geomagnetic cutoff suppression.
In this case, the Dst-variation is most expedient to usebecause it can be predicted to within a high accuracy
from the parameters of interplanetary medium (Burton
et al., 1975).
2. Radiation belt variations
Now, we shall examine the radiation dose variationson Mir space station due to formation of the new belt of
high-energy protons and electrons, which was formed on
L�2.5 within 1 min during the sudden commencement
of magnetic storm on 24 March 1991 (Blake, 1992). We
shall also discuss the features of the dose variations on
ISS, which are independent from SEP events.
Fig. 3 shows the 10 day averaged radiation doses
recorded by the Mir ionization chambers D2 and D1
Fig. 3. The 10 day averaged radiation doses on Mir station from
January 1991 to July 1992. The light and dark circles are the readings
of chambers D2 and D1, respectively.
from January 1991 to July 1992. A persistent ‘‘pedestal’’
is seen clearly in the time dependence of the doses in
both chambers. The pedestal was formed after the storm
in March 1991. The doses increased by �80% in
chamber D2 (Ep > 40 MeV) and by �30% in chamber
D1 (Ep >70 MeV), which corresponds approximately tothe ratio of dose increases in similar energy ranges re-
corded on CRRES (Gussenhoven et al., 1991). The later
history of the new belt is difficult to trace in the Mir
measurement data because its effect was ‘‘overlapped’’
from mid-1992 by the effect of dose increase due to the
solar cycle variations of the inner belt proton intensity
(Panasyuk et al., 1998). At the same time, the new belt is
known to be observable during a few years (Ginzburget al., 1993).
The formation mechanism of the new belt has been
studied quite properly (Pavlov et al., 1993; Li et al.,
1993). With the present-day level of knowledge, how-
ever, the amplitude and structure are impossible to
predict for the sudden pulse, during which the new ra-
diation belt was formed. The intensive cases of that type
are very rare and were probably observed 2–3 timesthroughout the space era.
Fig. 4 shows the daily radiation doses that were re-
corded with the ISS chambers D2 and D1 from the
operation start moment of the chambers to July 2002.
The periods attract attention, when the readings of
chambers D2 and D1 are alike, and even coincide ac-
tually sometimes. The similarity between the D2 and D1
readings may be explained probably by the hard spec-trum of the inner belt protons, given a negligible con-
tribution from the relativistic electrons of the belts.
According the measurement data of the Express-A2
geosynchronous satellite, the 4–6 MeV electron fluxes
decrease markedly during the said periods (Sosnovets
et al., 2002). However, any final conclusion can only be
drawn from a comparison with the low-orbiting satellite
data.
Fig. 4. The 10 day averaged radiation doses on ISS from August 2000
to July 2002. The light and dark circles are the readings of chambers
D2 and D1, respectively.

1428 L.V. Tverskaya et al. / Advances in Space Research 34 (2004) 1424–1428
3. Conclusions
• The radiation dose variations on Mir space stations
and on ISS have been studied. The dose is shown
to be defined by not only the intensity of a SEPevent, but also the features of the manned space-
craft orbits and geomagnetic disturbances. The
storm-time suppression of geomagnetic cutoff leads
to an increase of the spacecraft residence time in
the polar zones of solar proton penetration to the
magnetosphere, compared with geomagnetically
quiet periods.
• Throughout the period of manned spacecraftflights, the highest radiation hazard from SEP
events arose on 20 October 1989 due to coincidence
of the solar proton flux maximum with the abrupt
cutoff suppression (to �55�) during a strong mag-
netic storm.
• With the monitoring measurements of SEP events
outside the magnetosphere, the well-predictable pa-
rameter Dst is expedient to use for the purposes ofshort-term predicting the time within a current SEP
event for ISS residence in the polar zones of so-
lar proton penetration, depending on geomagnetic
activity.
• The shock-injected radiation belts similar to the belt
observed on 24 March 1991 constitute an additional
long-lived source of penetrating radiation. However,
although the formation mechanism of the shock-injected belt is clear and the belt structure can be
calculated from the sudden-pulse parameters, the am-
plitude and shape of the pulses are still unpredictable.
• The observed similarity between the readings of the
ISS ionization chambers D2 and D1 during separate
periods may be due to a decrease of the relativistic
electron fluxes in the outer radiation belt.
Acknowledgements
The authors thank all those who keep the Internet
sites with the interplanetary medium data, the GOES
relativistic electron data and ground-based geomagnetic
data. The work was supported by RFFI grant 0015–
96623 and ‘‘Universities of Russia’’ grant.
References
Biryukov, A.S., Ivanova, T.A., Kovrygina, L.M., et al. Boundary of
solar cosmic ray penetration into the Earth’s magnetosphere during
magnetic quiet time. Kosmicheskie Issledovaniya 21, 897–906, 1983
(in Russian).
Blake, B.J. CRRES records creation of new radiation belt. STEP Int.
2, 1–4, 1992.
Burton, R.K., McPherron, R.L., Russel, C.T. An empirical relation-
ship between interplanetary conditions and Dst. J. Geophys. Res.
80, 4204–4214, 1975.
Ginzburg, E.A., Malyshev, A.B., Pustovetov, B.P. About new radia-
tion belt of relativistic electrons at L¼ 1.9: METEOR data. Izv.
Acad. Nauk, ser. Phys. 57 (7), 89–92, 1993 (in Russian).
Gussenhoven, M.S., Mullen, E.G., Brautigam, D.H., et al. Preliminary
comparison of dose measurements on CRRES to NASA model
predictions. IEEE Trans. Nucl. Sci. 38, 1655–1662, 1991.
Ivanova, T.A., Kuznetsov, S.N., Sosnovets, E.N., Tverskaya, L.V.
Dynamic the low-latitude boundary of low-energy solar proton
penetration into the magnetosphere. Geomagn. i Aeron. 25, 7–12,
1985 (in Russian).
Kuznetsov, N.V., Nymmik, R.A., Panasyuk, M.I., et al. Registration
and prognosis of absorbed radiation dose from solar protons on-
board orbital stations. Kosmicheskie Issledovaniya 42, 1–8, 2004.
Leske, R.A., Mewaldt, R.A., Stone, E.C., von Rosenvinge, T.T.
Observations of geomagnetic cutoff variations during solar ener-
getic particle events and implications for the radiation environment
at the Space Station. J. Geophys. Res. 106, 30011–30022, 2001.
Li, X., Roth, I., Temerin, M., et al. Simulation of the prompt
energization and transport of radiation belt particles during the
March, 24, 1991 SSC. Geophys. Res. Lett. 20, 2423–2426, 1993.
Nymmik, R.A. The problems of cosmic ray particle simulation for the
near-Earth orbital and interplanetary flight conditions. Radiat.
Meas. 30, 669–677, 1999 (in Russian).
Panasyuk, M.I., Teltsov, M.V., Shumshurov, V.I., Tsetlin, V.V.
Variations of the radiation dose onboard MIR station. Adv.
Space. Res. 21 (12), 1635–1638, 1998.
Pavlov, N.N., Tverskaya, L.V., Tverskoy, B.A., Chuchkov, E.A.
Variations of radiation belt energetic particles during the strong
magnetic stormMarch, 24–26, 1991. Geomagn. i Aeron. 33 (6), 41–
46, 1993 (in Russian).
Sosnovets, E., Panasyuk, M., Vlasova, N., et al. Modeling and
monitoring of radiation conditions in the Earth’s magnetosphere
aboard high-altitude satellites. Solnechno-zemnaya fisika (2), 166–
167, 2002 (in Russian).
Sosnovets, E.N., Tverskaya, L.V. Ring current dynamics inferred from
direct measurements and from solar cosmic rays measurements in
the magnetosphere. Geomagn. i Aeron. 26, 107–114, 1986 (in
Russian).
Tverskaya, L.V., Teltsov, M.V., Shumshurov, V.I. Measurements of
radiation doses on Mir station during SEP events in September–
October 1989. Geomagn. i Aeron. 31, 928–930, 1991 (in Russian).
Yuryatin, E.I., Shumshurov, V.I., Fominyh, V.V., Teltsov, M.V.
Studies of dosimetric characteristics of ionization chambers with
electrostatic relays. Ismerit. Techn. 3, 48–53, 1979 (in Russian).