the fate of oil in the water column following experimental
TRANSCRIPT
VOL. 40, SUPP. 1 (1987) P. 124-132 ARCTIC
The Fate of Oil in the Water Column Following Experimental Oil Spills in the Arctic Marine Nearshore
B. HUMPHREY ,' D.R. GREEN,' B.R. FOWLER,' D. HOPE' and P.D. BOEHM3
(Received 12 June 1986; accepted in revised form 9 April 1987)
ABSTRACT. Petroleum hydrocarbon concentrations in the water column were monitored after a release of crude oil onto the water surface and subsurface release of chemically dispersed oil. During the surface release, petroleum hydrocarbons did not disperse into the water column deeper than m. The highest concentrations observed under the slick were less than 2 m g P . The chemically dispersed oil release resulted in concentrations over 5 mg.f' in the Bay 9 study area for 12 hours, and petroleum hydrocarbons were detectable by in siru fluorometry for more than 4 days. The dispersed oil di not undergo further weathering for 24 hours. Estimated exposures of the benthic communities to oil in the three experimental bays were 3 mgd-'.h, 3 mg.f'.h, and 300 mg#'.h respectively. The highest exposures were to oil retaining many of its more toxic components. Key words: dispersant, oil, fluorometry, gas chromatography, oil spill
&SUM& La concentration d'hydrocarbures pitroliers a t t t mesur6e dans la colonne d'eau apds un dtversement de p6trole brut en surface, et u dtversement de pitrole disperse chimiquement sous la surface. Lors du dtversement en surface, les hydrocarbures pitroliers ne se sont pas disperses dm la colonne d'eau B plus d' 1 m de profondeur. Les plus hautes concentrations observtes sous la nappe ne dtpassaient pas 2 mg.1". Le dtversement d pitrole disperst chimiquement a provoqut des concentrations dtpassant 50 m g P pendant 12 heures dans la baie expirimentale no 9, et les hydrocarbure pitroliers ont pu & t r e dttectts par fluoromttrie in siru pendant plus de 4 jours. Le pitrole disperse n'a pas subi de degradation suppltmentaire pendant 2 heures. On a estimt l'exposition au pitrole des communauth benthiques des trois baies expirimentales B 3 mg.l".h, 30 mgd".h et 300 m g P . respectivement. Les taux les plus dlevts ttaient ceux de I'exposition au pitrole contenant encore beaucoup de ses composants les plus toxiques. Mots ~16s: agent de dispersion, fluoromttrie, chromatographie en phase gazeuse, dtversement de pitrole
Traduit pour le journal par Ntsida Loyer.
INTRODUCTION
Dispersants have been proposed as a countermeasure to oil spills in Canadian arctic waters (Hildebrand et al., 1977). Indeed, because of the remote location and the harsh climate and severe weather that can exist during a transportation spill or blowout, dispersants may be the only possible active countermeasure for oil on the sea surface. Before an intelligent choice can be made between using dispersant or leaving the oil slick alone, a better understanding of the fate and effects of the oil under those two circumstances is required.
Although numerous studies of the effectiveness of disper- sants in countering oil spills have been undertaken in temperate waters (Nichols and Parker, 1985), and some of these have examined the effects of the dispersed oil on biota, no field studies have addressed similar problems in arctic areas. A major program of experiments was designed to fill these gaps. The Baffin Island Oil Spill (BIOS) Project included a series of experiments examining the effectiveness of various counter- measures on shoreline spills. Two experiments were designed to examine the effects of oil spills on the nearshore environment. This paper describes the fate of the oil in the water column during and after the two nearshore oil releases.
Two experimental oil releases, both of 15 m3, were performed at Cape Hatt, on the northern tip of Baffin Island, N.W.T., Canada. In one experiment, oil was released on the water surface and no dispersants were used; the oil was allowed to strand on a pebble-cobble beach. In the other, dispersant was premixed 1:lO with the oil before being mixed 1 5 with sea water and pumped through a diffuser pipe into the water column at depths ranging from 3 to 10 m, approximately 0.5 m above the bottom (Dickins et al., 1987).
The experiments were part of the BIOS Project, designed to
compare the fate and effects of the oil when chemical1 persed or left alone (Sergy and Blackall, 1987). Chc dispersion acts by the addition of chemicals that reduj interfacial tension between oil and water, increasing the 1 dispersion of oil droplets into the water column. Thc selected were a series of bays along the eastern edge of R Channel, which is almost totally enclosed at its southern el open at the northern end. The oceanographic and meteorol conditions during the experimental periods are describ Buckley et al. (1987) and Meeres (1987). The project in( monitoring the fate of the oil in the water column (this pap the sediments (Boehm et al., 1987), in the benthic biota ( phrey et al . , 1987) and in intertidal sediments (Owens 1987). In order to evaluate the effect of oil dispersed in water column on the benthic biota, an estimate of their ex1 to oil was needed.
In 1980 and 1981, studies completed before the release determined the benchmark concentrations of hydrocarbc the various compartments of the local environment. The ods and results of these studies are reported by Cretney- (1987a,b,c). The experimental releases occurred in t 1981, and return visits were made to the site in 1982 and The water column was sampled from 1980 to 1983, w major program during the 1981 open water season.
The two releases were carried out in bays on the west I Cape Hatt (Fig. 1). The surface oil release was conducted 11 , and the dispersed oil release in Bay 9 (Dickins et al., Monitoring of oil in the water column was continued ir bays and throughout Ragged Channel over a three-year during open water. During the releases, flow-through fluc try was used to determine the movement of the oil in the column. In all periods, gas chromatography was used to mine both the concentration and composition of the oil.
'Seakem Oceanography Ltd., 2045 Mills Road, Sidney, British Columbia, Canada V8L 3S1 'Seakern Oceanography Ltd., Argo Building, Bedford Institute of Oceanography, Dartmouth, Nova Scotia, Canada B2Y 3Y9 3Battelle Ocean Sciences, 397 Washington Street, Duxbury, Massachusetts 02332, U S A . @The Arctic Institute of North America

FATE OF OIL IN WATER COLUMN
FIG. I . Experimental site.
METHODS
For each experimental release, six fixed-bottom sampling points were set up in the area of expected impact. During the dispersed oil release, a floating platform with four sampling pumps at the surface and 2 ,4 and 6 m below the surface was also deployed. In addition, a moving vessel sampled various prede- termined locations in profile, and during the dispersed oil release a towed in situ fluorometer made numerous passes through the study area and throughout Ragged Channel. Moni- toring of oil concentrations was carried out using flow-through fluorometry, and discrete samples were collected for low molec- ular weight and high molecular weight hydrocarbon analysis. These samples were also used for calibration purposes. All sampling stations were positioned using a Motorola Remote Positioning System.
For the collection of hydrocarbon samples, glass containers were cleaned by washing with laboratory detergent, rinsed with Milli-Q water and baked overnight at 350°C. After cooling, a small crystal of HgClz was added to each container, which was then sealed with a Teflon cap liner until use. Any containers reused in the field were rinsed three times with 75 ml aliquots of Freon 113 (1,1,2-trifluoro-2,2,1-trichlorethylene) before reuse. The Freon 113 had been cleaned by distillation with pre-baked
125
all-glass apparatus, including an 80 cm raschig packed column. The primary monitoring method used was flow-through fluo-
rometry using submersible pumps, colourless polyethylene tub- ing and filter fluorometers with flow-through sample compart- ments. The pumps were either Tee1 Epoxymagnetic Model 1P681A or Little Giant Model 3E 12WDVR. Five Turner- Designs Model 10 fluorometers equipped with 254 nm primary filters and a combination of SG and 760 secondary filters were used. Yellow 2A filters were placed in the reference light beams. The in situ system was an Endeco Petrotrack system, which also included a Turner-Designs fluorometer. All fluorometers were calibrated simultaneously using vigorously stirred sea water spiked with known amounts of Lagomedio crude oil and Corexit 9527 dispersant. All instruments were connected in series and adjusted to give similar calibration curves. During each experi- ment, the fluorometer outputs were recorded on Houston Instru- ment Omni-Scribe recorders, Series B-5000. The oil concentra- tions were calculated in the laboratory from a second order least squares fit to the calibration points. These calibration curves were calculated for three segments of the calibration to avoid the distortion caused by using oil values separated by orders of magnitude, The ranges used were 0-3 mg-l", 3-15 mg.1" and 15-40 mg4" (Green et al., 1983).
One-litre water samples collected for validation of the flow- through fluorometric method were extracted in the field by shaking with three 20 ml aliquots of Freon 113 for 2 min each. The combined extracts were stored in the dark at 4°C until analysis in the laboratory. A subsample was dried over anhy- drous sodium sulphate and the carbon-hydrogen bond stretch at 2930 cm" infrared (IR) absorption determined using a Perkin Elmer 457 or 337 IR spectrophotometer. Concentrations were determined using a calibration curve derived from Lagomedio crude oil collected from the surface oil release discharge pool at the time of release. The solvent of another subsample was converted to hexane by successive additions followed by rotary evaporation, after which the concentration of oil was determined by fluorescence, again using a Turner-Designs Model 10 fluo- rometer with a cuvette attachment. The same filter arrangement was used as in the field determinations. Standards were prepared using the same Lagomedio crude oil as for the IR method.
Water samples (about 350 ml) were taken for low molecular weight hydrocarbon (LMWHC, Cs-Clo, aliphatic and aromatic) analysis. They were collected from the outlet of the ' flow- through fluorometers. Hydrocarbon-clean amber beer bottles were filled to the top and sealed with a Teflon liner and crown cap. The samples were kept cool and in the dark until analysis.
Samples were analyzed for LMWHC by packed column gas chromatography with flame ionization detection (GC/FID) using the method of Pojasek and Scott (1981). A 10 ml aliquot of water was introduced with a pipet into a 40 ml glass vial containing 1 ml Hg metal. The vial was sealed with a Teflon-faced silicone septum, inverted and heated at 90°C for 30 min in a water bath to allow the headspace to equilibrate. A 2 ml aliquot of the headspace vapour was withdrawn through the septum and injected directly into the gas chromatograph. Peaks were identi- fied by comparing the peak retention times to peaks in external standards. Response factors were calculated from the external standards.
The sampling and analyses for high molecular weight hydro- carbons (HMWHC, Clo +) were similar to the methods used in 1979 for background determinations (Cretney et al., 1987b). Samples were collected in hydrocarbon-clean 4 1 jugs, either
126
from the pump outlets or using a National Bureau of Standards water sampler. The samples were immediately extracted in the sample bottle by shaking three times for 5 min each with a fresh 75 ml aliquot of Freon 113. The combined extracts were concentrated by rotary evaporation at 50°C to 40 ml, dried over anhydrous sodium sulphate and further concentrated by rotary evaporation to 1 ml. The solvent was then displaced with hexane. The extracts were stored in a freezer until analysis. An aliquot was evaporated to dryness and weighed on a Cahn Model 25 electrobalance to determine total extractable organics. Samples with high total extractables were chromatographed on a silica geualumina column. The saturated (fl) fraction was eluted with 18 ml of hexane, followed by 21 ml of hexane: dichloromethane (1:l) to elute the unsaturatedlaromatic (f2) fraction. The f l fraction was then analyzed by GC/FID, and the f2 fraction by gas chromatography/mass spectrometry (GUMS). Samples with low total extractables were analyzed directly by GC/FID.
From the resulting chromatograms, certain indexes of weath- ering could be calculated. The Saturated Hydrocarbon Weather- ing Ratio (SHWR, see Boehm et al . , 1982, for definitions) indicates the loss of low molecular weight n-alkanes as com- pared to their higher analogs. The Aromatic Weathering Ratio (AWR) provides the same comparisons for aromatics, and the alkane/ isoprenoid ratio indicates biodegradation, as the n-alkanes are preferentially utilized compared to isoprenoids such as pristane and phytane.
Large-volume water samples (LVWS) were collected by pumping sea water through a sampler described in de Lappe et al. (1979). The sampler employed a GF/C filter paper and a polyurethane foam plug to extract the suspended solids and dissolved hydrocarbons from sea water pumped through the system. The volume pumped varied somewhat but was approxi- mately 60 1 per sample. Some sample volumes were known to be inaccurate, as leaks were observed after recovery of the pump/ filter unit. The method was used during the background study (Cretney et al., 1987b) and was modified slightly each year. The original configuration of lowering the entire unit to the appropri- ate depth was unwieldy during any but calm seas, so the system was modified to have the filter and plug unit on board the sampling vessel, with a submersible pump at the end of a colourless polyethylene tube lowered to depth. A comparison was made of two samples taken by each method, and no difference was observed. The modified system allowed for better leak detection, and the greater ease of deployment permit- ted more samples to be collected each day.
Each large-volume water sample consisted of two subsamples: a GF/C filter paper containing suspended sediments and a polyurethane foam plug containing extracted hydrocarbons. From 1980 to 1982 these were analyzed separately; in 1983 the extracts from the plug and the filter were combined before analysis. The analytical methods are described fully in Cretney et al. (1987b).
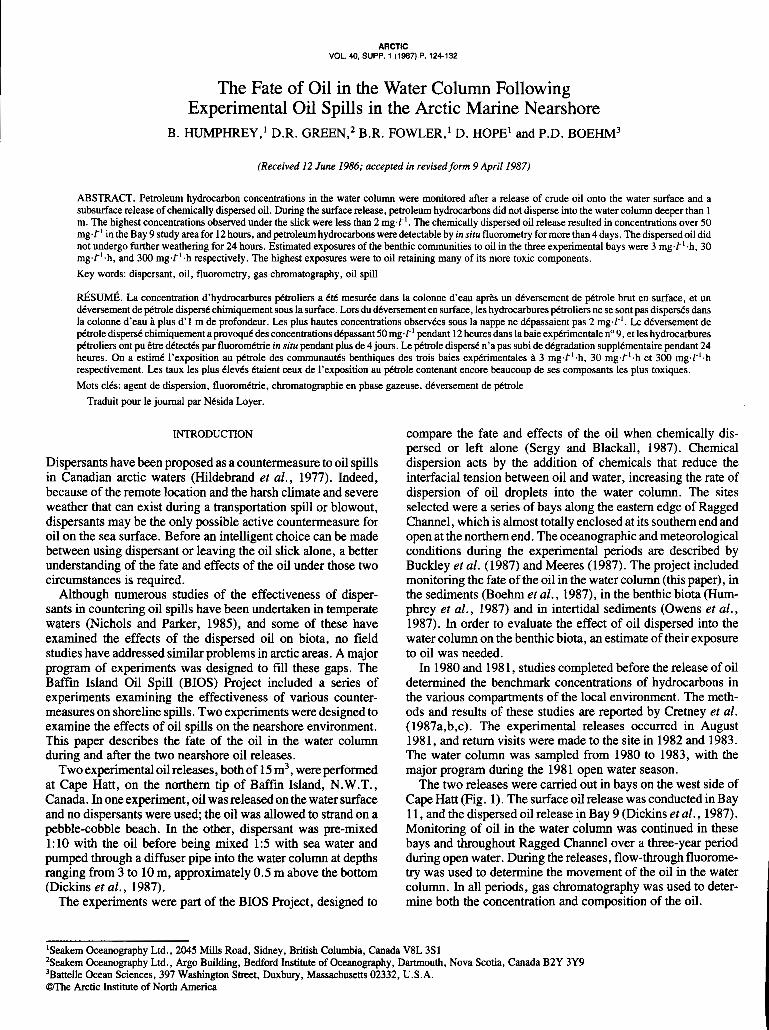
During the surface oil release in Bay 1 1, permanent bottom- mounted pumps were deployed as in Figure 2. Each shore station monitored the flow from three pumps sequentially using a valve manifold. A vessel with a profiling pump system occupied the marked stations regularly during the release and cleanup operations. This sampling vessel was restricted to the outside of the boomed release area. Table 1 lists the sample sites and depths for this release and identifies the number, times and types of sample taken.
B . HUMPHREY et al.
\S TRANSECT LINE
H 20m
FIG. 2. Surface oil release. Permanent bottom pumps shown by dots, profile stations by squares.
TABLE 1. Surface oil release sampling and analysis, 1981, continuous monitoring
Depth period Validation LMWHC HMWHC Monitoring
Location (m) (hours)" samples samples samples
Shore station 1 1 0-25 3 0-25 6 5 3 7 0-25
Shore station 2 3 0-25 3 1 5 7 0-25 I 1
10 0-25 I
Profile stations 0-10 0-25 I 1 5 I
'Hours measured from beginning of surface oil release.
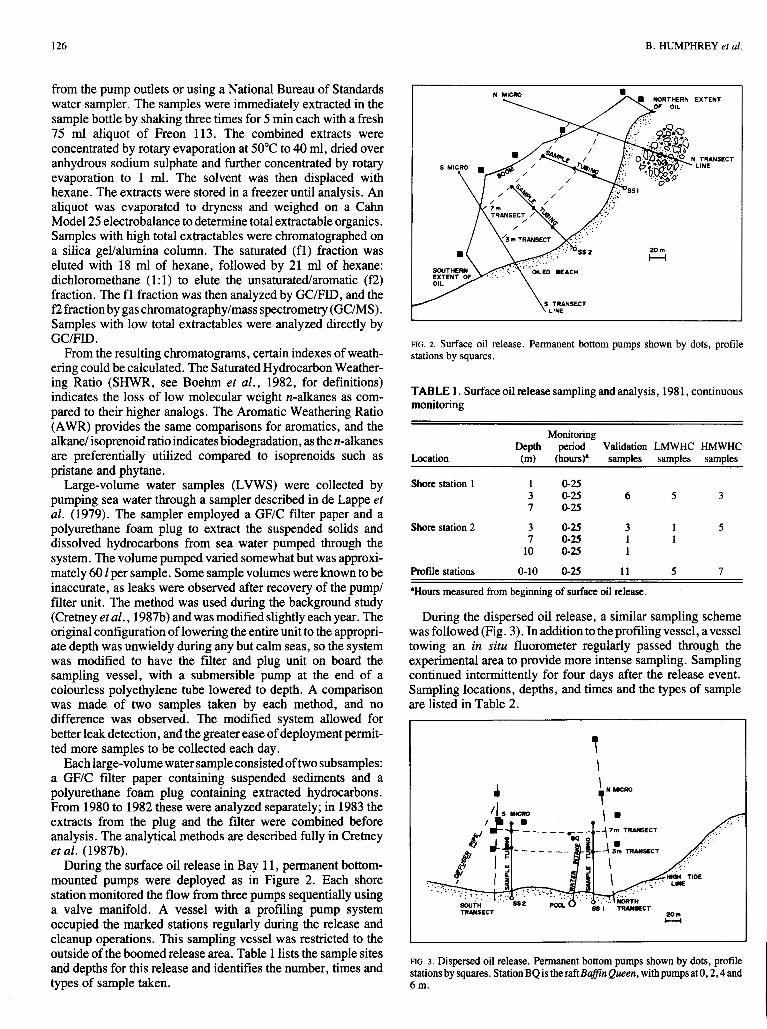
During the dispersed oil release, a similar sampling scheme was followed (Fig. 3). In addition to the profiling vessel, avessel towing an in situ fluorometer regularly passed through the experimental area to provide more intense sampling. Sampling continued intermittently for four days after the release event. Sampling locations, depths, and times and the types of sample are listed in Table 2.
t I
FIG. 3. Dispersed oil release. Permanent bottom pumps shown by dots, profile stations by squares. Station BQ is theraftBuJin Queen, with pumps at 0,2,4 and 6 m.
FATE OF OIL IN WATER COLUMN
The results of the oil-in-water determinations were combined to evaluate both temporal and spatial distributions of oil in the water column during each experiment. The results from a single station were plotted in a time series. Results from different stations were divided into time segments and plotted on a map of the study area to give crude contours of oil concentration. These time segments were typically six hours long. A three-dimensional picture emerged for oil movement and dispersion, as the data set included oil concentration, position and depth, and time. TABLE 2. Dispersed oil release sampling and analysis, 1981, continu- ous monitoring
Monitoring Depth period Validation LMWHC HMWHC
Location (m) (hours)" samples samples samples
Shore station 1 2 0-29 3 5 1 6 0-29 5 3 1 8 0-29 5 3 1
Shore station 2 3 0-29 6 3 1 7 0- 1 1 1 1
10 0-29 7 7 4 Baffin Queen 0 0-29 3 5 3
2 0-29 3 4 3 4 0-29 3 4 3 6 0-29 3 6 3
Petrotrack in situ fluorometer Various 0-48 Profile stations 0-10 Bay 7:12 stations 12-75 3 4 Bay 9:27 stations 0-72 12 3 6 Bay 10:24 stations 2-72 12 12 17 Bay 1 1 :8 stations 27-72 3 6 Ragged Channel: 6 stations 53-15 2 Milne Inlet: 1 station 75 2
"Hours measured from beginning of dispersed oil release.
To evaluate the exposure of benthic biota to dispersed oil, an exposure rating was arrived at by determining the area under the plot of oil concentration versus time for the permanently mounted pumps in the biology study areas in the release bay. This exposure is reported as mg.l'.h, a unit that describes a total exposure. This unit has no previous use but was used in the present study to indicate relative exposures in the various bays to equate exposures with high oil concentrations for a short period to other exposures marked by low concentrations for a long period. For the dispersed oil release, oil concentrations determined from profiles were used to estimate exposures for Bays 10 and 7, which did not have permanent pumps.
RESULTS
Flow-Through Fluorometry
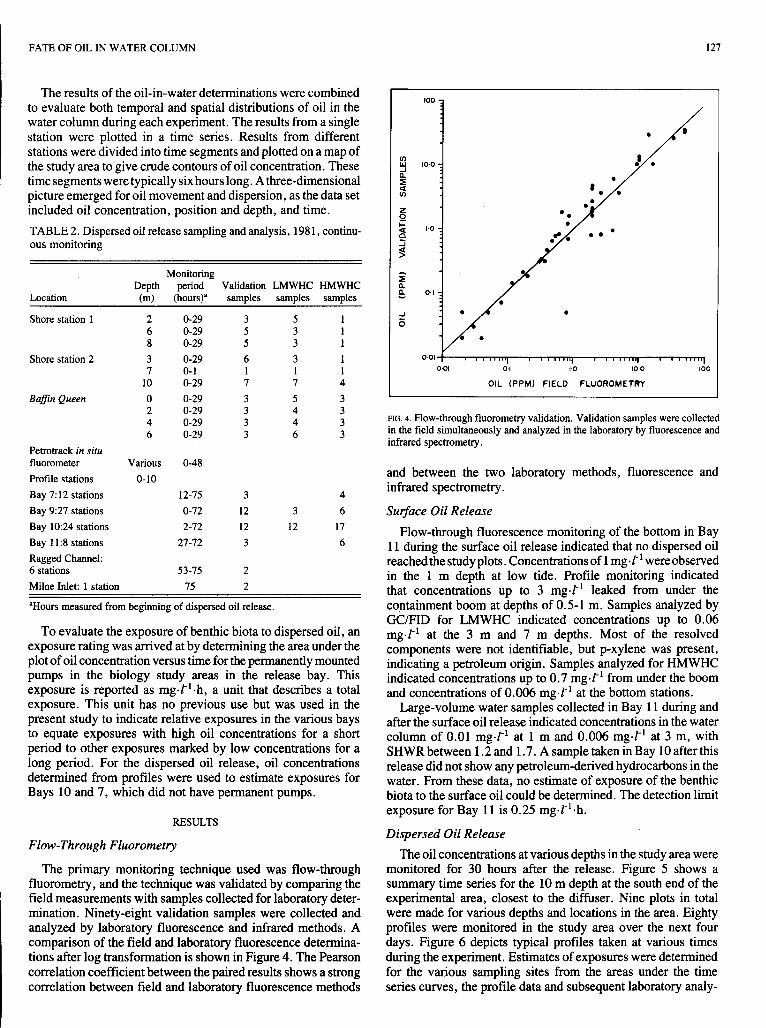
The primary monitoring technique used was flow-through fluorometry, and the technique was validated by comparing the field measurements with samples collected for laboratory deter- mination. Ninety-eight validation samples were collected and analyzed by laboratory fluorescence and infrared methods. A comparison of the field and laboratory fluorescence determina- tions after log transformation is shown in Figure 4. The Pearson correlation coefficient between the paired results shows a strong correlation between field and laboratory fluorescence methods
127
100 7
0.01 ; , , , , , , ,,, , , , , , ,,,, , , I , , , ,1 , , , , , , "1 0.01 0.1 1.0 10.0 100
OIL (PPM) FIELD FLUOROMETRY
FIG. 4. Flow-through fluorometry validation. Validation samples were collected in the field simultaneously and analyzed in the laboratory by fluorescence and infrared spectrometry.
and between the two laboratory methods, fluorescence and infrared spectrometry.
Surface Oil Release Flow-through fluorescence monitoring of the bottom in Bay
11 during the surface oil release indicated that no dispersed oil reachedthe studyplots. Concentrationsof 1 mg.1" were observed in the 1 m depth at low tide. Profile monitoring indicated that concentrations up to 3 mg.1" leaked from under the containment boom at depths of 0.5-1 m. Samples analyzed by GC/FID for LMWHC indicated concentrations up to 0.06 mg.1" at the 3 m and 7 m depths. Most of the resolved components were not identifiable, but p-xylene was present, indicating a petroleum origin. Samples analyzed for HMWHC indicated concentrations up to 0.7 mg.t' from under the boom and concentrations of 0.006 mg.Z" at the bottom stations.
Large-volume water samples collected in Bay 11 during and after the surface oil release indicated concentrations in the water column of 0.01 mgd" at 1 m and 0.006 mg.1" at 3 m, with SHWR between 1.2 and 1.7. A sample taken in Bay 10 after this release did not show any petroleum-derived hydrocarbons in the water. From these data, no estimate of exposure of the benthic biota to the surface oil could be determined. The detection limit exposure for Bay 11 is 0.25 mg-l".h.
Dispersed Oil Release The oil concentrations at various depths in the study area were
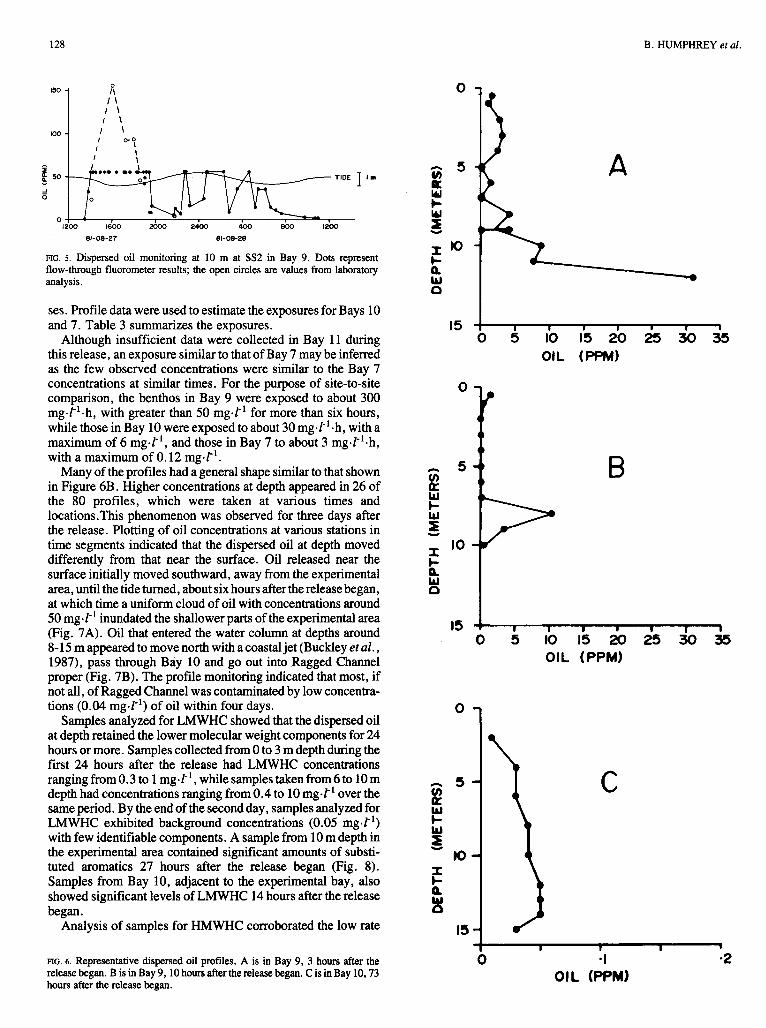
monitored for 30 hours after the release. Figure 5 shows a summary time series for the 10 m depth at the south end of the experimental area, closest to the diffuser. Nine plots in total were made for various depths and locations in the area. Eighty profiles were monitored in the study area over the next four days. Figure 6 depicts typical profiles taken at various times during the experiment. Estimates of exposures were determined for the various sampling sites from the areas under the time series curves, the profile data and subsequent laboratory analy-
128 B . HUMPHREY et al.
1200 1600 xxx) 2400 400 8 0 0 Ixx)
81-08 -27 81 -08 -28
FIG. 5 . Dispersed oil monitoring at 10 m at SS2 in Bay 9. Dots represent flow-through fluorometer results; the open circles are values from laboratory analysis.
ses. Profile data were used to estimate the exposures for Bays 10 and 7. Table 3 summarizes the exposures.
Although insufficient data were collected in Bay 11 during this release, an exposure similar to that of Bay 7 may be inferred as the few observed concentrations were similar to the Bay 7 concentrations at similar times. For the purpose of site-to-site comparison, the benthos in Bay 9 were exposed to about 300 mg.l".h, with greater than 50 mg4" for more than six hours, while those in Bay 10 were exposed to about 30 mg-l".h, with a maximum of 6 mg-l", and those in Bay 7 to about 3 mg.l".h, with a maximum of 0.12 mg.t'.
Many of the profiles had a general shape similar to that shown in Figure 6B. Higher concentrations at depth appeared in 26 of the 80 profiles, which were taken at various times and 1ocations.This phenomenon was observed for three days after the release. Plotting of oil concentrations at various stations in time segments indicated that the dispersed oil at depth moved differently from that near the surface. Oil released near the surface initially moved southward, away from the experimental area, until the tide turned, about six hours after the release began, at which time a uniform cloud of oil with concentrations around 50 mg-t ' inundated the shallower parts of the experimental area (Fig. 7A). Oil that entered the water column at depths around 8- 15 m appeared to move north with a coastal jet (Buckley et al., 1987), pass through Bay 10 and go out into Ragged Channel proper (Fig. 7B). The profile monitoring indicated that most, if not all, of Ragged Channel was contaminated by low concentra- tions (0.04 mg.l") of oil within four days.
Samples analyzed for LMWHC showed that the dispersed oil at depth retained the lower molecular weight components for 24 hours or more. Samples collected from 0 to 3 m depth during the first 24 hours after the release had LMWHC concentrations ranging from 0.3 to 1 mg-l", while samples taken from 6 to 10 m depth had concentrations ranging from 0.4 to 10 mg -t' over the same period. By the end of the second day, samples analyzed for LMWHC exhibited background concentrations (0.05 mg J') with few identifiable components. A sample from 10 m depth in the experimental area contained significant amounts of substi- tuted aromatics 27 hours after the release began (Fig. 8). Samples from Bay 10, adjacent to the experimental bay, also showed significant levels of LMWHC 14 hours after the release
Analysis of samples for HMWHC corroborated the low rate began.
0
n 5 v)
W a c Y i - X IO
t W 0
IS
0
n S VJ a
Y Y K)
I c P x
IS
FIG. 6. Representative dispersed oil profiles. A is in Bay 9, 3 hours after the release began. B is in Bay 9,lO hours after the release began. C is in Bay 10,73 hours after the release began.
A
I OIL (PPM)
C
FATE OF OIL IN WATER COLUMN
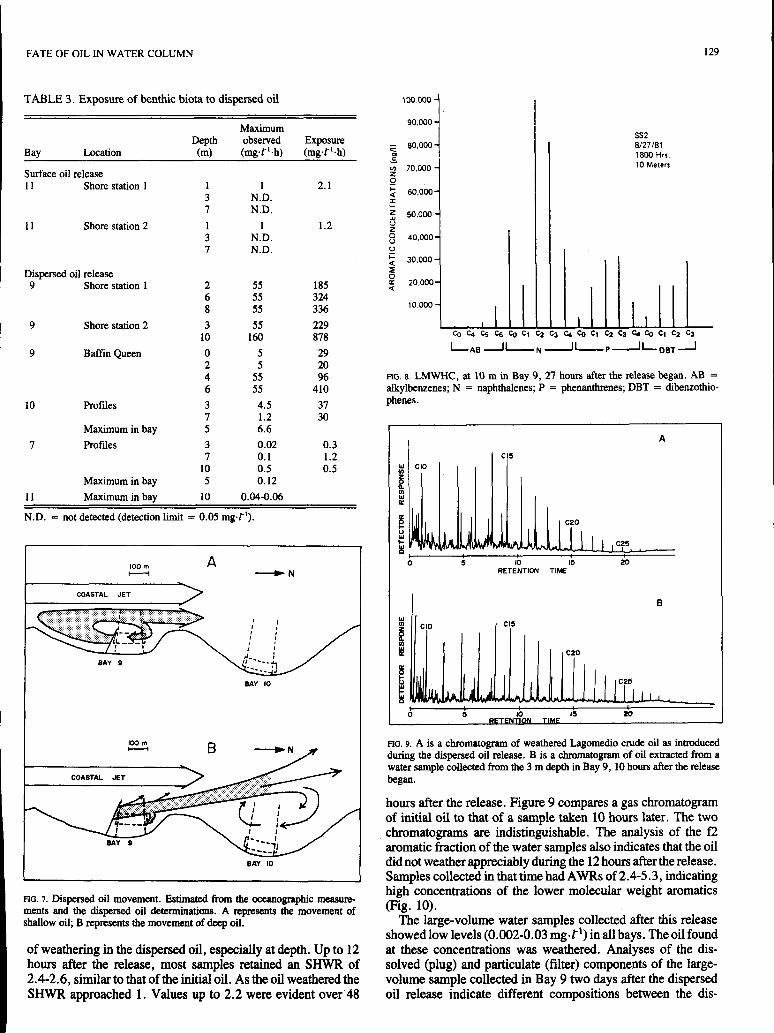
TABLE 3 . Exposure of benthic biota to dispersed oil ~ ~~~~ ~~~ ~~
Maximum Depth observed Exposure
Bay Location (m) (mgT'.h) (mgd".h)
Surface oil release 11 Shore station 1 1 1 2.1
3 N.D. 7 N.D.
1 1 Shore station 2 1 1 1.2 3 7
N.D. N.D.
Dispersed oil release 9 Shore station 1 2 55 185
6 55 324 8 55 336
9 Shore station 2 3 55 229 10 160 878
9 Baffin Queen 0 5 29 2 5 20 4 55 96 6 55 410
10 Profiles 3 4.5 37 7 1.2 30
Maximum in bay 5 6.6 7 Profiles 3 0.02
7 0.3
0.1 1.2 10 0.5 0.5
Maximum in bay 5 0.12 11 Maximum in bay 10 0.04-0.06
N.D. = not detected (detection limit = 0.05 mg@).
100 m A - - N
COASTAL JET
BAY IO
FIG. 7. Dispersed oil movement. Estimated from the OCeanoBraphic measure- ments and the dispersed oil determinations. A represents the movement of shallow oil; B represents the movement of deep oil.
of weathering in the dispersed oil, especially at depth. Up to 12 hours after the release, most samples retained an S H W R of 2.4-2.6, similar to that of the initial oil. As the oil weathered the S H W R approached 1. Values up to 2.2 were evident over 48
100.000
90,000
80.000 co - UI 70.000
0 2
2 60,000 a $ 50.000
40.000
I-
V 2
L! I- 30.000
0 I a ZO.OOO
10.000 I 129
ss2 8/27/81 1800 Hrr. 10 Meters
FIG. 8. LMWHC, at 10 m in Bay 9, 27 hours after the release began. AB = alkylbenzenes; N = naphthalenes; P = phenanthrenes; DBT = dibenzothio- phenes.
I A
I C!5
RETENTION TIME
B
, c20
FIG. 9. A is a chromatogram of weathered Lagomedio crude oil as introduced during the dispersed oil release. B is a chromatogram of oil extracted from a water sample collected from the 3 m depth in Bay 9, 10 hours after the release began.
hours after the release. Figure 9 compares a gas chromatogram of initial oil to that of a sample taken 10 hours later. The two chromatograms are indistinguishable. The analysis of the f2 aromatic fraction of the water samples also indicates that the oil did not weather appreciably during the 12 hours after the release. Samples collected in that time had AWRs of 2.4-5.3, indicating high concentrations of the lower molecular weight aromatics (Fig. 10).
The large-volume water samples collected after this release showed low levels (0.002-0.03 mg-f ') in all bays. The oil found at these concentrations was weathered. Analyses of the dis- solved (plug) and particulate (filter) components of the large- volume sample collected in Bay 9 two days after the dispersed oil release indicate different compositions between the dis-

130
I 50
T p?
In z 0 Y
5
FIG. io. Aromatic fraction of oil extracted from a water sample collected from 10 m depth in Bay 9, 6 hours after the release began.
solved and particulate oil. The particulate oil, representing about 95% of the total oil collected, retained n-alkanes after C13 and aromatic hydrocarbons with more than two rings. The dissolved component consisted of very little alkane fraction, but the naphthalenes were relatively abundant.
Long-Term Monitoring
In the two years following the oil releases, bulk water samples (16 I ) and large-volume water samples were collected at the beginning of the open water season each year. Concentrations in the water column were low. In both years, only traces of oil indicators (n-alkanes) were observed in total hydrocarbon con- centrations around 0.001 mgsl" or less. Samples of observable surface sheen in the vicinity of the oiled beach in Bay 11 indicated that some oil was being washed off the beach, but estimates of absolute quantities were not possible. The oil coming off the beach in 1982 was similar to the oil that had stranded one year before. The SHWR was typically 2.0-2.4, compared to the SHWR of stranded oil in 198 1 of 2.3. The AWR indicated that the low molecular weight aromatics were being removed; the AWRs measured were 1.4, as compared to 3.5 for the oil the previous year. In 1983, after one full open water season after the release, the oil coming off the beach was more weathered,withanSHWRof1.0-1.1andanAWRof1.0-1.1.In both years, the AWR did not show any significant change, implying little or no biodegradation.
DISCUSSION
Two experimental oil releases resulted in markedly different impacts on the water column.
The surface oil release in Bay 11 resulted in a short-term penetration of hydrocarbons into the water column below the slick. This impact was restricted to the top metre of the water column and lasted for one day only. Virtually no oil entered the water column past one metre during the spill and cleanup periods.
The surface oil release caused some oil to be stranded on the beach. This oil was very weathered after one complete open
B . HUMPHREY et al.
water season. Stranding oil on an arctic beach resulted in a low-level long-term source of weathered hydrocarbon for the water surface, and presumably for the water column. Although some leaching from the oiled beach face may have occurred in later open water periods, measured concentrations in the water column were near the limits of detection. No measurable con- centrations of oil were in contact with the bottom sediments at 1.3 or 7 m depths as a result of this surface release.
With no application of dispersants, very little oil enters the water column. These results are consistent with those of Lichtenthaler and Daling (1985), for example, who found oil concentrations of less than 1 mg.1" under an untreated slick on the open ocean. Thus the surface oil release resulted in little, if any, immediate contact between oil from the water column and the benthic community in Bay 11, although the chronic input from the stranded oil may induce a long-term impact (Cross and Thomson, 1987; Cross er al., 1987a,b).
The dispersed oil release in Bay 9 resulted in a massive injection of oil to the water column, where it remained relatively unweathered for more than a day. The dispersed oil cloud contacted bottom sediments in Bay 9 at concentrations greater than 50 mg-l" for at least 16 hours. The dispersed oil cloud, composed of hydrocarbons from C8 and higher, moved with the tidal currents in Ragged Channel. The early shallow input moved south with the currents and returned to the study area after the tide changed. Oil injected at depth moved consistently north, out of the bay and into Ragged Channel. For a period, shallow dispersed oil clouds from the early part of the release overlay clouds of recently released oil.
The dispersed oil at depths greater than 3 m did not lose the lower molecular weight hydrocarbons as rapidly as the near- surface dispersed oil. This is consistent with a model that the LMWHC pass from a dispersed oil phase to a dissolved phase and, if near the surface, to a gas phase. Submerged dispersed oil shows a concentration gradient. Near the surface, evaporation ensures that local equilibrium is never attained. The retention of some LMWHC in the particulate phase, which was not observed in the dissolved phase, indicates that hydrocarbons partition more favourably to suspended particulate.
Many dispersant experiments have been conducted in temper- ate waters. Nichols and Parker (1985) summarize the results from 54 field trials. Reported concentrations of dispersed oil in the water column under a dispersed slick vary from 67 mg.1" to less than 1 mg -1" , with the most common concentrations between 1 and 10 mg.1". In some cases, compositional analyses were carried out on the dispersed oil samples. Other experiments not listed in that summary gave similar results. Aerial dispersant trials off Canada's east coast resulted in reported concentrations up to 22 mg.l", with typical values of 2.5-10 mg.1" (Gill et al., 1985). A tank experiment with waves of 10 cm height resulted in dispersed oil concentrations under the slick of up to 60 mg.1" (MacNiell ef al., 1985).
At almost the same time as the BIOS Project, a program with similar goals was being carried out near Searsport, Maine (Gilfillan et al., 1985; Page ef al. , 1983,1985): two releases of approximately 1 m3 each of Murban crude oil were placed on the water surface. In one release, no countermeasure action was taken, and the oil was allowed to strand on the beach. In the other release, the oil was pre-mixed with a dispersant (10: 1) and, after release to the water surface, was dispersed using breaker boards

FATE OF OIL IN WATER COLUMN
to provide mixing energy. Concentrations up to 160 mg.1" were reported 0.5 m under the dispersed slick, with concentrations of about 0.5 mg.1" under the untreated slick. The composition of the dispersed oil changed with depth. The lighter, more toxic hydrocarbons did not penetrate to the bottom, as shown by a low ratio of naphthalenes to benzothiophenes and phenanthrenes in those samples, when compared to samples from 0.5 m depth (Page et al., 1985). Exposure of the benthic organisms to 7-8 mg.1-l.h was calculated by integrating the measured bottom concentration over time.
The dispersed oil concentrations observed in the BIOS study are similar to or higher than concentrations observed elsewhere, but the composition of the dispersed oil in this experiment is unlike that normally found after surface application of disper- sant. Discharging oil pre-mixed with dispersant into the water column via a subsurface diffuser resulted in very high concentra- tion of oil in the water column, including the highly toxic low molecular weight aromatic hydrocarbons, such as the substi- tuted benzenes and naphthalenes. McAuliffe et al. (1980), in their trials off New Jersey, noted rapid loss of the lower molecular weight components from dispersed oil; they postu- lated that evaporation of low molecular weight compounds from the water column was faster than dissolution, and those com- pounds were rapidly transported out of the water column. In general, low molecular weight compounds will not be found at depth in the water column.
The subsurface release of chemically dispersed oil represents by far the "worst case" of chemically dispersing oil. The dispersed oil release in this study resulted in different levels and conditions of exposure of the benthic communities in three of the experimental bays. The exposures of 300 mg.l".h in Bay 9, 30mg~l"~hinBay10and3mg~l"~hinBay7provideexperimen- tal conditions reflecting an extreme case (Bay 9), a possible case (Bay 10; see Gilfillan et al., 1985) and an example of minimal impact (Bay 7). Only four of the trials summarized by Nichols and Parker (1985) indicate that concentrations higher than 40 mg.1" were reached when conventional dispersant application methods were used, and the more toxic components did not penetrate to depth (Page et al., 1985). The conditions observed in the BIOS experiment may be similar to those produced by a subsurface blowout. In particular, high concentrations of low molecular weight and more toxic oil components have been observed in the water column during a blowout. Boehm et al. (1982), in their study of the Ixtoc I blowout in the Bay of Campeche, found that the subsurface oil had higher AWRs than the surface oil or the wellhead oil, implying that the more soluble fractions may remain in the water column longer under the conditions of subsurface release.
The fate of oil entering the water column from the surface release of crude oil and the subsurface release of an oil/ dispersant mixture was monitored for three years in the BIOS Project. Very little oil entered the water column immediately after the surface oil release, but there may have been some chronic input from oil stranded on the beach after that release. This chronic input had no measurable effect on the water column. The observed indicators were in such low concentra- tions as to be indistinguishable from the natural background material. All of the released oil entered the water column during the dispersed oil release but was not detectable in the area after one week.
131
The results indicate that while open water is seasonally present in some arctic locales, the oil behaviour and the effects of countermeasures are not significantly different from those in temperate regions.
CONCLUSIONS
The surface release of crude oil resulted in a short-term (less than one day) penetration of hydrocarbons into the water cob umn to a depth of 1 m below the slick. Little, if any, immediate contact between oil in the water column and the benthic commu- nity resulted. However, some oil was stranded on the beach face and provided a low-level long-term input of weathered hydrocar- bons to the water.
The subsurface discharge of oil pre-mixed with dispersant resulted immediately in a high concentration of oil in the water column. This oil was unweathered and contained the highly toxic low molecular weight aromatic hydrocarbons. However, this oil was no longer detectable in the water column one week after the discharge. Thus the dispersed oil release resulted in some short-term contact between oil in the water column and the benthic community of the experimental bay and, to a lesser extent, of the neighbouring bays.
ACKNOWLEDGEMENTS
We wish to thank the BIOS Project managers, Peter Blackall and Gary Sergy, for their excellent support in all phases of the project. We also wish to thank the many colleagues associated with the project for the useful discussions over the four years of the project. The work presented here was funded by the Environmental Protection Service of Environment Canada, and by the National Oceanographic and Atmo- spheric Administration (NOAA).
REFERENCES
BOEHM, P.D., FIEST, D.L., MACKAY, D. , and PATERSON, S. 1982. Physical chemical weathering of petroleum hydrocarbons from the Ixtoc I blowout: Chemical measurements and a weathering model. Environmental Science and Technology 16(8):498-505.
PHREY, B., FIEST, D.L., and CRETNEY, W.J. 1987. Comparative fate of chemically dispersed and beached crude oil in subtidal sediments of the arctic nearshore. Arctic 40 (Supp. 1):133-148.
BUCKLEY, J.R., DE LANGE BOOM, B.R., and REIMER, E.M. 1987. The physical oceanography of the Cape Hatt region, Eclipse Sound, N.W.T.
CRETNEY, W. J . , GREEN, D.R., FOWLER, B.R., HUMPHREY, B. , FIEST, D.L., and BOEHM, P.D. 1987a. Hydrocarbon biogeochemical setting of the Baffin Island Oil Spill experimental sites. I. Sediments. Arctic 40 (Supp.
-. 1987b. Hydrocarbon biogeochemical setting of the Baffin Island Oil
BOEHM, P.D., STEINHAUER, M.S., GREEN, D.R., FOWLER, B. , HUM-
Arctic 40 (SUPP. 1):20-33.
1):51-65.
CRETNEY, W. J . , GREEN, D.R., FOWLER, B.R., HUMPHREY, B., ENGEL- Spill experimental sites. 11. Water. Arctic (Supp. 1):66-70.
HARDT, F.R., NORSTROM, R.J., SIMON, M., FIEST, D.L., and BOEHM, P.D. 1987c. Hydrocarbon biogeochemical setting of the Baffin Island Oil Spill experimental sites. III. Biota. Arctic 40 (Supp. 1):71-79.
CROSS, W.E.,andTHOMSON,D.H. 1987.Effectsofexperimentalreleasesof oil and dispersed oil on arctic nearshore macrobenthos. I. Infauna. Arctic 40
CROSS, W.E., MARTIN, C.M., and THOMSON, D.H. 1987a. Effects of experimental releases of oil and dispersed oil on arctic nearshore macrobenthos. II. Epibenthos. Arctic 40 (Supp. 1):201-210.
CROSS, W.E., WILCE, R.T., and FABIJAN, M.F. 1987b. Effects of experi- mental releases of oil and dispersed oil on arctic nearshore macrobenthos. III. Macroalgae. Arctic 40 (Supp. 1):211-219.
(SUPP. 1):184-200.

132 B. HUMPHREY et al.
DE LAPPE, B.W., RISEBROUGH, R.W., SPRINGER, A.M., SCHMIDT, T.T., SHRIPSHIRE, J.C., LETTERMAN, E.F., and PAYNE, J.R. 1979. The sampling and measurement of hydrocarbons in natural waters. In: Afgan, B.F., and Mackay, D., eds. Hydrocarbons and Halogenated Hydrocarbons in the Aquatic Environment. N.Y.: Plenum Press. 29-68.
DICKINS, D.F., THORNTON, D.E., and CRETNEY, W.J. 1987. Design and operation of oil discharge systems and characteristics of oil used in the Baffin Island Oil Spill Project. Arctic 40 (Supp. 1):lOO-108.
GILFILLAN, E.S., PAGE, D.S., HANSON, S .A., FOSTER, J.C., VALLAS, D., PENDERGAST, E., HEBERT, S . , PRATT, S.D., and GERBER, R. 1985. Tidal area dispersant experiment, Searsport, Maine: An overview. In: Proceedings of the 1985 Oil Spill Conference. Washington, D.C.: American Petroleum Institute publication no. 4385. 553-559.
GILL,S.D.,GOODMAN,R.H.,andSWISS,J. 1985.Halifax’83seatrialofoil spill dispersant concentrates. In: Proceedings of the 1985 Oil Spill Confer- ence. Washington,D.C.:AmericanPetroleumInstitutepublicationno.4385.
GREEN, D.R., HUMPHREY, B., and FOWLER, B.R. 1983. The use of flow-through fluorometry for tracking dispersed oil. Proceedings of the 1983 Oil Spill Conference. Washington, D.C.: American Petroleum Institute publication no. 4356. 473-475.
HILDEBRAND,P.B.,ALLEN,A.A.,andROSS,C.W. 1977,Thefeasibilityof oil spill dispersant application in the southern Beaufort Sea. Ottawa: Environ- ment Canada. Environmental Protection Service Economic and Technical Review Report EPS-3-EL-77-16. 102 p.
HUMPHREY, B., BOEHM, P.D., HAMILTON, M.C., andNORSTROM, R. J. 1987. The fate of chemically dispersed and untreated crude oil in arctic benthic biota. Arctic 40 (Supp. 1):149-161.
LICHTENTHALER, R.G., and DALING, P.S. 1985. Aerial application of dispersants - comparison of slick behaviour of chemically treated versus non-treated slicks. In: Proceedings of the 1985 Oil Spill Conference. Wash- ington, D.C.: American Petroleum Institute publication no. 4385.471-478.
479-482.
MAcNIELL, M.R., GOODMAN, R.H., BODEUX, J.B., CORRY, K.E., and PADDISON, B.A. 1985. Dispersant tests in a wave basin. In: Pro- ceedings of the 1985 Oil Spill Conference. Washington, D.C.: American Petroleum Institute publication no. 4385. 463-469.
McAULIFFE, C.D., JOHNSON, J.C., GREENE, S.H., CANEVARI, G.P., and SEARLE, T.D. 1980. Dispersion and weathering of chemically treated crude oils in the ocean. Environmental Science and Technology 14:
MEERES, L.S. 1987. Meteorological operations at Cape Hatt in support of the Baffin Island Oil Spill Project. Arctic 40 (Supp. 1):42-50.
NICHOLS,J.A.,andPARKER,H.D. 1985.Dispersants:Comparisonoflabora- tow tests and field trials with practical experience at spills. In: Proceedings of the 1985 Oil Spill Conference. Washington, D.C.: American Petroleum Institute publication no. 4385. 421-427.
OWENS, E.H., ROBSON, W., and FOGET, C.R. 1987. A field evaluation of selected beach-cleaning techniques. Arctic 40 (Supp. 1):244-257.
PAGE, D.S., FOSTER, J.C., HOTHAM, J.R., PENDERGAST, E., HEBERT, S. , GONZALEZ, L., GILFILLAN, E.S., HANSON, S.A., GERBER, R.P., and VALLAS, D. 1983. Long-term fate of dispersed and undispersed crude oil in two nearshore test spills. In: Proceedings of the 1983 Oil Spill Conference. Washington,D.C.:AmericanPetroleumInstitutepublicationno.
1509-1518.
4356. 465-471. PAGE, D.S., GILFILLAN, E.S., FOSTER, J.C., PENDERGAST, E., GON-
ZALEZ, L., and VALLAS, D. 1985. Compositional changes in dispersed crude oil in the water column during a nearshore test spill. In: Proceedings of the 1985 Oil Spill Conference. Washington, D.C.: American Petroleum Institute publication no. 4385. 521-530.
POJASEK, R.B., and SCOTT, M.F. 1981. Surrogate screening for volatile organics in contaminated media. In: Conway, R.A., and Malloy, B.C., eds. Hazardous Waste Solid Testing: First Conference ASTM STP 760. American Society for Testing and Materials. 212-224.
SERGY, G.A., and BLACKALL, P.J. 1987. Design and conclusions of the Baffin Island Oil Spill Project. Arctic 40 (Supp. 1):l-9.