the family of linear graphs
TRANSCRIPT

A graphing calculator is a valuable tool when investigating characteristics of linear functions. Before graphing, you must create a viewing window that shows both the x- and y-intercepts of the graph of a function.
You can use the standard viewing window [-10, 10] scl: 1 by [-10, 10] scl: 1 or set your own minimum and maximum values for the axes and the scale factor by using the WINDOW option.
You can use a TI-73 Explorer graphing calculator to enter several functions and graph them at the same time on the same screen. This is useful when studying a family of functions. The family of linear functions has the parent function y = x.
Graphing Calculator Lab
The Family of Linear Graphs
ACTIVITY 1
Graph y = 3x - 2 and y = 3x + 4 in the standard viewing window and describe how the graphs are related.
Step 1 Graph y = 3x + 4 in the standard viewing window.
• Clear any existing equations from the Y= list.
kEysTrokEs:
• Enter the equation and graph.
kEysTrokEs: 3 4 6
Step 2 Graph y = 3x - 2.
• Enter the function y = 3x – 2 as Y2 with y = 3x + 4 already existing as Y1.
kEysTrokEs: 3 2
• Graph both functions in the standard viewing window.
kEysTrokEs: 6
The first function graphed is Y1 or y = 3x + 4. The second function graphed is Y2 or y = 3x - 2. Press . Move along each function using the right and left arrow keys. Move from one function to another using the up and down arrow keys. The graphs have the same slope, 3, but different y-intercepts at 4 and -2.
The tick marks on the x scale and on the y scale are 1 unit apart.
[-10, 10] scl: 1 by [-10, 10] scl: 1
The x-axis goes from -10 to 10.
The y-axis goes from -10 to 10.
EXErcisEs
Graph y = 2x - 5, y = 2x - 1, and y = 2x + 7.
1. Compare and contrast the graphs.
2. How does adding or subtracting a constant c from a linear function affect its graph?
3. Write an equation of a line whose graph is parallel to y = 3x - 5, but is shifted up 7 units.
4. Write an equation of the line that is parallel to y = 3x - 5 and passes through the origin.
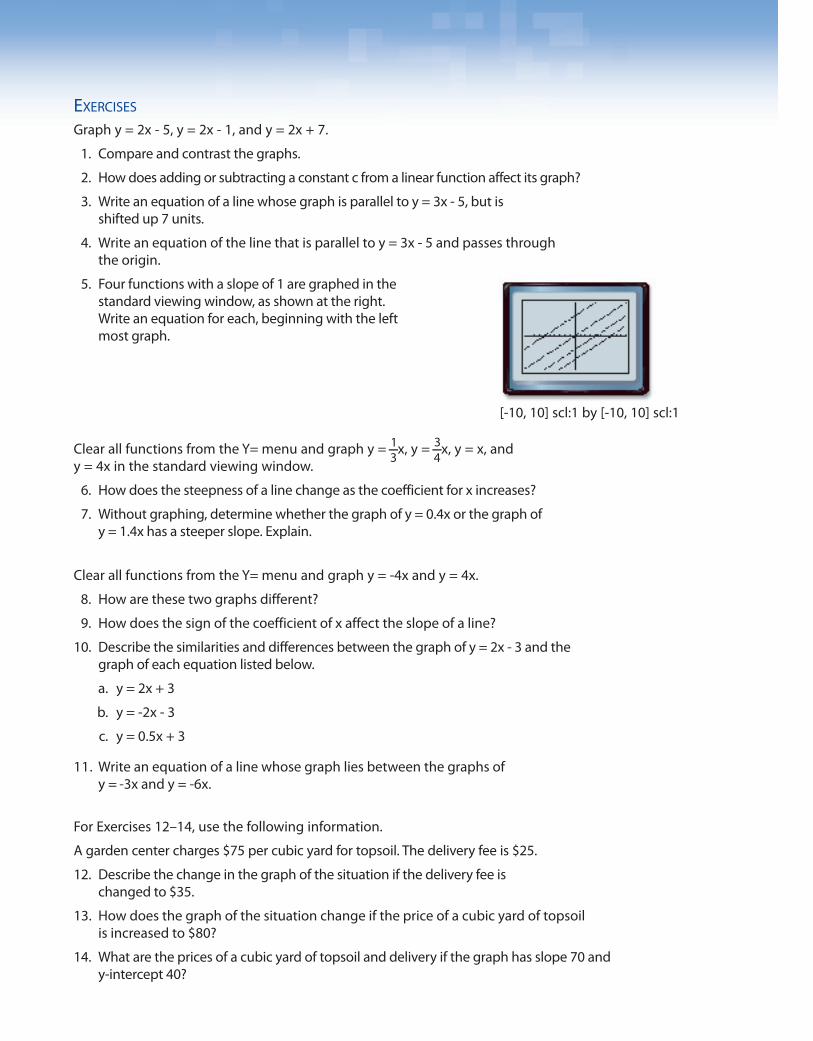
5. Four functions with a slope of 1 are graphed in the standard viewing window, as shown at the right. Write an equation for each, beginning with the left most graph.
Clear all functions from the Y= menu and graph y = 1 _ 3
x, y = 3 _ 4
x, y = x, and y = 4x in the standard viewing window.
6. How does the steepness of a line change as the coefficient for x increases?
7. Without graphing, determine whether the graph of y = 0.4x or the graph of y = 1.4x has a steeper slope. Explain.
Clear all functions from the Y= menu and graph y = -4x and y = 4x.
8. How are these two graphs different?
9. How does the sign of the coefficient of x affect the slope of a line?
10. Describe the similarities and differences between the graph of y = 2x - 3 and the graph of each equation listed below.
a. y = 2x + 3
b. y = -2x - 3
c. y = 0.5x + 3
11. Write an equation of a line whose graph lies between the graphs of y = -3x and y = -6x.
For Exercises 12–14, use the following information.
A garden center charges $75 per cubic yard for topsoil. The delivery fee is $25.
12. Describe the change in the graph of the situation if the delivery fee is changed to $35.
13. How does the graph of the situation change if the price of a cubic yard of topsoil is increased to $80?
14. What are the prices of a cubic yard of topsoil and delivery if the graph has slope 70 and y-intercept 40?
[-10, 10] scl:1 by [-10, 10] scl:1