the f/a-18 high-angle-of-attack ground-to-flight ...the f/a-18 high-angle-of-attack ground-to-flight...
TRANSCRIPT

NASA Technical Memorandum 4783
The F/A-18 High-Angle-of-Attack Ground-to-Flight Correlation: Lessons Learned
January 1997
Daniel W. Banks, David F. Fisher, Robert M. Hall,Gary E. Erickson, Daniel G. Murri, Sue B. Grafton,and William G. Sewall
NASA Technical Memorandum 4783
National Aeronautics and Space Administration
Office of Management
Scientific and Technical Information Program
1997
Daniel W. Banks and David F. Fisher
Dryden Flight Research CenterEdwards, California
Robert M. Hall, Gary E. Erickson, Daniel G. Murri, Sue B. Grafton, and William G. Sewall
NASA Langley Research CenterHampton, Virginia
The F/A-18 High-Angle-of-Attack Ground-to-Flight Correlation: Lessons Learned

THE F/A-18 HIGH-ANGLE-OF-ATTACK GROUND-TO-FLIGHTCORRELATION: LESSONS LEARNED
Daniel W. Banks and David F. FisherNASA Dryden Flight Research Center
Edwards, California
Robert M. Hall, Gary E. Erickson, Daniel G. Murri,Sue B. Grafton, and William G. Sewall
NASA Langley Research CenterHampton, Virginia
ABSTRACT
Detailed wind tunnel and flight investigations were performed on the F/A-18 configuration toexplore the causes of many high-angle-of-attack phenomena and resulting disparities betweenwind tunnel and flight results at these conditions. Obtaining accurate predictions of full-scale flightaerodynamics from wind-tunnel tests is important and becomes a challenge at high-angle-of-attackconditions where large areas of vortical flow interact. The F/A-18 airplane was one of the firsthigh-performance aircraft to have an unrestricted angle-of-attack envelope, and as such the config-uration displayed many unanticipated characteristics.
Results indicate that fixing forebody crossflow transition on models can result in a moreaccurate match of flow fields, and thus a more accurate prediction of aerodynamic characteristicsof flight at high angles of attack. The wind tunnel results show that small geometry differences,specifically nosebooms and aft-end distortion, can have a pronounced effect at high angles of at-tack and must be modeled in sub-scale tests in order to obtain accurate correlations with flight.
NOMENCLATURE
All force, moment, and pressure data have been reduced to coefficient form. All longitudinaldata are presented in the stability axis system, while all lateral-directional data are presented in thebody axis system. Moment data are referred to a moment center located at 25% of the mean aero-dynamic chord.
AR aspect ratio
b span, ft
b’ local span, ft
drag coefficient, drag /
lift coefficient, lift /
maximum lift coefficient
rolling-moment coefficient, rolling moment /
lateral stability parameter or dihedral effect, per degree
pitching-moment coefficient, pitching moment /
yawing-moment coefficient, yawing moment /
directional stability parameter, per degree
pressure coefficient, ( )/
side-force coefficient, side force/
mean aerodynamic chord, ft
FS full-scale fuselage station, in.
HATP High-Angle-of-Attack Technology Program
HARV High-Alpha Research Vehicle
LEX leading-edge extension, or wing-body strake
LE leading edge
free-stream Mach number
p surface static pressure, lb/ft2
free-stream static pressure, lb/ft2
free-stream dynamic pressure, lb/ft2
Reynolds number based on mean aerodynamic chord
Reynolds number based on forebody base diameter
S reference area, ft2
TE trailing edge
y local span distance, ft
α angle of attack, deg
CD q∞S
CL q∞S
CL max,
Cl q∞Sb
Clβ
dC1
dβ---------
Cm q∞Sc
Cn q∞Sb
Cnβ
dCn
dβ---------
Cp p p∞– q∞
CY q∞S
c
M∞
p∞
q∞
Rec
Red
2

β sideslip angle, deg
flap deflection angle, deg
θ circumferential angle, deg
INTRODUCTION
The design of high-performance fighter aircraft has always placed emphasis on maneuverabil-ity and agility. To this end the aerodynamic envelope of these aircraft has been expanded to includehigher usable angles of attack. Significant separated and vortical flows develop over the aircraft athigh angles of attack and may significantly interact. These types of flow fields result in nonlinearaerodynamics and cause significant changes in stability and control characteristics when comparedwith low angles of attack. The changes in stability and control at high angles of attack are difficultto predict from ground tests because of the varying sensitivities to test conditions such as Reynoldsnumber and Mach number. It has been a goal of the NASA High-Angle-of-Attack TechnologyProgram (HATP)1 to develop a better understanding of these flow fields and their effect on ground-to-flight correlation.
Obtaining accurate wind-tunnel-to-flight correlation is a significant challenge. High-angle-of-attack conditions add a level of complexity to this already difficult task. In the end, a goodunderstanding of the behavior of the associated flow fields and their potential interactions isnecessary to produce useful design methodology and ground-test techniques that can accuratelypredict flight.
This paper reviews the results of the various wind tunnel and flight investigations of the F/A-18configuration leading to a more comprehensive understanding of these disparities and more accu-rate ground-to-flight correlation at high-angle-of-attack conditions. The results reported hereinwere obtained from various wind tunnel tests of several 6%- and 16%-scale F/A-18 models, andflight tests of the F-18 High-Alpha Research Vehicle (HARV) conducted at the Dryden FlightResearch Center, Edwards, California (DFRC).
BACKGROUND
The F/A-18 configuration, due to its interesting high-angle-of-attack characteristics, unre-stricted angle-of-attack envelope, and the availability of a flight test aircraft and wind tunnel mod-els, was adopted for much of the work of the HATP. Since the F/A-18 aircraft was one of the firstaircraft capable of controlled flight at high angles of attack, it displayed many unusual character-istics that were not well understood during early high-angle-of-attack flight tests. The features ofthe F/A-18 aircraft that made it attractive for high-angle-of-attack research included its contouredwing-body leading-edge extensions (LEXs), and its forebody shape, which is approximately ellip-tical with the major axis in the vertical plane aft of the radome. The design of the F/A-18 aircraft
δ f
3

used the mixed flow philosophy to obtain good high-angle-of-attack characteristics without signif-icant impact on the conventional low-angle-of-attack flight regime. At low to moderate angles ofattack, the relatively low sweep wing works well. But at higher angles of attack, the leading-edgeextensions (LEXs) generate strong vortices which, in addition to generating lift on the LEXs,propagate over the wings, and energize the wing flow fields, thereby extending the usable flightenvelope beyond maximum lift. This same flow field is also responsible for many of the lessdesirable high-angle-of-attack characteristics of the F/A-18 aircraft. These strong vortices alsoimpinge on the vertical tails and under some conditions cause severe buffeting.2–6 The forebodyof the F/A-18 aircraft generates a vortex pair at high angles of attack, which interacts with thestrong LEX vortices, and under some conditions can cause wing rock7,8 and nonlinear effects onlateral stability.
The F/A-18 development program epitomizes the challenge of ground-to-flight correlation athigh-angle-of-attack conditions. Early developmental wind-tunnel tests of the F/A-18 aircraft pro-duced inconsistent results. The most notable of these inconsistencies was between the lateralstability of large-scale models tested at relatively low Reynolds numbers and small-scale modelstested at higher Reynolds numbers. The small-scale higher Reynolds number data predicted theconfiguration would remain laterally stable at high angles of attack, while the large-scale lowerReynolds number data indicated the configuration would become laterally unstable at angles ofattack near maximum lift.9 Designers intuitively relied on the higher Reynolds number data asbeing the most representative of flight. However, early flight tests showed the lower Reynoldsnumber data better predicted the flight characteristics at high angles of attack.
Subsequent tests of F/A-18 models and the HARV, as well as other non-F/A-18 tests haveincreased our understanding of high-angle-of-attack flow fields. The flow fields at these highangle-of-attack conditions typically consist of separated wakes and potentially interacting vortices.The F/A-18 high-angle-of-attack flow field is characterized by interacting forebody and LEX vor-tices. Since the forebody flow is more sensitive to Reynolds number effects and the LEX flow ismore sensitive to Mach number effects, it is difficult to predict the high-angle-of-attack flight flowfield and its interactions from sub-scale wind tunnel tests. The effectiveness of gritting to simulatehigher Reynolds number boundary-layer crossflow transition at high angles of attack has beenrecently investigated, and has shown promising results.10,11 Fixing crossflow transition on theF/A-18 forebody has been shown to reduce differences between wind tunnel and flight aerodynam-ic results.12,13 The effects of small geometric differences, such as airdata probes and deformationsfor wind-tunnel supports, can have a pronounced effect at high angles of attack and are responsiblefor some of the differences seen between F/A-18 aircraft and model tests.
MODELS, FACILITIES, AND INSTRUMENTATION
The data presented in this paper were obtained from multiple wind-tunnel entries with severalF/A-18 6%- and 16%-scale models and flight tests that were conducted with the HARV. Theground and flight tests were coordinated as well as possible to obtain meaningful comparisonsbetween ground and flight data. This coordination included a common set of measurements, andflight conditions (α, β, and ) closely matched to the wind tunnel conditions. Also, for modelM∞
4

data, all leading- and trailing-edge flap positions were made consistent with the flight vehicleconfiguration at that flight condition. The configuration that was tested on the HARV at α ≥ 26°and ≤ 0.76 was = 33° and = 0°.
6% Models
There were two 6% model configurations that are reported herein. The first is referred to as theMD/Navy 6% model (fig. 1). This model is the 6% wind-tunnel model originally used byMcDonnell Douglas (St. Louis, Missouri) and the U.S. Navy during the design and test of theF/A-18, which was tested in the current F/A-18 configuration. The second 6% model consisted ofthe back end of the MD/Navy 6% model with a more recently constructed and instrumented fore-body section (from nose apex back to LEX/wing juncture). This forebody had pressure ports fromthe nose back to the mid LEX region and is referred to as the NASA 6% model (fig. 2). Thus, thesetwo models/configurations shared the same wings, empennage, and support system hardware. Thepressure instrumentation consisted of 440 pressure orifices distributed circumferentially at 5 sta-tions on the nose and spanwise at 3 stations across the LEXs, as shown in figure 3. The pressureswere measured by internally mounted electronic scanning pressure modules located within theforebody. The on-surface flow visualizations were obtained with a mixture of titanium dioxide(TiO2), mineral oil, and a small amount of oleic acid added for dispersion.14 The mixture wasapplied to the model, the tunnel was then brought on condition long enough for the mixture to set,and then rapidly brought to a static condition when photographic documentation was taken. Theoff-surface flow visualizations were obtained with water vapor (injected or natural) and a laserlight sheet in the wind tunnel, this was recorded with video cameras.15 The 6% model wind-tunnel
M∞ δLE δTE
960789
Figure 1. MD/Navy 6% F/A-18 model in the NASA Langley 7- × 10-ft High Speed Tunnel.
5
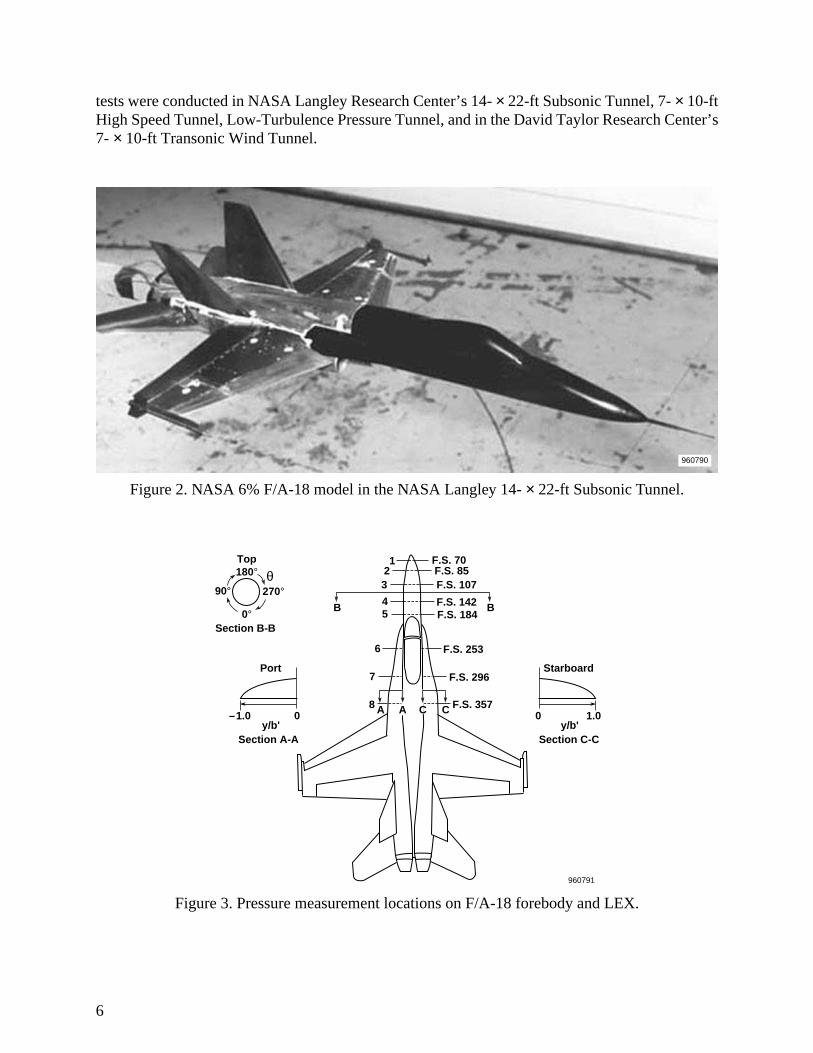
tests were conducted in NASA Langley Research Center’s 14- × 22-ft Subsonic Tunnel, 7- × 10-ftHigh Speed Tunnel, Low-Turbulence Pressure Tunnel, and in the David Taylor Research Center’s7- × 10-ft Transonic Wind Tunnel.
Figure 2. NASA 6% F/A-18 model in the NASA Langley 14- × 22-ft Subsonic Tunnel.
Figure 3. Pressure measurement locations on F/A-18 forebody and LEX.
960790
F.S. 70F.S. 85F.S. 107
F.S. 142F.S. 184
F.S. 253
F.S. 296
F.S. 357
123
45
270°
0°
Top
Section B-B
Section A-A Section C-C
Port Starboard
y/b' y/b'0 0–1.0 1.0
90°
180°
6
B B
7
8 A A C C
960791
θ
6
16% Models
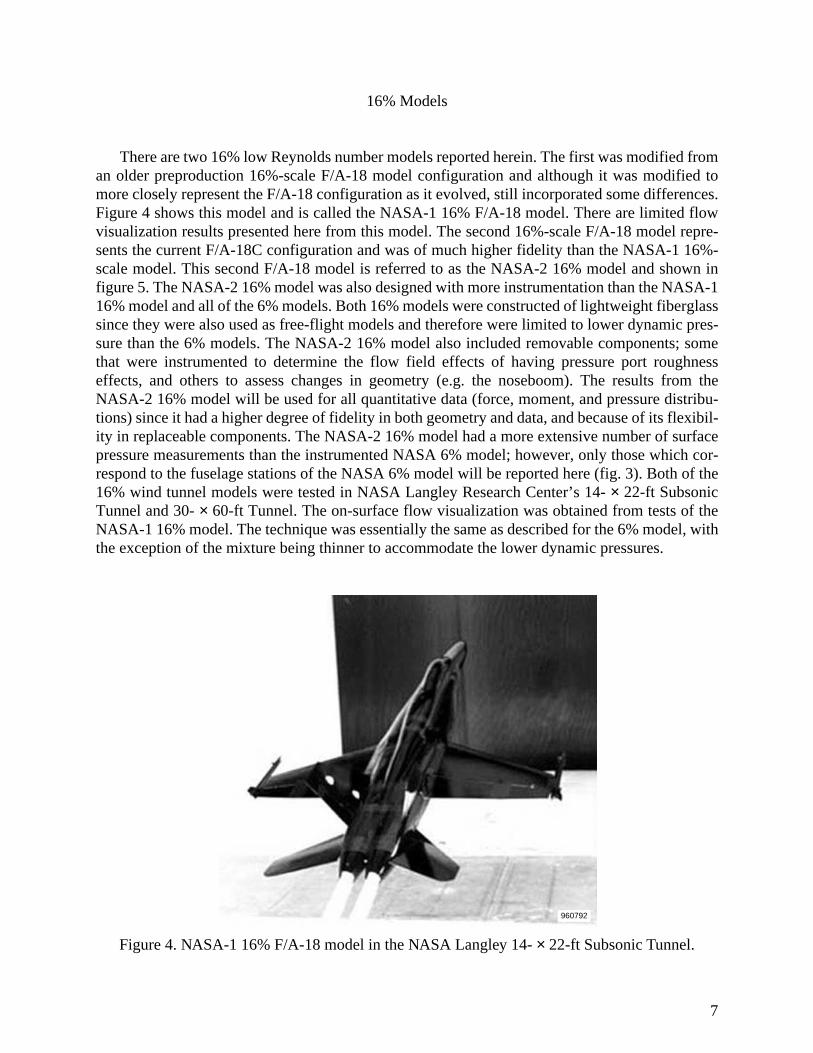
There are two 16% low Reynolds number models reported herein. The first was modified froman older preproduction 16%-scale F/A-18 model configuration and although it was modified tomore closely represent the F/A-18 configuration as it evolved, still incorporated some differences.Figure 4 shows this model and is called the NASA-1 16% F/A-18 model. There are limited flowvisualization results presented here from this model. The second 16%-scale F/A-18 model repre-sents the current F/A-18C configuration and was of much higher fidelity than the NASA-1 16%-scale model. This second F/A-18 model is referred to as the NASA-2 16% model and shown infigure 5. The NASA-2 16% model was also designed with more instrumentation than the NASA-116% model and all of the 6% models. Both 16% models were constructed of lightweight fiberglasssince they were also used as free-flight models and therefore were limited to lower dynamic pres-sure than the 6% models. The NASA-2 16% model also included removable components; somethat were instrumented to determine the flow field effects of having pressure port roughnesseffects, and others to assess changes in geometry (e.g. the noseboom). The results from theNASA-2 16% model will be used for all quantitative data (force, moment, and pressure distribu-tions) since it had a higher degree of fidelity in both geometry and data, and because of its flexibil-ity in replaceable components. The NASA-2 16% model had a more extensive number of surfacepressure measurements than the instrumented NASA 6% model; however, only those which cor-respond to the fuselage stations of the NASA 6% model will be reported here (fig. 3). Both of the16% wind tunnel models were tested in NASA Langley Research Center’s 14- × 22-ft SubsonicTunnel and 30- × 60-ft Tunnel. The on-surface flow visualization was obtained from tests of theNASA-1 16% model. The technique was essentially the same as described for the 6% model, withthe exception of the mixture being thinner to accommodate the lower dynamic pressures.
Figure 4. NASA-1 16% F/A-18 model in the NASA Langley 14- × 22-ft Subsonic Tunnel.
960792
7

Figure 5. NASA-2 16% F/A-18 model in the NASA Langley 30- × 60-ft Tunnel.
HARV Flight Tests
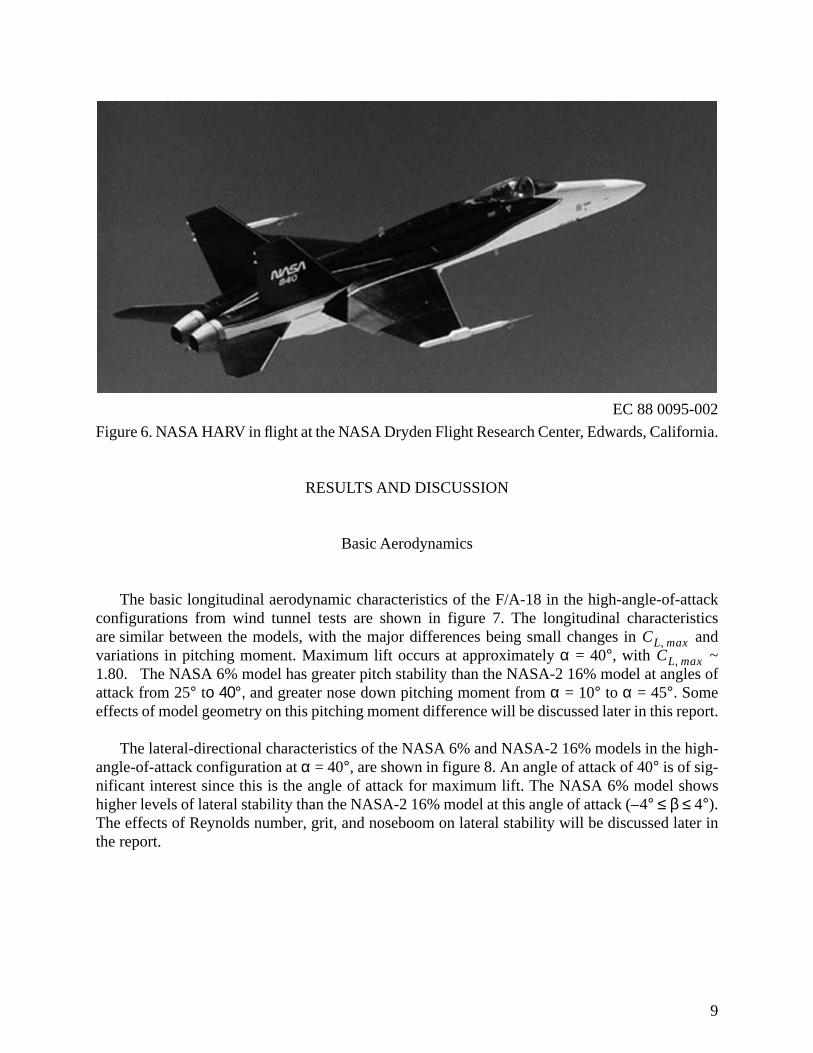
Dedicated flight tests were conducted with the F-18 HARV at the NASA Dryden FlightResearch Center, Edwards, California (fig. 6). Although the vehicle was heavily modified for var-ious phases of the program,16,17 the data shown in this report apply to the basic F/A-18 configura-tion. Some data were obtained with and some without the LEX fences that are part of the currentF/A-18 configuration. The F/A-18 HARV has both leading- and trailing-edge flaps that are sched-uled with angle of attack and Mach number. At α ≥ 26° and M ≤ 0.76 the leading-edge flaps aredeflected to their maximum of 33° and the trailing-edge flaps are set to 0°. The HARV was flownin the F/A-18 fighter-escort configuration, without stores, and the wingtip missile rails were mod-ified to carry special camera pods and wingtip airdata probes. Also the HARV was tested predom-inantly without LEX fences installed. The HARV was instrumented with surface pressure ports18
at the same fuselage stations as shown in figure 3 for the 6% model. On-surface flow visualizationwas obtained in flight with a mixture of an evaporating fluid and dye.19 The fluid and dye mixturewas pumped out of the ports, which were later used for pressure measurements. The dye patternsset quickly as the fluid evaporated and were preserved until postflight photos could be obtained.Off-surface flow visualization was obtained in flight with injected smoke at the apex of the LEX’sand nose.20,21
Except where noted, all data presented was obtained from configurations without noseboomsor LEX fences. Also, except where noted, all wind tunnel data was obtained from models with onlythe nosering grit pattern used for low-angle-of-attack forebody transition fixing, but not the twinstrips grit pattern used for high-angle-of-attack forebody crossflow transition.
960793
8
EC 88 0095-002
Figure 6. NASA HARV in flight at the NASA Dryden Flight Research Center, Edwards, California.
RESULTS AND DISCUSSION
Basic Aerodynamics
The basic longitudinal aerodynamic characteristics of the F/A-18 in the high-angle-of-attackconfigurations from wind tunnel tests are shown in figure 7. The longitudinal characteristicsare similar between the models, with the major differences being small changes in andvariations in pitching moment. Maximum lift occurs at approximately α = 40°, with ~1.80. The NASA 6% model has greater pitch stability than the NASA-2 16% model at angles ofattack from 25° tο 40°, and greater nose down pitching moment from α = 10° to α = 45°. Someeffects of model geometry on this pitching moment difference will be discussed later in this report.
The lateral-directional characteristics of the NASA 6% and NASA-2 16% models in the high-angle-of-attack configuration at α = 40°, are shown in figure 8. An angle of attack of 40° is of sig-nificant interest since this is the angle of attack for maximum lift. The NASA 6% model showshigher levels of lateral stability than the NASA-2 16% model at this angle of attack (– 4° ≤ β ≤ 4°).The effects of Reynolds number, grit, and noseboom on lateral stability will be discussed later inthe report.
CL max,CL max,
9

Figure 7. Longitudinal aerodynamics of F/A-18 models. β = 0°, = 33°, = 0°, = –12°.
The on-surface flow characteristics of the NASA-1 16% model at α = 36° and MD/Navy 6%models at α = 35° (both at ~ 1 million) are shown in the oil flow visualization of figures 9 and10 respectively. While the two models were tested at nearly the same Reynolds number and angleof attack the forebody flow field visualizations show some significant differences. The most nota-ble features on the NASA-1 16% model are a void region, seen in black, extending approximatelyfrom just behind the nose apex aft to the LEX juncture. This feature is most likely a laminar sepa-ration bubble, which would indicate that the flow upstream of it is laminar. On the front half of thenose the void is terminated by streamlines in an opposing direction. These lines indicate that theflow has separated aft of the bubble in this region (most likely laminar separation). On the rear halfof the nose the void region is terminated by an almond-shaped region where the streamlines are inthe same general direction as prior to the bubble. This evidence indicates a turbulent reattachmentin this region. The streamlines in this almond-shaped region show a difference in the texture,appearance of higher surface shear can be noticed, a further indication that the flow in this smallregion is turbulent. On the leeward side of the model additional voided regions are noticed whichappear to be caused by the impingement of the secondary separation vortex. These voided regionspropagate over the canopy. A similar feature is seen near the leading edge of the LEX. Overall, thenature of the flow field of the NASA-1 16% model forebody is transitional, mostly laminar withsmall areas of turbulent flow.
–10 0 10 20 30 40 50 60 0 .2 .4 .8
CD
.6 1.21.0 1.4 1.6α, deg
960794
2.5
2.0
1.5
1.0
.5
0
–.5
–.2
–.1
0
.1
.2
.3
CL
Cm
Facility
30– x 60– ft 7– x 10– ft HST
M∞0.08 0.30
Model
NASA-2 16% NASA 6%
Rec 1 x 10⁶ 1.4 x 10⁶
δ fLE δ fTE δHT
Rec
10
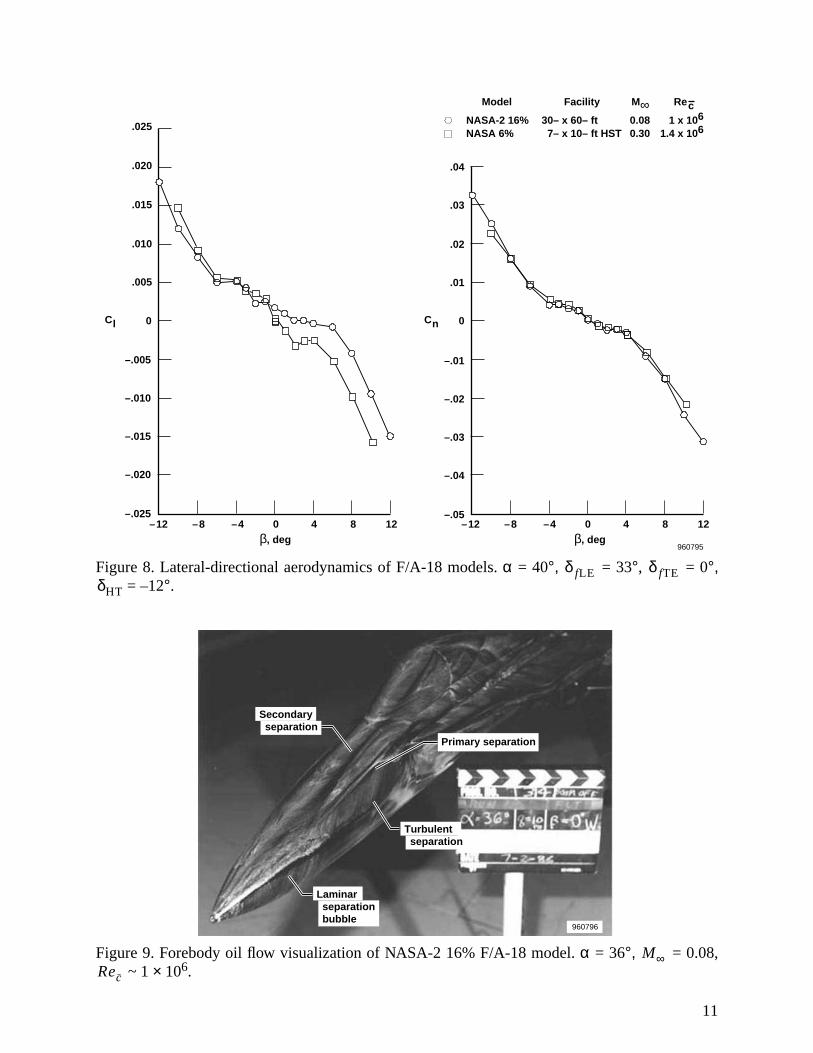
Figure 8. Lateral-directional aerodynamics of F/A-18 models. α = 40°, = 33°, = 0°, = –12°.
Figure 9. Forebody oil flow visualization of NASA-2 16% F/A-18 model. α = 36°, = 0.08, ~ 1 × 10⁶.
.005
.010
.015
.020
.025
0 0
–.05
–.04
–.03
–.02
.01
.02
.03
.04
–.01
–.025
–.020
–.015
–.010
–.005
Cl Cn
–12 –8 –4 0 4 8 12 –12 –8 –4 0 4 8 12β, deg β, deg
960795
Facility
30– x 60– ft 7– x 10– ft HST
M∞0.08 0.30
Model
NASA-2 16% NASA 6%
Rec 1 x 10⁶ 1.4 x 10⁶
δ fLE δ fTEδHT
Laminar separation bubble
Primary separation
960796
Secondary separation
Turbulent separation
M∞Rec
11

Figure 10. Forebody oil flow visualization of NASA 6% F/A-18 model: two views α = 36°, =0.22, ~ 1 × 10⁶.
The surface flow of the MD/Navy 6% model, shown in figure 10, indicates some distinct dif-ferences from that of the NASA-1 16% model, even though they were tested at nearly the sameReynolds number and angle of attack. This model does not show any of the laminar separation bub-bles that were prominent on the NASA-1 16% model. The MD/Navy 6% model does show a pool-ing near the 90° and 270° positions close to 2/3 the length of the nose, which would indicatelaminar separation. Aft of this the flow appears to remain attached. There are no voided regions onthe leeward side. There is a demarcation which is most likely caused by secondary separation, butis significantly weaker than that seen with the NASA-1 16% model and terminates at the LEXapex. Overall, the MD/Navy 6% model also appears to be transitional but with different featuresthan that of the NASA-1 16% model. Some of these differences can be attributed to differences in
Primary separation
960797
Secondary separation
960798
M∞Rec
12

dynamic pressure and to the viscosity effects of the oil on changing the local geometry. TheMD/Navy 6% model was tested at a higher dynamic pressure and thus the oil mixture was some-what more viscous, so the smaller model would also be more prone to local variations in geometryfrom the oil. The extent of transitional flow on the MD/Navy 6% forebody was more difficult todetermine than the NASA-1 16% because of effects of the oil on the MD/Navy 6% model and theresultant patterns. However, it appears that the flow field present (extent of transitional flow) onthe forebody of each model was different even though this visualization was obtained at nearly thesame Reynolds number.
On-surface flow characteristics of the HARV at α = 34°, and = 0.3 are shown in figure 11.The HARV displays a similar surface topology to that of the models with some notable differences.The forebody flow of the HARV appears to be fully turbulent aft of the radome. There is a smallrun of laminar flow on the radome, but it has fully transitioned by FS 107.8 Recall that the NASA-116% model showed a significant vortex structure pass over the canopy and the MD/Navy 6%,under some conditions, showed a similar although less defined vortex which did not propagate overthe canopy. Although the HARV had no flow visualization on the canopy the secondary separationlines are well defined up to the canopy.
Figure 11. Forebody flow visualization of NASA HARV. α = 34°, = 0.3, ~ 8.5 × 10⁶.
The off-surface flow visualization of the HARV at α = 39°, and = 0.24 is shown infigure 12. This flow visualization was obtained with smoke injection into the feeding sheet of theforebody vortex and natural condensation in the LEX vortex. The off-surface visualization(fig. 12) shows the vortices propagating over the canopy and interacting with the LEX vortex. It ispresumed that this type of interaction is also present on the models at some conditions, but itappears not to be present at many of the conditions tested.
M∞
Secondary separation
Primary separation
960799
M∞ Rec
M∞
13
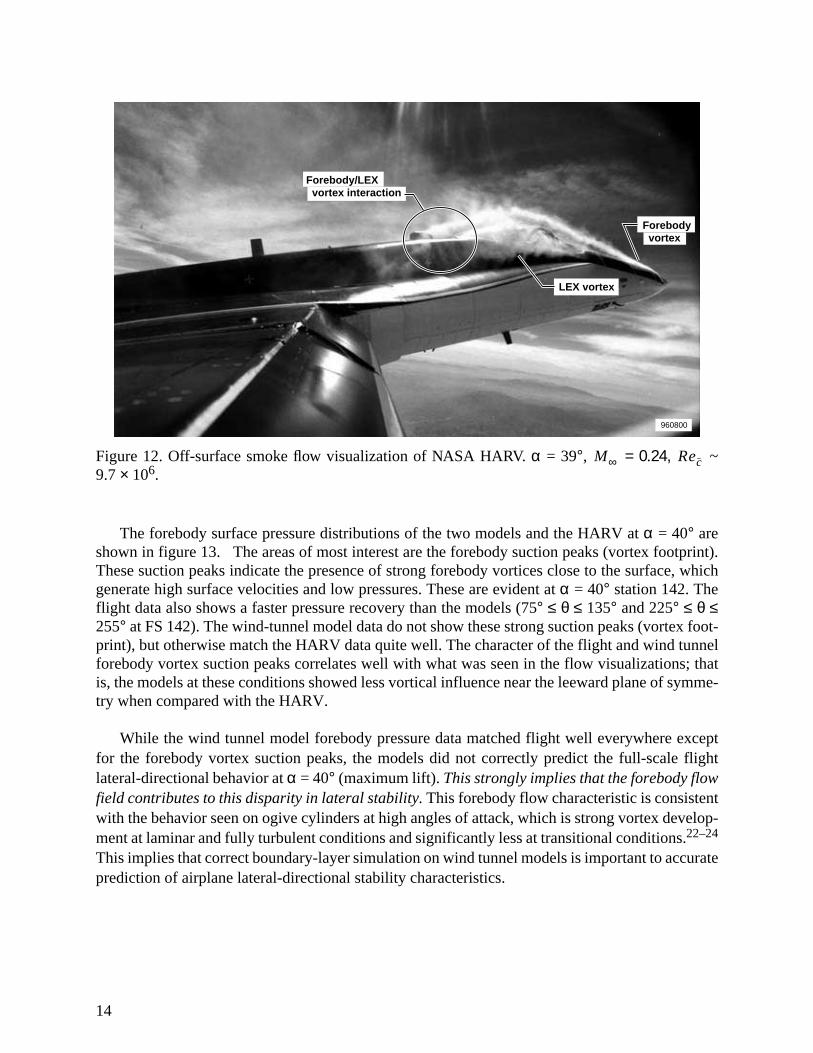
Figure 12. Off-surface smoke flow visualization of NASA HARV. α = 39°, = 0.24, ~9.7 × 10⁶.
The forebody surface pressure distributions of the two models and the HARV at α = 40° areshown in figure 13. The areas of most interest are the forebody suction peaks (vortex footprint).These suction peaks indicate the presence of strong forebody vortices close to the surface, whichgenerate high surface velocities and low pressures. These are evident at α = 40° station 142. Theflight data also shows a faster pressure recovery than the models (75° ≤ θ ≤ 135° and 225° ≤ θ ≤255° at FS 142). The wind-tunnel model data do not show these strong suction peaks (vortex foot-print), but otherwise match the HARV data quite well. The character of the flight and wind tunnelforebody vortex suction peaks correlates well with what was seen in the flow visualizations; thatis, the models at these conditions showed less vortical influence near the leeward plane of symme-try when compared with the HARV.
While the wind tunnel model forebody pressure data matched flight well everywhere exceptfor the forebody vortex suction peaks, the models did not correctly predict the full-scale flightlateral-directional behavior at α = 40° (maximum lift). This strongly implies that the forebody flowfield contributes to this disparity in lateral stability. This forebody flow characteristic is consistentwith the behavior seen on ogive cylinders at high angles of attack, which is strong vortex develop-ment at laminar and fully turbulent conditions and significantly less at transitional conditions.22–24
This implies that correct boundary-layer simulation on wind tunnel models is important to accurateprediction of airplane lateral-directional stability characteristics.
960800
Forebody/LEX vortex interaction
LEX vortex
Forebody vortex
M∞ Rec
14
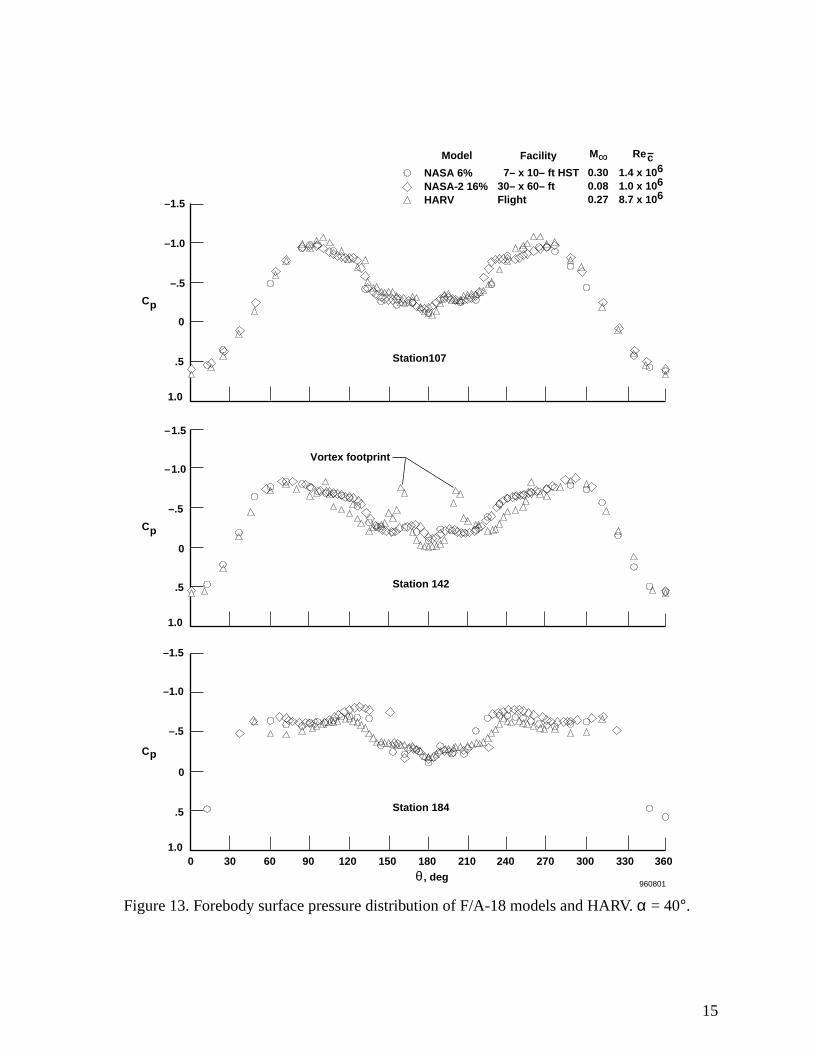
Figure 13. Forebody surface pressure distribution of F/A-18 models and HARV. α = 40°.
1.0
.5
0
–.5
–1.0
–1.5
Cp
Station107
1.0
.5
0
–.5
–1.0
–1.5
Cp
Station 142
0 30 60 90 120 150 180 210 240 270 300 330 360θ , deg
1.0
.5
0
–.5
–1.0
–1.5
Cp
Station 184
Vortex footprint
960801
Model
NASA 6% NASA-2 16% HARV
Facility
7– x 10– ft HST 30– x 60– ft Flight
M∞0.30 0.08 0.27
Rec1.4 x 106 1.0 x 10⁶ 8.7 x 10⁶
15

Mach Effects
Effects of compressibility become apparent at transonic conditions when local shock waves de-velop. These shock waves cause premature boundary-layer separation and vortex bursting,25 andchange the nature of the highly interactive separated flow field. The result is seen in nonlinear aero-dynamics at high angles of attack. However, where significant local flow acceleration occurseffects can be seen at significantly lower free-stream Mach numbers. Highly cambered or sweptsurfaces with sharp leading edges (e.g. strakes and LEXs) may show some compressibility effectseven below = 0.3.
The effects of Mach number on lateral-directional characteristics for the MD/Navy 6% modelis shown in figure 14. These effects are only shown for the MD/Navy 6% model, since the 16%model was limited to low dynamic pressures. These tests were conducted at the David TaylorResearch Center 7- × 10-ft Transonic Tunnel, which runs at reduced total pressure at higher Machnumbers. This reduced, but did not eliminate, variation in Reynolds number with Mach number.There are significant changes in the lateral-directional stability for increasing Mach numbers. Fig-ure 14 shows the basic trend, which is an increase in lateral stability and a decrease in directionalstability with increasing Mach number and increasing angle of attack at angles of attack α > 30°
M∞
M∞0.40 0.60 0.70 0.80 0.90
0 5 10 15 20 25 30 35 40 45 50 55 60α, deg
960802
.002
0
–.002
–.004
.002
.004
0
–.002
–.004
–.006
Clβ
Cnβ
Figure 14. Effects of Mach number on lateral-directional stability of NASA 6% F/A-18 models. = 33°, = 0°, 0° ≤ β ≤ 4°.δ fLE δ fTE
16
and < 0.9. At = 0.9 there is no change in lateral stability from = 0.8 and directionalstability increases slightly for increasing angles of attack. At high angles of attack is a stron-ger influence on departure resistance than is , and it is typical for fighter-type configurationsto have directional instability at high angles of attack. Gradual changes at lower Mach numbersare likely caused by locally transonic effects in the vortices. The large changes in between
= 0.6 and = 0.7 are most likely a result of the formation of local shocks on the wing andLEXs. In general the MD/Navy 6% model displays laterally stable behavior above α = 10° andthrough = 0.9. This trend had typically been observed throughout the early development ofthe F/A-18 aircraft.
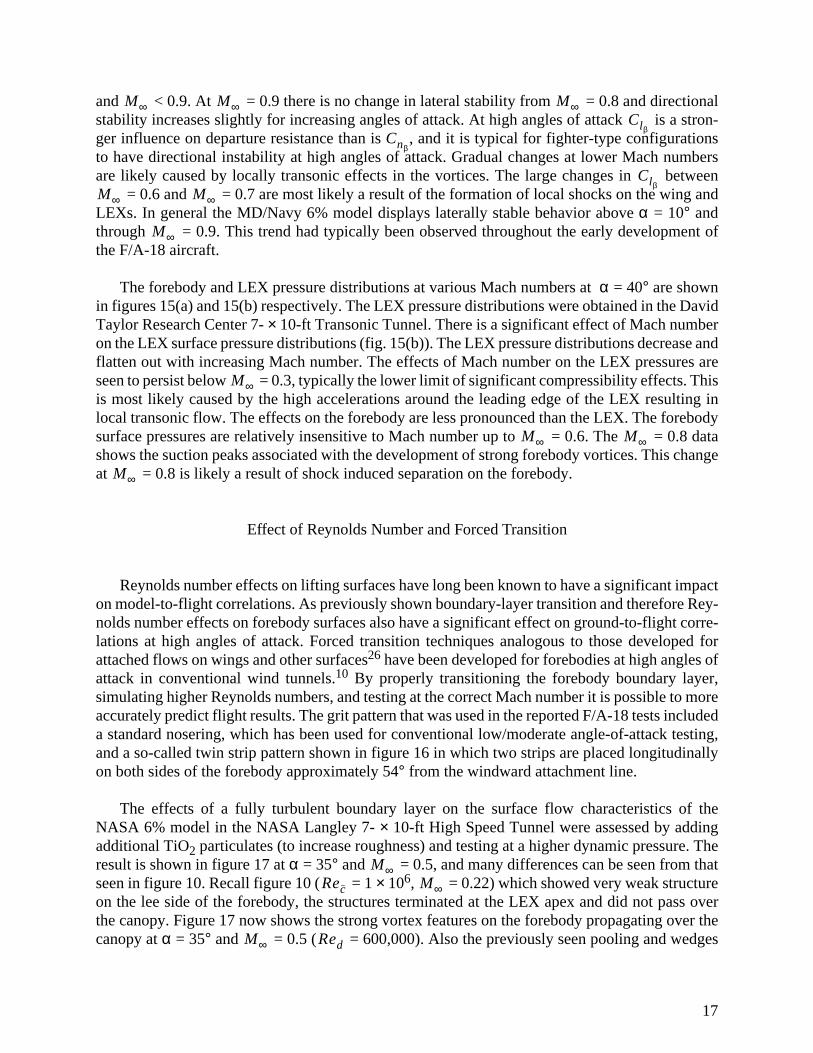
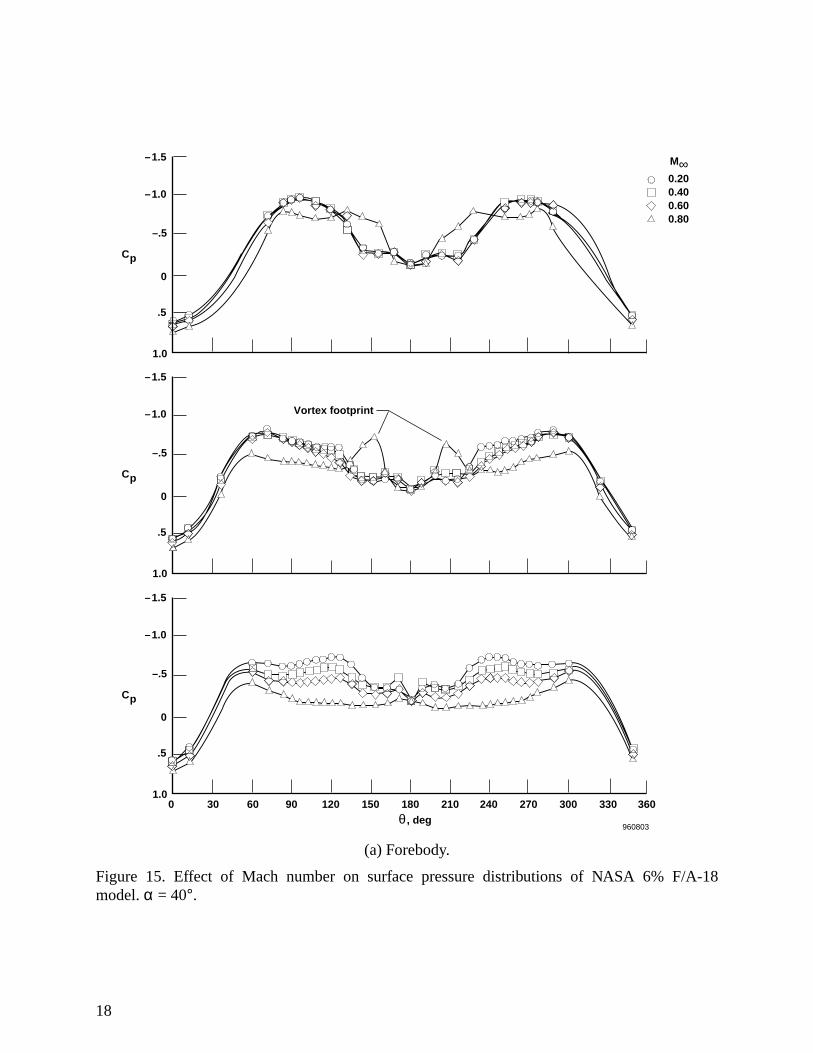
The forebody and LEX pressure distributions at various Mach numbers at α = 40° are shownin figures 15(a) and 15(b) respectively. The LEX pressure distributions were obtained in the DavidTaylor Research Center 7- × 10-ft Transonic Tunnel. There is a significant effect of Mach numberon the LEX surface pressure distributions (fig. 15(b)). The LEX pressure distributions decrease andflatten out with increasing Mach number. The effects of Mach number on the LEX pressures areseen to persist below = 0.3, typically the lower limit of significant compressibility effects. Thisis most likely caused by the high accelerations around the leading edge of the LEX resulting inlocal transonic flow. The effects on the forebody are less pronounced than the LEX. The forebodysurface pressures are relatively insensitive to Mach number up to = 0.6. The = 0.8 datashows the suction peaks associated with the development of strong forebody vortices. This changeat = 0.8 is likely a result of shock induced separation on the forebody.
Effect of Reynolds Number and Forced Transition
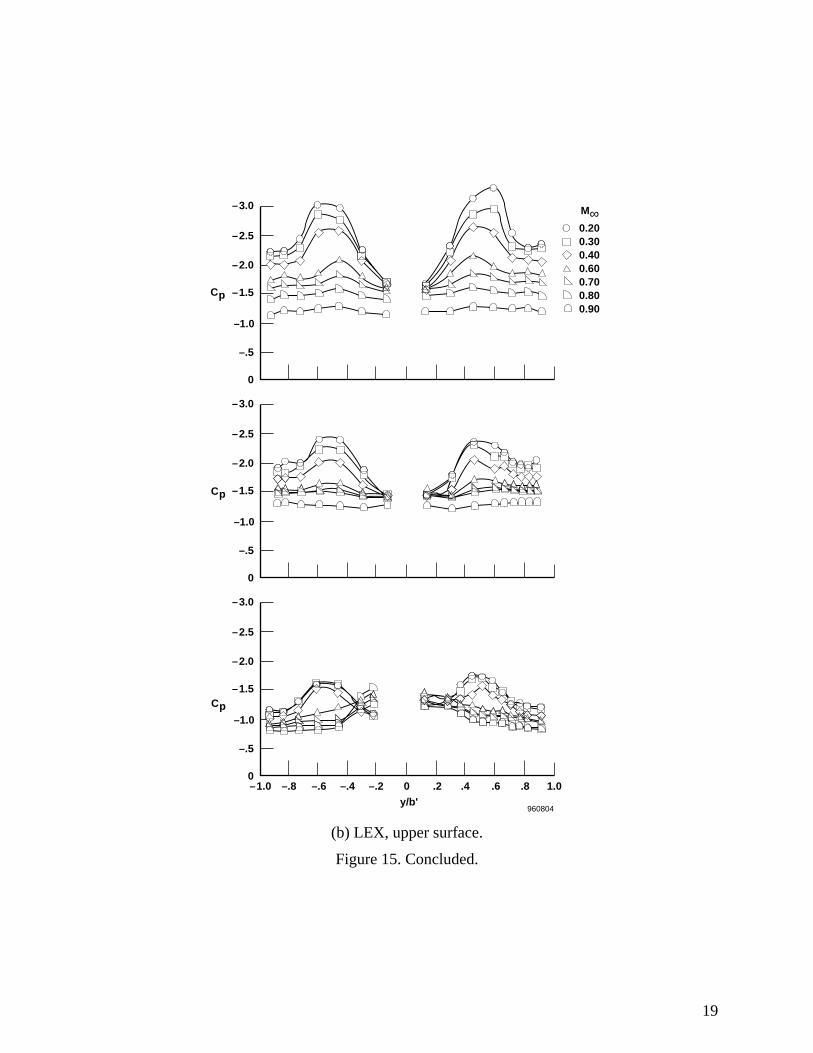
Reynolds number effects on lifting surfaces have long been known to have a significant impacton model-to-flight correlations. As previously shown boundary-layer transition and therefore Rey-nolds number effects on forebody surfaces also have a significant effect on ground-to-flight corre-lations at high angles of attack. Forced transition techniques analogous to those developed forattached flows on wings and other surfaces26 have been developed for forebodies at high angles ofattack in conventional wind tunnels.10 By properly transitioning the forebody boundary layer,simulating higher Reynolds numbers, and testing at the correct Mach number it is possible to moreaccurately predict flight results. The grit pattern that was used in the reported F/A-18 tests includeda standard nosering, which has been used for conventional low/moderate angle-of-attack testing,and a so-called twin strip pattern shown in figure 16 in which two strips are placed longitudinallyon both sides of the forebody approximately 54° from the windward attachment line.
The effects of a fully turbulent boundary layer on the surface flow characteristics of theNASA 6% model in the NASA Langley 7- × 10-ft High Speed Tunnel were assessed by addingadditional TiO2 particulates (to increase roughness) and testing at a higher dynamic pressure. Theresult is shown in figure 17 at α = 35° and = 0.5, and many differences can be seen from thatseen in figure 10. Recall figure 10 ( = 1 × 10⁶, = 0.22) which showed very weak structureon the lee side of the forebody, the structures terminated at the LEX apex and did not pass overthe canopy. Figure 17 now shows the strong vortex features on the forebody propagating over thecanopy at α = 35° and = 0.5 ( = 600,000). Also the previously seen pooling and wedges
M∞ M∞ M∞Clβ
Cnβ
ClβM∞ M∞
M∞
M∞
M∞ M∞
M∞
M∞Rec M∞
M∞ Red
17
(a) Forebody.
Figure 15. Effect of Mach number on surface pressure distributions of NASA 6% F/A-18model. α = 40°.
M∞0.20 0.40 0.60 0.80
0 30 60 90 120 150 180 210 240 270 300 330 360θ , deg
960803
1.0
.5
0
–.5
–1.0
–1.5
Cp
1.0
.5
0
–.5
–1.0
–1.5
Cp
1.0
.5
0
–.5
–1.0
–1.5
Cp
Vortex footprint
18
(b) LEX, upper surface.
Figure 15. Concluded.
M∞0.20 0.30 0.40 0.60 0.70 0.80 0.90
–1.0 –.8 –.6 –.4 –.2 0 .2 .4 .6 .8 1.0y/b'
960804
0
–3.0
–2.5
–2.0
–1.5
–1.0
–.5
Cp
0
–3.0
–2.5
–2.0
–1.5
–1.0
–.5
Cp
0
–3.0
–2.5
–2.0
–1.5
–1.0
–.5
Cp
19
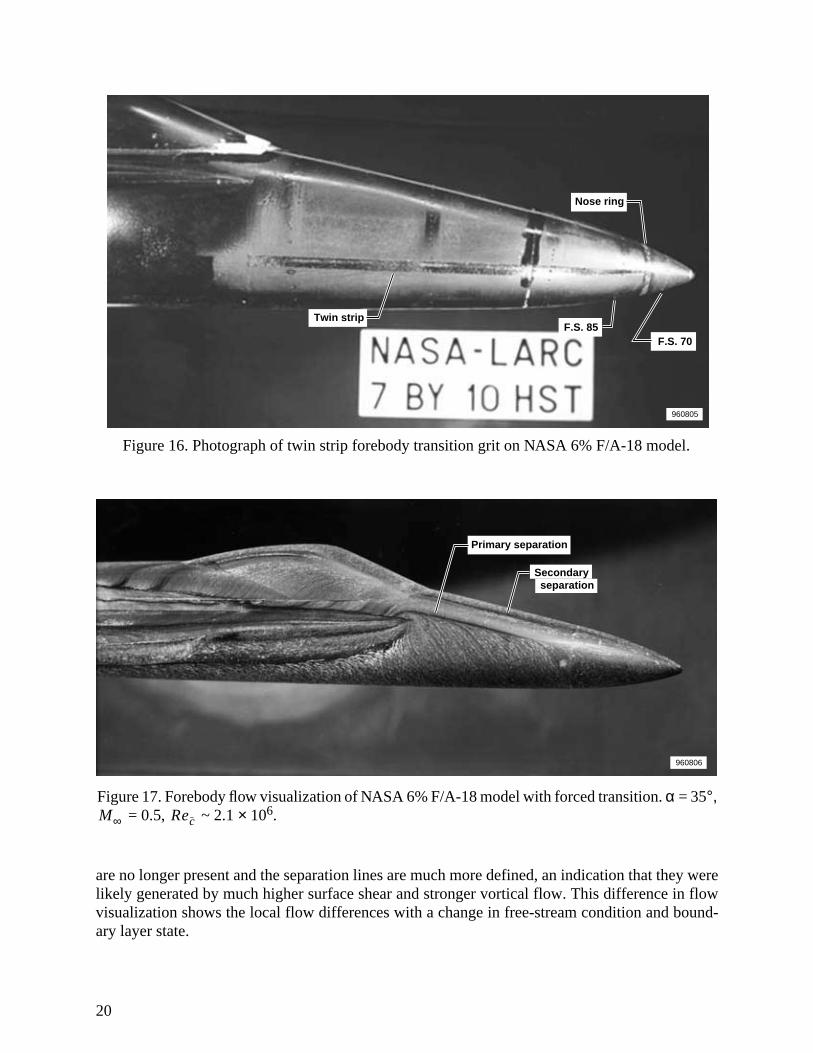
are no longer present and the separation lines are much more defined, an indication that they werelikely generated by much higher surface shear and stronger vortical flow. This difference in flowvisualization shows the local flow differences with a change in free-stream condition and bound-ary layer state.
960805
Twin strip
Nose ring
F.S. 85F.S. 70
960806
Secondary separation
Primary separation
Figure 16. Photograph of twin strip forebody transition grit on NASA 6% F/A-18 model.
Figure 17. Forebody flow visualization of NASA 6% F/A-18 model with forced transition. α = 35°, = 0.5, ~ 2.1 × 106.M∞ Rec
20

At high angles of attack the local surface flow has a significant component in the cross-flowdirection. Therefore, the twin strips are placed so that they transition each of the streamlines as theymove around the body. Figure 18 shows the surface pressure distribution at fuselage stations 107,142, and 184 with and without this fixed cross-flow transition at α = 36.4° and = 0.30. Thecomparison shows that the major effect is the much more evident vortex footprints (suction peaks
Grit patternNosering only Twin strips, no.180
Station107
Station 142
Station 184
Vortex footprint
0 30 60 90 120 150 180 210 240 270 300 330 360θ , deg
960807
1.0
.5
0
–.5
–1.0
–1.5
Cp
1.0
.5
0
–.5
–1.0
–1.5
Cp
1.0
.5
0
–.5
–1.0
–1.5
Cp
Figure 18. Effect of fixed transition on forebody pressure distribution of NASA 6% F/A-18 model.α = 36.4°, = 0.3, ~ 1.4 × 10⁶. M∞ Rec
M∞
21

at FS 142) on the leeward side when the crossflow is tripped. This, again, is evidence of the strengthof the forebody vortices, which are attenuated at transitional conditions.22,24 A comparison of the6% model test at α = 40° and = 0.30 with fixed cross-flow transition to the HARV is shownin figure 19. This shows a well-matched surface pressure distribution, with the forebody suctionpeaks just slightly lower for the NASA 6% model than for the HARV.
Figure 19. Comparison of forebody pressure distribution of NASA 6% F/A-18 model with fixedtransition (twin strips no. 180 grit) to HARV. α = 40°, = 0.3.
M∞
Station107
Station 142
Station 184
Vortex footprint
0 30 60 90 120 150 180 210 240 270 300 330 360θ , deg
960808
1.0
.5
0
–.5
–1.0
–1.5
Cp
1.0
.5
0
–.5
–1.0
–1.5
Cp
1.0
.5
0
–.5
–1.0
–1.5
Cp
Model
NASA 6% HARV
Facility
7– x 10– ft HST Flight
Rec 1.4 x 10⁶ 13.5 x 10⁶
M∞
22
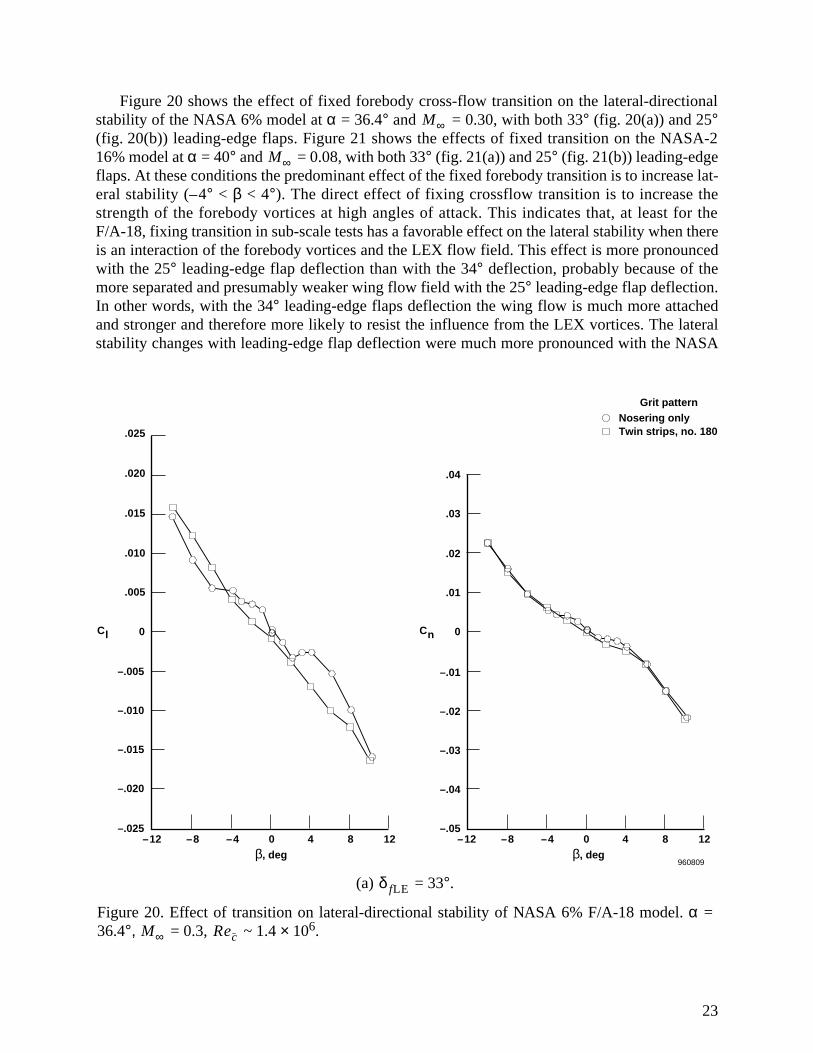
Figure 20 shows the effect of fixed forebody cross-flow transition on the lateral-directionalstability of the NASA 6% model at α = 36.4° and = 0.30, with both 33° (fig. 20(a)) and 25°(fig. 20(b)) leading-edge flaps. Figure 21 shows the effects of fixed transition on the NASA-216% model at α = 40° and = 0.08, with both 33° (fig. 21(a)) and 25° (fig. 21(b)) leading-edgeflaps. At these conditions the predominant effect of the fixed forebody transition is to increase lat-eral stability (– 4° < β < 4°). The direct effect of fixing crossflow transition is to increase thestrength of the forebody vortices at high angles of attack. This indicates that, at least for theF/A-18, fixing transition in sub-scale tests has a favorable effect on the lateral stability when thereis an interaction of the forebody vortices and the LEX flow field. This effect is more pronouncedwith the 25° leading-edge flap deflection than with the 34° deflection, probably because of themore separated and presumably weaker wing flow field with the 25° leading-edge flap deflection.In other words, with the 34° leading-edge flaps deflection the wing flow is much more attachedand stronger and therefore more likely to resist the influence from the LEX vortices. The lateralstability changes with leading-edge flap deflection were much more pronounced with the NASA
.005
.010
.015
.020
.025
0 0
–.04
–.05
–.03
–.02
.01
.02
.03
.04
–.01
–.025
–.020
–.015
–.010
–.005
Cl Cn
–12 –8 –4 0 4 8 12 –12 –8 –4 0 4 8 12β, deg β, deg
960809
Grit patternNosering only Twin strips, no. 180
(a) = 33°.
Figure 20. Effect of transition on lateral-directional stability of NASA 6% F/A-18 model. α =36.4°, = 0.3, ~ 1.4 × 10⁶.
δ fLE
M∞ Rec
M∞
M∞
23
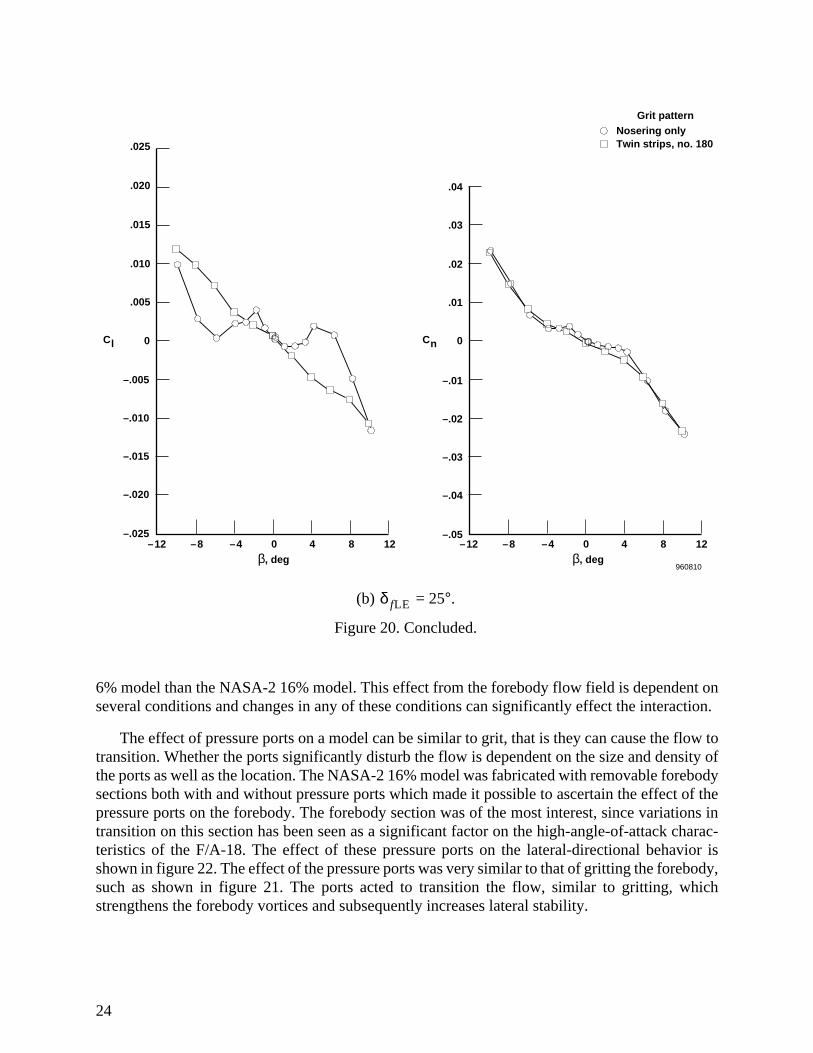
6% model than the NASA-2 16% model. This effect from the forebody flow field is dependent onseveral conditions and changes in any of these conditions can significantly effect the interaction.
The effect of pressure ports on a model can be similar to grit, that is they can cause the flow totransition. Whether the ports significantly disturb the flow is dependent on the size and density ofthe ports as well as the location. The NASA-2 16% model was fabricated with removable forebodysections both with and without pressure ports which made it possible to ascertain the effect of thepressure ports on the forebody. The forebody section was of the most interest, since variations intransition on this section has been seen as a significant factor on the high-angle-of-attack charac-teristics of the F/A-18. The effect of these pressure ports on the lateral-directional behavior isshown in figure 22. The effect of the pressure ports was very similar to that of gritting the forebody,such as shown in figure 21. The ports acted to transition the flow, similar to gritting, whichstrengthens the forebody vortices and subsequently increases lateral stability.
(b) = 25°.
Figure 20. Concluded.
δ fLE
.005
.010
.015
.020
.025
0 0
–.05
–.04
–.03
–.02
.01
.02
.03
.04
–.01
–.025
–.020
–.015
–.010
–.005
Cl Cn
–12 –8 –4 0 4 8 12 –12 –8 –4 0 4 8 12β, deg β, deg
960810
Grit patternNosering only Twin strips, no. 180
24

(a) = 33°.
Figure 21. Effect of transition on lateral-directional stability of NASA-2 16% F/A-18 model. α =40°, = 0.08, ~ 1 × 10⁶.
Geometry Effects
Geometry effects are an obvious area of concern for correlation between models and model toflight. Small geometry changes that have minimal impact at low angles of attack can have largeand pronounced effects at high angles of attack. For sharp and high fineness ratio forebodies at highangles of attack, even small variations at the nose can change the vortex shedding and the subse-quent flow field.27 The ramifications for high-angle-of-attack testing is that geometric fidelity inthe forebody region warrants serious attention. The conventional sensitivities for low/moderateangle-of-attack testing must still be taken into consideration.
.005
.010
.015
.020
.025
0 0
–.05
–.04
–.03
–.02
.01
.02
.03
.04
–.01
–.025
–.020
–.015
–.010
–.005
Cl Cn
–12 –8 –4 0 4 8 12 –12 –8 –4 0 4 8 DCβ, deg β, deg
960811
Grit patternNosering only Twin strips, + nosering
δ fLE
M∞ Rec
25
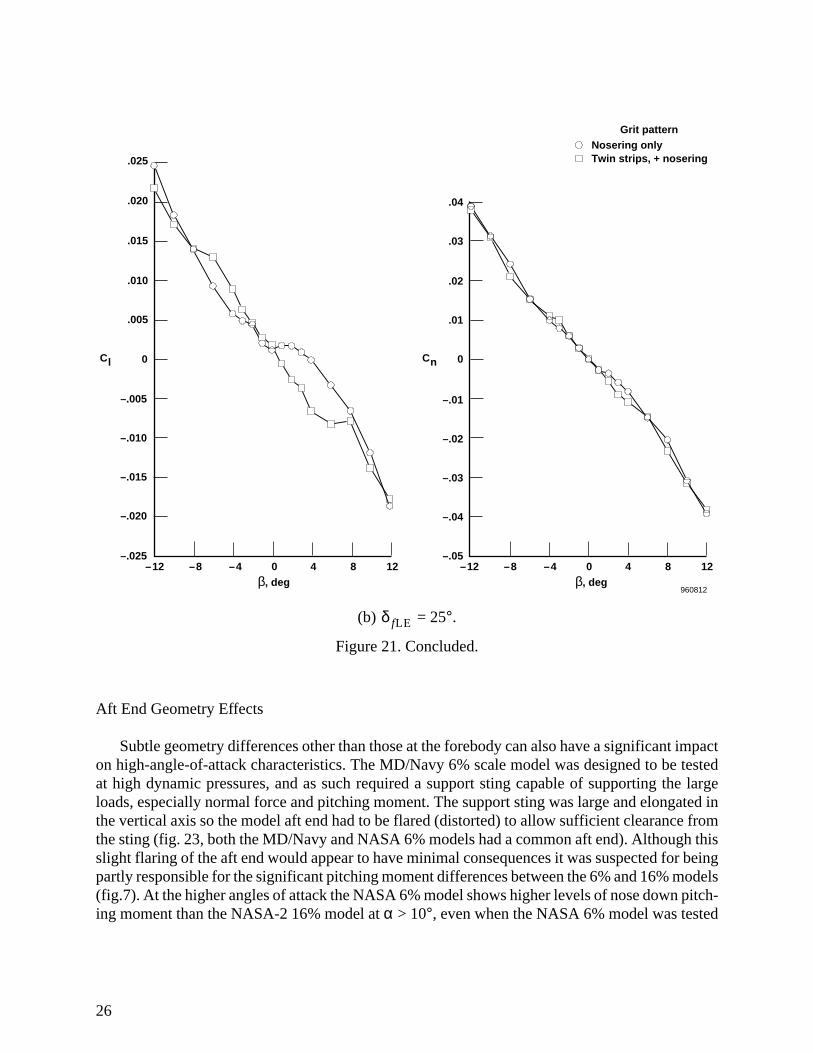
(b) = 25°.
Figure 21. Concluded.
Aft End Geometry Effects
Subtle geometry differences other than those at the forebody can also have a significant impacton high-angle-of-attack characteristics. The MD/Navy 6% scale model was designed to be testedat high dynamic pressures, and as such required a support sting capable of supporting the largeloads, especially normal force and pitching moment. The support sting was large and elongated inthe vertical axis so the model aft end had to be flared (distorted) to allow sufficient clearance fromthe sting (fig. 23, both the MD/Navy and NASA 6% models had a common aft end). Although thisslight flaring of the aft end would appear to have minimal consequences it was suspected for beingpartly responsible for the significant pitching moment differences between the 6% and 16% models(fig.7). At the higher angles of attack the NASA 6% model shows higher levels of nose down pitch-ing moment than the NASA-2 16% model at α > 10°, even when the NASA 6% model was tested
.005
.010
.015
.020
.025
0 0
–.04
–.05
–.03
–.02
.01
.02
.03
.04
–.01
–.025
–.020
–.015
–.010
–.005
Cl Cn
–12 –8 –4 0 4 8 12 –12 –8 –4 0 4 8 12β, deg β, deg
960812
Grit patternNosering only Twin strips, + nosering
δ fLE
26

27
Figure 23. Photograph of NASA 6% F/A-18 model showing aft end flare.
.005
.010
.015
.020
.025
0 0
–.05
–.04
–.03
–.02
.01
.02
.03
.04
–.01
–.025
–.020
–.015
–.010
–.005
Cl Cn
–12 –8 –4 0 4 8 12 –12 –8 –4 0 4 8 12β, deg β, deg
960813
ForebodyPressure instrumented Non-pressure instrumented
Figure 22. Effect of pressure ports on lateral-directional aerodynamics of NASA-2 16% F/A-18model in the NASA Langley 30- × 60-ft Tunnel. α = 40°, = 0.08, = 33°, ~ 1 × 106.M∞ δ fLE Rec
960814
Aft-end flare
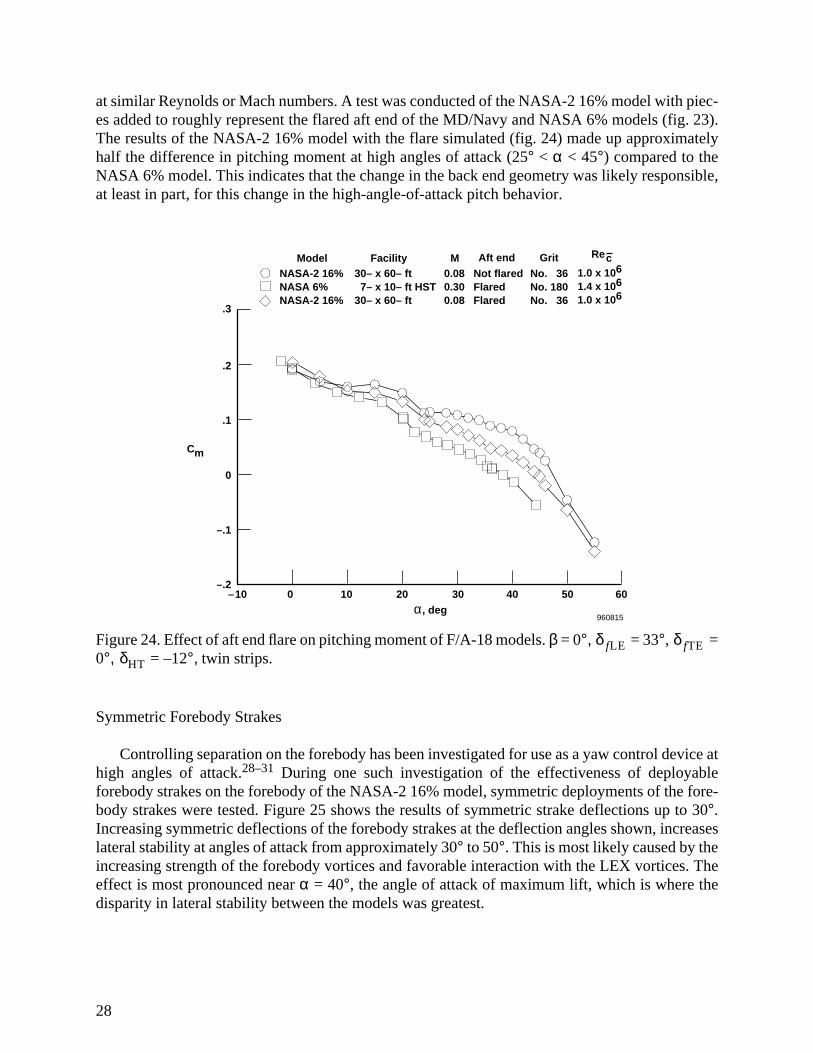
at similar Reynolds or Mach numbers. A test was conducted of the NASA-2 16% model with piec-es added to roughly represent the flared aft end of the MD/Navy and NASA 6% models (fig. 23).The results of the NASA-2 16% model with the flare simulated (fig. 24) made up approximatelyhalf the difference in pitching moment at high angles of attack (25° < α < 45°) compared to theNASA 6% model. This indicates that the change in the back end geometry was likely responsible,at least in part, for this change in the high-angle-of-attack pitch behavior.
Figure 24. Effect of aft end flare on pitching moment of F/A-18 models. β = 0°, = 33°, =0°, = –12°, twin strips.
Symmetric Forebody Strakes
Controlling separation on the forebody has been investigated for use as a yaw control device athigh angles of attack.28–31 During one such investigation of the effectiveness of deployableforebody strakes on the forebody of the NASA-2 16% model, symmetric deployments of the fore-body strakes were tested. Figure 25 shows the results of symmetric strake deflections up to 30°.Increasing symmetric deflections of the forebody strakes at the deflection angles shown, increaseslateral stability at angles of attack from approximately 30° to 50°. This is most likely caused by theincreasing strength of the forebody vortices and favorable interaction with the LEX vortices. Theeffect is most pronounced near α = 40°, the angle of attack of maximum lift, which is where thedisparity in lateral stability between the models was greatest.
–.2
–.1
0
.2
.3
.1
Cm
–10 0 10 20 30 40 50 60α, deg
960815
Facility30– x 60– ft 7– x 10– ft HST 30– x 60– ft
M0.08 0.30 0.08
ModelNASA-2 16% NASA 6% NASA-2 16%
Aft endNot flared Flared Flared
GritNo. 36 No. 180 No. 36
Rec1.0 x 106 1.4 x 10⁶ 1.0 x 10⁶
δ fLE δ fTEδHT
28
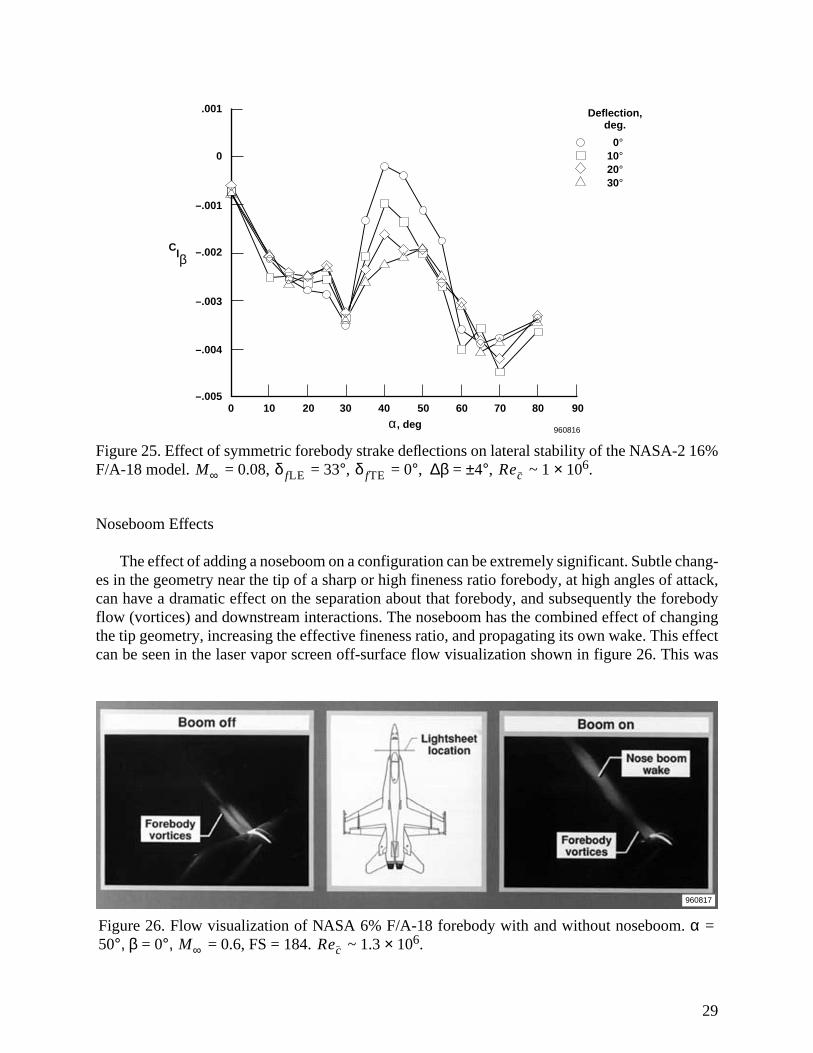
Figure 25. Effect of symmetric forebody strake deflections on lateral stability of the NASA-2 16%F/A-18 model. = 0.08, = 33°, = 0°, ∆β = ±4°, ~ 1 × 10⁶.
Noseboom Effects
The effect of adding a noseboom on a configuration can be extremely significant. Subtle chang-es in the geometry near the tip of a sharp or high fineness ratio forebody, at high angles of attack,can have a dramatic effect on the separation about that forebody, and subsequently the forebodyflow (vortices) and downstream interactions. The noseboom has the combined effect of changingthe tip geometry, increasing the effective fineness ratio, and propagating its own wake. This effectcan be seen in the laser vapor screen off-surface flow visualization shown in figure 26. This was
–.005
–.004
–.003
–.001
0
.001
–.002Clβ
0 10 20 30 40 50 60 70 80 90
α, deg960816
Deflection, deg.
0° 10° 20° 30°
M∞ δ fLE δ fTE Rec
Figure 26. Flow visualization of NASA 6% F/A-18 forebody with and without noseboom. α =50°, β = 0°, = 0.6, FS = 184. ~ 1.3 × 106.M∞ Rec
960817
29

obtained with the NASA 6% model at = 0.6 and α = 50°, at the David Taylor Research Center7- × 10-ft Transonic Tunnel.25 Although this was obtained at an angle of attack and Mach numbergreater than that discussed previously, it clearly shows the effect of the noseboom on the forebodyflow field. Without the boom a fairly symmetric pair of well developed vortices can be observedat a station just forward of the canopy junction. With the noseboom on, the forebody vortices aresignificantly diminished in size, no longer appear as two separate and distinct vortices, and a sig-nificant wake can clearly be seen, presumably generated by the boom itself.
The effects of the noseboom on the forebody surface streamlines of the NASA-1 16% modelat α = 40° are shown in figure 27. Figure 27(a) shows the forebody surface flow without the nose-boom and figure 27(b) shows the forebody surface flow at the same conditions with the noseboom.As would be expected with forebody vortices being attenuated, the surface streamlines are signif-icantly softened when compared to those of the forebody without the boom. There are also weakersecondary separation lines that do not persist over the canopy. Figure 28 shows the forebody sur-face pressure distribution of the NASA 6% model with and without the noseboom at α = 37° and
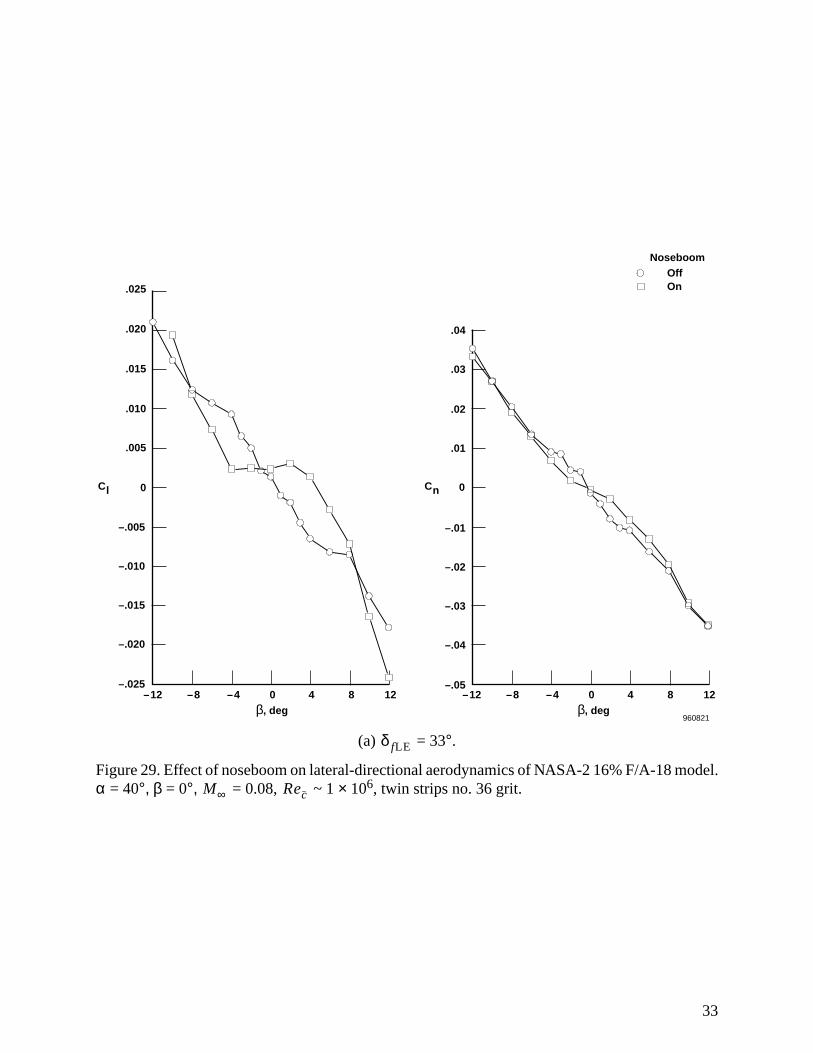
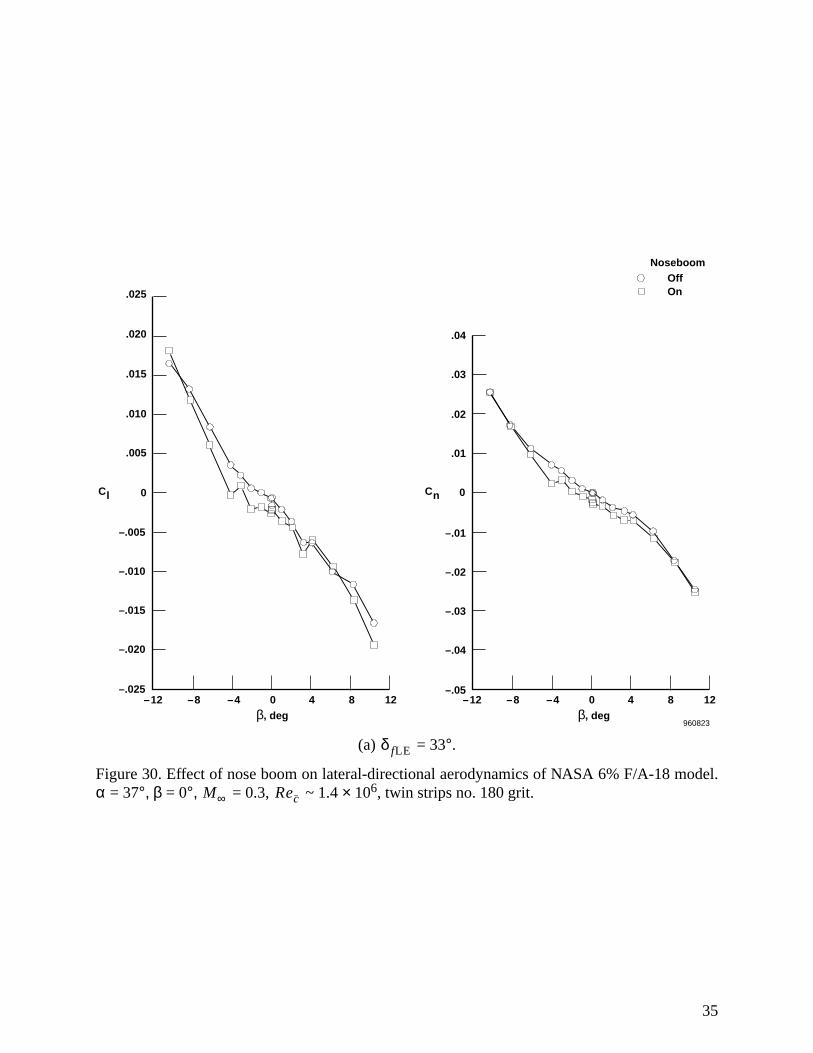
= 0.3. The major effect of the noseboom is to reduce the suction pressure peaks at FS 142, andshow an indication of reduced forebody vortex strength. The lateral-directional characteristics ofthe NASA-2 16% and NASA 6% models with and without the noseboom, at α = 40°, are shownin figures 29 and 30, respectively. However, even though the effect of the boom on the forebodyflow field is similar (reduced forebody vortex strength) between the two scale models, there is lessof a sensitivity from the boom on the lateral-directional behavior of the NASA-2 16% than theNASA 6% with = 33°.
Leading-Edge Flap Effects
Leading-edge flaps can have a significant influence in this forebody/ LEX flow interaction andtherefore high-angle-of-attack lateral-directional stability. By reducing wing separation at a givenangle of attack, leading-edge flaps can reduce the effects of the upstream flow field (i.e. the fore-body and LEX flow fields). In the case of F/A-18 development, the lateral instability that wasobserved in the region was alleviated by increasing the leading-edge flap deflection from25° to 33°. The effect of the leading-edge flap deflection and noseboom on lateral-directional sta-bility of the two models is shown in figure 29 for the NASA-2 16% (α = 40°) model and figure 30for the NASA 6% model (α = 37°). In both cases the destabilizing effect of the boom was reducedby increasing the leading-edge flap deflection. As seen previously the effect was more pronouncedon the NASA 6% model than on the NASA-2 16%. This delayed wing flow separation to a higherangle of attack, and lessened the unstable effects of the LEX vortices acting on the mostly separat-ed flow over the wing surfaces. Since the forebody vortices interact favorably with the LEX andthe noseboom disrupts the forebody flow field and attenuates the forebody vortices, the noseboomis a destabilizing influence. However, with the leading-edge flap deflection increased to 33° thisdestabilizing influence is mitigated as shown in figure 30(b). The NASA-2 16% model showedmuch less sensitivity in lateral aerodynamics from this change in flap deflection.
M∞
M∞
δ fLE
CL max,
30

Secondary separation
Laminar separation bubble
Primary separation
Turbulent region
960818
(a) Noseboom off.
Secondary separation
Laminar separation bubble
Primary separation
Turbulent region
960819
(b) Noseboom on.
Figure 27. Forebody flow visualization of NASA-2 16% F/A-18 model with and without nose-boom. α = 40°, β = 0°, = 0.08, ~ 1 × 106.M∞ Rec
31
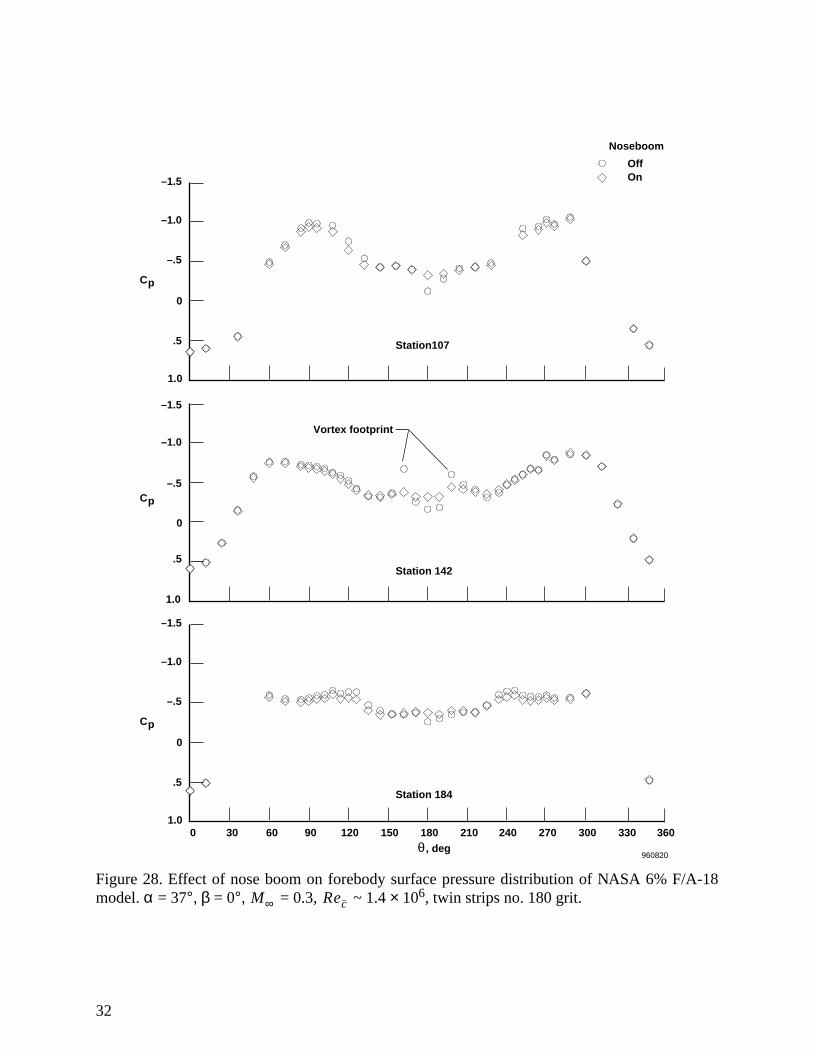
Figure 28. Effect of nose boom on forebody surface pressure distribution of NASA 6% F/A-18model. α = 37°, β = 0°, = 0.3, ~ 1.4 × 10⁶, twin strips no. 180 grit.
Station107
Station 142
Station 184
Vortex footprint
0 30 60 90 120 150 180 210 240 270 300 330 360θ , deg
960820
1.0
.5
0
–.5
–1.0
–1.5
Cp
1.0
.5
0
–.5
–1.0
–1.5
Cp
1.0
.5
0
–.5
–1.0
–1.5
Cp
Noseboom
Off On
M∞ Rec
32
(a) = 33°.
Figure 29. Effect of noseboom on lateral-directional aerodynamics of NASA-2 16% F/A-18 model.α = 40°, β = 0°, = 0.08, ~ 1 × 10⁶, twin strips no. 36 grit.
.005
0
.010
.015
.020
.025
–.025
–.020
–.015
–.010
–.005
Cl
–12 –8 –4 0 4 8 12β, deg
0
–.05
–.04
–.03
–.02
.01
.02
.03
.04
–.01
Cn
–12 –8 –4 0 4 8 12β, deg
960821
NoseboomOff On
δ fLE
M∞ Rec
33

(b) = 25°.
Figure 29. Concluded.
0
–.05
–.04
–.03
–.02
.01
.02
.03
.04
–.01
Cn
–12 –8 –4 0 4 8 12β, deg
960822
.005
0
.010
.015
.020
.025
–.025
–.020
–.015
–.010
–.005
Cl
–12 –8 –4 0 4 8 12β, deg
NoseboomOff On
δ fLE
34
(a) = 33°.
Figure 30. Effect of nose boom on lateral-directional aerodynamics of NASA 6% F/A-18 model.α = 37°, β = 0°, = 0.3, ~ 1.4 × 10⁶, twin strips no. 180 grit.
.005
0
.010
.015
.020
.025
–.025
–.020
–.015
–.010
–.005
Cl
–12 –8 –4 0 4 8 12β, deg
0
–.05
–.04
–.03
–.02
.01
.02
.03
.04
–.01
Cn
–12 –8 –4 0 4 8 12β, deg
960823
NoseboomOff On
δ fLE
M∞ Rec
35

(b) = 25°.
Figure 30. Concluded.
CONCLUDING REMARKS
A series of ground based and flight investigations have been conducted on the F/A-18 config-uration as part of the NASA High-Angle-of-Attack Technology Program. One of the objectives ofthese investigations was to determine the causes of disparities between ground and flight results.The results indicate that crossflow on the forebody, leading-edge extension (LEX) flow fields,nosebooms, and aft distortions can have a paramount effect on ground-to-flight correlation at highangles of attack.
The differences seen in various sub-scale model tests at high angles of attack are due in part tothe differences in forebody flow field and its subsequent interactions with the LEX and down-stream flow fields. The forebody flow field is most sensitive to Reynolds number which drives itsboundary layer state, and becomes increasingly important at high angles of attack. However, theLEX flow field is most sensitive to Mach number. It is difficult to match both conditions simulta-neously during ground tests. Therefore, significant interactions at full-scale flight conditions maynot be accurately predicted.
.005
0
.010
.015
.020
.025
–.025
–.020
–.015
–.010
–.005
Cl
–12 –8 –4 0 4 8 12β, deg
0
–.05
–.04
–.03
–.02
.01
.02
.03
.04
–.01
Cn
–12 –8 –4 0 4 8 12β, deg
960824
NoseboomOff On
δ fLE
36
Fixing transition can simulate higher forebody Reynolds numbers, and therefore providebetter predictions of full-scale flight results from sub-scale wind tunnel tests. At high angles ofattack it is necessary to fix crossflow transition on the forebody in addition to conventional transi-tion fixing for lower angles of attack. The twin strip technique has been shown to be effective onthe F/A-18 configuration.
Pressure ports and other subtle configuration differences can have a significant effect on theforebody flow field, and on the overall configuration flow field. The effect of pressure ports is toadd roughness similar to grit. These are more apparent at high angles of attack where the forebodyflow field becomes more significant.
Geometric differences can often have pronounced effects at high angles of attack. Aft end dis-tortions, due to wind tunnel support, on some F/A-18 models resulted in increased nose downpitching moments compared to the undistorted geometry. Symmetric forebody strakes can have asignificant effect on the forebody vortices and increase lateral stability of the F/A-18 at angles ofattack near that of maximum lift. Nose probes or other protuberances on the forebody, especiallynear the tip, have a significant influence on the forebody flow field. These influences can reduceforebody vortex strength at high angles of attack and cause a reduction in lateral stability on theF/A-18. Increasing leading-edge flap deflection at high angles of attack decreases wing flow sep-aration and reduces the effects of upstream influences; that is the LEX and forebody vortex flowsin the case of the F/A-18. The combined effect of the nose probe and reduced leading-edge flapdeflection can result in lateral instability at angles of attack near maximum lift for the F/A-18.
REFERENCES
1Gilbert, William P. and Gatlin, Donald H., “Review of the NASA High-Alpha TechnologyProgram,” High-Angle-of-Attack Technology Conference, NASA CR-3149, pt. 1, vol. 1, Oct. 30–Nov. 1, 1992, pp. 23–59.
2Lee, B.H.K., Brown, D., Zgela, M., and Poirel, D., “Wind Tunnel Investigation and FlightTests of Tail Buffet on the CF-18 Aircraft,” AGARD Specialists' Meeting on Aircraft Loads due toFlow Separation, Sorrento, Italy, Apr. 1–6, 1990.
3Meyn, L.A. and James, K.D., “Full-Scale Wind Tunnel Studies of F/A-18 Tail Buffet,” AIAA-93-3519, Monterey, CA, 1993.
4Meyn, L.A., James, K.D., and Geenen, R.J., Correlation of F/A-18 Tail Buffet Results, NASACP 10143, Fourth High Alpha Conference, NASA Dryden Flight Research Center, Edwards, CA,July 12–14, 1994.
5Shah, Gautam H., Grafton, Sue B., Guynn, Mark D., Brandon, Jay M., Dansberry, Bryan E.,and Patel, Suresh R., “Effect of Vortex Flow Characteristics on Tail Buffet and High-Angle-of-Attack Aerodynamics of a Twin-Tail Fighter Configuration,” presented at NASA High-Angle-of-Attack Technology Conference, NASA Langley Research Center, Hampton, Virginia,Oct. 30 –Nov. 1, 1990.
37
6Shah, Gautam H., “Wind Tunnel Investigation of Aerodynamic and Tail Buffet Characteristicsof Leading-Edge Extension Modifications to the F/A-18,” AIAA-91-2889. Presented at AIAAAtmospheric Flight Mechanics Conference, New Orleans, LA, Aug., 1991.
7Quast, Thomas, Nelson, Robert C., and Fisher, David F., A Study of High Alpha Dynamicsand Flow Visualization for a 2.5-percent Model of the F-18 HARV Undergoing Wing Rock, AIAA-91-3267, Jan. 1991.
8Fisher, David F., DelFrate, John H., and Richwine, David M., In-Flight Flow VisualizationCharacteristics of the NASA F-18 High Alpha Research Vehicle at High Angles of Attack, NASATM-4193, May 1990.
9Erickson, Gary E., Water Tunnel Flow Visualization and Wind Tunnel Data Analysis of theF/A-18, NASA CR-165859, May 1982.
10Hall, R.M. and Banks, D.W., Progress in Developing Gritting Techniques for High Angle ofAttack Flows, AIAA-94-0169, Jan. 1994.
11Hall, R.M., Erickson, G.E., Banks, D.W., and Fisher, D.F., “Advances in High-AlphaExperimental Aerodynamics; Ground Test and Flight,” High-Angle-of-Attack Technology Confer-ence, Publication 3149, pt. 1, vol. 1, Oct. 30–Nov. 1, 1990, pp. 69–115.
12Banks, D.W., Fisher, D.F., Erickson, G.E., Jordan, F.L., Hall, R.M., and Sewall, W.G.,“Comparison of Wind Tunnel and Flight Forebody Flow Fields on the NASA F-18 High-AlphaResearch Vehicle,” High-Angle-of-Attack Technology Conference, Publication 3149, pt. 1, vol. 1,Oct. 30–Nov. 1, 1992, pp. 243–264.
13Banks, Daniel W., Hall, Robert M., Erickson, Gary E., and Fisher, David F., Forebody FlowField Effects on the High Angle-of-Attack Lateral-Directional Aerodynamics of the F/A-18,AIAA-94-0170, Jan. 1994.
14Banks, Daniel W., Wind-Tunnel Investigation of the Forebody Aerodynamics of a Vortex-LiftFighter Configuration at High Angles of Attack, SAE-881419, Oct. 1988.
15Erickson, G.E., Hall, R.M., Banks, D.W., DelFrate, J.H., Schreiner, J.A., Hanley, R., andPulley, C.T., Experimental Investigation of the F/A-18 Vortex Flows at Subsonic Through Transon-ic Speeds, AIAA-89-2222, Aug. 1989.
16Bowers, Albion H., Pahle, Joseph, Wilson, Joseph R., Flick, Bradley C., and Rood, RichardL., “An Overview of the NASA F-18 High Alpha Research Vehicle,” High-Angle-of-Attack Tech-nology Conference, Langley Research Center, Hampton, Virginia, Sept. 17–19, 1996.
17Schneider, Edward T. and Meyer, Robert R., Jr., “F-18 High Alpha Research VehicleDescription, Results, and Plans,” Society of Experimental Test Pilots, Thirty-Third SymposiumProceedings, Sept. 1989, pp. 135–162.
18Fisher, David F., Banks, Daniel W., and Richwine, David M., F-18 High Alpha ResearchVehicle Surface Pressures: Initial In-Flight Results and Correlation with Flow Visualization andWind Tunnel Data, AIAA-90-3018, Aug. 1990.
38

19Fisher, David F., Richwine, David M., and Banks, Daniel W., Surface Flow Visualization ofSeparated Flows on the Forebody of an F/A-18 Aircraft and Wind-Tunnel Model, NASATM-100426, also available as AIAA-88-2112, June 1988.
20Curry, Robert E. and Richwine, David M., An Airborne System for Vortex Flow Visualizationon the F-18 High-Alpha Research Vehicle, AIAA-88-4671-CP, Sept. 1988.
21Richwine, David M., Curry, Robert E., and Tracy, Gene V., A Smoke Generator System forAerodynamic Flight Research, NASA TM-4137, Sept. 1989.
22Lamont, P.J., The Effect of Reynolds Number on Normal and Side Forces on Ogive-Cylindersat High Incidence, AIAA-85-1799, Aug. 1985.
23Keener, Earl R., Flow-Separation Patterns on Symmetric Forebodies, NASA TM-86016,Jan. 1986.
24Hunt, B.L., Asymmetric Vortex Forces and Wakes on Slender Bodies (Invited paper),AIAA-82-1336, Aug. 1982.
25Erickson, Gary E., Wind Tunnel Investigation of Vortex Flows on F/A-18 Configuration atSubsonic Through Transonic Speeds, NASA TP-3111, Dec. 1991.
26Braslow, A.L., Harris, R.V., Jr., and Hicks, R.M., Use of Grit-Type Boundary-Layer Transi-tion Trips on Wind-Tunnel Models, NASA TN-D-3579, Sept. 1966.
27Moskovitz, Cary A., DeJarnette, F.R., and Hall Robert M., Effects of Nose Bluntness, Rough-ness, and Surface Perturbations on the Asymmetric Flow Past Slender Bodies at Large Angles ofAttack, AIAA-89-2236, Jan. 1989.
28Murri, Daniel G., Biedron, Robert T., Erickson, Gary E., Jordan, Frank L., Jr., and Hoffler,Keith D., “Development of Actuated Forebody Strake Controls for the F-18 High Alpha ResearchVehicle,” NASA CP-3149, pp. 335–380. Presented at the NASA High-Angle-of-Attack TechnologyConference, Hampton, Virginia, Oc.t 30–Nov. 1, 1990.
29Erickson, Gary E., and Murri, Daniel G., “Forebody Strakes for High-Angle-of-Attack VortexFlow Control - Mach Number and Strake Planform Effects,” NASA CP-3149, pp. 381–480.Presented at the NASA High-Angle-of-Attack Technology Conference, Hampton, Virginia,Oct. 30–Nov. 1, 1990.
30Murri, Daniel G., Shah, Gautam H., DiCarlo, Daniel J., and Trilling, Todd W., “ActuatedForebody Strake Controls for the F-18 High-Alpha Research Vehicle,” Journal of Aircraft, vol. 32,no. 3, May–June 1995, pp. 555–562.
31Murri, Daniel G., Fisher, David F., and Lanser, Wendy R., “Effect of Actuated ForebodyStrakes on the Forebody Aerodynamic of the NASA HARV,” Presented at the NASA High-Angle-of-Attack Technology Conference, Hampton, Virginia, Sept. 17–19, 1996.
39

REPORT DOCUMENTATION PAGE Form ApprovedOMB No. 0704-0188
Public reporting burden for this collection of information is estimated to average 1 hour per response, including the time for reviewing instructions, searching existing data sources, gathering andmaintaining the data needed, and completing and reviewing the collection of information. Send comments regarding this burden estimate or any other aspect of this collection of information,including suggestions for reducing this burden, to Washington Headquarters Services, Directorate for Information Operations and Reports, 1215 Jefferson Davis Highway, Suite 1204, Arlington,VA 22202-4302, and to the Office of Management and Budget, Paperwork Reduction Project (0704-0188), Washington, DC 20503.
1. AGENCY USE ONLY (Leave blank) 2. REPORT DATE 3. REPORT TYPE AND DATES COVERED
4. TITLE AND SUBTITLE 5. FUNDING NUMBERS
6. AUTHOR(S)
8. PERFORMING ORGANIZATION REPORT NUMBER
7. PERFORMING ORGANIZATION NAME(S) AND ADDRESS(ES)
9. SPONSORING/MONITORING AGENCY NAME(S) AND ADDRESS(ES) 10. SPONSORING/MONITORING AGENCY REPORT NUMBER
11. SUPPLEMENTARY NOTES
12a. DISTRIBUTION/AVAILABILITY STATEMENT 12b. DISTRIBUTION CODE
13. ABSTRACT (Maximum 200 words)
14. SUBJECT TERMS 15. NUMBER OF PAGES
16. PRICE CODE
17. SECURITY CLASSIFICATION OF REPORT
18. SECURITY CLASSIFICATION OF THIS PAGE
19. SECURITY CLASSIFICATION OF ABSTRACT
20. LIMITATION OF ABSTRACT
NSN 7540-01-280-5500 Standard Form 298 (Rev. 2-89)Prescribed by ANSI Std. Z39-18298-102
The F/A-18 High-Angle-of-Attack Ground-to-Flight Correlation: LessonsLearned
WU 505-68-30
Daniel W. Banks, David F. Fisher, Robert M. Hall, Gary E. Erickson,Daniel G. Murri, Sue B. Grafton, and William G. Sewall
NASA Dryden Flight Research CenterP.O. Box 273Edwards, California 93523-0273
H-2149
National Aeronautics and Space AdministrationWashington, DC 20546-0001 NASA TM-4783
Detailed wind tunnel and flight investigations were performed on the F/A-18 configuration toexplore the causes of many high-angle-of-attack phenomena and resulting disparities between windtunnel and flight results at these conditions. Obtaining accurate predictions of full-scale flight aerody-namics from wind-tunnel tests is important and becomes a challenge at high-angle-of-attack conditionswhere large areas of vortical flow interact. The F/A-18 airplane was one of the first high-performanceaircraft to have an unrestricted angle-of-attack envelope, and as such the configuration displayed manyunanticipated characteristics.
Results indicate that fixing forebody crossflow transition on models can result in a more accuratematch of flow fields, and thus a more accurate prediction of aerodynamic characteristics of flight athigh angles of attack. The wind tunnel results show that small geometry differences, specificallynosebooms and aft-end distortion, can have a pronounced effect at high angles of attack and must bemodeled in sub-scale tests in order to obtain accurate correlations with flight.
Fighter aircraft; Forebody flows; High angle of attack; Vortex flows; Vortexinteractions
AO3
43
Unclassified Unclassified Unclassified Unlimited
January 1997 Technical Memorandum
Available from the NASA Center for AeroSpace Information, 800 Elkridge Landing Road, Linthicum Heights, MD 21090; (301)621-0390
Presented at NASA Langley High-Angle-of-Attack Technology Conference, Langley Research Center, Hampton, Virginia, September 17–19, 1996. Daniel Banks and David Fisher, Dryden Flight Research Center, Edwards, CA; Robert Hall, Gary Erickson, Daniel Murri, Sue Grafton, and William Sewall, NASA Langley Research Center, Hampton, VA.
Unclassified—UnlimitedSubject Category 02