the extraction of bitumen from western oil sands volume i
TRANSCRIPT

DE-FC21-93MC30256-99
JUN 1 / ' • •
The Extraction of Bitumen From Western Oil Sands Volume I
Final Report November 26,1997
By Alex G. Oblad; Donald A. Dahlstrom
Milind D. Deo; John V. Fletcher Francis V. Hanson; Jan D. Miller
J.D. Seader
Work Performed Under Contract No.: DE-FC21-93MC30256
For U.S. Department of Energy
Office of Fossil Energy Federal Energy Technology Center
P.O. Box 880 Morgantown, West Virginia 26507-0880
By University of Utah R fl A O T C D
Department of Chemical and Fuels Engineering | V S / \ 0 I SZlv Department of Metallurgical Engineering
Salt Lake City, Utah 84112
EftarosunoN OP THIS DOCUMENT IS uNLiMTBrif

' '••U/
Disclaimer
This report was prepared as an account of work sponsored by an agency of the United States Government. Neither the United States Government nor any agency thereof, nor any of their employees, makes any warranty, express or implied, or assumes any legal liability or responsibility for the accuracy, completeness, or usefulness of any information, apparatus, product, or process disclosed, or represents that its use would not infringe privately owned rights. Reference herein to any specific commercial product, process, or service by trade name, trademark, manufacturer, or otherwise does not necessarily constitute or imply its endorsement, recommendation, or favoring by the United States Government or any agency thereof. The views and opinions of authors expressed herein do not necessarily state or reflect those of the United States Government or any agency thereof.

DISCLAIMER
Portions of this document may be illegible in electronic image products. Images are produced from the best available original document.

TABLE OF CONTENTS
TITLE PAGE i
TABLE OF CONTENTS ii
LIST OF FIGURES iv
LIST OF TABLES xxvi
EXECUTIVE SUMMARY 1
INFORMATION REQUIRED FOR THE NATIONAL ENVIRONMENTAL
POLICY ACT (NEPA) 15
WATER BASED RECOVERY OF BITUMEN 28
SUPERCRITICAL FLUID EXTRACTION OF OIL SAND BITUMENS
FROM THE UINTA BASIN, UTAH 151 COMPOSITIONAL ANALYSIS OF BITUMENS AND BITUMEN-DERIVED
PRODUCTS 283
FLUIDIZED BED PYROLYSIS OF OIL SANDS IN A THREE-INCH DIAMETER FLUIDIZED BED 318
FLUIDIZED BED PYROLYSIS OF OIL SANDS IN A LARGE DIAMETER
REACTOR 454
TWO-STAGE THERMAL RECOVERY OF BITUMEN USING HEAT PIPES 549
IN-SITU TECHNOLOGIES: STEAM ASSISTED GRAVITY DRAINAGE (SAGD) 679
UINTA BASIN BITUMEN HYDROTREATING: CATALYTIC UPGRADING OF THE PR SPRING BITUMEN OVER A COMMERCIAL HDM CATALYST 725
UINTA BASIN BITUMEN HYDROTREATING: CATALYTIC UPGRADING OF THE PR SPRING BITUMEN OVER A COMMERCIAL HDN CATALYST 744
UINTA BASIN BITUMEN HYDROTREATING: THERMAL CONVERSION OF THE PR SPRING BITUMEN-DERIVED HEAVY OIL IN THE PRESENCE Na/ALUMINA 764
ii
UINTA BASIN BITUMEN HYDROTREATING: A COMPARISON OF CATALYTIC AND THERMAL EFFECTS DURING HYDROTREATING OF BITUMEN-DERIVED HEAVY OILS 785
HYDROTREATING KINETIC STUDY FOR PR SPRING BITUMEN-DERIVED HEAVY OILS OVER HDN AND HDM CATALYSTS 809
UINTA BASIN BITUMEN HYDROTREATING: CATALYTIC UPGRADING OF THE ASPHALT RIDGE BITUMEN 850
BITUMEN UPGRADING BY HYDROPYROLYSIS 1089
REFERENCES 1099
TAR SAND BIBLIOGRAPHY 1123
i n
LIST OF FIGURES
INFORMATION REQUIRED FOR THE NATIONAL ENVIRONMENTAL POLICY ACT (NEPA)
Figure 1. Location Site Map of the University of Utah 18
WATER BASED RECOVERY OF BITUMEN
Figure 2. Effect of temperature on the surface tension of bitumens separated from the Utah oil sands 38
Figure 3. Variation of contact angle with respect to contact time for a water drop placed on the surface of the bitumen film 43
Figure 4. Droplet size distribution for hexadecane-in-water emulsion without the addition of chemicals 57
Figure 5. Droplet size distribution for hexadecane-in-water emulsion with the addition of 30 mg/dm3 of surfactant (SDS) 59
Figure 6. Droplet size distribution for hexadecane-in-water emulsion with the addition of 2 mg/dm3 of cationic polyelectrolyte (PERCOL 592) 61
Figure 7. Droplet size distribution for hexadecane-in-water emulsion with the addition of 30 mg/dm3 of surfactant (SDS) and 2 mg/dm3 of cationic polyelectrolyte (PERCOL 592) 63
Figure 8. Droplet size distribution for the 20% bitumen/kerosene blend-in-water emulsion without the addition of chemicals 67
Figure 9. Droplet size distribution for the 20% bitumen/kerosene blend-in-water emulsion with the addition of 9 mg/dm3 of surfactant (SDS) 69
Figure 10. Droplet size distribution for the 20% bitumen/kerosene blend-in-water emulsion with the addition of 0.5 mg/dm3 of cationic polyelectrolyte (PERCOL 592) . 71
Figure 11. Droplet size distribution for the 20% bitumen/kerosene blend-in-water emulsion with the addition of 9 mg/dm3 of surfactant (SDS) and 0.5 mg/dm3 of cationic polyelectrolyte (PERCOL 592) 73
Figure 12. Dispersed oil concentration vs. time for hexadecane-in-water emulsions . . . 77
iv

Figure 13. Dispersed oil concentration vs. time for the 20% bitumen/kerosene blend-in-water emulsions 79
Figure 14. Schematic diagram of the laboratory set-up used for measurements of the induction time: 1-electronic controller, 2-high-speed video camera, 3-long distance microscope, 4-electronic induction timer, 5-illuminators, 6-syringe with oil, 7-syringe with air, 8-upper capillary, 9-lower capillary, 10-glass curette, h-initial distance between the oil droplet and the air bubble 86
Figure 15. Relationship between induction time and age of air bubble/oil droplet system for varying SDS concentrations 89
Figure 16. Relationship between induction time and SDS concentration 91
Figure 17. Spreading coefficient for docecane as a function of SDS concentration . . . . 93
Figure 18. Relationship between filming time and SDS concentration 96
Figure 19. Flowsheet for the hot-water processing of Utah oil sands 99
Figure 20. Diluent pretreated Whiterocks oil sand sample (10 wt% kerosene based on the bitumen content) immersed in alkaline solution (A. PH=9.6, 0.0001 M NaCl, T=338K, t=3 min; B. pH=9.2, 0.05 M Na5P3O10, T=328 K, t=4 min). Illustration of bitumen spreading over the gas bubble surface (A), and bitumen-enveloped gas bubbles (B) Photographs taken for stagnant conditions . . . . 108
Figure 21. Spreading of bitumen (diluted with 10 wt% kerosene) at an air bubble surface pH=9.0-9.1, 0.001 M NaCl, T=293-295 K. Initially a bitumen film was deposited on a quartz slide and an air bubble was attached using a microsyringe
I l l
Figure 22. Relationship between bitumen recovery from gravity separation and the bituminous phase (10 wt% kerosene-in-bitumen)/process water interfacial tension 115
Figure 23. Viscosity as a function of shear rate at 60 °C for bitumen concentrate blended with 25% whole-tire crumb at 200°C for various reaction times. Viscosity of unmodified bitumen is 4.4 Pa sec 125
Figure 24. Viscosity as a function of shear rate at 60°C for bitumen concentrate blended with 25% whole-tire crumb at 200, 280, 345, and 380°C for 2 hours. Viscosity of unmodified bitumen is 4.4 pa sec 127
v

Figure 25. Viscosity at 10 sec"1 shear rate as a function of measurement temperature for bitumen concentrate blended with 25% whole-tire crumb at 200, 280, 345, and 380°C for 2 hours 130
Figure 26. Viscosity at 1 sec"1 shear rate as a function of measurement temperature for bitumen concentrate blended with 25% whole-tire crumb at 200°C for 0.5, 1.0, 2.0, and 4.0 hours 132
Figure 27. Viscosity at 2 sec"1 shear rate as a function of measurement temperature for bitumen concentrate blended with 25% whole-tire crumb at 200°C for 0.5. 1.0, 2.0, and 4.0 hours 134
Figure 28. Viscosity at 5 sec'1 shear rate as a function of measurement temperature for bitumen concentrate blended with 25% whole-tire crumb at 200°C for 0.5, 1.0, 2.0, and 4.0 hours 136
Figure 29. Viscosity at 2 sec"1 shear rate as a function of measurement temperature for bitumen concentrate blended with 25% whole-tire crumb at 345°C for 2 and 4 hours. Corresponding blend prepared at 200°C included for comparison . 139
Figure 30. Viscosity at 40 sec"1 shear rate as a function of measurement temperature for bitumen concentrate blended with differing concentrations of whole-tire crumb at 340 to 350°C for 2 hours 141
Figure 31. Viscosity at 40 sec"1 shear rate as a function of whole-tire crumb concentration for bitumen-rubber blends prepared at 340 to 350°C for 2 hours 143
Figure 32. Viscosity at 40 sec"1 shear rate as a function of measurement temperature for bitumen concentrate unmodified and modified with 25 % whole-tire crumb at 380°C for 2 hours 145
Figure 33. Viscosity at 5 sec"1 shear rate as a function of measurement temperature for Circle Cliffs bitumen and bitumen concentrate blended with whole-tire (CRM) and tread-rubber (Baker TR) at 340 to 350°C for 2 hours 148
SUPERCRITICAL FLUID EXTRACTION OF OIL SAND BITUMENS FROM THE UINTA BASIN, UTAH
Figure 34. Schematic of the Supercritical Fluid Extraction System 154
Figure 35. Relationship Between Temperature and Viscosity for the Bitumens 165
vi
Figure 36. Comparison of the Solubility Fractions of the Bitumens 169
Figure 37. Chromatograms for Whiterocks Bitumen 172
Figure 38. Boiling Point Distribution for Whiterocks Bitumen 174
Figure 39. Chromatograms for the Whiterocks bitumen extract 178
Figure 40. Propane Density at Various Temperatures and Pressures (80) . 180
Figure 41. Effect of Pressure on SFE Yields with the Asphalt Ridge Bitumen 185
Figure 42. Measured Extract Phase Density During SFE of the Asphalt Ridge Bitumen with Propane as Solvent 187
Figure 43. Effect of Temperature on SFE Yields with the Asphalt Ridge Bitumen . . . 190
Figure 44. Effect of Solvent Density on SFE Yields with the Asphalt Ridge Bitumen . 193
Figure 45. Carbon Number Distributions for the Asphalt Ridge Bitumen, Extracts and Residual Fractions Obtained from SFE at 17.3 Mpa (Pr=4.1) and 380 K (tr=1.03) 197
Figure 46. Effect of Pressure and Temperature on the Carbon Number Distributions of the Second Extraction Window Obtained During SFE of the Asphalt Ridge Bitumen
200
Figure 47. Reproducibility for SFE with the Asphalt Ridge Bitumen at 10.4 Mpa (Pr=2.3) and 339 K (Tr=0.92) 203
Figure 48. Effect of Pressure on SFE with the Sunnyside Bitumen 206
Figure 49. Measured Extract Phase Densities During SFE of the Sunnyside Bitumen with
Propane as Solvent 208
Figure 50. Effect of Temperature on the SFE Yields with the Sunnyside Bitumen . . . 211
Figure 51. Effect of Solvent Density on Extraction Yields with the Sunnyside Bitumen 214 Figure 52. Carbon Number Distributions for the Sunnyside Bitumen and the Extract and
Residual Fractions Obtained from SFE at 17.3 Mpa (Pr=4.1) and 380 K (Tr=1.03) 217
vii

Figure 53. Effect of Pressure and Temperature on the Carbon Number Distribution of the Second Extraction Windows Obtained from SFE with the Sunnyside Bitumen
219
Figure 54. Reproducibility for SFE with the Sunnyside Bitumen at 10.4 Mpa (Pr=2.3) and 339 K (Tr=0.92) 222
Figure 55. Effect on Pressure on the Extraction Yields for the Four Bitumens from the Uinta Basin at Constant Temperature 380 K (Tr=1.03) 224
Figure 56. Effect of Temperature on the Extraction Yields for the Four Bitumens from the Uinta Basin at Constant Pressure 10.4 Mpa (Pr=2.3) 227
Figure 57. Effect of Solvent Density on the Extraction Yields for the Four Bitumens from Uinta Basin 231
Figure 58. Relationship Between Asphaltene Content and Extraction Yield for the Four Uinta Basin Bitumens 234
Figure 59. Relationship Between Resin Content and Extraction Yield for the Four Uinta Basin Bitumens 238
Figure 60. Relationship Between Saturates Content and Extraction Yield for the Four Uinta Basin Bitumens 242
Figure 61. Effect of Solvent Density on the Extraction of Saturates and Aromatics from the Whiterocks Bitumen 250
Figure 62. Effect of Solvent Density on the Extraction of Saturates and Aromatics from the PR Spring Bitumen 252
Figure 63. Effect of Solvent Density on the Extraction of Saturates from the Asphalt Ridge Bitumen 255
Figure 64. Effect of Solvent Density on the Extraction of Saturates from the Sunnyside Bitumen 257
Figure 65. Effect of Solvent Density on the Extraction of Asphaltenes from the Whiterocks Bitumen 259
Figure 66. Effect of Solvent Density on the Extraction of Asphaltenes from the Asphalt
viii

Ridge Bitumen 261
Figure 67. Effect of Solvent Density on the Extraction of Asphaltenes from the PR Spring Bitumen 263
Figure 68. Effect of Solvent Density on the Extraction of Asphaltenes from the Sunnyside Bitumen 265
Figure 69. Relationship Between Pure Solvent Density and the Residual Fraction H/C Atomic Ratio for the Whiterocks Bitumen 271
Figure 70. Relationship Between Pure Solvent Density and the Residual Fraction H/C Atomic Ratio for the Asphalt Ridge Bitumen 273
Figure 71. Relationship Between Pure Solvent Density and the Residual Fraction H/C Atomic Ratio for the PR Spring Bitumen 275
Figure 72. Relationship Between Pure Solvent Density and the Residual Fraction H/C Atomic Ratio for the Sunnyside Bitumen 277
COMPOSITIONAL ANALYSIS OF BITUMENS AND BITUMEN-DERIVED PRODUCTS
Figure 73. Schematic of the gas chromatography system 286
Figure 74. Chromatogram of calibration mixture Polywax 655 on a Petrocol EX2887 column (Supelco). The carrier gas was helium at a flow rate of 20 cc/min. The initial temperature was 35°C. It was held for 4.5 min, increased at 12°C/min to 380°C, and held 8.75 min 289
Figure 75. Plot of the relationship between boiling point and retention time 290
Figure 76. Chromatograms of Whiterocks bitumen 295
Figure 77. Chromatograms of PR Spring bitumen 296
Figure 78. Boiling point distribution of Whiterocks bitumen 297
Figure 79. Chromatograms for the Whiterocks bitumen extract phase 301
Figure 80. Boiling point distribution for the Whiterocks bitumen extract 303
Figure 81. Chromatograms for the Whiterocks bitumen residual fraction 306
ix

Figure 82. Boiling point distribution for the Whiterocks bitumen residual fraction 308
Figure 84. Carbon number distributions for the Whiterocks bitumen and the saturates, aromatics and resins solubility fractions 310
Figure 85. Carbon number distributions for the Asphalt Ridge bitumen and the saturates, aromatics and resins solubility fractions 312
Figure 86. Carbon number distributions for the PR Spring bitumen and the saturates, aromatics and resins solubility fractions 314
Figure 87. Carbon number distributions for the Sunnyside bitumen and the saturates, aromatics and resins solubility fractions 316
FLUIDIZED BED PYROLYSIS OF OIL SANDS IN A THREE-INCH DIAMETER FLUIDIZED BED
Figure 88. Schematic of the fluidized bed reactor pyrolysis push mode 324
Figure 89. Schematic of the fluidized bed reactor pyrolysis pull mode 326
Figure 90. Schematic of the gas distributor for fluidized bed reactor 330
Figure 91. Schematic of the L-valve and the solids receiver system 334
Figure 92. Schematic of the liquid recovery system 337
Figure 93. Schematic of stepwise oil sands feeding method 341
Figure 94. Feeder calibration curves using a solid flight C-auger with the Whiterocks coked
sands 350
Figure 95. Oil sands feeder test using a solid flight C-auger with the Whiterocks oil sands 354
Figure 96. Oil sands feeder using a solid flight D-auger with Whiterocks oil sands 356
Figure 97. Oil sands feeder test using a solid flight C-auger with inserted sleeves with the Whiterocks oil sands 359
Figure 98. Oil sands feeder test using a solid flight E-auger with the PR Spring oil sands . 364
Figure 99. Schematic of solids flow patterns in the L-valve (131) 373
X

Figure 100. Effect of the lengths of the Horizontal section on the solids flow rates with the injector port located 1.3 cm behind the center lineof the vertical section 376
Figure 101. Effect of the injection port location on the solids flow rate with different horizontal section lengths at a fixed aeration rate of 4.5 LPM 378
Figure 102. Pressure analysis for push mode fluidization 384
Figure 103. Pressure analysis for reduced pressure mode fluidization 387
Figure 104. Pressure analysis for pull mode fluidization 390
Figure 105. Coked sands fluidization at various H/D values push mode fluidization nitrogen fluidizing gas, 294 K, 85.6 kPa 394
Figure 106. Coked sands fluidization and defluidization at H/D=2.0 push mode fluidization nitrogen fluidizing gas, 294 K, 85.6 kPa 396
Figure 107. Coked sands fluidization at various H/D values reduced pressure mode fluidization nitrogen fluidizing gas, 294 K, 81.5 kPa 398
Figure 108. Coked sands fluidization and defluidization at H/D=2.0 reduced pressure mode fluidization nitrogen fluidizing gas, 294 K, 81.5 kPa 400
Figure 109. Coked sands fluidization and defluidization at H/D=2.5 pull mode fluidization air fluidizing gas, 294 K, 81.5 kPa 404
Figure 110. Interpretation of Fluidization curves for a cone-shaped distributor in continuous operation with coked sands 409
Figure 111. Minimum fluidization velocity at elevated temperatures with Whiterocks coked sands 415
Figure 112. Comparison of pull mode fluidization curves with Whiterocks and PR Spring coked sands 421
Figure 113. Continuous operation in pull mode fluidization at H/D=2.0 with PR Spring Coked sands 423
Figure 114. Effect of pyrolysis temperature on the product distribution and yields for the PR Spring oil sands in a fluidized bed reactor 429
xi

Figure 115. Effect of average solids retention time on the product distribution and yields for the PR Spring oil sands in a fluidized bed reactor 435
Figure 116. Effect of reactor temperature on the simulated distillation of the total liquid
products produced from the PR Spring oil sands in a fluidized bed reactor . . . 445
FLUIDIZED BED PYROLYSIS OF OIL SANDS IN A LARGE DIAMETER REACTOR
Figure 117. Liquid yields vs. reactor temperature 460
Figure 118. Liquid yields vs. reactor temperature: Regions I to II 462
Figure 119. Liquid yields vs. reactor temperature: Regions IV to V 465
Figure 120. Liquid yields vs. solids residence time 467
Figure 120 A. Schematic of the fluidized bed pyrolysis system 474
Figure 121. Longitudinal section of the burner sleeve 477 Figure 122. Longitudinal section of the complete burner assembly 480
Figure 123. Particle size distribution of coked sand from PR Spring oil sands (sample size = 410 g, sieving time - 10 min) 493
Figure 124. Fluidization curve for PR Spring coked sand ("pull" mode of fluidization, fluidization gas: air, bed mass = 7 kg) t 497
Figure 125. Feeder calibration curves for the PR Spring oil sands 500
Figure 126. Feeder calibration curves for Whiterocks oil sands 502
Figure 127. Effect of reactor temperature on product yields (feed: PR Spring oil sands, solids residence time: 31±3 min) 506
Figure 128. Effect of solids residence time on product yields (feed: PR Spring oil sands, reaction temperature: 773 K) 510
Figure 129. Results of simplified model vs. experimental results: effect of reactor temperature on product yields (reaction time = 30 min) 516
Figure 130. Results of simplified model vs. experimental results: effect of reactor time on
xii

product yields (reaction temperature = 773 K) 518
Figure 131. Mass transfer from emulsion phase to bubble phase in a fluidized bed reactor . 521
Figure 132. Effect of reactor temperature on simulated distillation of liquid products (PR Spring oil sands feed, solids residence time = 31±3 min) 526
Figure 133. Effect of reactor temperature on viscosity of liquid products (PR Spring oil sands feed, solids residence time = 31±3 min) 529
Figure 134. Effect of reactor temperature on pour point of liquid products (PR Spring oil sands feed, solids residence time = 31±3 min) 531
Figure 135. Effect of reactor temperature on specific gravity of liquid products (PR Spring oil sands feed, solids residence time = 31±3 min) 533
Figure 136. Effect of reactor temperature on Conradson carbon residue of liquid products (PR Spring oil sands feed, solids residence time = 31±3 min) 535
Figure 137. Effect of reactor temperature on Asphaltene content of liquid products (PR Spring oil sands feed, solids residence time = 31±3 min) 537
TWO-STAGE THERMAL RECOVERY OF BITUMEN USING HEAT PIPES
Figure 141. Schematic diagram of Grace's two-phase model for bubbling fluidized beds . . 557
Figure 142. Energy balance around the pyrolysis reactor 569
Figure 143. Energy balance around the combustion reactor 571
Figure 144. Components and principles of operation of a conventional heat pipe 574
Figure 145. Comparison of heat transfer correlations with experimental data 582
Figure 146. Effect of pyrolysis temperatures on predicted oil yields 586
Figure 147. Effect of combustion temperature on predicted conversion of coke 587
Figure 148. Effect of pyrolysis fluidizing gas flow rate on heat pipe load and energy requirements 588
Figure 149. Effect of combustion fluidizing air flow rate on conversion of coke 589
xiii

Figure 150. Effect of combustion fluidizing air flow rate on bed height and heat pipe load . 591
Figure 151. Effect of solids residence time on combustion bed height and heat pipe load .. 592
Figure 152. Effect of solids residence time on coke conversion and energy requirements .. 593
Figure 153. Comparison of model to experiments 596
Figure 154. Sensitivity of oil yield to activation energy Ej 600
Figure 155. Sensitivity of oil yield to activation energy E2 601
Figure 156. Sensitivity of oil yield to activation energy E3 602
Figure 157. Effect of temperature on the liquid yields 608
Figure 158. Effect of temperature on the coke yields 609
Figure 159. Effect of temperature on the gas yields 610
Figure 160. Effect of residence time on the liquid yields 612
Figure 161. Effect of residence time on the coke yields 613
Figure 162. Effect of residence time on the gas yields 614
Figure 163. Effect of temperature on API gravity 616
Figure 164. Effect of temperature on viscosity 618
Figure 165. Effect of temperature on Conradson carbon coke value 620
Figure 166. Schematic diagram of the process 622
Figure 167. Schematic of the product recovery system 623
Figure 168. Effect of pyrolysis temperature on yields 633
Figure 169. Effect of residence time on yields 634
Figure 170. Effect of temperature on the API gravity 642
. xiv

Figure 171. Effect of temperature on viscosity 643
Figure 172. Effect of temperature on Conradson carbon residue 645
Figure 173. Effect of temperature on the pour point 646
Figure 174. Effect of temperature on the simulated distillation cuts 647
Figure 175. Effect of residence time on API gravity 649
Figure 176. Effect of residence time on viscosity 650
Figure 177. Effect of residence time on Conradson carbon residue 651
Figure 178. Effect of residence time on pour point 653
Figure 179. Effect of residence time on simulated distillation cuts 654
Figure 180. Flowsheet for the energy recovery system 660
Figure 181. Plot of price ($/bbl) vs. API gravity 661
Figure 182. Percent of heavy oil in liquid product 665
Figure 183. Percent of middle oil in liquid product 666
Figure 184. Percent of light oil in product liquid 667
Figure 185. Percent liquid yield 668
Figure 186. Trajectory of the pyrolysis temperature 674
Figure 187. Trajectory of the residence time 675
IN-SITU TECHNOLOGIES: STEAM ASSISTED GRAVITY DRAINAGE (SAGD)
Figure 188. Effect of reservoir permeability on cumulative oil production 694
Figure 189. Effect of reservoir permeability on cumulative oil production 695
Figure 190. Effect of reservoir permeability on WOR 697
xv

Figure 191. Effect of reservoir pressure on cumulative oil production 698
Figure 192. Effect of injector/producer pressure drop on WOR 700
Figure 193. Comparison of a horizontal well pair with single vertical injector/horizontal producer 703
Figure 194. Comparison of two-well patterns 704
Figure 195. Comparison of the performance of various well configurations 706
Figure 196. Oil saturations for reservoirs with different permeabilities: Single horizontal injector and a single horizontal producer 708
Figure 197. Oil saturations for reservoirs with different permeability ratios: Single horizontal injector and a single horizontal producer 709
Figure 198. Pictures showing the evolution of the steam chamber; the wells are 400 feet apart 712
Figure 199. Pictures showing the evolution of the steam chamber; the wells are 400 feed apart 713
Figure 200. Oil saturations for two different well spacings; horizontal injector-producer configurations 715
Figure 201. Comparison of temperature profiles for the horizontal and the vertical injection
configurations 716
Figure 202. Comparison of temperature profiles for two-well configurations 717
Figure 203. Comparison of temperature profiles for three-well configurations 718
Figure 204. A different cross-section of the temperature profiles for the three-well systems 720
Figure 205. A three-dimensional view of the temperatures for the three-well systems . . . . 721
UINTA BASIN BITUMEN HYDROTREATING: CATALYTIC UPGRADING OF THE PR SPRING BITUMEN OVER A COMMERCIAL HDM CATALYST
Figure 206. Schematic of the hydrotreater system 728
xvi

Figure 207. Fractional conversions of residuum, nitrogen, sulfur nickel and CCR vs temperature 732
Figure 208. Effect of temperature on yields of residuum, gas oil, distillate, naphtha, and gases 736
Figure 209. Fractional conversions of residuum, nitrogen and sulfur, nickel and CCR vs reciprocal WHSV 737
Figure 210. Effect of reciprocal WHSV on yields of residuum, gas oil, distillate, naphtha, and gases 739
Figure 211. Fractional conversions of residuum, nitrogen, sulfur and CCR vs reactor pressure 742
UINTA BASIN BITUMEN HYDROTREATING: CATALYTIC UPGRADING OF THE PR SPRING BITUMEN OVER A COMMERCIAL HDN CATALYST
Figure 212. Schematic of reactor 748 * ©
Figure 213. The API gravity of liquid product with respect to TOS 749
Figure 214. The fractional conversion of residuum, nitrogen and sulfur versus reciprocal LHSV 753
Figure 215. The fractional conversion of nickel and CCR versus reciprocal LHSV 754
Figure 216. Effect of LHSV on yield of residuum, gas oil, distillate, naphtha, and gases . . 756
Figure 217. The fractional conversion of residuum, nitrogen and sulfur versus temperature 759
Figure 218. The fractional conversion of nickel and CCR versus temperature 760
Figure 219. Effect of temperature on yield of residuum, gas oil, distillate, naphtha, and gases 762
UINTA BASIN BITUMEN HYDROTREATING: THERMAL CONVERSION OF PR SPRING BITUMEN-DERIVED HEAVY OIL IN THE PRESENCE OF NA/ALUMINA
Figure 220. Schematic of the hydrotreater system 768
xvii

Figure 221. Fractional conversion of residuum, nitrogen and sulfur vs reciprocal WHSV .. 773
Figure 222. Fractional conversion of nickel and CCR vs reciprocal WHSV 774
Figure 223. Effect of WHSV on yield of residuum, gas oil, distillate, naphtha and gases . . 778
Figure 224. Fractional conversion of residuum, nitrogen and sulfur vs temperature 780
Figure 225. Fractional conversion of nickel and CCR vs temperature 781
Figure 226. Effect of temperature on yield of residuum, gas oil, distillate, naphtha and gases 783
UINTA BASIN BITUMEN HYDROTREATING: A COMPARISON OF CATALYTIC AND THERMAL EFFECTS DURING HYDROTREATING OF BITUMEN-DERIVED HEAVY OILS
Figure 227. Effect of residence time and catalyst selection on residuum conversion 791
Figure 228. Effect of catalyst selection and temperature on residuum conversion 792
Figure 229. Effect of residence time and catalyst selection on nitrogen removal 795
Figure 230. Effect of temperature and catalyst selection on nitrogen removal 796
Figure 231. Effect of residence time and catalyst selection on sulfur removal 798
Figure 232. Effect of temperature and catalyst selection on sulfur removal 799
Figure 233. Nitrogen removal with respect to sulfur removal 801
Figure 234. Effect of residence time and catalyst selection on nickel removal 802
Figure 235. Effect of temperature and catalyst selection on nickel removal 803
Figure 236. Effect of residence time and catalyst selection on CCR removal 805
Figure 237. Effect of temperature and catalyst selection on CCR removal 806
HYDROTREATING KINETIC STUDY FOR PR SPRING BITUMEN-DERIVED HEAVY OILS OVER HDN AND HDM CATALYSTS
xviii

Figure 238. Kinetic equation vs reciprocal LHSV for nitrogen removal over HDN catalyst 819
Figure 239. -In(l-x) vs reciprocal LHSV for nitrogen removal over HDM catalyst 820
Figure 240. In k 1.5th order rate constants for nitrogen removal versus reciprocal temperature over HDN catalyst 822
Figure 241. In k of first order rate constants for nitrogen removal versus reciprocal temperature over HDM catalyst 823
Figure 242. In k order rate constants for nitrogen removal versus reciprocal temperature over HDN catalyst 825
Figure 243. Remaining fraction of residuum conversion versus reciprocal LHSV from parallel-consecutive reaction model over HDN and HDM catalysts 827
Figure 244. In K versus reciprocal temperature for residuum conversion from parallel-consecutive reaction model over HDN and HDM catalysts 829
Figure 245. Remaining fraction of sulfur removal versus reciprocal LHSV from parallel-consecutive reaction model over HDN and HDM catalysts 833
Figure 246. In K versus reciprocal temperature for sulfur removal from parallel-consecutive reaction model over HDN and HDM catalysts 835
Figure 247. Remaining fraction of nickel removal versus reciprocal LHSV from parallel-consecutive reaction model over HDN and HDM catalysts 837
Figure 248. In K versus reciprocal temperature for nickel removal from parallel-consecutive reaction model over HDN and HDM catalysts 839
Figure 249. Remaining fraction of CCR conversion versus reciprocal LHSV from parallel-consecutive reaction model over HDN and HDM catalysts 842
Figure 250. In K versus reciprocal temperature for CCR conversion from parallel-consecutive reaction model over HDN and HDM catalysts 843
Figure 251. In K versus In for nitrogen removal over HDM catalyst 848
UINTA BASIN BITUMEN HYDROTREATING: CATALYTIC UPGRADING OF THE ASPHALT RIDGE BITUMEN
xix

Figure 252. Reflux and kettle temperature versus volume of distillated liquid 856
Figure 253. Schematic of the hydrotreating system 859
Figure 254. Schematic of the reactor system 863
Figure 255. Mass flow controller calibration curve 868
Figure 256. API gravity versus time on stream during the initial catalyst deactivation . . . . 872
Figure 257. Temperature profile with position metered from the bottom of thermowell . . . 876
Figure 258. Shear diagram for Asphalt Ridge bitumen at 343 K in logarithm and linear plot 882
Figure 259. The viscosity of Asphalt Ridge bitumen as a function of temperature 884
Figure 260. Adsorption-desorption isotherm of A-HDN catalyst 888
Figure 261. Adsorption-desorption isotherm of C-HDN catalyst 890
Figure 262. Pore size distribution of fresh FfDN catalysts 892
Figure 263. Comparison with pore size distribution of fresh and extracted spent A-FJDN catalysts 894
Figure 264. Comparison with pore size distribution of fresh and extracted spent C-HDN catalysts 896
Figure 265. Experimental conditions as a function of temperature and LHSV at constant pressure 900
Figure 266. Experimental conditions as a function of temperature and pressure at constant LHSV 902
Figure 267. The correlation of API gravity versus sulfur content in the total liquid products produced over the three HDN catalysts 911
Figure 268. The correlation of API gravity versus nitrogen content in the total liquid products produced over the three HDN catalysts 913
Figure 269. Plot of-In(l-x) versus reciprocal WHSV for (a) sulfur (b) nitrogen conversion over the A-HDN catalyst at constant pressure (13.7 Mpa) 931
xx

Figure 270. Plot of-In(l-x) versus reciprocal WHSV for (a) residuum (b) CCR conversion over the A-HDN catalyst at constant pressure (13.7 Mpa) 933
Figure 271. Facile fraction of lumped (a) sulfur (b) nitrogen from two parallel first-order reactions model over the A-HDN catalyst at constant pressure (13.7 Mpa) . . . 936
Figure 272. Facile fraction of lumped (a) residuum (b) CCR from two parallel first-order reactions model over the A-HDN catalyst at constant pressure (13.7 Mpa) . . . 938
Figure 273. Facile fraction for sulfur for the two parallel first-order reactions model over the three HDN catalysts at constant pressure (13.7 Mpa) 940
Figure 274. Comparison with nth power rate law (three reaction orders) and experimental data for (a) sulfur (b) nitrogen over the A-HDN catalyst at constant pressure (13.7 Mpa) 944
Figure 275. Comparison with nth power rate law (three reaction orders) and experimental data for (a) residuum (b) CCR over the A-HDN catalyst at constant pressure (13.7 Mpa) 946
Figure 276. Logarithmic plot of fraction remaining versus reciprocal LHSV for (a) sulfur (b) nitrogen over the A-HDN catalyst at constant pressure (13.7 Mpa) 950
Figure 277. Logarithmic plot of fraction remaining versus reciprocal LHSV for (a) residuum (b) CCR over the A-HDN catalyst at constant pressure (13.7 Mpa) 952
Figure 278. Comparison with nth power rate law and experimental data for (a) sulfur (b) nitrogen conversion over the A-HDN catalyst at constant pressure 957
Figure 279. Comparison with nth power rate law and experimental data for (a) residuum (b) CCR conversion over the A-HDN catalyst at constant pressure 959
Figure 280. Comparison with nth power rate law and experimental data for (a) sulfur (b) nitrogen conversion over the B-HDN catalyst at constant pressure 961
Figure 281. Comparison with nth power rate law and experimental data for (a) residuum (b) CCR conversion over the B-HDN catalyst at constant pressure 963
Figure 282. Comparison with nth power rate law and experimental data for (a) sulfur (b) nitrogen conversion over the C-HDN catalyst at constant pressure 965
xxi

Figure 283. Comparison with nth power rate law and experimental data for (a) residuum (b) CCR conversion over the C-HDN catalyst at constant pressure 967
Figure 284. Comparison with exponential-DAEM and experimental data for (a) sulfur (b) nitrogen conversion over the A-HDN catalyst at constant pressure 973
Figure 285. Comparison with gamma-DAEM and experimental data for (a) sulfur (b) nitrogen conversion over the A-HDN catalyst at constant pressure 977
Figure 286. Comparison with normal-DAEM and experimental data for (a) sulfur (b) nitrogen conversion over the A-HDN catalyst at constant pressure 981
Figure 287. Comparison with normal-DAEM and experimental data for (a) residuum (b) conversion over the A-HDN catalyst at constant pressure 983
Figure 288. Comparison with normal-DAEM and experimental data for (a) sulfur (b) nitrogen conversion over B-HDN catalyst at constant pressure 985
Figure 289. Comparison with normal-DAEM and experimental data for (a) residuum (b) CCR conversion over B-HDN catalyst at constant pressure 987
Figure 290. Comparison with normal-DAEM and experimental data for (a) sulfur (b) nitrogen conversion over C-HDN catalyst at constant pressure 989
Figure 291. Comparison with normal-DAEM and experimental data for (a) residuum (b) CCR conversion over C-HDN catalyst at constant pressure 991
Figure 292. Comparison with experimental data from the nth power rate law and normal DAEM for (a) sulfur (b) nitrogen conversion over A-HDN catalyst at constant pressure (13.7 Mpa) 993
Figure 293. Comparison with experimental data from the nth power rate law and normal DAEM for (a) residuum (b) CCR conversion over A-HDN catalyst at constant pressure (13.7 Mpa) 995
Figure 294. Comparison with experimental data from the nth power rate law and normal DAEM for (a) sulfur (b) nitrogen conversion over B-HDN catalyst at constant pressure (13.7 Mpa) 997
Figure 295. Comparison with experimental data from the nth power rate law and normal DAEM for (a) residuum (b) CCR conversion over B-HDN catalyst at constant pressure (13.7 Mpa) 999
xxii

Figure 296. Comparison with experimental data from the nth power rate law and normal DAEM for (a) sulfur (b) nitrogen conversion over C-HDN catalyst at constant pressure (13.7 Mpa) 1001
Figure 297. Comparison with experimental data from the nth power rate law and normal DAEM for (a) residuum (b) CCR conversion over C-HDN catalyst at constant pressure (13.7 Mpa) 1003
Figure 298. Fractional conversion of lumped species versus reciprocal WHSV over the A-HDN catalyst at different temperatures and constant pressure 1008
Figure 299. Fractional conversion of lumped species versus reciprocal WHSV over the B-HDN catalyst at different temperatures and constant pressure 1010
Figure 300. Fractional conversion of lumped species versus reciprocal WHSV over the C-HDN catalyst at different temperatures and constant pressure 1012
Figure 301. Effect of reciprocal WHSV on viscosity over the HDN catalysts at different temperatures and constant pressure (13.7 Mpa) 1016
Figure 302. Yields of boiling fraction of bitumen conversion versus reciprocal WHSV over the A-HDN catalyst at different temperatures 1018
Figure 303. Yields of boiling fraction of bitumen conversion versus reciprocal WHSV over the B-HDN catalyst at different temperatures 1020
Figure 304. Yields of boiling fraction of bitumen conversion versus reciprocal WHSV over the C-HDN catalyst at different temperatures 1022
Figure 305. Fractional conversion of lumped species versus temperature over the A-HDN catalyst at LHSV = 0.2 and 0.28 h"1 and constant pressure 1025
Figure 306. Fractional conversion of lumped species versus temperature over the A-HDN catalyst at LHSV = 0.48 and 0.9 h"1 and constant pressure 1027
Figure 307. Fractional conversion of lumped species versus temperature over the B-HDN catalyst at LHSV = 0.2 and 0.28 h"1 and constant pressure 1029
Figure 308. Fractional conversion of lumped species versus temperature over the B-HDN catalyst at LHSV = 0.48 and 0.9 h"1 and constant pressure 1031
Figure 309. Fractional conversion of lumped species versus temperature over the C-HDN
xxiii

catalyst at LHSV = 0.2 and 0.28 h"1 and constant pressure 1033
Figure 310. Fractional conversion of lumped species versus temperature over the C-HDN
catalyst at LHSV = 0.48 and 0.9 h"1 and constant pressure 1035
Figure 311. Relationship of temperature dependence with reciprocal LHSV 1039
Figure 312. .Effect of temperature on viscosity over the HDN catalysts at different space velocities and constant pressure (13.7 Mpa) 1041
Figure 313. Yields of boiling fraction of bitumen conversion versus temperature over the A-HDN catalyst at LHSV = 0.2 and 0.28 h*1 and constant pressure 1046
Figure 314. Yields of boiling fraction of bitumen conversion versus temperature over the A-HDN catalyst at LHSV = 0.48 and 0.9 h"1 and constant pressure 1048
Figure 315. Yields of boiling fraction of bitumen conversion versus temperature over the B-HDN catalyst at LHSV = 0.2 and 0.28 h"1 and constant temperature 1050
Figure 316. Yields of boiling fraction of bitumen conversion versus temperature over the B-HDN catalyst at LHSV = 0.48 and 0.9 h"1 and constant pressure 1052
Figure 317. Yields of boiling fraction of bitumen conversion versus temperature over the C-HDN catalyst at LHSV = 0.2 and 0.28 h"1 and constant pressure 1054
Figure 318. Yields of boiling fraction of bitumen conversion versus temperature over the C-HDN catalyst at LHSV = 0.48 and 0.9 h"1 and constant pressure 1056
Figure 319. Effect of pressure on asphaltenes and nickel conversions over the HDN catalysts at LHSV = 0.48 h"1 and T = 664 K 1061
Figure 320. Effect of pressure on viscosity over the HDN catalysts at LHSV = 0.48 h"1 and T =
664K • 1063
Figure 321. Yields of boiling fraction of bitumen conversion versus pressure over the HDN catalysts at LHSV = 0.48 h"1 and T = 664 K 1066
Figure 322. Effect of catalyst on nitrogen conversion at different reciprocal WHSVs and temperatures 1069
Figure 323. Effect of catalyst on sulfur conversion at different reciprocal WHSVs and temperatures 1071
xxiv

Figure 324. Effect of catalyst on residuum conversion at different reciprocal WHSVs and temperatures 1075
Figure 325. Effect of catalyst on CCR conversion at different reciprocal WHSVs and temperatures 1077
Figure 326. Effect of catalyst on asphaltene conversion at different reciprocal WHSVs and temperatures 1080
Figure 327. Effect of catalyst on viscosity (measured at 313 K) at different reciprocal WHSVs and temperatures 1083
BITUMEN UPGRADING BY HYDROPYROLYSIS
Figure 328. Hydropyrolysis process development unit process flow diagram 1093
Figure 329. Revised hydropyrolysis process flow diagram 1095
xxv

LIST OF TABLES
WATER-BASED RECOVERY OF BITUMEN
Table 1. Physical Properties of Extracted Bitumens from Utah Oil Sands 34
Table 2. Fractional Composition (wt%) of the Utah Oil Sand Bitumens 35
Table 3. Surface Tension Values for North America Bitumens 41
Table 4. Comparison of Bitumen Surface Tension Values Calculated from Contact Angle Measurements with Bitumen Surface Tension Determined by Wilhelmy Plate Measurements (21 °C) 45
Table 5. Average droplet diameter (//m) for hexadecane emulsions with different chemicals added (30 mg/dm3 of SDS and 2 mg/dm3 of PERCOL 592) 65
Table 6. Average droplet diameter (/zm) for bitumen/kerosene emulsions with different chemicals added (9 mg/dm3 of SDS and 0.5 mg/dm3 of PERCOL 592) . . . . 75
Table 7. Sedimentation coefficient calculated from the first order sedimentation rate equation for hexadecane and bitumen/kerosene emulsions with different chemical added 82
Table 8. Bitumen recovery from Whiterocks oil sand in the presence and absence of aeration during digestion 106
Table 9. Experimental conditions of tar sand bitumen-rubber samples prepared in the autoclave 123
SUPERCRITICAL FLUID EXTRACTION OF OIL SAND BITUMENS FROM THE UINTA BASIN, UTAH
Table 10. Analyses of the gas used as SFE solvent 161
Table 11. Physical and chemical properties of Uinta Basin bitumens 163
Table 12. The Eacl for viscous flow for four bitumens from Uinta Basin (Utah) . . . . 167
Table 13. Simulated distillation analyses for bitumens analyzed 176
Table 14. Measured densities of commercial propane 182
xxvi

Table 15. Comparison of boiling fractions for four bitumens 241
Table 16. Summary of extraction yields and residual fractions analyses for the Whiterocks bitumen 245
Table 17. Summary of extraction yields and residual fractions analyses for the Asphalt Ridge bitumen 246
Table 18. Summary of extraction yields and residual fractions analyses for the PR Spring bitumen 247
Table 19. Summary of extraction yields and residual fractions analyses for the Sunnyside bitumen 248
COMPOSITIONAL ANALYSIS OF BITUMENS AND BITUMEN-DERIVED PRODUCTS
Table 20. Temperature program for simulated distillation 288
Table 21. Typical physical and chemical properties of bitumen 292
Table 22. Comparison of the extended method results 298
Table 23. Distillation cuts for four bitumens analyzed 300
FLUIDIZED BED PYROLYSIS OF OIL SANDS IN A THREE-INCH DIAMETER FLUIDIZED BED
Table 24. Auger specifications for Acrison BDF-1 feeder 353
Table 25. Statistical analysis of average feed rates for F-augers 362
Table 26. Statistical analysis of average feed rates for E-augers 363
Table 27. Whiterocks coked sands physical properties 369
Table 28. Whiterocks coked sands particle size distribution 370
Table 29. Experimental Umf using nitrogen fluidizing gas . 402
Table 30. Experimental Umf at different flow modes 403
Table 31. Values of minimum fluidization velocities at elevated temperatures 414
xxvn

Table 32. Reproducibility of product distribution and yields with the PR Spring oil sands in a fluidized bed pyrolysis reactor 427
Table 33. Effect of pyrolysis temperature on product distribution and yields for the PR Spring oil sands in a fluidized bed reactor 431
Table 34. Effect of solids retention time on product distribution and yields for the PR Spring oil sands in a fluidized bed reactor 434
Table 35. Effect of short solids retention time on product distribution and yields for the PR Spring oil sands in a fluidized bed reactor 439
Table 3 6. Effect of reactor temperature on the properties of the total liquid products produced from the PR Spring oil sands in a fluidized bed reactor 443
Table 37. Effect of average solids retention time on the properties of the total liquid products produced from the PR Spring oil sands in a fluidized bed reactor 447
FLUIDIZED BED PYROLYSIS OF OIL SANDS IN A LARGE DIAMETER REACTOR
Table 39. Gas analysis of run SNPRS13 486
Table 40. Input data file of run SNPRS13 487
Table 41. Results of mass balance calculations of run SNPRS13 488
Table 42. Sieve analysis of coked sand from PR Spring oil sands . 495
Table 43. Effect of reactor temperature on product yields and distribution 505
Table 44. Effect of solids residence time on product yields and distribution 509
Table 45. Rate constants(1) and stoichiometric coefficients for the model 515
Table 46. Effect of reactor temperature on liquid product quality 525
Table 47. Effect of solids residence time on liquid product quality 540
Table 48. Extent of bitumen upgrading 542
Table 49. Comparison of liquid products from rotary kiln and fluidized bed 544
TWO-STAGE THERMAL RECOVERY OF BITUMEN USING HEAT PIPES
xxviii

Table 51. Physical characteristics of pseudo-components 561
Table 52. First-order kinetic rate constants 563
Table 53. Stoichiometric constants 564
Table 54. Comparison of model with experiments 595
Table 55. Sensitivity of oil yield to activation energy values 604
Table 56. Summary of the results from the runs 632
Table 57. Weight fraction of asphaltenes in the product liquid 641
Table 58. Results of some energy balance calculations 656
IN SITU TECHNOLOGIES: STEAM ASSISTED GRAVITY DRAINAGE (SAGD)
Table 59. Overview of the horizontal well drilling projects 680
Table 60. Oil and water viscosities as functions of temperature 688
Table 61. Input data for most simulations 690
Table 62. Effect of grid block size (z) on WOR and CPU time 691
UINTA BASIN BITUMEN HYDROTREATING CATALYTIC UPGRADING OF THE PR SPRING BITUMEN OVER A COMMERCIAL HDM CATALYST
Table 63. Physical and chemical properties of PR Spring bitumen 727
Table 64. Process operating conditions 731
Table 65. Effects of temperature on product properties of the hydrotreated bitumen . 733
Table 66. Effects of WHSV on product properties of the hydrotreated bitumen . . . . 735
Table 67. Effects of reactor pressure on product properties of the hydrotreated bitumen . . 741
UINTA BASIN BITUMEN HYDROTREATING: CATALYTIC UPGRADING OF THE PR SPRING BITUMEN OVER A COMMERCIAL HDN CATALYST
xxix

Table 68. Physical and chemical properties of PR Spring bitumen-derived heavy oil . 746
Table 69. The process operating conditions employed in this study 751
Table 70. Effect of LHSV on product properties of the hydrotreated PR Spring bitumen-derived heavy oils 752
Table 71. Effect of temperature on product properties of the hydrotreated PR Spring bitumen-derived heavy oils 758
UINTA BASIN BITUMEN HYDROTREATING: THERMAL CONVERSION OF THE PR SPRING BITUMEN-DERIVED HEAVY OIL IN THE PRESENCE OF NA/ALUMINA
Table 72. Physical and chemical properties of PR Spring bitumen-derived heavy oil . 766
Table 73. The process operating conditions employed in this study 770
Table 74. Effect of WHSV on product properties of the thermally cracked PR Spring bitumen-derived heavy oils 771
Table 75. Effect of temperature on product properties of the thermally cracked PR Spring bitumen-derived heavy oils 777
UINTA BASIN BITUMEN HYDROTREATING: A COMPARISON OF CATALYTIC AND THERMAL EFFECTS DURING HYDROTREATING OF BITUMEN-DERIVED HEAVY OILS
Table 76. Physical and chemical properties of PR Spring bitumen-derived heavy oil . 787
Table 77. Properties of the HDN and HDM catalysts and the sodium-impregnated alumina 788
HYDROTREATING KINETIC STUDY FOR PR SPRING BITUMEN-DERIVED HEAVY OILS OVER HDN AND HDM CATALYSTS
Table 78. Physical and chemical properties of native PR Spring bitumen 811
Table 79. The process operating conditions 813
Table 80. Kinetic parameters from parallel-consecutive reaction model 830
Table 81. k ,̂,, Eapp and obtained at different pressures from parallel-consecutive reaction model 846
xxx

UINTA BASIN BITUMEN HYDROTREATING: CATALYTIC UPGRADING OF THE ASPHALT RIDGE BITUMEN
Table 82. Physical and chemical properties of the Asphalt Ridge bitumen 881
Table 83. Chemical composition and physical properties of HDN catalysts 887
Table 84. Comparison with physical properties of fresh and spent HDN catalysts . . . 898
Table 85. Process operating conditions studied in B-HDN catalyst (Y series) 904
Table 86. * Process operating conditions studied in C-HDN catalyst (T series) 905
Table 87. Process operating conditions studied in A-HDN catalyst (F series) 906
Table 88. Elemental analyses of the total liquid products produced over the B-HDN catalyst 908
Table 89. Elemental analyses of the total liquid products produced over the C-HDN catalyst 909
Table 90. Elemental analyses of the total liquid products produced over the A-HDN catalyst 910
Table 91. Selected properties of liquid products produced over the B-HDN catalyst . 916
Table 92. Selected properties of liquid products produced over the C-HDN catalyst . 917
Table 93. Selected properties of liquid products produced over the A-HDN catalyst . 918
Table 94. The viscosity of liquid products produced over the B-HDN catalyst 919
Table 95. The viscosity of liquid products produced over the C-HDN catalyst 920
Table 96. The viscosity of liquid products produced over the A-HDN catalyst 921
Table 97. Product distributions and yields of hydrocarbon gases produced over the B-HDN catalyst 923
Table 98. Product distributions and yields of hydrocarbon gases produced over the C-HDN catalyst 924
Table 99. Product distributions and yields of hydrocarbon gases produced over the A-HDN
xxxi

catalyst 925
Table 100. Product distributions and yields produced over the B-HDN catalyst 926
Table 101. Produce distributions and yields produced over the C-HDN catalyst 927
Table 102. Product distributions and yields produced over the A-HDN catalyst 928
Table 103. Apparent kinetic parameters from nth power rate law at constant pressure (13.7 Mpa) 943
Table 104. Comparison with nth Power Rate Law (NPRL) and Asymptotic Lumped Kinetic Model (ALKM) for reaction orders 954
Table 105. Apparent kinetic parameters from overall nth Power Rate Law at constant pressure (13.7 Mpa) 956
Table 106. Apparent kinetic parameters from exponential-distributed activation model at constant pressure (13.7 Mpa) 972
Table 107. Apparent kinetic parameters from gamma-distributed activation model at constant pressure (13.7 Mpa) 976
Table 108. Apparent kinetic parameters from normal-distributed activation model at constant pressure (13.7 Mpa) 980
Table 109. Comparison of apparent kinetic parameters from the overall nth Power Rate Law and normal-distributed activation model at constant pressure (13.7 Mpa). 1005
Table 110. Comparison between conversions of nickel and asphaltenes over the HDN catalysts 1014
Table 111. Temperature dependence of lumped species over the HDN catalysts at constant pressure (13.7 Mpa) 1037
Table 112. Gibbs free energy of activation and internal energy of vaporization of the hydrotreated bitumen derived liquid produced over the HDN catalysts . . 1044
Table 113. Apparent rate constant (k) and reaction order ((3) of hydrogen partial pressure determined from nth Power Rate Law at T = 664 K and LHSV = 0.48 h_1 . . .
1059
Table 114. Comparison with first and second pass hydrotreating over the A-HDN catalyst at
xxxii

constant pressure (13.7 Mpa) 1085
XXXlll

1
EXECUTIVE SUMMARY
Principal Investigator: A.G. Oblad
The Oil Sand Research and Development Group at the University of Utah revised and
updated the environmental assessment of the impact of projected program-related activities for the
1994-1996 contract period in accordance with the requirement's of the National Environmental
Policy Act.
The surface tension of toluene-extracted bitumens from the Whiterocks, Sunnyside, PR
Spring, Asphalt Ridge, and Circle Cliffs oil sands was determined by the Wilhelmy plate
technique and found to be 20.6 mNra"1, 21.3 mNnT1, 31.2 mNm"1, 28.9 mNnV1, and 29.3 mNm'1
at 333 K, respectively. No apparent correlation between the bitumen surface tension and
fractional composition of bitumen was observed.
A linear relationship between the bitumen surface tension and temperature was found for
Utah bitumens examined in the temperature range of 310-356 K (depending on bitumen sample).
The temperature coefficient for surface tension was calculated to be -0.077 mNm'Meg"1, -0.063
mNnf'deg-1, -0.097 mNrn'deg1, -0.078 mNm'deg1, and -0.093 mNm'deg1, for the Whiterocks,
Sunnyside, PR Spring, Asphalt Ridge, and Circle Cliffs bitumen, respectively.
The contact angles for water drops at the surface of bitumen films were measured and the
bitumen surface tension at 294 K was calculated from Neumann's equation-of-state. The contact
angle technique provided comparable values for the bitumen surface tension at room temperature
2
for the Whiterocks, Sunnyside, and PR Spring samples. Significant discrepancies between the
bitumen surface tension values as obtained from the contact angle technique and as obtained from
direct measurements with the Wilhelmy plate technique were found for the Asphalt Ridge and
Circle Cliffs bitumens. In this regard, the contact angle technique, which is based on Neumann's
equation-of-state and contact angle measurements, may not be valid and, in any event, is limited
to a small temperature range.
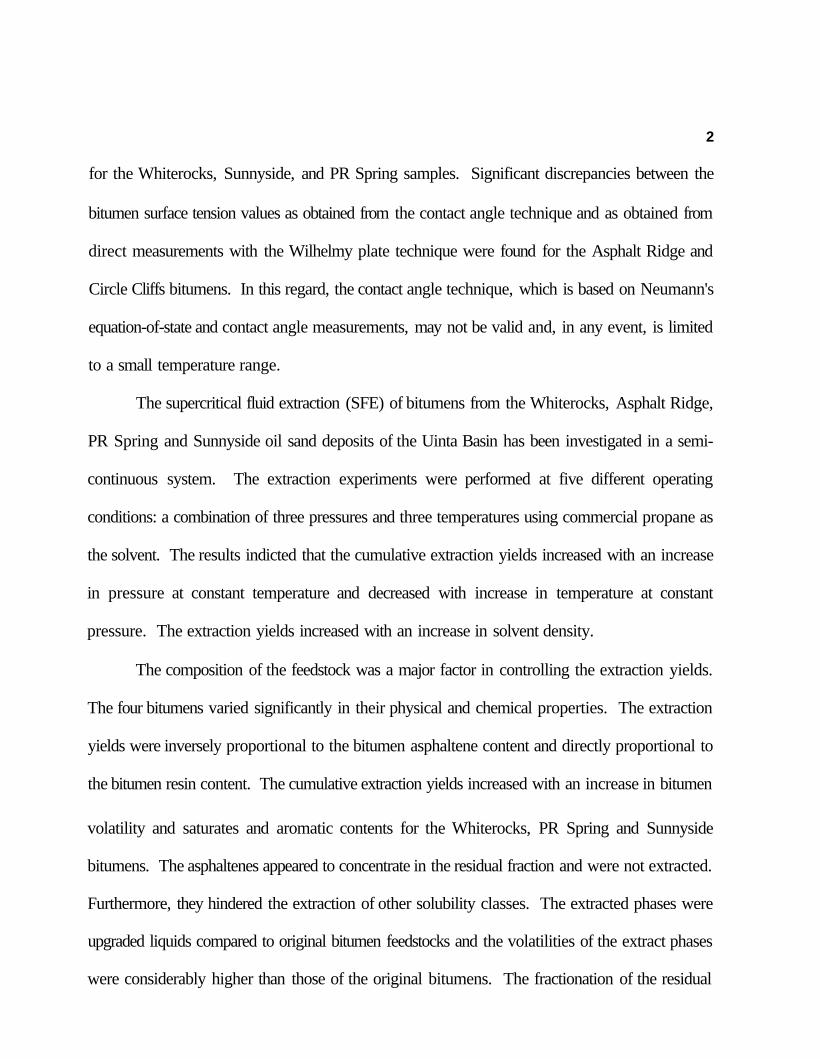
The supercritical fluid extraction (SFE) of bitumens from the Whiterocks, Asphalt Ridge,
PR Spring and Sunnyside oil sand deposits of the Uinta Basin has been investigated in a semi-
continuous system. The extraction experiments were performed at five different operating
conditions: a combination of three pressures and three temperatures using commercial propane as
the solvent. The results indicted that the cumulative extraction yields increased with an increase
in pressure at constant temperature and decreased with increase in temperature at constant
pressure. The extraction yields increased with an increase in solvent density.
The composition of the feedstock was a major factor in controlling the extraction yields.
The four bitumens varied significantly in their physical and chemical properties. The extraction
yields were inversely proportional to the bitumen asphaltene content and directly proportional to
the bitumen resin content. The cumulative extraction yields increased with an increase in bitumen
volatility and saturates and aromatic contents for the Whiterocks, PR Spring and Sunnyside
bitumens. The asphaltenes appeared to concentrate in the residual fraction and were not extracted.
Furthermore, they hindered the extraction of other solubility classes. The extracted phases were
upgraded liquids compared to original bitumen feedstocks and the volatilities of the extract phases
were considerably higher than those of the original bitumens. The fractionation of the residual

3
fractions into solubility fractions indicated that the saturates and aromatic were preferentially
extracted from the bitumen relative to asphaltenes and resins. This phenomena was confirmed by
reduction in the H/C ratio of the residual fractions.
The SFE of Asphalt Ridge and Sunnyside bitumen was modeled using continuous
thermodynamics principles and the Peng-Robinson equation of state. A process flow diagram was
suggested to upgrade bitumens using supercritical fluid extraction and separation technology.
Suitable operating conditions such as pressure, temperature and solvent-to-feed ratio were
identified for the proposed extraction and separation process concept. The modeling successfully
fit the experimental observations.
A high temperature simulated distillation technique was developed along with software to
extend the ASTM D2887 and D5307 techniques to estimate the boiling point of heavy oils from
811 K to 973 K.
The residual drum quantity samples of the mined oil sand ores from the Circle Cliffs,
Whiterocks, Asphalt Ridge, PR Spring and Sunnyside oil sands deposits which were obtained for
use in the University of Utah Oil Sand Research and Development Program have been discarded.
The contents of the drums were transferred to a dump truck and were taken to Staker Asphalt for
use as feedstock for the preparation of hot mix asphalt paving material. The drums were cleaned
and recycled as scrap metal.
The studies related to the 3-inch diameter flluidized bed oil sand pyrolysis reactor included
coked sands and oil sands feeding using a bin discharge auger feeder, the withdrawal of solids
from a fluidized bed using a modified L-valve, fluidization-defluidization experiments using
different fluidization modes, and the determination of minimum fluidization velocities at ambient

4
and elevated temperatures and pyrolysis of the PR Spring oil sands.
The feeder study results indicated that the modified Acrison bin discharge feeder with a
water cooled E-auger provided linear and reproducible oil sands feed rates from 1 to 10% of the
full range of the feeder motor speed controller. The feeder study confirmed that predictable and
reproducible feed rates were possible with a solid fight C-auger when feeding coked sands.
The coked sands withdrawal device was a modified pneumatic L-valve with an auxiliary
aeration port. The variables studied included the lengths of the vertical and horizontal sections,
the location of the primary gas injection port, and the injection gas flow rates. The results
indicated that the effect of the length of the vertical section on solids withdrawal rate was not a
significant variable. Solids flowed freely due to gravity when the length of the horizontal section
was less than two times its diameter. The solids flow rate decreased as the length of the horizontal
section increased. The maximum solids flow rate was obtained when the injection gas port was
located 1.3 cm behind the center line of the vertical section. The solids flow rate decreased when
the gas injector was moved in either direction.
Fluidization studies were conducted with the coked sands produced from previous oil sands
pyrolysis experiments. The fluidization experiments indicated that the coked sands, which were
group B particles according to Geldart's classification system, had a minimum fluidization velocity
of 1.41 cm/s in the regular fluidization mode, 1.35 cm/s in the reduced pressure fluidization
mode, and 1.62 cm/s in the pull fluidization mode. Three different fluidization modes have been
identified and the pressures in the reactor for the three modes have also been analyzed. The
fluidization curves obtained with a tapered gas distributor have been obtained. Fluidization studies
at elevated temperatures (>373 K) indicated that empirical minimum fluidization velocity

5
correlations developed at ambient temperatures were incapable of predicting minimum fluidization
velocities at elevated temperatures. An alternative relationship was developed in this study in
which the minimum fluidization velocity was determined to be 2.03-2.02xlO"3T cm/s in the
temperature range from 297 to 623 K.
The mined oil sands ore used in the pyrolysis studies was obtained from the PR Spring oil
sands deposit. The influence of reactor temperature and solids retention time on the product
distribution and yields and on the total liquid product qualities was determined in the pyrolysis
process variable study. The total liquid yields increased as the reactor temperature increased in
the range from 723 to 773 K at a fixed solids retention time of 30 minutes. A maximum yield of
84.2 wt% was obtained at a reactor temperature of 773 K. The liquid yields decreased slightly
as the reactor temperature was increased from 773 to 798 K. The coke yields decreased as the
reactor temperature increased from 723 to 773 K. The coke yield was insensitive to the reactor
temperature above 773 K. The hydrocarbon gas (C, to C4) yields increased with reactor
temperature from 723 to 798 K.
The total liquid product yields ranged from 80 to 84 wt% based on bitumen fed to the
reactor as the solids retention time increased from 18.5 to 39 min at a constant reactor temperature
of 773 K. The coke yields increased slightly with solids retention time. The hydrocarbon gas (C,
to C4) yields were insensitive to solids retention time. The shortest solids retention time achieved
for the pyrolysis of the PR Spring oil sands in this system was 18.5 min. The reactor had a
tendency to plug with unreacted oil sands at solids retention times below about 20 min.
The total liquid produced in the pyrolysis studies were significantly upgraded relative to
the bitumen.

6
Pyrolysis experiments with PR Spring oil sands were also conducted in a 6-inch diameter
pilot scale fluidized bed reactor. The effect of reactor temperature and solids residence time on
product distribution and yields was investigated. The liquid products (C5+) were analyzed to
determine the extent of bitumen upgrading achieved in the process and to study the effect of
process variables on the quality of the liquid product. The reactor temperature varied between 723
and 808 K and the solids residence time varied between 20 and 50 min. The fluidization gas flow
rate was maintained constant at 5380±141 SCFH (approximately five times the minimum
fluidization velocity) in all experiments.
The liquid yields obtained in this investigation were significantly higher than those obtained
with laboratory scale reactors and a pilot scale rotary kiln reactor (77 to 82 wt% as compared to
45 to 70 wt%, respectively). Concomitant with the increase to liquid yields was a decrease in
light gas (CI to C4) yields (1-6 wt% as compared to 15-22 wt%, respectively). The product
distribution and yields did not exhibit discernible trends with reactor temperature and solids
residence time. These results were presumed to be related to suppression of secondary cracking
reactions due to rapid removal of primary cracked pyrolysis products from the reactor. It is
proposed that the superior quality of fluidization and elimination of slugging due to the "pull"
mode of fluidization and larger diameter of the reactor were responsible for better mixing and
increased mass transfer rate between the emulsion and bubble phases in the fluidized bed. This
led to a reduction in the effective residence time of the primary pyrolysis products and a
suppression of secondary cracking reactions.
The liquid products obtained in this investigation were upgraded compared to the bitumen
in terms of volatility, viscosity, molecular weight, pour point, Conradson carbon residue,

7
asphaltenes content, and trace metals (Ni and V) contents. The nitrogen and sulphur contents of
the total liquid products were also reduced relative to the bitumen. The reactor temperature had
a minor effect on the liquid product quality. The liquid products obtained at high reactor
temperatures (>748K) were only slightly more upgraded than those produced at low reactor
temperatures (<748K). The solids residence time did not appear to exert any influence on liquid
product quality.
Based on the results of this study, the following set of process conditions are recommended
for fluidized bed pyrolysis of PR Spring oil sands: reactor temperature, 748K; solids residence
time, 20 min; fluidization gas velocity, 5 time Umf; and settled reactor height to diameter ratio
(H/D), 1.9.
A thermal process involving coupled fluidized-bed reactors has been developed at the
University of Utah for thermal extraction of tar sand bitumen and has been described in previous
reports. During this reporting period, the development of a comprehensive model for the process
was completed, which incorporates sub-models for fluidization hydrodynamics, pyrolysis and
combustion kinetics, mass and heat transfer, material and energy balances, and the heat pipes that
couple the two fluidized beds.
The model was used to determine optimal process conditions for maximizing oil yields and
minimizing process energy requirements. The model predicts that a pyrolysis temperature .of
475°C and a combustion temperature of 600°C are optimum. The model accounts for differences
in yields of different tar sands on the basis of the chemical nature of compounds present in the
bitumen. • However, due to the complexity of the pyrolysis process, more information about the
chemistry of pyrolysis of bitumen i§ needed for making predictions with more certainty.

8
Experiments were carried out to verify the model and the predicted optimal operating
conditions. The simulation results compared well with experimental results obtained for
Whiterocks tar sand. Material balances on the experimental data included quantifying the amount
of light gases (by gas chromatography), liquid product, and coke formed on the sand. Energy
balances were used to determine the effectiveness of the head pipes. The two main operating
parameters predicted by the model and verified by experiments were the pyrolysis temperature and
sand residence time. The quality of the liquid product was determined by measuring its specific
gravity, viscosity, pour point, Conradson Carbon Residue, and simulated distillation fractions.
Using the ASPEN Plus simulator, a cost analysis was completed for a hydrotreating plant to
upgrade the oil produced from the bitumen.
A heat recovery flowsheet was added to the scaled-up version of the model and the entire
process was optimized. The optimal pyrolysis temperature, pyrolysis sand residence time, and
combustion temperature were obtained. An optimal control strategy was developed, using
experimental data, to find the optimal trajectories for the pyrolysis temperature and residence
time, while minimizing a selected cost function.
The steam assisted gravity drainage (SAGD) method of thermal in situ oil recovery from
bitumen bearing sandstones has been evaluated for potential application to Utah oil sands.
Sensitivity studies were conducted using a thermal reservoir simulator. A gravity driven process
such as SAGD is expected to be sensitive to the grid size in the vertical direction. A
comprehensive set of simulations were performed to examine the effect of grid size on simulation
results. In a process where the injectors and producers are placed in close proximity, the injection
and reservoir pressure are of importance. Hence these parameters were studied. Permeabilities,

9
both vertical and horizontal are also expected to play a significant role.
Grid size sensitivity studies revealed that using blocks of six to ten feet thickness provided
adequate resolution without requiring inordinate amounts of computer time. Best results were
obtained by using grid blocks of various size. Regions of high activity such as near the well bore
consisted of five foot thick grid blocks, while areas near the edge of the reservoir were adequately
represented with 20 foot thick grid blocks.
Several sensitivity comparisons were made between the source-sink model and the
discretized well bore model. A discretized well bore model allocates space within the simulation
to account for the actual physical presence of the well bore. This method is much more rigorous,
but also much more time intensive, than the source-sink model. Results indicated no significant
differences in the output data between the two models.
Changes in reservoir pressures did not noticeably effect the amount of oil recovered as long
as the pressure difference between injector and reservoir was greater than 50 psi. Smaller pressure
differences greatly reduced the recovery efficiencies. Output from the simulations indicates a
strong correlation between high recovery efficiencies and high reservoir permeability. This
relationship is most noticeable at lower permeability levels, where a permeability increase of just
0.1 Darcy, in the vertical direction, resulted in a four-fold increase in recovery efficiency.
A comparison of two main types of well patterns — vertical injector / horizontal producer
and horizontal injector / horizontal producer was made. The study compared the recovery
efficiencies associated with one-, two-, and three- well patterns during a 7-year project lifetime.
Efficiencies were calculated based on the percent recovery of the original oil in place (%OOIP).
Additionally, comparisons of the volume of water injected versus the volume of oil recovered

10
(water-to-oil ratio) were made. On an efficiency basis, the best results of the wells patterns
studied were obtained in the closely spaced (100 ft), 3 horizontal pairs system. While the 3
vertical injector / one horizontal producer system consistently produced at a lower efficiency than
the 3 horizontal pairs system, the difference was small enough to suggest that from an economic
standpoint, the former process might be preferable to the latter. Similar results were found among
the four and two well systems.
PR Spring bitumen was hydrotreated in a fixed-bed reactor over a commercial Mo/alumina
hydrodemetallation (HDM) catalyst. Hydrodenitrogenation (HDN), hydrodesulfurization (HDS),
hydrodemetallation, Conradson carbon residue (CCR) reduction, and residuum conversion were
studied as a function of process operating conditions (T=625-685K, WHSV=0.26-1.55 h"1 and
reactor pressure=l 1.1-16.6 Mpa). The hydrogen-to-oil ratio was fixed at 890 m3/m3 (5000 scf
H2/bbl). The degree of sulfur removal was greater than residuum conversion and nitrogen
removal with increasing temperature and contact time. Nitrogen conversion was lower than the
conversions of the other species in all cases. Reactor pressure did not exert a significant influence
on nitrogen and sulfur removal and CCR and residuum conversion.
The hydrotreating of PR Spring bitumen-derived heavy oils was studied in a fixed-bed
reactor over a presulfided commercial NiMo/alumina hydrodenitrogenation catalysts. The extent
of heteroatom and metal removal and of Conradson carbon (CCR) and residuum (>811 K)
conversion were determined in terms of process operating variables. The operating variables
investigated were temperature (625-685 K) and liquid hourly space velocity (0,14-0.80 h'1).
Pressure and hydrogen-to-oil ratio were fixed at 13.7 Mpa and 890 m3/m3 (5000 scf H2/bbl);
respectively, in all experiments.

11
Product distributions and yields of the hydrotreated bitumen-derived heavy oils were
determined. The degree of nickel, nitrogen and sulfur removal and of CCR and residuum
conversion was significant as reciprocal LHSV increased at a fixed temperature and as temperature
increased at a fixed LHSV. The residuum fraction (> 81 IK) conversion increased significantly
with residence time concomitantly the yields of gas oil (617-81 IK), distillate (477-617K), naphtha
(IBP-477K) and C,-Q gases increased. Residuum conversion to volatiles was significant at higher
temperatures. The yield of distillate, naphtha and gas increased rapidly at higher temperatures.
The thermal cracking of PR Spring bitumen-derived heavy oils in the presence of hydrogen
was studied in a fixed-bed reactor as a function of process operating variables. The reactor was filled
with a catalytically inert sodium exchanged alumina. The packing consisted of an alumina
hydrodenitrogenation catalyst support which had been impregnated with 2 wt% sodium to reduce the
acidity of the alumina. Thermal reactions were investigated with regard to denitrogenation,
desulfurization, demetallation, Conradson carbon residue (CCR) reduction and residuum conversion.
The process operating variables investigated were temperature (642-683 K), and WHSV (0.25-0.74
-1 3 3 h ). The reactor pressure and hydrogen-to-oil ratio were fixed at 13.7 MPa and 890 m /m (5000
scf H2/bbl); respectively, in all experiments The product distributions and yields were also
determined as a function of process operating variables.
Residuum conversion over the sodium-impregnated catalyst support was greater in all cases
relative to nitrogen and sulfur removal due to thermal cracking of the residuum. Only low levels of
heteroatom conversion were possible via thermal reactions. The extent of nitrogen removal over the
sodium-impregnated catalyst support was lower than that of all other classes of component-types.
Significant levels of CCR conversion were obtained despite the absence of metal sulfides on the

12
alumina and were attributed to hydrothermal conversion.
The relative magnitude of catalytic and thermal reactions during the hydrotreating of PR
Spring bitumen-derived heavy oil was evaluated in a fixed-bed reactor as a function of temperature,
residence time and catalyst selection. The relative effects of thermal and catalytic reactions were
evaluated by hydrotreating the PR Spring bitumen-derived heavy oil over three catalysts: sulfided
NiMo/alumina HDN catalyst, Mo/alumina HDM catalyst and sodium-impregnated alumina. Catalytic
and thermal effects for each of the catalysts were evaluated under a range of temperature (625-685
K) and liquid hourly space velocity (0.14-0.81 h'1). The reactor pressure, 13.7 MPa, and the
hydrogen-to-oil ratio, 890 m3/m3 (5000 scf H2/bbl), were fixed in all experiments.
The catalysts activities were ranked as follows: HDN catalyst > HDM catalyst > sodium-
impregnated alumina based on their activities for nitrogen, sulfur and nickel removal as well as for
the conversion of Conradson carbon residue (CCR) and residuum. The catalyst activities were
strongly dependent on the metal loading and were dependent, to a lesser extent, on the acidity of the
alumina support. CCR and residuum conversion was closely linked relative to heteroatom and metal
removal. This is attributed to a significant overlap between moieties which are classified as CCR
precursors and moieties which are classified as residuum. Catalyst selection significantly affected
residuum conversion. This is because the high catalyst densities employed in packed bed reactors
accentuate catalytic reactions relative to thermal reactions. Although sulfur was generally more
reactive than nitrogen, sulfur conversions in excess of 70% were difficult to achieve. It was presumed
that 30-40% of the sulfur was asphaltic in nature and exhibited low reactivity. For this reason it was
easy to achieve significant sulfur conversion as low severities, but difficult to achieve deep
desulfurization at high severities. The deactivation rates of HDN and HDM catalysts were 0.06 and

13
0.02°API/day, respectively.
The kinetics of removal of nitrogen, sulfur and metals, as well as, conversion of Conradson
carbon residue (CCR) and residuum were studied in a fixed-bed reactor. These studies were
performed with commercial NiMo/alumina hydrodenitrogenation and Mo/alumina hydrodemetallation
catalysts. Bitumen-derived heavy oils from the PR Spring oil sand were hydrotreated under a range
of process conditions. The process conditions included reactor temperature (625-685 K), space
velocity (0.14-0.81 h"1) and total reactor pressure (11.1-16.6 Mpa).
Conversion data were modeled with a pseudo nth order kinetic model and a parallel-
consecutive reaction model. It was found that hydrodenitrogenation over HDN and HDM catalysts
followed pseudo nth order kinetics. Hydrodesulfurization and hydrodemetallation and CCR and resid
conversion data were correlated with a parallel-consecutive reaction model.
The bitumen extracted from Asphalt Ridge oil sands was hydrotreated over three sulfided
NiMo/y-Alumina hydrodenitrogenation catalysts in a fixed bed reactor to study the extent of
upgrading as a function of process variables and catalyst. The process variables investigated were
temperature (619-685 K), liquid hourly space velocity (0.18-0.95 h"1), and pressure (11.1-15.3 Mpa).
The hydrogen/oil ratio was fixed at 890 m3/m3 in all experiments.
The effects of process variables and catalyst on hydrodenitrogenation, hydrodesulfurization,
and hydrodemetallation, and on Conradson carbon residue (CCR), asphaltenes, and residuum
conversion, viscosity reduction, and yields and product distribution were investigated. Temperature
and space velocity exerted a greater influence on heteroatom reduction and conversion than pressure.
High surface area was a dominant factor for species conversion in the lower temperature regime,
whereas high surface area and wide pore size distribution appeared to exert equivalent effects at

14
temperatures above 684 K.
Significant upgrading of the bitumen was achieved after secondary hydrotreating of the liquid
product produced at the severest conditions (temperature of 684 K, LHSV of 0.2 h"1, pressure of 13.7
Mpa) in primary hydrotreating. The total conversions of sulfur, CCR, nitrogen, asphaltenes, and
residuum were 99.5, 95.0, 94.8, 92.2, and 79.8 wt%, respectively. The viscosity, measured at 313
K, was reduced by a factor in excess of four orders of magnitude. The total weight fraction of
naphtha plus distillate was 48% and increased fourfold compared with that of the bitumen.
It was concluded that the refractory fraction, 20 wt%, of the residuum contained little CCR
and asphaltenes andwas more difficult to convert than asphaltenes.
The conversions of sulfur, nitrogen, CCR, and residuum in bitumen were successfully modeled
by nth power rate law kinetics and by a distributed activation energy model using a normal
distribution function. Higher-order kinetics was required to represent the conversions of lumped
sulfur, nitrogen, CCR and residuum. The asymptotic lumped kinetic model used to describe
hydrodesulfurization was supported experimentally.
The hydropyrolysis reactor system was reassembled and preliminary pressure and flow tests
were conducted with a modified mixing nozzle design. Regrettably, no funding was available to carry
• out actual hydropyrolysis experiments.

15
INFORMATION REQUIRED FOR THE
NATIONAL ENVIRONMENTAL POLICY ACT (NEPA)
Principal Investigator: A.G. Oblad Co-Principal Investigators: M. D. Deo
F.V. Hanson
INTRODUCTION
The information required for compliance with the National Environmental Protection
Act (NEPA) has been documented in this section. This final report has been prepared to
reflect the research and development activities performed under the cooperative agreement
94MC30256 between the University of Utah, Department of Chemical and Fuels Engineering
and the U.S. Department of Energy. Detailed descriptions of the individual projects, process
flow diagrams for the various oil sand recovery technologies, laboratory locations,
environmental impacts, health and safety procedures, etc. have been documented in detail in
the 1991-92 final report for the cooperative agreement 89MC26268(1). An updated NEPA
checklist and the information required for a CX-B exclusion determination were reported in the
1992-1993 final report for the cooperative agreement 89MC26268(2). The proposed program
for the current contract does not include any experimental activity which would result in the
generation of additional gaseous, liquid and solid wastes over and above those indicated in the
detailed [1] and updated [2] reports submitted previously. All liquid and solid waste materials
produced during the course of the experimental program will be processed through the EPA
approved University of Utah Safety Services disposal system.
This section includes an NEPA checklist and a brief description of the 1993-1994
University of Utah oil sand research and development program and its overall environmental
16
impact. The information provided essentially qualifies the program for CX-B exclusion
determination.
NEPA CHECKLIST
1. Date: 7-16-96 NEPA Number
2. Activity/Project Name Recovery of Bitumen from Western Sands
3. Project Manager/Branch/Division J.D. Westhoff. LFT Br.. FRM Div
4. Project/Activity Description Include purpose, location, site
map (proved figure or map if appropriate)
construction requirements, schedule,
operation processes.
This action is in response to the (DE-FC-21-93 MC30256) application for the
cooperative agreement with the University of Utah, Department of Chemical and Fuels
Engineering. A similar cooperative agreement was in place between the U.S. DOE and the
Department of Fuels Engineering, University of Utah (89MC26286) since 1989. The
Department of Chemical Engineering and the Department of Fuels Engineering merged in
September of 1992 and now exist as a single department. NEPA approval for the program and
the activities conducted under the former cooperative agreement (89MC26286) has been
documented in a memo (dated Nov. 1990). The current program is a continuation of the effort
to develop commercial processes for the recovery of oil from the extensive tar sand resource
base in Utah and for the upgrading of the oil recovered. During the past 15 years, the
program has produced a comprehensive body of scientific and engineering data related to the

17
characterization and processing of the Utah tar sands and has evaluated numerous options for
bitumen upgrading.
The program is composed of 20 projects, of which 17 are laboratory bench or
laboratory pilot scale processes or computer process simulations that are performed in existing
facilities on the University-of Utah campus in north-east Salt Lake City. These tasks are:
1. Coupled fluidized-bed bitumen recovery and coked sand combustion
2. Water-based recovery of bitumen
3. Oil sand pyrolysis in a continuous rotary kiln reactor
4. Oil sand pyrolysis in a large diameter fluidized bed reactor
5. Oil sand pyrolysis in a small diameter fluidized bed reactor
6. Combustion of spent sand in a transport reactor
7. Recovery and upgrading of oil sand bitumen using solvent extraction methods
8. Fixed-bed hydrotreating of Uinta Basin bitumens and bitumen-derived hydrocarbon liquids
9. Ebullieted bed hydrotreating of bitumen and bitumen derived liquids
10. Bitumen upgrading by hydropyrolysis
11. Evaluation of Utah's major oil sand deposits for the production of asphalt, high-energy jet
fuels and other specialty products
12. Characterization of the bitumens and reservoir rocks from the Uinta Basin oil sand deposits
13. Bitumen upgrading pilot plant recommendations
14. Liquid-solid separation and fine tailings thickening
15. In-situ production of heavy oil from Uinta Basin oil sand deposits
16. Oil sand research and development group analytical facility
17. Process economics
A site map showing the location of the project laboratories on the University of Utah
campus is attached as Figure 1. There are no earth moving or construction requirements for
the program or its projects. The Departments of Chemical and Fuels Engineering and

1!
18
- - - - life wmim ! » S ? i ilJllJ
ISIS-SSIIIIIISM ils^MrtsHI
fe
lil«III!IIIIiliIII
If hH 11 %!*
^r i i i r r i ?M=iii!§
. SilL fefthfUJi I mi **m;m iiliipi!Ss
\s*mm -mam •8" ?
.8 s * * l llliii
I s
5s
fill S'S'gg ffff
Figure 1. Location site map University of Utah

19
Metallurgical Engineering operate under the University of Utah, Department of Safety
Services, which is responsible for compliance with the U.S. EPA, state an city permits.
Hazardous waste management and Chemical Hygiene programs are operated by the University
of Utah Department of Safety Services. The air and water effluents from the University are
monitored by the city and the state. The hazardous waste disposal program is monitored by
the U.S. EPA and the chemical hygiene program is monitored by OSHA.
5. Brief Description of Affected Environment State if previously disturbed occupied, or
vacant. Indicate in a few words the type of
cover (e.g. grasslands, woods, natural,
landscaped), or habitat types known.
The program and all the projects are located at the University of Utah campus in north
east Salt Lake City. The University of Utah is a major public educational a research institution
with an enrollment of about 26,000 students. The University of Utah employs 3,400 full-time
faculty and 30,000 personnel in its various facilities. The campus has 233 buildings, including
about 1,400 research laboratories all of which are located on 1,480 acres.
6. Environmental Concerns Will the project/activity, either during construction or operation,
result in changes or disturbances to the following entities? Provide brief explanations to any
"yes" answers.
6.1 Threaten a violation of applicable statutory, regulatory, or permit requirements for
environment, safety, and health requirements for DOE orders?
Yes No X Unknown

20
6.2 Require siting and construction or major expansion of waste storage, disposal recovery, or
treatment facilities?
Yes No X Unknown
6.3 Uncontrolled or unpermitted releases resulting from hazardous substances, pollutants or
CERCLA-excluded petroleum and natural gas products that preexist in the environment?
Yes No X Unknown
6.4 Adversely affect environmentally sensitive resources including:
4.a Threatened/Endangered Species or Critical Habitat Areas
Yes No _X Unknown
4.b Flood Plains/Wetlands
Yes No _X Unknown
4.c Archaeological/Cultural Resources
Yes No _X Unknown
4.d Prime, Unique or Important Farmland
Yes No _X Unknown
4.e Special sources of Groundwater (sole source aquifer, etc.)
Yes No _X Unknown
4.f Tundra, Coral Reefs, Rain Forests, Coastal Zones
Yes No _X Unknown
4.h National Parks, Wild and Scenic Rivers, Waters of the State, etc.
Yes No _X Unknown
4.i CAA Criteria Pollutants (7)
Yes No Unknown X
Cumulative gaseous emissions under the current operating conditions will be about 500
kg per year of which 97% would be comprised of carbon dioxide and water vapor. The
composition of the remaining 3% or 15 kg per year of he emissions is speculative.

21
7. Additional Information Will the project/activity...
7.1 affect water use and quality, including sedimentation, and discharge of point/nonpoint
source pollutants to surface or ground water?
Yes No _X Unknown
7.2 control or modify the water, streambed, or shoreline of any stream or water body?
Yes No _X Unknown
7.3 result in the generation, transportation, and disposal of any hazardous or toxic materials as
defined by Federal or applicable state regulations?
Yes No _X Unknown
Product liquids from process experiments are stored in tightly-sealed drums for
upgrading and characterization research. The waste sand is stored for combustion and residual
carbon research and is eventually hauled back to the mine of origin for disposal. The solid and
liquid hazardous wastes (petroleum products) are collected by the University Department of
Safety Services and are disposed of according to state and federal guidelines by their
contractor-APTUS Environmental. The University of Utah Safety Services provides a
hazardous waste management program including a clear and concise flow-chart for
management of hazardous materials from the point of identification to disposal. The office has
a US EPA number for hazardous waste handling and disposal and it carefully administers the
University waste management activity.
7.4 affect any aspect of the human environment besides those mentioned above either directly
or indirectly (e.g. visibility, noise, aesthetic and socioeconomic impacts; public facilities and
services or exposure to toxic and hazardous material)?

22
The program activities are performed in existing buildings. In the worst-case scenario,
with three of the reactors operating simultaneously, the noise level in the vicinity of the
reactors was measured to be 75-80 db. For operation in the noise intensive areas, hearing
protection is provided and used. Visibility and aesthetic effects due to the processes are non
existent. A rigorous hazard communication protocol, with formal safety workshops and
informal equipment training is in place. The exposure of personnel to hazardous and toxic
substances is monitored by the University Safety Services under a comprehensive Chemical
Safety and Hygiene plan. The Salt Lake City Office, of OSHA (Occupational Safety and
Health Administration) monitors the University Department of Safety Services.
7.5 generate public controversy?
Yes No _X Unknown
Please write all explanations of any "yes" answer on an attached page.
8. Is the Project/Activity specifically called out in the procedures as a categorical exclusion?
Yes X_ No Unknown
State Specific category CX-B3.10
9. Recommended NEPA Determination: CX_A CX-B X EA
EIS None needed
Original Signed Signature of Project Manager Date
Original Signed Signature of Environmental Project Manager Date

23
Original Signed Signature of METC NCO Date

24
RECOVERY OF BITUMEN FROM WESTERN TAR SANDS Environmental Impact Summary: Categorical Exclusion (CX_B)Determination:
Proposed Action: Renewal of the existing cooperative agreement DE-FC-21-93MC30256 with
the University of Utah Department of Chemical and Fuels Engineering.
Location: University of Utah, Department of Chemical and Fuels Engineering,
3290 Merrill Engineering Building, Salt Lake City, Utah, 84112
Proposed bv: Morgantown Energy Technology Center, U.S. Department of Energy
Description of the proposed action:
The U.S. DOE and the University of Utah, Department of Chemical and Fuels Engineering,
entered into cooperative agreement DE-FC-21-93MC30256 to conduct research and
development to create a body of scientific and engineering data necessary to develop
commercially viable processes for the recovery and utilization of the extensive tar sand
deposits in the United States. All research, development, small-scale fabrication and testing
activities will be conducted in existing facilities. The operations will be inspected and
monitored by the University Safety and Environmental Personnel, who are responsible to the
local state and U.S. EPA regulations. The following is a subject breakdown of the 17
laboratory-scale processes or computer process simulations and calculations that are being
performed on the University of Utah campus.
• Thermal recovery
• Water-assisted recovery
• Other recovery processes; solvent extraction and in-situ
• Resource/bitumen characterization/analytical facilities

25
• Upgrading/specialty chemicals
• Economics
The laboratory equipment being used to carry out the program tasks consists of:
1. Coupled fluidized-bed, pyrolysis-combustion reactor
2. Rotary kiln
3. Small, screening fluidized bed pyrolysis reactor
4. Six-inch fluidized-bed reactor
5. Digestor, separator and associated equipment for water-
6. assisted recovery of bitumen
7. Continuous solvent extractor
8. Hydropyrolysis reactor system
9. Hydrotreater
10. Ebullieted bed hydrocracker-hydrodynamic studies unit
11. Three-phase gravity classifier/thickener
12. Transport reactor for coked sand combustion
The experimental program consists of characterization of the bitumen and of the products
of various recovery processes, process variable study of several possible recovery processes
and a comprehensive evaluation of the upgrading options.
Feedstock use, product fate, and cumulative waste management are discussed below:
A. Feedstock: A maximum of 6 tons of tar sands will be processed during the current year
in all of the experiments. The feedstock will contain approximately 7-12% by weight of the
hydrocarbon material or bitumen. The remaining 88-93% of the material will contain
predominantly sand (silica) and some clay.

26
B. Produced Bitumen: The processing is expected to produce about 500 kg of bitumen which
will be stored in polyethylene-line containers and will either be used for upgrading research or
will be disposed of through the university hazardous waste management system.
Conservatively, 95-97% of the hydrocarbon are captured and it is estimated that the maximum
hydrocarbon losses are 75 kg for the year.
C. Off Gases: The pyrolytic processes produced vapor streams which are condensed into a
lighter product. The lighter gases in the vapor stream are flared to form C02 and H20. The
coked sand combustion is carried out under excess air conditions an generates mostly C02 and
H20 and small amounts of CO. At the maximum, the program will generate 500 kg of off-
gasses, 485 kg of off gases which would be C02 and H20. The remaining 15 kg would be
unburned hydrocarbon gasses and CO.
D. Water Wastes: The water assisted recovery processes use process water. Remaining
operations use water mainly for cooling the classifier and thickener operations use a closed
loop system where there will be no liquid wastes during the operation. The three closed-loop
experiments planned for the thickener study are expected to use a total 7,500 kg of water.
Once these experiments are complete the products will be down loaded into 55 gallon drums
and will be handed over to the University Safety services for appropriate disposal. The water-
assisted recovery process studies are expected to use 2500 kg of water. The water used in this
process is recycled 10 times after which it is pumped to a water-tight sump and is disposed of
as hazardous waste.
27
E. Solid and Liquid Hazardous Wastes: The spent sand from the pyrolysis reactors is either
used for combustion research or is disposed to the mine site of origin. It is not classified as
hazardous material. The bitumen and oil produced in the recovery processes are either used in
upgrading research or disposed of as hazardous liquid wastes through the university hazardous
waste management service. If required the oils are stored in polyethylene lined barrels. The
waste solvents resulting due to analytical activity are also stored and disposed in a similar
manner. Guidelines described in the University of Utah hazardous waste management manual
are strictly adhered to in handling and disposing all hazardous material. The proposed action is
a variety of small-scale laboratory research and development projects performed at existing
facilities. Its is thus within the threshold limits of the U.S. DOE National Environmental
Policy Act (NEPA). The action meets all of the eligibility requirements for categorical
exclusions as set forth in 10 CFR 1021, section 410, and all the integral elements of the classes
of Actions in Appendix B.

28
WATER-BASED RECOVERY OF BITUMEN
SURFACE TENSION OF BITUMENS FROM UTAH OIL SANDS AS DETERMINED
BY WILHELMY PLATE AND CONTACT ANGLE TECHNIQUES
Principal Investigator: J.D. Miller Res. Assoc. Professor: J. Hupka Post Doctoral Fellow: J. Drelich Research Associate: R. Bokotko Graduate Students: D. Lelinski
Ch. Holbert
INTRODUCTION
As the conventional crude oil deposits are rapidly being depleted, there is a greater need
to develop other petroleum resources. One such resource is oil sand, a bitumen-impregnated sandy
material, which is successfully mined and processed in Canada. Bitumen is separated from sand
using the hot-water process, and further upgraded to synthetic crude oil. At the University of Utah
researchers have developed both water-based separation processes and thermal processes for
bitumen recovery from the Utah oil sand deposits, however, these technologies have not been
commercialized yet (3).
Processing of oil sands involves several steps in which the physico-chemical properties of
the bitumen may be of particular significance in its recovery and upgrading. In particular,
properties such as surface tension, interfacial tension, and electrical charge at the bitumen/air and
bitumen/water interfaces may affect the efficiency of bitumen separation from oil sands using the
hot-water process (4-6). Also, bitumen surface tension may be an important property in
upgrading processes such as hydrotreating and hydrocracking when three-phase ebullited bed

29
reactors are used (7). In this regard, there is a need for basic research leading to specification
of the physical and chemical properties of bitumen. This task has received more attention at the
University of Utah, in recent years, and the surface properties of Utah oil sand bitumens have
been studied. Electrophoretic properties of bitumen emulsions have been reported for Asphalt
Ridge (8), Sunnyside (8), and Whiterocks (6) bitumens. The bitumen/air surface tension and the
bitumen/aqueous phase interfacial tension for Whiterocks bitumen have been examined also (5,
6). In this contribution the surface tension of toluene-extracted bitumens from the Whiterocks,
Asphalt Ridge, Sunnyside, PR Spring, and Circle Cliffs oil sands were measured and the results
are presented herein.
Literature Survey of Surface Tension Data
Only a limited amount of experimental data has been reported in the literature on the
surface tension of bitumens, and most of these measurements were carried out for Canadian
bitumens (4-6, 9-11). Bowman (4), and Isaacs and Smolek(9) measured the surface tension of
bitumen recovered from the Athabasca oil sand. Results presented by Bowman (4) have only
limited practical significance as they were obtained for nonequilibrated systems and the procedure
used was not well-defined. Isaacs and Smolek (9) reported the surface tension value of bitumen
which was obtained from the commercial hot water processing of Athabasca oil sand, using du
Nouy ring tensiometry. The bitumen surface tension was reported to be 29.6 mNm"1 at 64°C which
decreased to 25 mNm"1 at 112°C. Potoczny et al. (10) measured the surface tension of several
Canadian bitumen samples from different sites using the Wilhelmy plate technique. The surface
tension values of these samples varied from about 23 mNm"1 to 32 mNm"1 at 40°C, depending on
the location of the oil sand sample and solvent type used for the bitumen extraction. Vargha-Butler
et al. (11) proposed that the surface tension of bitumen at room temperature can be determined

30
from contact angle measurements using Neumann's equation-of-state for surface tension (12). The
surface tension of bitumens, as determined from contact angle measurements was reported to be
in the range of 24.4 mNm"1 to 33.8 mNm"1 at 23°C, depending on the sample origin and the
experimental procedure used in the bitumen preparation. This new technique for the bitumen
surface tension determination based on contact angle measurements was examined for five
different Utah oil sand bitumens and the results are presented in this report. The theoretical
background for the relationship between the bitumen surface tension and contact angle data is
briefly reviewed in the following section.
Equation-of-State for Interfacial Tensions
The force balance at a solid surface involving a three-phase system in which the
equilibrium contact angle is established, can be resolved in terms of the interfacial free energies
by using the Young equation (13):
Ysv ~ ySL = YLV C O S Q C1)
Ysv = Ys " n (la)
where ys, Ysv> YSU YLV are the surface free energy of solid in contact with vacuum, surface free
energy of solid in contact with saturated liquid vapor, interfacial free energy of the solid/liquid
interface, and liquid/vapor surface tension, respectively; 0 is the contact angle; n is the
equilibrium film pressure of the adsorbate (adsorbed liquid vapors), which is assumed to be zero
for low energy solid surfaces.
A difficulty in the application of the Young equation (1) is that there are two parameters,
Ysv a°d Ysu which cannot be measured directly. In this regard, several researchers have tried to
estimate the surface free energy of solids based on contact angle data for various liquids, and

31
calculation methods based on the dispersive and nondispersive theory of interaction between
phases have been proposed (14), including Neumann's equation-of-state (12).
Girifalco and Good(15) suggested that if two phases are immiscible and interact only through
additive dispersion forces the interfacial free energy can be expressed by the following equation:
_i
y5L = ys + yLV -2* <YS YLV)
2 (2)
where <I> is the correction factor called the interaction parameter.
According to Neumann et al. (12), there is a relationship between the surface free energy
of the solid, ys, of the liquid, yLV, and the solid/liquid interfacial free energy, ySh:
YSL = f{Ys' Y1V>
It was assumed that the interaction parameter, <I>, is a function of the interfacial free energy of the
solid/liquid interface, YSL:
cjj = - O Y S 1 + 1 (3)
where a is a constant with a value of 0.0075 m2/mJ, as determined from contact angle data for
hydrophobic surfaces.
Substituting the value of $ and the Young equation (1) into equation (2), and neglecting
the contribution of n, Neumann et al. (12) obtained the following equation-of-state in terms of the
appropriate interfacial tensions:
cose . ^ ^ - i l W ^ ^ ' v , (4)
Y i v [ 2 a (Ya YiV) 2 " 1]

32
Vargha-Butler and others (11) have proposed that the equation-of-state (4) can be used for
determination of the surface tension of bitumens at room temperature. Advancing contact angles
for water and glycerol drops placed on Canadian bitumen films were measured. They found that
for most bitumens the surface tension data calculated from equation (4) were in good agreement
with surface tension data obtained from direct measurements using the Wilhelmy plate technique.
However, in a few cases the differences in the surface tension values by these two methods
exceeded 2 mNm"1.
A disadvantage of the equation-of-state (4) lies in the discontinuity of the dependence of
cos0=f(ys) when 2a(ysYLv)1/2 approaches 1. In order to overcome this disadvantage the above
equation-of-state was revised and a new equation was derived by Li and Neumann (16, 17):
c o s e = 2 ( . l i ) " * e " B , Y w " Y * , a - 1 (5)
where P is a constant with a value of 0.0001247 (m2/mJ)2, which was determined from contact
angle data for low energy solids (17).
The principal advantage of the equation-of-state for interfacial tension is that it allows for
the determination of Ys (the surface tension of bitumen in our case) from a measurement of the
contact angle using only one liquid. The applicability of the equation-of-state for bitumen surface
characterization was examined in this study. The surface tension values calculated from equation
(5) using contact angle measurements for water drops placed on bitumen films are compared with
the surface tension data obtained from direct tensiometric measurements.
33
EXPERIMENTAL
Bitumen Samples
Oil sand samples used in this investigation were obtained from the Whiterocks, Sunnyside,
PR Spring, Asphalt Ridge, and Circle Cliffs deposits of Utah. The bitumen was extracted from
the oil sand samples using spectrograde toluene (EM Science, U.S.A.). The extractions were
carried out for 24 hours at 385-390 K in a Dean-Stark apparatus with Whatman cellulose thimbles,
as described in a previous contribution (18). Shark skin filter paper was wrapped around the
thimble to retain fine mineral particles which penetrated through the thimble wall. The
toluene/bitumen solutions were subjected to 12-14 hours vacuum distillation on the rotary
evaporator, 20 torr and 358 K. The residual toluene in the bitumen was less than 0.2 wt%, as
determined by gas chromatography. The bitumen samples were stored in a dark place in air-tight
glass containers to avoid bitumen oxidation before use.
The physical and chemical characteristics of toluene-extracted bitumens from the
Whiterocks, Sunnyside, PR Spring, Asphalt Ridge, and Circle Cliffs deposits, as reported in the
literature, are shown in Table 1 and 2, respectively.
Wilhelmy Plate Technique
The.surface tension of bitumens was measured on a Digital-Tensiometer K10T (KRUSS,
GmbH; Germany) with a fine platinum roughened plate. The tensiometer was connected to a
constant temperature water bath to maintain the desired temperature. A 10 mL bitumen sample
was placed in the sample container, which was installed in the tensiometer and the sample was
allowed to reach thermal equilibrium. The instrument with the attached platinum plate was
calibrated before being brought in contact with the bitumen sample. The sample container was
raised against the bottom edge of the platinum plate until the plate became moistened by the

Table 1. Physical Properties of Extracted Bitumens from Utah Oil Sands'3'19"21'
Property Whiterocks Sunnyside PR Spring Asphalt Ridge Circle Cliffs
bitumen content, wt% 7.1-8.3 8.5-10 5-14 10.9-13.1 2.8A)
specific gravity 0.981 1.033 1.016 0.970 ND gravity, °API 12.7 5.5 7.8 14.4 14.3 Conradson carbon, wt% 8.8 14.8 14.0 ND 23.3 ash, Wt% 0.24 2.4 3.3 0.04 0.06 viscosity (323K) , Pa-s 32 1500 280 80 258A)
ND = not determined, ' K. Bukka, unpublished data

Table 2. Fractional Composition (wt %) of the Utah Oil Sand Bitumens (19,22,23)
Bitumen F r a c t i o n W h i t e r o c k s C l i f f s A 1
Sunnyside PR Spring Asphalt Ridge C i r c l e
saturates aromatics resins asphaltenes
atomic H/C ratio molecular weight
29.5 22.2 42.4 3.3
1.60 500
24.9 18.1 30.0 23.7
1.45 588
26.6 25.7 31.7 16.0
1.57 820
3 2 . 4 2 2 . 4 3 7 . 6 7 . 3
1.56 490
2 3 . 8 1 9 . 2 2 8 . 8 2 8 . 1
1 .37 744
KT K. Bukka, u n p u b l i s h e d d a t a

36
sample. The resulting force, due to the wetting, was then measured. The accuracy of the
measurements was within 0.2 mNm"1 of the reported value. The results were recorded when no
change in the surface tension was observed, typically after 20-30 min.
Contact Angle Measurements
A film of bitumen was spread mechanically on a clean and warm (323-333 K) glass slide
to form a thickness of less than 5-6 pm, as estimated from the difference in the weight of a clean
glass slide and that covered by the bitumen film. The glass slide with the bitumen film was cooled
to room temperature (294.+1 K). The bitumen films, as prepared, were uniform and smooth. It
is important to note that viscous bitumens, in particular Sunnyside bitumen, could only be
uniformly deposited on the glass slide at an elevated temperature.
A 4-6 mm diameter water drop was placed on the bitumen film and the contact angle was
measured on both sides of the drop with an NRL Goniometer (Rame-Hart Inc., U.S.A.) with an
accuracy of 2 degrees. In all experiments, distilled water with a specific conductivity of less than
10"6 S/cm, pH=5.8+_0.1, and a surface tension of 72.6+0.1 mNm"1, was used. In each case 5
to 10 water drops were placed on 2-3 slides, each covered with freshly prepared bitumen films,
and then the contact angles were measured. Only the average values of the contact angles and
confidence intervals for the experimental data are reported. In selected experiments with the
Whiterocks and Circle Cliffs bitumens, the contact angle variation with time was recorded,
whereas in other experiments the contact angle was measured immediately, i.e. 15-20 seconds,
after the water drop had been placed on the bitumen film.

37
RESULTS AND DISCUSSION
Direct Measurement of Surface Tensions
Results from the temperature dependence of surface tension for the Whiterocks, Sunnyside,
PR Spring, Asphalt Ridge, and Circle Cliffs bitumens, using the Wilhelmy plate technique, are
presented in Figure 2. Surface tension measurements were carried out in the temperature range
of 310-356 K. It was found that the surface tension values were reproducible in this temperature
range. Further, in no case was hysteresis observed during temperature cycling. Always, for a
given bitumen, the same linear relationship between surface tension and temperature was observed
regardless of whether the temperature was increased or decreased during the experiments.
Reproducibility of the results suggests that such phenomena as evaporation of light bitumen
fractions, oxidation of asphaltenes, or chemical reactions at the platinum/bitumen interface, if such
reactions are significant, did not affect the surface tension during the time of these measurements.
For each bitumen at a certain low temperature, the measured surface tension value was not
reproducible, and the recorded values were always higher than expected from the linear
relationship of yB=f(T). This limiting low temperature was observed to vary with bitumen source.
The low temperature limits for the bitumens under study were as follows: T<310 K for
Whiterocks .bitumen, T<320 K for PR Spring and Asphalt Ridge bitumens, T<325 K for Circle
Cliffs bitumen, and T<340 K for Sunnyside bitumen. The higher viscosity of bitumen at low
temperatures could contribute to the experimental error in the surface tension measurements with
the Wilhelmy plate, as suggested in the literature (10).
Linear relationships between the surface tension of the bitumen and temperature were
obtained for bitumen samples in the range of temperatures examined, 310-356 K (Figure 2), and
were in general agreement with surface tension data reported in the literature for Canadian

Figure 2. Effect of temperature on the surface tension of bitumens separated from the Utah oil sands.

39
34i
PR Spring
30-.E Z E c o "£ 261
CD
CD
J CO
Circle Cliffs
Asphalt Ridge
Sunnyside
Whiterocks
110 320 330 340 Temperature [K]
350 360

40
bitumens (10). The surface tensions of toluene-extracted bitumen samples from Utah oil sands
were found to vary from 20.6 mNm"1 to 31.2 mNm"1 at 333 K, and are comparable to values
reported for Canadian bitumens, 22.0-30.9 mNm"1 at 333 K (see Table 3). The results presented
in Figure 2 can be described by the following equation:
YBCO = ~ ? T + Ya(2*0) (6)
For each bitumen the temperature coefficient of the surface tension, dyB/dT, was calculated from
the linear relationship (Figure 1), and presented in Table 3. The temperature coefficient values
varied from -0.063 mNirf'deg"1 to -0.097 mNm"1 deg"1, depending on the bitumen sample. Similar
values of the temperature coefficient for bitumen surface tensions have been reported for Canadian
bitumens (-0.044 mNm-Meg"1 to -0.095 mNnf'degf1) (Table 3).
There was no apparent relationship between the bitumen surface tension (Table 3) and
fractional composition of the bitumen examined (Table 2). Also, there seems to be no correlation
of the bitumen surface tension and average molecular weight of the bitumen when data from Table
3 are compared with data from Table 2.
Bitumen Surface Tension from Contact Angle Measurements
The applicability of the equation-of-state (5) for bitumen surface tension determination was
examined, and the advancing contact angles were measured for water drops resting on a bitumen
film. The contact angles were measured immediately (15-20 seconds) after placement of the water
drops at the bitumen film surface. Rapid measurement of contact angle was required in order to
minimize the effect of liquid penetration and chemical interaction between the two phases on the
contact angle measurement (11). Interactions at the interphase cause a decrease in the contact

Table 3. Surface Tension Values for North America Bitumens
B i t u m e n S u r f a c e T e n s i o n a t 333 K (60°C)
mNm"1
T e m p e r a t u r e C o e f f i c i e n t o f S u r f a c e T e n s i o n
mNnfMeg-1
Literature
Whiterocks Sunnyside PR Spring Asphalt Ridge Circle Cliffs
Utah Bitumens
20.6±0.2 -0.077±0.002 (313 K to 350 K) 21.3+0.2 -0.063±0.001 (341 K to 356 K) 31.2±0.2 -0.097±0.001 (322 K to 356 K) 28.9±0.2 -0.078±0.001 (323 K to 352 K) 29.3+0.2 -0.093±0.002 (326 K to 352 K)
Canadian Bitumens
This work This work This work This work This work
Athabasca
P e a c e R i v e r P e l i c a n L a k e F o r t McMurray
" 2 7 . 2 2 9 . 6 (64°C)
2 2 . 0 - 2 9 . 2 2 4 . 0 - 3 0 . 9 2 2 . 2 - 3 0 . 6
" - 0 . 1 9 (313 K t o 3 6 8 - 0 . 0 9 5 (337 K t o 3 8 5
- ( 0 . 0 4 8 - 0 . 0 7 2 ) (313 K t o - ( 0 . 0 4 4 - 0 . 0 7 8 ) (313 K t o - ( 0 . 0 5 0 - 0 . 0 8 2 ) (313 K t o
K) K) 363 K) 363 K) 363 K)
[2] [7] [8] [8] [8]
*>

42
angle value with time as shown in Figure 3 for the Whiterocks and Circle Cliffs bitumens.
The results of contact angle measurements and the bitumen surface tension values
calculated from equation (5) are presented in Table 4. The surface tension of the bitumen was
found to vary in a narrow range of values from 23.9 mNm"1 for Whiterocks bitumen to 26.7
mNm*1 for Sunnyside bitumen. However the surface tension of the PR Spring bitumen was found
to be significantly greater, 32.2 mNm"1, than for the other Utah bitumens. As shown in Table 4,
the average values for the surface tension calculated from contact angle data using equation-of-
state (5) are close to the extrapolated values at 294 K from direct measurements using the
Wilhelmy plate technique for Whiterocks, Sunnyside, and PR Spring bitumens. Significant
discrepancies between data obtained by the two different techniques was observed for the Asphalt
Ridge and Circle Cliffs bitumens. Vargha-Butler et al., (11) noted similar discrepancies for
Canadian bitumens which were found to differ from 0.4 mNm"1 to 5.3 mNm"1; but there was no
systematic trend in this difference.
There is no reason to assume that the linear surface tension/temperature relationship, which
is a characteristic property of liquids (13) and also melted polymers (24), does not exist for
bitumens. The high bitumen viscosity in the 294-310 K temperature region makes surface tension
measurements difficult with the Wilhelmy plate technique, nevertheless, the bitumens still exhibit
liquid properties in this temperature range. In this regard, it is believed that the extrapolation
procedure used for determination of the bitumen surface tension at room temperature could not
account for such large discrepancies between surface tension values obtained with the two different
techniques, Wilhelmy plate tensiometry and contact angle measurements.
It should be noted that special precaution was taken to avoid overheating the bitumen
during film preparation. The bitumen was spread on a warm glass slide and immediately cooled

Figure 3. Variation of contact angle with respect to contact time for a water drop placed on the surface of the bitumen film.

44
100i
Whiterocks Bitumen ^
CD
.0
c <
CO • * - * c o O
90-
Circle Cliffs Bitumen
85- T 1 1 1 1—I I I T r -I 1 — T T
0.1 10 Time [min]

Table 4. Comparison of Bitumen Surface Tension Values C a l c u l a t e d from Contact Angle Measurements with Bitumen Surface Tension Determined by Wilhelmy P l a t e Measurements (21°C)
bi tumen:
Whiterocks Sunnyside PR Spr ing A s p h a l t C i r c l e R idge C l i f f s
contac t a n g l e for water drop a t b i tumen f i lm at 294 K, [ d e g ] 98.3±1.8 93.8+2.2 85.1±2.9 9 8 . 0 + 2 . 4 95.8+1.2
calculated bitumen surface tension, [mNm"1] 23.9+1.2 26.7±1.5 32.2±1.9 24.2+1.5 25.5+0.8
bitumen surface tension after extrapolation of experimental data in Figure 1 to 294 K,[mNm"1] 23.5+0.2 23.7±0.2 35.0+0.2 31.9+0.2 33.0±0.2
difference in determination of the bitumen surface tension by both methods, direct measurement and using contact angle data, [mNm-1] +0.4 +3.0 -2.8 -6.9 -7.5
i
(-1.0 to +1.8) (+1.7 to +4.7) (-4.9 to -0.7) (-9.4 to -6.4) (-8.5 to -6.9)

46
to room temperature to minimize the destructive effect of the thermal energy on the bitumen
composition. In our preliminary experiments, Whiterocks and Asphalt Ridge bitumens were
deposited on a glass slide at room temperature. For such bitumen films, as prepared, the
advancing contact angle as measured for a water drop was found to be in close agreement with
that measured for a water drop placed on the bitumen film prepared at an elevated temperature.
These experiments suggest that annealing of the bitumen films, during the time of the experiment
has no significant effect on the surface properties of the bitumen films. The bitumen samples used
in the tensiometric measurements were also subjected to elevated temperatures. In this regard, the
thermal energy could affect the bitumen samples in a similar way in both techniques.
Vargha-Butler et al. (11) suggested that the presence of clay particles in bitumen can affect
the energetic state of the bitumen surface, and thus, may be responsible for the difference in the
surface tension as measured directly and those calculated from contact angle data. The procedure
for bitumen extraction from oil sand samples and bitumen purification from solvent, as used in
these studies, suggest that clay particles are probably not responsible for the observed difference.
Some interaction between molecules of water and bitumen occured rapidly during the
contact angle measurements as presented in Figure 2. This may involve reorientation of molecules
or some groups of bitumen molecules at the bitumen/water interface which affect the contact
angle. Also, factors such as solubility of bitumen compounds in water and/or water in bitumen,
deformation of the bitumen film at the three-phase contact line, and spreading of bitumen or
bitumen constituents at the water drop surface, could affect the contact angle measurements. These
effects caused difficulties in the selection of an appropriate time for contact angle measurements,
and thus, thermodynamic equilibrium for the three-phase system could not be defined. In this
regard, the contact angle measurements for liquid drops at a bitumen film surface may involve

47
some uncertainty. Also, it was pointed out recently that the equation-of-state has several
limitations, such as applicability to apolar systems involving only physisorption (25). Apolar
liquids such as hydrocarbons can not be used in the characterization of the bitumen surface due
to the mutual solubility of the phases (6). In this regard, the bitumen surface tension
determination based on contact angle measurements using polar liquids, such as water in our
studies or water and glycerol in the studies of Vargha-Butler et al. (11), may account for some
inaccuracy in the surface tension determination of the bitumens. Also, inaccuracy in the bitumen
surface characterization using the equation-of-state may point to the weakness of the theoretical
considerations used in the derivation of equation (5). (Note that additional proofs of the weakness
of Neumann's approach for the surface tension determination of low-energy surfaces based on
contact angle measurements were recently recognized in our laboratory during surface tension
measurements of polymers (26).
Finally, another disadvantage of the contact angle technique is its limitation in the
determination of the bitumen surface tension at room or lower temperatures when the bitumen
becomes a semi-solid. In practice, oil sands are processed at elevated temperatures, mostly from
323 K to 358 K, and thus, the bitumen surface tension at higher temperatures is of more practical
importance..
SUMMARY AND CONCLUSIONS
The surface tension of toluene-extracted bitumens from the Whiterocks, Sunnyside, PR
Spring, Asphalt Ridge, and Circle Cliffs oil sands was determined by the Wilhelmy plate
technique and found to be 20.6 mNm'1, 21.3 mNm"1, 31.2 mNnV1, 28.9 mNm'1, and 29.3 mNm"1
at 333 K, respectively. No apparent correlation between the bitumen surface tension and fractional

48
composition of bitumen was observed.
A linear relationship between the bitumen surface tension and temperature was found for
Utah bitumens examined in the temperature range of 310-356 K (depending on bitumen sample).
The temperature coefficient for surface tension was calculated to be -0.077 mNm"1 deg"1, -0.063
mNm-'deg-1, -0.097 mNinMeg-1, -0.078 mNm'Meg-1, and -0.093 mNm'Meg1, for the
Whiterocks, Sunnyside, PR Spring, Asphalt Ridge, and Circle Cliffs bitumen, respectively.
The contact angles for water drops at the surface of bitumen films were measured and the
bitumen surface tension at 294 K was calculated from Neumann's equation-of-state. The contact
angle technique provided comparable values for the bitumen surface tension at room temperature
for the Whiterocks, Sunnyside, and PR Spring samples. Significant discrepancies between the
bitumen surface tension values as obtained from the contact angle technique and as obtained from
direct measurements with the Wilhelmy plate technique were found for the Asphalt Ridge and
Circle Cliffs bitumens. In this regard, the contact angle technique, which is based on Neumann's
equation-of-state and contact angle measurements, may not be valid and, in any event, is limited
to a small temperature range. Several possible reasons for the discrepancies between surface
tension values determined by direct measurements and those calculated from contact angle data
were discussed in this contribution, however, the weakness of the theory, expressed by equation
(5), especially its limitations to apolar systems involving only physisorption, seems to be the most
reasonable explanation to account for such discrepancies.
CHARACTERIZATION AND STABILITY OF OBL-IN-WATER EMULSIONS
INTRODUCTION
Bitumen droplets in a successfully digested tar sand slurry exhibit a broad size distribution

49
with droplets from a few micrometers to 1 mm in size. Large bitumen droplets can be rapidly
separated in a gravity cell assuming that they contain a sufficient amount of entrapped air. Fine
bitumen droplets and bitumen-sand aggregates are either caught in the fast settling tailings or form
a middlings layer, which requires flotation for fast and complete recovery.
There are two stages in the removal of dispersed oil from oil-in-water emulsions during
flotation: contact and coalescence. These involve air bubbles and filming phenomena (27, 28).
Contact is sensitive to long range forces between the droplets and bubbles as they approach each
other. The contact or air bubble/oil droplet attachment can be controlled by adjusting the zeta
potential of the droplets and bubbles. The zeta potential of a bubble and a droplet (or two droplets)
should be close to the isoelectric point such that repulsion is weak.
The attachment involves rupture of the aqueous film and depends on the thermodynamic
properties of the interfacial films and on the degree of irreversibility of film desorption. The
possibility of filming can be estimated by calculation of the spreading coefficient for the system.
A positive spreading coefficient is necessary for the filming process to occur.
Oil droplet size distribution and oil-in-water emulsion stability were investigated and will
be discussed with respect to the deemulsification process. The results of this research support a
general consensus that the interfacial chemistry for such dispersed systems plays a dominant role
in phase separation processes and the bitumen-in-water system is no exception.
Oil Droplet Size Distribution Measurements
It is quite uncommon for any emulsion to have a uniform droplet size distribution. An
emulsion consisting mostly of fine droplets exhibits maximum stability, all other things being
equal (29). In this regard, suitable droplet size measurements as well as their description, are of
critical importance. There are, in general, four different methods by which the droplet size

50
distribution may be determined. These methods include microscopic observation, sedimentation
techniques, light-scattering measurements, and instrumental counting (29). It should be noted,
however, that some of these methods do not actually yield distributions as such, but only average
particle size.
Microscopic measurements have been used extensively for years and although laborious,
they are the most accurate. Observation of the emulsion under a microscope fitted with a
micrometer eyepiece permits the tabulation of the numbers of droplets in various size classes.
From this, a distribution curve may be plotted. Alternatively, a photographic record of the
emulsion may be made, from which the droplet sizes can be determined at a later time. In this way
a permanent record of the emulsion is available. In much of the literature relating to the
microscopic technique, undue emphasis has been placed on the necessity of counting a large
number of droplets in order to get a meaningful size distribution. For example, Fischer and
Harkins (30) made a direct microscopic count of 50,000 particles to obtain size distribution curves.
Actually, however, statistically significant counts can be made with as little as 300 droplets. It can
be shown (31) that a count of 300 droplets will result in a distribution in which the error at any
size range will be less than 8% with a 95% confidence limit. Reduction of this expected error to
5 %, at the same level of confidence, would require the counting 2960 droplets. In view of the
other sources of error affecting such measurements, such a small reduction in error hardly seems
worth the tenfold increase in effort.
The second type of measurement is based on sedimentation phenomena. If any emulsion
creams at any sort of observable rate, measurement of the amount of creamed material per unit
of time permits the construction of a size distribution curve. Most methods which depend on this
phenomenon measure the change in density.

51
Droplet size can also be measured, in principle, by optical methods which depend either
on measurement of the reduction in light transmitted through the dispersion (turbidimetric or
nephelometric methods) or by light scattered at some definite angle (usually 90°) from the optical
path. The method employed depends, to some degree, on the type of system being studied, direct
transmission methods being more applicable to dispersions of higher turbidity.
Methods depending on direct counting have been developed recently. A flow counter which
also gives particle size distributions is the Coulter Counter. In this device, the emulsion flows
through a narrow orifice surrounded on either side by a conductivity electrode. In an oil-in-water
emulsion, the conductivity of the dispersed oil droplets is, of course, much lower than that of the
continuous phase. Consequently, each time a droplet passes through the orifice, a change in
conductivity, whose magnitude is proportional to the droplet size, is recorded.
Since what is determined by most experimental measurements of size distribution is the
population of various size ranges, the proper graphical representation of such data is by means of
a histogram. For convenient discussion of particle-size data, it may be necessary to simplify
matters somewhat by using average quantities. For example, the emulsion may be described in
terms of an average particle diameter corresponding to that of a hypothetical monodispersed
emulsion. However, this is not as simple a matter as it might seem, for the average diameter may
be defined in a number of ways.
If, for example, one defines the total number of droplets in the emulsion as N, the total
interfacial area as S, the volume of dispersed phase as V, and the sum of all globule diameters as
D, six types of average diameter can be defined as shown below (29):
n /_, d. n. d^i-^ (7)

52
c 1 Yd2 n. 1 d*o = (4r ] 2 = ( V 2) 2 ®
6v,4_ , £ ^ , 4
S J2d2n.
*—' i i
^-«£'-«rU' 4
fiv 52d? n-d = -°J1 = ~ J ' (12)
32 5 E^n,
where n; is the number of droplets with a diameter of d;.
Eq.(7) provides a simple arithmetic mean, while Eq.(12) yields mean volume-surface
diameter (often called the Sauter diameter). The mean surface or interface area is also an index
of the dispersity of the emulsion and is often employed. As indicated above, the most meaningful
calculation of this quantity is from the volume-surface diameter.
Emulsion Stability Measurements
Emulsions are essentially unstable heterogeneous systems; they are partly dispersions, partly
colloids. The properties of emulsions often depend largely on their composition and on their mode
of preparation. The physical properties of the emulsion govern the stability of the system (29).

53
There are two stages in the collapse of emulsions: contact and coalescence. It should be
noted that in a process consisting of two consecutive reactions, the overall reaction rate is
determined by the slower of the two. For a very dilute oil-in-water emulsion the rate of contact
can be made much slower than the rate of coalescence. As a consequence, the stability of the
emulsion will be affected by the factors that affect the rate of contact. On the other hand,
increasing the concentration of the oil phase in the emulsion will result in a slowly increasing rate
of coalescence and a much faster increasing rate of contact. Thus, in highly concentrated
emulsions, the coalescence can be rate-determining.
In a certain range of concentrations these two reaction rates can be roughly equivalent.
Becher (29) has pointed out that even in very diluted emulsions, it is possible to make coalescence
rate determining by the addition of surface active agents which may have little or no effect on the
rate of contact while inhibiting coalescence.
In addition to the manner in which the droplet sizes are distributed in an emulsion, the total
amount of the dispersed phase present would be expected to be important. However, the best and
most direct indication of the stability of an emulsion is to measure the change in the dispersed
phase concentration as a function of time under stagnant conditions. The results of this
measurement can be presented as weight per cent, weight fraction, volume percent, volume
fraction or molarity. In the present work the units of mg/dm3 are used which are almost identical
to ppm (parts per million) when the density of water is assumed to be 1 kg/m3. The change in the
emulsion density after the addition of oil and chemicals is negligible.
Generally, the oil phase sedimentation from o/w emulsions follows first order kinetics (27,
32-34). The sedimentation coefficient (k.) as calculated from the following equation can be used
as an indicator of emulsion stability (27).

54
ln-£- = - * t (13) c '
o
where c0 - initial concentration c - concentration after time t kj - sedimentation coefficient [1/s] t - time [s]
The value of the sedimentation coefficient for very stable emulsions is smaller than 3-10'V1 and
for unstable emulsions, k. is larger than 5.6*1 (TV1.

55
EXPERIMENTAL
Oil Droplet Size Distribution Measurements
Hexadecane (Aldrich Chemical Co.) with a purity of 99% and a 20% Whiterocks bitumen-
in-kerosene blend were used in this study as the organic phase (oil). Sodium dodecyl sulfate (SDS)
with a purity of 95% (Sigma Chemical Co.) and PERCOL 592 (Allied Colloids, Inc.) were used
as the surfactant and cationic polyelectrolyte, respectively.
The oil-in-water emulsions were prepared by emulsification of the oil samples in 5 L of
water using the SDLVERSON L4R homogenizer (5 min., 7200 rpm). The emulsion was diluted
with water to 200 L in the conditioning tank in order to reach an oil concentration of 250 mg/dm3.
The surfactant and polyelectrolyte, if needed, were added to the conditioning tank. In each case,
with or without chemical additions, the emulsion was equilibrated in the conditioning tank with
a recirculating pump for 5 min. Next, chemicals were added (when both SDS and PERCOL 592
were added, SDS was added first) and the emulsion was equilibrated in the conditioning tank for
an additional 15 min (when no chemicals were added the emulsion was equilibrated in the storage
tank for the whole 20 min to maintain the identical conditions for each emulsion type).
A microscopic technique was adopted to determine the droplet size distribution. A sample
of 200 cm3 of emulsion was collected from the conditioning tank and immediately analyzed
microscopically. An optical microscope, model AXIOPLAN (ZEISS, Germany) and microscopic
slide with master scale (Fein-Optik in Jena, Germany) were used. Photographic records (12 of
each sample) were made of each emulsion and droplet sizes were determined from these
photographs. Four hundred fifty to five hundred droplets were counted to obtain the size
distribution curve (5 to 6 photographs were selected for each distribution and every droplet on
each photograph was counted).

56
Emulsion Stability
The kinetics of dispersed oil sedimentation were examined for model hexadecane-in-water
and 20% Whiterocks bitumen/kerosene blend-in-water emulsions. Oil phases, added chemicals
and their concentrations, as well as the procedure of emulsion preparation and the addition of
chemicals, were identical to those described in previous section. Equilibration in the conditioning
tank was done for 20 min.
After equilibration, a sample of 3.5 dm3 of emulsion was taken from the conditioning tank.
Next, the sample was left under quiescent conditions to allow gravity separation to occur. Samples
of the emulsion were taken at various time intervals from the bottom of the container without
disturbing the quiescent conditions of sedimentation. The time interval between successive
sampling was set at 15 min. at the beginning and was increased to 12 hours toward the end of each
experiment. The concentration of the dispersed oil phase was measured spectroscopicalry using
a HORIBA OCMA-220 oil-in-water analyzer.
RESULTS AND DISCUSSION
Oil Droplet Size Distribution
The droplet size distributions for hexadecane are shown in Figures 4 to 7. The average
droplet diameters for these emulsions are presented in Table 5 (formulas for each average diameter
are given in Eqs 7 to 12).
As can be seen from Figures 4 to 7 there is, essentially, no change in the average droplet
size after the addition of chemicals. When the surfactant and polyelectrolyte are added separately,
the size distribution becomes narrower and shifts to smaller sizes whereas the average droplet
diameters are very similar. The mechanisms by which SDS and PERCOL 592 bring about this

Figure 4. Droplet size distribution for hexadecane-in-water emulsion without the addition of chemicals
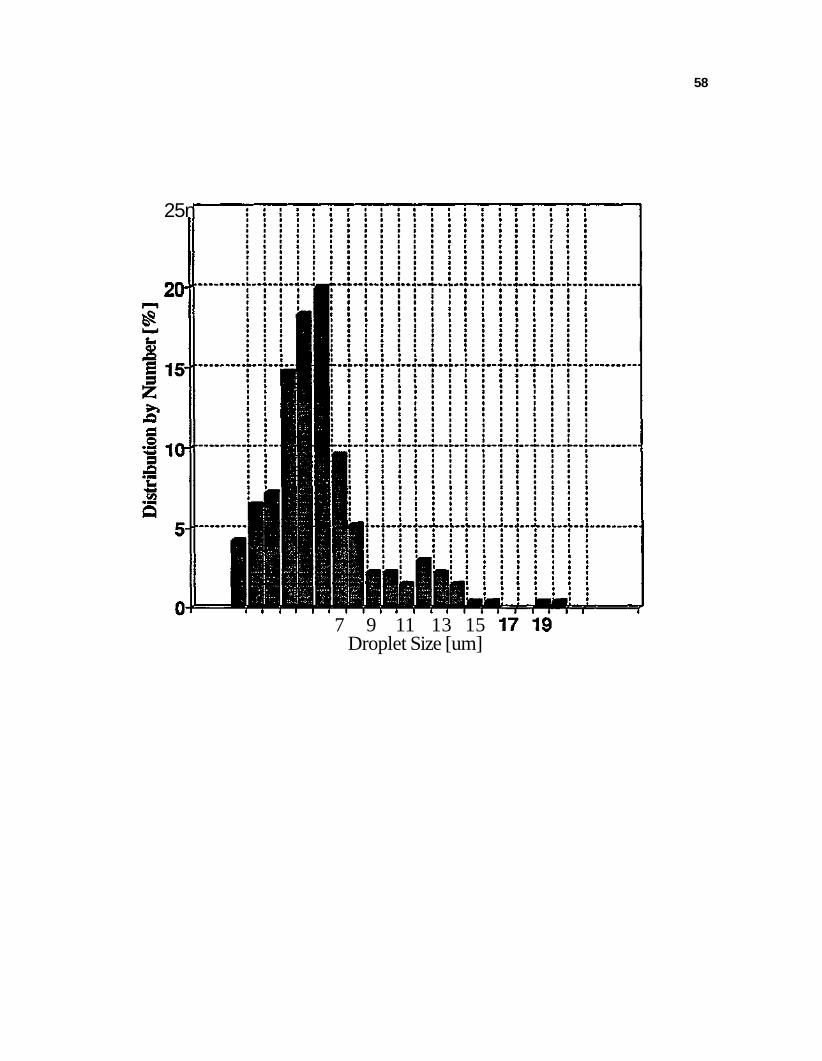
58
25n
7 9 11 13 15 Droplet Size [um]

59
Figure 5. Droplet size distribution for hexadecane-in-water emulsion with the addition of 30 mg/dm3 of surfactant (SDS)

60
7 9 11 13 15 17 19 Droplet Size [um]

Figure 6. Droplet size distribution for hexadecane-in-water emulsion with the addition of 2 mg/dm3 of cationic polyelectrolyte (PERCOL 592)

62
3U-
25-
| 2 0 -£ s
£15-c o
•|ia 5
5-
o-
— | — 4 — * — i — | — ; . . . j . . . j . . . | . .^..^...
"Pi^'W' M' W' M' r r <' r } 1 3 5 7 9 11 13 15 17 19
Droplet Size [um]

63
Figure 7. Droplet size distribution for hexadecane-in-water emulsion with the addition of 30 mg/dm3 of surfactant (SDS) and 2 mg/dm3 of cationic polyelectrolyte (PERCOL 592)

64
3on
7 9 11 13 15 Droplet Size [um]

65
Table 5. Average droplet diameter (ixm) for hexadecane emulsions with different chemicals added (30 mg/dm3 of SDS and 2 mg/dm3 of PERCOL 592)
Average No Add i t i ves SDS PE SDS/PE
d2o
d21
^ 3 2
5 . 9 6 . 4 7 . 5
41.2 3 .2
1 0 . 2
3 . 4 4 . 3 5 . 2
18.6 2 . 8 7 . 7
3 . 8 4 . 6 5 . 4
20.9 2 . 7 7 . 6
4 . 4 5 . 3 6 . 4
28.4 3 . 1 9 . 2
66
small change are quite different from each other. Addition of the surfactant to the water increases
the susceptibility to emulsification and this makes the droplet diameters shift to smaller sizes. On
the contrary, addition of the polyelectrolyte to the water causes coalescence and larger droplets
are formed during the equilibration time. As a consequence, a layer of separated oil was observed
at the top of the conditioning tank.
The oil concentration, especially at the beginning of the experiment, was the highest for the
emulsion with the SDS addition, and as expected, the addition of PERCOL 592 decreased the oil
concentration. The addition of PERCOL 592 together with SDS gave a broader size distribution
and slightly larger average droplet diameter than the addition of PERCOL 592 alone. The addition
of SDS and PERCOL 592 made the emulsion less stable and gravity separation was evident in this
case.
It must be noted that the flocculation of oil drops may be reversible. Thus, in many cases
the oil aggregates can be easily redispersed by stirring. This action of shearing forces can be
enhanced by dilution with a solution of a suitable surface active agent. Furthermore, coagulation
of an emulsion is a function not only of the rate of formation of these more or less reversible
aggregates, but also of the rate at which the droplets coalesce to form larger droplets (29).
The .droplet size distributions for a 20% bitumen in kerosene blend as an oil phase are
shown in Figures 8 to 11. The average droplet diameters for these emulsions are presented in
Table 6 (formulas for each average diameter are given in Equations 7 to 12).
Similar to the size distribution results for hexadecane emulsions, there is essentially no
change in droplet size distribution for bitumen/kerosene emulsions with the addition of chemicals.
When the basic emulsions without the addition of chemicals were studied, the emulsion of
the bitumen/kerosene blend as an oil phase was found to have a much narrower droplet size

Figure 8. Droplet size distribution for the 20% bitumen/kerosene blend-in-water emulsion without the addition of chemicals

68
40-ff
3 5 7 9 11 13 15 17 20 Droplet Size [urn]

Figure 9. Droplet size distribution for the 20% bitumen/ kerosene blend-in-water emulsion with the addition of 9 mg/dm3 of surfactant (SDS)

70
7 9 11 13 15 17 20 Droplet Size [um]

71
Figure 10. Droplet size distribution for the 20% bitumen/ kerosene blend-in-water emulsion with the addition of 0.5 mg/dm3 of cationic polyelectrolyte (PERCOL 592)

72
40"
35-
u
£25-1 ^20-s o
Dis
trib
u m
JL.
ml
9 <
f
5-
o-
-i—-j—-i—-i—<—s—i—
! !
1 — I |
•1 1 i • i : ; ; ; ; ; i i i ! ; ; ; ; ; !"i--r+-m--t--t--i • i i i i i i i •; i • i i • i • • • • • M ,! ,! ,; ,! ,! ,{ ,!
3 5 7 9 11 13 15 17 20 Droplet Size [um]

73
Figure 11. Droplet size distribution for the 20% bitumen/ kerosene blend-in-water emulsion with the addition of 9 mg/dm3 of surfactant (SDS) and 0.5 mg/dm3 of cationic polyelectrolyte (PERCOL 592)

74
1 3 5 7 9 11 13 15 17 20 Droplet Size [um]

75
Table 6. Average droplet diameter (/zm) for bitumen/kerosene emulsions with different chemicals added (9 mg/dm3 of SDS and 0.5 mg/dm3 of PERCOL 592)
Average No Additives SDS PE SDS/PE
<*10
d2o ^30 d21
<*31
<*32
4 . 2 4 . 8 5 . 6
2 3 . 5 2 . 7
7.4
1 .8 2 . 0 2 . 6 4 . 2 2 . 0
4.0
2 . 9 3 . 6 4 . 3
1 2 . 7 2 . 5
6.1
3 . 2 4 . 2 5 . 3
1 7 . 8 2 . 9
8.4

76
distribution range, as compared to the size distribution of the hexadecane emulsion. The size
distribution difference between these two basic emulsions can be explained by taking into account
the origin of the oil phase. Hexadecane is a pure hydrocarbon and an emulsion produced with it
as an oil phase is a typical model emulsion. The bitumen in kerosene blend is a mixture of many
different chemical compounds including the natural surfactants in bitumen. The other element
which can have an influence on emulsion formation is the presence of fine particles - emulsion
stabilizing agents (29) - such as clay and precipitated calcium carbonate (8) in bitumen. As pointed
out by Becher (29), precipitates are, in general, better emulsifiers than substances added to the
system and the physical state of the precipitates appears to be a very important factor. Generally,
highly gelatinous or highly-dispersed fine precipitates are more efficient than granular ones. If the
contact angle between a solid particle and two liquid phases is finite, a stable position for the
particle is at the liquid-liquid interface. Coalescence is inhibited because work has to be done to
displace the particle from the interface (13).
Emulsion Stability
The results of the measurements of dispersed oil concentration as a function of
sedimentation time for hexadecane-in-water and bitumen/kerosene blend-in-water emulsions are
presented in Figures 12 and 13, respectively. Both emulsion exhibit similar stability and a
continuous reduction in oil concentration was evident during the course of the experiment. The
emulsions with the addition of the polyelectrolyte (with and without surfactant) were less stable
than the emulsions with no additives.
All emulsions were prepared using exactly the same amount of oil. The initial concentration
differences came from the gravity separation during equilibration in the conditioning tank. A froth
layer in the conditioning tank was observed, especially in the case of the hexadecane emulsion

77
Figure 12. Dispersed oil concentration vs. time for hexadecane-in-water emulsions

78
1000q
no additives
30mg/dm SDS
2mg/dmPE
SDS + PE
200 400 600 800 1000 1200 1400 1600 Time [min.]

Figure 13. Dispersed oil concentration vs. time for the 20% bitumen/kerosene blend-in-water emulsions

80
1000?
1 a £
1 s 8 e ©
600 800 1000 1200 1400 1600 Time [min.]

81
with the addition of SDS and PERCOL 592. In cases with the addition of only PERCOL 592, a
thin oil layer at the surface was also observed.
In spite of the similar effects of the chemical additives, the two kinds of emulsions produced
from the different oil phases can be easily distinguished from each other. The emulsion made from
the bitumen/kerosene blend is more stable (i.e., higher oil concentration after a given period of
time). The values of the sedimentation coefficient presented in Table 7 are calculated from
Eq.(13). Two distinct stages of sedimentation can be distinguished in Figures 12 and 13.
Consequentiy, data for the two periods of time before and after 60 minutes of sedimentation were
taken for the calculations. Each stage can be approximated as a first order rate process. In the first
stage, the rate of sedimentation is about an order of magnitude greater than after 60 minutes. This
finding is very important because in the separation process the first period of 60 minutes is the
most significant period of time, the time during which the emulsion is processed.
It can be concluded from the sedimentation coefficient calculations, that the
bitumen/kerosene emulsion is more stable than the hexadecane emulsion (the smaller
sedimentation coefficient, the more stable the emulsion). This can be seen especially for the first
60 minutes of sedimentation. When comparing the less stable emulsions (addition of SDS as well
as SDS and PERCOL 592) with each other and with the more stable emulsions, the time of the
conditioning process (30 minutes in the tank before sampling) has to be taken into consideration.
The initial concentration was not the same in all cases. With the addition of SDS and PERCOL
592 the initial concentration was much lower than anticipated (250 mg/dm3); for hexadecane, 149
mg/dm3; and for bitumen/kerosene, 185 mg/dm3. As a consequence, such an emulsion (with
addition of SDS and PERCOL 592) is less stable than concluded from the data presented in Table
7. For a time period of over 60 minutes, all emulsions examined (with and without chemical

82
Table 7. Sedimentation coefficient calculated from the first order sedimentation rate equation for hexadecane and bitumen/kerosene emulsions with different chemicals added
Additives Sedimentation Coefficient [s-1] Hexadecane Bitumen/Kerosene
<60 min >60 min <60 min £60 min
no addi t ives SDS PE
SDS + PE
4.3-10"" 1.9-10"4
4.2-10"4
3.2-10"4
2.6-10 2.1-10 1.9-10 2.0-10 -5
1.7-10" 9.4-10 3.1-10 2.7-10"
-5
-4
3.3-10 2.4-10 2.2-10 2.0-10
-5
-5
-5

83
additions) had similar stability.
The reason for the greater stability of the bitumen/kerosene emulsion than the hexadecane
emulsion is the presence of natural surfactants and fine particles as was discussed in first section.
Addition of the surfactant makes the bitumen/kerosene emulsion more stable than the hexadecane
emulsion. On the other hand, the addition of the polyelectrolyte reduces the stability of the
bitumen emulsion. In the case of the hexadecane emulsion the reduction in stability due to the
addition of PERCOL 592 is less evident.
SUMMARY AND CONCLUSIONS
Droplet size distribution and oil-in-water emulsion stability for hexadecane-in-water and
20% bitumen/kerosene-in-water systems were examined in this study. The emulsions were
stabilized and destabilized with a surfactant (sodium dodecyl sulfate, SDS) and a cationic
polyelectrolyte (PERCOL 592), respectively. The results of this investigation support a general
consensus that phase separation for dispersed systems, such as for oil-in-water emulsions, can be
stimulated by the surface chemistry of the oil-water interface.
It was found that adsorption of surface active compounds at the oil-water interface affects
the oil droplet size distribution and the kinetics of droplet-droplet coalescence. Adsorbed SDS
lowers the oil-water interfacial tension and increases the surface charge at the oil-water interface
(27,28). As a consequence of the reduced oil-water interfacial tension, smaller sizes of oil
droplets are generated in the homogenizer with constant hydrodynamic conditions. The mechanism
of droplet-droplet coalescence is slower in such systems due to the increased surface charge at the
interface.
The polyelectrolyte primarily reduces the surface charge at the oil-water interface and

84
enhances the kinetics of the droplet-droplet coalescence. Also, the polyelectrolyte may reduce the
oil-water interfacial tension, however, this property was not examined in this research program
as thoroughly as in previous studies (27, 28).
HIGH-SPEED VIDEO INVESTIGATION OF Am BUBBLE FILMING WITH OTL
INTRODUCTION
Filming phenomena can be observed easily in the three phase air-water-oil system and is
of particular importance in the separation of bitumen from tar sands in hot water processing, as
will be demonstrated in the next chapter of this report. Filming of an air bubble with oil
incorporates at least three important stages. Initially, the aqueous film occupies the gap between
the colliding oil droplet and the air bubble. Next, after thinning and displacement, the aqueous
film ruptures, and oil spreads at the air-water interface. The minimal time required for film
drainage to a critical thickness and a spontaneous rupture is termed the induction time. The
induction time depends on the surface chemistry and the hydrodynamics of the system. It is
expected that the bubble adheres to the droplet when the bubble-droplet contact time is longer than
the induction time.
At equilibrium, the condition for filming is expressed by the following thermodynamic
criterion (35):
Yw > Y0J, + Y0 (14)
corresponding to the positive value of the spreading coefficient, where Yw> YO> YOW are the surface
tension of water and oil, and the oil-water interfacial tension, respectively.

85
EXPERIMENTAL
Sodium dodecyl sulfate (95% purity, Sigma Chemical Co.) as the surfactant, n-dodecane
(99% purity, Sigma Chemical Co.) as the oil and deionized water were used in all experiments.
Filming of the air bubble with oil was measured using the apparatus shown in Figure 13.
A high-speed camera with a framing rate of 1000 frames per second and a 10 /ts exposure time
(Kodak EktaPro 1000 high-speed video system) was coupled with a Questar 100 long distance
microscope. An air bubble and an oil droplet were put in contact by means of an electronic
induction timer (Virginia Coal Mineral Services, Inc.). Figure 14 depicts the device for filming
and measurement of the induction time. Two vertically oriented capillaries connected to
microsyringes were used to form an oil droplet and an air bubble. The oil droplet was released
from the upper capillary, while the air bubble was formed from the lower capillary. The upper
capillary was attached to the induction timer. The oil droplet and the air bubble were generated
in a rectangular glass cuvette filled with SDS solutions of varying concentrations. During the
experiment, the position of the capillary with the-air bubble was adjusted in such a manner that
the bubble was in steady contact with the oil droplet. The volumes of the droplets and bubbles,
controlled with microsyringes, were constant in all runs. The air bubble volume was 0.044 mm3
(horizontal diameter 0.45 mm), and the oil droplet volume was 0.19 mm3 (horizontal diameter
0.72 mm). The velocity of the bubble movement, resulting from the impulse, was also constant
and equal to 2.1 mm/s. The distance between the bubble and droplet was set at 0.13 mm and was
unchanged in all experiments. The filming time and the induction time were obtained from high
speed video tape recording.

Figure 14. Schematic diagram of the laboratory set-up used for measurements of the induction time: 1-electronic controller, 2-high-speed video camera, 3-long distance microscope, 4-electronic induction timer, 5-illuminators, 6-syringe with oil, 7-syringe with air, 8-upper capillary, 9-lower capillary, 10-glass cuvette, h-initial distance between the oil droplet and the air bubble.

87
6
- 1 - / 7
— , — / -
3_

88
RESULTS AND DISCUSSION
Aging Effect on the Induction Time
The relationship between the induction time and the life time (conditioning time) of the
bubble and droplet (which is the period elapsed from their release to rupture) was studied in a time
range of 15 seconds to 5 minutes. Fifteeen seconds was the minimum bubble/droplet age that
could be obtained in our experimental set-up. Figure 15 shows the effect of bubble/droplet age
on the induction time for 10~7 M to 10"2 M aqueous SDS solutions. In all cases the induction time
was practically constant which indicates that the coverage of newly formed surfaces with SDS
molecules takes place in less than 15 seconds.
Induction and Filming Time as a Function of SDS Concentration
Figure 16 shows the results of the induction time measurements for the dodecane-air-
aqueous solution systems with varying concentrations of SDS. The experimental data in Figure
16 represent the average values as calculated from at least 20 measurements for each SDS
concentration. Large numbers of measurements were necessary because of the variation in the
experimental data.
The induction time decreased steadily with an increasing SDS concentration (Figure 16).
A minimum value of 0.59 second was obtained for approximately 10^ M SDS. The induction time
sharply increased for solutions with SDS concentrations larger than 10"* M. In distilled water the
induction time was 1.33 seconds.
The relationship between the spreading coefficient for dodecane and various SDS
concentrations is presented in Figure 17. A comparison of Figure 16 with Figure 17 indicates a
distinct correlation between the spreading coefficient and the induction time. The shortest
induction time corresponding to the largest spreading coefficient indicates that thermodynamic

Figure 15. Relationship between induction time and age of air bubble/oil droplet system for varying SDS concentrations.

90
O
4 -,
3 -81
SDS Concentration
10EXP(-2)M
• r-4
O
o
2 -
.£
^ •
,̂ ._ re=i$ Q
=^= -S35-
B"
OM
10EXP(-7)M ^ 10EXP(-6)M " ^ 10EXP(-3)M
"*• 10EXP(-5)M 10EXP(-4)M
0
0 50 100 150 Age (sec)
200 250 300

91
Figure 16. Relationship between induction time and SDS concentration.

92
4.00 —.
o W
Q)
o • l - l -p o
3.00 —
2.00 —
1.00 —
0.00
1E-8 1E-6 1E-5 1E-4 SDS Concentration (M)

93
Figure 17. Spreading coefficient for dodecane as a function of SDS concentration.

94
Pi CD
CD o o 00 a
• • - «
•d <a
CD
GO
1E-7 1E-6 1E-5 1E-4 1E-3 0.01 SDS Concentration (M)

95
factors have substantial impact on filming phenomena, particularly on thinning and displacement
of the aqueous phase between the air bubble and the oil droplet.
Hydrodynamic factors, namely the velocity of the moving bubble and droplet, or the
vibrations of surfaces which are in contact, have a remarkable influence on the induction time.
The rupture of the liquid film can occur before complete thinning. Factors which can initiate film i
rupture are small vibrations and sloshing of the liquid. A broad scatter of the experimental data
in some measurements (Figure 15) supports this observation. Despite the fact that the diameters
of the air bubbles and the oil droplets remained constant, as well as the velocity of the bubble
approach to the oil droplet, at least 20-30 measurements for the SDS solution and about 50 for
distlled water were necessary to obtain satisfactory results.
The measured values of the filming time are given in Figure 18. The relationship between
the filming time and the SDS concentration corresponds very well to the induction time and the
spreading coefficient. The results indicate that the filming time is controlled by the spreading
coefficient - a thermodynamic property.
CONCLUSIONS
Induction time and filming time were measured for an air bubble-dodecane droplet-aqueous phase
with varying SDS concentrations. A high-speed video camera (1000 frames per second, 10 jxs
exposure time) coupled with a long distance microscope were used to study the mechanism of the
coalescence and spreading phenomena. It was found that the induction and filming times depended
on the SDS concentration. With an increase in SDS concentration the induction time decreased
and reached a minimum at a 10"4 M SDS solution. A similar relationship was observed for the
filming time. The minimal values of the induction time and the filming time corresponded to the

96
Figure 18. Relationship between filming time and SDS concentration.

97
0.50
0.40
o sS 0.30
H
| 0.20 -I
Pn
0.10
0.00
1E-8 TITTT1
1E-7 i urn1 rTTTF 11 llll1
1E-6 1E-5 1E-4 SDS Concentration (M)
1E-3 i IIIIII'
1E-2

98
maximum value of the spreading coefficient, which indicates that thermodynamic properties of
the system play an important role in spreading/filming phenomena.
ENHANCED BITUMEN SEPARATION FROM OIL SANDS IN THE PRESENCE OF GAS BUBBLES
INTRODUCTION
The modified water-based process developed at the University of Utah for domestic oil
sands is presented in Figure 19. A pretreatment step which involves kerosene addition to the oil
sand is necessary to reduce the bitumen viscosity below 1.5 Pa-s (20). The alkalinity of the
aqueous phase in the digestion step is adjusted to a pH of 8.0 to 9.5 with sodium carbonate
(Na2C03); sodium tripolyphosphate (Na^O^) is added to facilitate bitumen disengagement (36).
The digestion temperature is maintained in the range of 323 to 333 K by saturation of the oil sand
slurry with a mixture of steam and air. After several minutes of digestion, the slurry is discharged
into a gravity separation cell and diluted with water. The bitumen concentrate is skimmed and the
gravity tailings are transferred to a flotation cell to recover residual bitumen. The coarse sand
particles are screened, and the tailings are subjected to sedimentation for 20-30 minutes. Finally,
the tailings water is recycled to the digestion reactor (37). The bitumen concentrate thus prepared
requires the removal of fine solids and dispersed/emulsified water before utilization and/or
upgrading. The diluent-assisted hot-water process for bitumen recovery from oil sands as
developed at the University of Utah satisfies basic practical requirements (high bitumen recovery,
over 90%, and a good quality bitumen concentrate, 50-80 % bitumen on a dry weight basis)
necessary for scale-up. However, it is believed that further improvements in bitumen recovery and
the quality of the bitumen concentrate can be achieved by identification and control of the physico-

I
Figure 19. Flowsheet for the hot-water processing of Utah oil sands. 1 0

kerosene
Na2C03 Na 5 P 3 0 1 0
steam with air
bitumen *• concentrate
gravity separation
cell (B) tailings
f lotat ion cel l (C)
sedimentation tank (D) tailings
o o

101
chemical properties of such oil sand systems. Also, an appropriate identification and control of
the physico-chemical properties of oil sand systems may lead to the development of new
underground hot-water processing of oil sands.
For a long time, the digestion step was aimed at bringing the oil sand in contact with a hot
alkaline-water solution in which the oil sand structure broke down to give water-wet sands and
bitumen droplets displaced from mineral surfaces by the aqueous phase (similar to the mechanism
of detergency). Bitumen dispersed in the alkaline solution was then recovered by flotation.
Recently it has been discovered that gas injection during digestion improves the bitumen release
from the oil sands and aerates the bitumen phase, thus facilitating the gravity separation of a high
grade bitumen product (6, 38). Only aerated bitumen droplets can be separated by gravity
because the difference in density between bitumen and water is generally insufficient to make an
effective gravity concentration. Importantly, it was observed from these hot-water processing
experiments that aeration of the oil sand slurry during digestion improves the quality of the
bitumen concentrate.
Thus air injection during digestion plays an important role in bitumen release from oil
sands. In this regard, the role of gas bubbles in the analysis of bitumen displacement from sand
grains during digestion is important and its significance in the hot-water process is demonstrated
in this contribution based on fundamental studies of model systems.
EXPERIMENTAL
Diluent-Assisted Hot-Water Experiments
The flowsheet for hot-water separation of bitumen from oil sand is presented in Figure 18.
Oil sand samples from the North-West (7.0 wt% bitumen) or West-Central (6.0 wt% bitumen)

102
locations of the Whiterocks oil sand deposit were crushed, screened, and pretreated with 10 wt%
kerosene (kerosene addition was based on the bitumen content). The kerosene was allowed to
penetrate the oil sand for a period of 8 hours. Batch aqueous digestion (328-333 K, 75 wt% solids)
experiments were conducted in a baffle stirred-tank reactor (A, 20 L) equipped with a double
blade turbine impeller. Fresh tap water or recycled water (supernatant solution syphoned after 20
minutes of decantation from a 40 L sedimentation tank, D) with dissolved chemicals (Na2C03,
Na5P3O10, NaCl), was used for digestion. A mixture of steam and air was used to raise the
temperature of the oil sand slurry in the digester. After 5 minutes of digestion the resulting slurry
was discharged into a gravity cell (B) and diluted with fresh tap water or recycled water (323 K,
40 wt% solids) for sand sedimentation and separation of the released bitumen concentrate. The
suspension was gently stirred and the bitumen concentrate was skimmed from the surface of the
process water. Batch flotation (15 wt% solids) in a Denver-type flotation cell (C, 38 L; air flow
rate 5-6 L/min) was used for the final separation of the residual bitumen.
The grade of the bitumen concentrate from the gravity cell was determined by sample
extraction with toluene using a Dean-Stark apparatus. Samples of the process water were
withdrawn from the digester for measurement of the bitumen/water interfacial tension. The
interfacial tension between the 10 wt% kerosene-in-bitumen and the process water was measured
using the Wilhelmy plate technique with the K10T Digital-Tensiometer (KRUSS GmbH,
Germany). ,
Significance of Aeration during Digestion
Crushed oil sand samples from the Whiterocks oil sand deposit (North-West location) were
treated with kerosene (10 wt% of bitumen content) and allowed to equilibrate for 8-10 hours. Hot-
water experiments were conducted in a Denver flotation cell (3 L) at a temperature of 325-330 K

103
with a 1 kg oil sand sample and 1.2 L water (45 wt% solids). Fresh tap water with dissolved
Na,C03 and NajPgOjo was used in all experiments.
In the first experimental procedure, the oil sand pulp was digested for 5 minutes (rotational
speed of the stirrer was about 1000 rpm) and aerated with an air flow rate of 10-12 L/min.
Subsequently, during gravity separation (5 min.) the bitumen concentrate was skimmed with a
paddle and the froth composition was determined in terms of bitumen and solids content.
In the second experimental procedure, the oil sand pulp was digested at the same intensity
but in the absence of aeration. After 5 minutes of digestion, gravity separation was attempted and
the solids were separated from the supernatant liquid by decantation. The supernatant liquid was
recycled to the flotation cell. The settling sands were washed with 1 L of fresh aqueous phase
(warm tap water containing the same amount of chemicals as used in digestion) and discharged.
The wash water was combined with the supernatant liquid and recycled to the digester (flotation
cell). The supernatant liquid was subjected to flotation using conditions similar to those described
in the first experimental procedure, viz., rotational speed of stirrer of 1000 rpm, air flow rate of
10-12 L/min, 5 minutes of flotation. Finally, the residual aerated bitumen concentrate in the
supernatant was recovered for 5 minutes by gravity separation.
The bitumen content in the froth products was determined by the Dean-Stark analysis. The
pH of the aqueous phase was measured using a pH-meter (model 520, Orion Research Inc.,
U.S.A.). The bituminous/aqueous phase interfacial tension was measured by the Wilhelmy plate
technique (Digital-Tensiometer K10T, KRtJSS GmbH, Germany). Note that the 10 wt% kerosene-
in-bitumen mixture was prepared separately for the interfacial tension measurements using
kerosene (Chevron) and toluene-extracted bitumen from Whiterocks oil sands.

104
Microscopic Observations of Bitumen Spreading at the Gas Bubble Surface
Samples of the unconsolidated Whiterocks oil sand (North-West, 7.6 wt% bitumen) treated
with 10 wt% kerosene (addition based on the bitumen content) were submerged in alkaline
solutions in a glass cell. Changes in sample characteristics, especially bitumen spreading at the gas
bubble surface, were observed through a stereoscopic microscope (Carl Zeiss Jena, Germany) and
photographs taken as appropriate. The temperature in the glass cell was maintained at a constant
level (±3 K) by using a hot plate, and the pH of the aqueous phase was measured using a pH-
meter (model 520, Orion Research Inc.).
Whiterocks bitumen (either toluene-extracted or with 10 wt% kerosene) was spread
mechanically on a quartz slide. The quartz slide was immersed in the aqueous phase at ambient
or moderate temperatures. An air bubble, pushed through a microsyringe, was attached to the
bitumen coated surface of the quartz slide. Bitumen spreading over the air bubble was observed
and photographed through a stereoscopic microscope.
RESULTS AND DISCUSSION
Significance of Oil Sand Slurry Aeration
To demonstrate the significance of gas bubbles in bitumen release from mineral surfaces
the following experiments were conducted. The Whiterocks oil sand was digested with process
water in a Denver-type flotation cell. In the first experiment, air was sparged in the system (air
flow rate was 10-12 L/min.) and after 5 minutes of gravity separation a bitumen concentrate was
collected from the surface of the suspension. In the second experiment, oil sand was digested with
process water under the same conditions but in the absence of aeration. After 5 minutes, sand and
undigested oil sand were separated from the supernatant water, and washed with an additional

105
volume of the aqueous phase (same concentration of chemicals as for the aqueous phase used
during oil sand digestion) to remove bitumen droplets entrapped in the slurry. The supernatant
water from both steps of this experiment was combined and subjected to flotation (air flow rate
of 10-12 L/min, 5 min., 1000 rpm). These two experiments were conducted to compare the
efficiency of bitumen release from oil sand slurry during digestion in the presence and absence
of aeration. In this way, it was possible to determine the role of air bubbles in the digestion step
of the hot-water process. The experiments were conducted in a Denver flotation cell because
aeration of the oil sand slurry could be controlled. The effect of oil sand slurry aeration during
digestion on bitumen recovery and grade are presented in Table 8.
The results presented in Table 8 indicate the significance of the bitumen/water interfacial
tension in the bitumen release from sand grains in the presence of "air bubbles during oil sand
digestion. The bitumen separation and the quality of bitumen concentrate increased with
decreasing interfacial tension (Table 8). A significant bitumen recovery from Whiterocks oil sand
was only observed when the oil sand slurry was sparged with air during digestion. This suggests
that attachment of gas bubbles to bitumen at the surface of mineral particles and spreading of the
bitumen at the gas bubble surface are important phenomena which account for the improved
recovery of .bitumen from oil sand.
The poor quality of bitumen concentrate obtained in experiments No 1-2 (Table 8) indicates
that a significant amount of bitumen was strongly held by the solid particles and after air bubble
attachment to the bituminous sand, agglomerates of air bubble-bitumen-solid particle are
transported into the froth. A strong adhesion of bitumen to the mineral particle surfaces could not
be overcome by hydrodynamics in the flotation cell, and a better bitumen separation was made
possible only when the bitumen/water interfacial tension was lowered as in experiments No 3-5

Table 8, Bitumen recovery from Whilerocks oil sand in the presence and absence of aeration during digestion
Exp. No
1.
2.
3.
4.
5.
Reagent Concentration Na2C03 Na5P30)0
[M] [M]
7.8-10"3
I.2-10"2
2,1-10"*
3.9-I0"2
3.9-10'2
2,3-10"3
3.4-10-3
6.8-10"3
1.1-10"2
2.2-10"2
pH
7.9
8,3
8.7
8.9
9.0
Interfacial Tension (60°C)
[mNrrf1]
11.7
10.2
9.2
6.5
4.4
Recovery (Grade, dry basis) no aeration 10-12L/min air f
during digestion rate during digesl [wl%] [wi%]
<1 (ND)
•1 (33)
5(48)
4(51)
7 (56)
20(11)
18(15)
29 (24)
41 (32)
47(41)
ND - not determined

107
(Table 8).
Bitumen Release from Oil Sand - the Assistance of Gas Bubbles
It is evident from our experiments that gas bubbles aid bitumen release from mineral
particles. The bitumen transfer from the oil sand to the gas bubble surface occurs during digestion
of the oil sand slurry. Phenomena associated with bitumen release from coarse particle surfaces
in the presence of air bubbles are revealed by the photographs presented in Figure 20. These
photographs demonstrate how gas bubbles are enveloped by the bitumen. Gas (probably air
saturated with volatile hydrocarbons), which is entrapped in the inter-particle space of the oil sand
sample and in the pores of the mineral particles, appears to be displaced from the oil sand by
penetration of the aqueous phase when the oil sand sample is immersed in an alkaline solution (6).
The gas, displaced by the aqueous phase, forms bubbles at the oil sand surface which adhere to
the mineral particle surfaces via bitumen bridges. In time, the bitumen spreads over the gas bubble
surface to envelope the gas bubble as is evident for the systems shown in Figure 20. It is believed
that in the digester the attachment of a gas bubble to a sessile bitumen droplet on the surface of
a coarse particle may occur after inertial collision of the suspended phases. The kinetic energy for
a collision between the bitumen-sand aggregate and the gas bubble should be much larger than for
the collision between the bitumen droplet and the gas bubble due to a larger difference in density
of the colliding bodies. Electrostatic repulsive forces between the charged dispersed phases,
bitumen-sand aggregate and bubble, might play only a minor role in inhibiting such inertial
collisions.
Bitumen spreading over the air bubble surface was also observed for the following model
systems. A quartz slide was coated with Whiterocks bitumen, or kerosene (10 wt%)-in-bitumen
mixture, and immersed in the aqueous phase. An air bubble was placed on the immersed quartz

108
Figure 20. Diluent pretreated Whiterocks oil sand sample (10 wt% kerosene based on the bitumen content) immersed in alkaline solution (A. pH=9.6, 0.001 M NaCl, T=338 K, t=3 min; B. pH=9.2, 0.05 M Na5P3O10, T=328 K, t=4 min). Illustration of bitumen spreading over the gas bubble surface (A), and bitumen-enveloped gas bubbles (B). Photographs taken for stagnant conditions.

109

110
slide using a microsyringe. The spreading of the bituminous phase over the bubble surface was
observed and photographed through a stereoscopic microscope. Figure 21 illustrates the kinetics
of bitumen spreading at the air bubble surface (additional photographs of bitumen spreading for
similar model system are presented in Ref.(4)). It was observed that the bituminous phase covered
the bubble surface in a variety of aqueous phase compositions: pH=7 to pH=ll , 0 to 0.05 M
Na5P3O10 and 0 to 1 M NaCl concentrations, and temperatures from 293 K to 333K (6).
Bitumen spreading at the air bubble surface involves complex phenomena (6). First, it was
observed that a precursor film always assisted the moving bituminous phase and this film covered
the bubble surface in the first seconds of an experiment (a change in color of the air bubble
surface in front of the bituminous phase was observed but the thickness of this film was impossible
to estimate in these experiments). Second, the kinetics of bitumen spreading depended on the
volume of bitumen in contact with the air bubble. When the air bubble was attached to a small
bitumen lens, less than several hundred micrometers in diameter (bubbles with diameters larger
than 1.5 mm were used in these experiments), the spreading of the bituminous phase was almost
instantaneous and difficult to capture on photographs. Also, the bitumen spread rapidly when the
temperature was greater than 300 K. Figure 21 illustrates the behavior of the system at ambient
temperature, under which conditions the kinetics (60 seconds) of bitumen spreading did not
significantly disturb the quality of the photographs.
Bitumen spreading and envelopment of the gas bubble, shown in Figures 20 and 21,
indicate a positive spreading coefficient, S > 0, where the spreading coefficient is expressed by
the following equation (13):

111
Figure 21. Spreading of bitumen (diluted with 10 wt% kerosene) at an air bubble surface pH=9.0-9.1, 0.001 M NaCl, T=293-295 K. Initially a bitumen film was deposited on a quartz slide and an air bubble was attached using a microsyringe.

112
1 mm
10 s 20 s
30 s 60s
It m

113
where yw> YB> YBW are the surface tension of the water, bitumen, and the bitumen/water interfacial
tension, respectively. It was demonstrated in our previous contributions (5,6) (see also our 1992-
1993 DOE report) that the spreading coefficient, S, as calculated based on equilibrium values of
yB, yw, and YBW> remains positive for the Whiterocks bitumen/water systems with varying pH
values from pH=7 to p H = l l , and for varying concentrations of inorganic salts, from 0 to 0.1
M NasP3Oi0 and from 0 to 1 M NaCl, even if the surface tension of the processing water is
reduced to 45 mN/m. However, bitumen spreading at a water surface is a dynamic process in
which the driving force, the spreading coefficient, may vary with time. The spreading coefficient
can change even for systems with pure single-component liquids. With time the initial positive
spreading coefficient decreases to near zero or becomes negative when liquids are saturated with
each other. Bitumen is a complex mixture of hydrocarbons. The equilibration of surface properties
in bitumen/water systems requires time, and the spreading phenomena are even more complex
than for pure systems. Microscopic observations, discussed in the previous section, showed that
the precursor film (with a thickness of several micrometers or less, as expected after visual
observations) always assists in the spreading of the bitumen. It was observed in our laboratory (6)
that the surface tension of water in contact with bitumen decreased in time due to a screening
effect created by the migration of bitumen, or selected bitumen components. Further, contact of
bitumen with the aqueous phase also creates diffusional processes in which surface active
compounds migrate at the bitumen/water interface to minimize the interfacial free energy (6). In
this regard, the spreading coefficient for the bitumen/water system varies with time due to changes
in the surface tension of the aqueous phase, affected by the spreading films of bitumen (or bitumen
components), and changes of the bitumen/water interfacial tension. Bitumen spreading at the water
surface occurs as long as the thermodynamic equilibrium in the system is not reached, i.e., there

114
is a positive spreading coefficient (note that the initial positive spreading coefficient was also
demonstrated for a bitumen (20-40 wt%)/kerosene blend (27).
Hot-Water Processing of Oil Sands in the Presence of Dispersed Gas
The unique role of gas bubbles in bitumen separation from oil sands has been recognized
in the commercialized hot water process used in Canada in which case 30 vol% of air is mixed
with steam and injected during digestion to maintain an appropriate temperature for digestion (38).
Thus, aerated bitumen droplets can be separated in the gravity cell. In the diluent-assisted hot-
water experiments conducted at the University of Utah in a baffled stirred-tank reactor, air was
also introduced into the digester with steam, but the amount of air was not controlled (6).
Additionally, the intrinsic gas phase (air saturated with volatile compounds of bitumen) is released
from oil sand during digestion. Atmospheric air may be.incorporated into the oil sand slurry
during digestion. Air from both sources is entrapped by bitumen in the oil sand slurry and causes
the bitumen concentrate to float to the surface in the gravity separation cell.
The effect of bitumen/water interfacial tension on bitumen recovery in the gravity
separation step, after oil sand digestion in the presence of air, is shown in Figure 22. The hot-
water processing tests were carried out as described in the experimental section. A change in the
bitumen/water interfacial tension was stimulated by varying the pH and/or the ionic strength of
the aqueous phase (varying concentration of Na2C03, Na^O^, NaCl). See Ref.(4) and our 1992-
1993 DOE report for more details. As previously mentioned, gravity separation of bitumen was
possible in our experiments due to the entrapment of air during digestion. The gas phase was
introduced with steam and also originated from the intrinsic gas released from the oil sand during
digestion.
Based on the experimental results presented in Figure 22 it is evident, in addition to

Figure 22. Relationship between bitumen recovery from gravity separation and the bituminous phase (10 wt% kerosene-in-bitumen)/process water interfacial tension.

116
100
a 20-
0
_̂_̂
•
'M. & 0 > o o CD
rr c CD
E Z5
80-
60-
40-
excellent separation
•
CI
• Q
0
good separation poor
separation a
4 6 8 10 Interfacial Tension [mN/m]
12

117
aerated digestion, that the bitumen/water interfacial tension should be lowered to a value below
7- mN/m, preferably below 4 mN/m; for efficient Whiterocks bitumen recovery from the oil sand.
These criteria are in agreement with our previous findings (5). However, it should be recognized
that during oil sand processing the dynamic interfacial tension or the dynamic surface tension are
difficult to predict and may differ slightly from values determined under equilibrium conditions.
CONCLUSIONS
Poor bitumen recovery from oil sands was observed when air (gas) was eliminated during
digestion. A successful bitumen recovery from the Whiterocks oil sands was achieved when the
oil sand pulp was saturated with dispersed air during the digestion step. The effective separation
of bitumen from oil sands involves the mechanisms of gas bubble attachment to bitumen located
at the surface of mineral particles, spreading of bitumen over the gas bubble surface, and
detachment of bitumen-enveloped gas bubbles from the surfaces of coarse sand particles. All these
steps are facilitated by decreasing the bitumen/water interfacial tension. A decrease in the
bitumen/water interfacial tension can be accomplished by an increase in the pH and/or
concentration of electrolyte.
Systematic studies of the process which combines oil sand digestion and flotation into one
step seem to be of particular significance for future research activity. The optimal amount of
injected air and air bubble size distribution needs to be identified in order to improve bitumen
separation from oil sand.

118
BITUMEN PAVING MATERIAL WITH CRUMB RUBBER MODIFIER
INTRODUCTION
The amount of asphalt used annually is about 30 million tons of which approximately 24
million tons is used in paving applications (39). Refineries blend asphalt binders to meet the
specification requirements of the design engineer. However, the current asphalt binder being
supplied has not, in most cases, performed as expected. This is partially due to the decline in the
supply of high quality asphalt from indigenous crudes. In addition, the performance of asphalt
paving materials are constantly being challenged to withstand the strins of increasing traffic loads
under widely differeing climatic conditions. In many circumstances, changing the mix design or
aggregate types, or other conventional approaches have failed to solve the cracking and ruting
problems exhibited by asphalt pavements. Recently, polymeric materials and other additives have
been incorporated into asphalt binders to increase the viscoelastic behavior of pavements, thereby
reducing permanent deformation while providing a tough, crack-resistant binder. In order to meet
the increase demands and enhance the life-time of asphalt pavements, the development of high
quality asphaltic materials is a must.
Tar sand bitumens represent an important potential petroleum resource that may serve the
demand for the production of high asphaltic materials. The physical properties and elemental
compositions of tar sand bitumens are quite similar to those reported for petroleum asphalts. In
fact, the properties of several tar sand asphalts prepared in past studies by several different
investigators compare favorable with petroleum-derived asphalts and ASTM specifications (39).
In a previous investigation it was determined that the bitumen and a vacuum distillation residue
from the Asphalt Ridge tar sand deposit in Utah met ASTM specifications as viscosity-graded
asphalts, AC-5 and AC-30, respectively (41). A similar investigation with a vacuum distillation

119
residue of bitumen from the Whiterocks, Utah, deposit has classified it as a viscosity-graded AC-
10 asphalt (41). The only commercial application of tar sand bitumen as a paving material has
been limited to the direct use of run-of-mine tar sand as a surfacing material. The tar sands as
obtained from quarries, however, do not meet existing specifications as a highway construction
material.
Rubber is one type of polymeric material which can be used to modify the viscoelastic
properties of asphalts. Enormous quantities of scrap tires are discarded around the world every
year, almost 300 million tires in the United States alone (42), and represent a low-cost source of
rubber. With the exception of Japan, where 92% of scrap tires are being utilized (42% in the form
of crumb rubber), other countries dispose of the majority of waste tires in landfills or illegal
dumps. In 1991, based on preliminary performance of rubber modified asphalt, the U.S. Congress
included a provision in the Intermodal Surface Transportation and Efficiency Act (ISTEA, P.L.
102-240, Section 1038) addressing the use of scrap tire rubber in paving materials. The primary
requirements of Section 1038 as they relate to rubber modified asphalt are: relax federal
regulations to permit state and local agencies to use rubber in pavement construction; study the
performance, recycling, and environmental aspects of rubber use in asphalt design; and satisfy a
minimum rubber utilization requirement (MUR) beginning in 1994. The MUR requires that at
least 5% of Federal Aid hot-mix projects in 1994 must include some form of recycled tire rubber
(this has been delayed until 1995). The MUR increases 5% each year up to 20%.
In view of the foregoing, research was initiated to study the feasibility of blending scrap
tire rubber with selected Utah tar sand bitumens. In this section of the report, high temperature
consistency as measured by the Brookfield viscosity of the blended mixture is analyzed as a
function of composition, and co-processing variables including reaction temperature and mixing

120
EXPERIMENTAL
Bitumen Samples
Hot water processing was used to obtain a bitumen concentrate from Asphalt Ridge tar
sand (Uinta Basin, Utah) in large scale laboratory experiments according to procedures described
in the previous section of this report. The bitumen concentrate originally contained 30 wt%
dispersed water and about 5 wt% fine minerals. Both the contaminating phases were removed by
1 month sedimaentation at room temperature.
The Circle Cliffs tar sand (Uinta Basin, Utah) samples were used in several batches to
obtain bitumen by the Dean-Stark toluene extraction method. The toluene extracts of the bitumen
were subjected to vacuum distillation on the rotary evaporator, and the final traces of the solvent
were removed at 90°C and a vacuum setting of 20 ton for more than 4 hours.
Crumb Rubber
Two types of commercially available crumb rubber were used in this study. One type
consisted of whole-tire rubber and contained a small proportion of fibrous material. This fibrous
material is believed to culminate fromthe reinforcing plies used in the construction of pneumatic
tires, and is generally composed of polyester and polyamide fibers. The second type of crumb
rubber consisted only of tread rubber and was relatively devoid of the fibrous material ubiquitous
to whole-tire crumb. Both types of crumb were ambient ground and supplied by the manufacturer
as minus 40 mesh material. Additional screening performed in the laboratory allowed for
relatively narrow size fractions to be co-processed with the tar sand bitumen. The bitumen-rubber
blends prepared with whole-tire rubber used crumb in the -100+140 mesh size interval; whereas,
the blends containing tread rubber used -70+100 mesh crumb.

121
Viscosity Measurements
The viscosity measurements were made with a Brookfield Cone/Plate Viscometer, model
5XHBT, using 2 milliliters of sample and a 3.0° cone spindle. Viscosities of the bitumen-rubber
blends were measured at shear rates of 1 to 40 sec"1 in the temperature range of 40 to 90°C.
Bitumen-Rubber Co-Processing
Co-processing of the crumb rubber and tar sand bitumen was performed in the
temperature range of 200 to 380°C using a 150 cc autoclave (Autoclave Engineers). Reaction
temperature was maintained within +.2°C of the experimental temperature. Reaction time ranged
from 0.5 to 4.0 hours not including the time associated with sample heat-up and cool-down
periods. Sample heat-up times fluctuated according to the experimental temperature and ranged
from 30 to 60 minutes. Sample cool-down was generally accomplished within 45 minutes.
A removable 100 milliliters 316L stainless steel sleave was machined and snugly fitted
to the reaction chamber of the microclave to facilitate sample removal and cleaning operations.
Approximately 36 grams of bitumen were used in each experiment, with crumb rubber additions
ranging from 0 to 30% by weight of bitumen. The bitumen and crumb rubber were placed in the
sleave in a layered configuration to optimize crumb rubber dispersion. Approximately one-half
of the total, bitumen was placed in the sleave immediately prior to and following crumb rubber
addition. After the sample-filled sleave was sealed inside the autoclave, the system was purged
three times at 1000 psig with nitrogenin order to remove oxygen from the reaction chamber.
Mixing was accomplished with a straight four-blade turbine. Initial mixing intensity was set at 100
rpm and increased to 500 rpm when the sample temperature approached the temperature lower
than 50°C of the experimental temperature. Lower boiling components were continuosly collected
during each experimental run using a 5 mm diameter copper condenser connected to a sample port

122
located at the extreme top of the autoclave. To aid in the removal of the light fractions, nitrogen
was slowly purged through the system during each experiment.
RESULTS AND DISCUSSION
The experimental conditions under which crumb rubber was co-processed with tar sand
bitumen in the autoclave are outlined in Table 9. Two types of bitumen were examined - an oil
extended bitumen concentration containing approximately 10 wt% kerosene and a refined Circle
Cliffs bitumen, free of kerosene. The bitumens were blended with a whole-tire crumb rubber
containing a small proportion of polyester and/or polyamide fibers, and a tread-rubber crumb
relatively devoid of the fibrous material. In addition to the presence of the fibrous material, the
whole-tire crumb probably contains a larger percentage of natural rubber than the tread-rubber
crumb. Whole-tire crumb includes rubber from all components of a tire, including the sidewall
which generally contains a large proportion of natural rubber to provide optimum flexibility.
Whereas, tread-rubber requires a high resistance to abrasion and generally contains significant
amounts of synthetic rubber compounds.
Viscosity measurements were made on the blended samples at shear rates of 1 to 40 sec'1
in the temperature range of 40 to 90°C. Unlike the empirical tests commonly performed on
petroleum asphalts such as penetration and ductility, viscosity is a fundamental measurement of
consistency that is generally unaffected by changes in testing conditions, such as instrumentation
configuration or sample geometry. Viscosity measurements are capable of evaluating effects of
temperature, heating, and rate of deformation of loading. Viscosity is probably the most important
primary specification consideration since it is influential in determining the properties of the
paving mixture during preparation and pavement construction, as well as, the properties of the
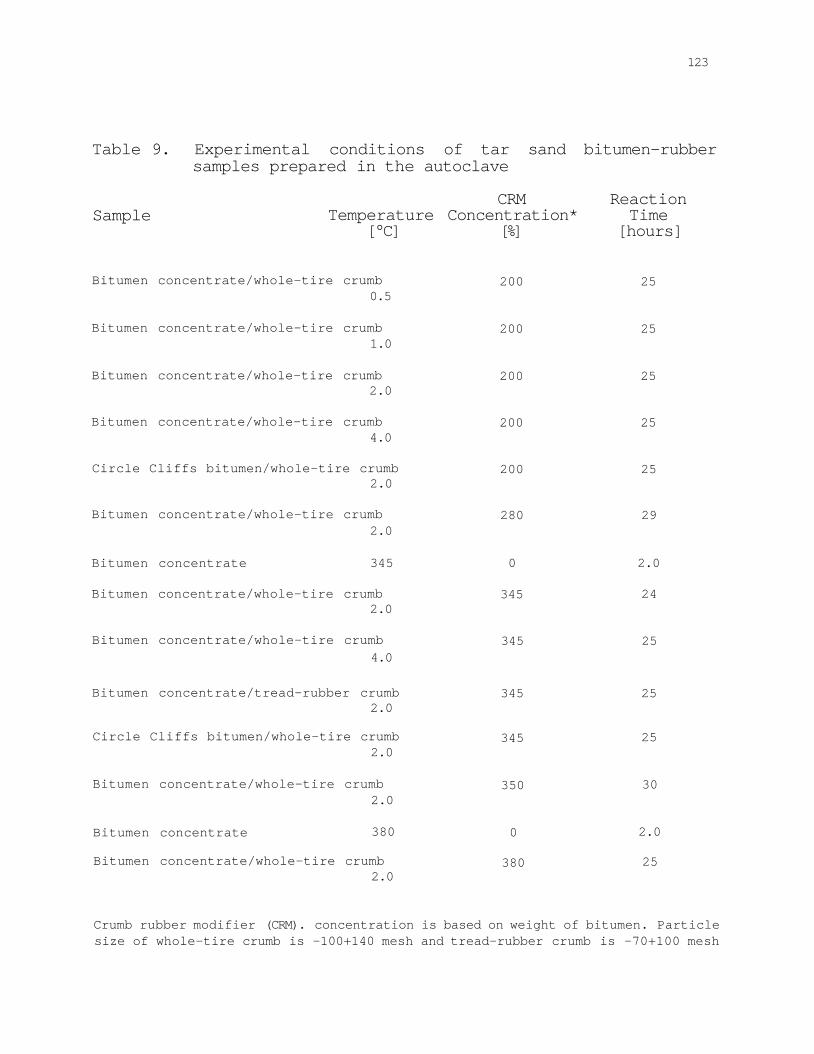
123
Table 9. Experimental conditions of tar sand bitumen-rubber samples prepared in the autoclave
Sample CRM Reaction
Temperature Concentration* Time [°C] [%] [hours]
Bitumen concentrate/whole-tire crumb 0.5
200 25
Bitumen concentrate/whole-tire crumb 1.0
200 25
Bitumen concentrate/whole-tire crumb 2.0
200 25
Bitumen concentrate/whole-tire crumb 4.0
200 25
Circle Cliffs bitumen/whole-tire crumb 2.0
200 25
Bitumen concentrate/whole-tire crumb 2.0
280 29
Bitumen concentrate 345
Bitumen concentrate/whole-tire crumb 2.0
0
345
2.0
24
Bitumen concentrate/whole-tire crumb
4.0 345 25
Bitumen concentrate/tread-rubber crumb 2.0
345 25
Circle Cliffs bitumen/whole-tire crumb 2.0
345 25
Bitumen concentrate/whole-tire crumb 2.0
350 30
Bitumen concentrate 380
Bitumen concentrate/whole-tire crumb 2.0
0
380
2.0
25
Crumb rubber modifier (CRM). concentration is based on weight of bitumen. Particle size of whole-tire crumb is -100+140 mesh and tread-rubber crumb is -70+100 mesh

124
finished pavement.
The flow properties of the bitumen-rubber samples generally exhibited non-Newtonian
behavior, and at low measurement temperatures, the samples tended to behave as viscoelastic
semi-solid materials. As the measurement temperature increased, the samples became Newtonian.
In addition, the flow characteristics of the bitumen-rubber samples changed significantly with
reaction temperature. At low reaction temperatures, sample viscosity decreased significantly with
increasing shear rate. This is illustrated in Figure 23 where viscosity is plotted as a function of
shear rate at constant measurement temperature for bitumen concentrate blended with 25 % crumb
rubber at 200°C. However, the samples prepared at higher reaction temperatures (280 to 380°C)
exhibited Newtonian flow behavior with increasing shear rate. This trend is evident in Figure 24
where viscosity is plotted as a function of shear rate at constant measurement temperature for
bitumen concentrate blended with 25% crumb rubber for 2 hours at 200, 280, 345, and 380°C.
The change in the flow behavior at higher reaction temperatures may presumably be a direct result
of crumb rubber degradation. At mixing temperatures of 280°C and greater, the rubber particles
are disintegrated and incorporated into the bitumen matrix; however, at 200°C rubber degradation
does not occur to any appreciable extent, and the rubber particles swell under the action of the
aromatic and naphthenic oils present in the bitumen. The texture of the blended samples also
supports possible rubber disintegration and incorporation into the bitumen matrix. Rubber particles
were easy to identify visually in the blended samples at 200°C but not in the samples prepared at
280, 345, and 380°C. The samples prepared at 200°C also exhibited a typical elastomeric
properties.
It is important to note the significant increase in viscosity exhibited by the bitumen
concentrate after blending with crumb rubber. For example, bitumen viscosity increases at 60°C

125
Figure 23. Viscosity as a function of shear rate at 60°C for bitumen concentrate blended with 25% whole-tire crumb at 200°C for various reaction times. Viscosity of unmodified bitumen is 4.4 Pa-sec.

126
300
160 2 3 4
Shear Rate (1/sec)

127
Figure 24. Viscosity as a function of shear rate at 60°C for bitumen concentrate blended with 25% whole-tire crumb at 200, 280, 345, and 380°C for 2 hours. Viscosity of unmodified bitumen is 4.4 Pa-sec.

128
250
"g 100 o
> 50
0 1
200 C
345 C
3- O- O-280 C (29% CRM) - g 2380 C
H 1 1—t—H ^ 1 i I
10 Shear Rate (1/sec)
100

129
from 4.4 Pa-sec to a range of 241 to 167 Pa-sec (shear rate dependent) after 25% crumb rubber
is blended with bitumen concentrate at 200°C for 2 hours (see Figure 24). Figure 25 illustrates the
effect of reaction temperature on sample viscosity. As can be seen, the viscosity generally
decreases with increasing reaction temperature. The one exception to this trend is the sample
prepared at 280°C; however, experimental difficulties were experienced during the preparation
of this particular sample. The largest increase in bitumen viscosity occurs at a reaction temperature
of 200°C and is significantly higher than the samples prepared at 280, 345, and 380*0. This is
presumable due to the presence of swollen rubber particles in the sample prepared at 200°C.
The effect of reaction time on the viscosity of bitumen-rubber samples prepared with 25%
crumb rubber at 200°C is shown in Figures 26 through 28. The different figures represent
viscosity measurements conducted at several shear rates. As the reaction time is increased from
0.5 to 2.0 hours, sample viscosity decreases. For a reaction time of 4.0 hours, however, no
further decrease in sample viscosity is exhibited for measurement temperatures above
approximately 70°C, and an increase in viscosity is experienced at temperatures below 70°C. The
longer reaction times presumably increased crumb rubber degradation resulting in decreased
viscosity. The increased viscosity of the 4 hour sample compared with the 2.0 hour sample at
measurement temperatures below 70°C may be due to some sort of aging effects occuring within
the bitumen matrix during mixing.
The increase in viscosity due to crumb rubber addition is most noticeable at low
measurement temperatures. As the temperature is increased from 45 to 90°C, the viscosity of the
rubber modified bitumen decreases dramatically (see Figure 26). Thus, the rubber modified
bitumen provides the benefit of high viscosity at pavement temperatures experienced during
summer months, without sacrificing processibility at temperatures normally used in pavement

Figure 25. Viscosity at 10 sec"1 shear rate as a function of measurement temperature for bitumen concentrate blended with 25% whole-tire crumb at 200, 280, 345, and 380°C for 2 hours.

131
40 50 60 70 80 90 Measurement Temperature (C)

Figure 26. Viscosity at 1 sec"1 shear rate as a function of measurement temperature for bitumen concentrate blended with 25% whole-tire crumb at 200°C for 0.5, 1.0, 2.0, and 4.0 hours.

133
1000
40 50 60 70 80 Measurement Temperature (C)
90

Figure 27. Viscosity at 2 sec*1 shear rate as a function of measurement temperature for bitumen concentrate blended with 25% whole-tire crumb at 200°C for 0.5, 1.0, 2.0, and 4.0 hours.
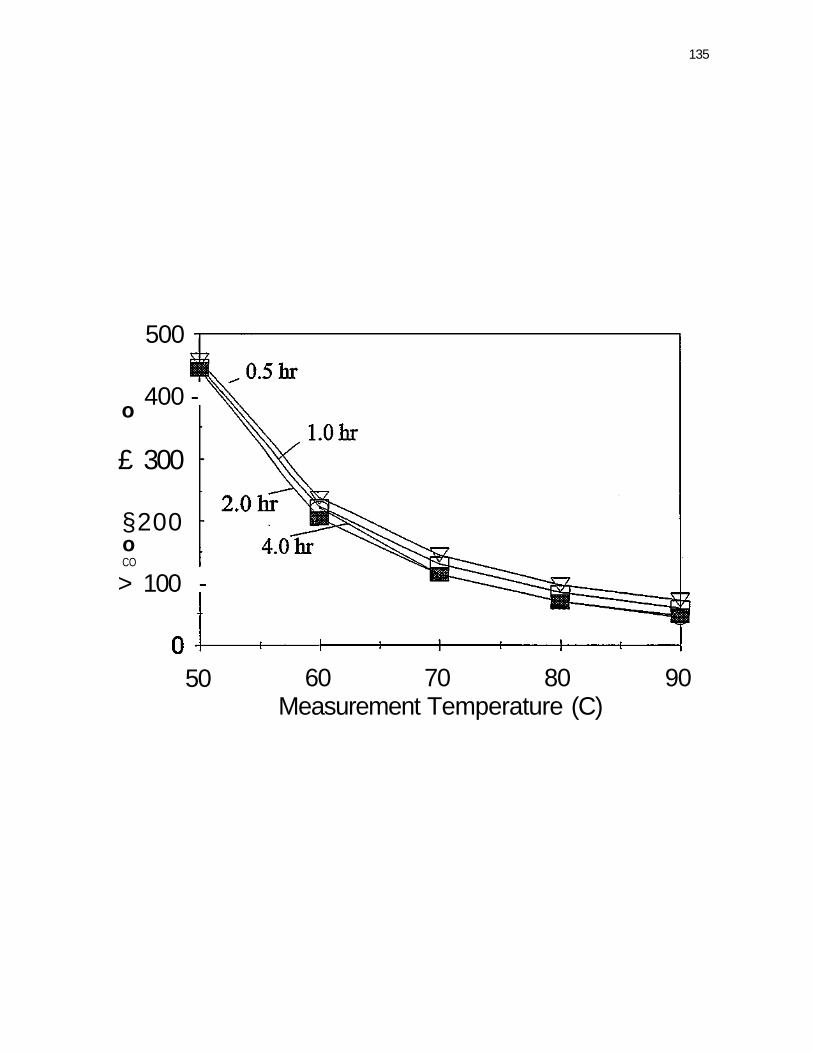
135
o
500
400 -
£ 300
§200 o CO
> 100 -
50 60 70 80 Measurement Temperature (C)
90

Figure 28. Viscosity at 5 sec"1 shear rate as a function of measurement temperature for bitumen concentrate blended with 25% whole-tire crumb at 200°C for 0.5, 1.0, 2.0, and 4.0 hours.

137
200
^ 1 6 0 ^
£120
8 80
O (0
>
60 65 70 75 80 85 Measurement Temperature (C)
90

138
construction. Most importantly, the viscosity (at a shear rate of 1 sec"1) of the bitumen-rubber
samples prepared with 25% crumb rubber at 200°C meets the ASTM specification of 300.+60
Pa-sec at 60°C for a viscosity-graded AC-30 asphalt binder (see Figure 23).
The effect of reaction time on the viscosity of bitumen-rubber samples prepared with 25%
crumb rubber at 345°C is shown in Figure 29. The sample prepared at a reaction time of 4 hours
exhibits a higher viscosity than 2 hour sample for measurement temperatures below 70°C. This
is similar to the results obtained for samples prepared at 200°C and may be due to bitumen aging
effects. Figures 30 and 31 illustrate the effects of crumb rubber concentration on the viscosity of
samples prepared at 340 to 350°C for 2 hours. The viscosity of the bitumen-rubber samples
increases with increasing crumb rubber concentration. The most dramatic increase in viscosity is
experienced at measurement temperatures below 70°C. As the measurement temperature is raised
near 80 to 90°C, the viscosity of the bitumen-rubber approaches that of the unmodified bitumen.
As previously mentioned, this is beneficial for processibility at elevated temperatures.
An interesting effect occured when bitumen concentrate was blended with 25 % crumb
rubber at 380°C for 2 hours. The viscosity of the unmodified bitumen concentrate processed at
these conditions exhibited higher viscosity values than the rubber modified bitumen processed
under the same conditions. This is shown in Figure 32 where sample viscosity is plotted as a
function of measurement temperature for both modified and unmodified bitumen. At a
measurement temperature of 60°C, the rubber modified bitumen has a viscosity (7.5 Pa-sec)
approximately one-half that exhibited by the unmodified bitumen (15.6 Pa-sec). However, as the
measurement temperature is increase, the vscosities of the two samples approach one another. For
example, at 80°C the rubber modified bitumen has a viscosity of 1.7 Pa-sec compared to 2.5
Pa-sec for the unmodified bitumen. It appears that the addition of crumb rubber at 380°C exerts

Figure 29. Viscosity at 2 sec"1 shear rate as a function of measurement temperature for bitumen concentrate blended with 25 % whole-tire crumb at 345°C for 2 and 4 hours. Corresponding blend prepared at 200°C included for comparison.

140
500
§200 o CO
50 60 70 80 Temperature (C)
90

141
Figure 30. Viscosity at 40 sec'1 shear rate as a function of measurement temperature for bitumen concentrate blended with differing concentrations of whole-tire crumb at 340 to 350°C for 2 hours.

60 65 70 75 80 85 90 Measurement Temperature (C)

Figure 31. Viscosity at 40 sec*1 shear rate as a function of whole-tire crumb concentration for bitumen-rubber blends prepared at 340 to 350°C for 2 hours.

144
0 10 15 20 CRM Concentration (%)
25 30

145
Figure 32. Viscosity at 40 sec"1 shear rate as a function of measurement temperature for bitumen concentrate unmodified and modified with 25% whole-tire crumb at 380°C for 2 hours.

146
25
-5-20 0 CO
£15
25% CRM
NoCRM
• 10 o (0
> 5 +
0 50 60 70 80
Temperature (C) 90

147
a destructive effect on the bitumen matrix thereby reducing sample viscosity.
The effects on sample viscosity of bitumen and crumb rubber type for blends prepared at
340 to 350°C are shown in Figure 32. As is expected, the viscosity of the blend prepared with
Circle Cliffs bitumen is significantly higher than the corresponding blend prepared with the oil
extended bitumen concentrate. The viscosity of the Circle Cliffs blend, however, may actually be
too high for adequate processibility and may cause serious problems during pavement
construction. This is evident for Circle Cliffs-crumb rubber blends prepared at 200°C where the
sample was extremely viscous and solid-like. The viscosity of the blends were also dependent
upon the type of crumb rubber used to modify the bitumen. Bitumen modified with tread-rubber
crumb exhibited higher viscosities than corresponding blends containing whole-tire crumb (see
Figure 33). At a measurement temperature of 70°C, the viscosity of bitumen modified with tread-
rubber crumb is 63.9 Pa-sec, compared with 19.7 Pa-sec for bitumen modified with whole-tire
crumb. The difference in viscosity may be due to a potential difference in rubber composition of
the two crumbs, or may be a result of the fibrous material present in the whole-tire crumb.
CONCLUSIONS
Coprocessing of tar sand bitumens with crumb rubber at elevated temperatures has been
shown to increase the viscosity of the blend with the exception of the bitumen-rubber sample
prepared at 380°C. Optimum viscosity behavior is exhibited for an oil extended bitumen blended
with crumb rubber at 200°C for 0.5 hours. The viscosity of the bitumen-rubber blend prepared
under these conditions met ASTM specifications of a viscosity-graded AC-30 asphalt binder. In
addition, the increase in viscosity is most noticeable at low measurement temperatures. As the
measurement temperature is increased from 45 to 90°C, the viscosity of the rubber modified

148
Figure 33. Viscosity at 5 sec"1 shear rate as a function of measurement temperature for Circle Cliffs bitumen and bitumen concentrate blended with whole-tire (CRM) and tread-rubber crumb (Baker TR) at 340 to 350°C for 2 hours.

149
200
40 50 60 70 Temperature (C)
80 90

150
bitumen decreases dramatically. Thus, the rubber modified bitumen provides the benefit of high
viscosity at pavement temperatures experienced during summer months, without concession of
processibility at pavement construction temperatures. A difference in viscosity is observed between
bitumen modified with whole-tire crumb and tread-rubber crumb. Evidently, this is due to the
compositional differences that exist between the two materials.

151
SUPERCRITICAL FLUID EXTRACTION OF OIL SAND BITUMENS
FROM THE UINTA BASIN, UTAH
Principal Investigator: F.V. Hanson Graduate Student: M. Subramanian
INTRODUCTION
Mining-surface recovery processes for the recovery of bitumen from oil sands are
recommended when the overburden-to-pay zone ratio is less than unity (43). The mined
oil sands are transported to processing locations where the bitumen is extracted from oil
sands by various surface processes: hot water process (44); solvent assisted aqueous
method (28); solvent extraction (46-49); pyrolysis (50, 51); supercritical fluid extraction
(52, 53); other thermal methods (54, 55).
The hot water and solvent assisted aqueous processes raise environmental concerns
due to the need for an aqueous tailings pond. A tailings pond is necessary since several
years are required for the settling and separation of fines (56). The solvent extraction
process used for bitumen extraction from oil sands ores leaves behind residual solvent in
the extracted sand and also poses potential environmental problems. Supercritical fluid
extraction (SFE) (57) has been developed as an alternative to the conventional solvent
extraction process. This process has several advantages over conventional processes:
solvent and solute can be separated by depressurization; high selectivity in separation of
solubility class compounds; and; selectivity can be varied by adjusting the pressure and
temperature of the extraction process.
The bitumen feedstocks, extract samples, residual fractions and the solubility

152
fractions obtained from adsorption chromatography (58) of the bitumens were analyzed
using an extended American Standards for Testing Material (ASTM) simulated distillation
technique developed during this study. This technique (59) permitted the determination
of the boiling point distribution up to 911 D. The bitumens, two SFE extract phase
samples and the residual SFE fractions were subjected to adsorption chromatography to
separate each into solubility fractions: asphaltenes, resins, aromatics and saturates to
investigate the influence of the nature of the feedstocks on the SFE process. Elemental
analyses were conducted on the bitumens and on the residual fractions. Continuous
thermodynamics (60, 61) and the Peng-Robinson cubic equation of state (62) were used
to model the extraction process. The Peng-Robinson EOS was selected since only a
limited number of parameters were required for its application to the description of the
bitumens and bitumen-derived heavy oils.
The present study focused on SFE of bitumens from the Asphalt Ridge and
Sunnyside oil sands deposits using commercial propane as solvent. The extractions were
carried out at the same operating conditions as those used for the Whiterocks (39) and PR
Spring bitumens (40), so that meaningful comparisons could be made for the different
bitumen feedstocks.
The specific objectives of this study included the following:
1) determination of the effect of pressure and temperature on extract yields and on the
composition of the extract phases;
2) determination of the effect of pressure and temperature on extract yields and on the
composition of the extract phases;
3) assess the influence of the nature of the bitumen on the extraction yields and
153
selectivity;
4) determination of the extent of asphaltene rejection during SEE; and
5) develop a preliminary mathematical model of the extraction process.
This work was a continuation of the SEE studies with the Whiterocks and PR Spring
bitumens reported previously (63, 64).
EXPERIMENTAL
The supercritical fluid extraction (SFE) system was built by Autoclave Engineers Inc.,
Erie, Pennsylvania. This system was designed for semi-continuous extraction of complex
hydrocarbon mixtures such as crude oil, heavy oils and coal liquids using carbon dioxide as
the supercritical solvent. Detailed descriptions of the original experimental system and its
components have been reported by Hwang (39) and Subramanian (40). The system was
modified in the course of this study by the addition of a data acquisition system from Keithley
Metrabyte to monitor flow rates and extract phase densities on a continuous basis. The
pressure control valve originally located upstream of the extractor was moved to the
downstream side of the densitometer to stabilize the system. The system can be conveniently
divided into four subsystems: a) the supercritical fluid supply system; b) the extractor and
densitometer assembly; c) the data acquisition system; and d) the separator assembly. A
schematic of the supercritical fluid extraction system used in this study is presented in Figure
34.'
The supercritical fluid supply system consisted of a high pressure, positive
displacement pump and a dynamic, high pressure fluid circulation pump. The positive
displacement system was acquired from D.B. Robinson Associates, Edmonton, Canada and

154
Figure 34.
Schematic of the Supercritical Fluid Extraction System

Pressu Relief Valve *£
Temperature and Pressure • Readout
E3 •A-
Stirrer
—A-
Extractor
3H—clcj-i
Positive Displacement
Pump *
Propane Storage
Density Meter
Back Pressure Valve
#><]
HI. IBM PC
4
Separator
Flow Mete E Flow (*^\
Totalizer^
Uquld Sample Propane to Flare

156
consisted of a cylinder, piston, and power pack to pump the fluids at high pressures. The
pump was designed to handle liquids at flow rates ranging from 0 to 1800 cm3/h at a
maximum pressure of 135 MPa and temperature of 1033 K. The volumetric capacity of the
pump cylinder was 500 cm3. The fluid was transferred from the storage tank into the pump
cylinder, pressurized and pumped into the supercritical fluid extractor. This pump was
capable of pumping fluid at a rate of one hundredth of a cm3/min and the volume discharged
by the pump could be measured to within 0.1 cm3 accuracy.
The fluid pumping system consisted of a storage cylinder (C02 or propane), a
nonreturn valve and line filter, a high pressure liquid circulation pump, and a circulating
refrigerant bath to cool the pump head. The head of the circulation pump was maintained at
273 K by means of a circulating cooling bath (Fisher Scientific, Model 900) to prevent vapor
lock.
The extractor assembly consisted of the extraction vessel, a flanged stainless steel
closure, a magnetic-drive, packerless stirring device and a pressure gauge mounted on the
flange-head. The 300 cm3 extractor was rated for a working pressure of 37 Mpa at 616 K.
The effective volume of the extractor with the stirring device assembly in place was 290 cm3.
An electric furnace mounted on the outside of the extractor. A three-mode
temperature controller provided with a type-K thermocouple was used to control the
temperature inside the extractor. The control thermocouple was located in the thermowell
adjacent to the stirrer blades.
The densitometer consisted of two parts: 1) an external measuring cell and 2) a
display unit. The external measuring cell (Anton Paar K.G, model DMA 512) was placed on
the downstream side of the extractor assembly to measure the extract phase densities at high

157
densitometer and the separator, a back pressure regulator valve, a separator vessel, the liquid
sample withdrawal valve and a gas outlet line with a flow totalizer. The separator vessel had
a capacity of 500 cm3 and was constructed of 316 stainless steel. The maximum working
pressure of the vessel was 13.7 MPa at 505 K. The cover of the vessel was fixed to the vessel
with quick disconnect couplings and was sealed with Buna-N O-ring seals. A type-J
thermocouple was used to monitor the temperature inside the separator. The ball valve
mounted at the bottom outlet was used to withdraw the liquid phase samples from the
separator. The extraction system pressure was maintained by a manually operated back
pressure regulator (Haskel Engineering & Supply Co.) installed between the extractor-
densitometer system and the separator. It also served as a pressure reduction valve through
which the supercritical extract phase flowed to the separator where the solute was recovered
when the extract phase flashed. The fluid transfer lines between the extractor, the
densitometer and the separator were traced with heat tape to maintain the transfer line
temperatures the same as that of the extractor.
The solvent separated from the solute in the separator was vented after passing
through a flow meter and a flow totalizer. When propane was used as solvent, the vent line
was connected to a flare in the evacuation hood where the propane was burned. An
electronic flow meter (EG&G Flow Technology, model FTO-4NIYA-GHC-5) was used to
measure the flow rate and cumulative volume of the solvent vented through the system.
Oil Sands Bitumen Preparation
The bitumens used in the SFE studies were recovered from crushed, screened and
well-mixed ore samples by conventional Dean-Stark extraction apparatus using toluene as the

158
solvent. The ores were mined from the Whiterocks, PR Spring, Asphalt Ridge and Sunnyside
oil sands deposits of the Uinta Basin (Utah). The extractions were carried out in a Dean-Stark
apparatus with Whatman single thickness cellulose thimbles. Sharkskin filter paper was
wrapped around the outside of the thimble to retain any fine mineral particles that penetrated
the thimble wall.
Extraction was carried out at total reflux depending on the compaction and bitumen
content of the oil sands ore. The solvent reservoir temperature was maintained between 385
and 389 K. A rotary evaporator was used in conjunction with a vacuum pump to evaporate
the toluene from the concentrated toluene/bitumen solution. A sample was withdrawn from
the bitumen-toluene solution for simulated distillation (SMDIS) analysis to determine the
residual toluene concentration.
A residual toluene concentration of less than 0.1 wt% was achieved for the PR Spring
(64), Asphalt Ridge and Sunnyside bitumens after rotoevaporating for 20 hrs at 5.3 kPa with
the water bath temperature held at 358 K.
Liquid Product Analysis
The Asphalt Ridge and Sunnyside bitumens, all extracts and the residues from the
extraction experiments were analyzed using a simulated distillation technique to obtain the
carbon number distribution up to C90.
The samples were assigned carbon numbers based on the elution patterns of standard
samples containing normal alkanes ranging from C10 to C90. Three standard samples, namely,
Polywax 655 (C20to Cno), ASTM PS-12-60N (C12 to C60) and ASTM PS-18-44N 60N (CK
to C44) from Supelco, Inc. were used for calibration purposes. The uneluted portion was
159
determined using an internal standard ( d 4 to Cn) mixture. A Visual Basic computer program
was developed to estimate the carbon number distributions.
The Conradson carbon residues and the pour points of the feedstocks were
determined according to the procedures outlined in the ASTM D189-65 and ASTM D97-66
methods, respectively. The viscosities of the Whiterocks, Asphalt Ridge, PR Spring and
Sunnyside bitumens were determined using a Brookfield cup-cone digital viscometer (Model
DVT-II+). The viscosities were measured at four different temperatures to establish the
relationships between temperature and viscosity for each bitumen. The densities of the
bitumens were measured using the procedure developed by AOSTRA[191] for semisolids.
The saturate, aromatic, resin and asphaltene (SARA) contents of the feedstocks,
extracts and residues were determined by an analytical method developed by Bukka et al. (58,
66). The most commonly used solvents to make the initial separation of bitumen into
maltenes and asphaltenes are n-pentane and n-heptane. The solvating power of the alkane
increases gradually with increase in the carbon chain length, thus pentane yields quantitatively
more asphaltenes than heptane for a given hydrocarbon sample (65). Moreover, removal of
pentane from the maltenes fraction by rotoevaporation can be accomplished at lower
atmospheric equivalent temperature relative to heptane; hence, it has gained popularity as the
standard solvent for asphaltene separation.
The elemental (C,H,N,S) analyses of the feedstocks and residual fractions and the
molecular weight determinations for the feedstocks were carried out at Galbraith
Laboratories, Inc., Knoxville, Tennessee. Galbraith used a Perkin Elmer 240 elemental
analyzer. Molecular weights were determined by a three point vapor pressure osmometry
method using toluene as the solvent.

160
Gas Analysis
The propane used for extraction studies was a commercial grade gas supplied by
Wasatch Propane, Inc. The analyses of the feed gases are presented in Table 10.

161
Table 10
Analyses of the Gas Used as SFE Solvent
Propane
Supplier
Grade
Cylinder Content
Saturation Pressure (@STP)
Composition (vol%)
Wasatch Propane,
Commercial
14Kgs
758 kPa
Methane: Ethane: Propane Butane:
Inc.
0.2 5.4 93.9 0.5

162
RESULTS AND DISCUSSION
The bitumens from the Asphalt Ridge (AR) and Sunnyside (SS) oil sands deposits
of the Uinta Basin, Utah were used in the SFE experiments using propane as solvent. The
SFE of the bitumens from the Whiterocks (WR) and PR Spring (PRS) oil sands deposits
was conducted by Hwang (63) and Subramanian (64), respectively. The four bitumens
differ significantiy in their physical and chemical characteristics. Thus, it was possible to
compare the effect of pressure, temperature, solvent density and composition on the SFE
extraction yields, the quality of the extract phases and the nature of the residual fractions
for four oil sands bitumens from the Uinta Basin, Utah.
Feedstock Characterization
Four different bitumens from the WR, AR, PRS and SS oil sands deposits of the
Uinta Basin (Utah), were used for the SFE experiments using propane as solvent. The
physical and chemical properties of the bitumens are presented in Table 11.
Physical Properties
The specific gravities of the bitumens were measured using the procedure proposed
by Syncrude Limited for semisolid hydrocarbons. The WR bitumen had a specific gravity
(288 K/288 K) of 0.98, compared to 0.985 for the AR bitumen, 1.005 for the PRS
bitumen and 1.015 for the SS bitumen. The WR and SS bitumen had the lowest and
highest specific gravities, respectively. The AR and PRS bitumen specific gravities fell in-
between with the AR density lower than that of the PRS bitumen. The viscosities of the
bitumens were measured at 343 K to provide a direct comparison. The viscosity of the WR

163
Table 11 Physical and Chemical Properties of Uinta Basin Bitumens
Properties
Specific Gravity (288K/288 K)
API Gravity, °API Conradson Carbon, Residue, wt % Pour Point, K Viscosity, cp @343K
Asphaltenesa), wt % Saturates, wt % Aromatics, wt % Resins, wt %
Molecular Weight, g/gmol
Elemental Analysis C, wt % H, wt % N, wt % S, wt % H/C Atomic Ratio
Simulated Distillation
Whiterocks
Bitumen
0.980
12.9
9.5 327
4,825
2.9 35.7 7.0
54.5
653
87.0 11.2
1.4 0.4 1.56
Volatility(<811 K), wt% 46.6 <477K
477-617 K 617-811 K
> 811 K
0.5 7.4
38.7 53.4
Asphalt Ridge
Bitumen
0.985
12.1
13.9 320
5,050
6.8 39.2
9.0 44.1
426
86.9 11.6
1.7 0.4 1.60
53.5 1.3
11.8 40.4 46.5
PR Spring
Bitumen
1.005
9.3
14.17 319
47,000
19.3 33.4
3.6 43.8
670
87.0 11.3
1.3 0.4 1.56
45.4 0.4 8.2
36.8 54.6
Sunnyside
Bitumen
1.015
7.9
15.0 348
173,000
23.6 20.0 15.1 36.8
593
86.8 10.8
1.1 0.7 1.49
40.9 0.6 7.8
32.5 59.1
a)
b) Pentane Insolubles C,H,N,S analyses normalized to 100%

164
bitumen was lowest at 4825 cP compared to the SS bitumen at 173,000 cP and the
viscosities of the AR (5050 cP) and PRS bitumens (47,000 cP) fell in between. The
viscosities for these bitumens were measured in the temperature range from 318 to 353 K.
In general, the viscosities of the four bitumens decreased with increase in temperature and
the rate of decrease in viscosities were different for the different bitumens. The
relationship between viscosity and inverse temperature is presented in Figure 35. It is
observed from Figure 35 that the decrease in the viscosity of the SS bitumen was greatest
with increase in temperature, the PRS and WR bitumen have similar slopes and the AR
bitumen had the lowest decrease for a given increase in temperature. The activation
energies, Eactfor viscous flow for the four bitumens are presented in Table 12.
The pour points, a measure of the fluidity of the bitumens, of the AR and PRS
bitumens were similar at around 320 K, the WR bitumen was 327 K and the SS bitumen
was highest at 348 K.
Chemical Properties
The bitumen feedstocks were mixed with an excess of normal pentane (40 cc of
pentane/gram of sample) to precipitate the asphaltenes fraction and to dissolve the maltene
fraction. The procedure adopted by Bukka et al. (58, 66) was used to fractionate the
bitumens, and the extract phases and residual fractions obtained from SFE. The maltenes
were subjected to adsorption chromatography using Fuller's earth as the adsorbent and
were sequentially eluted using solvents of increasing polarity to isolate saturates and
aromatics, resins I and resins II. These compound classes were separated based on their
solubility using solvents such as pentane, tetrahydrofuran and methanol. The saturates and

165
Figure 35.
Relationship Between Temperature and Viscosity for the Bitumens

166
Temperature, K
320 325 330 335 340 345 350 355
3.15
1000/T(K)

Table 12 The Eactfor Viscous Flow for Four Bitumens from Uinta Basin (Utah)
Bitumen
Whiterocks Bitumen
Asphalt Ridge Bitumen
PR Spring Bitumen
Sunnyside Bitumen
K
5.2187x10⁻¹³
2.8487x10⁻¹¹
2.6708x10⁻¹²
4.3948x10"02
^act
-12.574
-11.281
-12.843
-5.207
Temperature T in Kelvin

168
aromatics were further adsorbed on neutral alumina and eluted using the same sequence
of solvents mentioned above to isolate saturates, aromatics I and aromatics II. The
aromatics I and II fractions and the resins I and II fractions were combined and were
reported as aromatics and resins, respectively. The fractionation results obtained for the
four different bitumen feedstocks are presented in Figure 36.
It is seen from Figure 36 that the asphaltene content of the WR bitumen was lowest
at 2.9 wt%, and the asphaltene contents of AR (6.8 wt%), PRS (19.3 w%) and SS
bitumens (23.6 wt%) were progressively greater. The saturates content of the SS bitumen
was lowest at 20.0 wt% compared to the high value for the AR bitumen of 39.2 wt%. The
PRS and WR bitumens saturates contents fell in the intermediate range at 33.4 and 35.7
wt%, respectively. The aromatics content of the SS bitumen was highest at 16 wt% and
the aromatics content of the other three bitumens was less than 10 wt%. The resin content
of the WR bitumen was highest at 54.5 wt%, the SS bitumen lowest at 36.8 wt%. The AR
(44.1 wt%) and PRS bitumens (43.8 wt%) had intermediate resins contents with the AR
resin content slightly higher than that of the PRS bitumen.
It is also observed from the chemical compositions of the bitumens that as the
asphaltene content of the bitumens increased, the specific gravity, viscosity at 343 K and
Conradson carbon of the four bitumens increased. Thus, the asphaltene
content appears to have affected these properties of the bitumens under investigation.
The molecular weights of these bitumens were determined by Galbraith
Laboratories, Inc., Knoxville, TN. The molecular weight of the AR bitumen was lowest
at 426 g/gmol, the WR and PRS bitumens had similar molecular weights around 660
g/gmol and the SS bitumen had an intermediate molecular weight of 593 g/gmol.

169
Figure 36.
Comparison of the Solubility Fractions of the Bitumens

60
40
O) 30 '55
• Whiterocks Bitumen II Asphalt Ridge Bitumen • PR Spring Bitumen HSunnyside Bitumen
Asphaltenes Saturates Aromatics Resins
171 .
The elemental analyses for carbon, hydrogen, nitrogen and sulfur were also
determined by Galbraith Laboratories, Inc. The carbon, hydrogen, nitrogen and sulfur
contents of the bitumen were normalized and are reported in Table 11. The AR bitumen
was more saturated than the other bitumens with a hydrogen/carbon (H/C) atomic ratio of
1.6. The WR and PRS bitumens had H/C ratios of 1.56. The SS bitumen was the least
saturated with a H/C atomic ratio of 1.48. The H/C atomic ratio of these bitumens
correlated with their saturates contents: the higher the saturates content, the higher the H/C
ratio of the bitumen. The AR bitumen had the highest saturates content and the highest
H/C atomic ratio. The nitrogen contents of the four bitumens were higher than their sulfur
contents which is typical for fresh water origin hydrocarbon resources.
The quality ranking for the four bitumens as indicated by their physical and
chemical properties is as follows:
Whiterocks < Asphalt Ridge < PR Spring < Sunnyside
Simulated Distillation
The boiling point or carbon number distributions of the bitumens were determined
up to 973 K. The simulated distillation chromatograms and the boiling point distribution
for the Whiterocks bitumen is presented in Figures 37 and 38, respectively. The simulated
distillation analyses for the four bitumens are presented in Table 13.
Supercritial Fluid Extraction of Asphalt Ridge and Sunnyside Oil Sands Bitumens
SFE experiments were conducted using the AR and SS bitumens as a part of this study
using commercial propane as the solvent. SFE of the WR and PRS bitumens were

172
Figure 37.
Chromatograms for Whiterocks Bitumen

300000
250000
^ 200000
'55 c CD
JE 150000 "c3 c
mmtm
10 100000-
50000 -
0
313 Ky
653 K ^8.75 min
12 K/mln
4.5 min Column : Petrocol EX2887 from Supeico, Inc.
Carrier Gas : He at 20 cc/min
10 15 20 25 30 35 40 45 Time, minutes

174
Figure 38.
Boiling Point Distribution for Whiterocks Bitumen

175
Cumulative Weight Fraction
co r- co m -xt o o o o o
UOJ;OBJJ WBISM ieijusja&irj
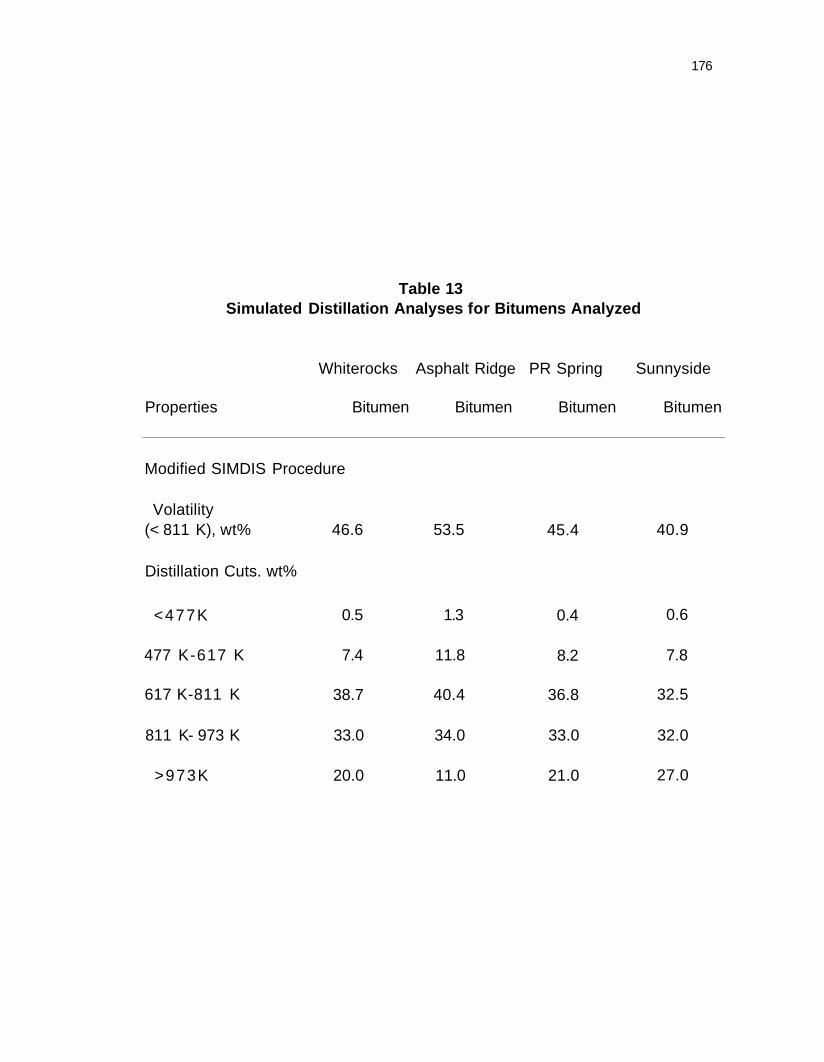
176
Table 13 Simulated Distillation Analyses for Bitumens Analyzed
Whiterocks Asphalt Ridge PR Spring Sunnyside
Properties Bitumen Bitumen Bitumen Bitumen
Modified SIMDIS Procedure
Volatility (< 811 K), wt%
Distillation Cuts. wt%
<477K
477 K-617 K
617 K-811 K
811 K- 973 K
>973K
46.6
0.5
7.4
38.7
33.0
20.0
53.5
1.3
11.8
40.4
34.0
11.0
45.4
0.4
8.2
36.8
33.0
21.0
40.9
0.6
7.8
32.5
32.0
27.0

177
conducted by Hwang (63) and Subramanian (64), respectively. The SFE experiments for
all four bitumens were carried out at five different operating conditions, a combination of
three pressures (5.6, 10.4, and 17.3 MPa) and three temperatures (339, 380 and 422 K)
with four conditions above the critical pressure and temperature of the solvent and one
condition above the critical pressure but below the critical temperature of the propane. The
typical operating conditions used for the SFE experiments are presented in Figure 39. The
experiments were carried out at five similar conditions so that the influence of the nature
of the bitumen on SFE yields and on the quality of the extract phases could be observed.
Experiments were conducted to measure the density of the commercial propane
using the densitometer at the operating conditions used in this study. The measured
densities of the propane are listed in Table 14. The propane density increased with
increasing in pressure at constant temperature and decreased with increasing in temperature
at constant pressure. Starling (67) developed an equation of state which was used to
estimate the density of propane and other hydrocarbon gases. The propane densities for
pressures and temperatures ranging from 1.97 MPa to 10.9 MPa and 355 to 477K;
respectively, are presented in Figure 40. These curves were obtained by solving the
equation of state developed by Starling (67). The propane densities predicted were less
than the measured densities which is typical for cubic equations of state. The cubic
equation of state predicts liquid densities lower than the experimentally measured one (68)
and the deviation from the measured values differs for different equations of state (68, 69),
hence the propane density was measured,
The SFE experiments were conducted with 50 g of bitumen (AR and SS) initially
in the extractor. A known quantity of propane was charged to the extractor until the

178
Figure 39.
Chromatograms for the Whiterocks Bitumen Extract

179
440
420
* 400
3 380 to
§.360 £ 1^340
320-1
300
+ - -
Pc 1 I I I I
Propane Pc=4.25MPa Tc=369.7K
I i i j i i i I i i i I » i i j i i t I i . »
4 6 8 10 12 14 16 18 Pressure, MPa

180
Figure 40.
Propane Density at Various Temperatures and Pressures (80)

0.45
0.4-1
0.35
0.3 H o
O) 0.25 -|
c 0.2 H Q
0.15 -!
0.1
0.05
0 —i 1 1 1 1 1 r
0 2 - i — i — . — . — i — [ -
4 6 -T 1 1 1 1 r
8 — i — i — i — i — i —
10 12 Pressure, MPa
00

182
Table 14
Measured Densities of Commercial Propane
Density (g/cc)
Temperature, K 339 380 422
Reduced Temperature 0.92 1.03 1.14
Pressure Reduced (MPa)Pressure
5.6 1.3 - 0.533
10.4 2.4 0.566 0.553 0.545
17.3 4.1 - 0.569

183
system was brought to the desired operating conditions. The initial solvent charging was
performed using a positive displacement pump. Liquid samples were collected from the
separator for every 25 liters of propane vented through the system. Six such samples
were collected before the extraction was terminated. The extraction was terminated after
window #6 because the extraction yield tapered down considerably and terminating
extraction after a fixed number of windows (six) permitted meaningful comparisons of the
compositions of the residual fractions. The extract phase samples were labeled as extract
window #1 through #6. The hydrocarbon remaining in the extractor was collected as the
residual fraction for further analysis.
Supercritical Fluid Extraction of Asphalt Ridge Bitumen
Hwang (63) and Subramanian (64) conducted SFE experiments and studied the SFE
behavior of the bitumens from the WR and PRS deposits. This section will examine SFE
extraction of the bitumen from the AR deposit whose physical and chemical properties are
intermediate to those of the WR and PRS bitumens. The effect of process variables such
as pressure, temperature and solvent density on the extraction yields of the AR bitumen
has been determined.
Pressure Effect
The SFE experiments conducted to determine the influence of pressure on the SFE
of AR bitumen were carried out at a constant temperature of 380 K (Tr= 1.03) and three
different pressures of 5.6 MPa (Pr=1.2), 10.4 MPa (Pr=2.3) and 17.3 MPa (Pr=4.1).
The maximum cumulative extraction yield, 31.4 wt%, was achieved at 17.3 MPa (Pr=4.1)
and 380 K (Tr=1.03). The extraction yield decreased with decreasing in pressure at

184
constant temperature 380 K (Tr=1.03) with yields of 24.5 wt% and 13.4 wt% achieved
at 10.4 MPa (Pr=4.1) and 5.6 MPa (Pr=4.1), respectively. The amount extracted was
quite sensitive to the solvent density: for every 1 % change in the solvent density, there
was 3% change in the cumulative extraction yield (6 windows). The effect of pressure on
the extraction yield of AR bitumen is presented in Figure 41. The decrease in the overall
extraction yield with decrease in pressure at constant temperature was attributed to the
decrease in the solvent density with decrease in pressure (Table 14).
The extracted phase density was measured for all the SFE experiments for the AR
bitumen-propane system using the data acquisition system incorporated into the SFE
system. The measured extracted densities for the AR bitumen-propane system at all five
operating conditions are plotted versus extraction time in Figure 42.
The extraction yield increased for the first three windows and decreased in the
subsequent extraction windows (Figure 42). This trend is attributable to the extraction of
lighter hydrocarbons initially and the change in the overall composition of the system with
time. Propane has an affinity for the extraction of lighter hydrocarbons relative to heavier
hydrocarbons (57). The lighter hydrocarbons were extracted initially and as the extraction
proceeded, the system was depleted in lighter hydrocarbons (the SFE system is batch and
continuous with respect to bitumen and solvent, respectively) and the remaining bitumen
components in the extractor became heavier. As the hydrocarbons were extracted, the
overall composition of the system changed continuously and became leaner in bitumen and
richer in solvent. The lower affinity of propane for heavier hydrocarbons resulted in a
reduction in the transfer of bitumen components from the oleic phase to the extract phase
during the later part of the extraction. Furthermore, the lighter hydrocarbons acted as

185
Figure 41.
Effect of Pressure on SFE Yields with the Asphalt Ridge Bitumen

Cumulative Amount Extracted, wt% on _1_
o _ 1 _
X
_». -N|
CO
TJ 0) TJ II CO 00
D k
o
TJ fl) TJ 1] N3 CO
• cn O)
TJ 0) **"̂* TJ £ to
% — • "
o o 3
sr 3 «-* H
3 •o
(T> - i 0) i t -
c - 1 (D CO oo o
U o CO
CO
cn
oo 01

t
187
Figure 42.
Measured Extract Phase Density During SFE of the Asphalt Ride Bitumen
with Propane as Solvent

o o O)
>i + ^ CO
c (D
Q CU U) CO sz a. •a a> •*-* o ro x
UJ
0.80
0.75
0.70
0.65
0.60
10.4 MPs ' 330 K 10.4 MPa* 380 K
— M 1^4 MPa •422V
5.6 MPa " 380 K sj
g 5 5 I 1 1 1 1 1 1 1 1 1 I 1 1 1 1 I 1 1 1 1 I 1 1 1 1 1 1 1 1 1 I 1 1 1 1 1 1 1 1 1 I 1 1 1 1 I 1 1 i 1 I 1 1 1 1 1 1 i 1 1 1 1 1 1 1 1 i 1 1 1 I 1 1 1 1
0 10 20 30 40 50 60 70 80 90 100 110 120 130 140 150
Time, Minutes 00 00

189
cosolubilizing agents for the heavier species; thus their depletion during the initial
extraction periods produced a more refractory residual oleic phase which was less soluble
in supercritical propane. Consequently the extraction yields decreased.
It is observed from the extract phase density plots (Figure 42) that the SFE
experiments started with extract phase densities of 0.71, 0.66 and 0.62 g/cm3 at pressures
of 17.3 (Pr=4.1), 10.4 (Pr=2.3), and 5.6 MPa (Pr=1.2); respectively, at a constant
temperature of 380 K (Tr=1.03). The pure solvent densities measured at these conditions
were 0.569, 0.553 and 0.533 g/cm3, respectively.
Temperature Effect
The extraction experiments were conducted to examine the influence of temperature
on SFE of the AR bitumen at a constant pressure of 10.4 MPa (Pr=2.3) and at three
different temperatures: 339 K (Tr=0.92), 380 K (Tr=1.03) and 422 K (Tr=1.14). The
maximum cumulative extraction yield, 31.3 wt%, was obtained at 10.4 MPa (Pr=2.3)
and 339 K (Tr=0.92). The cumulative extraction yield decreased with increase in
temperature at constant pressure, that is, yields of 24.5 and 18.2 wt%, were achieved at
380 K (Tr=1.03) and 422 K (Tr=1.14), respectively (Figure 43). The decrease in
extraction yield with increase in temperature at constant pressure was attributed to the
decrease in solvent density with increase in temperature (Table 14) It is also observed from
the extract density plots (Figure 42) that the extract phase density was highest at the lowest
temperature 339 K, (Tr=0.92) and decreased with increase in temperature at constant
pressure.
The extraction yield increased for the first four windows and decreased in the
subsequent extraction windows (Figure 43). As explained in the previous section, this

790
Figure 43.
Effect of Temperature on SFE Yields with the Asphalt Ridge Bitumen

Cumulative Amount Extracted, wt% to _L_
CO O
X
4*.
K 7\ H U _x _x 4^
O CO 00
o 7\ H 11 _v o CO
• CO CO CO
* H 71 o CO Ni
o o C/>
= J
3 c/> c 3 o 4̂
n
CO O l
( '

192
effect was related to the extraction of lighter hydrocarbons initially and the change in the
overall composition of the system with time.
The initial extract phase densities were 0.680, 0.66 and 0.625 g/cm3 at 339
(Tr=0.92), 380 (Tr=1.03), and 422 K (Tr=1.14), respectively at a constant pressure of
10.4 MPa (Pr=2.3) (Figure 42) whereas the pure solvent densities were 0.566, 0.553 and
0.545 g/cm3; respectively. Thus, both the pure solvent density and the extract phase
densities decreased with increase in temperature resulting in a decrease in the extraction
yields.
Solvent Density Effect
The solvent densities measured at the five operating conditions are plotted (Figure
44) against the cumulative extraction yields obtained for SFE with the AR bitumen. It is
observed from the plot that the cumulative extraction yields with AR bitumen increased
as the pure solvent density increased. However, the maximum extraction yield obtainable
using propane as the supercritical fluid would be equal to or less than the deasphalted oil
obtained using liquid propane (70).
The pure solvent densities measured at the five operating conditions were 0.533,
0.566, 0.553, 0.545 and 0.569 g/cm3; respectively, at 5.6 MPa and 380 K, 10.4 MPa and
339 K, 10.4 MPa and 380 K, 10.4 MPa and 422 K and 17.3 MPa and 380 K. While
performing SFE experiments, the extract phase density was measured on a continuous
basis using the data acquisition system. The initial extract phase densities were 0.62, 0.68,
0.66, 0.625 and 0.71 g/cm3; respectively, at 5.6 MPa and 380 K, 10.4 MPa and 339 K,
10.4 MPa and 380 K, 10.4 MPa and 422 K and 17.3 MPa and 380 K. These values

Figure 44.
Effect of Solvent Density on SFE Yields with the Asphalt Ridge Bitumen

Cumulative Extraction Yield, wt%
en 0.53 i i i i i i i
en _j .
O CO
o to
-I I l_—I I I I L_J I l_ -I '
0.535
0.54" "D
3 "S 0.545 3 (D D g 0.55 to
(Q 0.555
o
0.56-
0.565 -
0.57

195
indicate that the higher the pure solvent density, the higher the initial extract phase density
at the same temperature and pressure. The propane densities were varied by adjusting the
pressure and temperature and the extraction capacity of the solvent increased with
increased density. The propane densities at 10.4 MPa and 339 K and 17.3 MPa and 380
K were similar: 0.566 and 0.569 g/cm3; respectively. The cumulative extraction yields for
the AR bitumen were likewise nearly the same: 31.3 and 31.4 wt%; respectively. These
results indicate that the by maintaining the same extraction density through combinations
of pressure and temperature, similar extraction yields could be obtained.
Another explanation could be provided for the increase in extraction yields with
increase in solvent density. Johnston (71) indicated that the enhancement factor for
hexamethylbenzene, 2-naphthnol, phthalic anhydride, anthracene and acridine increased
exponentially with increase in density of carbon dioxide. The enhancement factor, a
measure of the solubility of a solute in the vapor phase is directly governed by vapor
pressures. This observation could be applied to SFE of bitumen using propane as solvent
and the dependence of extraction yield on solvent density.
The propane solvent density can be increased either by increasing the pressure at
constant temperature or by decreasing the temperature at constant pressure. The maximum
propane solvent density obtainable under supercritical conditions is always less than the
propane liquid density and hence the extraction capability will be less than that of liquid
propane. Thus, it may be advantageous to operate the extraction in the liquid phase region
of the solvent where the temperature and pressure will be less compared to the supercritical
conditions and to separate the solvent from the extract phase at supercritical conditions.

196
The main advantages for operating under supercritical conditions are given below:
I. Extraction provides high selectivity
II. Selectivity towards extraction of a single compound or group of compounds could
be varied by decreasing or increasing the solvent density by adjustment of the operating
pressure and temperature
HI. The supercritical solvent-solute separation is achieved by increasing the extract phase
temperature when the extracted oil is no longer soluble in the solvent or by simple
depressurization. In the case of a liquid solvent, the thermal energy must be added to
the solvent to vaporize it from the solvent-extract phase mixture. Hence supercritical
solvent processes are energy efficient. In case of commercial SFE process (72) to
upgrade heavy oil, the energy savings are of the order of 30 to 50 % relative to
conventional propane deasphalters which utilizes liquid propane.
Carbon Number Distribution for AR Bitumen Extract Phases
The extract samples obtained from SFE of the AR bitumen were subjected to
simulated distillation analyses to determine the boiling point or carbon number
distributions. The results obtained at a pressure of 17.3 MPa (Pr=4.1) and a temperature
of 380 K (Tr=1.03) are presented in Figure 45. It is observed from the boiling point
distributions of the extract phases that as the extraction proceeded heavier and heavier
components were extracted. This was due to the semi-continuous (batch for solute and
continuous for solvent) SFE system used for the extraction experiments where the lighter
hydrocarbons were extracted initially. As the extraction proceeded, the extractor was
depleted of lighter hydrocarbons and hence the heavier hydrocarbons were extracted in the

197
Figure 45.
Carbon Number Distributions for the Asphalt Ridge Bitumen, Extracts and
Residual Fractions Obtained from SFE at 17.3 MPa
(P r=4.1)and3 8 0 K<T=1.03>

Cumulative Weight Fraction
o •
o In
-I I I I i_
© o a
r ,1 I I
o
• •_ +
p bo
_ L _ l
©
li il I lul l I I
a CO »-* c 3 (D 3
70 (0 </) a c o
an i - f
3"
3 a. o
,jv++\.
3.
3 a o
3 W
3 a o
03

199
subsequent windows. This was also indicated by the simulated distillation curves shifting
towards higher carbon numbers as the extraction window number increased (Figure 45).
Furthermore, the extract phases were significantly upgraded liquids as indicated by the
volatilities, approximately 70 wt%, compared to the original bitumen which was 53.5 wt%
volatile. The residual fraction was only 20 wt% volatile. The volatiles are defined as the
fraction boiling below 811 K.
The effects of temperature and pressure on compositional variation of the extract
phases are presented in Figure 46. As the system pressure increased at constant
temperature heavier extract fractions were obtained in the 2nd extraction window. At
constant pressure, as the system temperature is increased, lighter extract liquids were
obtained.
It is observed from the experimental results that at a constant temperature of 380
K (Tr=1.03), the extraction yield increased from 13.4 wt% (@5.6 MPa) to 31.4 wt%
(@17.3 MPa) as the extraction pressure increased. At the same time the volatility
(fractions boiling below 811 K) of the 2nd extraction window extract decreased from 85.2
wt% (@5.6 MPa) to 65.1 wt% (@17.3 MPa). The SFE system was operated on
semicontinuous basis (bitumen and propane are batch and continuous respectively) and
hence an increase in extraction yield with pressure means decrease in overall volatility
(quality) of the extract phase as the solvent extracts heavier hydrocarbons. As the system
temperature increased at constant pressure (10.4 MPa), the cumulative extraction yield
decreased from 31.3 wt% (339 K) to 18.2 wt% (422 K). The volatility (quality) of the 2nd
window extract phase increased from 73.1 wt% (339 K) to 83.9 wt% (422 K). Thus, it
could be stated that at constant temperature, as the extraction pressure increased extraction

200
Figure 46.
Effect of Pressure and Temperature on the Carbon Number Distributions of the Second Extraction Window Obtained During SFE of the Asphalt Ridge
Bitumen

201
Effect of Pressure
0.9^
1 0.8^ u 2 0.7^
« * -
1,0.6 o
| o * 3 §0.4-3
!o .3^ i 0.2^ O
0,1-3
2nd Extraction Window -+++' 380 K(Tr=1.03) ^ ~rL
++++++Z
* . '
ui o
5.6 MPa(Pr=1.2)
10.4MPa(Pr=2.3)
17.3 MPa(Pr=3.8)
10 20 30 40 50 60 Carbon Number
70 80 90
I o
]5
> a 3 E 3
o
A _ 1 .
0.9 4
0.8 H 0.7^ 0.6 4
0.5 ̂
0.4 \ 0.3-̂ 0.2 4 0 1 -
0 J
Effect o1 ̂Temperature
o" * * • *
g * 2nd Extraction Window •* ^ 10.4MPa(Pr=2.3)
•9 •9 ••
w*P
* 339 K(Tr=0.92)
• 380 K(Tr=1.03)
O 422 K(Tr=1.14) . . . I . . . . I . . . . . . . . . I . .
10 20 30 40 50 60 70 80 90 Carbon Number

202
yields increased and produced heavier and less volatile hydrocarbon liquids. In contrast,
at constant pressure as the extraction temperature increased extraction yields decreased but
produced refined and lighter hydrocarbon liquids.
Reproducibility
Reproducibility experiments were conducted using the AR bitumen at 10.4 MPa
(Pr=2.3) and 339 K (Tr=0.92). The results obtained from two experiments are compared
in Figure 47. It is observed from the experimental results that the difference between the
extraction yields (for individual extraction windows) obtained for each of the six windows
were within 5 % absolute margin. Hence, it was concluded that the experimental results
are reproducible.
Supercritical Fluid Extraction of Sunnyside Bitumen
The physical and chemical properties such as specific gravity, Conradson carbon,
pour point, viscosity at 343 K, pentane insolubles and 811 K plus (non volatile) fractions
of the bitumen from the SS oil sands deposit are higher than those for the WR, AR and
PRS bitumens. Hence, the SS bitumen was selected as representative of a lower quality
bitumen for SFE studies.
Pressure Effect
The experiments intended to determine the influence of pressure on the SFE of
bitumen from the SS oil sands deposit were conducted at a constant temperature of 380
K (Tr=1.03) and three different pressures, 5.6 MPa (Pr= 1.2), 10.4 MPa (Pr=2.3) and

203
Figure 47.
Reproducibility for SFE with the Asphalt Ridge Bitumen at 10.4 MPa (P =2.3) and 339 K (T =0.92)
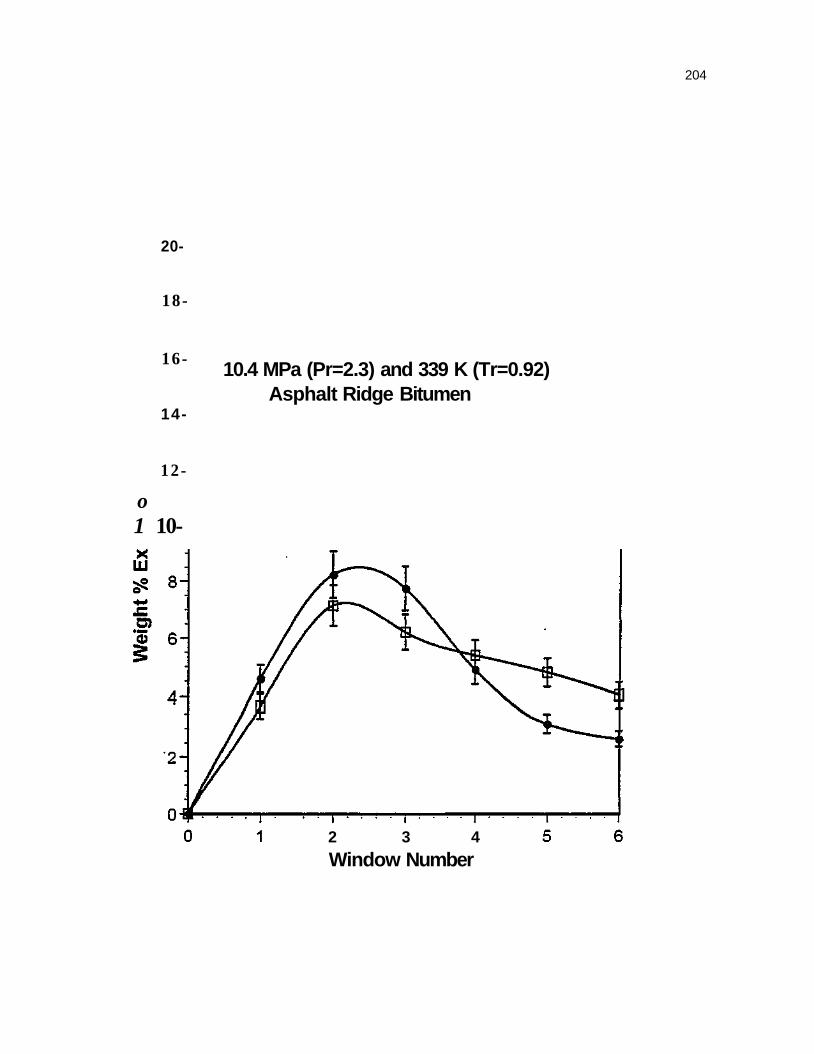
20-
18-
204
16-
14-
10.4 MPa (Pr=2.3) and 339 K (Tr=0.92) Asphalt Ridge Bitumen
12-
o 1 10-
2 3 4
Window Number

205
17.3 MPa (Pr=4.1). The maximum extraction yield, 23.7 wt%, was achieved at 17.3 MPa
(Pr=4.1) and 380 K (Tr=1.03). The extraction yields decreased with decrease in pressure
at constant temperature. Extraction yields of 14.8 and 12.0 wt% were obtained at 10.4
MPa (Pr=2.3) and 5.6 MPa (Pr=1.2), respectively (Figure 48). The decrease in the
extraction yield with decrease in pressure was attributed to decrease in solvent density with
decrease in pressure at constant temperature.
The extracted phase density was measured for all the SFE experiments for SS
bitumen-propane system. The measured extract phase densities for the SS bitumen-
propane system at all five operating conditions are plotted vs time in Figure 49.
The extraction yield increased for the first three extraction windows and decreased
in the subsequent extraction windows (Figure 48). As discussed previously, this trend was
presumed to be related to the extraction of lighter hydrocarbons initially and to the change
in the overall composition of the system with time. Propane has an affinity for the
extraction of lighter hydrocarbons compared to heavier hydrocarbons (57). The initial
depletion of the lighter hydrocarbons led to a residual bitumen phase in the extractor which
consisted of heavier components. As the extraction process proceeded, the overall
composition in the extractor changed continuously to leaner in the bitumen component and
richer in the solvent. The propane's lesser affinity for heavier hydrocarbons and the
enrichment of solvent in the extractor resulted in decreased extraction of bitumen
components during the later part of the extraction. The maximum differential extraction
yield was also inferred by the maximum extract phase density (Figure 49). The extract
phase density plots (Figure 49) indicated that the initial extract phase densities were 0.604,
0.58 and 0.571 g/cm3 at pressures of 17.3 (Pr=4.1), 10.4 (Pr=2.3), and 5.6 MPa

206
Figure 48.
Effect of Pressure on SFE with the Sunnyside Bitumen

Cumulative Amount Extracted, wt% to o _i_
to en
X
_x -NJ
CO
S •D 01
-o 71 w bo
o - X
o • ^
<: "D CD "0
71 to w w
• O l en S T3 0) "D
ll ho
o o CO « • • • •
0)
n CD
3 CD
0)
c CD CO 00 O
7s H —i
II
M O ^1

208
Figure 49.
Measured Extract Phase Densities During SFE of the Sunnyside Bitumen
with Propane as Solvent

10.4 MPa * 380 K
O
O)
0) c CD
Q CD CO CO
x: Q. TJ CD
ts
UJ
17.3 MPa * 380 K
10.4 MPa * 339 K
I ' i i I i i i i I i i i i I i i i i I i i i i I i i i i I i i i i I i i i i I i i i i I i i i i I i i i i I i i i i I . i i i I i i i i I i i i i
10 20 30 40 50 60 70 80 90 100 110 120 130 140 150
Time, Minutes M O (JO

210
(Pr=1.2); respectively, at a constant temperature of 380 K (Tr=1.03). The comparable
pure solvent densities were 0.569, 0.553 and 0.533 g/cm3, respectively. Thus, once
again, it was concluded that higher extraction yields were driven by higher propane
densities and in fact can be correlated by the solvent densities.
Temperature Effect
The influence of temperature on SFE extraction yields with the SS oil sands
bitumen was determined at a constant pressure 10.4 MPa (Pr=2.3) and three different
temperature of 339 K (Tr=0.92), 380 K (Tr=1.03) and 422 K (Tr=1.14). The effect of
temperature on the cumulative extraction yield is presented in Figure 50. The maximum
extraction yield, 22.4 wt%, was obtained at 339 K (Tr=1.03). The extraction* yields
decreased with increase in temperature at constant pressure, 14.8 and 11.2 wt% at 380 K
and 422 K; respectively. The decrease in the extraction yield was attributed to the
decrease in the solvent density with increase in the temperature at constant pressure.
The extraction yield increased for the first four windows and decreased in the
subsequent extraction windows (Figure 50). As explained in the previous section, this
effect was attributed to the initial extraction of lighter hydrocarbons and the transition in
the overall system composition to heavier components and an enrichment in solvent with
time.
It is observed from the plots that the extractions were started with an extract phase
densities of 0.602, 0.58 and 0.572 g/cm3 at temperatures 339 (Tr=0.92), 380 (Tr=1.03),
and 422 K (Tr=1.14); respectively, at a constant pressure of 10.4 MPa (Pr=2.3) (Figure
49 ). The pure propane solvent densities at these conditions were 0.566, 0.553 and 0.545

211
Figure 50. Effect of Temperature on the SFE Yields with the Sunnyside Bitumen

212
0-9
Constant Pressure10.4 MPa(Pr=2.3)
• 339 K(Tr=0.92)
o 380K(Tr=1.03)
x 422K(Tr=1.14)
i
25 0 25 50 75 100 125 150 Cumulative Volume of Propane Vented, (Liters, @STP)

213
g/cm3, respectively. Thus, it is apparent that as the pure solvent density decreased with
increase in temperature, the experimentally measured extract phase density also decreased
which led to the decline in the carrying capacity of the solvent.
Solvent Density Effect
The solvent densities are plotted versus the cumulative extraction yields for the SS
bitumen in Figure 51. The extraction yield increased with increase in solvent density
during SFE of the SS bitumen using propane as solvent. It is observed from the plot that
the cumulative extraction yields with the SS bitumen increased as the pure solvent density
increased.
The pure solvent densities were measured at the five operating conditions. The
extract phase densities were measured on a continuous basis during each extraction. The
measured extract phase densities indicate that the starting densities were 0.571, 0.602,
0.58, 0.572 and 0.604 g/cm3 at 5.6 MPa and 380 K, 10.4 MPa and 339 K, 10.4 MPa and
380 K, 10.4 MPa and 422 K and 17.3 MPa and 380 K; respectively. It was observed that
the relationship between the pure solvent densities and the starting extract phase densities
and operating variables was consistent; thus it was possible correlate the extraction yields
by the pure solvent density. The propane density (Figure 40) could be varied by adjusting
the extraction pressure and temperature. Thus, the propane densities at 10.4 MPa and 339
K and 17.3 MPa and 380 K were similar: 0.566 and 0.569 g/cm3, respectively.
Furthermore, the cumulative extraction yields of SS bitumen, 22.4 and 23.7 wt%,
corresponding to these densities indicated the significance of solvent density as a

214
Figure 51.
Effect of Solvent Density on Extraction Yields with the Sunnyside Bitumen

Cumulative Extraction Yield, wt%
216
correlating parameter. If a combination of pressure and temperature is selected that
maintains a fixed solvent density, similar extraction yields should result.
An alternate explanation, an increase in E with increase in solvent density, which
was described relative to the extraction of the AR bitumen is also valid for the SS bitumen.
Carbon Number Distribution for SS Bitumen Extract Phases
The extract fractions obtained during SFE of the SS bitumen were analyzed using
a modified simulated distillation technique to obtain boiling point and carbon number
distributions up to 973 K (C90). Carbon number distributions for the extract samples
obtained from SFE of the SS bitumen at 17.3 MPa (Pr=4.1) and 380 K (Tr=1.03) are
presented in Figure 52. As the extraction proceeded heavier and heavier components were
extracted as indicated in Figure 52. The extract phases were significantly upgraded
(volatilities " 80 wt%) compared to the original feedstock (volatility 40.9 wt%). The
residual fraction was approximately 20 wt% volatile (fraction boiling below 811 K).
The effects of temperature and pressure on compositional variation of the extract
phases are compared in Figure 53. As the system pressure increased at constant
temperature heavier extract fractions were obtained. As the system temperature increased
at constant pressure lighter extract liquids were obtained. It is observed from the
experimental results that at constant temperature, as the extraction pressure increased, the
extraction yield increased from 12.0 wt% (@5.6 MPa) to 23.7 wt% (@17.3 MPa). At the
same time the volatility (fractions boiling below 811 K) of the 2nd extraction window
extract decreased from 89.6 wt% (@5.6 MPa) to 63.1 wt% (@17.3 MPa). The SFE
system was operated on a semicontinuous basis and hence the increase in extraction yield
217
Figure 52.
Carbon Number Distributions for the Sunnyside Bitumen and the Extract and Residual Fractions Obtained from SFE at 17.3 MPa (Pr=4.1)
and 380 K (T=1.03)

218
I : • • • I • ' • • I
10 20 30 40 60 70 80 90 Carbon Number

219
Figure 53.
Effect of Pressure and Temperature on the Carbon Number Distribution of the Second Extraction Windows Obtained from SFE with the Sunnyside
Bitumen

220
1
0.9^
J 0.H •4-t
o 2 0.7 « * -
1 0 . 6 ^ | 0.5-3
§0 .4
1 0.3^
I 0.2 O
0.1
o CO
>
CO
E o
1
0.9
0.8
0.7
0.6
0.5
0.4
0.3
0.2
0.1
0
Effect of Pressure
2nd Extraction Window ,+++ 380 K{Tr=1.03) . + +
.++++• +++++++++ » M l»+
.o~ •
O •
* M #
+ o o •
+ o •
+ 5.6 MPa(Pr=1.2)
O 10.4MPa(Pr=2.3)
• 17.3 MPa(Pr=3.8)
10 20 30 40 50 60 Carbon Number
70 80 90
Effect of Temperature
2nd Extraction Window 3 10.4 MPa (Pr=2.3) c
• • 5 * * • «• • * .• *
o • *
o • *
• * • *
o • *
^ •
o. m ou** 0£
* 339 K(Tr=0.92)
• 380 K{Tr=1.03)
O 422 K(Tr=1.14) • • • • • l • • I—r"!~T—: "• I :—"—i rrr~-—i •—r
0 10 20 30 40 50 60 70 80 90 Carbon Number

221
with pressure led to a decrease in overall volatility (quality) of the extract phase. As the
system temperature increased at constant pressure (10.4 MPa), the cumulative extraction
yield decreased from 22.4 wt% (339 K) to 11.2 wt% (422 K). The volatility (quality) of
the 2nd window extract phase increased from 62.4 wt% (339 K) to 83.4 wt% (422 K).
Thus at constant temperature, as the extraction pressure increased the extraction yields
increased and produced heavier or poorer quality hydrocarbon liquids. In contrast, at
constant pressure as the extraction temperature increased extraction yields decreased but
produced refined hydrocarbon liquids. These are similar to the observations made for the
AR bitumen-propane system and hence these observations could be generalized for other
feedstocks also.
Reproducibility
SFE experiments were conducted at 10.4 MPa (Pr=2.3) and 339 K (Tr=1.03)
using the SS bitumen to demonstrate the reproducibility of the experimental results. The
extraction yields obtained in these experiments are presented in Figure 54. The difference
between the extraction yields is within 5% and hence it was concluded that the
experimental results were reproducible.
Pressure Effect
Cumulative extraction yields were obtained for the four bitumens at a constant
temperature of 380 K (Tr=1.03) and at three pressures 5.6 MPa (Pr=1.2), 10.4 MPa
(Pr=2.3) and 17.3 MPa (Pr=4.1). Plots of cumulative extraction yields versus system
pressure for the bitumens are presented in Figure 55. As the system pressure increased at
constant temperature the cumulative extraction yields increased. As discussed before,

222
Figure 54.
Reproducibility for SFE with the Sunnyside Bitumen at 10.4 MPa (P =2.3) and 339 K (T=0.92)

Weight % Extracted o
o-4 Ni
_1_ i i i
CD
_1_ 00
_1_ i i i o _l_
1 ' ro
_L_
ro -
3 Q. O 2=
co -
c 3
4*. -
Oi -
O)
O •
<*> U 3 ^ »< "D
Q to
3 a
< D <*> J to
CO ro
M M Ul

224
Figure 55.
Effect of Pressure on the Extraction Yields for the Four Bitumens from the Uinta Basin at Constant Temperature 380 K (Tr=1.03)

Cumulative Extraction Yield, wt%
3 to to C - t CD
flj
S2Z

226
the increase in extraction yields has been attributed to the increase in the solvent density
with increased pressure at constant temperature for a particular bitumen. Moreover, the
WR bitumen gave the maximum yield at all three pressures, the AR bitumen gave the
second highest yields, and the SS bitumen gave the lowest. The PRS extraction yields were
intermediate between the yields for the AR and SS bitumens. The WR bitumen extraction
yields were 6 to 10 % (absolute) more than those of the AR Bitumen. The AR bitumen
yields were 1 to 5 % more than PRS bitumen. The PRS bitumen extraction yields were 1
to 7 % greater than the yields for the more refractory SS bitumen. The ranking for the four
bitumens according to extraction yield as follows:
Whiterocks > Asphalt Ridge > PR Spring > Sunnyside
This ranking is similar to the ranking observed when the physical (specific gravity,
Conradson carbon and viscosity) and chemical (asphaltene and resin contents) properties
of the four bitumens are compared. The bitumen (WR) judged to possess superior physical
and chemical properties gave greater extraction yields compared to the bitumen (SS)
judged to possess inferior physical and chemical properties. Thus, the difference in the
cumulative extraction yields amongst four bitumens at a particular temperature could be
attributed to their physical and chemical properties.
Temperature Effect
The effect of temperature on the cumulative extraction yield at a constant pressure
of 10.4 MPa (Pr=2.3) for the four bitumens is presented in Figure 56. As the system
temperature increased at constant pressure, the cumulative extraction yield decreased for
the four bitumens. The decrease in the extraction yields with increase in temperature was

227
Figure 56.
Effect of Temperature on the Extraction Yields for the Four Bitumens from the Uinta Basin at Constant Pressure 10.4 MPa (Pr=2.3)

45
40
* 35
CO
§ 30
s t< W 25 o >
I | 20 o
15-
1 0 — T
• WRS Bitumen
+ AR Bitumen
* PRS Bitumen
o SS Bitumen
- i — i — | — i — i — i — i — | — i — i — i — i — | — i — i — i — i — | — i — i — i — i — | — i — i — i — i — | — i — i — i — i — | — i — i — i — i — I — i — i — i — i — | — i — i — i —
325 335 345 355 365 375 385 395 405 415 425 Temperature, K 00

229
attributed to the decrease in solvent density as the temperature increased. The cumulative
extraction yields for the WR bitumen were highest and were 10 to 12 wt% greater than
those for the AR bitumen. The extraction yields of SS bitumen were lowest, and were 2
to 6 wt% less than those for the PRS bitumen. The AR bitumen and PRS extraction yields
were intermediate with the former yields 2 to 7 wt% higher than that of PRS bitumen.
Thus, the order as indicated by the extraction yields was as follows:
Whiterocks > Asphalt Ridge > PR Spring > Sunnyside
This ranking is similar to the ranking observed with the pressure effects. The
cumulative extraction yields for the four bitumens should remain the same if the extraction
yields were solely governed by the operating pressure and temperature of the SFE.
However, it was observed that the four bitumens exhibited different extraction yields at
the same operating conditions with the order as shown above. Thus, the extraction yields
of the bitumen are not only governed by the operating parameters but also by the feedstock
physical and chemical make up. The bitumen with the lowest specific gravity, Conradson
carbon, viscosity, asphaltene and highest resin content (WR bitumen) exhibited higher
extraction yields than the other three bitumens. The SS bitumen that had the highest
specific gravity, Conradson carbon, viscosity, asphaltene and lowest resin content gave
lowest extraction yield. The AR bitumen and PRS bitumen extraction yields were in the
intermediate range with AR bitumen yield greater than those of the PRS bitumen. This was
consistent with the perception that the AR bitumen was of a higher quality than the PRS
bitumen. The effect of chemical make up of the bitumen on the extraction yield is
discussed in detail in the subsequent sections.

230
Solvent Density Effect
The cumulative extraction yields at all five operating conditions for the four
bitumens are plotted against the pure propane solvent density in Figure 57. The pure
solvent densities were measured in a separate experiment and are reported in Table 14. The
cumulative extraction yields increased with increase in solvent density. As indicated
previously, the WR bitumen gave the highest extraction yields at all five operating
conditions whereas the SS bitumen gave the lowest yields. Thus, the ranking of the four
bitumens according to extraction yields:
Whiterocks > Asphalt Ridge > PR Spring > Sunnyside
was the same for each of the process variables studied: This would seem to indicate that
it may be possible to link process extraction yields to key chemical and physical attributes
of the bitumens.
The measured extract phase densities for the AR and SS bitumens at all the five
operating conditions were plotted against extraction time and are presented in Figures 42
and 49, respectively. It can be observed from these plots that the starting extract phase
densities at 17.3 MPa (Pr=3.2) and 380 K (Tr=1.03) were 0.71 and 0.604 g/cm3 for the
AR and SS bitumens, respectively. The corresponding cumulative extraction yield for the
AR bitumen was higher at 31.4 wt% compared to SS bitumen at 23.7 wt%. Thus, the
higher extraction yield for the AR bitumen relative to the SS bitumen at same solvent
density could be attributed to the chemical make up of the bitumens. Similar observations
could be made for the AR bitumen at the other four operating conditions, where the
starting extract phase density and corresponding extraction yields were higher than for the
SS bitumen.

231
Figure 57.
Effect of Solvent Density on the Extraction Yields for the Four Bitumens from Uinta Basin

70
60
50
^ 40
& 30
20
10 9 8
• WRS Bitumen
+ AR Bitumen
* PRS Bitumen
o SS Bitumen
7 ~ | — i — ' — i — i — i — i — ' — i — i — i — i — ' — i — i — i — i — i — ' — i — i — i — i — i — i — i — i — i — i — i — i — i — i — i — i — i — i — • — i — i "
0.53 0.535 0.54 0.545 0.55 0.555 0.56 0.565 0.57
Solvent Density, g/cc M U)

233
Effect of Bitumen Asphaltene Content
The extraction yields were different for the four bitumens under investigation at the
same temperature, pressure and solvent density. This could be attributed to the difference
in the chemical nature of the bitumens (Table 11). The asphaltene contents of the four
bitumens varied from 2.9 wt% (WR) to 23.6 wt% (SS). The cumulative extraction yields
obtained at the five different operating conditions for the four bitumens were plotted
against the asphaltene content of the feedstocks and are presented in Figure 58. It is
observed from the plot that as the asphaltene contents of the bitumens increased from 2.9
wt% for the WR bitumen to 23.6 wt% for the SS bitumen, the cumulative extraction yields
decreased.
The WR bitumen that had the lowest asphaltene (2.9 wt%) content gave the highest
extraction yields at all five operating conditions. The SS bitumen with an asphaltene
content of 23.6 wt% gave the lowest extraction yields. The AR (6.7 wt%) and PRS
bitumens (19.3 wt%) extraction yields were intermediate with the AR extraction yields
higher than the PRS yields at all five conditions.
It was established by Speight (65) that for a bitumen sample, the amount of
asphaltene precipitated increased exponentially from 18 wt% to 48 wt% when the solvent
was switched from pentane to propane. The difference in the propane and pentane soluble
fractions is related to the resin molecules present in the bitumens. It should be noted that
the highest resin content was 54.5 wt% for the WR bitumen whereas the lowest resin
content was 36.8 wt% for the SS bitumen. The AR and PRS bitumens fall in the
intermediate range with AR bitumen resin content (44.1 wt%) higher than the PRS
bitumen resin content (43.8 wt%). Thus, the bitumen (WR) that had lowest pentane

234
Figure 58.
Relationship Between Asphaltene Content and Extraction Yield for the Four Uinta Basin Bitumens

235
CO CO
CO
Q_
to CM
* ^ * : ic: o CO
to D.
B O N O CO CO CN 00 CO CO TJ" CO
« « <* * co co co co
Q. Q. Q. Q.
<
a:
rr *r T co d ci o" Is-'
II
o CN
to
5̂
C 0 C o
O 0) c 0)
CO JZ CL (0
<
to
CM <D CO
o in CN
— O)
o
o/0̂ v\ 'p|8!A uojpBjpcg 9Ai}B|niuno

236
insolubles and highest resin content was expected (assuming equal increase in asphaltene
content from pentane to propane insolubles) to have the lowest propane insolubles
compared to the SS bitumen (highest pentane insolubles and lowest resin content). The AR
and PRS bitumen propane insolubles were expected to fall in the intermediate range with
AR bitumen propane insolubles lower than the PRS bitumen insolubles. As stated in the
earlier section, the maximum extraction yield obtainable using supercritical propane will
be equal to or less than the maximum deasphalted oil obtainable using liquid propane.
Thus, the amount of propane soluble fractions available for extraction is in the order:
Whiterocks > Asphalt Ridge > PR Spring > Sunnyside
Thus, the WR bitumen that would have highest propane soluble fractions (largest
fraction available for extraction since asphaltene was not extracted) gave a higher
extraction yield than the other bitumens at all five operating conditions. The SS bitumen
was extracted least and the AR and PRS bitumens extraction yields fell in the intermediate
range with the AR bitumen yields higher than the PRS bitumen yields. The pentane
insoluble test performed on the AR and SS extract samples (2nd window at 10.4 MPa and
339 K) did not yield any precipitate. Thus, the relationship established between the
asphaltenes and extraction yields indicates that the asphaltenes (pentane insolubles) played
a significant role in decreasing the extraction yield of bitumens and asphaltenes were not
transferred to the extract phase.
Effect of Bitumen Resin Content
The resin contents of the four feedstocks are plotted against the cumulative
extraction yields obtained for the SFE of the bitumens at the five different operating
237
conditions in Figure 59. It is observed from the plot that as the resin content of the
feedstock decreased from 54.5 to 36.8 wt%, the cumulative extraction yields decreased.
The WR bitumen had the highest resin content, 54.5 wt%, and the lowest asphaltene
content, and gave the highest extraction yields relative to the other bitumens. The SS
bitumen that had the lowest resin content (36.8 wt%) and the highest asphaltene content
gave the lowest extraction yields at all the five operating conditions. The AR bitumen
(44.1 wt%) extraction yields were lower than those of the WR bitumen and marginally
higher than those of the PRS bitumen (43.8 wt%) at all five conditions. This trend is
similar to the observation made for the asphaltene contents of the bitumens.
Effect of Bitumen Saturate and Aromatics Content
No clear trends were observed based on the saturates and aromatics contents of the
bitumens. It was expected that the AR bitumen (saturates content 39.2 wt%) which had
the highest saturates content should have given high extraction yields similar to those of
the WR bitumen (saturates content 35.7 wt%); however, the WR bitumen gave higher
extraction yields than the AR bitumen at all five operating conditions. The PRS (saturates
content 33.4 wt%) and SS bitumens (saturates content 20.0 wt%) again gave intermediate
extraction yields with the PRS bitumen yields lower than those of the AR bitumen and
higher than those of the SS bitumen. It was also observed that the cumulative extraction
yields for the WR, PRS and SS bitumens increased with increase in the volatility (fraction
boiling below 811 K). It was expected that the AR bitumen with the greater volatility and
the highest saturates content would exhibit higher extraction yields than the WR bitumen;

238
Figure 59.
Relationship Between Resin Content and Extraction Yield for the Four Uinta Basin Bitumens

Cumulative Extraction Yield, wt%
73 (D w 3" O o
(D 3
6SZ

240
however, the experimental results indicted that the AR yields were lower than those
obtained for the WR bitumen at all five operating conditions.
An explanation for this behavior is proposed based on the boiling point distributions
of the bitumen solubility fractions. A comparison has been made in Table 15 of the
contributions from the solubility fractions to the volatility (<811 K) and to fraction boiling
below 973 K for the four bitumens. It is observed from Table 15 that the WR, AR, PRS
and SS bitumens volatilities were 46.6, 53.5, 45.4 and 40.9 wt%, respectively. As
explained before, no clear trend was observed when an attempt was made to correlate
cumulative extraction yields based on the volatilities of the bitumens. The fractions boiling
below 811 K consisted of saturate, aromatics, resin and asphaltene solubility fractions. The
contribution to the volatility from the asphaltene class of compounds was small compared
to the contributions from other three solubility classes. The trend observed in Figure 60
could not be explained based on the estimated contribution to the volatility from the three
solubility classes since the AR bitumen had a higher concentration of these classes than the
WR bitumen (Table 15) which exhibited the apparent anomalous behavior.
All the extract phase samples were characterized using a simulated distillation
technique with a maximum boiling point of 973 K. The AR and SS extract phase samples
(2nd extract window samples produced at 10.4 MPa and 339 K) were subjected to pentane
insoluble analysis. The test results confirmed that these extract phase samples did not
contain asphaltene solubility class compounds. Based on the boiling point distributions of
the saturates, aromatics and resins fractions for the four bitumens, the contribution towards
the bitumen solubility fractions boiling below 973 K was estimated on a prorated basis
relative to the corresponding three solubility classes in the respective bitumens and is

241
Table 15
Comparison of Boiling Fractions for Four Bitumens
\
Properties Asphaltenes0>, wt %
Saturates, wt % Aromatics, wt % Resins, wt %
i/Vhiterocks Bitumen
2.9 35.7 7.0
54.5 Simulated Distillation
Volatility(<811 K) of Bitumen, wt% Volatility (<811 K) of Saturates, wt% Volatility (<811 K) of Aromatics, wt% Volatility (<811 K) of Resins, wt%
46.6
81.2
28.5
21.6
Asphalt Ridge Bitumen
6.8 39.2 9.0
44.1
53.5
86.2
23.2
20.4
PR Spring Bitumen
19.3 33.4 3.6
43.8
45.4
78.5
40.9
29.8
Sunnyside Bitumen
23.6 20.0 15.1 36.8
40.9
84.1
30.2
19.0
Contribution from Saturates + Aromatics and Resin towards Volatility (<811 K) of Bitumenb)
42.7 44.9 40.7 28.4
Boiling Fraction (< 973 K) of Bitumen, wt% 78.7 Boiling Fraction (< 973 K) of Saturates, wt% 99.8
90.1
100.0
56.5
54.7
78.1
99.4
80.3
62.4
73.4
99.6
72.9
55.0
Boiling Fraction (< 973 K) of Aromatics, wt% 71.4 Boiling Fraction (< 973 K) of Resins, wt% 56.3
Contribution from Saturates + Aromatics and Resin towards Boiling Fraction (< 973 K) of Bitumenb)
71.3 68.40 63.4 51.2 Pentane Insolubles
b) Estimated on prorated basis

242
Figure 60.
Relationship Between Saturates Content and Extraction Yield for the Four Uinta Basin Bitumens

100
10
1 -15 20
• 5.6 MPa* 380 K
• 10.4 MPa* 339 K
• 10.4 MPa* 380 K
+ 10.4 MPa*422 K
• 17.3 MPa* 380 K
- i — i — i — p -
25 30 Saturates Content, wt%
35 40 M to

244
presented in Table 15. These estimated values indicated that the WR bitumen had the
highest extractable (saturates, aromatics and resins) 973 K minus fraction: 71.3 wt% and
the SS bitumen had the lowest extractable 973 minus fraction: 51.2 wt%. The AR and PRS
bitumens extractable 973 K minus fractions fell in the intermediate range with the AR
bitumen 973 K minus fraction (68.4 wt%) higher than that of the PRS bitumen (63.4
wt%). The experimental results also indicated that at all five extraction conditions, the WR
bitumen yield was greater than those obtained for the other three bitumens. The refractory
SS bitumen gave the lowest extraction yields whereas the AR and PRS bitumen were in
the intermediate range with the AR bitumen yields greater than the yields for the PRS
bitumen.
Thus, the cumulative extraction yield trend obtained from the SFE of the four
bitumens using propane as solvent was controlled by the extractable solubility class
compounds present in the 811 K plus and 973 K minus range.
Compositional Analyses of Residual Fraction
The residual fractions in the extractor at the completion of each extraction
experiment were fractionated into saturates, aromatics, resins and asphaltenes using
adsorption chromatography. The fractionation technique is outlined in Appendix D. The
fractionations of the residual fractions were performed to determine the nature of the
material left behind in the extractor.
The results of the compositional and elemental analyses of the residual fractions
obtained from SFE of the four bitumens at five different operating conditions are presented
in Tables 16 through 19.

245
Table 16 Summary of Extraction Yields and Residual Fractions Analyses for the
Whiterocks Bitumen
Pressure (MPa) 5.6 10.4 10.4 10.4 17.3
Reduced Pressure 1.2 2.3 2.3 2.3 4.1
Temperature (K) 380 339 380 422 380 Reduced Temperature 0.92 1.03 1.03 1.03 1.14
Solvent Density, g/cc 0.533
Product Yields (wt%) Extract Phase 20.0 Residual Phase 79.0
Residual Phase SARA Analyses Saturates & Aromatics, wt% 24.9 Resins, wt% 63.7 Asphaltenes, wt% 11.4 Asphaltenes, wt% (Expected) 3.7
0.566
40.0 59.0
15.5 74.5 10.0
4.9
Residual Phase Elemental Analysis3) C, wt% 86.8 H,wt% 11.0 N,wt% 1.8 S, wt% 0.5 H/C Atomic Ratio 1.52
86.7 10.8 2.0 0.5 1.50
0.553
39.0 58.0
20.1 64.5 15.4
5.0
86.7 10.8 2.0 0.5 1.49
0.545
24.0 73.0
27.0 62.2 10.'8
4.0
86.7 11.1 1.8 . 0.5 1.53
0.569
48.0 50.0
0.0 76.5 23.5
5.8
86.8 10.6 2.1 0.5 1.46
a) Normalized to 100%

246
Table 17 Summary of Extraction Yields and Residual Fractions Analyses for the Asphalt
Ridge Bitumen
Pressure (MPa) Reduced Pressure
Temperature (K) Reduced Temperature
Solvent Density, g/cc
Product Yields (%)
Extract Phase Residue Phase
5.6 1.2
380 0.92
0.533
13.4 86.6
Residual Phase SARA Analyses
Saturates, wt% Aromatics, wt% Resins, wt% Asphaltene, wt% Asphaltene, wt% (Expected)
22.6 3.5
58.9 15.0
7.8
10.4 2.3
339 1.03
0.566
31.3 68.7
5.5 1.6'
60.0 33.0
9.9
Residual Phase Elemental Analysis3)
C, wt% H, Wt% N, wt% S, wt% H/C Atomic Ratio
87.38 10.90 1.21 0.50 1.50
87.29 10.50 1.73 0.49 1.44
10.4 2.3
380 1.03
0.553
24.5 75.5
13.3 2.3
61.9 22.5
9.0
87.00 10.66 1.85 0.49 1.47
10.4 2.3
422 1.03
0.545
18.2 81.8
18.8 4.9
59.5 16.8
8.3
87.11 11.00 1.42 0.47 1.51
17.3 4.1
380 1.14
0.569
31.4 68.6
4.1 1.4
56.5 38.0
9.9
87.18 10.91
1.43 ' 0.48 1.50
a) Normalized to 100.0 %

247
Table 18 Summary of Extraction Yields and Residual Fractions Analyses for the PR
Spring Bitumen
Pressure (MPa) 5.6 Reduced Pressure 1.2
Temperature (K) 380 Reduced Temperature 0.92
Solvent Density, g/cc 0.533
Product Yields (%)
Extract Phase 8.8 Residual Phase 91.2
Residual Phase SARA Analyses
Saturates & Aromatics, wt% 29.3 Resins, wt% 50.3 Asphaltenes, wt% 20.4 Asphaltenes, wt% (Expected) 21.2
10.4 2.3
339 1.03
0.566
23.0 77.0
22.7 42.0 35.3
25.1
Residual Phase Elemental Analysis3)
C, wt% 87.4 H,wt% 11.0 N,wt% 1.1 S, wt% 0.5
H/C Atomic Ratio 1.50
87.4 10.5 1.4 0.7 1.44
10.4 2.3
380 1.03
0.553
20.8 79.2
10.0 53.8 36.2
24.4
87.3 10.8 1.3 0.6 1.47
10.4 2.3
422 1.03 •
0.545
15.7 84.3
21.0 52.6 26.4
22.9
-
87.3 11.0 1.1 0.6
• 1.50
17.3 4.1
380 1.14
0.569
31.7 68.3
10.8 37.1 52.0
28.3
87.4 10.6 1.4 0.6 1.44
a) Normalized to 100%

248
Table 19 Summary of Extraction Yields and Residual Fractions Analyses for the
Sunnyside Bitumen
Pressure (MPa) 5.6 Reduced Pressure 1.2
Temperature (K) 380 Reduced Temperature 0.92
Solvent Density, g/cc 0.533
Product Yields (%)
Extract Phase 12.0 Residual Phase 88.0
Residual Phase SARA Analyses
Saturates, wt% 13.3 Aromatics, wt% 7.3 Resins, wt% 51.5 Asphaltene, wt% 37.9 Asphaltene, wt% (Expected) 26.8
Residual Phase Elemental Analysis
C, wt% 87.41 H, wt% 10.40 N, wt% 1.08 S,wt% 1.11 H/C Atomic Ratio 1.43
10.4 2.3
339 1.03
0.566
22.4 77.6
3.3 1.2
37.1 58.4
30.4
)
87.20 10.14 1.42 1.23 1.39
10.4 2.3
380 1.03
0.553
14.8 85.2
5.4 3.5
35.9 55.2 "
27.7
87.31 10.28 1.17 1.24 1.41
10.4 2.3
422 1.03
0.545
11.2 88.8
16.7 6.8
40.2 36.3
26.6
87.32 10.60 1.02 -1.05 1.46
17.3 4.1
380 1.14
0.569
23.7 76.3
1.3 1.5
37.0 60.3
30.9
86.72 9.86 1.41 1.23 1.36
a) Normalized to 100%

249
Saturates Content of Residual Fractions
A partial SARA analysis was performed on the residual fractions from the SFE of
the WR and PRS bitumens by Subramanian (64) without fractionating the saturates and
aromatics into saturates, aromatics I and II using neutral alumina. Hence, the results were
reported as saturates and aromatics. However, the residual fractions from SFE of the AR
and SS bitumens were subjected to complete fractionation into saturates, aromatics, resins
and asphaltenes.
The saturates and aromatics contents of the WR and PRS bitumen are compared
with the saturates and aromatics contents of their respective residual fractions obtained at
all five operating conditions in Figures 61 and 62. The solvent densities are plotted against
the saturates and aromatic contents instead of operating variables pressure and temperature,
because the extraction yields were proportional to the solvent density, which represents the
severity of operation in SFE processes. The saturates and aromatics contents of the
residual fractions for the WR and PRS bitumens were lower than the saturates and
aromatics contents of the respective bitumens, and in general decreased with increase in
solvent density (severity of operation). Thus, it was concluded that as the solvent density
or the severity of operation or the extraction yields increased more and more of the
saturates and aromatics were extracted. It has also been pointed out in the earlier sections
that the cumulative extraction yields increased with increase in the solvent density meaning
more of the saturates and aromatics were removed in the process. Moreover, the resin
contents (Tables 16 through 19) of the residual fractions obtained during the SFE of four
bitumens were higher than the resin contents of the original bitumens except for the PRS
bitumen at two operating conditions where the solvent densities are higher compared to the

250
Figure 61.
Effect of Solvent Density on the Extraction of Saturates and Aromatics from the Whiterocks Bitumen

251
50 — Q Saturates & Aromatics Content of the Bitumen
Saturates & Aromatics Content of the Residual Fractions
0.533 0.545 0.553 0.566
Solvent Density, g/cc 0.569

252
Figure 62.
Effect of Solvent Density on the Extraction of Saturates and Aromatics from the PR Spring Bitumen

50
45
40
Q Saturates & Aromatics Content of the Bitumen
Saturates & Aromatics Content of the Residual Fractions
0.533 0.545 0.553 0.566
Solvent Density, g/cc 0.569

254
other three conditions. This indicates that the contribution to the extract phases from resins
was less than that from the saturates and aromatics. Analyses of selected extract samples
indicated that no asphaltenes (pentane insolubles) were present. Thus, it was concluded
that propane preferentially extracted saturates and aromatics from bitumens at the expense
resins and asphaltenes.
The saturates contents of the AR and SS bitumens and the respective residual
fractions have been plotted and are presented in Figures 63 and 64. The trends are similar
to those reported for the WR and PRS bitumens. This led to the conclusion that the
saturates and aromatics were preferentially extracted by propane compared to the
asphaltenes and resins.
Asphaltene Content of Residual Fractions
The residual fractions of the four bitumens after SFE were mixed with excessive
amounts of n-pentane to yield pentane insolubles, i.e., asphaltenes. The asphaltene content
of the residual fractions was examined to determine the effect of process variables on the
removal or rejection of the asphaltenes and also to investigate the nature of the unextracted
residual fraction.
The measured asphaltene content of the residual fractions is compared with the
expected asphaltene content of the residual fractions and the asphaltene content of the
respective bitumens in Figures 65 through 68. The expected asphaltene contents of the
residual fractions were calculated on a prorated basis relative to the amount of bitumen
charged to the extractor and assuming that all the asphaltenes remained in the residual
fractions. Selected extract samples from SFE of the AR and SS bitumens at 10.4 MPa

255
Figure 63.
Effect of Solvent Density on the Extraction of Saturates from the Asphalt Ridge Bitumen

256
| | Saturates Content of the Bitumen
Saturates Content of the Residual Fractions
0.545 0.553 0.566
Solvent Density, g/cc 0.569

257
Figure 64.
Effect of Solvent Density on the Extraction of Saturates from the Sunnyside Bitumen

258
• ^
^ 1 c a •+•«
c o O U) 0)
*-< CO i _ 3
*-• (0
C/i w ^
yJXJ —
-
„
25--
20-
-
•
15-
.
10--
.
*
5-•
--
-
o-i
—
[~[ Saturates Content of the Bitumen
-
^ Saturates Content of the Residual Fractions
—
—
^ r
V v .
i»
£••
..^
V;
' .
.1 .-B
~.:; -̂r
. •-? - • < *
•• -X?
- .-Ss -_ "."^s
-rjt
. j i -
.- ; ^ V"
„.v
'•&>
-*:,
R ft
§ §
&
8
| \
| 5
| i
\ \
I i
<v
V ,
x
ssssas. SuS&Stl
ins • ISl 9Mi | | | | | §
iiiii H l l l l g g
H 1 IHH?
iili B 1 !»«§»»
jj JS-SKSW
IIP Wm H
—
—
s
r
'
.-
-
Jj i
N
V1.-a
£!• - :. •
:- •;;:
1 :•«£ . .—-~.-;-r , / i . - . :^--V«i
»
"-Sft-
• . ~ ' ~ : "
• ^
1
"N
^
s • • : - ' •
z .-"
- • - * .
. -.- * .7
.* - - • -
. • * - .
• - - . * • •
; :•• • V .
.-.*•.
x-h. ' - -V?
'A \-sZ
• ~ -
-<i • V :
• v
• . *
• • '
1
' v
V ,
N
_.
{ _ i
;•
.-. " :
*
- - • : *
--:•' i;--v : -,'•"
-
• . i " • -V
,
• • m̂ B
\
i *
0.533 0.545 0.553 0.566
Solvent Density, g/cc 0.569

259
Figure 65.
Effect of Solvent Density on the Extraction of Asphaltenes from the Whiterocks Bitumen

30
c a
^ - > c o o © c o as
SZ a. (0 <
25-1
H Bitumen
• Residual Fractions (Expected)
Residual Fractions (IVIeasured)
0.533 0.545 0.553 0.566 Solvent Density, g/cc
0.569

261
Figure 66.
Effect of Solvent Density on the Extraction of Asphaltenes from the Asphalt Ridge Bitumen

262
50-
Bitumen
Residual Fractions (Expected)
Residual Fractions (Measured)
40-
c Qi
c o o c CD
(0
Q . (0
<
0.533 0.545 0.553 0.566 0.569 Solvent Density, g/cc

>
263
Figure 67.
Effect of Solvent Density on the Extraction of Asphaltenes from the PR Spring Bitumen

264
C 0) c o o c
(0
x: Q. (0 <
B Bitumen
Q Residual Fractions (Expected)
Residual Fractions (Measured)
0.533 0.545 0.553 0.566 Solvent Density, g/cc
0.569

265
Figure 68.
Effect of Solvent Density on the Extraction of Asphaltenes from the Sunnyside Bitumen

266
C
o o <D C 0}
CO
Q. (0
<
70-fH Bitumen
• Residual Fractions (Expected)
B Residual Fractions (Measured)
0.533 0.545 0.553 0.566 Solvent Density, g/cc
0.569

267
(Pr=2.3) and 339 K (Tr=1.03) were analyzed and there was no evidence that asphaltenes
were transferred to the extract phases.
The asphaltene contents of the residual fractions for the four bitumens were much
higher than those of the bitumens and the expected asphaltene contents which had been
calculated on a prorated basis. An explanation for this phenomenon can be generated by
revisiting the literature. Nellensteyn (72) proposed initially a colloidal model for the heavy
asphaltic material present in naturally occurring crude oils. According to him, the asphaltic
materials were made up of micelles covered or shielded from the bulk of the oil by
adsorbed resins (cosolubilizing agents) and other hydrocarbon materials. The micelles were
assumed to be dispersed in the hydrocarbon medium. He also suggested that the
precipitating properties of asphaltic materials in different solvents are related to the surface
tension. Swanson (73) and Witherspoon and Munir (74) suggested that the resins help
asphaltenes stay dissolved in the distillate portion of the naturally occurring crude oil,
heavy oil, bitumen, etc. Dickie and Yen (75) proposed that the petroleum resins act as an
interface between the polar asphaltenes and relatively nonpolar oil fractions in petroleum.
Koots and Speight (76) proposed that the resin fractions play major role in maintaining the
asphaltenes in a colloidal state in crude oils. Leontaritis and Mansoori (77) proposed a
thermodynamic model of the colloidal state to predict the onset of asphaltene fiocculation.
Mitchell and Speight (78) indicated that asphaltene precipitation increased exponentially
with a decrease in carbon number in the paraffinic solvent used for precipitation. Thus,
the composition of the asphaltene precipitated using different solvents was different. The
asphaltene molecular weight increased and the H/C atomic ratio decreased with increase
in the carbon number of the paraffinic solvent used for precipitation. There are other

268
process variables such as the ratio of solvent-to-feedstock, the precipitation temperature
and the contact time that influence the amount of asphaltene precipitated.
Thus, the interaction between resins and asphaltenes is the key to the colloidal
suspension of the asphaltenes in oil. This interaction is disturbed by the addition of a
nonpolar solvent, the equilibrium that existed between the resin (soluble in the nonpolar
solvent) and asphaltenes (insoluble in the nonpolar solvent) was disturbed, and permitted
the aggregation of asphaltene molecules and their precipitation from solution. The analysis
of the residual fractions produced in the SFE process indicated the presence of saturates,
aromatics, resins and pentane insolubles when propane was used as the solvent. At the
same time, the propane-free extract phases consisted of saturates, aromatics and resins and
no asphaltenes or pentane insolubles. During the SFE process, the resins or the
cosolubilizing agents that kept the asphaltenes in solution in the original bitumen were
transferred to the extract phase. Without these resin molecules, some of the asphaltene that
did not precipitate from the original bitumen (while performing pentane insolubles) was
precipitated after the bitumen sample was subjected to SFE. The observation made here
was also observed by Koots and Speight (76) while studying the relationship between resin
and asphaltenes in bitumen or crude oils. While using pentane and heptane as solvent, the
Athabasca bitumen yielded 17 and 11 wt% of asphaltenes, respectively. Thus, 35 % of the
pentane insolubles remained in solution when heptane was used as the solvent. An attempt
was made to dissolve the pentane insolubles in heptane; however, only 10 % of the
pentane insoluble dissolved. When resins were added, such that the asphaltene-resin ratio
was same as that of the original bitumen, 33 % of the pentane insoluble asphaltenes were
soluble in pentane. The authors also observed similar effects using other hydrocarbon

269
solvents. Thus, the removal of resins (cosolubilizing agents)resulted in an increase in the
pentane insolubles in the residual fractions obtained from SFE of bitumens using propane.
The measured asphaltene content of the residual fractions increased with increase
in the solvent density for all the four bitumens (Figures 65 through 68). This correlated
well with the increased extraction yields with increase in solvent density for the four
bitumens and also with the decrease in the saturate and aromatic contents of the residual
fractions. Thus, it was concluded that the resins (cosolubilizing agents) that kept the
asphaltenes suspended in the original bitumen have been removed during SFE.
Elemental Analyses
The elemental (C, H, N and S) analyses of the residual fractions for the bitumens
are reported in Tables 16 through 19 for the WR, AR, PRS and SS bitumens, respectively.
The nitrogen and sulfur compounds are primarily present in the resin and asphaltenes with
the exception of sulfur in small quantities in the oils (saturates plus aromatics). The
nitrogen and sulfur compounds have a tendency to concentrate in the asphaltenes relative
to resins (79). However, an exception to this trend was observed in the case of sulfur (79).
It has been observed from the solubility fractions of the SFE residual fractions that
saturates and aromatics were extracted preferentially compared to resins and asphaltenes.
The analyses of the extract samples indicated the absence of asphaltenes. Thus the pentane
insolubles which contain the increased amounts of asphaltenes and consequently nitrogen
and sulfur were left behind in the residual fractions. The resins were transferred to the
extract phase; however, the relative amount of extraction was less compared to the
extraction of saturates and aromatics (saturates and aromatics content decreased in the

270
residual fractions compared to the original bitumens) . This was also indicated by the
increase in the resin contents of the residual fractions compared to the original resin
content of the bitumens. Thus, the heteroatoms such as sulfur and nitrogen that are
predominantly contained in the asphaltenes, and to a lesser extent in the resins, were
concentrated in the residual fractions. The nitrogen and sulfur concentrations of the
residual fractions were consistently higher than the nitrogen and sulfur contents of the
bitumen confirming that the heteroatoms are concentrated in the unextracted residual
fractions. This is an important observation relevant to the quality of the upgraded
hydrocarbon liquids produced in the SFE process. Elemental analyses of the extract
samples need to be performed to quantify the amount of heteroatoms present in the extract
samples; however, the quantities of the extract samples produced in this study were not
sufficient to permit elemental analyses.
The H/C atomic ratios of the residual fractions are compared with the H/C ratios
of the bitumens in Figures 69 through 72 for the WR, AR, PRS and SS bitumens;
respectively. The H/C ratios of the residual fractions were lower than the H/C ratios of
the bitumens. Furthermore, as the solvent density increased and concomitantly the
extraction yields, the H/C atomic ratio of the residual fractions decreased for the four
bitumens implying that the saturates and aromatic compounds were preferentially extracted
compared to the polar resins and asphaltenes. This was confirmed by an observed
reduction in the saturates and aromatic contents of the residual fractions compared to the
original bitumen.

271
Figure 69.
Relationship Between Pure Solvent Density and the Residual Fraction H/C Atomic Ratio for the Whiterocks Bitumen

272
0.533 0.545 0.553 0.566 0.569
Solvent Density, g/cc

273
Figure 70.
Relationship Between Pure Solvent Density and the Residual Fraction H/C Atomic Ratio for the Asphalt Ridge Bitumen

274
0.533 0.545 0.553 0.566 0.569 Solvent Density, g/cc

275
Figure 71.
Relationship Between Pure Solvent Density and the Residual Fraction H/C Atomic Ratio for the PR Spring Bitumen

276
1.65
1.6
1.55 4-f
[ | Bitumen
li Residual Fractions
•S 1.5 CO
a: o E 1-45 o
<
^ 1.4
1.35
1.3
1.25
f w ^ .
S *
0.533 0.545 0.553 0.566
Solvent Density, g/cc 0.569

277
Figure 72.
Relationship Between Pure Solvent Density and the Residual Fraction H/C Atomic Ratio for the Sunnyside Bitumen

278
0.533 0.545 0.553 0.566 0.569
Solvent Density, g/cc

279
Modeling SFE Using Continuous Thermodynamics Principle
An attempt has been made to model the supercritical fluid extraction of oil sands
bitumen with propane as solvent using the principle of continuous thermodynamics. The
pseudocomponent lumps used to represent the bitumen in modeling were arbitrarily
specified whereas continuous thermodynamic principles uses mathematically selected
quadrature points to represent the complex hydrocarbon mixtures. The critical properties
were estimated at these quadrature points and flash calculations were conducted using the
Peng-Robinson (62) equation of state to simulate the supercritical extraction process and
understand the effect of bitumen composition on the SFE yields. The choice of the proper
continuous distribution function and the number of quadrature points required to represent
ultra heavy oils such as bitumen was very critical for the success of the modeling process.

280
SUMMARY AND CONCLUSIONS
The supercritical fluid extraction (SFE) apparatus was successfully used to conduct studies
with two bitumens from the Asphalt Ridge (AR) and Sunnyside (SS) oil sands deposits of Utah.
The existing system (63, 64) was modified by switching the backpressure valve located upstream
of the extractor to downstream of the extractor between the densitometer and the low pressure
separator to achieve better pressure control of the system. A data acquisition system was installed
to monitor the flowrate of the solvent gas flowing out of the system and also to measure the
density of the extract phase on a continuous basis.
The SFE experiments were carried out at five different sets of operating conditions using
the Asphalt Ridge and Sunnyside bitumens and the following conclusions were drawn:
a) The cumulative extraction yields for both the Asphalt Ridge and Sunnyside bitumens
increased with increase in pressure at constant temperature;
b) The cumulative extraction yields of the two bitumens decreased'with increase in
temperature at constant pressure.
c) The extraction yields increased with increase in propane solvent density.
d) The liquid products obtained from SFE of both the bitumens were upgraded liquids which
were approximately 80 wt% volatile.
e) Higher molecular weight extract phases were obtained by increasing the system pressure
at constant temperature. Lighter and upgraded liquids were obtained by increasing the
temperature at constant pressure.
The bitumens from four major Utah deposits, Whiterocks, Asphalt Ridge, PR Spring and
Sunnyside were subjected to SFE using propane as the solvent. The effect of pressure,

281
temperature, solvent density, and feed compositions on extraction yields and residual fraction
characteristics has been investigated. The cumulative extraction yields for the four bitumen
increased with increase in pressure at constant temperature and decreased with increase in
temperature at constant pressure. In general, higher extraction yields were obtained at higher
solvent density for all four bitumens.
The cumulative extraction yields decreased with increase in the asphaltene content and
were directly proportional to the feed resin content of the feedstock at all five operating
conditions. Except for the Asphalt Ridge bitumen, the extraction yields increased with an increase
in feed volatility and saturates content of the bitumens. Saturates and aromatics were
preferentially extracted compared to asphaltene and resins. This was confirmed by the reduction
in the H/C ratio of the residual fraction. The higher the solvent density, the greater the extent of
removal of saturated and aromatic compounds during SFE of all four bitumens.
Modeling of the supercritical extraction of oil sands bitumen was attempted using
continuous thermodynamics along with the Peng-Robinson equation of state. A process flow
diagram was developed for upgrading bitumen recovered by the surface mining and aqueous
flotation recovery technique." Optimization has been attempted using the modeling procedure to
obtain operating conditions such as solvent-to-bitumen ratio, pressure and temperature for
supercritical extraction and separation using propane as solvent and the Asphalt Ridge and
Sunnyside bitumens as feedstocks.
The modeling results predicted preferential extraction of saturates, and aromatics relative
to resins were consistent with the experimental observation.

282
FUTURE ACTIVITIES
The supercritical fluid extraction studies will be discontinued due to the termination of the
University of Utah Oil Sands Research and Development Program by the U.S. Department of
Energy. The database on the Whiterocks, Sunnyside, PR Spring and Asphalt Ridge bitumen will
be published for the benefit of the technical community in a series of journal articles currently in
preparation.

283
Compositional Analysis of Bitumens and Bitumen-Derived Products
Principal Investigator: F.V. Hanson Co-Principal Investigator: M.D. Deo Graduate Student: M. Subramanian
INTRODUCTION
Bitumens are ultraheavy oils with API gravity values less than 10° API and viscosity values
greater than 10,000 cp at reservoir conditions. Whether the bitumens are produced by surface
recovery (81,82) or by in-situ (83) processes, their characterization is important for the
development of recovery process employed to convert them to refinery feedstocks. Some of the
processes used for upgrading bitumens and bitumen-derived heavy oils include coking (54,55),
hydrotreatment (84), and supercritical fluid extraction (SFE) (63,64). Ryu (85) has extensively
reviewed the literature on bitumen upgrading processes.
Boduszinski (86,89) reported a method for heavy oil characterization using both
chromatographic and spectroscopic techniques and has suggested the use of the sequential elution
fractionation (SEF) technique for extending the atmospheric equivalent boiling point (AEBP)
beyond 704°C(1300°F) to as high as 1648°C(2998°F). Correlations (89) are available to estimate
the mid-AEBP using the H:C atomic ratio or specific gravity of fractions obtained from SEF of
hydrocarbons boiling above 704°C(1300°F). This permits complete characterization of petroleum
crude oils and residual fractions. Bukka and co-workers (58,66) reported solubility class fractions
of selected bitumens from the Uinta Basin of Utah. The fractions were separated using a sequence
of solvents of increasing polarity. The separated solubility fractions were classified as saturates,
aromatics I, aromatics II, resins I, resins II, and asphaltenes. The analyses of the fractions
obtained from the Whiterocks, Asphalt Ridge, and Sunnyside bitumens led to the recommendation

284
that the Whiterocks deposit be subjected to subsequent development studies based on the lower
asphaltene content.
The boiling point distributions of oils can be determined using the ASTM D2892 (90)
procedure. Distillation is carried out at a 5:1 reflux ratio on a column that contains 15 theoretical
plates. Gas chromatographic simulated distillation (SIMDIS) techniques such as ASTM D2892
were developed to reduce the time required for boiling range analysis. The ASTM D2887 (91)
simulated distillation procedure provided the means to determine boiling point distributions of oils
containing components boiling below 538°C(1000°F). ASTM D5307-92 (92) was subsequently
developed to account for the uneluted portion of the oil, based on the mathematical procedure
originally proposed by Worman and Green (93). Neer and Deo (94) established the mathematical
equivalence between this procedure and the more intuitive lever arm rule to quantitate the uneluted
fraction. ASTM D2887 and D5307 make use of packed columns to determine the boiling point
distributions of oils up to 538°C(1000°). It should be possible to elute heavier fractions of oils
and to obtain boiling point (or equivalent carbon number) distributions up to about 700°C(1292°F)
using capillary columns with high phase ratios (approximately 500) or equivalent packed columns.
The development of this technique would be particularly useful for analysis of heavy oils and
bitumens that typically contain greater than 50 wt% material boiling above 538°C(1000°F).
The objective of this paper is to demonstrate the viability of using short, high-phase-ratio
capillary columns for the characterization of ultraheavy oils and bitumens. The ASTM D5307
method has been extended to higher boiling point components and thus, to higher carbon numbers.
The modified technique has been used to analyze bitumens from the Whiterocks, Asphalt Ridge,
PR Spring, and Sunnyside oil sands deposits of the Uinta Basin (Utah). Four extract phases and
four residues generated during SFE of the bitumens with propane (63,64) have been analyzed, and

285
the boiling range distributions have been reported.
EXPERIMENTAL
Gas Chromatography
A Hewlett-Packard Model 5890 Series n gas chromatograph (GC) (Palo Alto, CA) was
used to analyze the samples in this study. The chromatograph was equipped with on-column
injection and a flame-ionization detector (FID). A schematic of the GC setup is presented in
Figure 73. Helium was used as the carrier gas. Air, hydrogen, and nitrogen were used to sustain
the FID flame. Injections were performed using the Model A 7673 automatic sampler from
Hewlett-Packard. The signals from the detector were sent to an IBM-PC through a Hewlett-
Packard 3396 Series n integrator using a Hewlett-Packard file server program. The signals were
integrated and were stored as report files for further computations. A Microsoft Windows based
SIMDIS program was developed in-house to read the sliced and calibration data and to obtain the
boiling point distributions for totally and partially eluted samples.
A Petrocol EX-2887 fused-silica capillary column (5 m x 0.53-mm i.d.; OA-ym film
thickness; phase ratio = 1325) from Supelco (Bellefonte, PA) was used to characterize Whiterocks
and PR Spring bitumens and the four extracts and residues. A Model Petrocol 2887 column from
Supelco with 0.5-//m film thickness (phase ratio = 265) was used to analyze the Asphalt Ridge
and Sunnyside bitumens to achieve improved resolution because this column has a lower phase
ratio. The recommended maximum operating temperature of the columns was 380°C(716°F).
The initial oven temperature was maintained at 35°C(95°F) for 4.5 min, increased at a
constant rate of 12°C/min to a final oven temperature of 380°C(716°F), and held there for 8.75
min. The detector was maintained at 400°C(752°F) during the entire analysis. The temperature

Schematic of (he Gas Chromatography
On Column Injection
Gnses 1
H e , N y l l 2
& Air
O O O
9 9
FID Defector
H-H
V Cnplllnry \ i Column /
Oven
Gas Chromntograph
j^ /k
_r RS-232-C
4 O U R
Integrator IBM PC
Figure 73. Schematic of the gas chromatography system.

287
of the injector was initially maintained at 200°C(392°F) for 2.0 min, increased at 10°C/min to
a final temperature of 400°C(752°F), and held at 400°C(752°F) until the end of the oven
program. The oven and injector temperature programs are reported in Table 20. The carrier gas
flow rates were maintained at 20 and 13cc/min for the Petrocol EX-2887 and 2887 columns,
respectively.
A 10-^L syringe from Hewlett-Packard and a nanoliter adapter kit were used in the
automatic sampler to reduce the injection volume to 0.2 ptL of sample. Polywax 655, a
calibration mixture from Supelco, was used to calibrate the column. Polywax 655 is a blend of
polyethylene oligomers with a carbon number range of C,0 to Cno in even-number increments.
The chromatogram of the Polywax 655 calibration standard for the Petrocol EX-2887 column is
presented in Figure 2. The peaks for carbon numbers QQ, C30, C40, C50, QO, Cj0, C80, and C90
were observed at approximately 13.5, 19.0, 23.5, 27.5, 29.5, 31.0, 33.0, and 35.5 min,
respectively (Figure 74). The retention times for earlier peaks (with a carbon number less than
20) were obtained using different calibration mixtures from Supelco. Separate calibration runs
using Polywax 655 were carried out with the Petrocol 2887 column used to analyze the Asphalt
Ridge and Sunnyside bitumen samples.
The. relationship between carbon number and retention time was obtained from the
calibration mixtures. The boiling point of hydrocarbons (C10 to C90) were obtained from TRC
Thermodynamic Tables (95). The relationship between the boiling point and retention time is
nearly linear and is presented in Figure 75. A Hewlett-Packard internal standard, which contained
C,4, Ci5, C16, and C17 normal alkanes, was used in approximately a 1:10 weight ratio with the
samples to permit calculation of the uneluted portion of the sample.

288
Table 20
Temperature Program for Simulated Distillation
Initial Initial Ramp Final Final Temperature Time (°C/min) Temperature Time
(°C) (min) (°C) (min)
Oven 35 4.5 12.0 380 8.75
Injector 200 2.0 12.0 400 20.0

•
i/rnnnn -, lOUUUU
-
120000 -
a | 80000 -r—4 ft
a.
40000 -
0-i
• i i i l i
5 10
Calibration Mixture, Polywax 655, Chromatogram
48
40
30
2 0 - N - J ^ ' ^ IP
ll 1 1 1 6 0
1 Hill p " 1 i ' A.
1 U l l l l " VIAA80
— i — i — i — | 1 1 — i — i — | — i — i 1 1 — | — i — i — i — i — | — i 1 1 — i — | — i — i —
15 20 25 30 35 Time, minutes
- 1 — 1 — 1 — 1 —
40
Figure 74. Chromatogram of calibration mixture Polywas 655 on a Petrocol EX2887 column (Supelco). The carrier gas was helium at a flow rate of 20 cc/min. The initial temperature was 35°C. It was held for 4.5 min, increased at 12°C/min to 380°C, and held 8.75 min.

1400
Relationship Between Boiling Point and Retention Time
1200- <r 1000-
bi) «
o 800 b*
o
600
400
200 - ) — i — i — i — | — i — i — i — i — | — i — i — i — i — | — i — i — i — i — | — i — i — i — i — p ~i 1 r
30 T 1—i—r
0 10 15 20
Retention Time, minutes
25 35
Figure 75. Plot of the relationship between boiling point and retention time.
291
Samples
Four Uinta Basin bitumens from the Whiterocks, Asphalt Ridge, PR Spring, and Sunnyside
deposits were analyzed in this study. The bitumens were extracted from the crushed oil sands ores
in a conventional Dean-Stark extraction apparatus using toluene as the solvent. The bitumen-
toluene solution was concentrated in a rotary evaporator, and the toluene was removed from the
solution at 80°C(176°F). The physical and chemical properties of the bitumens are presented in
Table 21. The extract samples for all four bitumens were obtained by SFE using propane as the
solvent at 5.6 Mpa and 193°C(380°F). The residual samples were obtained by SFE of the four
bitumens at 17.3 Mpa and 193°C(380°F). The supercritical fluid extraction procedure has been
described in detail elsewhere (64). The objective of this work was to demonstrate the applicability
of the chromatographic technique to materials lighter and heavier than bitumens. The extract
samples were viscous light hydrocarbons, containing mainly saturates, aromatics, resins, and little
or no asphaltenes. Asphaltenes were pentane insolubles obtained by a technique (96) prescribed
by Syncrude Canada Ltd. Resins were measured using the technique described by Bukka and co
workers (58,66). The residual samples were black powders at ambient temperatures and consisted
primarily of asphaltenes and resins and contained small amounts of saturates and aromatics. The
residual samples were expected to contain 80 to 90 wt% of 538°C(1000°F) plus fractions. The
bitumens and residual samples were diluted by adding 50-100 wt% of carbon disulfide to facilitate
injection using the automatic sampler. The extent of dilution varied for individual samples to
permit easy flow into the syringe. The extract phase samples were injected without dilution.
However, due to their viscous nature, the turret tray of the automatic sampler was maintained at
60°C(140°F) using a constant temperature water circulation bath. The automatic sampler
viscosity parameter was maintained at 7 for syringe rinsing and injection.

292
Table 21
Typical Physical and Chemical Properties of Bitumen
Properties
Specific Gravity (288/288 K)
API Gravity, °API Conradson Carbon,
wt % Pour Point, K Viscosity, @343K
a)
Asphaltenes , wt % Saturates, wt % Aromatics, wt % Resins, wt %
Molecular Weight
b)
Elemental Analysis C, wt % H, wt % N, wt % S, wt % H/C Atomic Ratio
Whiterocks
Bitumen
0.98
12.9
9.5 327
4,825
2.9 35.7 7.0
54.5
653
87.0 11.2 1.4 0.4
1.56
Asphalt Ridge
Bitumen
0.985
12.1
13.9 320
5,050
6.8 39.2 9.0
44.1
426
86.9 11.6 1.7 0.4 1.60
PR Spring
Bitumen
1.005
9.3
14.17 319
47,000
19.3 33.4
3.6 43.8
670
87.0 11.3 1.3 0.4 1.56
Sunnyside
Bitumen
1.015
7.9
15.0 348
173,000
23.6 20.0 15.1 36.8
593
86.8 10.8 1.1 0.7 1.49
a) Pentane Insolubles
b) C, H, N, S analyses normalized to 100%

293
Results and Discussion
Once a boiling point versus retention time calibration curve has been established for a
given column at prescribed conditions, the following procedure permits calculation of the boiling
point distribution of a given sample to the upper limit of the calibration curve. The curve used
in this study (Figure 75) gave retention times of hydrocarbons boiling up to 700°C(1292°F). The
uneluted portion of the sample, which in this case corresponds to species boiling above
700°C(1292°F), was calculated using chromatograms of the sample and chromatograms of the
sample containing a known weight of the internal standard (typically 10 wt%). The baseline
signal was subtracted from both the sample and sample containing the internal standard
chromatograms before the uneluted fractions were calculated according to the following procedure
(92).
The total area of the chromatogram was calculated from Equation 1:
AT= KIAxR)-IB] x 1 -W
W (15)
where AT is .the total area under the chromatogram, R = (B - IB)/(A - 7A); Wis the weight of the
internal standard divided by the sum of the weights of the sample and the internal standard (18);
A is the area of the internal standard chromatogram up to 700°C(1292°F), B is the area of the
sample chromatogram up to 700°C(1292°F); 1A is the area of the internal standard segment of the
internal standard chromatogram; and 1B is the area of the internal standard segment of the sample
chromatogram.
The weight fractions of different boiling point or carbon number segments were calculated

294
using to total chromatogram area according to Equation 2:
Wn= B^JLi
(16)
where Wn is the weight fraction of the sample eluted between carbon numbers n and n - 1; and B
is the area of the sample chromatogram up to a given carbon number.
The chromatograms of the Whiterocks and PR Spring bitumens are presented in Figures
76 and 77. Chromatograms of the sample plus the internal standard are also shown in Figures 76
and 77. The chromatograms indicate that even at high temperatures, negligible column bleed was
observed. It should be noted that C^, which has a boiling point of 700°C(1292°F), elutes at
around 35.5 min. Thus, the procedure essentially divides the sample chromatograms into boiling
point fractions up to 35.5 min plus a non-eluted fraction that boils above 700°C(1292°F). It
should be noted that packed columns (instead of capillary columns) are employed in ASTM
D5307, and the technique extends only to a boiling point of 538°C. The differential and
cumulative boiling point distributions of the Whiterocks bitumen are shown in Figure 78. A
comparison of the amounts of the 538°C(1000°F) plus fractions of the bitumens, as determined
by the conventional D5307 analyses, and the 700°C(1292°F) plus fractions, as determined by the
procedure reported herein, is presented in Table 22. The Whiterocks bitumen has a
538°C(1000°F) plus fraction of 53 wt%'and a 700°C(1292°F) plus fraction of 20 wt%. Thus,
by using the technique described in this paper, it was possible to characterize (within the limits
of simulated distillation analysis) 80 wt% of the Whiterocks bitumen; that is, 33 wt% more than
would have been possible using ASTM D5307. Similarly, 89 wt% of the Asphalt Ridge bitumen

Whiterocks Bitumen Chromatograms
300000 -i
200000 -
c 01
(0 c O)
to 100000 -
0 10 15 20 25
Time, minutes
30 35 40
H
45
Figure 76. Chromatograms of Whiterocks Bitumen

300000 -r
250000 --
200000
£ 150000
c O)
100000 -
50000 -
0
PR Spring Bitumen Chromatograms
10 15 20 25
Time, minutes
30 35 40 45
Figure 77. Chromatograms of PR Spring Bitumen

Whiterocks Bitumen Boiling Point Distribution
a o
2
bl) • > • «
(U
S3
800
Time, minutes
I r
1000 1400
o
2
W) • PM
•I 1
S3 U
Figure 78. Boiling Point Distribution of Whiterocks Bitumen

298
Table 22
Comparison of the Extended Method Results
Samples Weight Fraction
1000°F+ 1292°F+
Whiterocks Bitumen 0.53 0.20
Asphalt Ridge Bitumen 0.45 0.11
PR Spring Bitumen 0.54 0.21
Sunnyside Bitumen 0.59 0.27
Whiterocks Extract 0.08 0.0
Asphalt Ridge Extract 0.16 0.0
PR Spring Extract 0.12 0.0
Sunnyside Extract 0.18 0.0
Whiterocks Residue 0.88 0.58
Asphalt Ridge Residue 0.87 0.61
PR Spring Residue 0.86 0.59
Sunnyside Residue 0.87 0.61
V

299
(34 wt% more than ASTM D5307), and 73 wt% of the Sunnyside bitumen (32 wt% more than
ASTM D5307) were characterized by the proposed method. In general, it was possible to
characterize approximately one-third more of these heavy oil samples than would have been
possible by conventional ASTM analyses. The distillation cuts, thus obtained, for the four
bitumens are presented in Table 23.
If an oil contains a small amount of material boiling above 538°C(1000°F), it should be
possible to characterize 100% of the sample using the proposed method. This is illustrated using
the proposed method. This is illustrated using the extract phases obtained by the SFE of four
bitumens with propane. The chromatogram for the extract phase from the Whiterocks bitumen
is shown in Figure 79. Analyses with internal standard (analogous to those described in the
previous paragraph) for these extract samples revealed that these extracts did not contain any
hydrocarbon heavier than C^. The 538°C(1000°F) plus weight fractions of the Whiterocks,
Asphalt Ridge, PR Spring, and Sunnyside extracts were 0.08, 0.16, 0.12, and 0.18, respectively.
However, all four extract phases were totally eluted with the upper boiling point of
700°C(1292°F). Thus, the procedure developed in this paper allows for complete characterization
of samples that consist of relatively small fractions boiling above 538°C(1000°F). The boiling
point distribution of the extract phase from Whiterocks bitumen is shown in Figure 80.
The method can also be applied to extremely heavy petroleum residue. Residual fractions
of the four bitumens recovered after SFE with propane were used to illustrate this point.
Approximately 90 wt% of each of these residues boiled above 538°C(1000CF), as shown in Table
22. The extended SIMDIS technique helped characterize 42 wt% of the Whiterocks residue, 39
wt% of the Asphalt Ridge residue, 41% of the PR Spring residue, and 39% of the Sunnyside
residue (Table 22). Thus, the technique permitted the characterization of an additional 30 wt%

300
Table 23 Distillation Cuts for Four Bitumens Analyzed
ASTM D5307 Volatility (<538°C), wt%
Distillation cuts (wt%) < 204°C 204 - 344°C 344-538°C
> 538°C
Modified SIMDIS proced Volatility
(<538°C), wt% Distillation cuts (wt%) < 204°C 204 - 344°C 344 - 538°C
538 - 700°C > 700°C
Whiterocks
46.6 *
0.5 7.4
38.7 53.4
ure
46.6
0.5 7.4
38.7 33.0 20.0
Bitumen Source Asphalt Ridge
53.5
1.3 11.8 40.4 46.5
53.5
1.3 11.8 40.4
34.0 11.0
PR Spring
45.4
0.4 8.2
36.8 54.6
45.4
0.4 8.2
36.8 33.0 21.0
Sunnyside
40.9
0.6 7.8
32.5 59.1
40.9
0.6 7.8
32.5 32.0 27.0

301
Figure 79.
Chromatograms for the Whiterocks Bitumen Extract Phase

(0 © 3 C
0)
E l -
Ajisuejui |BU6IS

303
Figure 80.
Boiling Point Distribution for the Whiterocks Bitumen Extract

c .2 +3 O CO i -
u. CD
75 c
0)
Q
0.1
0.08 -
0.06
0.04
0.02
0 • I I I I I I u I i—i i i I i i i i I . I t i _ j i • • J i I***T-
0.8
0.6
0.4
0.2
0 300 400 500 600 700 800
Boiling Point, K
900 1000
o c 3 c 0)
< fl>
ro <5* rr
"n 0)
o 5' 3
ui o

305
of the residual fractions. The chromatograms of the Whiterocks bitumen residual fraction and the
boiling point distributions are presented in Figures 81 and 82, respectively. The carbon number
distributions for the Whiterocks, Asphalt Ridge, PR Spring and Sunnyside bitumens and their
saturates, aromatics and resins fractions are presented in Figures 84 through 87.
Summary and Conclusions
Boiling point distributions up to 700°C(1292°F) and an estimate of the 700°C(1292°F)
plus fraction for the ultraheavy oils can be obtained using capillary columns with high phase
ratios. Applicability of this technique was demonstrated using ultraheavy oils (bitumens) from
the Uinta Basin in Utah, which had volatilities (538°C minus fractions)of 55 wt% or less. The
method allowed for the characterization of 30-35 wt% more of the bitumen and bitumen residual
fractions obtained by SFE than would have been possible using the ASTM D5307-92 method.
Characterization of extract phases with volatilities of 90 wt% was also demonstrated.

306
Figure 81.
Chromatograms for the Whiterocks Bitumen Residual Fraction

300000
250000
200000-(0 c 0)
£ 150000
c en 100000
50000
653 K 8̂.75 mln
12 K/mln 313 J"
4.5 mln Column : Petrocol EX2887 from Supeico, li]ic.
Carrier Gas : He at 20 cc/min
Sample + Intemal Standard Sample
i—i—i—i—I—i—i—n—I—i—i—i—i—r~i—i—i—i—I—i—i—i—i—i—i—i—i—i—i—i—;—i—i—i—i—n—i—i—i—i—i—r T 0 10 15 20 25 30 35 40 45
Time Minutes
U)
o

308
Figure 82.
Boiling Point Distribution for the Whiterocks Bitumen Residual Fraction
309
Cumulative Weight Fraction
in o
L_ an o
•
o
o CO
d CM
d i i
_i i i_ i
o o
I
CO o o
J I L. I
C\J o d
c o Q.
0>
c
o CD
uoj;oeJd mBiayw WV&&UIQ

310
Figure 84.
Carbon Number Distributions for the Whiterocks Bitumen and the Saturates, Aromatics and Resins Solubility Fractions

311
1-
0.9-;
0.8-
§0.7-1 O to
£0.6-JZ o "3 0.5-
5 0)
£0.4-•2 3 | 0.3-o
o ^
0.1-
0-
•
0
•
X
Saturates
Aromatics
Resins
Whiterocks Bitumen
• • • • • •
X "
x ° • • X u •
0 A *
• X 0 • * x o - •
o •
• o x o •
• x o •
• * • * • * 10 20 30 40 50 60 70 80 90
Carbon Number

312
Figure 85.
Carbon Number Distributions for the Asphalt Ridge Bitumen and the Saturates, Aromatics and Resins Solubility Fractions

Cumulative Weight Fraction
M O
CO O
o 0)
o 3
z C
3 (D
O
O
o
CD
o
( 0 o
o _ I _
o o in
p bo
_ 1 _ Ni
o x O X
- * > X • O • X » O » X • o •< • O 1 • o • o • o • o • o
>•
X
* rr 0) ?p ;o Q.
(Q CD 0) !=S--
c 3 n> 3
•
70 CD
5'
o
5-o 3 Eft
8
• CO
3 CD 0)
X
X X
• o • o • o • o • o • o • o • o • o • o
• o • o • o • o • o • o • o • o •o •o •o •o •o 4 0 •o •o
•o K>
X X X X X X
X X
X - X -
00

314
Figure $6.
Carbon Number Distributions for the PR Spring Bitumen and the Saturates, Aromatics and Resins Solubility Fractions

315
0.9-
0.8-
cO/M a o (0 0.6-
"3 0.5-
5 = 0.4-|
3
E
0.2-
0.1-
• Saturates
o Aromatics
• Resins
+• PR Spring Bitumen
• • • • TT*
,9??X
p * ? 0 +
<s 6
+ o + + °
+ o + o
+ o
• + o ^ * # + o •
l l f t t O +. • ©
• ' • I • : I ^ H
10 20 30 40 50 Carbon Number
60 70 80 90

316
Figure 87.
Carbon Number Distributions for the Sunnyside Bitumen and the Saturates, Aromatics and Resins Solubility Fractions

Cumulative Weight Fraction
O
W O
o 3 2 c 3 o, cr o fl>
o
o
00
o
o
p p p p o o o p p Li. KJ co '*. en b> ^ i bo io •
* * . . • . i . . . . i t . . . i . • t . i . t t t i—i i i i—i—i—• • • i . . . . i . . . .
+ i + » + • o •• • o + •
• o + • • o + • • o + • • o + •
• o + • o +
• o + • o +
• o -t • o
• o • o
• o • o
• o
+ CO c
»< a. a> CD r-t*
c 3 CD 3
•
•Xi CD 2.
o
> J3
3 a> 8
• CO u ff a> #-•• CD V)
o + o +
o + o +
o + o +
o + o +
o + • o +
o + o +
o + o+
a-
318
FLUIDIZED BED PYROLYSIS OF OIL SANDS IN A THREE-INCH DIAMETER FLUIDIZED BED
Principal Investigator: F.V. Hanson Co-Principal Investigator: J.V. Fletcher Graduate Student: Qiming Tang
INTRODUCTION
Because of the special properties of oil sands, these materials cannot be recovered by
conventional petroleum reservoir production techniques. The lack of sufficient reservoir energy
and the viscous nature (> 10,000 cp) of the reservoir fluid prevents movement through the
formation to a production well (97). Also, the unconsolidated structure of oil sands deposits
means that conventional underground mining methods, such as the room-and-pillar technique for
mining of oil shale and coal cannot be used (98).
The methods used for the recovery of heavy oil from oil sand can be classified into two
broad categories: in-situ recovery techniques and surface mining-recovery processes. The oil
sands recovery method of choice is determined by cost, recoverability, and bitumen content.
In-situ processes recover bitumen-derived heavy oils from oil sands reservoirs by thermal
and/or chemical means. The mobilized reservoir fluid is lifted to the surface for subsequent
processing and upgrading. Typically thermal in-situ recovery techniques include steam injection,
partial combustion, and combustion (99, 100). The costs associated with surface mining of oil
sands are related to the thickness of the overburden which must be stripped to expose the oil
sands. Generally, an overburden-to-pay zone ratio less than or equal to unity is required to justify
a surface mining-recovery operation (101). Surface mining recovery processes involve open pit

319
mining of the oil sands ore at the surface followed by extraction and upgrading of the bitumen and
disposal of the coked sands. In-situ recovery schemes can be employed where surface mining is
not economically feasible.
Mining Surface Oil Sands Recovery Technologies
Surface recovery technology is the dominant method applied for the recovery of
hydrocarbon values from oil sands (98). Surface recovery schemes include open pit mining of the
oil sands, transportation of the ore from the mine site to the processing plant, and extraction and
upgrading of the bitumen. The surface recovery of oil sands can be classified into two distinct
categories. The first involves the use of water or solvents or a combination of both to separate
the bitumen from oil sands (102, 103). The second category includes the various thermal
processes used to produce bitumen-derived heavy oils from oil sands. The thermal processing of
oil sands is carried out in a nonoxidizing environment (104, 105). The liquid products are
upgraded and are of a higher quality than the bitumen recovered by aqueous separation or solvent
extraction. The feasibility of an individual surface mining-recovery process is subject to economic
constraints related to the pricing of conventional crude oil.
Thermal Processing Recovery Technologies
Surface thermal processing methods involve the heating of the mined oil sands to high
temperatures (usually around 723 to 823 K) in a nonoxidizing environment (106). The high
molecular weight hydrocarbon species in the bitumen undergo thermal decomposition reactions
to form low molecular weight (about 370 to 500) compounds which volatilize to form gaseous and
liquid products at high temperature. Simultaneously, a portion of the bitumen is polymerized to
form a carbonaceous residue or coke. Thus pyrolysis of oil sands is a molecular weight reduction
process. The liquid products produced during pyrolysis are of higher quality than the bitumens

320
obtained by solvent extraction processes. The terms flash distillation, pyrolysis, retorting,
cracking, volatilization, destructive distillation, coking, and carbonization are frequently used
interchangeably in discussing this process. The thermal process recovery methods can be
classified into two general groups, direct heating and indirect heating, depending on whether the
pyrolysis and combustion steps are carried out in one or two reactors. The thermal processes can
further be subdivided into fluidized bed and rotary kiln reactor systems.
Huidized bed pyrolysis was initially investigated by Gishler (107), in which fluidized bed
technology was applied successfully to the flash distillation of oil from Alberta oil sands on a
laboratory scale. The oil recovered represented 76 wt% of the bitumen fed to the reactor. A pilot
plant reactor was developed and operated based on this process (108). The liquid yield for the
pilot plant was over 80 wt% based on the bitumen fed. The Lurgi-Ruhr gas process has been
adapted to the pyrolysis of oil sands (109). The process included the recirculation of clean,
burned sand as a heat carrier. The oil yield was reported to be above 90 wt%. A direct heating
process with pyrolysis and combustion in a single unit has also been investigated. In this case, the
liquid yield was in excess of 83 wt% at a pyrolysis temperature of 744 K (110).
Rotary Kiln Pyrolysis Process
The. rotary kiln process is an alternative to the fluidized bed pyrolysis process for the
production of bitumen-derived heavy oils from oil sands. A single rotating vessel for the recovery
of bitumen from oil sands was developed and patented (111, 112). Hanson et al. (113) studied
pyrolysis of the Whiterocks oil sands in a rotary kiln reactor. The influence of process variables
on the product distribution and yields was investigated. The trends reported for the effect of
reactor temperature and solids retention time were similar to those reported for fluidized bed
pyrolysis of the Whiterocks oil sands in laboratory scale reactors (114). A maximum liquid yield

321
of 69 wt% relative to the bitumen fed was achieved at a kiln temperature of 798 K and a solids
retention time of 10 min (105).
Fluidized Bed Pyrolysis Process
Two-stage fluidized bed pyrolysis process studies have been conducted at the University
of Utah (115-118). The process involved two units: a fluidized bed pyrolysis reactor and a coked
sands combustion reactor. The oil sands were fed to the top of the upper pyrolysis reactor and
underwent pyrolysis to produce a bitumen-derived heavy oil. The coked sands were transferred
to the lower combustion chamber where the coke was burned. Heat was transferred from the
combustion chamber to the pyrolysis zone by potassium heat pipes. The potassium was vaporized
in the combustion zone and condensed in the pyrolysis zone. The results indicated that the liquid
yield increased as the temperature increased in the range of 713 to 773 K, and as the solid
residence time increased (117). Smart (117) reported that a maximum liquid yield would be
expected to be obtained at solid retention times of around 9 min.
Oil sands pyrolysis using fluidized bed processes have been investigated by Hanson and
co-workers (50, 51, 106, 114, 119-121). The process variables studied included reactor
temperature, fluidizing gas velocity, solids retention time, oil sands source, and alternate
fluidization. modes.
Prescreened oil sands were fed continuously from the discharge feeders located on top of
the reactors in the fluidized bed pyrolysis process studies. Oil sands particles fell directly into the
fluidized bed, and the bitumen underwent pyrolysis to form hydrocarbon vapors, gases, and a
carbonaceous residue on the sand particles. Vapor and gases were carried out by the nitrogen
fluidizing gas, whereas the coke remained on the sand surface. The coked sands were withdrawn
from the reactor by a solids control valve or a modified L-valve. The continuous flow reactor

322
systems were operated to maintain the bed hold-up constant. This was accomplished using a
differential pressure controller.
The yields of bitumen-derived liquids were primarily dependent on the pyrolysis
temperature and on the solids retention time which was determined by the oil sands feeding rate
and the bed hold-up. The liquid products decreased with increased pyrolysis temperature and
increased with decreased solids retention time. The total liquid yields and product distribution
appeared to be independent of the fluidizing gas velocity in the range of velocities investigated.
The amount of bitumen converted to coke on the sand was relatively insensitive to process
variables; however, it was dependent upon the source of the feed sands. Most of the oil sands
exhibited maximum total liquid yields at pyrolysis temperatures in the range 773-798 K.
It was concluded from these oil sands pyrolysis investigations (50, 51, 106, 114, 119-121)
that the most important pyrolysis process variables were the pyrolysis temperature and the solids
retention time. Temperature appeared to be more significant than the solids retention time in
deterrnining the product distribution and yields and the quality of the total liquid products (104).

323
EXPERIMENTAL APPARATUS AND PROCEDURES
The fluidized bed reactor (FBR) oil sands pyrolysis system was a laboratory
scale, continuous flow reactor. The apparatus consisted of a fluidized bed reactor, an
oil sands feeder, an electric furnace, a solids withdrawal L-valve, liquid recovery
condensers, and measurement and control instrumentation. The unit will be described
in detail in this chapter.
Fluidized Bed Experimental Apparatus
Fluidized Bed Reactor Pyrolysis Apparatus
Schematics of the fluidized bed reactor when operated in the push and pull
fluidization modes (121) are presented in Figures 88 and 89, respectively. Nitrogen
was used as the fluidizing and purge gas in all pyrolysis experiments. The fluidizing
gas was preheated and evenly distributed in the windbox and passed through the gas
distributor into the pyrolysis zone. The purge gas flowed continuously through the
coked sands receiver. The purpose of maintaining a positive purge gas pressure in the
coked sands receiver was to prevent air leaks and the combustion of the carbonaceous
residue on the coked sands.
The reactor was loaded with screened coked sands at the beginning of each
experiment. The amount was established by the ratio of the intended height of the
settled bed to the reactor diameter (H/D). The appropriate H/D ratio had been
previously determined in the preliminary fluidization studies conducted with the coked
sands. The reactor temperature was raised to the desired pyrolysis temperature, and the
coked sands were fluidized to establish hydrodynamic and thermal stability in the bed.
The oil sands feed was introduced into the reactor stepwise by increasing the feeder
speed in increments until the desired feed rate was obtained. _ Oil sands were fed
continuously at the top of the reactor and dropped through the expansion chamber into
the fluidized bed due to gravity. Once a steady state condition was attained, data

324
Figure 88.
Schematic of the Fluidized Bed Reactor Pyrolysis Push Mode

325
Auger and Discharge Chamber w/ Water Jacket
Oil Sands Feeder
Motor and Gear Box
Feeder Speed
Control
FBR
L-Valve
M
Reactor Furnace
f
s»
M *To Vent
ti
( D P C )
Liquid Recovery System Condenser/Strainers
-&5H Compressed Air
104 kPa
€Z*3. t
Mass Flow Meter
*
M
* r\
Coked Sands Receiver
DPC Actuator
N2 Cylinder
; Temperature Measurement

326
Figure 89.
Schematic of the Fluidized Bed Reactor Pyrolysis Pull Mode

327
Auger and Discharge Chamber w/ Water Jacket
Feeder Speed
Control
N2 Pressrue
Surge Tank
: Temperature Measurement

328
logging was started and the run initiated. Initial liquid, solid, and gas samples were
collected at the start of the steady state operation.
The fluidized bed hold-up was maintained at a constant value by a solids
withdrawal L-valve. The differential pressure drop across the bed was monitored and
controlled. Pressure taps were located at the exit of the disengager and in the windbox
underneath the gas distributor. When the differential pressure exceeded the set-point, a
signal was sent to an actuator which caused the nitrogen to flow into the L-valve and
coked sands were withdrawn from the reactor. Since the pyrolysis reaction is an
endothermic reaction, thermal energy was supplied to the reactor by means of an
electrical furnace which had four separate heating zones.
The mixture of coked sands and oil sands.in the reactor were fluidized by
preheated nitrogen, and the bitumen was pyrolyzed. The heavy oil vapors and
entrained fine particles were carried out of the disengager into the liquid recovery
system. The entrained particles and liquids were separated in the recovery system, and
the liquids were withdrawn from the condensers. The liquid recovery system consisted
of a condensing pipe and two water cooled liquid filter-condensers in series. The
noncondensable hydrocarbon gases flowed through a transfer line and two water cooled
condensers. The condensate-free gas was sampled and vented to the stack.
Fluidized Bed Reactor Assembly
Fluidized Bed Reactor
The fluidized bed reactor was fabricated from 304 stainless steel with a flange
welded to each end. The reactor consisted of the main body, the windbox, and the
disengager sections. Main body section had a 7.62 cm inside diameter (ID) and was
76.2 cm long with a maximum throughput of 3 to 4 kg/h depending upon the individual
oil sands feedstock. The expansion chamber was intended to reduce the superficial gas
velocity above the bed which allowed fine particles to fall back into the bed. The

329
windbox was designed to preheat nitrogen to the pyrolysis temperature. The conical
gas distributor located between the fluidized bed and the windbox was intended to
evenly distribute the gas across the reactor.
A stainless steel ring, 7.62 cm ID by 11.43 cm OD and 0.95 cm thickness, was
welded to the reactor wall between the reactor and windbox sections. A 3 mm deep by
3 mm wide groove at a diameter of 8.89 cm was machined on the bottom side of the
ring. The edge of the distributor fitted into the groove to form a seal which prevented
by-passing of the fluidization gas.
Fluidizing Gas Distributor
Thirty-two evenly distributed holes, 0.16 cm in diameter, were drilled through
the 304 stainless steel conical gas distributor perpendicular to the surface. The holes
were drilled in a staggered pattern consisting of three sets of holes at different depths
in the cone: 14, 10, and 8 proceeding from shallowest to the deepest set (see Figure
90). The holes provided a nominal open surface area of 1.4 % based on the reactor
cross-sectional area. The gas distributor, sand withdrawal pipe, and bottom flange
were welded into one piece. The sand withdrawal pipe was 2.54 cm ID with standard
pipe threads. Thus the height of the gas distributor could be adjusted. The distributor
was installed in the reactor and adjusted to fit into and seal the groove. Also, a flexible
graphitic packing material which could withstand 3033 K under nonoxidizing
conditions from Palmetto was used as a sealant between the edge of the distributor and
the groove machined into the interior ring. The bottom flange had a nitrogen inlet
fitting (0.64 cm ID) and three NPT fittings (0.32 cm ID) for control and monitoring of
temperatures and pressures.
Oil Sands Feeding System
The oil sands feeder was a standard commercial bin discharge feeder
manufactured by Acrison, Inc. A schematic of the feeder and the control system has
been presented by Hanson et al. (122). The original Acrison Model BDF-l-C/2 feeder

330
Figure 90.
Schematic of the Gas Distributor for Fluidized Bed Reactor

331
Nitrogen
Fluidized Bed Reactor
Gas Distributor
Windbox and Preheater
Temperature and Pressure Tap
HI Solids Withdrawal Stand Pipe

332
was equipped with a C-auger. The standard C-auger plugged because of the unique
feeding characteristics of oil sands. The feeder was modified by increasing the auger
diameter and by reducing the length of the auger. An E-size auger was used to
eliminate the tendency of the oil sands to fill the gap between the auger and auger
housing and to maintain constant feed rates. The length of the discharge cylinder was
reduced from 45.72 to 30.48 cm and the auger housing was equipped with a water-
cooled jacket (Figures 88 and 89).
A 10.16 cm long and 10.16 cm ID heat resistant rubber clamp was used to
connect the reactor and the feeder downspout to reduce heat transfer from the pyrolysis
reactor to the feeder. .The water jacket was used to maintain the auger housing
temperature below 290 K.
The feeder specifications were as follows:
• Acrison bin discharge volumetric feeder Model BDF-l-E/2, SN 91380-1.
• Digital variable speed SCR/DC controller Model 050-1A operatingrange of
0-99.9 %.
• 373W DC motor.
• 0.0286 m3 feed hopper.
The auger was a stainless steel solid shaft. The discharge cylinder was equipped
with an auger end bearing and a stainless steel 10.16 cm downspout. The discharge
downspout cover had two 0.64 cm NPT fittings equipped with feed-through were used
for temperature monitoring and control.
Gas Introduction System
The reactor was designed to operate in a non-oxidizing inert gas environment at
atmospheric pressure and at temperatures up to 823 K. Cylinder nitrogen was used as
the fluidizing gas, aeration gas, and purge gas in all the experiments. A mass flow
meter from OMEGA, Model FMA-5611, and a Whitey needle valve were to monitor
and control the flow rate of fluidizing gas, respectively. Aeration nitrogen to the L-

333
valve was regulated by two Matheson flow meters, Model 1050, with 0-7.5 LPM flow
tubes and aluminum utility valves. The flow meters were connected to an air-to-close
Type 78S control valve supplied by Research Controls with an M-trim and a 21 to 103
kPa pressure range. The coked sands receiver was purged with nitrogen to prevent
spontaneous ignition of the carbonaceous residue on the coked sands withdrawn from
the reactor.
Compressed building air was used as the supply gas for the differential pressure
control unit. The line pressure was regulated to 207 kPa by a brass Whitey needle
valve and a Model 14R air regulator from Schrader Bellows.
Modified Solids Withdrawal L-valve
A schematic of the modified L-valve is presented in Figure 91. The coked
sands withdrawal system consisted of an L-valve and a solids receiver. The coked
sands were intermittently withdrawn from the bed to maintain a constant inventory in
the reactor. The L-valve was similar to that used for the 15.24 cm diameter fluidized
bed reactor (121).
The L-valve assembly was constructed from 2.54 cm ID 304 stainless steel
Schedule 40 pipe and cross and tee fittings. The length of the downcomer was 45.72
cm, and the horizontal section was 10.16 cm. There were two nitrogen injection ports
in this modified L-valve. The main aeration point was positioned at the center line of
the horizontal section behind the downcomer (Point A) and the auxiliary gas injection
port was located on the center line of the downcomer and below the horizontal pipe
(Point B). The purpose of the second injection port was to facilitate the withdrawal of
coked sands and to assist in the removal of large lumps, whenever the main injection
port (Point A) did not provide sufficient surge energy to purge coked sands from the
valve.
The coked sands receiver was a modified 30-gallon commercial barrel. The lid
of the drum had two 0.32 cm NPT half couplers which were used as a thermocouple

334
Figure 91.
Schematic of the L-valve and the Solids Receiver System

335
Nitrogen Injection Point A
A
n Nitrogen Injection
Point B
J jGas Vent iPurge Gas

336
feed through for temperature measurement and as the purge gas vent. The L-valve was
connected to the coked sands receiver by a 15.2 cm long 2.54 cm diameter flexible
pipe.
Process Control and Monitoring Instrumentation
The process variables, including temperatures, pressures, and flow rates of
gases and solids, were controlled and monitored during the course of an experiment.
Provision was made for both manual and automatic control.
Liquid Product Recovery System
The purpose of the liquid product recovery system was to condense the
maximum amount of liquids from the gas stream and to separate the entrained sand
particles from the liquid product. A schematic of the liquid product recovery system
for solids-liquids-gas separation is presented in Figure 92.
The recovery system included three components: the prestrainer trap to collect
heavy liquids and two liquid recovery strainers in series. The prestrainer trap was
made from 2.54 cm stainless steel pipe fittings with a 0.64 cm NPT Speedy valve for
withdrawal of condensed liquids. Insulation materials were wrapped on the condenser
pipe to maintain a constant temperature.
The product vapors were carried along with the nitrogen sweep gas as it passed
through the prestrainer trap into the first liquid collection strainer which had been
fabricated from modified high pressure water purifiers. The perforated stainless steel
strainer was 8.89 cm in diameter and was 45.72 cm long with an open area of 58%.
The inner strainer screen and its cover were connected by a twist pin lock and sealed by
an O-ring gasket. The liner of the cylinder was a 200 mesh stainless steel screen
which functioned as a solid-liquid-gas separation device. The second strainer was fitted
with two Rosedale 10.16 cm diameter 25 micron prewetted multifilament polyester
bags to capture the fine oil mist present in the gas stream after the first strainer.

337
Figure 92.
Schematic of the Liquid Recovery System

338
Prestrainer Trap
Strainer #1 Strainer #2

339
The vapor product stream passed into the strainer, penetrated the screen and
passed out through the outlet. The entrained solid particles were retained inside the
screen and the mist condensed to form the liquid product after penetrating the screen.
The liquid accumulated at the bottom of the first strainer. The second strainer filter
had two 25 micron prewetted filter bags which adsorbed almost all of the light liquids
at room temperature. Both strainers had bottom drain valves for liquid removal. The
chromatographic analysis indicated only trace amounts of C5 hydrocarbons were
present in the vented gas stream.
Electrical Furnace
The thermal energy required for the oil sands pyrolysis reaction was provided
by a 14 kW four-zone electrical furnace Model M-5048-S-V manufactured, by
Lindburg. The furnace, had four separate heating zones which could be controlled at
different temperatures as required. The furnace was powered by four two-phase 20A
240V AC circuits. The silicon carbide heating elements were wrapped thermal
resistant wires. Each of the power circuits was controlled by a temperature controller
and a solid state relay. The power supply wiring to the furnace and control panel were
installed by University of Utah Campus Utility Services.
Bed Height Determination
The bed height was an indirect measurement; that is, it was determined by the
bed' hold-up divided by the coked sands packed density and the reactor cross-sectional
area. The particle bulk density was determined by placing a weighed amount of coked
sands into a 10.2 cm ID transparent glass column and measuring the height of the
sands. The particle bulk density was obtained by the weight of the sands loaded into
the column divided by the volume it occupied. Using the particle bulk density, the
reactor cross-sectional area, and the weight of sands loaded into the reactor the settled
bed height was calculated from the following relationship:

340
H = - ^ (17) P b k A
The bed height was usually expressed as a dimensionless parameter of H/D,
which is the ratio of the bed height to the reactor diameter.
Stepwise Oil Sands Feeding During Pyrolysis
A typical feeder speed pattern (QTPRS05) is shown in Figure 93. After the
fluidized bed reactor was loaded with 1750 g screened coked sands and the desired
temperature (i.e., 773 K) was established in the settled bed, fluidizing gas was
introduced into the reactor at 10 LPM. The pressure drop across the bed gradually
built up. Steady state fluidization was usually attained after 20 minutes with the bed of
coked sands. The bed temperature did not exhibit significant fluctuations during this
period. Oil sands feeding from the Acrison feeder was started after stable fluidization
was achieved at the desired temperature and fluidization gas flow rate. Oil sands feed
rates were increased to the desired level in step increments. Normally, a higher oil
sands feed rated required a longer time to reach steady state. Once a steady state
condition was attained, the motor speed set point was once again incrementally
increased. The temperature and differential pressure of a typical steady state condition
(QTPRS05) were 773±3 K and 2.27±0.06 kPa. The operating parameters indicated that
the system had the capacity to supply sufficient energy for the pyrolysis of oil sands at
all the feed rates investigated. The differential pressure control and solids withdrawal
system were continuously monitored, and coked sands were intermittently removed by
means of the L-valve.
Product Analysis Methods
The pyrolysis products of the PR Spring oil sands included the total liquid
product, the C1-C4 light hydrocarbon gases, and a carbonaceous residue on the spent

341
Figure 93.
Schematic of Stepwise Oil Sands Feeding Method

342
2.5-
eo e «s e£ 1.5-"3 t u <*. o
"O
c i VI I -
o o s
0.5-
Beginning of Steady State Sampling
Begming of Oil Sands Feeding
OHI-
50 100 150 200 250 Pyrolysis Operating Time, min.

343
sands which is also referred to as coke. The mass balance calculations were based on
the bitumen fed to the reactor. An experiment was considered successful when the
bitumen mass balance was over 90 wt%. Experiments were rejected when the mass
balance was less than 90 wt%.
Gas Sample Analysis
The pyrolysis hydrocarbon (HC) gases leaving the liquid recovery systems
contained mainly nitrogen and small amounts of hydrocarbon gases ranging from C, to
C6. The HC gas species were identified and quantified using a Hewlett Parkard 5890A
gas chromatograph equipped with a thermal conductivity detector (TCD) and a
microprocessor. A 80/100 SUPELCO chromsorb 102 column (3.18 mm diameter by
6.1m long) was used for gas separation in this investigation. Helium was used as both
the carrier and reference gas. The recommended carrier and reference gas flow rates
were 20 and 30 ml/min, respectively, and the inlet pressure was 6.80 kPa. The
hydrocarbon species thermal response factors for the TDC were determined and
calculated by the method proposed by Dietz (123) and Rosie and Barry (124). The
actual response factors for this investigation were obtained from Tang (125) and Nagpal
(106). The HC gas analysis was conducted in two steps to compare the relative ratios
of each species. The low sensitivity signals were sent to an IBM-XT computer with
data acquisition software and were used to obtain the relative ratio of nitrogen and
methane. At high sensitivity, the nitrogen peak was off the integrated range, but the
relative amounts of all low concentration species were quantified. The Visualized GC
software collected and integrated each hydrocarbon peak. The fractions of each
individual compound were computed by combining data for the two-step analyses.
Coke and Extractables Analysis
The coked sands samples from each pyrolysis experiment were prepared by
cone and quartering the coked sands collected in the sands receiver and the reactor
during the experiment (126). The coke content was determined according to the

344
method reported by Wang (114) and Shun (120). Two crucibles which contained 2 g
coked sands samples were placed into a muffle furnace at 823 K for 16 hours,
transferred to a desiccator, and cooled to ambient temperature. The crucibles were
weighed and the total combustibles were determined by difference. The crucibles were
removed from the dessicator and weighed every 2 hours until the second decimal did
not change.
A 20 g coked sands sample was charged to a tared thimble and put into a
vacuum dryer overnight at 378 K at the same time. The sample was removed from the
dryer and weighed every two hours until the second decimal did not change. The
weighed thimble containing the coked sands sample was placed in a Soxhlet extraction
apparatus and extracted for 48 hours using toluene as a solvent. The thimble was
placed into the vacuum dryer overnight and dried at 378 K to evaporate the residual
toluene. The toluene extractables were determined by difference. The coked sands
withdrawn from the reactor was checked for toluene extractables to ensure correct
reporting of the product distributions and bitumen mass balances. The amounts of
toluene extractables in this investigation were generally negligible; that is, no
measurable quantities of extractables were detected using a five decimal place analytical
balance.
Liquid Product Analysis
Selected physical and chemical properties of the bitumen and the pyrolysis
liquid products were determined. The properties included simulated distillation;
specific and API gravities; viscosities; Conradson carbon residues and ash contents;
pour points; C, H, N, and S elemental analyses; nickel and vanadium metal contents;
and molecular weights. The analytical methods used to determine the properties of the
samples were adopted from the ASTM standard methods and the Syncrude Analytical
Methods (127). The elemental, metals, and molecular weight analyses were performed
by Galbraith Laboratories, Inc., Knoxville, Tennessee.

345
Bitumen Mass Balance Calculation
The pyrolysis runs using the PR Spring oil sands feed were carried out in a
laboratory scale fluidized bed reactor system. The mined oil sands ore was crushed and
screened through a 0.32 cm sieve and air dried in a 1.8 m by 3.0 m rectangular
polyethylene box prior to being loaded into the feeder storage bin.
Mass balance calculations included the bitumen-derived heavy oil yield, the Cl-
C4 hydrocarbon gas yield, and carbonaceous residue yield. The calculations reported
were based on a bitumen saturation of 10 wt% water-free basis which was determined
by Soxhlet extraction of a cone and quarted sample over a 48-hour period using toluene
as a solvent.
Material balances ranged from 90 to 110 wt% based on bitumen fed to the
reactor. The best mass balances obtained were 100 wt%. If the mass balance was not
100 wt%, the yields were normalized to 100 wt%.
Product Gas Analyses and Yield Calculations
The qualitative and quantitative analyses of the product gases were determined
using a Hewlett-Packard 5890A gas chromatograph. The molar ratios are the same as
the volume ratios for the gaseous compounds. The computation of the amount of each
compound was based on the nitrogen flow rate. The assumption was made that all
nitrogen present in the process gas was from fluidizing gas. Also, it was assumed that
a negligible amount of hydrogen gas was produced during the process; thus the product
gas yields were reported on a nitrogen and hydrogen free basis.
Since nitrogen was used as an inert gas, its flow into the system equaled its flow
out of the system; thus it was treated as an internal standard for the calculation of
product gas composition. The following equations were used to determine the weight
of each compound in the gas stream based on the steady state samples taken during the
pyrolysis process.
The quantitative analysis for the Ci to C6 yields were calculated as follows:

346
Mass ratio (MR) calculation
M R = ( ^ W ^ - ) H S = ^ (18>
Mass of a single gas specie
M g = T s x V s w x ^ I L x M R x M W i (19)
where MR is the nitrogen to specie i mass ratio based on the integrated area; A is the
integrated area which was corrected by compound response factors; LS and HS indicate
the low sensitivity and high sensitivity chromatographs, respectively; Tss is the total
steady state sample collection time, min; V is the nitrogen volumetric flow rate, LPM;
T is the temperature, K; MW is the molecular weight, g/mol; and STP is the standard
temperature and pressure of 273.15 K and 1 atm.
The hydrocarbon gas and coke yields in the bitumen mass balance were assumed
to represent 100% recovery in the process. Thus, the losses were presumed to be
liquid products. Some of the hydrocarbon vapors may have condensed in the section
intended to isolated the feeder downspout from the reactor expansion chamber (Figure
88).' It is possible that a portion of the vapor products condensed on the wall in that
section. This would result in a loss of liquid products and a low mass balance.
Solids Retention Time Calculation
Oil sands feed rate was computed based on the coked sands produced during the
mass balance period. The coked sands production rate was calculated by weighing total
coked sands produced during the mass balance period of the experiment divided by the

347
duration of the run. Bed hold-up was indirectly determined by averaging the bed hold
up in the reactor before or after the experiment.
wL= 1000 5 F 4633.7/121 v J
where s is the solids retention time, min; Wb is the bed hold-up, g; and F is the oil
sands feed rate, g/min.

348
RESULTS AND DISCUSSION
Although the fluidized bed process has been adopted to the pyrolysis of Utah oil
sands, a series of equipment and operating problems had always been associated with
this process. The problems included plugging of oil sands feeder, clogging of solids
withdrawal valves, slugging of the bed, and loss of liquid products from the recovery
system (50, 51, 114, 119, 120). A 15.2 cm diameter fluidized bed reactor system was
designed and tested by Fletcher (121). The system was operated successfully in oil
sands pyrolysis studies with the Whiterocks oil sands (121) and the PR Spring oil sands
(106). Acrison dry-materials feeders provided reproducible oil sands feed rates (122).
The L-valve used as a solids withdrawal device solved the solids removal problem
(121). A novel pull fluidization mode eliminated bed slugging (121).
A 7.62 cm diameter reactor was used to investigate the continuous fluidized bed
pyrolysis of the PR Spring oil sands under regular fluidization conditions. The
objective was to investigate reproducible oil sands feeding with a small Acrison feeder,
to evaluate the performance of an intermittent solids discharge L-valve on a small
diameter fluidized bed reactor, to develop an effective liquid products recovery system,
and to conduct a process variable study with the PR Spring oil sands. The fluidization
studies included fluidization and defluidization experiments with Group B sands (128),
an investigation of the fluidization characteristics of the bed under different fluidization
modes, determination of the minimum fluidization velocity at elevated temperatures,
and determination of the performance of the tapered gas distributor during fluidization.
The pyrolysis process variable study with the PR Spring oil sands ore was intended to
determine the influence of reaction temperature and feed sands retention time on the
product distribution and yields and on the total liquid product quality. The results of
these studies are described in detail in this chapter.

349
Coked Sands and Oil Sands Feeding
A Model BDF-1 commercial bin discharge dry-materials feeder from Acrison was
used in the oil sands feeding study and as the oil sands feeder in the process studies.
The feeder was capable of having the auger and auger housing changed. Thus
variations in auger size and type and in the discharge cylinder could be studied.
Oil sands are silica particles coated by a viscous hydrocarbon, called bitumen. The
rheological characteristics of the bitumen-impregnated sandstone changes as it is
transported through the screw feeder. A coating of compacted oil sands formed on the
feeder auger and the inner wall of the discharge chamber in the laboratory scale and
semipilot plant scale oil sands pyrolysis studies (119, 120) due to shear and factional
forces. The feed rates decreased with time, and eventually the discharge chambers
were plugged by the oil sands mixtures. The plugging problem was temporarily solved
by using a feed that consisted of oil sands premixed with coked sands produced in the
previous pyrolysis experiments (51, 105, 118). However, increasing the sand content
of the feed mixture reduced the average bitumen content and increased the sensible heat
requirement for the sands in the reactor. The objective in this investigation was to
develop the ability to feed oil sands directly to a small diameter reactor without
diluents.
Coked Sands Feeding Study
The initial feeder studies were conducted with spent coked sands. The coked sands
used were produced from the previous fluidized bed pyrolysis study with the
Whiterocks oil sands (119). The coked sands consisted of the sand granules coated
with a carbonaceous residue and were nonsticky, free flowing materials similar to
regular sand grains.
The coked sands calibration curves using a C-auger are presented in Figure 94.
These curves indicated that the Acrison BDF-1 feeder gave linear and reproducible
feed rates over the complete range of motor speeds when handling dry materials. The

350
Figure 94.
Feeder Calibration Curves Using a Solid Flight C-auger with the Whiterocks Coked Sands

351
lOVJU —
1400-
00
- r i200-
>
1 1000-C/3
•a c cs 52 800-^
o
o 600-** J2 3
1 400-u
200-
0H
• 10% Full Range
• 30% Full Range
A 50% Full Range
• 70% Full Range
D 90% Full Range
n D
D • •
nn • *
a • A
° • A * . ,-, • A » • 3 A • • •
, 8 1 : : • • • • 1 • ' 1 1
•
•
A
•
• 1
•
•
•
•
•
n u
+
A
•
•
1
D
•
A
•
•
D
•
A
•
•
1
( ]
Q
< •
•
1 1
A
•
• II
Time, min

352
feed rates of coked sands can be determined from the slopes of the lines in Figure 94
for a given motor speed. The coked sands feeder studies demonstrated that the feeder
could successfully handle dry oil sands related materials.
Oa Sands Feeding Study
The mined and crushed ores from the Whiterocks and PR Spring oil sands deposits
were used for the feeder calibration-studies. The mined ore was crushed and screened
to provide particle size ranges below 6.4 and 3.2 mm for the Whiterocks and PR
Spring ores, respectively. The bitumen saturations for the Whiterocks and PR Spring
ores were 7 and 10 wt%, respectively. Samples were air dried for more than 30 days
to evaporate gravitational moisture.
As mentioned previously, the unique characteristics of oil sands caused unstable
feeding rates with laboratory scale screw feeders. The auger configurations (diameter,
shape, and length) were important factors affecting oil sands feeding. The auger
diameters increased according to the alphabetical sequence (C, D, E, F) in Table 24.
The void volume-to-surface area between the auger and the inner auger housing
increased as the alphabetic order. The surface area included the inner surface of the
cylindrical auger housing and the area on both faces of the auger flights. The void
volume included the cylindrical annulus between the outer edge of the auger flights and
the inside wall of the auger housing and the volume between the faces of auger flights.
TheC- and D-augers were classified as small size augers and E-and F-augers were
classified as large size augers for the purpose of this study. The C- and D-augers had
smaller gaps between the inner surface of the discharge chamber and the auger edge
than the E- and F-augers.
The C-auger also had a relatively smaller gap than the D-auger, which appeared to
cause the C-auger to plug more quickly than the D-auger. The plot of the cumulative
weights of Whiterocks oil sands fed with the C- and D-augers at various conditions are
presented in Figures 95 and 96, respectively. The tests for both augers indicated that

353
Table 24. Auger Specifications for Acrison BDF-1 Feeder
Auger C D E F F
Diameter, cm 0.95 2.54 3.49 4.45 4.45
Configuration solid flight solid flight solid flight solid flight
helical
Coating none none none yes none
Water Cooling ves yes yes none none
Length, cm 45.7 45.7 30.5 45.7 45.7
Testing Result failed failed
success success success
«

354
Figure 95.
Oil Sands Feeder Test Using a Solid Flight C-auger with the Whiterocks Oil Sands

355
50-
10-
4 5 -
40-eo
§ 3 5 -> Q 3 0 -01
"S « 2 5 -
O s>20-
g 15-
• 10% Full Range
• 20% Full Range
• 40% Full Range
Time, min

356
Figure 96.
Oil Sands Feeder Using a Solid Flight D-auger with Whiterocks Oil Sands

12-
357
10-
-o o 5
a
« 6 CO
5 4-
3
• 90% Full Range
• 50% Full Range
• 10% Full Range
Time, h

358
feeding ceased when the auger plugged. The results for both the C- and D-augers
indicated that neither was capable of feeding undiluted oil sands for a sustained period
of time at a constant rate. The feed rate of oil sands decreased with time and
eventually the auger plugged even though feeding persisted for a longer time with the
D-auger than with the C-auger. It was presumed that the smaller the ratio of the void
volume-to-surface area the greater the tendency for the auger to plug. When plugging
occurred oil sands were no longer delivered, although the auger was still rotating. It
was noted that the space between the auger surface and the inner wall of discharge
chamber was filled with compacted oil sands when the auger-discharge cylinder
assembly was removed. The auger and discharge cylinder were cleaned and replaced
on the feeder.
The effect of reducing the annular gap space was evaluated with the C-auger when
bronze and PVC sleeves were placed in the discharge cylinder to reduce the gap
between the auger flights-edge and the cylinder wall. The results of these tests are
presented in Figure 97. This change gave no improvement in feeding and in fact made
the situation worse because the actual space for oil sands movement had been reduced.
Oil sands feeding was a result of the relative movement between the stationary
discharge cylinder and the rotating auger, which provided the driving force to move the
oil sands from the feeder hopper to the discharge downspout. The mechanical shear
and friction forces acting on the oil sands caused the movement of the material through
the auger-housing assembly. A layer of bitumen-impregnated oil sands which may
have been enriched in bitumen coated the inside wall of the cylinder and built-up on the
auger flights at the same time. When the space between the auger and the discharge
cylinder was less than the size of the oil sands lumps, these lumps accumulated near the
entrance of the discharge chamber. Shear stress and frictional forces caused the lumps
to grow larger than the transportation space provided for a specific auger size. The
result was to stop the feeding of oil sands.
359
Figure 97.
Oil Sands Feeder Test Using a Solid Flight C-auger with Inserted Sleeves with the Whiterocks Oil Sands

360
25 -
-a P
I 20 Q -o
en 15
> 1 10 3
C 3
PVC Sleeve; 20% Full Range
Brass Sleeve; 20% Full Range
Time, min

361
The mass of oil sands delivered at various auger speeds and feed rates for the solid
flight and helical F-augers are presented in Table 25. The experiments were conducted
with a solid flight F-auger with a nonstick fluorocarbon polymer coating layer and with
a helical F-auger. The feed rates were more stable when large size solid flight and
helical augers were used. Thus the feed rates can be predicted from calibration curves
for these augers using a linear regression technique. The F-augers were operated
continuously over a 4-hour period and for total feeding times up to 15 hours. The
results indicated that minor variations in the feed rates occurred and were caused by
adhesive and agglomeration tendencies of oil sands. The results indicated that both
augers performed in a similar manner based on a statistical analysis of the data in Table
25 and that neither the coated solid flight F-auger nor the helical F-auger gave
improved feeding characteristics compared with an uncoated solid flight E-auger.
The results of an oil sands feeder test using the E-auger are presented in Figure 98.
The solid flight E-auger was specified and purchased based on the test results with the
C-, D-, and F-augers. The statistical analysis indicated that the E-auger performed
better than the F-auger. It is possible the performance difference between the C-, D-,
and F-augers and the E-auger was related to the nature of the oil sands ore fed. The
Whiterocks ore were used as the feed sands with the C-, D-, and F-augers whereas the
PR Spring ore was used with the E-auger. Visual observation indicated the PR Spring
oil sands was less likely to agglomerate. The particle size distribution may also have
played a role: the PR Spring oil sands were crushed and screened to pass through a 3.2
mm mesh sieve, and the Whiterocks oil sands were screened through a 6.4 mm mesh
sieve. The larger size of the oil sands particles coupled with the tendency for particle
agglomeration with the Whiterocks ore may have been responsible for the plugged
augers. The oil sands feed rates using the E-auger at various motor speeds are presented
in Table 26. The E-auger gave the longest continuous run, 5 hours, at pyrolysis
conditions, and had a cumulative successful feeding time of over 100 hours. The feed

362
Table 25. Statistical Analysis of Average Feed Rates for F-Augers
Type of Auger Auger Speed Set-Point, %
No. of Data Points F ^ k g / h
<*n-l
C^n-l/Favp %
Solid 1.0 14 1.2
0.10 8.3
"light F-auger 10.0 14 3.5 0.05 1.5
20.0 14 6.3 0.16 2.5
Helical 4.0 4
1.3 0.08 6.1
5.0 4
1.7 0.04 2.1
7-auger 10.0
4 6.0
0.15 2.6
20.0 4
8.2 0.39 4.7
F3Vg is average feeding rate, kg/h <rn.i is standard deviation

363
Table 26. Statistical Analysis of Average Feed Rates for E-Auger
Auger Speed Set-Point, % No. of Data Points
Favp, kg/h
<*n-I
Cfn-l/Favg» %
2.0 6
1.9 0.046
2.4
5.0 6
5.4
0.01 0.27
10.0 6
10.8
0.06 0.52
20.0 6
21.7
0.14 0.63
Fayg is average feeding rate, kg/h Cn.! is standard deviation

364
Figure 98.
Oil Sands Feeder Test Using a Solid Flight E-auger with the PR Spring Oil Sands
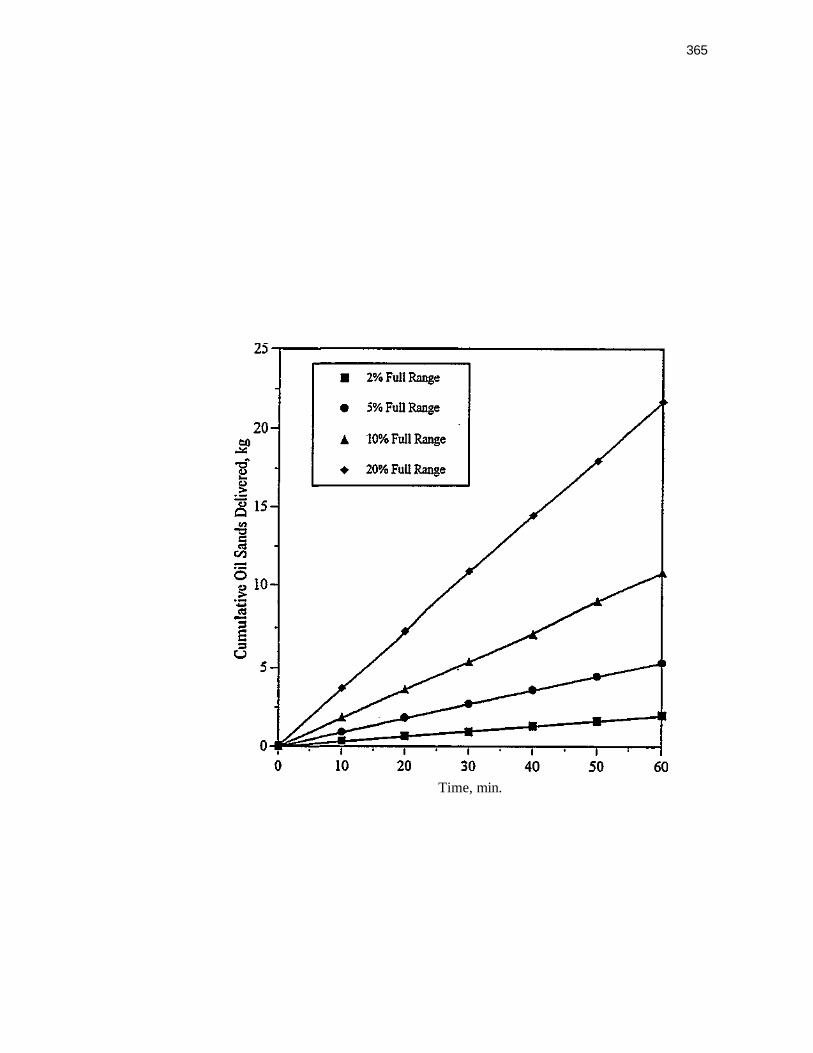
365
Time, min.

366
rates were maintained during experiments with virtually no discernible change. The
feed rates were proportional to motor speed setting in the test range.
A water jacket was installed for continuous cooling of the auger housing to maintain
the discharge housing temperature at 290 K in the summer and 285 K in the winter
which was 5 to 10 K below the ambient laboratory temperature in each case.
The crushed and screened PR Spring oil sands ore used in the feeder study had a
loose structure and narrow particle size distribution which resulted in more stable
feed rates compared with the more compact crushed run-of-mine oil sands ore. The
Acrison BDF-1 feeder with solid flight E- and F-augers and a helical F-auger provided
linear and predictable feed rates. The length of the discharge chamber and the ratio of
void volume-to-surface area, including auger and inner housing surface areas, were the
primary constraints during feeder operation. The shorter the lengths of the discharge
chamber and augers and the larger the ratio of the void volume-to-surface area, the
more reproducible and linear the feed rates were.
Increasing the motor speed caused the feed rates to increase; however, it also
increased the shear stress and frictional forces and eventually led to reduced feed rates
when agglomeration occurred. Low auger speeds were adequate for feeding the oil
sands ores. A large auger was required to provide reproducible feed rates and
sustained oil sands feed rates. The preferred Acrison feeder auger was the solid flight
E-auger fitted with a 30.5 cm long water jacketed discharge chamber (previously a 45.7
cm standard discharge cylinder was used) based on reactor design requirements and the
feeder studies. The cumulated operating hours were over 120 and the longest run
lasted for 5 hours. The results showed a good linearity and reproducibility for the E-
auger.
Pneumatic L-Valve as a Solids Withdrawal Device
Knowlton and Hirsan (129), Frick and Novak (130), Geldart and Jones (131),
Fletcher (121), and Yang and Knowlton (132) have reported on the applications of an

367
L-valve as a solids flow control device. Knowlton and Hirsan (129) used it as a solids
recycling system for a circulating fluidized bed reactor. Geldart and Jones (131)
conducted extensive experimental work to determine the different factors that effect the
performance of L-valves and to develop L-valve design procedures. Fletcher (121)
reported on the use of an L-valve to withdraw Group B sands (128) from a high
temperature fluidized bed oil sands pyrolysis reactor. Recently, Yang and Knowlton
(132) analyzed and correlated data which led to proposed L-valve equations for
calculation of solids flow rates.
L-valves are different from traditional mechanical solids withdrawal valves. They
do not have moving mechanical parts within the system. The L-valves consist of a
vertical section and a horizontal section in conjunction with one or more gas injection
points. Aerating gas is introduced into the L-valve through injection taps. The
geometric shape of the L-valve combined with the aerating gas flow is used to start and
stop solids withdrawal from a process vessel.
A reliable spent coked sands withdrawal system is critical to the maintenance of bed
inventory and operation of a fluidized bed oil sands pyrolysis reactor. Solids
withdrawal valves can be classified into two categories: mechanical control valves and
nonmechanical aerated L-valves. Mechanical valves previously evaluated included a
Foxboro P50 air-to-close model actuator with an open and shut valve (119). The
control signal was provided by a differential pressure controller (DPC) which measured
the differential pressure across the fluidized bed in the reactor. When the differential
pressure exceeded the set-point, a signal was sent to the actuator which opened the
valve to discharge solids from the reactor. Generally, the mechanical valve failed to
close properly after repeated cycles due to solids retention in the valve housing.
Fletcher (121) introduced a nonmechanical L-valve as a spent sand withdrawal device
on the large diameter fluidized bed reactor. It successfully controlled the bed inventory
and the solids withdrawal rate from the reactor.

368
The control principle of L-valves was similar to that used with mechanical valves.
Signals from the DPC controlled the flow of the aeration gas to the L-valve to control
the rate of solids withdrawal from the bed so as to maintain a constant pressure drop
across the bed. The advantages of nonmechanical L-valves included no mechanical
parts in direct contact with the solids and the controlled withdrawal of solids due to the
geometric configuration and sensitivity of the aerating gas flow rate control. The
aeration gas flow was regulated by an open and shut mechanical valve.
Experimental Set-up
The L-valve solids withdrawal device is depicted in Figure 88. It consisted of a
pneumatic L-valve, a nitrogen gas supply, and pressure regulating and monitoring
devices. The L-valve downcomer, horizontal section, and cross connector were made
of 2.54 cm 304 stainless steel pipe and fittings for uses at elevated temperatures.
Injection gas was introduced through a 6.4 mm tubing and NPT connectors. The
aeration gas flow rates were controlled and metered by two FM1050 flowmeters
equipped with utility valves supplied by Matheson.
The coked sands used in the L-valve studies were produced previously during
fluidized bed pyrolysis of the Whiterocks oil sands (119). The sand granules were
coated with a carbonaceous residue and were a multisized Group B sands (128). The
physical properties and the particle size distribution of the sands are summarized in
Tables 27 and 28, respectively. The average particle diameter was calculated from the
following equation:
dP=Ef1-)"1 (17A) p.'
where dp is the average particle diameter of the coked sands, m, dp5i is the average
diameter of the particles between the two sieves, m, and xi is the weight fraction of

369
Table 27. Whiterocks Coked Sands Physical Properties
Mean particle size (dp), um
Particle density (pp), kg/m3
Bulk density (pbk), kg/m3
Bulk packed Voidage (ebk)
Minimum fluidization Voidage (s^)
153
2440
1450
0.405
0.408

Table 28. Whiterocks Coked Sands Particle Size Distribution
Sieve No. Under 200 140 120 100 80 70 60 50 45 35 25
Sieve size, um <75 75 106 125 150 180 212 250 300 355 500 710
dp.;, \m 38.5 90.5 115.5 137.5 165 196 231 275
327.5 427.5 605
3456
X;, Wt% 5.8 6.1 8.1 11.9 11.0 27.7 8.7 9.7 3.1 2.4 1.1 4.3
Xi/dp.i
0.129 0.068 0.070 0.086 0.067 0.141 0.038 0.035 0.009 0.006 0.002 0.001

371
coked sands having a diameter of dp?i. The mean particle size was determined to be
153 pm.
According to the coked sands particle size analysis, 95.7 wt% of the particles was
less than 500 \im. The sands contained 4.3 wt% rock chips and coked sands lumps
which bridged at the neck of the downcomer, caused segregation in the fiuidized
bed, and plugged the withdrawal system. The oil sands particles could have
agglomerated to form large lumps during pyrolysis and would not be expected to break
down into individual particles in their passage through the bed. Agglomeration of the
feed oil sands and subsequent cementation of the agglomerates due to coking were the
main cause of malfunctions of the mechanical withdrawal devices and led to
modifications of the L-valve design in term of the cross-sectional area of the L-valve
and the addition of a second aeration point.
The downcomer and horizontal sections of the L-valve were fabricated from 2.54
cm Schedule 40 stainless steel pipe to circumvent plugging due to larger particles. The o
60 slope of the tapered gas distributor facilitated gravitational flow of the solids into
the downcomer and eliminated distributor dead volume at the wall of the reactor.
After filling the L-valve with coked sands, the aeration gas flow rate was set at a
predetermined value. Solids withdrawn from the L-valve were collected for specified
time intervals and weighed. The solids flow rate was measured five times and an
average value calculated. The aeration gas rate was increased in a stepwise manner
during the course of an experiment.
Characteristics of Solids Flow in L-valves
Solids flow patterns in L-valves had been studied by Knowlton and Hirsan (129),
Geldart and Jones (131), and Yang and Knowlton (132). When aeration gas is injected
into an L-valve, solids do not begin to move immediately at low gas injection rates. A
threshold aeration rate is required to initiate solids flow. The threshold value will vary with the configuration of the L-valve, the location of the injection points and the solids

372
properties. After the critical aeration rate is attained, increasing the aeration gas rate to
the L-valve leads to a solids flow rate increase. Once the gas flow rate increases to a
certain value, the solids flow rate reaches a maximum value and a further increase in
the gas rate may actually reduce the solids flow rate.
The solids flow rate in an L-valve is zero at very low aeration gas flow rates and
the solids in both the vertical and horizontal sections remain stationary. The solids
flow patterns (Figure 99) in an L-valve are usually described in term of three regimes
(129, 131). At low gas flow rates only the sands at the top of the horizontal section
flowed while the balance of the sands in the horizontal section remained stationary
(Figure 99[a]). In addition, a small-portion of the vertical section flowed at low gas
flow rates. However, significant size segregation occurred when multisized particles
were present in the horizontal section with the smaller particles reporting to the top
layer of sands in the horizontal pipe where solids appeared to move in ripples. At
medium gas flow rates the stationary region of particles decreased and a relative large
portion of the solids moved through the horizontal section (Figure 99 [b]) Dunes and
ripples in the sand enlarged and moved at relatively higher frequencies. The entire
solids in the L-valve were in motion at high aeration rates (Figure 99[c]). The
segregated layers and the demarcation between the flowing and stagnant phases
disappeared. The maximum solids flow rate was accompanied by streaming and flow
fluctuations with a further increase in the gas injection rates. When the L-valve
horizontal section was sufficiently long, the motion of the solids formed dunes and the
frequency of the cycles dramatically increased.
Results and Discussion
The L-valves can be classified as automatic solids flow L-valves or external gas
facilitated L-valves depending upon the length of the horizontal section. When the
horizontal section of an L-valve is shorter than 1.5 times the downcomer pipe diameter,
the L-valves do not require gas injection to facilitate solids flow. Solids automatically

373
Figure 99.
Schematic of Solids Flow Patterns in the L-valve (131)
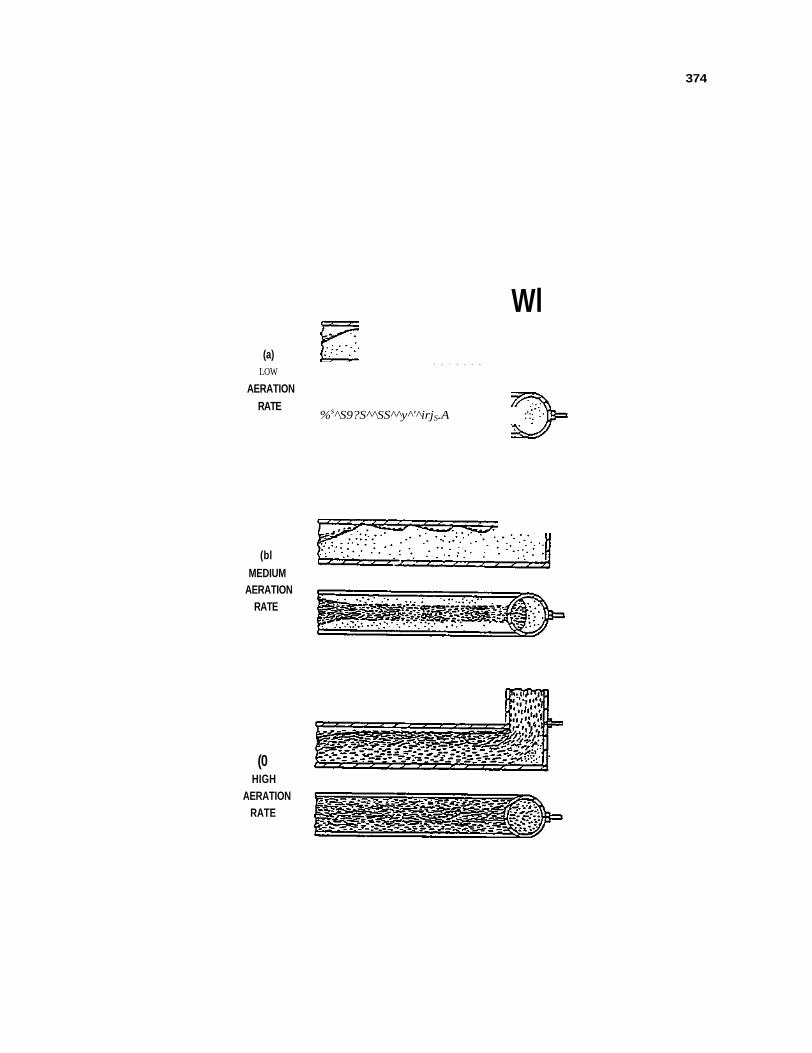
374
(a) LOW
AERATION RATE
Wl
• > • > • • >
%s^S9?S^^SS^^y^'^irjS.A :':
(bl
MEDIUM AERATION
RATE
(0 HIGH
AERATION RATE

375
flow out due to gravity and the length of the vertical section do not affect the solids
flow rates. It was concluded in the present study that the horizontal section of an L-
valve should be greater than the critical value of 1.5 times its diameter to permit
control of the solids flow rate. The critical value is defined as the minimum length
requirement to control the solid flow. The height of downcomer did not affect solids
flow rates in the range of interest. Varying cylinder downstream pressure in the range
34 to 207 kPa did not change solids initial flow point at a given gas injection rate
because the solids were discharged to an ambient pressure receiver. The preferred
cylinder pressure was 41 to 55 kPa.
Three different lengths of the horizontal section were tested in these experiments:
11.4 cm, 19.1 cm, and 34.3 cm. The effect of the length of the horizontal section on
solids flow rates is presented in Figure 100. The solids transfer rates decreased as the
length of the horizontal section increased at a fixed aeration rate. As the length of the
horizontal section increased the more kinetic energy consumed to transfer the solids in
the horizontal pipe instead to discharge particles. The solids transfer rate increased as
the aeration rate increased to a certain point and then leveled off for sufficiently long
horizontal pipe sections, i.e., the 34.3 cm long horizontal section. This was related to
the energy consumed in accomplishing the horizontal transfer of solids.
The changes in solids flow rates with injector location are presented in Figure 101.
The -variation in the position of the aerating gas injector along the center line of the
horizontal section affected solids flow rates. A maximum solids flow rate was obtained
with the injection point located 1.3 cm behind the center line of the downcomer. When
the injection point was moved in either direction the solids flow rate decreased. If the
injector was moved forward, the solids flow rate decreased faster than if it was moved
in the opposite direction. The aerating gas did not affect the solids flow rate when the
injection point was positioned 2.54 cm in front of the center line of the downcomer.
The injection gas flow rate was an important parameter in the design and the operation

376
Figure 100.
Effect of the Lengths of the Horizontal Section on the Solids Flow Rates with the Injector Port Located 1.3 cm behind
the Center Line of the Vertical Section

400-
377
550-
300-1
if 250-
*§ 200-c 03
•3 150-o
en
100-
50-
0--3 -1 0
Injector position, cm

Figure 101.
Effect of the Injection Port Location on the Solids Flow Rate with Different Horizontal Section Lengths
at a Fixed Aeration Rate of 4.5 LPM

Soikls Transfer Rate, g/s
CO
CO

380
of the L-valve. Initial solids breakthrough occurred at a nitrogen flow of 1.5 LPM
with the injection point located 1.3 cm behind the center line of the downcomer. The
amount of coked sands which remained in the L-valve was determined by its angle of
repose. If the injector projected beyond the coked sands slope-boundary defined by the
angle of repose, the injected gas discharged into the empty region of the horizontal
section of the L-valve. As the injector moved backward into the coked sands pile,
more and more coked sands were carried out by aeration gas and reached a maximum
value at 1.3 cm behind the center line of downcomer. However, further backward
movement of injector decreased the solids transfer rates, because part of the energy
consumed in horizontal transport.
The solids flow rate (Figure 100) increased as the gas flow rate increased. The
solids fluxes ranged from 0 to 90.4 g/cm s, whereas the discharge rate ranged from 0
to 460 g/s throughout the test range. When injection gas rates increased from 0 to 7.5
SLPM, the solids transfer rate reached 458 g/s and leveled off with the 11.4 cm
horizontal section. The solids flow rates increased from 0 to 408 g/s with a 19.1 cm
horizontal section and from 0 to 207 g/s with a 34.3 cm horizontal section. The solids
transfer rate decreased as the length of the horizontal section increased at constant gas
injection rate. This effect was related to the energy required to transport the solids
through the horizontal section: increasing the length of the horizontal section led to the
consumption of more energy in the horizontal transfer pipe.
An attempt was made to correlate these results using the Yang and Knowlton (132)
method. However, large deviations resulted because the Yang and Knowlton (132)
method was established for large solids flow rates and the method was reported to be
inaccurate at low solids flow rates.
The following conclusions were drawn from the L-valve studies. The diameter of
the vertical and horizontal sections of the L-valve should be equal to or greater than
2.54 cm. The experimental results indicated that lumps formed in the pyrolysis process

381
did not plug the valve. The solids flowed out automatically by gravity when the length
of the horizontal section of the L-valve was less than 1.5 times its diameter. A
minimum amount of injection gas which varied with the lengths of the horizontal
section (Figure 101) was required to initiate solids flow. Gas injection into the
horizontal section behind the center line of downcomer was an effective way to control
the solids flow rate. The length of the downcomer section of the L-valve did not affect
solids flow rate, whereas the length of the horizontal section of the L-valve had a
significant effect on solids flow rates. Secondary gas injection facilitated solids flow in
the presence of coked sands lumps which formed during pyrolysis.
An L-valve with two aeration injection ports (Figure 91) was fabricated using an 11
cm long 2.54 cm pipe for the horizontal section and fittings for the fluidized bed
system. The injection gas flow rate was 4 SLPM, the solids flow rate was 50 g/s, and
aeration time lasted for 2 seconds. The valve intermittently discharged coked sands at
90-second intervals to maintain the fluidized bed hold-up constant for a settled-bed H/D
of 2 and a solids retention time of 30 min. The auxiliary aeration injector was located
underneath of the vertical section to permit solids flow when lumps were present in the
coked sands.
Coked Sands Fluidization Studies
The fluidization studies conducted in the 7.62 cm diameter fluidized bed reactor had
the following objectives:
• test the reactor system capability and performance, especially the tapered gas
distributor;
• examine the fluidization regimes and determine the range of operating variables in
which channeling and slugging were absent;
• determine the preferred bed hold-up and fluidizing gas flow rate;
• determine the relationship between H/D, fluidization mode, and reactor
temperature;

382
• determine the minimum fluidization velocity at elevated temperatures; and,
• determine the appropriate fluidizing gas velocity for oil sands pyrolysis based on the
coked sands minimum fluidization velocity.
Characteristics of Fluidization
Consider a column or a reactor that is filled with loose packed solids up to a certain
level, H. If a fluid is introduced in the bottom of the reactor upward through the bed
of solids, the bed gradually expands and the pressure drop across the bed increases with
an increase in the gas velocity in the fixed bed regime. The particles are in a static
state and exhibit no relative movement. The pressure drop across the bed is
proportional to the gas velocity in the fixed bed regime. As the fluidizing gas rate
increases the pressure drop across the bed increases and the particles are partially
suspended by the gas in the bed leading to a further expansion.
When the fluid velocity is increased beyond this point, the pressure drop fluctuates
around a constant value equal to the mass per unit area of the bed and the particles
begin to move about freely with frequent collisions. The suspended solids exhibit
properties usually attributed to liquids. The onset of fluidization is observed when the
drag force exerted by the upward moving fluid stream balances the mass of the particles
in the bed. The pressure drop at this point should be equivalent to
w • AP = ̂ - (18A)
A b
where Wb is the mass of the particles in the bed and Ab is the cross-sectional area of the
reactor.
The pressure drop at minimum fluidization is given by
APmf=Hmf(l-8mf)(Pp-p£) (19A)

383
where H^ is the height of the expanded bed at minimum fluidization, s,^ is the voidage
of the expanded bed at minimum fluidization, pP and pg are the densities of the solids
and fluidizing gas, respectively.
The minimum fluidization velocity is determined by extrapolating the straight line
pressure drop for a packed bed until it reaches the horizontal line corresponding to the
bed hold-up per unit cross-sectional area or the value of the pressure drop across the
bed of solids acting on the bed.
Geldart (128) classified powders into four categories according to particle-gas
fluidization characteristics: group A, B, C, and D. Geldart's group B particles have a
mean particle size between 40 to 500 pm and particle densities between 1,400 and
4,000 kg/mJ and are sandlike particles. The coked sands produced during oil sands
pyrolysis is a group B sand: the coked sands had an average particle size of 153 urn
and a particle density of 2440 kg/m .
Fluidized Bed Pressure Analyses
The system arrangement and pressure analysis for the conventional push, the
reduced pressure, and the pull modes of fluidization are presented in Figures 102 to
104, respectively. The pressure in the fluidized bed reactor is the system pressure and
is the pressure above the bed. The system pressure in conventional push mode
fluidization is the same as the ambient pressure. The system pressure is less than the
ambient pressure in the reduced pressure fluidization mode. The windbox (plenum)
pressure is the sum of the reactor pressure and differential pressure drops across the
bed and the distributor.
Conventional Push Mode Fluidization
The solids particles in the bed were at the ambient atmospheric pressure. Fluidizing
gas was introduced into windbox and then passed through gas distributor upward
through the bed (Figure 102). A pressure equal to the bed loading must be established
in the windbox to fluidize particles above the gas distributor. This pressure drop

384
Figure 102.
Pressure Analysis for Push Mode Fluidization

385
^—Qr Gas pump
Dust filter
Regulater
-O—M
N2 cylinder
Mass flow meter
•o top
0 **> bed
o
P =P -4.1kPa(const)
^ . ' H X ' t t
P =85.6kPa tan
AP. bed
AP <fct
P <P top wbx
P ^ =P«m+APhM+AP^-4-l kPa wbx *•»» o 0 1 dot

386
should be equal to the sum of the pressure drop across the bed and pressure loss in the
distributor. The absolute pressure analysis for the conventional push mode of
fluidization was as follows:
p amb
P«r
*wbx
p xwbx
= 85.1kPa
- P amb
>P«r
> P a m b
Pwbx = Pna+APb+APdist
The pressure drop across the fluidizing gas distributor was negligible. The pressure
drop, Pdist» was 0.03 kPa at gas flow rate of 5.5 cm/s (15 LPM).
Reduced Pressure Mode Fluidization
The sealed reactor system was operated at an absolute pressure lower than ambient
pressure by means of vacuum pump pulling gas out of system (Figure 103). The
pressure in the freeboard region had a value of 81.5 kPa. The absolute pressure
analysis for reduced pressure mode fluidization is as follows:
PMb = 85.6kPa
*amb > Pro-
P r a = Pamb-4.1kPa = 81.5kPa
P > P rwbx ^ rna Pyvbx > "amb
Pwbx=Pna+APb+APdist

387
Figure 103.
Pressure Analysis for Reduced Pressure Mode Fluidization
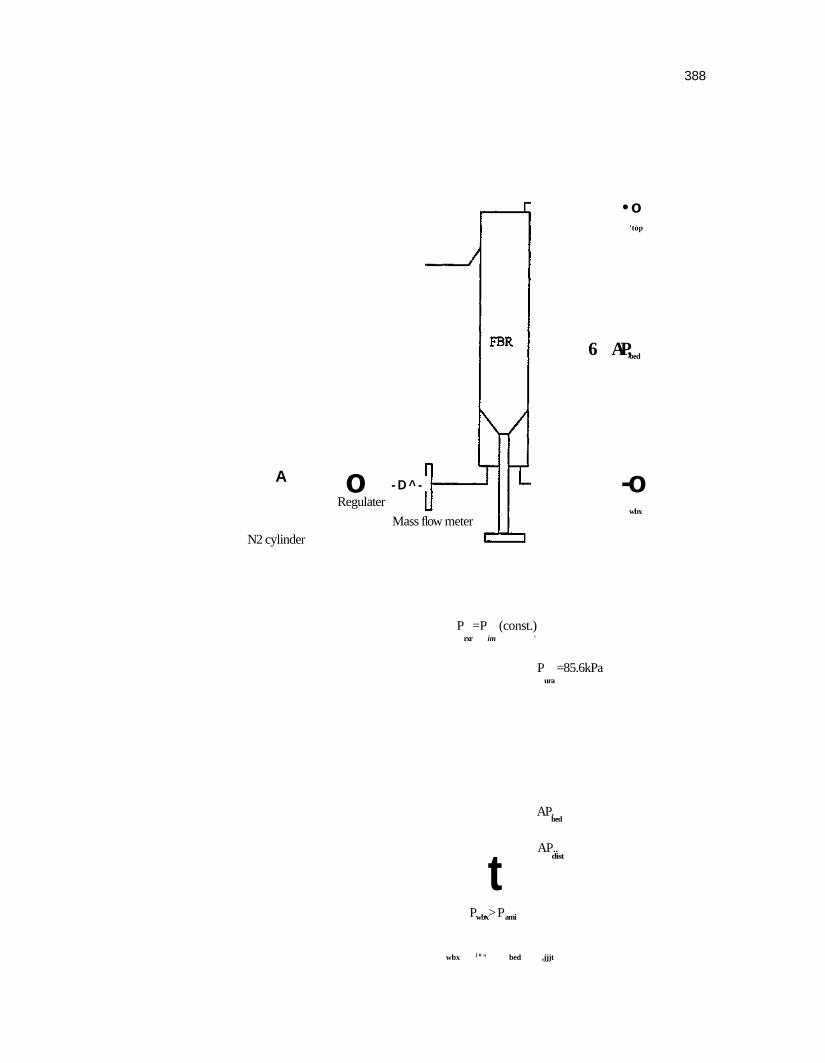
388
A
N2 cylinder
o - D ^ -Regulater
Mass flow meter
• o 'top
6 AP, bed
-o wbx
P =P (const.) rxr im '
t
P =85.6kPa ura
AP. bed
AP.. dist
P ,>P wbx ami
wbx j n " bed ,jjjt

389
The windbox pressure is dependent on the pressure drop across the bed. If the two
terms of APb and AP^ exceeded the 4.1 kPa, the windbox pressure could be higher than
the ambient pressure. The difference between the two flow modes is the system
pressure. The system pressure affects the minimum fluidization velocity by changing
the fluidizing gas density. The reduced pressure mode fluidization provides an
environment in which the minimum fluidization velocity occurs at a lower superficial
gas velocity.
Pull Mode Fluidization
The pull mode of fluidization was developed for fluidization of wide particle size
distribution sands by Fletcher (121). The windbox pressure was the ambient pressure.
Fluidization of the bed inventory was accomplished by pulling the fluidizing gas
through the windbox and gas distributor into the bed by means of a vacuum pump in
the exit line from the reactor expansion chamber (Figure 104). Fluidization gas used in
the pull fluidization was ambient air. The absolute pressure analysis for pull mode
fluidization was as follows:
• P,* = 85.6kP»
p =p x wbx x amb
amb ** *ixr
P >P x wbx x ncr
Prer=Pwbx-(APb+APdist)

390
Figure 104.
Pressure Analysis for Pull Mode Fluidization

391
Mass flow meter
- Q -Gas pump
Air
Dust filter
I I
•o •09
6 AP bed
-o wbx
P <P (const)
P =85.6kPa asm
AP. bed
AP..
wbx AMra

392
Experimental Determination of the Minimum Fluidization Velocity
The fluidization studies were conducted using the Whiterocks coked sands produced
in a 10.2 cm fluidized bed reactor (119). Several techniques have been developed to
interpret the experimental minimum fluidization velocity (Umf) (128, 133-135). The
minimum fluidization velocity is defined as the gas velocity at which the pressure drop
across the bed is equal to the bed hold-up per unit cross-sectional area (M/A). This
value is the point of intersection of the fluidization curve and the horizontal line equal
to M/A (136-138). The intersection was taken on the descending portion of the curve
beyond the transition point from the fixed to the fluidized bed during which the
particles unlock. The experimental Umf values in this study were determined at the
intersections of the fluidization curve beyond the maximum and the horizontal line
corresponding to the theoretical M/A values.
The differential pressure measured across the reactor was the sum of the pressure
drops across the fluidized bed and the gas distributor. Normally, the bed pressure drop
would be calculated by deducting the pressure drop across the gas distributor; however,
the experimental results indicated that the distributor pressure drop was less than the
experimental uncertainty in terms of pressure drop measurements; therefore the
correction was not made. The net pressure drop across the gas distributor at a gas
velocity of 5.5 cm/s (15 LPM) was 0.03 kPa at a bed pressure drop of 1.63 kPa
(H/D=1.5).
The fluidization and defluidization experiments were conducted at various H/D
ratios and for three distinct fluidization modes. Fluidization and defluidization curves

393
for various H/D ratios in the push and reduced pressure fluidization modes are
presented in Figures 105 to 108. Values of Umf at ambient temperature (294 K) using
nitrogen as the fluidizing gas are tabulated in Table 29.
The minimum fluidization velocity is a function of both particle and fluid
properties. Once the particles (coked sands), temperature, and fluidizing gas (nitrogen)
were specified Umf should be fixed. The H/D ratios did not affect the Umf which was
expected. The experimental Umf values reported in Table 30 were obtained for
different fluidization modes and different fluidization gases. However, the density and
viscosity of fluidizing gases are very similar for nitrogen and ambient air. The
fluidization and defluidization curves at an H/D of 2.5 under the pull fluidization mode
are presented in Figure 109.
The Umf for the push mode fluidization was greater than Umf for the reduced
pressure mode fluidization. This observation has been confirmed by several
researchers (139-140) during the reduced pressure fluidization studies. Their findings
indicated that the Umf decreased in the reduced pressure environment. The push mode
of fluidization is essentially the conventional fluidization method in which pressure
above the bed is the ambient pressure. The reduced pressure mode was achieved using
a vacuum pump in the exit line leaving the product recovery train. The ambient
pressure due to the altitude of the Salt Lake City area is 85% of atmospheric pressure at
sea level. Thus the ambient pressure in these studies was 85.1 kPa. The vacuum pump
installed in the exit of the reactor system maintained a system pressure of 81.5 kPa or
4.1 kPa vacuum. Fluidization at system pressures below the ambient pressure was
identified as the reduced pressure fluidization mode.
Pressure exerts a significant influence on the fluidizing gas density. The
relationship of pressure and gas density can be reasonably expressed by the ideal gas
law at ambient pressure and temperature. The gas density decreased from 0.9853

394
Figure 105.
Coked Sands Fluidization at Various H/D Values Push Mode Fluidization
Nitrogen Fluidizing Gas, 294 K, 85.6 kPa

395
2.5-
as
<o 3 co
.2 • * - •
s u
2 -
1.5-
0.5-
Reduced Pressure Mode Fluidization (H/D=2.0, M/A=2.17kPa),kPa
Reduced Pressure Mode Defluidization (HyD=2.0, M/A=2.17kPa),kPa
0-0
i 4
i
5
Fluidization Velocity, cm/s

396
Figure 106.
Coked Sands Fluidization and Defluidization at H/D=2.0 Push Mode Fluidization
Nitrogen Fluidizing Gas, 294 K, 85.6 kPa

397
Fluidization Velocity, cm/s

398
Figure 107.
Coked Sands Fluidization at Various H/D Values Reduced Pressure Mode Fluidization
Nitrogen Fluidizing Gas, 294K, 81.5 kPa
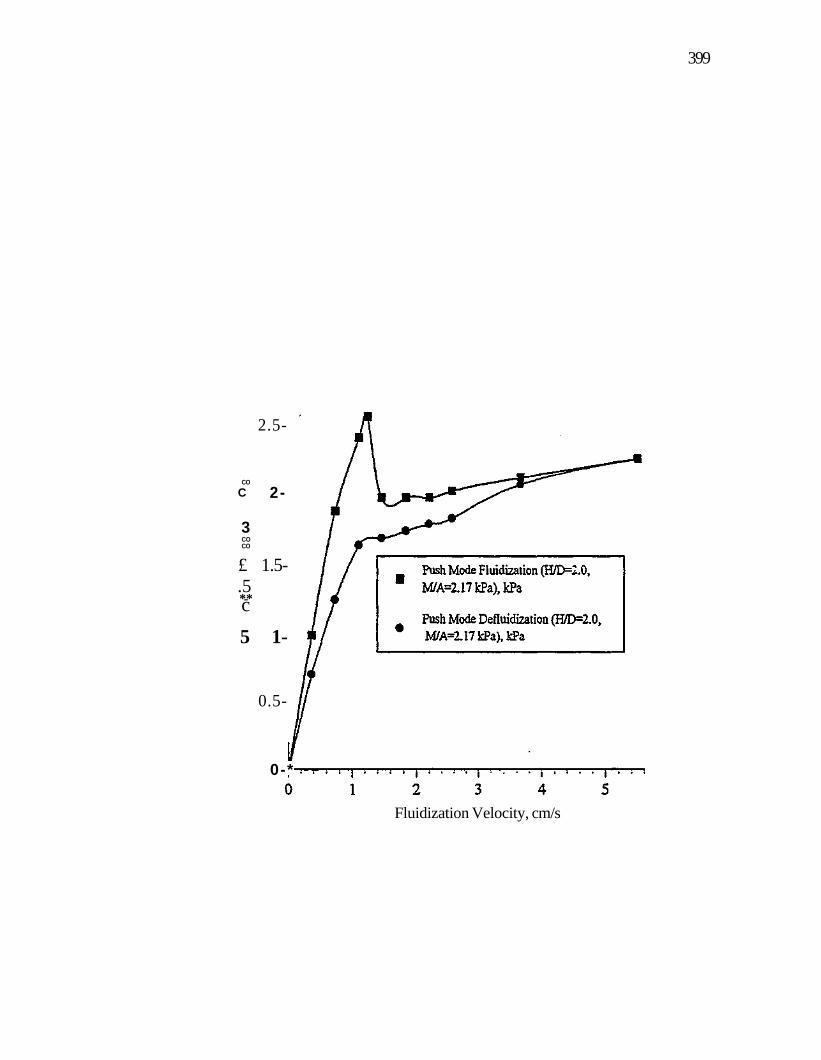
399
2.5-
CO
C
3 CO CO
2-
£ 1.5-.5 *-* c
5 1-
0.5-
0-*
Fluidization Velocity, cm/s

400
Figure 108.
Coked Sands Fluidization and Defluidization at H/D=2.0 Reduced Pressure Mode Fluidization
Nitrogen Fluidizing Gas, 294K, 81.5 kPa

401
Fluidization Velocity, cm/s

402
Table 29. Experimental U^ Using Nitrogen Fluidizing Gas
H7D=1.5 H/D=2.0 H/D=2.0* H7D=2.5 H/D=3.0 Average U f̂, cm/s CTn . , , cm/s
On-l/U^ %
M/A,kPa 1.63 2.17 2.17 2.71 3.02
—
—
—
Push Mode, cm/s 1.43 1.40 1.40 1.41 1.41 1.41 0.01 0.7
Reduced Pressure Mode, cm/s 1.30 1.37 1.30 1.37 1.40 1.35 0.04 3.0
*: reproducibility test

403
Table 30. Experimental U^at Different Flow Modes
Flow Mode Fluid Media Unf, cm/s
Push Mode Nitrogen
1.41
Reduced Pressure Mode Nitrogen
1.35
Pull Mode Air 1.62

404
Figure 109.
Coked Sands Fluidization and Defluidization at H/D=2.5 Pull Mode Fluidization
Air Fluidizing Gas, 294 K, 81.5 kPa

405
3.5
AH
en to
3 -
2.5-
2 -
• | 1.5
0.5-
0-
Pull Mode Fluidization (H/D=2.5, M/A=2.71kPa),kPa
Pull Mode Defluidization (H/D=2.5, M/A=2.71 kPa), kPa
l
2 5 Fluidization Velocity, cm/s

406
kg/m3 at ambient pressure to 0.9377 kg/m3 at the reduced pressure fluidization
operating pressure.
The minimum fluidization velocity under pull mode fluidization, 1.62 cm/s, was
greater than those observed for the other two modes. The pull fluidization mode was
presumed to induce a loosely packed bed a higher bed voidage under minimum
fluidization conditions.. The increases in bed voidage in pull mode were confirmed
from studying of Ergun equation (142).
In conclusion, U^ under reduced pressure fluidization was lower than U^ under
push mode fluidization, and it is presumed that this difference is related to the
reduction in the fluidizing gas density. U^ under the pull mode fluidization was higher
than U^ under the push mode fluidixation. An attempt to explain the difference was
based on changes in bed voidage at minimum fluidization.
Prediction of Minimum Fluidization Velocity
The experimentally determined minimum fluidization velocities were discussed in
the previous section. Several empirical and semitheoretical methods have been
developed for the calculation of U^ (121, 143). The mathematical expressions can be
derived in term of the Reynolds number at minimum fluidization and the Archimedes
number to give a dimensionless form:
Re^ = f (Ar) or Ar = f (Re^) (20A)
^ P ^ C P P - M S ( 2 1 )
Remf = ^ = ^ (22)

407
The well-established Ergun equation (142) and the characteristic dimensionless
number (Ar/Remf) are frequently used to correlate minimum fluidization velocities.
The Ergun equation was originally developed as a universal correlation for the pressure
losses across packed beds of spherical particles.
Two types of correlation (144) can be used correctly to describe the behavior of a
fluidized bed at the minimum fluidization velocity.
(23) '
where C=f(emf,<|>s,ug,pp,pg)and0.5<m<1.0 and where smf is the bed voidage at
minimum fluidization; (j>s is the particle sphericity; pg is the gas density, kg/m ; pp is
the particle density, kg/m^; and pg is the gas viscosity, g/cm-s.
The left-hand side of equation 24 is the characteristic dimensionless group Ar/Remf
which is a measure of minimum fluidization velocity of the system: a function of the
particles to be fluidized and the fluidizing gas. The right-hand side of the equation is
composed of a constant determined by particle size, density, voidage, sphericity, and
the particle Ar number.
H. Ar = C1Retof+C2ReSlf (24)
where C,,C2 =f(smf,<}>s) and 1.5<n<2.0
The Ergun equation (142) was given by
Ar Re
= CArn
mf
_*L = l50 ( 1-8f ) a^+L75 ( 1-^ ) P '8 U a- f
H^ felt d2p <ML dp
(25)

408
which can be recast in dimensionless form as follows:
= 150i_^L + -i^-Remf ( 2 6)
^ a n d C ^ Thus Q = 1 5 0 ^ ^ and C2 = 3 <PsSmf <PsSmf
Solving the quadratic Ergun equation the following form is obtained:
Remf = (cr+c2Ar)°-5-c1 (27)
where Ci, C2, ci, and c2 are functions of (j>s and smf. Thus the minimum fluidization
velocity is a function of the properties of the bed material and fluidization gas
properties. The values of the constants in the Wen-Yu correlation (145) were Ci = l l ,
C2=14, ci=33.7, and c2=0.0408. The calculated values of Umf in the push
fluidization and the reduced pressure fluidization were 1.46 cm/s and 1.39 cm/s,
respectively, using the Wen-Yu equation (Equation 27). This equation is not adequate
to predict U^ under pull mode fluidization, because the lump constants, c} and C2,
contain bed voidage, which infers that the s^ is considered to be a constant in the Wen-
Yu equation.
Interpretation of Fluidization Curves
The fluidization curves for tapered gas distributors are different from conventional
fluidization curves obtained with a flat distributor (146-148). The fluidization curve
for a cone-shaped distributor in continuous operation with coked sands is presented in
Figure 110.
Packed Bed Regime — O to A
When gas flowed upwards through a packed bed reactor which was loaded with a
certain amount of coked sands the pressure drop across the bed gradually increased

409
Figure 110.
Interpretation of Fluidization Curves for a Cone-shaped Distributor in Continuous Operation with Coked Sands

410
u
411
with gas velocity according to Ergun equation (142). The bed was in a quiescent state
in the packed bed regime. The increase in pressure drop versus gas velocity depended
upon bed inventory and how firmly the bed was packed. The packed bed pressure drop
curve with conical gas distributor was as similar as that with flat gas distributor in the
packed bed regime.
Transition Regime — A to B
As the fluidizing gas velocity increased, the pressure drop across the bed declined:
and the differential pressure across the bed decreased from a maximum value at (A) to
a minimum value at (B). A "hump" in the curve was recorded particularly during the
first attempt to fluidize the bed, of if the settled bed was left undisturbed for a
relatively long period of time. This pressure rise was attributed to pressure drop
required to free or unlock the compacted or interlocked particles in the transition from
a packed bed to a fluidized bed. This phenomena has usually been associated with the
fluidization of Geldart's Group B particles (128) for both flat and conical gas
distributors.
As soon as the pressure drop reached the maximum value (A), the bed began to
segregate into a fluidized inner column and downward moving outer column. It was
presumed that the momentum of fluidizing gas which passed through holes in the cone
was about 70 times higher than the momentum associated with the fluidization velocity
("2 m/s) and would keep it toward the center of the reactor This phenomena was
attributed to the conical design of the gas distributor. The orientation of the distributor
orifices (Figure 90) caused the gas to flow toward the center of the bed which formed
an inner fluidized column. Thus, the distributor set up a preferential flow path in the
bed through which large quantities of gas flowed.
Once the bed pressure drop curve reached its maximum value at A, the pressure
drop fell to B. The experimental pressure at a point A was in the range of 95 to 110%

412
of the pressure drop equivalent to the mass of the bed divided by the cross-sectional
area of the reactor (M/A), whereas at point B it was about 85 to 90% of M/A.
Partial Inner Column Fluidization Regime — B to C
The solids flow pattern at B was reported to resemble channeling due to the fact that
the pressure drop was 10 to 15% below the calculated M/A value (133). After the bed
pressure drop fell to the minimum value B, increasing gas velocity led to increased the
pressure drop from B to C. Particles were continuously transferred from the upward-
moving inner region of the column to the downward-moving outer region of the
column. The outer column region decreased and the pressure drop recovered as the
fluidization gas velocity increased. The excess gas flow, U-Umf, expanded the partial
fluidization region.
Fully Developed Fluidization Regime — C to D
The entire bed was fluidized, and the bed pressure drop was equivalent to the bed
hold-up per unit cross-sectional area when the fluidizing gas velocity attained the value
equal to the complete fluidization velocity, Ucf. Ucf was about two to three times the
minimum fluidization velocity in this study. The fluidization curve was similar to that
with flat gas distributor. The complete fluidization velocity can be calculated according
to Geldart (128) even though the method was developed for fluidization of multisized
particles in a system with a flat gas distributor.
The pressure-fluidizing gas curve with cone-shaped gas distributor indicated that the
curve was different than that of flat-plated distributor. The tapered gas distributor
provided a preferential pathway perpendicular to the surface of the distributor which
allowed the gas to flow toward the centerline of the reactor. In contrast, the fluidizing
gas flow with flat-plated distributor was upward. Thus, the configuration of the
tapered gas distributor affected the fluidization characteristics. This influence on the
pressure drop across the bed diminished as the fluidization velocity reached the

413
complete fluidization regime. The fluidization curve with tapered gas distributor was
the same as that with flat-plated distributor.
Elevated Temperature Fluidization
Although many of the applications of fluidization involve high temperature
operations, most of the correlations developed for the prediction of minimum
fluidization velocities have been obtained at ambient conditions (137, 138, 149).
Examinations of the correlations over a board temperature range have shown a
significant deviation between predicted and measured velocities when gas densities and
viscosities corresponding to the operating conditions were used (150-152). The
minimum fluidization velocity (Table 31) decreased with increased fluidized bed
temperature with the coked sands produced during the pyrolysis of the Whiterocks oil
sands in a fluidized bed reactor (119).
Elevated temperature fluidization studies were conducted at 423, 523, and 623 K to
determine the effect of reactor temperature on the minimum fluidization velocity.
These temperatures were below the coke ignition temperature to prevent the
spontaneous ignition of the carbonaceous residue on the sand grains. Furthermore,
nonoxidizing nitrogen was used as the fluidizing gas in these push mode fluidization
studies. The temperature dependence of nitrogen viscosity and density used to compute
the predicted U^ were reported by White (153) and are given as follows,
|ig = -1.189 x 10-"T2 +4.832 x 10'8T+4.394 x 10"6 (kg/m-s) (28)
Pg = 338.8 xT0"87 (kg/m3) (29)
where R2=1.00 for both correlations. The experimental and predicted minimum
fluidization velocities are presented in Table 31 and Figure 111.

414
Table 31. Values of Minimum Fluidization Velocities at Elevated Temperatures
Bed Temperature, K 297 423 523 623
Experimental V^, cm/s 1.41 1.2 1.0
0.75
Predicted Un*, cm/s 1.46 1.32 1.12 0.99
a: predicted minimum fluidization velocities were calculated from Ergun equation.

415
Figure 111.
Minimum Fluidization Velocity at Elevated Temperatures with Whiterocks Coked Sands

416
l . J -
^ 1.3-o ;£ *-* "5 o u
> o ~ 1 1 -N
rs '3 E 5
_S •S 0.9-2
n 7
•
•
• i • 1 :
Umf,expl,
•
cm/s
Umf,calc, cm/s
1 • 1 • l
*V * \ .
\ l l
• 1 • 1
• \ 1 1 '
200 250 300 350 400 450 500 550 600 650
Fluidized Bed Temperature, K

417
The minimum fluidization velocity is dependent upon a number of parameters, such
as fluid density (pg), fluid viscosity (pg), particle sphericity (<j)S), voidage at minimum
fluidization velocity (smf), and particle density (pp). When the temperature and
pressure of the system are fixed, these parameters are constants. The characteristic
dimensionless numbers Ar and Remf for coked sands at ambient temperature and
pressure can be determined. However, the use of parameters measured at room
temperature may not be justified for the prediction of Umf at elevated temperatures.
All the Umf calculations are based upon the equality of pressure drop per unit
cross-sectional area as given by the Ergun equation (142). If the voidage at minimum
fluidization velocity, smf, and the particle shape factor, (J)S, are known, the original
Ergun equation (142) could provide a better prediction of U^ than its simplified
variations. However, both voidage and sphericity are parameters which are difficult to
determine for a given system. Practically, both factors may be mutually
interdependent.
When the temperature of a fluidized bed is changed, the most obvious changes were
in the properties of the fluidizing gas. The gas density and viscosity significantly affect
the performance of gas-solid fluidization systems and, concomitantly, Umf- The
density of the gas, pg, decreases and the viscosity, pg, increases with temperature.
Fluidized beds operate in the laminar flow region at low particle Reynolds numbers
where Remf is less than 20 (144). The viscous term in the Ergun equation is
predominant and the kinetic term is negligible in this regime. The Ergun equation can
be rearranged to give
(30)

418
Umf is a function of gas viscosity; that is, Umf oc l/jo.. Since the gas viscosities are
proportional to Tn where n is usually between 0.6 and 1.0 (150), Umf is also a
function of temperature. The U^ of coked sands at elevated temperature study were
fallen into this category, where gas viscosity is the important variable.
The system is in the turbulent flow region at high particle Reynolds numbers over 1000
(128). The kinetic term in the Ergun equation (142) predominates and the viscous term
is negligible. Thus, the Ergun equation reduces to
* L?5-Relrf (31) &w ctej„
and Umf is primarily determined by kinetic energy losses. Since Umf is proportional
to the square root of the fluidizing gas density, the temperature dependence is a
function of T0 '5 .
The experimental minimum fluidization velocity at the elevated temperatures
invested can be expressed by the following equation in the temperature range from 290
to 623 K.
U^ = 2.03 - 2.02 x 10"3T (cm/s) (32)
where R2= 1.00.
The predictions from existing correlations tend to overestimate the minimum
fluidization velocity at elevated temperatures (150). Bed voidage (smf) increased with
temperature for Geldart's group B particles (137, 151, 154), especially for particles in
the size range from 90 to 110 \im. Mii et al. (152) studied the U^ at 673 K with air
and nitrogen and indicated that the experimental U^ was 2 cm/s whereas the predicted
U^ was 4 cm/s. The discrepancies between the predictions and experimental data

419
increased as the temperature increased. The experimental results at elevated
temperatures indicated that the minimum fluidization velocity was less than the
predicted values and that the deviation increased as the temperature increased.
Variations in bed voidage with temperature appeared to be another factor in
determining the dependence of the minimum fluidization velocity on temperatures. It is
presumed that fluidized bed voidage changed as the bed temperature increased and,
consequently, the minimum fluidization velocity with temperatures. The characteristics
of the particulate phase was determined by the interparticle force in the bed. The
growth of bed voidage at minimum fluidization condition with increasing temperature
demonstrated the possibility of attaining an increasingly looser arrangement of the sand
particles. This arrangement increased the fluidity of particle.
The experimental results in this study suggested that the minimum fluidization
velocities decreased as bed temperature increased at elevated temperatures. The
minimum fluidization velocity was determined by the viscous energy loss term in the
Ergun equation at low particle Reynolds numbers. Other relevant parameters, such as
mf and s, might also impact the minimum fluidization velocity. The rise in operating
temperature led to an increase in the fluidity of the fluidized bed. Calculations
confirmed that the system was well within the laminar flow region when the particle
Reynolds numbers were less than 10.
Comparison of Pull Mode Fluidization Characteristics with Different Coked Sands
The coked sands produced during pyrolysis of the Whiterocks oil sands in a
fluidized bed reactor (119) and the PR Spring coked sands produced in this study were
used to investigate the feasibility of the pull mode fluidization in a small fluidized bed
reactor. A surge tank with a gas dryer was installed to provide continuous nitrogen
flow to the reactor at constant ambient pressure to maintain the pull mode fluidization.
A schematic of the system was presented in Figure 89.

420
The fluidization curves for the Whiterocks and the PR Spring coked sands are
presented in Figure 112. The two types of coked sands studied exhibited different
fluidization characteristics in the pull mode. The fluidization curve using the
Whiterocks coked sands was similar to a push mode fluidization curve. It displayed
distinct packed bed and fluidized bed regimes. In contrast, the fluidization curve
for the PR Spring coked sands exhibited a gradual transition from the packed bed to the
fluidized bed regimes. The slope of pressure drop in the packed bed portion with the
Whiterocks coked sands was greater than with the PR Spring coked sands. The
transition from the packed bed to the fluidized bed was not apparent during fluidization
with the PR Spring coked sands.
The beds were allowed to settle for 30 min and a second set of fluidization curves
were obtained for both coked sands. The fluidization curves were quite similar to
Figure 112. Two distinct regimes were still apparent with the Whiterocks coked
sands, whereas once again the PR Spring coked sands did not exhibit an observable
transition from the packed bed to the fluidized bed regime. The pressure drop across
the bed developed gradually with the PR Spring coked sands as the fluidizing gas
velocity was increased, which indicated that the fluidization of the PR Spring coked
sands underwent a gradual transition from partially to fully developed fluidization. The
pressure drop was fully developed and attained a value equivalent to the bed hold-up
per unit area with further increase in the nitrogen flow rate for the PR Spring coked
sands. These observation may be related to the that the PR Spring and Whiterocks
coked sands samples had different particle size distributions. The PR Spring coked
sands (106) had a broad particle size distribution whereas the particle size distribution
of the Whiterocks coked sands was relatively narrow. The results indicated that both
coked sands operated successfully in a pull mode fluidization.
The differential pressure drop across the bed for a fluidized bed operated in the pull
mode at a constant bed inventory is shown in Figure 113. A significant amount of

421
Figure 112.
Comparison of Pull Mode Fluidization Curves with Whiterocks and PR Spring Coked Sands

422
4.. J ~
•
2-
.as
11.5-VI in o
C
"5
§ i-fa 5
0.5-
n-j u i
•
•
1 ' i
Whiterocks Coked Sands
PR Spring Coked Sands
. . . . . . . . . . . . . 1 • • • | • • • •
1 2 3 4 Fluidization Velocity, cm/s

423
Figure 113.
Continuous Operation in Pull Mode Fluidization at H/D=2.0 With PR Spring Coked Sands

Differential Pressure, kPa
u>
to o
to
I I I I
o
I
to

425
fluidizing gas flow rate was required to achieve a fully developed fluidized bed
pressure drop: twice the minimum fluidization velocity was required to maintain a bed
pressure drop equal to M/A in the pull mode for the PR Spring coked sands (Figure
112). Pull mode fluidization was not practical compared with push mode fluidization
and fluidization quality was not as good as in the push mode operation for this reactor
system.
Effect of Pyrolysis Variables on Product Distributions and Yields
The fluidized bed reactor system operated in the bubbling regime under pyrolysis
conditions. This conclusion was based on the coked sand fluidization and
defluidization studies at ambient and elevated temperatures for different flow modes.
The process variables investigated in the oil sand pyrolysis studies included the bed
temperature, the solids retention time, and the fluidizing gas velocity. Previous
researchers, (50, 51, 114, 119-121), established the range of reactor temperatures
and solids retention times expected to influence the-product distribution and yields.
These investigations also confirmed that the fluidized gas velocity had no significant
effect on product yields in the range of conditions studied.
In this study, a series of experiments was conducted in which
• the reproducibility of the reactor system was established;
• the effect of reactor temperatures at constant solids retention time was studied;
• the effect of solids retention times at constant reactor temperature was studied;
and,
• the maximum reactor throughput with the PR Spring oil sands at pyrolysis
conditions was established.
Reproducibility of Fluidized Bed Pyrolysis
Two experiments (QTPRS11 and QTPRS13) were conducted at a reactor
temperature of 773 K and solids retention times of 26.0 and 27.2 minutes to test the
reproducibility of the operating and experimental procedures for the fluidized bed

426
system at elevated temperatures under pyrolysis conditions. The process operating
conditions, the product distribution and yields, and selected liquid product properties
are presented in Table 32. The temperature and differential pressure of the bed for
these two experiments were controlled by four temperature controllers and a differential
pressure controller. The temperatures for the two experiments were 773+2 and 773±3
K. The solids retention times for the two experiments controlled by the differential
pressure controller and the oil sands feeder auger speed. The differential pressures
across the bed were 2.24*0.11 and 2.19*0.10 kPa for QTPRS11 and QTPRS13,
respectively. The auger speeds of the two experiments were 2.0% of the full speed.
The solids retention times in the runs were 27.2 and 26.0 minutes and were considered
the same for purposes of the reproducibility evaluation. The minor difference of 1.2
minutes of the solids retention times was caused by oil sands feed rate fluctuations and
did not change the conclusions regarding reproducibility.
Selected bitumen-derived liquid properties were determined for the two experiments
to evaluate the reproducibility of the experimental procedures. The normalized product
distribution and yields for the two experiments were very close. Specific and API
gravities, pour points, viscosities, and Conradson carbon residues were in fairly good
agreement, and the simulated distillation results indicated that the two liquid products
had similar boiling range distributions. The results indicated that the fluidized bed
pyrolysis system was reliable and reproducible.
Effect of Pyrolysis Temperature on Product Distribution and Yields
The pyrolysis temperature is the most significant process variable which affects the
product distribution and yields in thermal cracking processes, especially in the pyrolysis
of oil sands. A series of experiments using the PR Spring oil sands as feed were
conducted, in which the reactor solids retention time and fluidizing gas velocity were
held constant at 30±1 min and 10 SLPM (standard liter per minute), respectively. The

427
Table 32. Reproducibility of Product Distribution and Yields with the PR Spring Oil Sands in a Fluidized Bed Pyrolysis Reactor
Experiment I.D. Date Tb,K TR, min.
APb,kPa
Auger Speed, % Ufi LPM
WU»f Steady State Run, min. Bitumen Mass Balance
Gases, wt% Liquids, wt% Coke, wt% Extractables, wt% Total Mass Bal., wt%
Normalized Yields Gases, wt% Liquids, wt% Coke, wt% Extractables, wt% Total Yields, wt%
Specific Gravity (288/288K) API Gravity (288 K) Viscosity (298 K), cp Pour Point, K Conradson Carbon, wt% Ash, wt% Simulated Distillation
ffiP-477 K, wt% 477-617 K, wt% 617-811 K,wt% >811K,wt%
Volatility, <811, wt% Elemental Analysis
Carbon, wt% Hydrogen, wt% Nitrogen, wt% Sulfur. wt%
H/C Ratio Molecular Weight, g/mol H/C atomic Ratio
QTPRS11 10/17/94 773±2
27.2 2.24+0.11
2.0 10
2.6 120
3.1 83.3 12.9 trace 99.3
3.1 83.9 13.0
trace* 100
0.9360 19.7 210 257 3.3 0.0
3.1 18.9 56.3 21.7
• 79.3
86.97 12.24 0.50 0.29
364 1.69
QTPRS13 10/21/94 773+3
26 2.19±0.10
2.0 10
2.6 121
2.9 78.5 13.3 trace 94.7
3.0 82.9 14.1
trace* 100
0.9408 18.9 320 263 4.5 0.1
2.8 18.2 56.6 22.4 77.6
87.28 11.88 0.54 0.30
383 1.63
Trace: Toluene extractable amount less than 0.01 g.

428
effect of reactor temperature on the product distribution and yields in the push mode
fluidization are presented in Figure 114 and Table 33.
The normalized total hydrocarbon liquid yields ranged from 76.0 wt% at 723 K to 81.8
wt% at 798 K. The liquid yield increased as reactor temperature increased from 723 to
773 K. An apparent maximum liquid yield of 84.2 wt% was obtained at 773 K. The
total liquid yield decreased from 84.2 to 81.8 wt% as the reactor temperature increased
from 773 to 798 K. The light gas yield steadily increased from 1.5 wt% at 723 K to
5.1 wt% at 798 K. The coke yield decreased from 21.9 to 13.1 wt% as the reactor
temperature increased from 723 to 773 K. The coke yield was insensitive to reactor
temperature above 773K. Similar product distribution and yields were obtained with
the PR Spring oil sands in a large diameter fluidized bed reactor pyrolysis study (106).
The thermal decomposition of bitumen during oil sands pyrolysis in a fluidized bed
reactor is a set of complex chemical reactions. The proposed mechanisms for bitumen
pyrolysis consists primarily of thermal cracking reactions (51, 155); however, Shun
(120) reported that the Circle Cliffs oil sands mineral matter exhibited catalytic
cracking activity at pyrolysis conditions. The apparent catalytic effect led to a
significant reduction in the bitumen-derived liquid yields. The liquid yields obtained in
this study were higher and the gas yields were lower than those reported in previous
pyrolysis studies using various oil sands (50, 51, 114, 119, 120). The reason for
higher liquid yields in this investigation was presumed to be related to the attainment of
the bubbling fluidization regime in the reactor.
The lowest normalized liquid yield, 76 wt%, was obtained at a reactor temperature
of 723 K and a solids retention time of 29 minutes. The amount of toluene extractables
leaving the reactor in the coked sand was 0.6 wt%, whereas the coke yield was 21.9
wt%. The liquid yields were lower at low temperatures due to the reduced severity of
the pyrolysis reactions as the temperature decreased. The higher coke yield and the
presence of toluene extractables on the coked sand indicated that some higher molecular

429
Figure 114.
Effect of Pyrolysis Temperature on the Product Distribution and Yields for the PR Spring Oil Sands in a Fluidized Bed Reactor

430
y\j-
80-
S?70-% . v>
S 60->
l s o -5
E 40-•c
CO
"5 30-U 3
T3 O
£ 20-
10-
n u • 1
• C1-C4 Gases, wt%
• Liquids, wt%
• Coke, wt%
• "• ' I 1 i
698 723 748 773 798 823 ReactorTemperature, K

431
Table 33. Effect of Pyrolysis Temperature on Product Distribution and Yields for the PR Spring Oil Sands in a Fluidized Bed Reactor
Experiment I.D. Date Tb,K T^min.
APb,kPa Auger Speed, % U6 LPM WUU Steady State Run, min.
Bitumen Mass Balance Gases, wt% Liquids, wt% Coke, wt% Extractables, wt% Total Mass Bal., wt%
Normalized Yields Gases, wt% Liquids, wt% Coke, wt% Extractables, wt% Total Yields, wt%
QTPRS17 11/05/94 723+4
29 2.43±0.07
2.0 10 2.6 120
1.5 73.7 21.2 0.5 96.9
1.5 76.0 21.9 0.6
100.0
QTPRS16 11/04/94 748±3
31 2.47+0.15
2.0 10 2.6 121
2.2 76.3 14.8 trace 93.3
2.4 81.8 15.9 trace 100.0
QTPRS05 09/27/94
773+3 29
2.27±0.06
2.0 10 2.6 148
2.9 85.0 13.0 trace 100.9
•
2.9 84.2 12.9 trace 100.0
QTPRS14 11/01/94 798+3
30.9 2.38±0.15
2.0 10 . 2.6 122
4.9 78.6 12.6 trace 96.2
5.1 81.8 13.1 trace 100.0

432
weight species were not converted to evaporable liquids at reactor temperatures below
723 K. The overall bitumen pyrolysis reaction is frequently represented as follows:
Bitumen—pyro^sis > Condensable Hydrocarbon VaporsCCj Liquids)
+ Hydrocarbon Gases (C, +C4) + Coke
Conceptually (not mechanistically) the pyrolysis can be represented as a combined
vaporization and pyrolysis/vaporization scheme:
Bitumen(< Tv) Va»°*:°«°» > Condensable Hydrocarbon Vapors (Liquids)
Bitumen(>Tv) ***** ) Bitumen Derived Heavy Oils(BDHO) on Sand Grains
+ Condensable Hydrocarbon Vapors (Liquids) + Hydrocarbon Gases (Ci - C4 ) + Coke
The BDHO intermediate can undergo further reaction to produce coke and/or vapor
phase products or it can vaporize:
BDHO Ve"x,ri:ation > Condensable Hydrocarbon Vapors (Liquids)
BDHO Pyn** ) Condensable Hydrocarbon Vapors (Liquids)
+ Hydrocarbon Gases (C, -C4) + Coke
If the reactor is operated at a temperature where the rate of coke formation is
greater than the rate of BDHO vaporization and pyrolysis, then the coke yield would be
expected to increase at this temperature at the expense of liquid yield. The longer the
BDHO remains in contact with the sand surface the greater the tendency to form coke
whereas once the reaction products are vaporized they are rapidly swept out of the

433
reactor. The conceptual pyrolysis scheme was invoked to explain the observed trends
in product distribution as a function of temperature: the bitumen-derived liquid yields
increased and coke yields decreased as the reactor temperature increased from 723 to
773 K. A maximum liquid yield of 84.2 wt% was obtained at 773 K. The coke yields
remained unchanged as the reactor temperature increased from 773 to 798 K.
However, secondary vapor phase cracking of condensable vapors to gas may have
shifted the liquid and gas yields and consequently, the product distribution.
Effect of Solids Retention Time on Product Distribution and Yields
The average solids retention time (9S) in the fluidized bed reactor was defined as the
bed hold-up divided the oil sands feed rate.
w 0s=-f (32A)
F
The solids retention time can be varied by changing the bed hold-up or by adjusting
the oil sands feed rates. The solids retention time in this study was changed and
controlled by changing the feed-auger speed while the bed hold-up was held constant.
The feed rate of oil sands was not precisely controlled compared to reactor temperature
because the auger speed control operated in the low range from 1.5 to 3.0 % of full
range and the E-auger was relatively large based on the feed rate. The average solids
retention times exhibited minor differences even though the auger speed control was set
to the same value in different runs. A series of solids retention time experiments using
the PR Spring oil sands was conducted to determine the effect of solids retention time
on product distribution and yields and total liquid product quality.
The effect of solids retention time on the product distribution and yields in the push
mode of fiuidization are presented in Table 34 and Figure 115. The average solids

Table 34. Effect of Solids Retention Time on Product Distribution and Yields for the PR Spring Oil Sands in a Fluidized Bed Reactor
Experiment I.D. Date Tb ,K T^mui.
APb, kPa
Auger Speed, % Ufi LPM W r f Steady State Run, min. Bitumen Mass Balance
Gases, wt% Liquids, wt% Coke, wt% Extractables, wt% Total Mass Bal., wt%
Normalized Yields Gases, wt% Liquids, wt% Coke, wt% Extractables, wt% Total Yields, wt%
QTPRS08 10/10/94 773+6 18.5
2.20+0.26 1 3.0
10 2.6 52
3.6 79.8 16.4 trace 99.8
3.6 80.0 16.4 trace 100.0
QTPRS13 10/21/94 773±3
26
2.19+0.10
2.0
10 2.
121
2.9 78.5 13.3 trace 94.7
3.0 82.9 14.1 trace 100.0
QTPRS05 09/27/94
773+3 29
2.27±0.06
2.0 10
2.6 148
2.9 85.0 13.0 trace 100.9
2.9 84.2 12.9 trace 100.0
QTPRS04 09/23/94
773+2 39
2.30+0.09
1.5 10 2.6 180
3.7 84.4 12.9 trace 101.1
3.7 83.5 12.8 trace 100.0

435
Figure 115.
Effect of Average Solids Retention Time on the Product Distribution and Yields for the PR Spring Oil Sands in a Fluidized Bed Reactor

436
80-
^ 7 0 ->
J 60->--a § 5 0 -s
.2 J 40-
Prod
uct
Dis
to
O
J o
o 1
,1
,
10-
n u
•
•
• 1
• •
• C1-C4 Gases, wt%
• Liquids, wt%
• Coke, wt%
A A
• • i 1 i
•
A
• i
15 20 25 30 35 40 45 Solids Retention Time, min.

437
i -
retention time was varied from 18.5 min to 39 min, whereas the reactor temperature was
held constant at 773 K. The liquid yields increased with solids retention time from 80.0
wt% at an 18.5 min average retention time to a maximum value of 84.2 wt% at a 29 min
average retention time. The liquids decreased slightly to 83.5 wt% as the average
retention time increased further to 39 min.
The total liquid yields increased as the solids retention time increased at constant
reactor temperature. The gas yield was insensitive to changes in solids retention times:
it only increased from 3.6 wt% at 18.5 to 3.7 wt% at 39 min. The coke yield
decreased from 16.4 to 12.9 wt% as the solids retention time increased from 18.5 to 29
min. The coke yield was constant as the solids retention time increased further from 29
to 39 min.
Changes in the solids retention time at a fixed bed inventory affected the bitumen-
to-nitrogen feed ratio in the fluidized bed. An increase in solids retention time
reduced the bitumen fed-to- nitrogen ratio. The tendency of low vapor pressure
species being swept out increased in a nitrogen-rich environment. The vapor phase
retention time was constant at about 8 seconds as the average solids retention time
increased from 18.5 to 39 min at constant fluidizing gas rate of 10 SLPM. The solids
retention time was 140 to 280 times greater than the vapor phase retention time. The
pyrolysis reactions occurred in dense and diluted solid phases with minimal secondary
cracking reactions in the vapor phase. Secondary cracking in the gas phase would be
expected to be unchanged for a given fluidizing gas flow rate at a fixed temperature.

4 3 8
>. — _
Study of Short Solids Retention Time
The short solids retention time experiments were conducted using the PR Spring oil
sands as feed sand to determine the limits of the fluidized bed pyrolysis reactor
regarding oil sands throughput and the attendant effects on the product distribution and
yields. The results of a pair of experiments are presented in Table 35. Two
experiments were conducted at different conditions: QTPRS08 was conducted at a
reactor temperature of 773 K and a solids retention time of 18.5 min, and QTPRS12
was conducted at a reactor temperature of 798 K and a solids retention time of 20
minutes. The first experiment operated at steady state for 52 minutes, and the second
one operated at steady state for 86 minutes. The coke yields for two experiments were
higher than corresponding longer solids retention time runs (QTPRS05 and QTPRS14)
at 723 K and 798 K, respectively. The normalized product distributions were nearly
the same which was unexpected given the significance of temperature as a variable in
pyrolysis reactions.
The reactor temperature and pressure fluctuations also increased in magnitude and
frequency when the solids retention time was decreased. The onset of reactor plugging
was detected in these experiments based on the differential pressure across the bed.
This indicated that the reactor system was not capable of sustained long-term operation
at solids residence times less than 20 min as indicated by differential pressure
instabilities in the reactor. Although the furnace supplied enough heat through the wall
of the reactor at short solids residence time (< 20 min), the reactor shut down due to
plugging. The magnitude of the temperature fluctuations in the runs of
QTPRS08 and QTPRS12 was ±6 K, which was 2 to 3 K (or 70 to 100%) greater than
for typical stable pyrolysis experiments, i.e., QTPRS05 or QTPRS04. The
differential pressure across the bed in runs QTPRS08 and QTPRS12 was 2.20 kPa.
The variations around the set-point were ±0.26kPa. The differential pressure variations
for stable pyrolysis experiments were typically less than 0.1 kPa. Thus the instabilities

439
Table 35. Effect of Short Solids Retention Time on Product Distribution and Yields for the PR Spring Oil Sands in a Fluidized Bed Reactor
Experiment ID . Date Tb ,K T^min.
APb,kPa Auger Speed, % Uf, LPM WIW Steady State Run, min. Bitumen Mass Balance
Gases, wt% Liquids, wt% Coke, wt% Extractables, wt%
Total Mass Bal., wt% Normalized Yields
Gases, wt% Liquids, wt% Coke, wt% Extractables, wt% Total Yields, wt%
QTPRS08 10/10/94 773±6
18.5 2.20+0.26
3.0 10 2.6
52
3.6 79.8 16.4
Trace
99.8
3.6 80.0 16.4
Trace 100.0
QTPRS12 10/20/94 798±5
20 2.15±0.22
3.0 10
2.6 86
3.6 74.1 13.3 trace
91.1
4.0 81.4 14.6 trace 100.0

440
were two to three times higher at short solids retention times than these were for stable
pyrolysis experiments at longer retention times.
A portion of the oil sands particles fed to the reactor were several times greater than
the screen size (3.2 mm) used to prepare the feed sands. This was related to
agglomeration of oil sands particles during transport through the feeder auger at the
higher feed rates due to auger induced shear and factional forces. The agglomerates
formed during feeding did not disperse into smaller particles until the pyrolysis
reactions were completed and in some instances were bound together by coke. The
large oil sands lumps could not be fluidized in the reactor which limited heat and mass
transfer between the solids and the fluidized phases and disrupted the bubbling
fluidization mode. The incompletely reacted bitumen-residue wetted sand particles
caused the bed to plug.
Characteristics of the Total Liquid Products
The quality of the hydrocarbon liquids produced in the fluidized bed pyrolysis
process was dependent on the operating variables as reflected by their physical and
chemical properties (82, 104). The pyrolysis of the PR Spring oil sands in this work
gave high bitumen-derived total liquid product yields (76-84 wt%) with low gas yields
(2-5 wt%) relative to those from the other Uinta Basin oil sands deposits (50, 51, 114,
119, 120). Based on bitumen fed to the reactors, liquid yields ranged from 17 to 75
wt% and gas yields ranged from 15 to 22 wt% in small diameter fluidized bed
pyrolysis process studies. A maximum yield of 75 wt% was obtained using PR Spring
Rainbow I oil sands (51) and a minimum of 17 wt% of liquid yield was found using
Circle Cliffs oil sands (120). Shun (120) reported that the catalytic characteristics of
the host rock led to the low liquid yields. The total liquid yields in this study were
similar to the liquid yields (77-90 wt%) reported for large diameter fluidized bed
reactor (15.2 cm) studies (106, 121) in which slugging and channeling were absent.
The reasons probably relate to the nature of the oil sands and the fluidization regimes in

441
which the fluidized bed reactor was operated. The previous small fluidized bed
reactors (3.8 and 10.2 cm diameter) had a tendency to slug, especially the 10.2 cm
diameter reactor (119). Heat transfer was greatly hindered in the slugging regime
where the piston movement of bulk sand also caused poor mass transfer (135). In oil
sands pyrolysis this could result in inefficient removal of the vapor phase from contact
with the sand particles in the plug, thus leading to the secondary cracking of product
vapors and a shift to high gas and low liquid yields. The fluidized bed reactor used in
this study was operated in the bubbling fluidization regime as confirmed in fluidization
studies. The improved quality of fluidization in this system may be a factor which led
to the high liquid and low gas yields. Bubbling fluidization is characterized by good
heat and mass transfer and decreased retention time of vapor products in the reactor
which suppresses secondary cracking during pyrolysis. This should further lead to a
better quality of bitumen-derived liquid products. The same trend was obtained in a
large diameter fluidized bed reactor (106, 121).
The determination of liquid product properties was undertaken to assertion the
influence of the process variables (i.e., reactor temperature and solids retention time)
on the quality of the liquid products. Ultimately, these analyses will aide in the
determination of the preferred process scheme for upgrading and refining of bitumen-
derived liquid products. The effect of the pyrolysis process variables on liquid
properties will be discussed with respect to oil sands pyrolysis to determine the extent
of upgrading between the liquids and the bitumen.
Effect of Reactor Temperature on the Liquid Product Quality
A series of experiments was performed to determine the influence of reactor
temperature on the liquid product properties. The effect of temperature on the physical
and chemical properties of the total liquid quality was studied in the temperature range
from 723 to 798 K at a fixed solids retention time of 30±1 minutes. The effect of

442
reactor temperature on the properties of the total liquid products produced from the PR
Spring oil sands in a fluidized bed reactor are presented in Table 36.
The API gravity of bitumen derived liquid products steadily decreased from
19.6°API at a reactor temperature of 723 K to 19.0°API at 798 K. The API gravity of
the bitumen on the feed oil sands was 11.2° API. The increase in the API gravity of the
PR Spring total liquid products relative to the bitumen was related to the severity of the
thermal decomposition reactions at the pyrolysis temperatures.
The effect of reactor temperature on the viscosity of the liquid products from the
PR Spring oil sands was also investigated. The viscosity of the liquid products
decreased from 298 cp at 723 K to 247 cp at 798 K at a constant solids retention time
of 30±1 min. The decrease in viscosity with increasing temperature was consistent
with the API gravity data. The slight decline in viscosity with temperature was
probably related to a slight increase in the severity of thermal cracking as the reactor
temperature increased from 723 to 798 K.
The Conradson carbon residue of the liquid products increased with reactor
temperature from 3.4 wt% at 723 K to 4.5 wt% at 798K. This was a significant
decrease relative to the bitumen (16.1 wt%) and represented a major improvement in
the quality of the bitumen-derived heavy oils relative to the bitumen. The ash content
for each sample was insignificant (<0.1 wt%) and was related to the entrainment of
fine particles in the fluidizing gas and heavy oil vapors. Fluidizing gas velocity was
held constant in each experiment at 10 LPM. Hence, the ash content in the liquid
products due to fines entrainment was expected to be independent of process
conditions. The ash contents indicated that the fluidizing gas velocity was low enough
to minimize entrainment and that the condenser/strainer system was functioning as
designed.
The pour points of the liquid products were independent of the reactor temperature.
The lower pour points of the liquid products relative to the bitumen were consistent

443
Table 36. Effect of Reactor Temperature on the Properties of the Total Liquid Products
Produced from the PR Spring Oil Sands in a Fluidized Bed Reactor
Experiment I.D.
Date Tb ,K T^min. APb,kPa Specific Gravity (288/288K) API Gravity (288K) Viscosity (298K), cp Pour Point, K Conradson Carbon Residue, wt% Ash,wt% H/C Atomic Ratio Simulated Distillation
IBP-477 K, wt% 477-617 K, wt% 617-811 K,wt% >811K,wt%
Volatility (<811 K), wt% Elemental Analysis
Carbon, wt%
Hydrogen, wt% Nitrogen, wt% Sulfur, wt%
Molecular Weight Nickel, ppm Vanadium, ppm
QTPRS17 11/05/94 723+4
29 2.43±0.07
0.9364 19.6 298 262 3.4
0.1 1.70
2.7 17.9 56.9 22.6 77.4
86.92
12.29 0.51 0.28 365
6 <5
QTPRS16 11/04/94 748+3
31 2.47±0.15
0.9379 19.4 282 262 3.9
0.0 1.69
2.9 17.6 56.6 22.9 77.1
86.96
12.28 0.50 0.26 373
8 <5
QTPRS05 09/27/94
773+3 29
2.27±0.06
0.9391 19.2 277 260 3.7
0.1 1.68
2.7 19.4 55.3 22.6 77.4
87.03
12.18 0.50
- 0.29 376 10 <5
QTPRS14
11/01/94 798±3 30.9
2.38±0.15
0.9400 19.0 247 257 4.5
0.1 1.67
19.2 56.6 20.9 79.1
87.14
12.06 0.51 0.29 366 12 <5
Bitumen
0.9913 11.2
3492* 339 16.1
3.2 1.60
0.2 5.5 30.6 63.7 36.3
86.99
11.63 1.08 0.30 809 78 18
*: Bitumen viscosity measured at 363 K.

444
with the thermal cracking of heavy molecular species at pyrolysis temperatures in the
range 723 to 798 K.
Simulated distillation data for the liquid products produced in the temperature range
from 723 to 798 K are presented in Table 36 and Figure 116. The boiling point
distributions and liquid product yields did not change significantly with reactor
temperature. This is similar to the results reported by Dorius [1984] for the fluidized
bed pyrolysis of PR Spring oil sands. The gasoline (IBP-477 K), middle distillates
(477-617 K), and the gas oil (617-811 K) fractions were insensitive to reactor
temperature. The volatility of liquid products increased from 77.4 to 79.1 wt% as the
reactor temperature increased from 723 to 798 K. The residuum (>811 K) fraction
decreased from 22.6 wt% to 20.9 wt% as the reactor temperature increased from 723
to 798 K.
The influence of reactor temperature on H/C atomic ratios of the total liquid
products was consistent with the trend observed for viscosities and API gravities. The
heteroatom contents of the liquid products were little influenced by changes in reactor
temperature. The increase in the H/C ratios of the total liquid products was related to
carbon rejection via the formation of the carbonaceous residue on the sand grains
during pyrolysis.
Effect of Solids Retention Time on the Liquid Product Quality
A set of experiments was conducted to study the effect of solids retention time on
liquid product properties using the PR Spring oil sands as feed. The study was
conducted by varying solids retention time from 18.5 to 39 min at a fixed reactor
temperature of 773±3 K. The effect of solids retention time on the total liquid product
quality is presented in Table 37.

Figure 116.
Effect of Reactor Temperature on the Simulated Distillation of the Total Liquid Products Produced from
the PR Spring Oil Sands in a Fluidized Bed Reactor

446
£50-
« £ 40-
1 30-D T3
<L>
| 2 0 -
• •
•
BP-J77K.
477-617 K
617-811 K
•
D
>8U K
Volatility (<81 IK)
10-
723 748 773 798 Reactor Temperature, K

447
Table 37. Effect of Average Solids Retention Time on the Properties of the Total Liquid Products Produced from the PR Spring Oil Sands in a Fluidized Bed Reactor
Experiment I.D. Date Tb ,K Tfoinin.
APb,kPa Specific Gravity (288/288K) API Gravity (288K) Viscosity (298K), cp Pour Point, K Conradson Carbon Residue, wt% Ash, wt% H/C Atomic Ratio Simulated Distillation
IBP-477 K, wt% 477-617 K,wt% 617-811 K,wt% >811K,wt%
Volatility (<811K),wt% Elemental Analysis
Carbon, wt% Hydrogen, wt%
Nitrogen, wt% Sulfur, wt%
Molecular Weight Nickel, ppm Vanadium, ppm
QTPRS08 10/10/94 773+6 18.5
2.20±0.26
0.9300 20.7 231 258 2.6
0.1 1.71
3.1 22.2 58
16.8 83.2
86.84 12.37
0.51 0.28 353
QTPRS13 10/21/94 773+3
26 2.19+0.10
0.9408 18.9 320 263 4.5
0.1 1.63
2.8 • 18.2
56.6 22.4 77.6
87.28 11.88
0.54 0.30 383
QTPRS05 09/27/94
773±3 29
2.27±0.06
0.9391 19.2 277 260 3.7
0.1 1.68
2.7 19.4 55.3 22.6 77.4
87.03 12.18
0.50 0.29 376 10 <5
QTPRS04 09/23/94
773±2 39
2.30±0.09 0.9417
18.8 311 262 4.0
0.1 1.67
2.9 18.9 55.3 22.9 77.1
87.08 12.12
0.50 0.30 379
Bitumen
0.9913 11.2
3492* 339 16.1
3.2 1.60
0.2 5.5 30.6 63.7 36.3
86.99 11.63
1.08 0.30 809 78 18
*: Bitumen viscosity measured at 363 K.
448
Since the 18.5 min run (QTPRS08) was terminated when the reactor plugged, it
was not considered as a successful run. Thus, the effect of solids retention time on
total liquid product quality only considered 26, 29, and 39 min retention time runs. As
indicated in the fluidization study, the superior bubbling fluidization suppressed the
secondary cracking. The solids retention time did not exhibit any clear influence on the
properties of the liquid products. This phenomena was also observed from large
diameter fluidized bed reactor (106).
Extent of Upgrading as Reflected in Total Liquid Product Quality
It is essential to understand that total liquid quality improved significantly during
fluidized bed pyrolysis in the 7.62 cm fluidized bed reactor. A comparison of the
physical and chemical properties of the liquid product produced at 773 K and a solids
retention time of 29 min and the PR Spring bitumen is presented in Table 38.
Significant changes occurred during fluidized bed pyrolysis. The specific gravity of
the bitumen was higher than that of liquid products. The API gravity improved from
11.2 to 19.2°API. The viscosity of the liquid product decreased several orders of
magnitude relative to the bitumen feed. The pour point of liquid product was markedly
reduced during pyrolysis. The API gravity, 19.2°API; the viscosity, 277 cp at 298 K;
and the pour point, 260 K indicated that the total liquid product produced at 773 K
and a solids retention time of 29 min was pipeline quality petroleum liquid. The
Conradson carbon residue decreased by a factor of four from 16.1 wt% to 3.7 wt%.
The boiling point distribution indicated that during pyrolysis the volatility increased
from 36 to 77 wt%, whereas the resid content was reduced from 64 to 33 wt%.

449
Improvement in the liquid quality occurred because of thermal cracking of high
molecular weight materials to smaller compounds. This was observed as a reduction in
molecular weight process. An increase in H/C atomic ratio indicated that the liquid
quality increased during pyrolysis. The nitrogen contents of the liquid products
decreased by approximately 50%. This observation was significantly different from the
trends reported previously [Hanson and Oblad, 1988] regarding the fate of nitrogen
heteroatoms during oil sands pyrolysis. The nitrogen contents of the total liquid
products produced in the small diameter (50, 51, 114, 120) and large diameter (106,
119, 121) fluidized beds were little different from that of bitumen. It was presumed
that nitrogen containing heteroatomic species were deposited in the carbonaceous
residue on the sand grains during thermal cracking and coke formation. The sulfur
contents of the total liquid products were little different from that of the bitumen which
was consistent with the results reported previously (104). Inorganic material, such as
metals and ash, were significantly decreased. The reduction in Conradson carbon
residue, resid content, and metals were a reflection of the significant upgrading
accomplished during pyrolysis of the oil sands.
Liquids produced from the fluidized bed pyrolysis process were significantly
upgraded relative to the bitumen. The experimental results indicated that it was
technically feasible to use the fluidized bed pyrolysis process to recover an upgraded
bitumen-derived liquid product. Pyrolysis followed by hydrotreating may reduced the
overall costs of upgrading to synthetic crude oil relative to aqueous extraction followed
by coking and/or hydrotreating.

450
SUMMARY AND CONCLUSIONS
A fiuidized bed reactor system was designed, installed, and operated for the
pyrolysis of the PR Spring oil sands under push mode fluidization. A number of
previously reported problems with oil sands pyrolysis in a small diameter reactor
(<15.2 cm) were resolved through improved oil sands feeding, coked sands
withdrawal with a modified aerated L-valve, and a modified liquid recovery system.
The following conclusions were drawn from this investigation.
The coked sands feeding study indicated that commercial Acrison model BDF-1 bin
discharge feeders were capable of feeding dry coked sands. An E-auger with a water-
cooled discharge cylinder (30.5 cm long) operated at low auger speeds, 1-3% full
range, was successfully used to feed undiluted PR Spring oil sands. The water-cooled
E-auger exhibited reproducible feed rates and an appropriate correlation between oil
sands feed rate and the auger speed was established.
A modified aerated L-valve with two aeration ports was used as a solids withdrawal
device. The secondary aeration port facilitated the transfer of large particles from the
downcomer to the coked sands receiver and resolved the L-valve solids withdrawal
plugging problems. The L-valve study indicated that the device was suitable for
controlling and metering solids removal in a small diameter fiuidized bed pyrolysis
reactor.
A series of fluidization and defluidization experiments with multisized coked sands
was conducted to establish the regime in which the reactor operated during oil sands
pyrolysis. The coked sands fluidization studies indicated that the bed operated in the
bubbling regime, which was different from previous studies in which the slugging
regime predominated.
Three different fluidization modes were investigated in the system: conventional
push, reduced pressure, and pull fluidization modes. Pressure analyses were performed
for three fluidization modes.
451
The minimum fluidization velocity was 1.41 cm/s in push fluidization mode and
1.35 cm/s in reduced pressure fluidization mode. The difference between the push and
reduced pressure fluidization modes was related to the reactor pressure. The decrease
in fluidizing gas density at the bed pressure in the reduced pressure mode relative to the
push mode led to the decreased U^. The minimum fluidization velocities for both
modes were predicted using the Wen-Yu empirical equation (145). The calculated
values of U^ in the push and reduced pressure fluidization modes were 1.46 cm/s and
1.39 cm/s, respectively.
The tapered gas distributor gave a unique fluidization curve which had four separate
regimes: packed bed, transition, partial inner column fluidization, and fully developed
fluidization. The partial inner column fluidization distinguishes a tapered gas
distributor from a conventional flat plate distributor. The fluidizing gas velocity during
pyrolysis was achieved in a fully developed fluidization regime characterized by
bubbling fluidization.
Elevated temperature fluidization at push fluidization mode suggested that the
ambient temperature empirical correlations, and even the Ergun equation deviated
significantly from results. The deviation increased dramatically with an increase in
fluidization temperatures. The effect of temperature on minimum fluidization velocity
for coked sands was correlated to U^ = 2.03-2.02x10~3T cm/s in the temperature
range of 294 to 623 K.
Fluidization during continuous feeding and withdrawal indicated that the PR Spring
coked sands can be fluidized in the small fluidized bed reactor under pull fluidization
mode.
The pyrolysis study demonstrated that upgraded bitumen-derived liquids can be
produced during oil sands pyrolysis in a fluidized bed. The reproducibility study
indicated that process variable results for fluidized bed pyrolysis of oil sands can be
duplicated. The product distributions and yields and liquid product qualities at the

452
same reactor temperature and solids retention time were in good agreement for the two
experiments.
The major focus of this investigation was the pyrolysis of the PR Spring oil sands
and the study of the influence of process variables (temperature and solids retention
time) on product distributions and yields and total liquid product properties. The
bitumen-derived liquid yields increased as reactor temperature increased at fixed solids
retention time, passed through a maximum, and decreased as reactor temperature
continued to increase. The coke yields decreased and the hydrocarbon gas (Cl to C4)
yields increased as reactor temperature increased. A maximum liquid yield of 84.2
wt% was obtained at a reactor temperature of 773 K and a solids retention time of 29
min with the PR Spring oil sands. The liquid yields increased as the solids retention
time increased at a fixed reactor temperature. The coke yields increased as solids
retention time decreased. The Cl to C4 gas yields were insensitive to solids retention
time Reactor temperature exerted a greater influence than solids retention time on the
total liquid product liquid properties. Even though pyrolysis significantly affected the
liquid product properties relative to bitumen, the effects of changes in reactor
temperature and solids retention time were minor. Its was presumed that the reactor
operated in the bubbling fluidization which is characterized by superior heat and mass
transfer. In oil sands pyrolysis this could facilitate the release of hydrocarbon vapor
from the sand particles, reduce secondary cracking, and dampen the process variable
effects observed in slugging reactors. The total liquid properties indicated that
substantial upgrading occurred during the pyrolysis process, that is, significant
improvements on API gravities, specific gravities, viscosities, Conradson carbon
residues, and pour points were achieved. The extent of upgrading was also indicated
by improved liquid volatilities, metal contents, and molecular weights. The sulfur of
the total liquid products was little different from that of the bitumen and was
independent of the process conditions. However, there was a reduction of

453
approximately 50% for the nitrogen contents. This effect has not been previously
reported for either the large or small diameter reactors regardless of the origin of the
feed oil sands.
The pyrolysis studies indicated that the preferred recovery sequence would be oil
sands pyrolysis followed by hydrotreating of the total liquid products to reduce the
heteroatom concentrations.

454
FLUIDIZED BED PYROLYSIS OF OIL SANDS IN A LARGE DIAMETER REACTOR
Principal Investigator: F.V. Hanson Co-Principal Investigator: J.V. Fletcher Graduate Student: S. Nagpal
INTRODUCTION
Pyrolysis of oil sands in a fluidized bed reactor has been investigated by various
researchers (50, 51, 108, 114-117, 119-121, 156). The basic process involves the following three
steps: feeding oil sands to a heated fluidized bed, condensation and collection of the cracked and
distilled heavy oil fractions and continuous withdrawal of coked sand from the reactor. The
bitumen on the oil sands undergoes the following overall reaction:
Bitumen > a. Liquid + b. Coke + c. Gases
In the above equation, a, b and c are the weight fractions based on unit weight of bitumen reacted.
Various operating parameters have been found to effect the product distribution and yields (i.e.,
a, b and c) from these reactors. These variables include the reactor temperature, solids retention
time in the reactor, nature of the oil sands, the fluidizing gas flowrate, the nature of the fluidizing
gas, the chemical and physical nature of host rock, the reactor loading (height-to-diameter ratio
(H/D) of the settled bed), and the design of the reactor.
Pyrolysis of OH Sands
A systematic study to develop the scientific and engineering data base necessary for
commercialization of Utah's tar sand deposits was started in 1973 at the University of Utah (82,
157). The emphasis of this program was on water-assisted (45, 158-160); and thermal recovery
technologies (104, 113, 161, 162); upgrading of the bitumen derived heavy oils and

455
characterization of hydrocarbon liquid products and bitumens (163).
The initial fluidized bed investigators at the University of Utah were carried out by Weeks
(115), Jayakar (116), and Venkatesan (51). A 5-cm ID fluidized bed reactor capable of
processing up to 2.27 kg/h of oil sands (164) was constructed. The reactor system included two
coupled fluidized beds - one for pyrolysis of oil sands and the other for combustion of coked sand.
Heat was transferred from the combustion bed to the pyrolysis bed by a heat pipe which contained
potassium as the heat transfer fluid. These studies were conducted with the crushed and mixed
ore from the Tar Sand Triangle and Asphalt Ridge oil sands deposits. The product yields were
reported to be dependent upon the reactor temperature. A temperature of 773 K was found to
maximize the liquid yields. However, less than 80% of the bitumen fed to the reactor could be
accounted for in this exploratory study.
Venkatesan (50) constructed a bench scale fluidized bed pyrolysis reactor (3.6 cm ID).
The reactor was designed to process a maximum of 2.5 kg/h of oil sands. Effects of reactor
temperature and solids residence time on product distribution and yields were investigated with
crushed and sized oil sands from the Sunnyside and Tar Sand Triangle deposits. It was concluded
that a reactor temperature of about 723 K gave the maximum liquid yield of 61 % (based on
bitumen fed to the reactor) with the Sunnyside oil sand feed. The temperature for maximum
liquid production was found to shift to 798 K in the case of Tar Sand Triangle oil sand feed. The
liquid yields were inversely related to the solids retention times. It was predicted that a maximum
liquid yield of about 80% could be achieved at the preferred reactor temperature and retention
times in the range of 12-16 min (165). Detailed chemical and physical property analyses of the
liquid products were carried out. The API gravity and viscosity were found to decrease with
reactor temperature while the Conradson carbon residue and volatility were found to increase.

456
Wang (114) conducted runs with Whiterocks and Tar Sand Triangle oil sands in the reactor
constructed by Venkatesan (50) and reported similar trends in product distribution. The maximum
liquid yield with the Whiterocks oil sands was obtained at a lwo solids residence time and a
reactor temperature of about 798 K. A correlation based on regression analysis was developed
to fit the experimental yield data. It was predicted that a liquid yield of about 80% could be
achieved at a solids retention time of 12 min and a pyrolysis temperature in the range from 803
K to 823 K. A primary conclusion of this study was that the liquid yield was more dependent on
the solids retention time than on any other parameter in laboratory scale reactors.
Smart (117) investigated the effect of reactor temperature and solids residence time on the
pyrolysis of oil sands in a mini-pilot scale fluidized bed reactor (10.8-cm ID). This reactor was
scaled up from the design of Jayakar (116) and Weeks (115). Three oil sands were investigated -
PR Spring, Whiterocks and Sunnyside. The reactor temperature was varied from 713 K to 773
K and the solids retention time ranged from 30 to 48 min. Since the number of satisfactory runs
with Whiterocks and Sunnyside oil sands were too few to establish interpretable trends, only the
PR Spring runs were used to determine the effects of process variables on the product distribution
and yields. The liquid and gas yields were reported to increase with temperature while the coke
.yield decreased. Similarly, an increase in solids residence time resulted in an increase in liquid
yields. These results were contrary to the trends observed by other workers (50, 51, 114). In
terms of liquid properties, the API gravity did not indicate any trend with reactor temperature
whereas the viscosities decreased from 2000 to 500 cp as the temperature increased from 713 to
773 K.
Dorius (51) followed up on the work of Venkatesan (50) and Wang (114) and investigated
the pyrolysis of Whiterocks (WR), PR Spring Rainbow-I (PRS-RI), PR Spring Rainbow - II (PRS-

457
RII) and PR Spring South (PRS-S) oil sands. The reactor temperatures at which maximum liquid
yields were obtained were 798 K for PRS-RI and PRS-RII and 823 K for PRS-S. The difference
in these two temperatures was attributed to the highly asphaltic nature of PRS-S bitumen as
compared to the other two bitumens (104). Dorius (51) expanded on the regression analysis of
Wang (114) and developed a set of correlations to predict product yields which correlated the
experimental data better. Moreover, the asphaltene content, Conradson carbon residue and the
H/C ratio of the bitumen were determined to have a very strong influence on the product
distribution (166). The effect of operating parameters on the liquid quality was also determined.
The results were similar to those reported by Venkatesan (51).
Sung (119) constructed 4-in diameter glass fluidized bed and pilot plant fluidized bed
reactors to study the hydrodynamics of coked sand fluidization and the pyrolysis of the Circle-
Cliffs oil sands, respectively. A 21-h long production run with Whiterocks oil sands was also
carried out. The liquid yield during the production run with Whiterocks oil sands was 45 wt%.
Shun (120) rebuilt the reactor system originally constructed by Venkatesan (51) and
conducted pyrolysis runs with the Circle Cliffs oil sands. The product distribution and yield
patterns in these experiments were found to be very different from those of earlier investigations
with other oil sands. A maximum liquid yield of 35.9 wt% was obtained at a reactor temperature
of 823 K and solids residence time of 15 min. The gas yields were found to be much higher (30-
35 wt%) than those previously reported. Furthermore, the recovered total liquid product
contained a large amount of condensed water. The low liquid yield, high gas yield and the
product water were attributed to the unusual chemical nature of the mineral substrate/host rock.
The host rock contained kaolinite which released large amounts of bound water at pyrolysis
temperatures. The activated kaolinite was presumed to have catalytically cracked the produced

458
liquid-boiling range vapors (104).
Deo et al. (167) reexamined the fluidization data of some of the previous studies (50, 51,
114, 120) and determined that the fluidization regime (based on the criterion proposed by Clift
(168) in each case was in the slugging regime instead of the intended bubbling regime. Fletcher
(121) constructed a pilot scale fluidized bed reactor capable of processing up to 20 kg/h of oil
sands. Various hydrodynamic studies were carried out and a new correlation for predicting the
minimum fluidization velocity (Umf) was proposed (121). The effect of temperature on Umf was
also investigated and a new correlation was determined. The new reactor system incorporated
some of the features of a commercial oil sands processing unit. Instead of electrical heating, the
reactor used a propane burner as the source of heat. The burner flue gases were used to fluidize
the bed instead of nitrogen as in previous studies. Care was taken to ensure that the bed operated
in the bubbling fluidization regime by operating in the "pull" mode rather than the conventional
"push" mode (121). Pyrolysis of Whiterocks oil sands was investigated in the temperature range
from 723 to 798 K and the solids residence times between 30 to 76 minutes. There was a
substantial increase in the maximum liquid yields as compared to the previous studies in the bench
scale fluidized bed reactors (50, 51, 114, 115, 117, 119, 120); 85% vs. 70%. The gas yields
were lower. (5% vs. 20%) and the coke yield also showed a minor reduction. Moreover, no
significant trends were observed in the product distribution and yields with respect to the reactor
temperature and solids retention time. The difference may be related to the C02 and steam rich
fluidizing gas and the better quality of fluidization in the reactor or to a combination of the two.
Bhadkamkar (156) conducted pyrolysis experiments with Whiterocks oil sands in a coupled
fluidized bed reactor system (117) and obtained liquid yields ranging from 50.0 to 74.6 wt%. The
maximum liquid yield (74.6 wt%) was obtained at a solids residence time of 12 min and a reactor

459
temperature of 734 K. The C5-C6 yield from the reactor was significant (13 to 49 wt%) indicating
a high degree of secondary cracking. However, no discemable trends in product yields with
respect to process parameters could be established.
General Trends in Product Yields and Quality
Most researchers agree that there are two important operating parameters that affect the
product yields from the pyrolysis reaction in a fluidized bed reactor (104). These are the reactor
temperature and the solids residence times.
Reactor Temperature
The liquid product yields have been plotted in Figure 117. The effect of reactor
temperature on liquid yields can be analyzed to two different methods.
1. Subdivision I: Figure 117 can be divided into three distinct regions based on the amounts
of liquid product yields. These regions are presented in Figure 118. Region I contains
results with liquid yields higher than 75%, Region II has liquid yields between 45% to
75% and Region III consists of all results with liquid yields less than 45%. The bulk of
the results lie in Region II (50, 51, 114, 117). Region III has results of only one
researcher (120). The uncharacteristically lwo liquid yields of Shun (120) were attributed
to the unusual nature of the Circle Cliffs oil sands and the small reactor diameter which
could have resulted in slugging in the bed. Sung (119) reported higher liquid yields with
Circle Cliffs oil sands in a,large diameter fluidized bed. The results included in Region
I of Figure 118 are those of Fletcher (121). The reason for high liquid yields is not clear
at this stage. However, superior fluidization quality and steam and CO, rich fluidization
gas have been proposed as possible explanations (121).
2. Subdivision II: Regions II and III in Figure 118 can be divided into sub-Regions IV and

460
Figure 117
Liquid Yields vs. Reactor Temperature

461
Reactor Temperature (K)
•
•
•
•
•
o
A
PRS, Smart (1984) (t-res=48 min)
PRS-R1, Dorius (1985Xt-res=20 min)
TST, Wang (1983) (t-res=25 min)
WR, Fletcher (1992) (t-res=30 min)
WR, Hetcher (1992) (t-res=46 min)
PRS-R2, Dorius (1985) (t-res=20 min)
PRS-S, Dorius (1985) (t-res=27 min)
o
+
*
o
•
n
CC, Shun (1990) (t-res=15 min)
SS, Vcnkatesan (1980) (t-res= 27min)
TST, Venkatesan (1980) (t-rcs= 27 min)
WR, Cha (1991) (t-res=21 min)
WR, Dorius (1985) (t-rcs=25 min)
WR, Wang (1983Xt-res = 25 min)

462
Figure 118
Liquid Yields vs. Reactor Temperature: Regions I to II

90-
80-
10-
463
~ip3~
Region I
•Region III
675 725 775 i
825 l
875 I
925
Reactor Temperature (K)
•
- •
•
•
D
O
A
FRS, Smart (1984) (t-res=48 min)
PRS-R1, Dorius (1985Xt-res=20 min)
TST, Wang (1983) (t-res=25 min)
WR, Fletcher (1992) (t-res=30 min)
WR, Fletcher (1992) (t-res=46 min)
PRS-R2, Dorius (1985) (t-res=20 min)
PRS-S, Dorius (1985) (t-res=27 min)
o
+
*
Q
•
•
CC, Shun (1990) (t-res=15 min)
SS, Veakatesan (1980) (t-res= 27min)
TST, Veakatesan (1980) (t-res= 27 min)
WR, Cha (1991) (t-res=21 min)
WR, Dorius (1985) (t-res=25 min)
WR, Wang (1983Xt-res = 25 min)

464
V (Figure 119). During the pyrolysis process, two competing sets of reactions take place
simultaneously. The first set of reactions involve primary cracking and distillation of
heavy fractions of bitumen. The distilled heavy oil is subjected to secondary cracking at
long reaction times and high temperatures. In Region IV, the liquid yield increases with
an increase in reactor temperature. It is presumed that in this temperature range, the heavy
oil is being distilled. Hence, with increase in temperature, the rate of distillation becomes
more rapid. However in Region V, this trend is reversed. This is due to increased
cracking of heavy oil to light oil and gases at high temperatures. Hence, there exists a
temperature at which the liquid yields are maximized. Though this optimum temperature
depends on the nature of oil sands, it is usually found to lie at the common boundary of
Regions IV and V (798 to 823 K).
Solids Residence Time
With the exception of Smart, most researchers (50, 51, 114, 120) agreed that the liquid
yields decrease with an increase in solids retention time in the reactor (Figure 120). The proposed
explanation (51) for this trend is that an increase in solids residence time leads to thermal cracking
of the undistilled portion of the bitumen on the oil sands. Fletcher (121), however, did not report
significant trends in liquid yields with solids retention time. It was generally agreed (50, 114) that
a residence time of about 12-16 min might be preferred for the pyrolysis of oil sands in a fluidized
bed reactor.
Generalized observations based on the oil sands pyrolsysi studies are as follows:
1. Fluidizing gas flowrate did not affect the product distribution directly.
2. The gas yield increased with an increase in the reactor temperature while the coke yield,
which is a function of the nature of oil sands, remained constant.

465
Figure 119
Liquid Yields vs. Reactor Temperature: Regions IV to V

466
90-
8 0 -
• 7 0 -
5 £ 60-
£ 50-c
c
^ 4 0 -tn
-a
> : 3 0 -
20-
10-
RegjonlV
675 725 775 825
Reactor Temperature (K)
i
875 925
D
O
A
PRS, Smart (1984) (t-res=48 min) O
PRS-R1, Dorius (1985Xt-res=20min) +
TST, Wang (1983) (t-res=25 min) «
WR, Fletcher (1992) (t-res=30 min) O
WR, Fletcher (1992) (t-res=46 min) •
PRS-R2, Dorius (1985) (t-res=20 min) •
PRS-S, Dorius (1985) (t-res=27 min)
CC, Shun (1990) (t-res=15 min)
SS, Veakatesan (1980) (t-rcs= 27min)
TST, Veakatesan (1980) (t-res= 27 min)
WR, Cha (1991) (t-res=21 min)
WR, Dorius (1985) (t-res=25 min)
WR, Wang (1983Xt-rcs = 25 min)

467
Figure 120
Liquid Yields vs. Solids Residence Time

468
15 20 25 30 35 40 Solids Residence Time (minutes)
50
•
•
•
•
SS, Vcnkatcsan (1980) (T=773K)
PRS, Smart(1984) (T=773K)
PRS-Rl,Dorius (1985) 0=798K)
PRS-S, Dorius (1985) (T=S73K)
D
O
A
TST, Wang (1983) (T=798K)
CC, Shun (1983) (T=823K)
WR,Cha(1991)(T=798K)

469
3. The nature of oil sands had a direct bearing on the product distribution. The higher the
asphaltene content or Conradson carbon residue of the bitumen, the lower the liquid yield
and the higher the coke yield. The structure and chemical nature of the host rock also
influenced the yields (as was evident from Circle Cliffs oil sand studies [119, 120]).
4. Reactor diameter and loading (H/D ratio) determined the fluidization regime which in
turen influenced the liquid yields.
5. The reactor temperature influenced the quality of liquid product. In general, an increase
in reactor temperature led to a reduction in viscosity, pour point and API gravity and an
increase in volatility and Conradson carbon residue.
6. It is probably not technically feasible to process oil sands in a fluidized bed at temperatures
below 723 K.
Rotary Kiln Process
The rotary kiln process has been studied by Cha (105) as an alternative to the fluidized bed
process for the pyrolysis of oil sands. The process variable data obtained in an exploratory study
(169) indicated that rotary kiln pyrolysis could be a feasible alternative to a fluidized bed thermal
process for the production of an upgraded bitumen-derived heavy oil from oil sands. The product
distribution and yields obtained with the rotary kiln process appeared to be better than most
contemporary fluidized bed processes. Hanson et al. (113) reported on the pyrolysis of
Whiterocks oil sands in a commercially available rotary kiln. The effect of temperature and
retention times on the product yields were found to be very similar to the trends obtained for the
fluidized bed. The maximum liquid yield of 68.7 wt% was obtained for the fluidized bed. The
maximum liquid yield of 68.7 wt% was obtained at a temperature of 798 K and a solids retention
time of 10 min. This compared favorably with the results obtained by the previous fluid-bed

470
researchers (50, 51, 114, 117). However, Fletcher (121) obtained much higher liquid yields with
the same feed in a large diameter (15.2-cm ID) fluidized bed reactor. His maximum yield of 89%
(by weight) was greater than the yield obtained from the rotary kiln with Whiterocks oil sands.
In terms of quality of the liquid product obtained, the two processes were comparable. The only
significant difference lay in the volatility of the liquids. The rotary kiln liquid product was
reported to be 100% volatile (boiling point less than 813 K) (113) whereas the fluidized bed liquid
product was about 80-85% volatile (121).
The advantages of the rotary kiln process (as applied to pyrolysis of oil sands) relative to
the fluidized bed process are as follows.
1. Rotary kilns are commercially available as opposed to fluidized beds which must be
specifically designed for a particular application.
2. It is easier to operate rotary kilns as compared to fluidized beds. The control of solids
residence time is much easier and more precise.
3. The fluidized bed may not operate in the intended regime. For example, in small diameter
beds, there is a tendency for the bed to slug. This could affect the extent of solids mixing
in the bed which would influence the product distribution. This problem is obviously
absent in rotary kilns.
4. If an agglomerated mass of oil sands is fed to a fluidized bed, it is likely to de-fluidize the
bed which could lead to severe coking of the oil sands in the bed and bed plugging.
Rotary kilns are more versatile and can process wider size-distribution oil sand ores than
fluidized beds.
5. Withdrawl of coked sand from a rotary kiln is continuous whereas in a fluidized bed the
coked sand generally exits in spurts. There is also an increased likelihood of plugging of

471
the exit pipe in fluidized beds.
Although the rotary kiln process exhibits a number of advantages relative to a fluidized
bed, in light of the higher yields obtained by Fletcher (121), the fluidized bed pyrolysis studies
were extended.

472
EXPERIMENTAL
Deo et al. (167) reported that most of the oil sands pyrolysis fluidized bed reactors had a
tendency to operate in the slugging regime instead of the bubbling regime which is more
desireable. Fletcher (121) constructed a 15.2 cm ID reactor which was capable of operating in
the bubbling regime over a wide range of fluidization gas flow rates and bed H/D ratios. The
details of design calculations, construction and installation are available elsewhere (121).
The pilot scale fluidized bed reactor was modified for this investigation. A schematic of
the system (after modifications) is presented in Figure 120. The oil sands were fed to the fluidized
bed reactor by a bin-discharge dry materials feeder (Acrison BDF 1.5 H/2). The fluidized bed
was heated by two propane burners attached to the reactor jacket. The burner flue gases were split
into two streams. The first stream was pulled into the bed through the wind box by the gas pump.
These gases served to fluidize the bed and to directly transfer heat to the oil sands (direct retort
heating). The second stream traversed a swirling path along the reactor jacket and provided the
additional heat required for pyrolysis through the reactor wall (indirect retort heating).
Bitumen on the oil sands underwent pyrolysis reactions at the high temperatures prevailing
in the reactor. Approximately 85% of the bitumen was distilled off or cracked to lower molecular
weight hydrocarbon liquids and gases and the remaining 15% formed a carbonaceous residue on
the sand. The hydrocarbon vapors were carried over to the product recovery system where the
heavier hydrocarbons and moisture in the fluidizing gas were condensed. The uncondensed gases
were vented through the chimney.
The pressure drop across the bed increased as the bed hold-up/height increased. The
nitrogen control valve on the L-valve was activated and the coked sand was withdrawn from the
reactor and was transferred to the coked sand receiver returning the pressure drop (and hence the

473
bed hold-up) to the preset value. The propane supply to the burners was regulated by a PID
controller to ensure that the reactor temperature remained steady during the course of a run.
Modifications in the Burner System
One of the most frequent problems encountered in operating this pilot scale fluidized bed
(121) was the failure of the burner system. This was precipitated by direct exposure of the burner
sleeve to unusually high temperatures (as high as 1300K). In this study, it was decided to use PR
Spring oil sands which have a higher (10 wt%) bitumen saturation than the Whiterocks oil sands
(7 wt%) which were used in the previous investigation (121). This increase in bitumen saturation
marginally increased the thermal energy requirements of the reactor. Furthermore, it was
intended to reduce the solids residence times in the reactor in this study. Both of these factors
contributed to an increase in the heat requirement of the system. Thus, the burner/heat supply
section of the reactor was redesigned and rebuilt.
It appeared that a single burner would be overloaded if used to provide the entire energy
demand of the reactor. Hence, it was decided to divide the heat load between two burners. It was
expected that apart from reducing the thermal stress, this new configuration (as shown in Figure
120) would lead to a more uniform temperature profile along the circumference of the reactor and
would be capable of providing a greater amount of heat than the previous single burner system
(121).
Design of Burner Sleeves
The primary design assumptions and constraints were as follows:
1, The inner wall of the burner (i.e., the ceramic tube) was at a temperature of 1773 K
Fletcher (121) reported burner sleeve temperatures of approximately 1273K.
2. The outer layer (ceramic wool) was in contact with stationary, ambient air at 294 K.

474
Figure 120A
Schematic of the Fluidized Bed Pyrolysis System

475
Propane
Burner 2 i Burne P r o p a n e V f c ^ ^
W W » / / «
'?////;/////////////''?•/'.
Air
Oil Sands
Feeder
Exhaust Flue Gases {>
To Chimnev A '
Product and
Fluidization
Gases Gas Sampling
Port Strainer
Condenser 1 Filter
__^J \ Condenser 2
XT-. — t > M L-Valve Nitrogen .^ta1 1
— W ^ LSI
Spent Sand
Receiver
Gas Pump
Prestrainer T rap

476
3. The diameter of the whole assembly should not exceed 45.7 cm since that posed problems
in installation.
These assumptions and constraints were employed in the heat transfer calculations using
various combinations of refractory materials and thicknesses. The lognitudinal-section of the
burner sleeve is shown in Figure 121. The outer wall of each burner was an 20.3-cm ID SS 304
pipe. It was covered by a thick layer of insulating ceramic fiber (Inswool HP). The inner wall
was a mullite ceramic (3Al203.2Si02) tube. Mullite is a dense ceramjic material with excellent
high temperature and thermal shock properties and can withstand temperatures up to 2000 K. The
annular space between the ceramic tube and the outer wall was filled with a castable refractory:
Kast-O-Lite 30 Plus (trade name) which is an alumina based compound capable of withstanding
temperatures up to 2000 K.
Casting and Curing the Refractory
The refractory was obtained in the form of a white granular material. It was mixed with
water in a ratio of one gallon of water per 100 lb of refractory. The mixing was carried out in
a cement mixer. When the mixture reached a uniform consistency it was poured into the annular
region between the outer SS 304 pipe and the inner ceramic tube. A cement vibrator was used
to remove trapped air bubbles in the cast and to ensure uniform distribution of the refractory in
the annulus. The cast was air dried for 48 h. At this stage the cast had solidified. This was
followed by more rigorous thermal curing which was carried out at Lotec, Inc. The following
manufacturere recommended temperature program was used to cure the refractory:
1. The refractory was heated to a temperature of 523 K at a rate of 40 K/h. The refractory
was held a 523 K for 4 h.
2. The temperature was increased at a rate of 40 K/h to 873 K and was held at this

477
Figure 121
Longitudinal Section of the Burner Sleeve

30.5 cm
, Castable Refractory _Ceramic Pipe
_ SS 304 Pipe
nil
.Ceramic Wool L20.3 cm
JSS 304 Flange
7.6.en
Section AA
35.5 cm
Cross Section at AA
45.7 cm
4s.
00-

_ 479
temperature for 36 h.
The refractory was dry after the above heat treatment and the burners were ready to be
installed on the reactor furnace.
Design of Burners
The burners were designed to provide a combination of premixed and diffusion flames.
This kind of flame was found to be extremely effective in the past (121) since it combines the
advantages of both types of flames. A premixed flame is capable of burning fuel at a very high
rate as compared to the diffusion type whereas it is easier to control the fuel/oxidizer ratio in a
diffusion flame. Controlling this ratio was critical in this application since excess oxygen could
lead to excessive formation of coke in the reactor during the pyrolysis reaction and to oxidation
of the produced hydrocarbon vapors.
A commercial weed burner was modified to serve as the burner. Premixing of the air-fuel
stream was achieved by installing a tee (with an open top) in the fuel line. The burner nozzle was
located in the center of this tee. The nozzle was fabricated by drilling a 0.08-cm hole (drill bit
67) in a brass swagelok cap. As the gas passed through the nozzle at a high velocity, air was
drawn through the open end of the tee. The fuel/oxidizer ratio was maintained close to
stoichiometric by positioning the flame deep inside the burner sleeve and controlling the amound
of air allowed to diffuse into the burner housing. This was achieved by varying the open area
available at the end of the burner sleeve. A portable oxygen analyzer (Bacharach OXOR II) was
installed in the product gas line to monitor the amount of oxygen in the flue gas.
Installation
The two burners were located on opposite sides of the reactor. Furthermore, the burners
were welded tangentially along the burner wall to prevent impingement of flue gases from one

480
Figure 122
Longitudinal Section of the Complete Burner Assembly
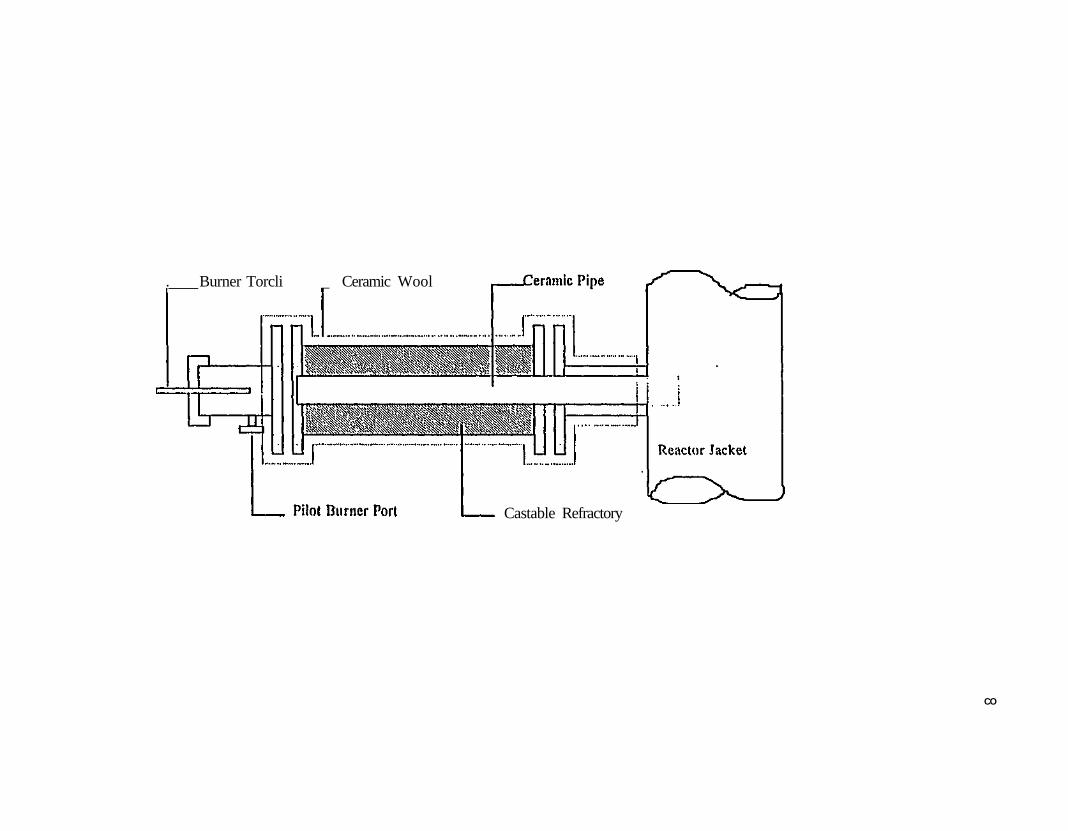
. Burner Torcli _ Ceramic Wool
Castable Refractory
CO

482
capable of providing thermal energy at higher rates than the previous single-burner system.
Experimental Procedures
The oil sands used in this investigation were mined from the Utah Pit in the PR Spring oil
sands deposit in Utah. The oil sands were originally in the form of a consolidated sandstone.
These rocks were crushed in a jaw crusher and sieved through a 0.64-cm (1/4") sieve. A
representative sample was obtained by the coning and quartering technique recommended by
Kenkel (170). The oil sands feed was air dried for at least 24 h before being loaded in the feeder.
The burner start up procedure, the standard operating procedure, and the reactor shutdown
procedure have been described in detail by Nagpal (106).
Product Collection
Following termination of a run it took approximately 16 h for the reactor temperature to
decline to about 373 K. The condensers and the prestrainer trap were drained. The traps located
before and after the gas pump were checked for traces of liquid product. The nitrogen flow to the
L-valve was switched on to drop the bed into the coke receiver. The bed thermocouple was pulled
out and the feeder was disconnected from the reactor. Residual oil sands from the reactor were
dropped in to the L-valve. The reactor was disconnected and the partially pyrolyzed oil sands
were collected. The distillables in the partially pyrolyzed oil sands were extracted with toluene
in a Soxlet extractor. The gas samples, collected during the run, were analyzed immediately after
the run to minimize contamination from the ambient air.
Process Variable Studies
It has been demonstrated conclusively (50, 51, 104) that the bed temperature and solids
residence time are the only two operating parameters that significantly effect the product yields
and quality. The effect of these parameters was investigated in this study. The bed temperature
483
was varied from 723 to 808 K whereas the solids residence time ranged between 20 and 50 min.
The effect of each parameter was studied independently. The reactor temperature was varied at
a constant solids residence time of 30+3 min in the first set of experiments. The temperature was
maintained at 773 K whereas the solids residence time was varied from 20 to 50 min in the second
set of experiments. An attempt was made to reduce the residence time to 10 min; however, the
heat requirement for such experiments was such that it was difficult to maintain a constant
temperature throughout the course of a run.
Mass Balance Calculations
Mass balance calculations were carried out based on the bitumen or hydrocarbon content
of oil sands. These calculations involved the following steps: estimation of bitumen fed to the
reactor, determination of liquid, gas and coke yields, and determination of the amount of
unpyrolyzed bitumen recovered from the reactor after the run.
The amount of coked sand collected at the end of the run was used to back calculate the
amount of bitumen fed to the reactor. The amount of coke on coked sand was determined by
burning a representative sample of coked sand in a muffle furnace. The amount of clean sand fed
to the reactor was calculated as follows:
Clean sand (kg) = Coked sand (kg) x (l-Coke%/100)
The bitumen saturation of the oil sands was known (from Soxlet extraction) to be 10 wt%.
Hence, the amount of oil sands and bitumen fed to the reactor in the entire run was calculated
from the amount of clean sand and the bitumen saturation.
The liquid product from the run was collected in the two condensers and the prestrainer
trap (Figure 120A). A small amount of liquid condensed in the traps located before and after the
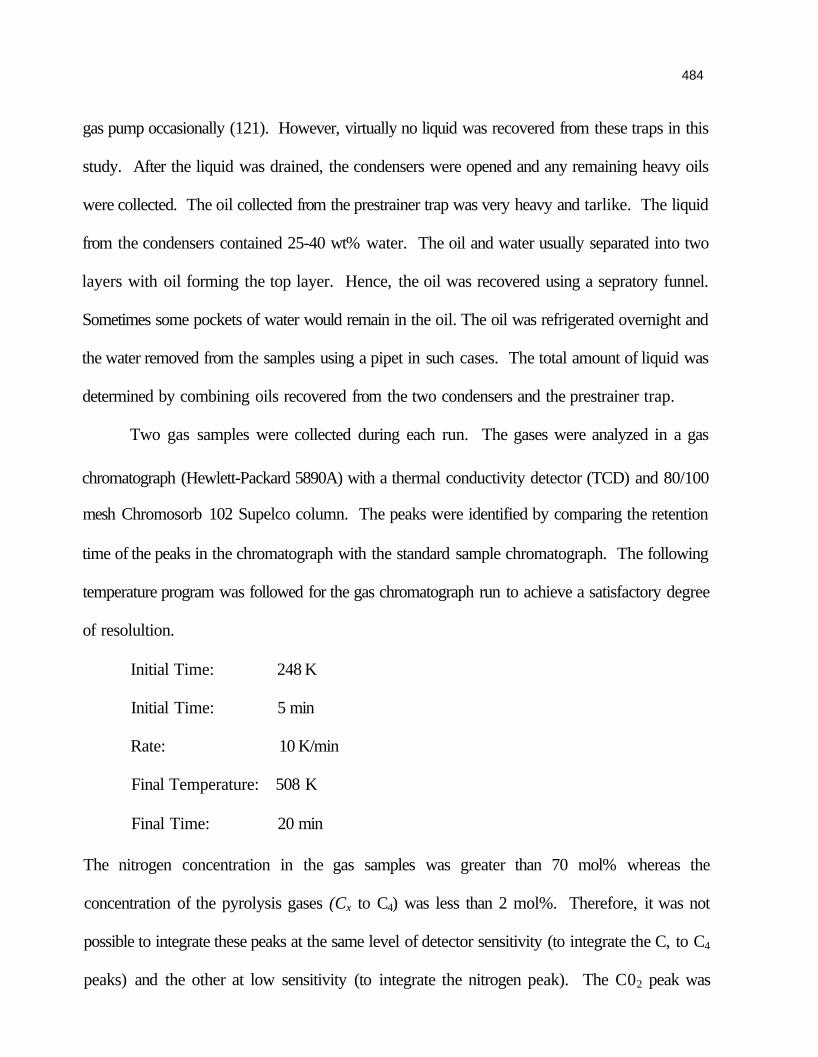
484
gas pump occasionally (121). However, virtually no liquid was recovered from these traps in this
study. After the liquid was drained, the condensers were opened and any remaining heavy oils
were collected. The oil collected from the prestrainer trap was very heavy and tarlike. The liquid
from the condensers contained 25-40 wt% water. The oil and water usually separated into two
layers with oil forming the top layer. Hence, the oil was recovered using a sepratory funnel.
Sometimes some pockets of water would remain in the oil. The oil was refrigerated overnight and
the water removed from the samples using a pipet in such cases. The total amount of liquid was
determined by combining oils recovered from the two condensers and the prestrainer trap.
Two gas samples were collected during each run. The gases were analyzed in a gas
chromatograph (Hewlett-Packard 5890A) with a thermal conductivity detector (TCD) and 80/100
mesh Chromosorb 102 Supelco column. The peaks were identified by comparing the retention
time of the peaks in the chromatograph with the standard sample chromatograph. The following
temperature program was followed for the gas chromatograph run to achieve a satisfactory degree
of resolultion.
Initial Time: 248 K
Initial Time: 5 min
Rate: 10 K/min
Final Temperature: 508 K
Final Time: 20 min
The nitrogen concentration in the gas samples was greater than 70 mol% whereas the
concentration of the pyrolysis gases (Cx to C4) was less than 2 mol%. Therefore, it was not
possible to integrate these peaks at the same level of detector sensitivity (to integrate the C, to C4
peaks) and the other at low sensitivity (to integrate the nitrogen peak). The C02 peak was
485
integrated in both chromatograms. Hence, the hypothetical area of the nitrogen peak at low
sensitivity was calculated as follows:
2 2 C02 (LS) '
where HS infers High Sensitivity and LS infers Low Sensitivity. The peak areas were then
corrected using the response factors.
Corrected Peak Area of A = Actual Peak Area of A / Response Factor of A
The response factors obtained from literature (124) were found to give erroneous results. Hence,
the GC response factors were determined specifically for this study. The corrected peak areas
were added and then normalized to determine the molar concentration of each compound. Using
the molar concentrations and the average gas flow at ambient conditions, the total mass of
pyrolysis gas formed in the run was calculated. The calculation of the amount of pyrolysis gas
formed in the run SNPRS-13 is summarized in Table 39.
The coked sand obtained in the coke receiver was agitated vigorously to obtain a
representative sample. Twenty grams of this sample were weighed out in a crucible and heated
to a temperature of 373 K under vacuum to remove moisture. The sample was then combusted
at 823 K for 16 h. The percentage coke on coked sand was hence determined. The test was
repeated to ensure that the amount of coke on coked sand was established within ±5%.
At the end of each run about 500 to 1000 g of a mixture of partially pyrolyzed oil sands
and coked sand was removed from the L-valve. Typically the amount of hydrocarbon in this
mixture constituted less than 3% of the total bitumen mass balance. The bitumen in this mixture

Table 39 Gas Analysis of Run SNPRS13
Low Sensitivity Ga9 Annlysis
Ratio of Areas
Gos Flow Time (LPH) (min)
5380 86
Total Gas A nalysis
Gas N2 02 CO
CH4 C02
C2H8 C2H4 C3H8 C3H6
n-C4H10 1-C4H8
1-C5H10 n-C5H12 n-C6H14 1-C6H12
MW 28 32 28 16 44 30 28 44 42 58 56 70 72 86 84
' Response Factor as C
Moles of Pyrolysls Gas I Moss of Pyrolysls Gos P
Gos N2
C02
N2/C02 =
Aroo 36.5073 2.1644 3.4629 0.2710 5.5463 0.1343 0.1685 0.1488 0.2789 0.0736 0.1682 0.0000 0.0000 0.0000 0.0000
olculotod in
Produced In roducod in t
Aroo 1.3441 0.2042
6.5823
Tomporoturo (K)
298
RF' 35.1 37.3 43.6 38.0 63.8 64.0 48.0 104.0 86.0 142.0 114.0 164.0 206.0 213.0 165.0
Appondix C
the Run = lie Run (g)
Aroo/RF 1.0404 0.0580 0.0928 0.0062 0.1541 0.0021 0.0026 0.0031 0.0027 0.0009 0.0012 0.0000 0.0000 0.0000 0.0000
3.73 120
Proasuro latm)
0.86
Vol% 76.27 4.25 6.01 0.46 11.29 0.15 0.19 0.23 0.20 0.06 0.09 0.00 0.00 0.00 0.00
Molos 206.87 11.54 18.46 1.24
30.63 0.42 0.52 0 .62 0.53 0.17 0.24 O.OO O.00 O.OO 0.00
Moles
271.24
Mass (n) 5792 369 517 20
1348 13 15 27 22 10 13 0 0 0 0

487
Table 40 Input Data File of Run SNPRS13
Name of run: Date:
snprs13 Aua 9.94
Please Supply the Following Measured Parameters
1. Weight of coked sand collected (g):
2. Average weight of spent sand in bed (g):
3. Liquid Product (g): a. Pre-strainer Trap: b. Condenser tf 1: c. Condenser tf 2: d. From reactor:
76.37 1245.79
278.57 49.45
4. Coke on coked sand (%):
5. Type of tar sand used (WR = 1 or PRS = 2):
6. Gas Analysis: a. Low sensitivity analysis:
Comp. Area
N2 | 1.3441 C02 | 0.2042
19473
8500
1.61 |
b. High sensitivity analysis:
Comp.
0 2 CO
CH4
C02
Area 2.1644 3.4629 0.271
5.5463
C2H6 I 0.1343 C2H4 C3H8 C3H6
C4H10 C4H8
C5H10 C5H12 C6H14 C6H12
0.1685 0.1488 0.2789 0.0736 0.1682
0 0 0 0
7. Gas Flowrate (LPH):
8. Length of the run (minutes):
9. Ambient Pressure (kPa):
10. Ambient Temperature (K):
1 1 . Bed Temperature (K):
12. Feed Rate (%):
5380
86
86
298
773
6.00

488
Table 41
Results of Mass Balance Calculations of Run SNPRS13
Mass Balance Calculations for Run:
Date:
_snprs1_3_J
Aug 9,94
Conditions for the run:
Bed Temperature {K): Feed Rate (%): Average Residence Time (min):
773 6.00 3 4
Overall Mass Balance:
Total Tar Sand Fed (g):
Coked Sand Recovered (g)
Total Bitumen Fed (g):
Products Recovered (g):
Liquid: Gas: Coke:
Liquid Yield (wt%): Gas Yield (wt%): Coke Yield (wt%):
Bitumen Accounted For (g):
21288 19473 2129
1600.7 119.6 313.5
79
15
2083
Bitumen Mass Balance Closing (wt%): 98
Pyrolysis Gas Analysis:
CH4 C2H6 C2H4 C3H8 C3H6
n-C4H10 1-C4H8 1-C5H10 n-C5H12 n-C6H14 1-C6H12
Vol% 33 11 14 17 14 5 6 0 0 0 0
Mass % 17 10 12 23 19 8 11 0 0 0 0

489
was estimated by extraction with toluene in a Soxlet extractor. This amount of bitumen was not
added to the product yields but was estimated only for the purpose of closing the mass balance.
Once each of the above amounts had been determined, the product yields and the overall
bitumen mass balance was calculated. A spreadsheet program was used to calculate the overall
mass balance and yields. The input data sheet and the final output for the run SNPRS-13 are
shown in Table 40 and Table 41, respectively.
Liquid Sample Preparation
The liquid products were recovered from three different points in the equipment: the
prestrainer trap and the two condensers. It was necessary to obtain a single representative sample
of the liquid to evaluate the effect of process parameters on the quality of liquid product. The
three oil samples were blended proportionally to obtain a single sample after the removal of
moisture from the product. The mixture was heated to 323 K and stirred to prepare a uniform
sample. This sample was used to determine the quality of the liquid products. It was suspected
that some of the samples might be contaminated with entrained coked sand fines. Hence, about
20 ml of the blended liquid sample were filtered through a Whatman Grade 4 filter paper to
prepare samples for viscosity and simulated distillation analyses.
Liquid Product Analyses
The following chemical and physical analyses were carried out on the liquid samples to -
determine the effect of process variables on liquid quality and the extent of upgrading of bitumen-
derived liquid relative to the bitumens.
1. Specific gravity: The specific gravity was measured using a capillary stoppered
pyknometer as specified in the ASTM method number D-70. The specific gravity was
measured at 293 K.

490
2. Pour point: The pour point was determined by the ASTM D97-66 method.
3. Conradson carbon residue: The conradson carbon residue and ash contents were measured
by the Syncrude Analytical Method 5.4 (171) in order to determine the coking tendencies
of pyrolysis liquid products.
4. Viscosity: The viscosity was measured at a temperature of 298 K using the Brookfield DV
11+ viscometer. A CP-40 cone was used. A Brookfield TC500 temperature bath was
used to maintain the sample at the constant temperature. The effect of sample temperature
on the viscosity was also investigated for one sample (run id SNPRS16).
5. Simulated distillation The boiling fractions of the liquid product were characterized by
simulated distillation. This was performed on a Hewlett Packard (HP) 5890 Series II gas
chromatograph with a flame ionization detector (FID) and a Supelco Petrocol column.
The weight percent boiling up to 477 K (400°F) was defined as the naphtha fraction. The
fraction boiling between 477 and 616 K (400 and 650°F) was the middle distillate and the
fraction between 616 and 811 K (650 and 1000°F) was the gas oil. The residuum
consisted of the fraction boiling above 811 K (1000°F). The ASTM D2887 method was
followed for calculating the fractions for totally elutable chromatograms.
6. Elemental and other analyses: The carbon, hydrogen, kjeldahl-nitrogen and sulphur
contents of all the samples were determined (analyses performed by Galbraith Laboratories
Inc.). Additional analyses (including nickel and vanadium contents and molecular weight
[3 point method using benzene solvent]) were carried out on the bitumen and one liquid
product sample (run id SNPRS13) to determine the extent of upgrading of bitumen.
7. Asphaltene content: Asphaltenes were defined as n-pentane insolubles and were determined
according to the method reported by Subramanian (1994) for heavy oils and bitumens.

491
RESULTS AND DISCUSSION
The pilot scale fluidized bed reactor system (121) was modified and used for the pyrolysis
of mined and crushed oil sands from the PR Spring oil sands deposit which is located in Uinta
Basin (Utah). The effect of process parameters (reactor temperature and solids residence time)
on product were carried out to study the effect of process parameters on the liquid quality and the
extent of bitumen upgrading. The kinetic model for bitumen pyrolysis of Deo et al. (167) was
modified to explain the results of this investigation. The yields and properties of the products
obtained in the large diameter fluidized bed and the rotary kiln (105) reactors were also compared.
The details of the hydrodynamic and feeder calibration studies, the pyrolysis process
variable experiments, the product distributions and yields, the liquid product qualities, the kinetics
of pyrolysis reaction, and the influence of hydrodynamics on the reactor performance are
discussed.
Determination of Minimum Fluidization Velocity
The fluidization regime is directly linked to the fluidization gas velocity. This affects the
mass and heat transfer characteristics in the bed and hence the performance of the fluidized bed
reactor. Therefore, it was essential to determine the minimum fluidization velocity (Umf) to define
the regime of operation.
It was necessary to determine the mean particle size diameter (dp) to theoretically calculate
the minimum fluidization velocity. Hence, a sample of coked sand was sieved to determine dp.
A representative sample of coked sand was obtained using a 1/16 sample splitter. The analysis
was carried out according to the ASTM STP 447B standard method (ASTM Committee E-29,
1985). US Standard wire mesh sieves and a ro-tap mechanical shaker were used for the sieve
analysis. An important parameter in sieve analysis is the total sieving time (ASTM Committee

492
E-29) since extended sieviing time can lead to attrition and fines generation. The time of analysis
is determined by trial and error and varies from one material to another. The Sieve analysis was
carried out for four different time intervals: 5, 10, 15 and 20 min. The particle size distributions
obtained at sieving times of 10 and 15 min were nearly identical. However, the particle size
distribution obtained with 20 min sieving time was a little finer indicating attrition had occured.
Hence, an "end point" of 10 min was selected. The particle size distribution is presented in Figure
123. The calculation of mean particle diameter as determined by sieve analysis is reported in
Table 42.
The above analysis established the mean particle size of the coked sand to be 132 ± 3^m.
Various empirical correlations are available in the literature for predicting the minimum
fluidization velocity (143, 172-174; Grewal and Gupta,k 1989). The minimum fluidization
velocity was determined by using the following equations provided by Fletcher et al., (1992).
. <fr'p,{p.-pj (34)
ri
i te_=_j|£_ (35) af 1400 K J
Vs- (36)
The minimum fluidization velocity for the coked sand obtained from pyrolysis of PR
Spring oil sands in the large diameter fluidized bed reactor was predicted to be 1.64 cm/s at

493
Figure 123
Particle Size Distribution of Coked Sand from PR Spring Oil Sands
(Sample Size = 410 g, Sieving Time = 10 min)

494
100 1000 Particle Size Diameter (microns)
10000

Table 42 Sieve Analysis of Coked Sand from PR Spring Oil Sands
US Standard
No.
4
16
25
50
100
140
200
pan
Sieving Time: 1
Mesh Size
(micro-m)
4750
1180
710
300
150
106
75
o 0 min
dpi
(micro-m)
5175
2965
945
505
225
128
91
38
Weight of
Sieve (g)
429.8
424.9
330.6
349.9
382.1
381.6
371.4
366.4
Sand Recovcrcc
Weight of sand
&sieve (g)
430.7
433.7
339.9
391.2
581.3
465.5
395.7
408.7
(B):
Weight of
Sand (g)
0.9
8.8
9.3
41.3
199.2
83.9
24.3
42.3
410
100(Xi)
0.2
2.1
2.3
10.1
48.6
20.5
5.9
10.3
Xi/dpi
4.241780-07
7.23 893 n-06
2.4003 112-05
0.000199469
0.00215935
0.001598704
0.000654898
0.00275122
Sample Size: 410 g
Average Particle Diameter (microns) = 135

496
ambient conditions with air as the fluidizing gas.
Fluidization studies were conducted on beds with H/D ratios ranging from 1.7 to 4. It was
found that the minimum fluidization velocity in all cases lay between 1.5 to 1.6 cm/s. A
fluidization curve (pressure drop vs. fluidization gas flow rate) for an H/D ratio of 2.2 is shown
in Figure 124. An interesting observation in this plot are the fluctuations in pressure drop in the
region between the point of incipient fluidization and the point corresponding to the M/A value
of the bed. This is a typical observation in the fluidization of multi-sized paritcle beds (121, 175).
The large particles remain defluidized at the point of minimum fluidization. As the gas flowrate
is increased the larger particles become fluidized. This leads to pressure fluctuations and an
increase in the average pressure drop across the bed. As more particles get fluidized, the pressure
drop value approaches the M/A value.
The pyrolysis experiments were carried out at a gas superficial velocity corresponding to
a U/Umf value of approximately 5 and an H/D ratio of 1.9. The bed operated in the bubbling
fluidization regime and provided excellent solids mixing at this gas velocity.
Feeder Calibration
The oil sands were fed to the reactor by a commercially available bin discharge feeder
(Acrison Model BDF 1.5-H/2). The feeder was calibrated to determine the feeding rates as a
function of the motor speed. The determination of a correlation between the feeding rates and the
motor controller set points was essential to the establishment of reproducible solids residence times
in the fluidized bed reactor. The feeder was calibrated using a representative sample of oil sands
that was air dried for at least 24 h prior to being placed in the feeder hopper. The feeder was
calibrated at four different motor speeds: 5%, 10%, 15% and 25% of the maximum feeder speed.
The higher motor speeds were not investigated because it was intended to conduct the pyrolysis

497
Figure 124
Fluidization Curve for PR Spring Coked Sand
("Pull" Mode of Fluidization, Fluidization Gas: Air, Bed Mass = 7 kg)

498
0 0.5 1 1.5 2 2.5 3 3.5 Gas Superficial Velocity (cm/s) -
4.5

499
experiments at feeding rates corresponding to 5-10% of maximum motor speed. The cumulative
amount of oil sand fed was measured as a function of time at each motor speed. The feeder auger
housing was water cooled to maintain the oil sands nearly isothermal during their transit through
the auger. Increased temperatures due to shear forces on oil sand granules in the auger have been
reported to make the oil sands sticky thereby making them difficult to feed (122).
The feeder calibration curves for the PR Spring and Whiterocks oil sands are presented in
Figures 125 and 126, respectively. A comparison of the two figures indicate that the feeding rates
of PR Spring oil sands are higher than that of Whiterocks oil sands for the same motor speed. The
cumulative amounts of oil sands remained linear (R2 > 0.99) for both the oil sands over the time
range investigated indicating constant feed rates. The feeder motor controller set point was varied
between 4% and 7% of full scale during the pyrolysis experiments.
Effect of Process Parameters on Product Distribution
A total of sixteen pyrolysis experiments were conducted in the large diameter fluidized bed
reactor with PR Spring oil sands feed. Only the runs with an overall bitumen material balance
in the range 88 to 109 wt% were accepted for studying the effect of process variables on the
product yields, distribution and quality. The high bitumen mass balances (109 wt% each)
achieved in runs SNPRS11 and SNPRS12 are probably due to oil sands which stuck to the sides
of the reactor and underwent partial pyrolysis. This was, however, not accounted for in the mass
balance calculations. It is expected that in long term continuous operation of the fluidized bed
pyrolysis process, the contribution of this source of error would be negligible. The low bitumen
mass balances (88 to 92 wt%) in runs SNPRS5, SNPRS8 and SNPRS10 may have been related
to leakage of air into the reactor leading to the combustion of the hydrocarbon vapors.
The reactor temperature and solids residence time have been reported to be the two most

500
Figure 125
Feeder Calibration Curves for PR Spring Oil Sands

501
25000
I 20000 cs 1—
to
£ 15000 CO
C3 CO
ns 10000 o o
CO CO 5000
i • • • i
0 200 400 600 800 1000 1200 1400 Feeding Time (seconds)
• 5% Motor Speed
• 10% Motor Speed
A 15% Motor Speed
a 25% Motor Speed

502
Figure 126
Feeder Calibration Curves for Whiterocks Oil Sands

503
16000
^14000-j P
5 12000
S 10000
1 8000 CO
§ 6000:
52 4000
2000 :
0-i 0 100 200 300 400 500 600 700 800 900
Feeding Time (seconds)
5% Motor Speed A 15% Motor Speed
10% Motor Speed ° 25% Motor Speed

504
important process parameters influencing the product distribution and yields and the liquid product
qualities during the pyrolysis of oil sands in a fluidized bed reactor (104, 120, 121). The product
distribution and yields were reported to be independent of fluidization gas velocity (51). Thus,
the influences of reactor temperature and solids residence times were the focus of this study.
Effect of Reactor Temperature on Product Distribution and Yields
Five runs were made to study the effect of reactor temperature on product distribution and
yields. The bed temperature was varied from 723 K (450°C) to 808 K (535°C). The fluidization
gas velocity and the solids residence time were maintained constant at 5380 ± 141.6 LPH (190
+5 SCFH) and 31+3 min, respectively. The reactor loading was also constant with H/D (bed
height to diameter ratio) fixed at 1.9.
The effect of reactor temperature on product distribution and yields is presented in Table
43 and Figure 127. The analyses of the pyrolysis gas products obtained in this study are reported
in Appendix F. The liquid (C5 + fraction), gas (C, to C4) and coke yields appeared to be
independent of reactor temperature over the range studied (723 to 808 K). This observation is
inconsistent with the results reported in the earlier investigations of pyrolysis of oil sands in
laboratory scale fluidized bed reactors (50, 51, 114, 117, 119, 120) and a pilot scale (15.2 cm ID)
rotary kiln reactor (105,113). The liquid product yields showed an apparent maxima with respect
to reactor temperature in the laboratory scale reactors and in the rotary kiln reactor. The maxima
usually lay between 798 and 823 K depending on the nature and origin of the oil sands.
Moreover, the liquid yields obtained in these reactors varied between 55 and 71 wt% depending
upon the bitumen saturation of the oil sands fed to the reactor.
However, no such liquid yield maxima was observed in this study. Also, the liquid yields
obtained in the large diameter fluidized bed reactor were higher, ranging from 77% to 81 %, than

Table 43
Effect of Reactor Temperature on Product Yields and Distribution
(Solids Residence Time: 31 ± 3 minutes, Gas Flowrate:
5380 ± 141 SLPH, Feed: PR Spring Oil Sands)
Run ID Temperature
(K)
Product Yields
(normalized wt%)
Liquid Gas Coke
SNPRS16
SNPRS5
SNPRS10.
SNPRS13
SNPRS11
723
748
755
773
808
81
78
80
79
77
3
1
2
6
6
16
21
18
15
17

506
Figure 127
Effect of Reactor Temperature on Product Yields
(Feed: PR Spring Oil Sands, Solids Residence Time: 31 ±3 min)

507
700 720 740 760 780 Reactor Temperature, K
800 820

508
those reported for laboratory scale reactors. The gas yields were lower: 1-6 wt% in this study as
opposed to 15-22 wt% in this study confirming the speculation (51) that coke yields were
dependent upon the nature and origin of the oil sands and not on processing conditions.
The liquid product yields declined from 81 to 77 wt% as the reactor temperature increased
from 723 to 808 K. TGA studies reported by Lin (1988) indicated that the maximum liquid yields
were obtained at pyrolysis temperatures between 723 and 748 K. This observation is in
concurrence with the results obtained in this study. The reduction of 4% in liquid yields over a
range of reactor temperatures from 723 to 808 K is minor. The gas yield increased from a
minimum of 1 % to a maximum value of 6%. Both of these trends can be explained on the basis
of increased secondary cracking of heavy oils at high temperatures to form light oil and gas.
Effect of Solids Residence Time on Product Distribution and Yields
The average solids residence time (6) in the fluidized bed reactor was defined as follows:
e=i^ (37) F
where:
W = mass of the sand inventory in the bed (kg)
F = feed rate of oil sands (kg/min)
The solids residence time was determined as follows. The cumulative mass of coked sand
recovered at the end of the run was measured. The mass of oil sands fed to the reactor during the
run was back calculated. The average feed rate was determined by dividing the mass of oil sands
fed by the total time of the run. The mass of sand inventory in the bed (W) was fixed at the
beginning of the run and was maintained constant by controlling the pressure drop across the bed

Table 44
Effect of Solids Residence Time on Product Yields and Distribution
(Temperature: 773 K, Gas Flow: 5380 ± 141 SLPH)
(Feed: PR Spring Oil Sands)
Run ID Residence Time
(min)
Product Yields
(normalized wt%)
Liquid Gas Coke
SNPRS12
SNPRS13
SNPRS14
SNPRS9
20
34
40
50
80
79
82
81
3
6
3
6
18
15
15
13

510
Figure 128
Effect of Solids Residence Time on Product Yields
(Feed: PR Spring Oil Sands, Reaction Temperature: 773 K)

511
90.
80-
70-
^ 6 0 ^
% '•
^ 5 0 -3 ;
> 40-
e 3o-
2 0 -
10 --"
0 -1
1
•
•
A
• —
5 20
Liquid
Gas
Coke
25
• •
•
30 35 40 45 50 5'.
Solids Residence Time (minutes)

512
during the course of the run. The solids residence time was calculated from the above expression.
The solids residence time could be varied by two methods: by changing the bed hold up
(W) or by changing the oil sands feed rate (F). During the course of this investigation the solids
residence time was varied by a combination of both methods.
The solids residence time in the reactor was varied from 20 to 50 min at a constant
temperature of 773K. The fluidization gas flow rate was maintained constant at 5380+141.6 LPH
(190±5 SCFH) (U/Umf ~5) in all runs.
The effect of solids residence time on the product distribution and yields is shown in Table
44 and Figure 128. The product yields did not exhibit any apparent trend with the solids residence
time in the range investigated. The liquid yields ranged from 79 to 81 wt% and the gas and coke
yields were nearly constant at 3-6 wt% and 13-18 wt%, respectively. These observations differ
from those reported for pyrolysis experiments carried out in laboratory scale fluidized bed reactors
(104, 119) and the rotary kiln reactor (105). The liquid yields decreased but the gas yields
increased as the solids residence time was increased in the laboratory scale fluidized bed reactor.
The difference in results is attributed to the difference in the hydrodynamic characteristics of the
laboratory scale reactors and the large diameter fluidized bed reactor and is discussed in the
following section.
Discussion
The results of this investigation can be explained by studying the pyrolysis reaction
mechanism and the bubbling bed hydrodynamics in the large diameter fluidized bed reactor.
Pyrolysis Reaction Mechanism
Various reaction schemes (65, 105, 118, 148, 167, 176, 177) have been proposed for the
pyrolysis of oil sands and oil shale. Deo et al. (167) proposed a kinetic model to explain the

513
results obtained from pyrolysis experiments carried out in laboratory scale fluidized bed reactors
(104). According to this model, the pyrolysis process occurs via three steps:
1. Asphaltenes > a. Coke + b. Heavy Oil
2. Maltenes > c. Heavy Oil + d. Gas
3. Heavy Oil > e. Light Oil + f. Gas
The first reaction accounts for the cracking and condensation reactions involving
asphaltenes (pentane insolubles) to form heavy oils and the carbonaceous residue on the sand
grains. The heavy oil constituents volatilize and are transferred to the gas phase. Neurock et al.
(178) conducted pyrolysis experiments with asphaltene fractions and determined the kinetic
pathways for this series of reactions. They determined that coke and heavy oil are the two most
important products of asphaltene pyrolysis. The second reaction accounts for volatilization of a
portion of the maltene fraction (pentane solubles), the cracking of high molecular weight
constituents and gases, and the subsequent volatilization of the produced heavy oil. The third
reaction accounts for secondary cracking of the bitumen-derived heavy oil produced from the first
two reactions.
An examination of the rate constants reported for the three reactions (167, 177) indicates
that the rates of the first two reactions are higher by more than an order of magnitude than the
third reaction (at 723 K, k,: 1.6 h'\ k2: 86.2 h"\ k3: 0.1 IT1 and at 803 K, k,: 30.6 h*1, k2: 342.5
h"1, k3: 1.7 h"1). The third reaction becomes significant only at high temperatures (> 773 K) and
long reaction times (> 10 min). This explains the existence of an apparent maxima in liquid
yields with respect to reactor temperature reported for most laboratory scale fluidized bed oil sand
pyrolysis studies (Figure 117). Also long reaction times lead to greater secondary cracking which
explains the previously observed reduction in liquid yields and increase in gas yields with solids

514
residence time at a fixed reactor temperature (Figure 44). Conesa et al. (178) reported that long
solids residence times and high temperatures favored the secondary cracking reactions resulting
in higher gas yields during pyrolysis of polyethylene in a fluidized bed reactor. The relationship
between the reaction time and solids residence time is explained in the next section.
The gas yields obtained in this study were significantly lower (1-6 wt% versus 15-22 wt%
in the rotary kiln and smaller fluidized bed reactors) (82, 104, 119, 120). It was presumed that
the secondary cracking reactions were suppressed in the large diameter fluidized bed and that the
primary cracking and volatilization reactions (reactions 1 and 2) should be sufficient to explain
the results of this study. The hypothesis was tested by calculating the product yields based on the
first two reactions only. The kinetic parameters and the stoichiometric coefficients used in the
simplified model are given in Table 45. The rate constants were adapted from Phillips et al.
(177) and Deo et al. (167) except that the activation energy for reaction 2 was reduced by 20%
in this simplified model compared to the previous model (167) to achieve a better fit of the data.
The stoichiometric constants were determined from the best fit of the experimental data.
The yields of coke, liquid, and gas products from this simplified kinetic model have been
plotted as functions of temperature and residence times in Figures 129 and 130, respectively. The
simplified model predicts that for reactor temperatures above 750 K and reaction times above 5
min the product yields remain more or less constant. This observation agrees reasonably well
with the experimental results obtained in this study in the range of solids residence time from 20
to 50 min. The slight reduction in liquid yields (from 81 to 77 wt%) with temperature in the
experimental results is likely due to secondary cracking of heavy oil. It is proposed that although
the secondary cracking is suppressed, it is not entirely eliminated.

515
Table 45
Rate Constants111 and Stoichiometric Coefficients for the Model
j c ^ l . 16xl013exp ( " 1 7 ^ 0 0 0 ) (ii"1)
K=B . 85^107exD ( ~ 8 3 ' J 0 0 ) (i2_1)
a = 0.8, b = 0.2, c = 0.93, d = 0.07
'"Adapted from Phillips et al. (1985) and Deo et al. (1991)

516
Figure 129
Results of Simplified Model vs. Experimental Results:
Effect of Reactor Temperature on Product Yields
(Reaction Time = 30 min)

517
v.?
0.8-
0.7-
•J 0.6-̂ o cs 2
o £ 0.4-
f o-3-i
02-m
0.1-^
0 - -1
62.
-
i
3 673
•
•
-"~~~ • i
723
. - * -
• •
•
±
i
773
Liquid •
Coke
Gas • .
• • • i •
823
Reaaor Temperature (K)

518
Figure 130
Results of Simplified Model vs. Experimental Results:
Effect of Reactor Time on Product Yields
(Reaction Temperature = 773 K)

519
Solids Residence Time (minutes)
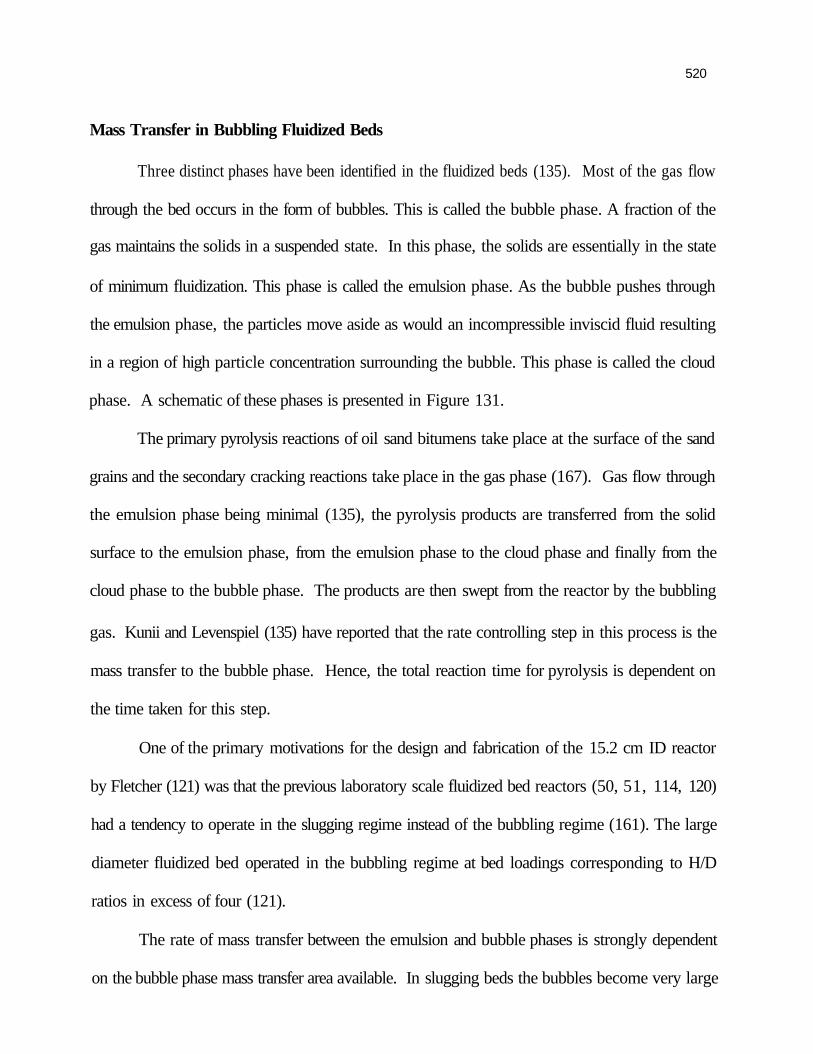
520
Mass Transfer in Bubbling Fluidized Beds
Three distinct phases have been identified in the fluidized beds (135). Most of the gas flow
through the bed occurs in the form of bubbles. This is called the bubble phase. A fraction of the
gas maintains the solids in a suspended state. In this phase, the solids are essentially in the state
of minimum fluidization. This phase is called the emulsion phase. As the bubble pushes through
the emulsion phase, the particles move aside as would an incompressible inviscid fluid resulting
in a region of high particle concentration surrounding the bubble. This phase is called the cloud
phase. A schematic of these phases is presented in Figure 131.
The primary pyrolysis reactions of oil sand bitumens take place at the surface of the sand
grains and the secondary cracking reactions take place in the gas phase (167). Gas flow through
the emulsion phase being minimal (135), the pyrolysis products are transferred from the solid
surface to the emulsion phase, from the emulsion phase to the cloud phase and finally from the
cloud phase to the bubble phase. The products are then swept from the reactor by the bubbling
gas. Kunii and Levenspiel (135) have reported that the rate controlling step in this process is the
mass transfer to the bubble phase. Hence, the total reaction time for pyrolysis is dependent on
the time taken for this step.
One of the primary motivations for the design and fabrication of the 15.2 cm ID reactor
by Fletcher (121) was that the previous laboratory scale fluidized bed reactors (50, 51, 114, 120)
had a tendency to operate in the slugging regime instead of the bubbling regime (161). The large
diameter fluidized bed operated in the bubbling regime at bed loadings corresponding to H/D
ratios in excess of four (121).
The rate of mass transfer between the emulsion and bubble phases is strongly dependent
on the bubble phase mass transfer area available. In slugging beds the bubbles become very large

Figure 131
Mass Transfer from Emulsion Phase to Bubble Phase in a
Fluidized Bed Reactor

522
.•v s A\*yww
Emulsion Phase
Cloud Phase
Bubble Phase

523
which lowers the total mass transfer area and hence, the rate of removal of cracked and distilled
oil from the emulsion phase. This also provides the time required for the slower heavy oil
secondary cracking reactions (represented by reaction 3) to produce light oil and gas. The
increase in the FBR reactor diameter to 15.2 cm ID and the "pull" mode of operation (121) led
to a superior quality of fluidization and elimination of slugging in this reactor. Availability of a
high interfacial mass transfer area between the cloud phase and the bubble phase led to a faster
removal of primary cracked and distilled oil from the reactor which was responsible for the
increased liquid yields. The secondary cracking reactions could not proceed to a significant extent
due to the reduction in the total pyrolysis reaction time. Hence, an increase in reactor temperature
had no effect on product distribution and yields as observed in this study.
Peterson and Ghishler (108) carried out coking of oil sands from Bitmont and Abasand oil
sands in a 15 cm ID reactor and reported liquid yields of 84 to 86 wt% in the range of reactor
temperature of 773 to 798 K. These results are similar to those obtained by Fletcher (121) and
those obtained in this study in the large diameter fluidized bed reactor. Suppression of secondary
cracking reactions due to elimination of wall effects in the large diameter reactor could be
responsible for the high liquid yields obtained by Peterson and Ghishler (179).
The .pyrolysis reaction time is indirectly related to the solids residence time in the bed. An
increase in solids residence time results in an increase in the solid-vapor contact time. Carberry
(180) determined that for sequential reactions (of the bitumen pyrolysis type) the liquid yields
decrease with an increase in the gas-solid contact time. This observation explains the results of
the earlier laboratory scale reactors (Figure 120). In slugging beds, the rate of mass transfer of
primary cracked and distilled heavy oil from the emulsion phase to the bubble phase being low,
the effective solid-vapor contact time is increased. This resulted in an increase in pyrolysis

524
reaction time which led to an increase in secondary cracking. This was probably responsible for
the decrease in liquid yields and increase in gas yields. In the large diameter fluidized bed, the
rapid removal of primary cracked and distilled liquid products led to an invariant product
distribution with respect to solids residence time.
Characterization of Liquid Products
One of the objectives of this investigation was to perform complete physical and chemical
analyses of the liquid products. The quality of the liquid products influences the choice of
subsequent processing steps for further upgrading and refining. Moreover, knowledge of the
effect of process parameters on the nature of the liquid products may provide insight into the
pyrolysis reaction scheme and helps in determining the optimum set of process conditions for the
pyrolysis process. It also provides information about the extent of bitumen upgrading achieved
in the fluidized bed pyrolysis process.
The trends in product quality will be discussed in relation to the pyrolysis reaction scheme
discussed in the previous section.
Effect of Reactor Temperature on Liquid Product Quality
The quality of liquid products as a function of the pyrolysis temperature is shown in Table
46. The effect of reactor temperature on the boiling point distribution of the liquid product is
shown in Figure 132. The overall volatility of the liquids increased slightly (from 80 to 85 wt%).
The gasoline and the gas oil fractions remained nearly constant and ranged from 3.1 to 3.9 wt%
and from 55 to 59 wt%, respectively. The middle distillate fraction increased from 18 to 24 wt%
while the residuum fraction decreased from 20 to 14 wt% as the reactor temperature increased
from 723 to 808 K. These trends indicate that at high temperatures, secondary cracking of the

Table 46
Effect of Reactor Temperature on Liquid Product Quality
(Solids Residence Time = 31 ±3 minutes, PR Spring Oil Sands Feed)
Temperature (K)
Simulated Distillation Volatility (wt%) < 4 7 7 K (wt%)
477-616 K (wt%) 617-811 K (wt%)
>811 K (wt%)
Properties Viscosity @ 298 K (cp)
Specific Gravity @ 293 K Conradson Carbon (wt%)
Pour Point (K) Asphaltenes (wt%)
Maltenes (wt°/f»)
Elemental Analysis C (wt%) H (wt%) S (wt%) N (wt%)
H/C (atomic ratio)
SNPRS16
723
80 .0 3.1 18.7 58.3 20 .0
507 0 .96 2.8 2 8 4 4 .4
95 .6
86 .12 12.13 0 .29 0 .54 1.69
SNPRS5
748
82.7 3.4
20.1 59.2 17.3
347 0.94 2.3 285 2.3
97.7
86.15 12.25 0.28 0.52 1.71
SNPRS10
755
81.9 . 3.4
21.6 57.0 18.1
369 0.94 2.8 274 1.7
98.3
86.71 12.49 0.29 0.52 1.73
SNPRS13
773
80.3 3.9 20.8 55.5 19.7
420 0.94 3.3 277 1.8
98.2
85.34 11.66 0.29 0.52 1.64
SNPRS11
808
85.6 3.7 24.8 57.0 14.4
259 0.94 3.2 267 2.7
97.3
85.32 11.54 0.29 0.56 1.62

526
Figure 132
Effect of Reactor Temperature on Simulated Distillation of Liquid Products
(PR Spring Oil Sands Feed, Solids Residence Time = 31+3 min)

527
J\J-
80-i
70-
60^
^ 5 0 ^ "cb | 4 0 - j
• '
•
• n
• V
D
• 0
30^
20-̂
10-
0-• •
700 720 740 760 780 800 820 Reactor Temperature (K)
• Residum * Middle Distillate n Volatility
• Gas Oil • Gasoline

528
residuum fraction to lighter fractions takes places. However, only a slight increase (5 wt%) in
the overall volatility of the liquid products with reactor temperature indicates that secondary
cracking was suppressed even at high temperatures because of the rapid removal of the primary
cracked and distilled products.
The trends obtained in viscosity and pour point (Figures 133 and 134, respectively) can
also be explained by this argument. Increased secondary cracking at high temperatures led to
slightly lighter and a less viscous liquid products.
The specific gravity (Figure 135) of the liquid product reduced with increase in the reactor
temperature in the range 723 to 755 K but remained nearly constant in the range 755 to 808 K.
This plateau could be due to the condensation reactions of aromatic free radicals to form higher
molecular weight aromatics (65).
The Conradson carbon residue of the liquid products increased slightly as the reactor
temperature increased (Figure 136). The polynuclear aromatics (PNA) with alkyl side chains
which constitute the asphaltene fraction of the bitumen (65) undergo cracking reactions at high
reactor temperatures. The alkyl side chains are severed and removed from the reactor as lighter
products. Hence, an increase in cracking leads to an increase in the aromaticity of the liquid
products which form precursors for coke. This is reflected in an increase in the Conradson carbon
residue of the liquid products as the severity of the reaction increased.
The asphaltene (n-pentane insolubles) content of the liquid product decreased with increase
in reactor temperature up to 775 K and increased beyond 780 K (Figure 137). The decrease was
probably due to the conversion of PNAs to aromatics (as explained above) as the reactor
temperature increased. At high reactor temperatures (>780 K) formation of coke precursors due
to condensation reactions of aromatic free radicals results in an increase in the total asphaltene

529
Figure 133
Effect of Reactor Temperature on Viscosity of Liquid Products
(PR Spring Oil Sands Feed, Solids Residence Time = 31+3 min)

530
ouu
500^
^ 4 0 0 :
O
-tsoo-o o GO
^200 \
O
CD
0-
•
•
H
•
700 720 740 760 780 800 820 Reactor Temperature (K)

531
Figure 134
Effect of Reactor Temperature on Pour Point of Liquid Products
(PR Spring Oil Sands Feed, Solids Residence Time = 31+3 min)

532
300
720 740 760 780 . 800 Reactor Temperature (K)
820

533
Figure 135
Effect of Reactor Temperature on Specific Gravity of Liquid Products
(PR Spring Oil Sands Feed, Solids Residence Time = 31 ±3 min)

534
740 760 780 Reactor Temperature (K)

Figure 136
Effect of Reactor Temperature on Conradson Carbon Residue
of Liquid Products
(PR Spring Oil Sands Feed, Solids Residence Time = 31+3 min)

536
740 760 780 Reactor Temperature (K)
820

537
Figure 137
Effect of Reactor Temperature on Asphaltene Content of Liquid Products
(PR Spring Oil Sands Feed, Solids Residence Time = 31+3 min)

538
740 760 780 800 Reactor Temperature (K)
820

539
content of the liquid product.
The effect of reactor temperature on the H/C ratio of the liquid products is shown in Figure
138. The H/C ratio increased as the reactor temperature increased from 723 to 755 K and
decreased as the reactor temperature increased from 755 to 808 K. As the reactor temperature is
increased from 723 to 755 K, the high molecular weight compounds crack to form heavy oil and
coke. This leads to a net increase in the H/C ratio of the liquid product since the hydrogen
deficient species are depositing on the sand grains as coke. As the temperature increased beyond
755 K, the alkyl chains attached to the asphaltic and resinous naphthenoaromatic species are
severed and removed from the reactor as high H/C lower molecular weight products. Hence, the
overall H/C ratio decreases because of increased formation of high H/C gas products at higher
temperatures.
The nitrogen and sulphur contents of the liquid product did not exhibit trends with reactor
temperature and remained nearly constant at approximately 0.5 and 0.3 wt%, respectively.
Effect of Solids Residence Time on Liquid Product Quality
The effect of solids residence time on the quality of the liquid product is shown in Table
47. There were no apparent trends in liquid quality with increasing solids residence time. Due
to the superior quality of fluidization and rapid removal of primary cracked products from the
reactor, the solids residence time did not exert any clear influence on the quality of the liquid
products. This trend is in concurrence with the proposed kinetic and hydrodynamic explanation
for the trends.
Extent of Bitumen Upgrading
A significant advantage of the use of thermal methods (fluidized bed and rotary kiln

540
Table 47
Effect of Solids Residence Time on Liquid Product Quality
(Reactor Temperature = 773 K, PR Spring Oil Sands Feed)
Solids Res. Time (min)
Simulated Distillation Volatility (wt%) <477K (wt%)
• 477-61 6 K (wt%) 617-811 K (wt%)
>811 K (wt%)
Properties Viscosity @ 298 K (cp)
Specific Gravity @ 293 K Conradson Carbon (wt%)
Pour Point (K) Asphaltenes (wt%)
Maitenes (wt%)
Elemental Analysis C (wt%) H (wt%) S (wt%) N (wt%)
H/C (atomic ratio)
SNPRS12
20
84.8 4.5 23.9 56.4 15.2
183 0.96 • 2.5 279 1.9
98.1
86.15 11.98 0.29 0.54 1.67
SNPRS13
34
80.3 3.9
20.8 55.5 19.7
420 0.94 3.3 277 1.8
98.2
85.34
11.66 0.29 0.52 1.64
SNPRS14
40
80.2 4.1 20.6 55.6 19.8
431 .0.95 3.3 277 2.8
97.2
-----
SNPRS9
50
84.2 3.9
22.1 58.2 15.8
212 0.95 2.6 273 1.7
98.3
85.83 11.97 0.31
• 0.52 1.67

541
processes) over other surface recovery methods is the upgrading of bitumen during the pyrolysis
process. The physical and chemical properties of the liquid products from this study were
determined and compared to the bitumen properties. The extent of bitumen upgrading achieved
in this study is shown in Table 48.
There is a marked difference between the physical properties of the liquid product and the
bitumen. The specific gravity of the liquid product was lower than that of the bitumen. A similar
trend was observed for the pour point of the two liquids. The liquid product is about three orders
of magnitude less viscous than the bitumen. The volatility of the liquid product is 80 wt% as
against 36 wt% for the bitumen. All of these trends can be explained on the basis of thermal
cracking of high molecular weight compounds in the bitumen to form lighter compounds.
The higher H/C atomic ratio of the pyrolyzed liquid indicates the extent of upgrading. The
nitrogen and sulphur contents are significantly lower indicating that a portion of the hetroatoms
were deposited on the sand grains along with the coke. The liquid products had a lower trace
metal content than the bitumen which suggested that most of the trace metals in the bitumen are
concentrated in the coke product. The marked reduction in the asphaltene and Conradson carbon
residue contents of the bitumen during the pyrolysis process was indicative of the thermal
conversion of the asphaltenes to aromatics and light gases as explained earlier.
The high degree of upgrading achieved in the pyrolysis process was reflected by the
improvement in the liquid product properties over the bitumen. The high volatility and low
asphaltenes, Conradson carbon residue, hetroatoms, and trace metals contents of the liquid
products indicate that they could be upgraded to refinery feedstock quality by hydrotreating (51,
163).

542
Table 48
Extent of Bitumen Upgrading
Properties
Specific Gravity
Conradson Carbon (wt%)
Pour Point (K)
Viscosity (cp)
Asphaltenes"" (wt%)
Maltenes (wt%)
Elemental Analysis
C (wt%)
H (wt%)
S (wt%)
N (wt%)
Ni (ppm)
V (ppm)
H/C atomic ratio
Molecular Weight, g mole"1
Simulated Distillation
Volatility (wt%)
< 477 K (wt%)
4 7 7 - 6 1 6 K ( w t % )
6 1 7 - 8 1 1 K(wt%)
> 811 K (wt%)
PR Spring Bitumen
1.005 @ 288 K '"
14.2"1
319'"
870,000 @ 311 K'"
19.3'"
80.7*"
84.0
10.6
0.43
0.91
38
6
1.52
924
45.4'"
0.4'"
8.2'"
36.8'"
54.6'"
Total Liquid Product
(Run ID SNPRS13.
T=773 K, e=34min)
0.939 @ 293 K
3.3
277
420 @ 298 K
1.8
98.2
85.3
11.7
0.29
0.52
< 4.5
< 4.5
1.64
441
80.2
3.9
20.8
55.5
19.8
Data from Subramanian (1994)
"' As Pontane insolubles

543
Comparison of Fluidized Bed and Rotary Kiln
Pyrolysis Processes
Cha (105) and Hanson et al. (113) reported on pyrolysis studies using the Whiterocks oil
sands in a 15.2 cm ID rotary kiln reactor. A maximum liquid yield of 65.5 wt% was reported
at a temperature of 773 K and a residence time of 21 min. The gas and coke yields for these
conditions were 13.0 wt% and 21.5 wt%, respectively (105). Pyrolysis experiments in a 15.2
cm ID fluidized bed reactor with the Whiterocks oil sands by Fletcher (121) resulted in a liquid
product yield of 84.5 wt% at similar process conditions. A liquid product yield of 80 wt% was
obtained in this investigation with PR Spring oil sands (which has a higher asphaltene content,
19.3 wt% [64] compared to 11.4 wt% for the Whiterocks bitumen [113]) at 773 K and a solids
residence time of 20 min.
The product distribution and the properties of the liquid products from the 15.2 cm ID
rotary kiln and fluidized bed pyrolysis experiments are compared in Table 49. The yields of
liquid products obtained in the large diameter fluidized bed reactor studies were approximately
15-20 wt% higher than the liquid product yield from the rotary kiln reactor at similar process
conditions. However, the rotary kiln liquid product was higher in API gravity and volatility and
lower in viscosity and pour point indicating a slightly greater extent of upgrading.
These trends are consistent with the proposed explanation of the impact of kinetics of the
pyrolysis reaction and hydrodynamic characteristics of the large diameter fluidized bed reactor on
the product distribution and yields. The high interfacial contact area between the emulsion phase
and the bubble phase in the 15.2 cm ID fluidized bed reactor leads to rapid removal of the
primary pyrolysis products from the reactor thereby suppressing the secondary cracking reactions.
In contrast, there is almost no gas flow through the rotary kiln solids and the mass transfer rate
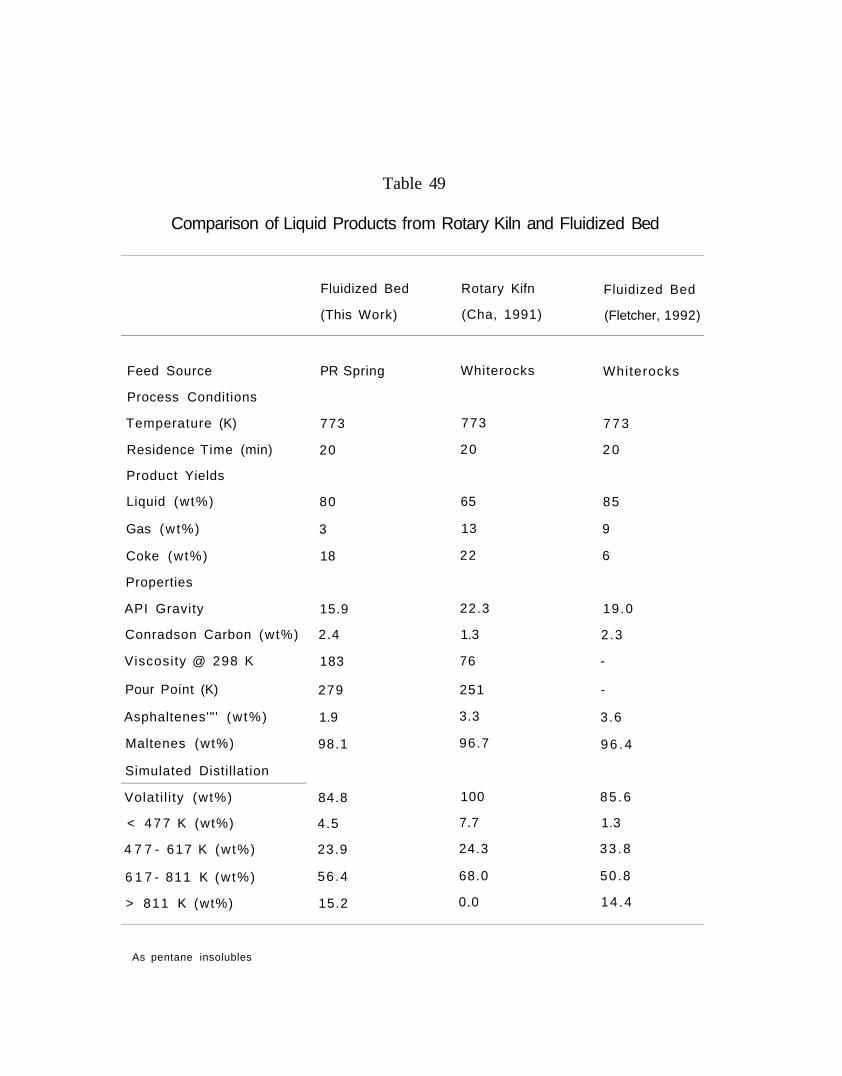
Table 49
Comparison of Liquid Products from Rotary Kiln and Fluidized Bed
Feed Source
Process Conditions
Temperature (K)
Residence Time (min)
Product Yields
Liquid (wt%)
Gas (wt%)
Coke (wt%)
Properties
API Gravity
Conradson Carbon (wt%)
Viscosity @ 298 K
Pour Point (K)
Asphaltenes'"' (w t%)
Maltenes (wt%)
Simulated Distillation
Volati l i ty (wt%)
< 4 7 7 K (wt%)
4 7 7 - 617 K (wt%)
6 1 7 - 811 K (wt%)
> 811 K (wt%)
Fluidized Bed
(This Work)
PR Spring
773
20
80
3
18
15.9
2.4
183
279
1.9
98.1
84.8
4.5
23.9
56.4
15.2
Rotary Kifn
(Cha, 1991)
Whiterocks
773
20
65
13
22
22.3
1.3
76
251
3.3
96.7
100
7.7
24.3
68.0
0.0
Fluidized Bed
(Fletcher, 1992)
Whiterocks
773
2 0
85
9
6
19.0
2 .3
-
-
3.6
9 6 . 4
85 .6
1.3
33 .8
50 .8
14 .4
As pentane insolubles

545
from the solid phase to the vapor phase above the surface of the solids is reduced. Thus the
effective residence time of produced heavy oils in the vicinity of the sand grains is increased and
secondary cracking reactions become significant leading to lower liquid yields, higher gas yields
and higher extent of upgrading.
Preferred Process Conditions
The liquid product yields were independent of the reactor temperature and solids residence
time. However, the liquid product analyses indicated that the produced liquids were substantially
upgraded at high reactor temperatures (> 748 K). The liquid product obtained at a reactor
temperature of 723 K was significantly less upgraded as compared to the liquid products obtained
at higher reactor temperatures (high specific gravity, high viscosity, high pour point, etc.).
Hence, based on these observations, a reactor temperature of 748 K and a solids residence time
of 20 min or less is recommended for pyrolysis of oil sands in a fluidized bed reactor. The
fluidization gas flow corresponding to approximately five times the minimum fluidization velocity
(Umf) should be maintained.

546
SUMMARY AND CONCLUSIONS
This investigation has conclusively demonstrated that the fluidized bed pyrolysis
of oil sands has certain clear advantages over other surface recovery methods. Bitumen
obtained from the hot-water process is considerably less upgraded as compared to the
liquid product obtained in the fluidized bed thermal process. The environmental problems
associated with tailing ponds in the hot water process and waste solvent disposal in the
solvent recovery method are also eliminated in this process. The liquid product yields
obtained in this investigation were considerably higher than those obtained from the rotary
kiln pyrolysis reactor (105).
The tasks completed during this investigation and the results and conclusions of the
pyrolysis experiments are summarized as follows.
1. A two-bumer system was designed, constructed, installed and successfully operated
for pyrolysis of PR Spring oil sands in the large diameter fluidized bed reactor.
The new burner system performed well under high thermal stress and was able to
provide heat input sufficient to achieve solids residence times of as low as 20 min.
The adjustable burner supports successfully supported the weight of the burner
assembly and provided sufficient flexibility to account for the reactor
expansion at high temperatures.
2. Pyrolysis experiments with PR Spring oil sands feed were conducted in the
modified large diameter fluidized bed reactor. The effect of reactor temperature
and solids residence time on product yields and quality was determined. The

-547
reactor temperature and solids residence time did not have any apparent effect on
the product distribution and yields.
The liquid product yields obtained in this study were significantly higher than those
obtained from laboratory scale fluidized beds (104) and rotary kiln reactors (105,
113).
The trends in the process variable studies and the high liquid yields have been
explained by a combination of the kinetics of the pyrolysis reaction and the
hydrodynamic characteristics of the large diameter fluidized bed reactor when
operated in the pull mode. It is proposed that the secondary cracking reactions
were suppressed in this reactor by rapid removal of primary cracked pyrolysis
products. This was due to the increased interfacial mass transfer area between the
emulsion phase and the bubble phase because of the improvement in the quality of
fluidization achieved in the large diameter fluidized bed reactor as compared to the
laboratory scale fluidized bed reactors.
A simplified two-reaction pyrolysis network was proposed which fit' the
experimental product yield data reasonably well for a bubbling fluidized bed.
The liquid products obtained in this study were found to be considerably upgraded
as compared to the bitumen on the oil sands fed to the reactor.
The reactor temperature was found to influence the liquid product quality to some
extent. Viscosity, specific gravity, and pour points of the liquid product decreased
with increase in the pyrolysis temperature while volatility increased. The
Conradson carbon residues of the produced liquids were nearly insensitive to

548
pyrolysis temperature.
8. The solids residence time (0) did not appear to influence the liquid product quality.
9. The rotary kiln and fluidized bed pyrolysis processes were compared with respect
to the product yields and liquid product quality. The liquid product yields obtained
from the large diameter fluidized bed reactor were higher than those from the
rotary kiln pyrolysis reactor (approximately 80 wt% as compared to 65 wt%).
However, the rotary kiln liquid product was slightly more upgraded in terms of
volatility, API gravity, and viscosity. The rotary kiln process variable data base
is not sufficient to prepare the technical and economic evaluations required to select
the rotary kiln or fluidized bed as the preferred pyrolysis reactor.
10. Based on the product yields and liquid product quality, a reactor temperature of
748 K (475°C) and a solids residence time of 20 min are recommended for
continuous operation of the fluidized bed pyrolysis process.