the extent and nature of alcohol, tobacco …and other drug use, and related harms, in the...
TRANSCRIPT
Social Research & Evaluation Pty Ltd ABN 40 113 241 973
1004 Norton Road Phone: (02) 6238 3706 Wamboin NSW 2620 Australia
Mobile: 0416 231 890 Fax: (02) 9475 4274
Email: [email protected] www.socialresearch.com.au
THE EXTENT AND NATURE OF ALCOHOL, TOBACCO AND OTHER DRUG USE, AND RELATED HARMS,
IN THE AUSTRALIAN CAPITAL TERRITORY
Fourth edition, version 3, November 2012
Prepared by David McDonald Consultant in Social Research & Evaluation
ii
Contents
PREFACE .................................................................................................................... III EXECUTIVE SUMMARY .............................................................................................. IV 1. INTRODUCTION ................................................................................................... 1
2. CONSUMPTION LEVELS AND PATTERNS ............................................................... 2 Alcohol ................................................................................................................... 2 Tobacco .................................................................................................................. 3 Illicit drugs ............................................................................................................. 4 Injecting drug use .................................................................................................. 6
Poly-drug use ......................................................................................................... 7 3. DRUG AVAILABILITY ........................................................................................... 8
Alcohol ................................................................................................................... 8 Tobacco .................................................................................................................. 8 Pharmaceutical products ....................................................................................... 9
Illicit drugs ............................................................................................................. 9 Illicit drugs’ price and purity ................................................................................. 9
4. DRUGS, CRIME AND LAW ENFORCEMENT........................................................... 12 Drug-related arrests ............................................................................................ 12 Prison inmates ..................................................................................................... 14 Random breath testing ......................................................................................... 15
Roadside drug testing .......................................................................................... 16 People placed in custody owing to intoxication .................................................. 16
5. DRUGS AND HEALTH ......................................................................................... 17 Which drugs cause the greatest burden of disease and injury in the ACT? ........ 17 Drug-related overdoses ....................................................................................... 18
Opioid overdose mortality ................................................................................... 20 Diagnoses of vital hepatitis infection ................................................................... 21
Alcohol caused deaths and hospital presentations .............................................. 23 Hospital separations related to illicit drugs ........................................................ 24
Hospital Emergency Department separations for psychoactive substance use... 25 6. OTHER TYPES OF DRUG-RELATED HARM ........................................................... 27
Children’s exposure to adult drug use ................................................................. 27 Perception of neighbourhood problems............................................................... 27
Discarded syringes............................................................................................... 28 Activities undertaken while under the influence of alcohol and other drugs ...... 28
7. TRENDS AND EMERGING ISSUES ........................................................................ 30 8. CONCLUSION ..................................................................................................... 32 APPENDIX: DEMOGRAPHIC SUMMARY ....................................................................... 33
Population ............................................................................................................ 33 Household wealth................................................................................................. 35 Labour market ...................................................................................................... 35
Educational attainment ........................................................................................ 35 Note re sources .................................................................................................... 35

iii
Preface
The purpose of this report is to provide summary information on the extent and nature
of the use of alcohol, tobacco and other drugs in the Australian Capital Territory, and
on the harms associated with that use. It is the fourth edition in a series produced to
assist in the further development, implementation and evaluation of the ACT’s
Alcohol, Tobacco and Other Drug Strategy. The earlier editions were published in
February 2005, January 2006 and February 2008.
This report is largely based on published data. It covers drug use; drug availability;
drug-related crime, law enforcement and health; and other types of drug-related harm.
It concludes with a summary of ACT demographics.
The major changes from the third edition to this fourth edition include the following:
All the categories of information published in the previous edition have been
updated, and many expanded, except for a small number that are the result of
one-off studies.
Changes to how liquor and tobacco licence data are presented, reflecting a
different approach to information systems at the Office of Regulatory
Services, ACT Justice and Community Safety Directorate.
The section on viral hepatitis now includes hepatitis B. This reflects the fact
that this condition, as with hepatitis C, occurs predominantly among people
with a history of injecting drugs.
Long-term trend data for hepatitis C is now included.
New data on Emergency Department separations for The Canberra Hospital
and Calvary Hospital are included.
Information on roadside drug testing, conducted by ACT Policing, is now
included, in addition to random breath testing.
Data from the 2010 ACT Inmate Health Survey is included.
New data on types of drug offences (from ACT Policing) are included.
Acknowledgments
I commend the ACT Government Health Directorate for initiating and maintaining
this series of reports as a component of its monitoring and evaluation of the ACT’s
Alcohol, Tobacco and Other Drug Strategy.
Dr Lisa Alleva from the Health Directorate’s Alcohol and other Drug Policy Unit
managed the project. She liaised with data custodians in various parts of the ACT
Public Service to obtain previously unpublished data.
Data custodians and analysts in the ACT Government Health Directorate and Justice
and Community Safety Directorate responded generously to our requests for
unpublished data.
Recommended citation
McDonald, D 2012, The extent and nature of alcohol, tobacco and other drug use,
and related harms, in the Australian Capital Territory, 4th
edition, ACT Government
Health Directorate, Canberra.

iv
Executive summary
The purpose of this report is to provide summary information on the extent and nature
of the use of alcohol, tobacco and other drugs (ATOD) in the Australian Capital
Territory (ACT), and on the harms associated with that use and with societal
responses to drugs, drug use and people who use drugs. It is an expanded and updated
edition in a series produced to assist in the further development, implementation and
evaluation of the Australian Capital Territory’s Alcohol, Tobacco and Other Drug
Strategy 2010-2014. It is largely based on published data and it covers drug use; drug
availability; drug-related crime, law enforcement and health; and other types of drug-
related harm. It concludes with a demographic summary.
Drug use
Some 86% of ACT adults state that they use alcohol, with 5.4% drinking daily and
20% of drinkers being in the ‘risky’ level of consumption, as defined by the National
Health and Medical Research Council (NHMRC).
The ACT’s prevalence of daily tobacco smoking, 11%, is well below the national
prevalence. Some 7% of female secondary school students report current tobacco use,
as do 6% of the male students. Smoking rates among students have fallen markedly
over the last decade.
Illicit drug use is not uncommon in the ACT, with 14% of household survey
respondents aged 14 years or older reporting using an illicit drug in the year before
interview. Cannabis is the drug most frequently consumed, with 10% reporting recent
use. The next most commonly consumed drug category is the use of pain killers for
non-medical purposes (2.9%). Polydrug use is the norm among people who inject
illegal drugs and ‘ecstasy’-related drug users.
Drug availability
The ACT had 495 liquor licence renewals in December 2011, with the number having
fallen by 18% over the last four years, largely because of fewer renewals of ‘off’
licences.
A total of 326 retail tobacconists’ licences were renewed in 2011. The number has
fallen each year over the past three years.
Heroin, MDMA (‘ecstasy’), cannabis, methamphetamine and cocaine are said by
users to be ‘easy’ to ‘very easy’ to obtain in the ACT. This is in contrast to earlier
years when the level of cocaine availability was low.
Drugs, crime and law enforcement
In the 2009-10 year, 459 arrests for drug offences occurred (386 excluding Simple
Cannabis Offence Notices: SCONs). Taking into account the size of the ACT
population, this is a rate just 34% of the national rate. Cannabis consumers (i.e.
offenders not classified as providers) composed 64% of all ACT drug arrests plus
SCONs in that year.
At 30 September 2011 just 3 of the 171 inmates of the Alexander Maconochie Centre
(AMC: Canberra’s prison) had a drug offence as the most serious offence for which
they were incarcerated. Three-quarters (74%) reported that the crimes for which they
were imprisoned were drug-related. Some 32% reported injecting illegal drugs while
at the AMC and 27% reported that the last time they had injected was in a prison.

v
ACT Policing conducted 98,245 random breath tests for drink-driving in the year to
30 September 2011. In 1,448 cases the driver exceeded the prescribed limit, a rate of
15 per 1,000 tests. The number of tests administered each quarter, and the proportion
of drivers exceeding the blood alcohol concentration (BAC) limit, varies markedly
over time.
In the year to 30 June 2011, 1,093 instances of people being taken into police custody
owing to intoxication occurred. The number has been fairly stable over the last three
years.
Drugs and health
Overdose is a major health threat to people who consume drugs. The ACT Ambulance
Service attended 601 overdose incidents in the first 10 months of 2011, of which 42%
were from alcohol, 22% from ‘polypharmacy’, 10% from heroin and 6% from
benzodiazepines. Other pharmaceutical drugs accounted for most of the remainder.
The ACT mortality rate from opioids, 1.7 per 100,000 aged 15-54 years (six deaths),
was 30% higher than the national rate in 2007, the most recent year for which ACT
data are available.
In 2010, 223 cases of hepatitis C infection were diagnosed in the ACT, a rate 17%
higher than the national level. The ACT rate fell markedly from 1995 to 2009, but
moved to a higher level in 2010.
Alcohol is a major cause of deaths and hospital presentations. It is estimated that, over
the 1992-2001 decade (the most recent data available), alcohol caused the loss of 341
lives in the ACT and saved 38 lives through its purported protective effect with
respect to cardiovascular disease, with a net loss of 303 lives. 82 of the deaths were
from alcoholic liver cirrhosis, 54 from road crash injury, 33 from alcohol poisoning
and 32 from suicide.
The ACT rates of illicit drug-related hospital separations (covering illicit drug use,
dependence, psychosis and withdrawal) was 20% higher than the national rate in
2009-10. Overall, in 2010-11 77% of people treated in the Emergency Departments of
Canberra’s two largest hospitals for disorders caused by psychoactive substance use
were for alcohol-related conditions. Opioids composed just 4.1% of the cases, illicit
stimulants 3.3%, and cannabis 1.4%.
Perceptions of neighbourhood problems
People’s perceptions of neighbourhood problems are monitored in the ABS Crime
Victimisation Survey program. The 2009-10 Survey revealed that 10% of ACT people
aged 18 years and over felt that there were problems with public drunkenness in their
local area, compared with 17% nationally. A much lower proportion, 4%, had a
perception of local problems with people using or dealing drugs, compared with 8%
nationally.
Activities while under the influence of alcohol and other drugs
Significant numbers of ACT residents report engaging in dangerous or otherwise
problematic activities while under the influence of alcohol and/or other drugs. This
includes 18% of drinkers driving a motor vehicle while under the influence of alcohol
and 6% going to work in that condition. 23% of people who had used illicit drugs in
the year before interview reported driving under the influence of drugs other than
alcohol, with 13% going to work in that condition.

vi
Trends
On most indicators the prevalence of harms related to psychoactive substances in the
ACT are stable or falling.
That said, the increasing levels of consumption of pharmaceutical opioids (both
prescribed and diverted from licit sources) and harms related thereto, seen nationally,
is probably occurring in the ACT, though this is as yet largely undocumented. In
addition, the ACT is probably experiencing an increase in the availability and use of
potentially-harmful synthetic cannabinoids (formerly known as ‘legal highs’).
Information systems that could monitor both of these trends would be useful.
Conclusion
It is recommended that this report continue to be updated and expanded, perhaps
every two years or as significant new data sources become available. Opportunities
may exist to harmonise the contents of future editions in this series with the reports of
the National Drug Strategy Working Group that has been established to develop a
new National Drug Research and Data Strategy.
Data from the 2010 National Drug Strategy Household Survey were released by the
Australian Institute of Health and Welfare (AIHW) in July 2011. The Institute’s
earlier approach of also releasing a supplement report providing key data separately
for each state and territory was not followed, and the national report contains little
data on the ACT specifically. Such data would be valuable, however, for monitoring
and evaluating in the ACT. Consideration could be given to commissioning a
comprehensive analysis of the 2010 Survey results as they pertain to this jurisdiction,
including documenting trends.
In any further development of ACT ATOD information systems, particularly attention
could be given to monitoring emerging trends through implementing early warning
systems, as the ACT does not have in place a sufficiently timely and comprehensive
early warning system to alert policy people, service agencies, drug users and the
community about emerging trends.

1. Introduction
The purpose of this report is to provide summary information on the extent and nature
of the use of alcohol, tobacco and other drugs in the Australian Capital Territory, and
on the harms associated with that use and with societal responses to drugs and drug
use. It is an expanded and updated fourth edition in a series produced to assist in the
further development, implementation and evaluation of the Australian Capital
Territory’s Alcohol, Tobacco and Other Drug Strategy 2010-2014.1 The previous
issue in this series (the third edition) was published in 2008.2
The scope of the report is limited to information on drug consumption, drug
availability and drug-related harms. The sources of harms are drug use; the illegal
status of some drugs; the operation of drug markets; and societal responses to drugs,
drug users and drug use. It does not cover responses (interventions) in the areas of
prevention, treatment or law enforcement except where these are proxy measures for
harms experienced by the community (e.g. people taken into custody for public
intoxication). The sources of information on interventions are detailed in a related
report,3 and information on ACT Government expenditures on drugs has also been
published in elsewhere.4
Where appropriate, this report provides comparative national data, enabling the reader
to see how the ACT compares with the rest of Australia. With a few exceptions, only
published information is presented here.
A caution is proffered: while it is commonplace to cite data comparing the ACT with
the Australian states, the NT and Australia as a whole (and ABS & AIHW do so
routinely), in some cases this produces misleading comparisons as it entails
comparing a city with other population and geographical units that merge urban, rural
and remote communities and localities.
1 Other papers in this series are available online at
<http://www.health.act.gov.au/c/health?a=da&did=10133064> 2 McDonald, D 2008, The extent and nature of alcohol, tobacco and other drug use, and related
harms, in the Australian Capital Territory, February 2008, Social Research & Evaluation Pty Ltd,
Canberra, http://www.health.act.gov.au/c/health?a=da&did=10133064. 3 McDonald, D 2006, Sources of published data on alcohol, tobacco and other drugs in the
ACT, 2nd edn, ACT Health, Canberra, http://www.health.act.gov.au/c/health?a=da&did=10133064. 4 McDonald, D 2006, Australian Capital Territory Government expenditure on preventing and
responding to drug abuse, 2004-05, Social Research & Evaluation Pty Ltd, Canberra,
http://www.health.act.gov.au/c/health?a=da&did=10133064.

2
2. Consumption levels and patterns
This section deals with the levels and patterns of consumption of alcohol, tobacco and
illegal drugs. It also covers polydrug use, injecting and the availability of illicit drugs.
Alcohol Overall, 86.3% of ACT residents aged 14 years and above state that they have
consumed alcohol in the past 12 months, with the proportion of males drinking
(88.1%) being slightly higher than females (85.0%). These figures are for 2010, and
are in each case lower than for 2004. The ACT’s 2010 drinking prevalence was higher
than the national figure: 86.3% compared with 79.9%.5
The proportion of ACT residents 14 years and older who drink alcohol daily (5.4%) is
well below the national rate (7.2%). The proportion drinking at levels that place them
in the ‘risky’ category of lifetime alcohol-related harm (using the NHMRC’s
definition of consuming more than two standard drinks per day on average6) is similar
to the national proportion: 19.5% of recent drinkers compared with 20.1% nationally.
TABLE 1
ALCOHOL CONSUMPTION, RISK STATUS, ACT & AUSTRALIA, 2010 Risk status ACT (%) Australia (%)
Abstainers 13.5 19.5
Low risk 67.0 60.4
Risky 19.5 20.1
Persons aged 14 years and over
Base: people who consumed alcohol in the previous 12 months
Per capita alcohol consumption
The ACT’s adult per capita consumption of alcohol for the 2000/01 year has been
estimated as 9.8 litres of pure alcohol, similar to the national figure of 9.3 litres.7 Later
data are not available as some years ago the ACT Government ceased collecting data
on wholesale purchases of alcoholic beverages by ACT retailers once its capacity to
tax such sales was removed by a decision of the High Court of Australia. The
problematic consequences of this have been recognised by the Government, and at the
time of writing it is re-establishing a data collection system to provide, prospectively,
alcohol sales data that will enable trends in per capita consumption to be monitored in
the ACT.
Secondary school students
Overall, 24% of male secondary school students and 23% of female students reported
drinking alcohol in the week before the 2008 ACT Secondary Student Alcohol and
Drug Survey (ASSAD) survey, proportions similar to the previous (2005) survey but
lower than those in the 1990s and 2002. The prevalence of harmful drinking was 7.1%
5 Source for this section: Australian Institute of Health and Welfare 2011, 2010 National Drug
Strategy household survey report, cat. no. PHE 145, AIHW, Canberra,
<http://www.aihw.gov.au/publications/phe/ndshs04sts/ndsh04sts.pdf>. 6 National Health and Medical Research Council 2009, Australian guidelines to reduce health
risks from drinking alcohol, National Health and Medical Research Council, Canberra. 7 Chikritzhs, T, Catalano, P, Stockwell, T, Donath, S, Ngo, H, Young, D & Matthews, S 2003,
Australian alcohol indicators, 1990-2001: patterns of alcohol use and related harms for Australian
states and territories, National Drug Research Institute, Curtin University of Technology, Perth, W.A,
p. 28.

3
(7.5% among male students and 6.6% among females). These proportions were also
similar to that observed in 2005.
Some 39% of students reported that their last drink was given to them by their
parents. 81% of male and 89% of female students (85% of all students) agreed with
the statement ‘You can have a good time at a party where there is no alcohol’, but
almost half of the male students (44%) and a similar proportion of the females (46%)
(45% of all students) agreed that ‘Getting drunk every now and then is not a
problem’.8
Tobacco The ACT has the lowest level of daily smoking of all Australia’s states and territories,
11.0% compared with a national figure of 15.1% in 2010. Both the ACT’s male daily
smoking prevalence (12.0%) and the female prevalence (10.1%) are markedly lower
than the corresponding national figures of 16.4% and 13.9%.9 The prevalence rates for
both males and females have fallen steadily from earlier surveys in this series.
Persons aged 14 years and over
Prevalence: secondary school students
In 2008, 7.1% of the female secondary school students reported current tobacco use,
as did 6.3% of the male students (6.7% of all students). (Here ‘current smokers’ are
students who reported smoking cigarettes on at least one day in the last seven days.)
Between 1996 and 2005, current tobacco smoking prevalence among these students
fell by 67%, from 20.4% to 6.7%. The change between the 2005 and 2008 surveys,
from 8.6% to 6.7%, was not statistically significant, suggesting that the long-term
reduction in prevalence rates may have slowed or stopped.
The secondary school students who smoke tend to be relatively light, non-dependent
smokers, with male current smokers reporting smoking an average of 28 cigarettes in
the previous week, and females smoking 20 cigarettes.10
8 Epidemiology Branch, ACT Health 2010, ACT secondary student drug and health risk
behaviours: results of the 2008 ACT Secondary Student Alcohol and Drug Survey, Health Series no. 50,
Epidemiology Branch, ACT Health, Canberra. 9 Australian Institute of Health and Welfare 2011, 2010 National Drug Strategy household
survey report, cat. no. PHE 145, AIHW, Canberra,
<http://www.aihw.gov.au/publications/phe/ndshs04sts/ndsh04sts.pdf>. 10
Epidemiology Branch, ACT Health 2010, ACT secondary student drug and health risk
behaviours: results of the 2008 ACT Secondary Student Alcohol and Drug Survey, Health Series no. 50,
Epidemiology Branch, ACT Health, Canberra.
TABLE 2
TOBACCO SMOKING, ACT & AUSTRALIA, 2010 Smoking status ACT (%) Australia (%)
Daily 11.0 15.1
Weekly 1.0 1.5
Less than weekly 1.8 1.4
Ex-smoker 24.9 24.1
Never smoked 61.2 57.8

4
Figure 1 provides trend data from the ACT Secondary Student Alcohol and Drug
Survey series.
FIGURE 1
Illicit drugs In 2010, 13.9% of ACT survey respondents aged 14 years and above reported having
used an illicit drug in the 12 months prior to the survey. This figure is marginally
lower than the national rate of 14.7%.
Cannabis is the illicit drug most commonly used in the ACT (as elsewhere in
Australia), with 9.5% of ACT residents aged 14 years and above reporting recent use
of the drug (i.e. having used it in the past 12 months) in 2010.11
Prevalence of use of
the other illegal drugs is very low. The following table lists the drug types with
reported 2010 prevalence of use exceeding 1%.
TABLE 3
RECENT USE OF AN ILLICIT DRUG, ACT AND AUSTRALIA, 2010
Drug type
ACT
(%)
Australia
(%)
ACT:Australia
rate ratio
Cannabis 9.5 10.3 0.9
Ecstasy 2.3 3.0 0.8
Meth/amphetamine (speed)* 1.2 2.1 0.6
Pain killers/analgesics* 2.9 3.0 1.0
Cocaine 1.8 2.1 0.9
Hallucinogens 1.5 1.4 1.1
Any illicit drug 13.9 14.7 0.9
Persons aged 14 years and over. ‘Recent use’ means within the last 12 months.
*For non-medical purposes
*The prevalence of reported use in the ACT of the other illicit drugs covered in the NDS
Household Survey (inhalants, heroin, ketamine, GHB, steroids, methadone/buprenorphine,
and other opiates) has relative standard errors greater than 50%, meaning that the figures are
too unreliable for general use. Consequently, they are not reported here.
11
Australian Institute of Health and Welfare 2011, 2010 National Drug Strategy household
survey report, cat. no. PHE 145, AIHW, Canberra,
<http://www.aihw.gov.au/publications/phe/ndshs04sts/ndsh04sts.pdf>.
20.4 20.5
15.3
8.6 6.7
0
5
10
15
20
25
1996 1999 2002 2005 2008
Cu
rre
nt
smo
kers
(%
)
Current smokers, secondary school students, 1996 - 2008
5
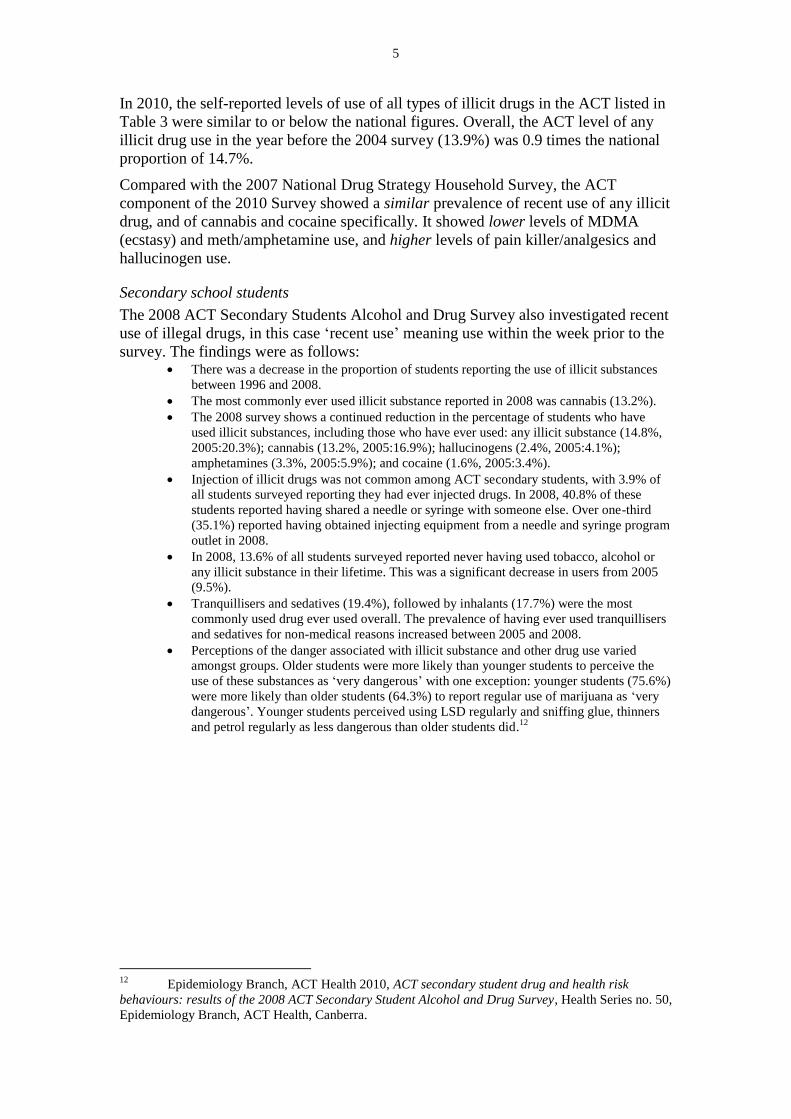
In 2010, the self-reported levels of use of all types of illicit drugs in the ACT listed in
Table 3 were similar to or below the national figures. Overall, the ACT level of any
illicit drug use in the year before the 2004 survey (13.9%) was 0.9 times the national
proportion of 14.7%.
Compared with the 2007 National Drug Strategy Household Survey, the ACT
component of the 2010 Survey showed a similar prevalence of recent use of any illicit
drug, and of cannabis and cocaine specifically. It showed lower levels of MDMA
(ecstasy) and meth/amphetamine use, and higher levels of pain killer/analgesics and
hallucinogen use.
Secondary school students
The 2008 ACT Secondary Students Alcohol and Drug Survey also investigated recent
use of illegal drugs, in this case ‘recent use’ meaning use within the week prior to the
survey. The findings were as follows: There was a decrease in the proportion of students reporting the use of illicit substances
between 1996 and 2008.
The most commonly ever used illicit substance reported in 2008 was cannabis (13.2%).
The 2008 survey shows a continued reduction in the percentage of students who have
used illicit substances, including those who have ever used: any illicit substance (14.8%,
2005:20.3%); cannabis (13.2%, 2005:16.9%); hallucinogens (2.4%, 2005:4.1%);
amphetamines (3.3%, 2005:5.9%); and cocaine (1.6%, 2005:3.4%).
Injection of illicit drugs was not common among ACT secondary students, with 3.9% of
all students surveyed reporting they had ever injected drugs. In 2008, 40.8% of these
students reported having shared a needle or syringe with someone else. Over one-third
(35.1%) reported having obtained injecting equipment from a needle and syringe program
outlet in 2008.
In 2008, 13.6% of all students surveyed reported never having used tobacco, alcohol or
any illicit substance in their lifetime. This was a significant decrease in users from 2005
(9.5%).
Tranquillisers and sedatives (19.4%), followed by inhalants (17.7%) were the most
commonly used drug ever used overall. The prevalence of having ever used tranquillisers
and sedatives for non-medical reasons increased between 2005 and 2008.
Perceptions of the danger associated with illicit substance and other drug use varied
amongst groups. Older students were more likely than younger students to perceive the
use of these substances as ‘very dangerous’ with one exception: younger students (75.6%)
were more likely than older students (64.3%) to report regular use of marijuana as ‘very
dangerous’. Younger students perceived using LSD regularly and sniffing glue, thinners
and petrol regularly as less dangerous than older students did.12
12
Epidemiology Branch, ACT Health 2010, ACT secondary student drug and health risk
behaviours: results of the 2008 ACT Secondary Student Alcohol and Drug Survey, Health Series no. 50,
Epidemiology Branch, ACT Health, Canberra.
6
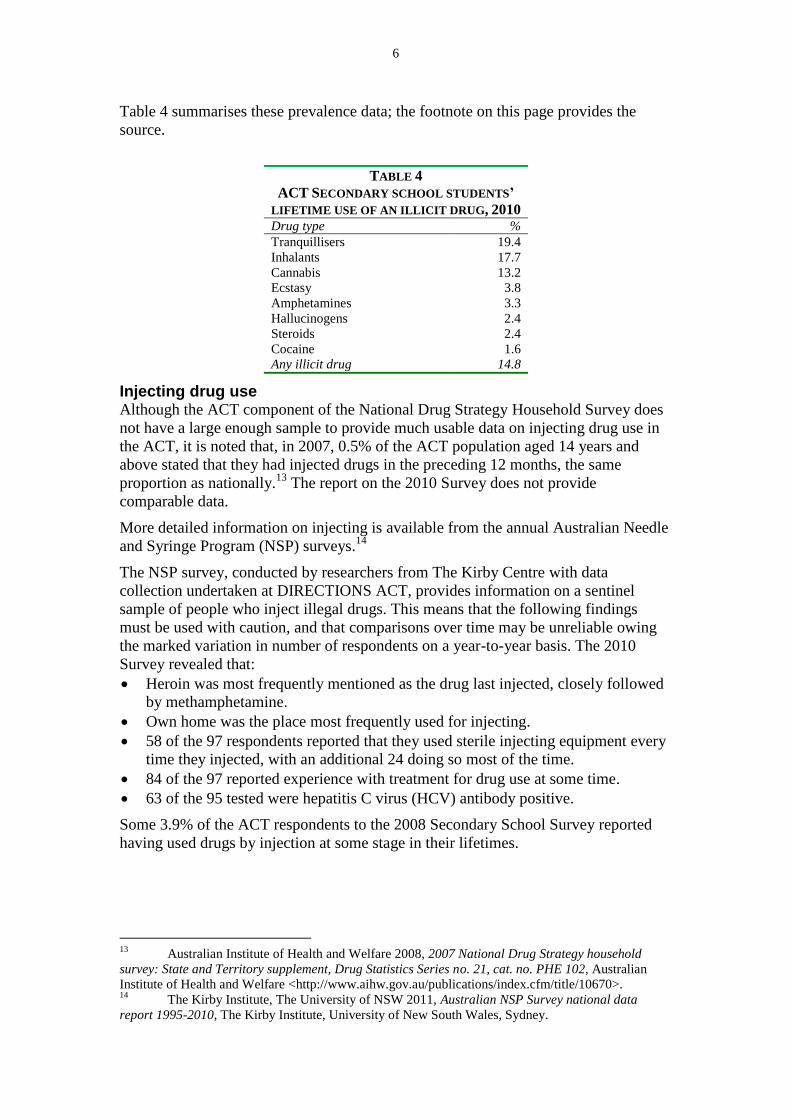
Table 4 summarises these prevalence data; the footnote on this page provides the
source.
TABLE 4
ACT SECONDARY SCHOOL STUDENTS’
LIFETIME USE OF AN ILLICIT DRUG, 2010 Drug type %
Tranquillisers 19.4
Inhalants 17.7
Cannabis 13.2
Ecstasy 3.8
Amphetamines 3.3
Hallucinogens 2.4
Steroids 2.4
Cocaine 1.6
Any illicit drug 14.8
Injecting drug use Although the ACT component of the National Drug Strategy Household Survey does
not have a large enough sample to provide much usable data on injecting drug use in
the ACT, it is noted that, in 2007, 0.5% of the ACT population aged 14 years and
above stated that they had injected drugs in the preceding 12 months, the same
proportion as nationally.13
The report on the 2010 Survey does not provide
comparable data.
More detailed information on injecting is available from the annual Australian Needle
and Syringe Program (NSP) surveys.14
The NSP survey, conducted by researchers from The Kirby Centre with data
collection undertaken at DIRECTIONS ACT, provides information on a sentinel
sample of people who inject illegal drugs. This means that the following findings
must be used with caution, and that comparisons over time may be unreliable owing
the marked variation in number of respondents on a year-to-year basis. The 2010
Survey revealed that:
Heroin was most frequently mentioned as the drug last injected, closely followed
by methamphetamine.
Own home was the place most frequently used for injecting.
58 of the 97 respondents reported that they used sterile injecting equipment every
time they injected, with an additional 24 doing so most of the time.
84 of the 97 reported experience with treatment for drug use at some time.
63 of the 95 tested were hepatitis C virus (HCV) antibody positive.
Some 3.9% of the ACT respondents to the 2008 Secondary School Survey reported
having used drugs by injection at some stage in their lifetimes.
13
Australian Institute of Health and Welfare 2008, 2007 National Drug Strategy household
survey: State and Territory supplement, Drug Statistics Series no. 21, cat. no. PHE 102, Australian
Institute of Health and Welfare <http://www.aihw.gov.au/publications/index.cfm/title/10670>. 14
The Kirby Institute, The University of NSW 2011, Australian NSP Survey national data
report 1995-2010, The Kirby Institute, University of New South Wales, Sydney.

7
Poly-drug use The Ecstasy and Related Drugs Reporting System (EDRS) confirms that polydrug use
is the norm among ACT people who inject illegal drugs:
As in previous years, the majority of ACT EDRS participants in 2010 were polydrug users.
Eighty-eight percent of participants reported that the last time they used ecstasy they had used
other drugs in combination with ecstasy. The drugs most commonly used in combination with
ecstasy by [recent ecstasy users] were alcohol, cannabis and tobacco. Cocaine, speed and LSD
were also commonly used in combination with ecstasy. Polydrug use can increase or alter
adverse effects in ways that are often unpredictable and problems relating to intoxication may
be enhanced due to the drug interactions arising from polydrug use. Treatment approaches and
harm reduction interventions need to take this into account, especially in relation to the effects
of drugs, safer use, withdrawal and overdose risk.15
15
Arora, S & Burns, L 2011, ACT trends in ecstasy and related drug markets 2010: findings
from the Ecstasy and Related Drugs Reporting System (EDRS), Australian Drug Trends Series no. 66,
National Drug and Alcohol Research Centre, University of New South Wales, Sydney, (p. 0 (sic)).

8
3. Drug availability
This section provides information on the availability of both legal and illegal drugs,
along with the price and purity of the illegal drugs.
Alcohol On 1 December 2011, 495 liquor licences were renewed in the ACT under the ACT
Liquor Act 2010, in the following categories: ‘on’ 291; ‘off’: 108; ‘club’: 61;
‘special’: 26; and ‘general’: 9. The number of renewals effected, in each year 2008 to
2011 is provided in Table 5.
The number of renewals has fallen by 18% from 2008 to 2011. This fall has been
largely driven by a 39% reduction in the number of ‘off’ licences renewed.
TABLE 5
LIQUOR LICENCE RENEWALS, ACT,
2008 TO 2011
Type 2008 2009 2010 2011
On 306 314 305 291
Off 176 181 173 108
Club 64 66 64 61
Special 42 39 38 26
General 13 12 12 9
Total 601 612 592 495
Note: the number of liquor licence renewals is the best indicator of trends in licences
on issue as they are all renewed on 1 December each year.
Source: Office of Regulatory Services, Justice and Community Safety Directorate.
Tobacco Retailers and wholesalers of tobacco products are required to be licensed under the
provisions of the ACT Tobacco Act 1927. At 30 June 2011 there were 367 tobacco
licences on issue.16
Trend data are available covering new tobacco licences issued and renewals of
licences. The number of licences on issue has fallen over each of the years reported
upon.
TABLE 6
TOBACCO LICENCES, NEW AND RENEWALS, ACT,
2007-08 TO 2010-11 Year 2007-08* 2008-09 2009-10 2010-11
New 429 53 38 45
Renewals .. 374 337 326
* The new/renewal licences breakdown is not available for the 2007-08 year.
Source: ACT Office of Regulatory Services, Justice and Community Safety Directorate.
16
ACT Government, Justice and Community Safety Directorate 2011, Annual Report 2010-11,
vol. 1, Justice and Community Safety Directorate, p. 53.

9
Pharmaceutical products The author is not aware of any source of data on the volume and types of
psychoactive pharmaceutical drugs prescribed and/or dispensed specifically in the
ACT.
Illicit drugs The Illicit Drugs Reporting System (IDRS) and the Ecstasy and Related Drugs
Reporting System (EDRS) provide information annually on the availability of illicit
drugs in the ACT, using as its sources interviews with current users and key
informants, and the data collected by various organisations including criminal justice
system agencies and those published by the Australian Crime Commission.17
The availability of heroin has been stable in recent years, and in 2010 remained
classified as ‘easy’ to ‘very easy’ to obtain in Canberra. Some 29% of 2010 IDRS
respondents indicate that they had used, in the previous six months, the brown powder
or rock forms of heroin (assumed to be sourced from Afghanistan) as well as the
purer, white powder form.
The availability with of methamphetamine is similar to heroin, with most EDRS
informants indicating that it is ‘easy’ or ‘very easy’ to obtain in the powdered
(‘speed’) form.
Cocaine was reported by illicit drug users as being ‘easy’ or ‘very easy’ to obtain in
the ACT, in contrast to four years earlier when most advised that it was ‘difficult’ or
‘very difficult’ to obtain.
Both bush cannabis and the hydroponic form remain ‘easy’ to ‘very easy’ to obtain.
Hydroponic cannabis is the dominant form of this drug in the Canberra region.
In 2010, MDMA (‘ecstasy’) was still classified by most informants as being ‘easy’ or
‘very easy’ obtain.
Illicit drugs’ price and purity Two sources of information on price and purity of illegal drugs are available, namely
the annual drug trends data from the Illicit Drugs Reporting System (IDRS) and the
Ecstasy and Related Drugs Reporting System (ERDS), and police data from the
Australian Crime Commission’s annual Illicit Drug Data Report (IDDR). The IDRS
cites data from the same sources as the IDDR uses (including the police services) and
collects its own data as well.
The 2010 IDRS findings regarding heroin were as follows The reported price for a cap of heroin has remained stable in the ACT since 2001 at $50. In
2010 the reported price for a gram of heroin decreased to $300 ($320 in 2009), which was
equivalent to 2007 and 2008…There was an increase in participants reporting heroin purity to
be ‘low’ from 47% in 2009 to 57% in 2010. In 2010, 28% reported heroin purity to be
‘medium’ (down from 37% in 2009), and only 4% reported purity to be ‘high’ (6% in 2009). 18
17
Spicer, B, Arora, S & Burns, L 2011, Australian Capital Territory drug trends 2010: findings
from the Illicit Drug Reporting System (IDRS), Australian Drug Trends Series no. 57, National Drug
and Alcohol Research Centre, University of New South Wales, Sydney.
Arora, S & Burns, L 2011, ACT trends in ecstasy and related drug markets 2010: findings from the
Ecstasy and Related Drugs Reporting System (EDRS), Australian Drug Trends Series no. 66, National
Drug and Alcohol Research Centre, University of New South Wales, Sydney.
18 Spicer, B, Arora, S & Burns, L 2011, Australian Capital Territory drug trends 2010: findings
from the Illicit Drug Reporting System (IDRS), Australian Drug Trends Series no. 57, National Drug
and Alcohol Research Centre, University of New South Wales, Sydney, p. xiv.

10
For powder methamphetamine (‘speed’) The reported price for a point of speed remained stable from 2009 to 2010 at $50. The median
price reported for a gram of speed also remained stable at $250…In 2010, participants
perceived the purity of speed to be ‘low’ (44%) to ‘medium’ (33%).19
For crystalline methamphetamine (‘ice’, ‘crystal’) The median price for a point of crystal remained stable in 2010 at $50. The price for a gram
decreased from $450 in 2009 to $275 in 2010; however, only a very small number of
participants reported on the price of this quantity in 2010 so results should be interpreted with
caution. There were mixed reports regarding current purity of crystal in 2010. It has been
suggested that the lower purity form may be domestically produced crystal, with higher purity
crystal imported…The majority of participants in 2010 reported that crystal purity was
‘medium’ (39%) or ‘high’ (33%). There was a significant decrease in the proportion of
participants who reported that crystal was ‘low’ in purity (22%; 54% in 2009).20
For cocaine, since only one respondent provided information on the price, purity and
availability of cocaine in 2010, so these data were not reported upon in the 2010
IDRS.
For cannabis The median reported price of a gram of hydro or bush remained stable from 2009 to 2010 at
$20. The median price for an ounce of hydro decreased to $280 in 2010 ($300 in 2009), while
the median price for an ounce of bush remained stable at $250. In 2010, small numbers
reported on the price per ounce for both types of cannabis (hydro and bush) so results should
be interpreted with caution…The majority of participants who reported on the potency of
hydro cannabis believed it to be of ‘high’ potency (52%), while bush was reported to be of
‘medium’ potency (56%).21
For ecstasy The median reported price for a tablet of ecstasy has remained stable in the ACT since 2003 at
$35 a tablet…The current purity of ecstasy was reported by REU to be at ‘medium’ to ‘high’
levels, and approximately one-fifth of the sample indicated that the purity of ecstasy had
fluctuated in the past six months.22
Comment: An important finding from the Australian Drug Policy Modelling Project
has been the usefulness of monitoring illicit drug price and purity as an instrument for
monitoring trends in illicit drug markets. The investigators have suggested that
monitoring the price per pure gram (or other unit) of each class of drugs of interest
provides a useful sentinel measure of drug availability and the impacts of law
enforcement. Modelling has demonstrated that this indicator tracks the 2001 end of
the Australian heroin glut as effectively as trends in overdoses,23
and the indicator has
19
Op. cit., p. xiv. 20
Op. cit., p. xv. 21
Op. cit., p. xv. 22
Campbell, G & Degenhardt, L 2007, ACT trends in ecstacy and related drug markets 2006:
findings from the Ecstasy and Related Drugs Reporting System, NDARC Technical Report no. 276,
National Drug and Alcohol Research Centre, University of New South Wales, Sydney, p. xiii. 23
Ritter, AJ 2005, ‘Improving illicit drug policy in Australia: the Drug Policy Modelling Project
(DPMP)’, paper presented to Australian Institute of Criminology Occasional Seminar, Canberra,
5 October; Moore, T, Caulkins, JP & Dietze, P 2005, Bulletin No 8: Illicit drugs in Australia: what do
we know about the role of price? DPMP Bulletin Series, Turning Point Alcohol and Drug Centre,
Fitzroy, Vic.; Moore, TJ, Caulkins, JP, Ritter, A, Dietze, P, Monagle, S & Pruden, J 2005, Heroin
markets in Australia: current understandings and future possibilities, Drug Policy Modelling Project
Monograph Series no. 09, Turning Point Alcohol and Drug Centre, Fitzroy, Vic.
11
been used to estimate the social costs of illicit drug use.24
Consideration could be
given to using this approach in the ACT.
24
Moore, TJ 2007, Working estimates of the social costs per gram and per user for cannabis,
cocaine, heroin and amphetamines, Drug Policy Modelling Project Monograph Series no. 14, National
Drug and Alcohol Research Centre, Sydney.

12
4. Drugs, crime and law enforcement
This section provides information in five areas: ACT drug-related arrests, people in
custody for a drug offence, drink-driver breath testing, roadside drug testing and
people taken into police custody owing to intoxication.
Drug-related arrests The Australian Crime Commission provides data concerning drug-crime arrests.
25
Using data provided by ACT Policing, they advise that, in the ACT in the 2009-10
year, 405 people classified as drug ‘consumers’ were arrested or issued with a SCON
(a Simple Cannabis Offence Notice), and 54 people classified as ‘providers’ were
arrested, a total of 459 offenders. This means that 88% of the ACT total were
consumers, a proportion similar to the national figure of 81%. In the previous year,
89% were classified as consumers.
For all drugs, the ACT arrest plus SCON rate was 129 per 100,000 population, just
34% of the equivalent national rate of 385 per 100,000.
Cannabis offences are the most frequent. Some 93% (96% in the previous year) of
people arrested for a cannabis offence or issued with a SCON in the ACT were
consumers, compared with 86% nationally. Cannabis consumers were 64% (59% in
the previous year) of all illicit drug arrests and SCONs in the ACT, compared with
57% nationally.
TABLE 7
DRUG ARRESTS, CONSUMERS AND PROVIDERS, ACT 2009-10 Drug Consumers Providers Total
Cannabis arrests 223 21 244
Cannabis SCONs 73 - 73
Heroin 21 9 30
Amphetamine-type
stimulants 76 24 100
Cocaine 8 0 8
Hallucinogens 1 0 1
Steroids 3 0 3
Other/unknown 0 0 0
All drugs (excl. SCONs) 332 54 386
All drugs (incl. SCONs) 405 54 459
SCON: Simple Cannabis Offence Notice
Source: Australian Crime Commission 2011, Illicit drug data report 2009-10,
Australian Crime Commission, Canberra.
25
Australian Crime Commission 2011, Illicit drug data report 2009-10, Australian Crime
Commission, Canberra.

13
Information on the types of drug offences is provided by ACT Policing:
TABLE 8
DRUG OFFENCES BY TYPE, ACT 2009-10 AND 2010-11 Offence type 2009-10 2010-11 % change
Possession or use of
drugs
426 426 0
Deal and traffic in drugs 61 42 -31
Manufacture and grow
drugs
40 32 -20
Other drug offences 2 0 -100
Total 529 500 -5
Source: ACT Policing 2011, Annual report 2010-11, ACT Policing, Canberra, p. 84.
ACT Policing data on the number of drug arrests/summonses issued each quarter
since September 2000 are illustrated in Figure 2. With the exception of large numbers
of arrests/summonses in late 2000 and early 2001, and another (though smaller) peak
in mid-2003, the number has remained largely within the range 40 to 60 per quarter.
FIGURE 2
Source: ACT Justice and Community Safety Directorate, ACT criminal justice statistical
profile, quarterly.
0
20
40
60
80
100
120
140
Sep
-00
Mar
-01
Sep
-01
Mar
-02
Sep
-02
Mar
-03
Sep
-03
Mar
-04
Sep
-04
Mar
-05
Sep
-05
Mar
-06
Sep
-06
Mar
-07
Sep
-07
Mar
-08
Sep
-08
Mar
-09
Sep
-09
Mar
-10
Sep
-10
Mar
-11
Sep
-11
Nu
mb
er
Arrests & summonses for drug offences, ACT, quarterly, 2000 to 2011

14
Prison inmates The quarterly ACT Criminal Justice Statistical Profile provides data on people in
custody and the offences involved, including drug offences. At the end of September
2011 there were 171 inmates of Canberra’s prison, the Alexander Maconochie Centre
(AMC), and in 3 cases drug offences were recorded as the most serious offence
leading to custody. 26
In 2011 researchers from the Burnet Institute conducted an evaluation of the drug
policies and services at the Alexander Maconochie Centre. They documented the
extent and nature of drug availability and use at the prison. Their report shows that
most of the inmates were users of illegal drugs immediately before incarceration.
Almost all are cigarette smokers, and most were drinking at harmful levels
immediately prior to incarceration. Three-quarters (74%) reported that the crimes for
which they were imprisoned were drug-related, and 79% reported that they were
affected by alcohol or other drugs when they committed the offence(s) for which they
were imprisoned. Some 32% reported injecting illegal drugs while at the AMC and
27% reported that the last time they had injected was in a prison.27
In May 2010 the ACT Government Health Directorate conducted the first Inmate
Health Survey at the AMC. Although detailed information on drug use and related
matters has yet to be published, the initial summary report on the Survey included
these findings:
48% of respondents are hepatitis C antibody positive; none are HIV positive
85% are current cigarette smokers
20% stated that they commenced smoking in prison
80% would like to quit cigarette smoking
16% of those who reported drinking consumed alcohol while in prison
91% had ever used illicit drugs and 67% of them had injected illegal drugs
53% of those who have ever injected illegal drugs are on the prison methadone
program
79% stated that they were under the influence of alcohol and/or other drugs at
the time of committing the offence that led to their imprisonment.28
26
ACT Government, Justice and Community Safety Directorate quarterly, ACT criminal justice
statistical profile September 2011 quarter, Justice and Community Safety Directorate,
<http://www.justice.act.gov.au/criminal_and_civil_justice/criminal_justice_statistical_profiles>. 27
Stoové, M & Kirwan, A 2011, External component of the evaluation of drug policies and
services and their subsequent effects on prisoners and staff within the Alexander Maconochie Centre,
Burnet Institute, Melbourne. 28
ACT Health, Epidemiology Branch 2011, 2010 ACT Inmate Health Survey summary results,
Health Series no. 55, ACT Health, Population Health Division & Mental Health, Justice Health and
Alcohol & Drug Services Division, Canberra.

15
Random breath testing ACT Policing conducts random breath testing as part of the ACT’s campaign against
drink-driving. Figure 3 illustrates data on the number of tests administered, and the
number that exceed the limit (0.05g% for most drivers) per 1,000 tests, quarterly for
the last 12 years.
In all, 98,245 random breath tests for drink-driving were conducted in the 12 months
to 30 September 2011 (90,112 in the 12 months to December 2010). In 1,448 cases
the driver exceeded the prescribed limit, a rate of 15 per 1,000 tests (the same rate as
the previous year).
Contrary to what is often found in media reporting, the data in Figure 3 reveal that the
ACT’s rate of positive breath tests has been lower over the last two years than it has
been over much of the previous five years.
Considerable variation exists on a quarter-by-quarter basis in both the number of tests
administered and the proportion that is positive. This reminds us that many criminal
justice system statistics reflect patterns of law enforcement effort as much as or more
than they do patterns of offending.29
In the case of what we call random breath testing,
fluctuations frequently reflect shifts between targeted testing in known hot-spots for
drink drivers, during some periods, and general deterrent-oriented testing of drivers in
other periods.
FIGURE 3
Source: ACT Justice and Community Safety Directorate, ACT criminal justice statistical
profile, quarterly, and author’s calculations.
29
Weatherburn, D 2011, Uses and abuses of crime statistics, Crime and Justice Bulletin,
Contemporary Issues in Crime and Justice Number 153, Bureau of Crime Statistics and Research,
Sydney.

16
Roadside drug testing In 2011 ACT Policing commenced testing drivers (and they have power to test driver
trainers as well) for the presence of three illicit drugs: MDMA (‘ecstasy’), THC (the
key impairing component of cannabis) and methamphetamine. Under recent
amendments to the ACT Road Transport (Alcohol and Drugs) Act 1977 it is an
offence for a person to drive a motor vehicle on a public street or in a public place if
that person has any detectible level of these drugs present in their blood or oral fluid
(saliva).
Although no statistics had been formally published at the time of writing, a media
report states that, in the first full year of implementation of the roadside drug testing
regime (May 2011 to May 2012) 761 roadside tests were conducted and 20 drivers
tested positive in both the roadside screening test and the confirmatory laboratory
assessment, a rate of 26 positives per 1,000 tests. ACT Policing laid 20 drug-driving
charges.30
People placed in custody owing to intoxication ACT Policing members have power to take into custody without arrest, and to detain
or release into someone else’s custody, people who are intoxicated and disorderly,
incapacitated and/or likely to cause injury. Protective custody data covering the five
years 2007 to 2011 are presented in Table 9.
During the year ended 30 June 2011, 1,093 occasions of protective custody occurred
owing to intoxication (males 943 and females 150). This total is similar to the
preceding two years, but well below the 2007 and 2008 figures.
TABLE 9
PEOPLE TAKEN INTO POLICE CUSTODY OWING TO INTOXICATION
ACT, YEAR TO 30 JUNE 2007 TO 2011 2007 2008 2009 2010 2011
Juveniles 76 68 55 49 46
Adults 1,541 1,261 950 1,119 1,047
Total 1,617 1,329 1,005 1,168 1,093
Source: ACT Policing annual reports.
People taken into protective custody without arrest owing to intoxication composed
26% of all people taken into custody by ACT Policing in 2010-1131
, demonstrating
the extent to which ACT Policing plays a social welfare role in addition to its criminal
justice system roles.
30
Knaus, C 2012, ‘20 caught in first year of drug tests’, Canberra Times, 23 May. 31
In the previously published version of this report this figure was incorrectly stated to be 35%.

17
5. Drugs and health
This section covers drug-related overdoses, opioid overdose mortality, diagnoses of
hepatitis C infection and alcohol-caused deaths and hospital presentations. It
commences with national data on the drugs that cause the greatest burden of disease
and injury.
Which drugs cause the greatest burden of disease and injury in the ACT? Although ACT data are not published, the study of the burden of disease and injury
nationally is informative.32
It identifies the top 14 risk factors in 2003 in terms of their
per cent contribution to the total individual and joint burden of disease and injury,
expressed in disability-adjusted life years (DALYs). Tobacco, alcohol and illegal
drugs composed 12.1% of the total burden:
Tobacco use topped the list, being the cause of 7.8% of the total burden of disease
and injury.
Alcohol was also in the top 14, accounting for 2.3% in net terms, after taking into
account alcohol’s protective characteristics.33
Illicit drugs were also in the top 14, causing 2.0% of the total burden of disease
and injury. The impact of hepatitis C-caused mortality is especially significant in
this figure. The age-standardised rates of new cases of liver cancer (most of
which are caused by hepatitis B and/or C infection) are predicted to rise by 22%
in males and 33% in females over the next decade.34
Looking at these three drug classes only, tobacco accounted for 65% of the drug-
related burden of disease and injury, alcohol 19% and illicit drugs 16%.
Although these are national data, and becoming increasingly dated, insofar as they
accurately represent the ACT situation they are potentially important in guiding
resource allocation.
32
Begg, S, Vos, T, Barker, B, Stevenson, C, Stanley, L & Lopez, AD 2007, The burden of
disease and injury in Australia 2003, AIHW cat. no. PHE 82, Australian Institute of Health and
Welfare, Canberra. 33
The extent to which low-level alcohol consumption is actually a protective factor for coronary
heart disease is now being questioned: Chikritzhs, T, Fillmore, K & Stockwell, T 2009, ‘A healthy dose
of scepticism: four good reasons to think again about protective effects of alcohol on coronary heart
disease’, Drug Alcohol Rev, vol. 28, no. 4, pp. 441-4. 34
Australian Institute of Health and Welfare 2012, Cancer incidence projections: Australia, 2011 to
2020, Cancer Series no. 66, cat. no. CAN 62, AIHW, Canberra.

18
Drug-related overdoses Ambulance callouts to overdoses are monitored by the ACT Ambulance Service.
Their data showing trends in opioid (mostly heroin) overdoses are in Figure 4. The
end of the national heroin glut (sometimes referred to as the commencement of the
heroin drought) commenced at Christmas 2000. The incidence of opioid overdoses
then fell sharply. Most of the overdoses, while constituting medical emergencies, are
non-fatal.
FIGURE 4
Source: ACT Ambulance Service as reported in Spicer, B, Arora, S & Burns, L 2011,
Australian Capital Territory drug trends 2010: findings from the Illicit Drug Reporting
System (IDRS), Australian Drug Trends Series no. 57, National Drug and Alcohol Research
Centre, University of New South Wales, Sydney.
Monthly data for the first ten months of 2011 follow.
TABLE 10
ACT AMBULANCE CALLOUTS TO OVERDOSES
NUMBER HEROIN, % HEROIN AND NUMBER FROM ALL
DRUGS, JAN-OCT 2011 Month Heroin Heroin % Other drugs Total ODs
Jan-10 4 5.8 65 69
Feb-10 6 8.8 62 68
Mar-10 11 11.8 82 93
Apr-10 6 13.3 39 45
May-10 3 4.8 60 63
Jun-10 6 17.6 28 34
Jul-10 3 6.1 46 49
Aug-10 9 14.8 52 61
Sep-10 4 5.9 64 68
Oct-10 6 11.8 45 51
Total 58 9.7 543 601
Source: ACT Ambulance Service and author’s calculations.
547
478
327
130 159
248
109 66 85
130 99 113
0
100
200
300
400
500
600
1999 2000 2001 2002 2003 2004 2005 2006 2007 2008 2009 2010
Nu
mb
er
of
ove
rdo
se c
allo
uts
Annual number of heroin overdoses attended by the ACT Ambulance Service, year to 30 June,
1999 to 2010
19
It will be noted that the number of heroin overdoses, and the proportion of all
overdoses that are attributed to heroin, fluctuates considerably on a month-to-month
basis.
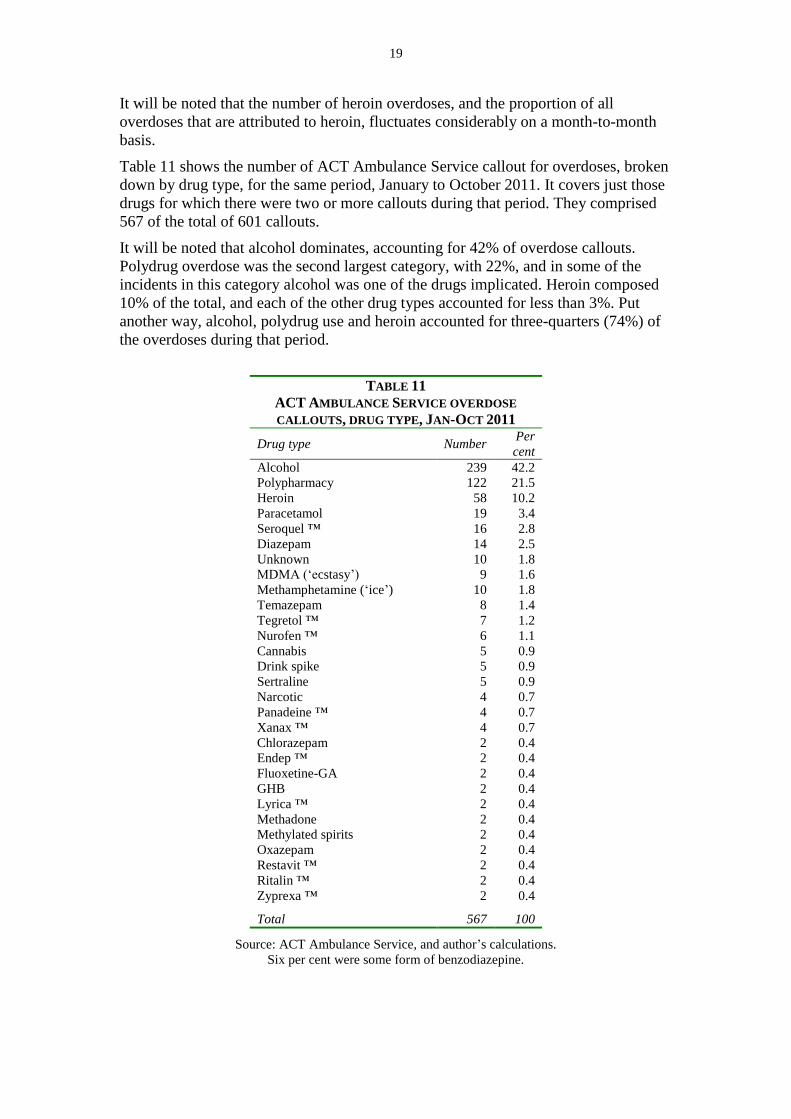
Table 11 shows the number of ACT Ambulance Service callout for overdoses, broken
down by drug type, for the same period, January to October 2011. It covers just those
drugs for which there were two or more callouts during that period. They comprised
567 of the total of 601 callouts.
It will be noted that alcohol dominates, accounting for 42% of overdose callouts.
Polydrug overdose was the second largest category, with 22%, and in some of the
incidents in this category alcohol was one of the drugs implicated. Heroin composed
10% of the total, and each of the other drug types accounted for less than 3%. Put
another way, alcohol, polydrug use and heroin accounted for three-quarters (74%) of
the overdoses during that period.
TABLE 11
ACT AMBULANCE SERVICE OVERDOSE
CALLOUTS, DRUG TYPE, JAN-OCT 2011
Drug type Number Per
cent
Alcohol 239 42.2
Polypharmacy 122 21.5
Heroin 58 10.2
Paracetamol 19 3.4
Seroquel ™ 16 2.8
Diazepam 14 2.5
Unknown 10 1.8
MDMA (‘ecstasy’) 9 1.6
Methamphetamine (‘ice’) 10 1.8
Temazepam 8 1.4
Tegretol ™ 7 1.2
Nurofen ™ 6 1.1
Cannabis 5 0.9
Drink spike 5 0.9
Sertraline 5 0.9
Narcotic 4 0.7
Panadeine ™ 4 0.7
Xanax ™ 4 0.7
Chlorazepam 2 0.4
Endep ™ 2 0.4
Fluoxetine-GA 2 0.4
GHB 2 0.4
Lyrica ™ 2 0.4
Methadone 2 0.4
Methylated spirits 2 0.4
Oxazepam 2 0.4
Restavit ™ 2 0.4
Ritalin ™ 2 0.4
Zyprexa ™ 2 0.4
Total 567 100
Source: ACT Ambulance Service, and author’s calculations.
Six per cent were some form of benzodiazepine.

20
IDRS data derived from interviews with Canberra people who use illegal drugs reveal
how frequently they experience non-fatal overdoses. The authors reported that, In 2010, 48% of participants reported having overdosed on heroin at least once at some point
in their lives, a decrease from 54% in 2009.
Sixty percent of participants who reported ever having overdosed on heroin reported having
overdosed one to 5 times, 23% reported having overdosed between 6 and 10 times and 17%
reported 11 or more times. The median time to last heroin overdose was 60 months, or five
years (range 5-396 months).
…in 2010, 19% of participants reported having overdosed on heroin in the year prior to the
interview, the same proportion as in 2009. No participants reported overdosing on heroin in
the past month.35
Opioid overdose mortality Trends in opioid overdose deaths are monitored by the National Drug and Alcohol
Research Centre (NDARC), using ABS data. The most recent data published are for
the 2007 calendar year. 36
Table 12, showing time series data from 1988, demonstrates
that the end of the heroin glut in December 2000 had far less impact in the ACT, in
terms of opioid overdose mortality, than nationally.
The number of accidental ACT opioid overdoses in the 2004-2007 period was low
compared with the numbers in the late 1990s, the period of the heroin glut. The most
recent figures are broadly similar to those observed in the first half of the decade of
the 1990s prior to the heroin glut.
The opioid overdose mortality rate among people aged 15-54 years for the ACT in
2007 was 1.7 per 100,000 of the ACT’s population, 30% higher than the national rate
of 1.3 per 100,000. NDARC has not published 2005 and 2006 ACT mortality data in
the interests of protecting confidentiality.
35
Spicer, B, Arora, S & Burns, L 2011, Australian Capital Territory drug trends 2010: findings
from the Illicit Drug Reporting System (IDRS), Australian Drug Trends Series no. 57, National Drug
and Alcohol Research Centre, University of New South Wales, Sydney, p. 54. 36
Roxburgh, A & Burns, L 2011, Drug-induced deaths in Australia, 2007 edition, National
Drug and Alcohol Research Centre, UNSW, Sydney.

21
TABLE 12
NUMBER OF ACCIDENTAL DEATHS DUE TO
OPIOIDS AMONG THOSE AGED 15-54 YEARS,
ACT AND AUSTRALIA, 1988-2007 Year ACT Australia % ACT
1988 2 351 0.6
1989 2 307 0.7
1990 0 321 0.0
1991 2 250 0.8
1992 4 336 1.2
1993 5 374 1.3
1994 3 425 0.7
1995 13 582 2.2
1996 17 557 3.1
1997 9 713 1.3
1998 14 927 1.5
1999 11 1,116 1.0
2000 10 938 1.1
2001 12 386 3.1
2002 8 364 2.2
2003 17 357 4.8
2004 2 357 0.6
2005 np 374 -
2006 np 269 -
2007 6 266 0.2
Notes
1. ‘np’ means that the data were not published in order to protect confidentiality
2. ABS changed its data collection system in the 2005-2006 period, with the result
that the data for 2006 and beyond are not directly comparable with those of
previous years.
Sources:
Degenhardt, L & Roxburgh, A 2007, Accidental drug-induced deaths due to opioids
in Australia, 2005, National Drug and Alcohol Research Centre, Sydney
Roxburgh, A & Burns, L 2009, Drug-induced deaths in Australia, 2006 edition,
National Drug and Alcohol Research Centre, UNSW, Sydney.
---- 2011, Drug-induced deaths in Australia, 2007 edition, National Drug and
Alcohol Research Centre, UNSW, Sydney.
Author’s calculations.
Diagnoses of viral hepatitis infection Injecting drug use is a major risk factor for the transmission of the hepatitis C virus
(HCV) and the hepatitis B virus (HBV) through sharing injecting equipment and
contaminated injecting environments. As the Kirby Institute points out, ‘Based on
reported cases, [in 2010] hepatitis B and hepatitis C transmission in Australia
continued to occur predominantly among people with a recent history of injecting
drug use’.37
In 2010, injecting drug use was the source of infection in 86% of the
newly diagnosed cases of HCV infection in Australia for which data on the source
were available (the same proportion as in the previous year). For hepatitis B, injecting
drug use accounted for 74% of newly diagnosed cases (55% the previous year).
37
The Kirby Institute, The University of NSW 2011, HIV, viral hepatitis and sexually
transmissible infections in Australia Annual Surveillance Report 2011, The Kirby Institute, the
University of New South Wales, Sydney, p. 7.

22
The most recent five years of data on hepatitis B infections in the ACT and Australia
follow. The incidence has fluctuated markedly over the last two decades.
TABLE 13
NUMBER AND RATE* OF DIAGNOSES OF HEPATITIS B INFECTION, 2006-2010
ACT AND AUSTRALIA Year of
diagnosis
2006 2007 2008 2009 2010
Number Rate Number Rate Number Rate Number Rate Number Rate
ACT 77 20.8 68 19.1 59 16.0 106 28.0 96 25.7
Australia 6,499 31.0 7,137 33.5 6,765 31.1 7,335 33.0 4,640 30.3
* Rate per 100,000 population
Source: The Kirby Institute, The University of NSW 2011, HIV, viral hepatitis and sexually
transmissible infections in Australia Annual Surveillance Report 2011, The Kirby Institute, the
University of New South Wales, Sydney.
In 2010 there were 223 (165 in the previous year) diagnoses of HCV infection in the
ACT, a rate of 58 (44 in the previous year) per 100,000, and higher than the national
rate of 50 (52 in the previous year) per 100,000. Both the national and ACT rates of
diagnoses have fallen steadily in recent years.
TABLE 14
NUMBER AND RATE* OF DIAGNOSES OF HEPATITIS C INFECTION, 2006-2010
ACT AND AUSTRALIA Year of
diagnosis
2006 2007 2008 2009 2010
Number Rate Number Rate Number Rate Number Rate Number Rate
ACT 191 52.8 202 54.8 200 54.6 165 43.8 223 58.5
Australia 12,285 58.6 12,202 57.4 11,458 52.9 11,474 52.0 7,608 50.1
* Rate per 100,000 population
Source: The Kirby Institute, The University of NSW 2011, HIV, viral hepatitis and sexually
transmissible infections in Australia Annual Surveillance Report 2011, The Kirby Institute, the
University of New South Wales, Sydney.
Figure 5 shows trend data derived from the National Notifiable Diseases Surveillance
System that operates under the auspices of the Communicable Diseases Network
Australia. As the managers of the Surveillance System explain:
Under this scheme, notifications are made to the States or Territory health authority under the
provisions of the public health legislation in their jurisdiction. Computerised, de-identified
unit records of notifications are supplied to the Australian Government Department of Health
and Ageing on a daily basis, for collation, analysis and publication on the Internet, (updated 3
times per week), and in the quarterly journal Communicable Diseases Intelligence.38
Figure 5 demonstrates a steady decline in hepatitis C notifications to 2009, with
significant fluctuations in the two years since then.
38
Source: National Notifiable Diseases Surveillance System:
http://www.health.gov.au/internet/main/publishing.nsf/content/cda-surveil-nndss-nndssintro.htm .

23
FIGURE 5
Source: National Notifiable Diseases Surveillance System
<http://www9.health.gov.au/cda/Source/Rpt_4.cfm>.
Alcohol caused deaths and hospital presentations The National Alcohol Indicators Project (NAIP) conducted by the National Drug
Research Institute (NDRI) has produced estimates of the numbers of lives lost and
saved owing to drinking alcoholic beverages for the 1992-2001 decade. They estimate
that alcohol caused 341 deaths in the ACT over that period, and saved 38 lives, with a
net loss of 303 lives.39
More recent data are not available.
TABLE 15
ESTIMATED NUMBER OF LIVES LOST AND SAVED OWING TO RISKY AND HIGH RISK
DRINKING, ACT & AUSTRALIA, 1992-2001 Lives lost Lives saved
Jurisdiction Males Females Total Males Females Total
ACT 253 88 341 21 17 38
Australia 23,430 7,702 31,133 2,223 1,352 3,576
39 Source for all data in this section: Chikritzhs, T, Catalano, P, Stockwell, T, Donath, S, Ngo, H,
Young, D & Matthews, S 2003, Australian alcohol indicators, 1990-2001: patterns of alcohol use and
related harms for Australian states and territories, National Drug Research Institute, Curtin University
of Technology, Perth, W.A. and author’s calculations.
0
50
100
150
200
250
300
350
19
95
19
96
19
97
19
98
19
99
20
00
20
01
20
02
20
03
20
04
20
05
20
06
20
07
20
08
20
09
20
10
20
11
Nu
mb
er
Hepatitis C notifications, ACT, 1995 to 2011

24
TABLE 16
ESTIMATED NUMBER OF LIVES LOST AND SAVED FOR ACUTE AND
CHRONIC CONDITIONS OWING TO RISKY AND HIGH RISK DRINKING
ACT, 1992-2001 Lives lost Lives saved
Acute Acute 0
Road crash injury 54 Chronic 38
Suicide 32 Total saved 38
Homicide 7
Other injury 22
Alcohol poisoning 33
Alcohol abuse and psychosis 3
Other acute medical 31
Total acute 182
Chronic
Alcoholic liver cirrhosis 82
Alcohol dependence 10
Cardiovascular disease 7
Cancer 31
Other chronic medical 28
Total chronic 158
Total lives lost (acute plus chronic) 341
Net alcohol-caused deaths 303
Note: rounding errors affect totals
The same source also reported that, over the 8 year period 1993-04 to 2000-01, the
ACT had 4,897 hospitalisations caused by alcohol and 555 hospitalisations were
prevented by alcohol.
Hospital separations related to illicit drugs The Australian Institute of Health and Welfare (AIHW) published data on drug-
related hospital separations, as shown in Table 17. It shows that the ACT rate is 20%
higher that of Australia overall.
TABLE 17
PUBLIC HOSPITAL SEPARATIONS FOR ALCOHOL/DRUG USE
AND ALCOHOL/DRUG INDUCED ORGANIC MENTAL DISORDERS,
ACT AND AUSTRALIA, NUMBER AND RATE*, 2009-10 Jurisdiction Number Rate*
ACT 634 1.8
Australia 33,571 1.5
Notes:
Rate per 1,000 population.
Includes both same-day and overnight acute separations.
Private hospital data are not published for the ACT for reasons of confidentiality.
Source: Australian Institute of Health and Welfare 2011, Australian hospital statistics 2009-
10, Health Services Series, no. 40, AIHW cat. no. HSE 107, Australian Institute of Health and
Welfare, Canberra, and author’s calculations.

25
Hospital Emergency Department separations for psychoactive substance use Substance abuse is heavily implicated in the work of hospital Emergency
Departments. The following table shows the number of separations (i.e. people
seeking medical attentions) that were diagnosed as ‘due to psychoactive substance
use’, as the International Statistical Classification of Diseases and Related Health
Problems (ICD-10) calls it, for each of the five years from 2006-07 to 2010-11 for
The Canberra Hospital and Calvary Hospital combined.
The most notable aspect is the dominance of alcohol, with 77% of all the substance
use separations in the most recent (2010-11) year being for alcohol-related conditions.
Some 56% of the total were for acute alcohol intoxication, with an additional 6% for
alcohol use withdrawal problems and the same proportion for the alcohol dependence
syndrome.
Opioids composed just 4.1% of the 2010-11 Emergency Department separations,
stimulants 3.3%, and cannabis 1.4%.
TABLE 18
EMERGENCY DEPARTMENT SEPARATIONS FOR MENTAL AND BEHAVIOURAL DISORDERS DUE TO
PSYCHOACTIVE SUBSTANCE USE, THE CANBERRA HOSPITAL AND CALVARY HOSPITAL
2006-07 TO 2010-11
Mental and behavioural disorders due to … 2006-
07
2007-
08
2008-
09
2009-
10
2010-
11 Total
Alcohol acute intoxication 291 308 383 353 361 1,696
Alcohol use withdrawal state 38 25 27 68 36 194
Alcohol use dependence syndrome 39 42 26 27 47 181
Multiple drug/psychoactive substance use withdrawal
state 24 26 35 38 27 150
Alcohol: unspecified mental and behavioural
disorders 18 17 23 40 36 134
Multiple drug/psychoactive substance use
dependence syndrome 12 18 15 25 15 85
Alcohol withdrawal state with delirium 12 11 14 24 17 78
Stimulants dependence syndrome 11 12 12 11 13 59
Multiple drug/psychoactive substance use:
unspecified 5 17 9 12 13 56
Opioid use withdrawal state 7 6 11 15 11 50
Multiple drug/psychoactive substance use acute
intoxication 8 4 6 13 16 47
Opioid use dependence syndrome 10 13 11 4 4 42
Alcohol harmful use 2 1 3 9 18 33
Opioids: unspecified mental and behavioural
disorders 3 7 3 9 3 25
Cannabis use dependence syndrome 3 4 4 6 3 20
Stimulants: unspecified mental and behavioural
disorders 5 5 1 4 4 19
Multiple drug/psychoactive substance use psychotic
disorder 4 2 3 3 5 17
Alcohol use psychotic disorder 4 3 2 2 6 17
Stimulant use acute intoxication 3 1 2 2 6 14
Cannabis: unspecified mental and behavioural
disorders 1 2 1 4 3 11
Multiple drug/psychoactive substance harmful use 1 2 0 5 1 9
Sedative hypnotics: unspecified mental and 1 0 2 3 2 8

26
TABLE 18
EMERGENCY DEPARTMENT SEPARATIONS FOR MENTAL AND BEHAVIOURAL DISORDERS DUE TO
PSYCHOACTIVE SUBSTANCE USE, THE CANBERRA HOSPITAL AND CALVARY HOSPITAL
2006-07 TO 2010-11
Mental and behavioural disorders due to … 2006-
07
2007-
08
2008-
09
2009-
10
2010-
11 Total
behavioural disorders
Multiple drug/psychoactive substance withdrawal
state with delirium 1 1 0 2 3 7
Antidepressants 2 0 4 0 0 6
Analgesics 1 1 1 2 0 5
Cannabis use acute intoxication 1 2 1 0 1 5
Cannabis harmful use 1 0 1 0 3 5
Hallucinogens acute intoxication 0 1 0 4 0 5
Sedative hypnotics acute intoxication 1 2 0 0 2 5
Hallucinogens: unspecified mental and behavioural
disorders 0 3 1 0 1 5
Opioid use acute intoxication 0 1 0 1 2 4
Opioids use psychotic disorders 1 0 1 1 1 4
Sedative hypnotics withdrawal state 1 0 3 0 0 4
Unspecified harmful use non-dependence substance 0 0 0 2 2 4
Antacids 1 0 1 1 0 3
Stimulants harmful use 0 0 0 1 2 3
Stimulants psychotic disorder 0 1 1 1 0 3
Stimulants withdrawal state 0 1 0 0 2 3
Cannabis psychotic disorders 1 0 0 0 1 2
Hallucinogens withdrawal state 0 1 0 0 1 2
Sedative hypnotics withdrawal state with delirium 0 0 0 0 2 2
Stimulant withdrawal state with delirium 0 1 0 1 0 2
Specific herbal or folk remedies 0 0 1 0 1 2
Steroids or hormones 0 0 1 0 1 2
Cannabis use withdrawal state 0 1 0 0 0 1
Cocaine dependence syndrome 1 0 0 0 0 1
Cocaine withdrawal state 0 1 0 0 0 1
Hallucinogens psychotic disorder 0 0 0 0 1 1
Hallucinogens harmful use 0 0 0 0 1 1
Sedative hypnotics harmful use 0 0 0 0 1 1
Opioid withdrawal state with delirium 0 0 1 0 0 1
Volatile solvents: unspecified mental and behavioural
disorders 0 0 1 0 0 1
Other substances which do not produce dependence 1 0 0 0 0 1
Vitamins 0 0 1 0 0 1
Total 515 543 612 693 675 3,038
Source: ACT Health Directorate Information Management Branch, unpublished data.

27
6. Other types of drug-related harm
Children’s exposure to adult drug use A national study has estimated the proportion of Australian children living in
households where they are exposed to adult drug use. It concluded that
…3.2 per cent or 231 705 children are at risk of exposure to binge drinking in the household
by at least one adult; 2.3 per cent or 40 372 live in a household containing at least one daily
cannabis user. Finally, 0.8 per cent or 14 042 live in a household with an adult who uses
methamphetamine at least monthly and reports doing so in their home. 40
These proportions can be applied to the ACT population. In June 2010 there were an
estimated 57,619 children in the ACT aged 12 years or younger. If their drug
exposure was similar to the national experience, the numbers would be as set out in
Table 19. Many more are exposed to tobacco smoking in the home.
TABLE 19
ESTIMATED* CHILDREN’S EXPOSURE TO ADULT DRUG
USE IN THE HOUSEHOLD, ACT, 2010
Exposure to drugs % Number
Binge drinking 13.2 7,606
Cannabis user - daily 2.3 1,325
Methamphetamine user (use at least monthly
in the home)
0.8 461
Total 16.3 9,392
* Estimate based on applying the national rates (footnote 39) to
ACT population data.
Perception of neighbourhood problems Drug-related crime and/or public nuisance in people’s neighbourhoods is a matter of
concern to many, so this is assessed in the annual ABS Crime Victimisation Survey.
The 2010-11 Survey revealed that 12.0 % of ACT respondents felt that there were
problems with public drunkenness in their local area (10.2% in the previous year),
compared with 17.0% nationally. A much lower proportion, 4.9%, had a perception of
local problems with people using or dealing drugs (4.0 in the previous year),
compared with 7.6% nationally.41
It is noteworthy that the prevalence of concerns about drunkenness and illegal drugs
in ACT neighbourhoods is far lower than for some other perceived problems,
including noisy driving (33%), dangerous driving (32%) and intentional damage to
property (16%).
40
Dawe, S, Frye, S, Best, D, Moss, D, Atkinson, J, Evans, C, Lynch, M & Harnett, P 2006,
Drug use in the family: impacts and implications for children, ANCD Research Paper no. 13,
Australian National Council on Drugs, Canberra, p. 17. 41
Australian Bureau of Statistics 2012, Crime victimisation, Australia, 2010-11, cat. no. 4530.0,
Australian Bureau of Statistics, Canberra.
28
Discarded syringes The ACT Government Territory and Municipal Services Directorate provides a
service relating to inappropriately discarded syringes: members of the public are
invited to call a hot-line if they see such paraphernalia, and a ranger will attend and
safely remove the injecting equipment. This is an important service, helping to
maintain the integrity of the NSP services, despite the fact that the risk of contracting
a communicable disease such as hepatitis B or C from an accidental needle-stick
injury, in a public place, is very low.42
In the 2010-11 year they responding to 284
reports of syringes found in public places, collecting more than 4,303 discarded and
used syringes.43
In the previous year they responded to 331 reports and collected more
than 4,265 syringes. During 2010-11, approximately 750,000 needles and syringes
were distributed in the ACT through NSPs, pharmacies and vending machines. This
means that only a tiny proportion of the syringes distributed (0.6%) are disposed of
inappropriately.
Activities undertaken while under the influence of alcohol and other drugs A special analysis of the National Drug Strategy Household Survey data undertaken
by the ACT Health Directorate provides information on activities undertaken while
respondents were under the influence of alcohol and illicit drugs. Details are in
Table 20 below. It shows that, with respect to the ACT population aged 14 years and
above, in 2010:
About 18% of drinkers stated that they drove a motor vehicle while under
influence of alcohol in the 12 months prior to the survey. The proportion of males
doing so was significantly higher than the proportion of females. Among males,
but not females, the prevalence fell between 2007 and 2010.
About 6% of drinkers went to work while under influence of alcohol in the
previous 12 months. The proportion of males doing so was markedly higher than
the proportion of females. Among both males and females the prevalence fell
between 2007 and 2010.
About 23% of people who had used an illicit drug in the year before being
interviewed (‘recent users’) stated that they had driven a motor vehicle while
under influence of illicit drugs in the previous 12 months. The proportion of
males doing so was higher than the proportion of females. The prevalence of
driving under the influence of illicit drugs fell significantly among males from
2007 to 2010, but rose significantly among females.
About 13% of recent users went to work while under influence of illicit drugs in
the previous 12 months (with similar proportions of males and females). The
prevalence was similar in 2007 and 2010.
42
Papenburg, J et al. 2008, ‘Pediatric injuries from needles discarded in the community: epidemiology
and risk of seroconversion’, Pediatrics, vol. 122, no. 2, pp. e487-92. 43
ACT Government, Territory and Municipal Services Directorate 2011, Annual report 2010-
11, vol. 1, Territory and Municipal Services Directorate, Canberra. This number seems high, and
represents 15 syringes per callout, on average. It is understood, however, that most callouts to remove
syringes from public places such as parks are for just one or two syringes. This means that the 4,303
total for the year must include callouts to pick up large-quantities, perhaps bulk supplies of used
equipment left at syringe vending machines.

29
TABLE 20
ACTIVITIES UNDERTAKEN WHILE UNDER THE INFLUENCE OF ALCOHOL
AND ILLICIT DRUGS IN THE PAST 12 MONTHS, BY SEX, ACT, 2010
Males Females Persons
Alcohol
Drove a motor vehicle 22.6 13.0 17.9
Verbally abused someone 5.8 2.2* 4.0
Went swimming 6.7 5.5 6.1
Went to work 6.3 3.1 4.7
Created a disturbance, damaged or stole goods 6.0 2.7* 4.4
Operated a boat or hazardous machinery 1.8* .. 0.9*
Physically abused someone 0.5* 0.4** 0.5**
Took part in at least one potentially harmful activity 31.6 20.0 25.9
Illegal drugs
Drove a motor vehicle 24.7 20.9 23.3
Verbally abused someone 5.6 4.3 5.1
Went swimming 16.1 5.1 12.1
Went to work 13.2 12.1 12.8
Created a disturbance, damaged or stole goods 5.1 6.2 5.5
Operated a boat or hazardous machinery 6.4 .. 4.1
Physically abused someone 2.2* .. 1.4*
Took part in at least one potentially harmful activity n/a n/a n/a
Notes:
Alcohol: base is people who have used alcohol in the previous 12 months.
Illicit drugs: base is people who have used an illicit drug in the previous 12 months.
* Estimate has a relative standard error between 25-50% and should be used with caution
** Estimate has a relative standard error greater than 50% and should be used with caution
Source: National Drug Strategy Household Survey 2010, computer files, unpublished analysis by the
ACT Health Directorate Epidemiology Branch.

30
7. Trends and emerging issues
A number of trends and emerging issues warrant specific attention here.
The prevalence of tobacco use continues to fall, with the gap between the female
and male rates closing.
Self-reported cigarette smoking rates among secondary school students have
fallen markedly in recent years, with the fall greater among female students than
males (though some question the accuracy of the ASSAD survey that produces
these figures).44
The prevalence of use of illicit drugs overall has remained steady in recent years
(recent use in 2001: 17.8%, in 2004: 17.6%, in 2007: 13.8%, in 2010: 13.9%).
Use of MDMA (‘ecstasy’) and meth/amphetamine fell between the 2007 and
2010 NDS Household Surveys, the non-medical use of pain killers and of
hallucinogens rose, and prevalence of use of cannabis and cocaine remained
essentially stable.
Illegal drugs remain ‘easy’ to ‘very easy’ to obtain in Canberra. This includes
cocaine which was in short supply until recent years.
The number of illicit drug related arrests and SCONs issued fluctuates within a
wide band; no specific trend is apparent.
The proportion of drivers exceeding the prescribed levels of alcohol in random
breath testing fluctuates hugely, apparently reflecting patterns of policing drink-
driving (including the mix of targeted and non-targeted testing), rather than any
trends in drink driving as such.
An information system on people tested for drug driving, paralleling that used for
drink driving, should be established to enable the authorities to monitor and
evaluate this new initiative.
The first ACT Inmate Health Survey has been conducted and an overview of the
findings released. Work is in hand to develop a report detailing findings related to
the use of psychoactive drugs, inmates’ drug-related risk behaviours, etc.
Repeating the survey at intervals will produce data valuable for monitoring and
evaluation, and for adjusting prison and community corrections’ services to better
meet the needs of inmates and prison staff.
The number of people apprehended without arrest and held in police custody
owing to intoxication has fallen in recent years. The reasons for this, and their
implications, are unclear to the author.
Alcohol continues to be the psychoactive substance that is most frequently the
cause of overdoses responded to by the ACT Ambulance Service, followed by
polydrug use. This is also the pattern with Emergency Department separations at
The Canberra Hospital and Calvary Hospital.
While the number of opioid overdoses callouts responded to by ambulance
officers has fluctuated over the years, the most recent numbers are significantly
lower than observed those during the late 1990s heroin glut period.
The number of new cases of hepatitis C diagnosed in the ACT is markedly lower
than a decade ago, but rose between 2009 and 2010. A close watch on the trend
line is needed, along with renewed preventive interventions if the incidence
continues to rise.
44
Siggins Miller, Miller, M-E, Siggins, I, Hall, W, Bush, R, McDonald, D, Cleary, G, Lai, SH-C
& Ho, B 2009, Evaluation and monitoring of the National Drug Strategy 2004-2009: final report.
Volume 1: findings and recommendations, Siggins Miller, Brisbane, p. xiii.

31
In Australia generally, and probably in the ACT specifically, the prevalence of
use of prescribed opioids, and of these drugs diverted into illicit markets, is rising.
In parallel with this is a rise in the incidence of harms related to these drugs.45
Some observers are concerned that this trend could develop as it has in the USA
where more accidental overdose deaths now occur from prescribed opioids than
from heroin.46
Synthetic cannabinoids have received much public attention in recent years, with
many of them being classed as prohibited drugs in the ACT in 2011, as a result of
a decision by Commonwealth authorities. No systematic approach to monitoring
their availability, use and related harms exists in Australia.
Overall, on most indicators the prevalence and incidence of harms related to
psychoactive substances, both legal and illegal, in the ACT is stable or falling.
45
Roxburgh, A, Bruno, R, Larance, B & Burns, L 2011, ‘Prescription of opioid analgesics and
related harms in Australia’, Medical Journal of Australia, vol. 195, no. 5, pp. 280-4. 46
Paulozzi, LJ, Jones, CM, Mack, KA & Rudd, RA 2011, ‘Vital signs: overdoses of prescription
opioid pain relievers-United States, 1999–2008’, MMWR: Morbidity and Mortality Weekly Report, vol.
60.

32
8. Conclusion
The data and information summarised here provide an overview of psychoactive
substances in the ACT in terms of their availability, their use and harms linked to that
use. It could continue be updated and expanded, perhaps biennially or as significant
new data sources become available.
This report is based, almost exclusively, upon published data. A valuable source of
additional information that could be accessed for future revisions and updates is ACT-
level data from the National Drug Strategy Household Survey program conducted by
the Australian Institute of Health and Welfare. Although AIHW has published
national data covering many (but not all) of the variables investigated in the survey, it
has published few tables from the 2010 wave of the survey with state/territory
breakdowns, and has almost no trend data disaggregated this way. AIHW’s earlier
practice of publishing state and territory supplements, providing data from the Survey
specific to the individual jurisdictions, has not occurred with the 2010 Survey. Despite
the fact that the ACT component has a relatively small number of respondents,
meaning that some of the resulting data are unreliable owing to large relative standard
errors, the ACT Health Directorate may consider it worthwhile commissioning a
comprehensive analysis of the ACT data from the 2010 survey, including trend data.
Under the National Drug Strategy 2010-2015 an expert Working Group has been
established to produce a new National Drug Research and Data Strategy.47
Part of its
remit is to review existing information sources and recommend on improvements, as
well as reporting annually on the progress of the NDS against its stated performance
indicators. Opportunities may exist to harmonise the contents of future editions in this
series with the reports of the Working Group.
In any further development of ACT ATOD information systems, particular attention
could be given to monitoring emerging trends through implementing early warning
systems, as the ACT does not have in place a sufficiently timely and comprehensive
early warning system to alert policy people, service agencies, drug users and the
community about emerging trends.
47
Ministerial Council on Drug Strategy 2011, The National Drug Strategy 2010–2015: a
framework for action on alcohol, tobacco and other drugs, Ministerial Council on Drug Strategy,
Canberra.

33
Appendix: demographic summary
Population The ACT’s estimated resident population at 30 June 2011 was 365,421. This is a 1.9%
increase on the previous year, and the longer term trend is that the ACT’s total
population growth rates have been below the national average since 1994. The largest
component of growth is natural increase (rather than net interstate or overseas
migration) and net interstate migration produces the bulk of the volatility in
population growth.
At June 2011, 50.2% of the ACT population was females and 49.8% males.
The estimated resident Indigenous population of the ACT as enumerated in the 2006
national census was 4,282, 1.2% of the ACT population and 0.8% of the national
Indigenous population. The 2001-2006 intercensal change was an increase of 3.4%.
The ACT has a low total fertility rate compared to most of the Australian states and
the NT: 1.8 births per woman compared with the national rate of 1.9 in 2010. The rate
is, of course, well below the replacement rate of 2.1. In 2010 the standardised death
rate was 5.3 deaths per 1,000 population compared with the national rate of 5.7. The
ACT has the lowest death rate of all the states and territories. The ACT population’s
life expectancy at birth in 2010 was 80.5 for males and 84.7 for females, both higher
than the equivalent national life expectancies of 79.5 and 84.0.
The 2010 median age of the ACT population was 34.7 years compared with the
national figure of 36.9 years. Only the NT, among the eight states and territories, has a
lower median age. The largest five-year age group in the ACT is the 25-29 year-olds,
9% of the total. The second-largest age group was 20-24 year olds, followed by 30-34
year olds.

34
The following population pyramid highlights the ageing of the ACT population over
the 20 years to 2005.
Source: Australian Bureau of Statistics, Australian Capital Territory Office 2006, Australian
Capital Territory in focus, Catalogue no. 1307.8, Australian Bureau of Statistics Australian
Capital Territory Office, Canberra, p. 60.
The mid-2011 age distribution is detailed in the following table.
ACT POPULATION, BY AGE GROUP
30 JUN 2011 Age group Number Per cent
0 to 4 years 24,753 6.8
5 years to 9 years 21,588 5.9
10 years to 14 years 21,056 5.8
15 years to 19 years 24,028 6.6
20 years to 24 years 31,424 8.6
25 years to 29 years 32,519 8.9
30 years to 34 years 29,103 8.0
35 years to 39 years 27,155 7.4
40 years to 44 years 25,906 7.1
45 years to 49 years 25,078 6.9
50 years to 54 years 24,008 6.6
55 years to 59 years 21,103 5.8
60 years to 64 years 18,858 5.2
65 years to 69 years 12,945 3.5
70 years to 74 years 9,233 2.5
75 years to 79 years 6,689 1.8
80 years to 84 years 5,069 1.4
85 years and over 4,906 1.3
Persons - total 365,421 100.0
35
Household wealth The ACT’s average weekly full-time ordinary time earnings in the August 2011
quarter were $1,525, 15% higher than the national figure of $1,323.
The mean household net worth in the ACT in 2003-04 was $849,650, 6% higher than
the national figure of $803,319.
Labour market In November 2011, 72% of the ACT population aged 15 years and above participated
in the labour force, that is, they were either employed or unemployed and looking for
work. The ACT has the highest labour force participation level of all the states and
territories, with the national rate being 66%. The November 2011 unemployment rate
in the ACT was 3.9% (lower than the states and the NT). The national unemployment
rate that month was 5.3%.
Educational attainment At May 2004, 30% of ACT residents in the 15-64 years age group had a Bachelor
degree or higher qualification compared with 19% nationally. Some 11% had year 10
or below educational attainments.
Note re sources The sources of information used in this Appendix are:
Australian Bureau of Statistics 2007, Population distribution, Aboriginal and
Torres Strait Islander Australians, 2006, cat. No. 4705.0, ABS, Canberra.
Australian Bureau of Statistics 2011, Australian demographic statistics, June
2011, cat. No. 31010DO002_201106, ABS, Canberra.
Australian Bureau of Statistics 2011, Education and work, Australia, May
2011, cat. no. 6227.0, ABS, Canberra.
Australian Bureau of Statistics 2011, Household Expenditure Survey,
Australia, 2009-10: summary of results, cat. no. 6530.0, ABS, Canberra.
Australian Bureau of Statistics 2011, State and Territory statistical indicators,
2012, cat. no. 1367.0, ABS, Canberra.
Australian Bureau of Statistics, Australian Capital Territory Office 2006,
Australian Capital Territory in focus, cat. no. 1307.8, Australian Bureau of
Statistics Australian Capital Territory Office, Canberra.
Australian Capital Territory, Chief Minister's Department 2010, Canberra
quick stats 2009-2010, ACT Chief Minister's Department Canberra.