the expansion activities of the multinational company, a...
TRANSCRIPT

Reversing the Perspective: Expansion Activities of Multinational Corporations
From Middle-Income Countries
Debaere Peter1
Univ. of Texas, Austin
1 This research would have been impossible without the assistance of Hongshik Lee who was instrumental in obtaining the (unpublished) data for South Korean multinationals from South Korean institutions. I thank Bruce Blonigen, Alan Deardorff, Ufuk Demiroglu, Li Gan, Juan Carlos Hallak, John Ham, Wolfgang Keller, Mary Lovely, Preston McAfee, Devashish Mitra, Gerald Oettinger, Dave Richardson and Vittor Trinidade for helpful suggestions. The usual disclaimers apply. Earlier versions of the paper were presented at Michigan State University, Ohio State University, Syracuse University, Texas A & M University, the University of Texas, Austin, The University of Michigan, and the Midwest International Economics Conference.

Reversing the Perspective: Expansion Activities of Multinational Corporations
From Middle-Income Countries
The organization of production within the multinational corporation (MNC) depends on the relative factor abundance of the home country and the destination country. This proposition is at the heart of the theory of the multinational corporation (MNCs) that Helpman (1984, 1985) and Helpman and Krugman (1985) developed and that is primarily conceived from the perspective of the advanced, developed countries. It rationalizes one-way, North-South MNC activity; MNCs from capital-abundant nations break up domestic production and relocate the labor-intensive parts to low-wage countries. I show how two-way MNC activities are implied by the theory that Helpman and Krugman develop and how these are essential to understand MNCs from middle-income countries: these MNCs relocate labor-intensive activities to more labor-abundant countries, they also move capital-intensive components to more capital-abundant countries. I use unique South Korean firm-level data to investigate this hypothesis. I provide evidence from the affiliates of South Korea’s MNCs that bears out this prediction. I also formally test the implications of the hypothesis for the parents’ capital-intensity with a panel of South Korean MNC parents (1980-1996). Relocating to more capital-abundant countries indeed decreases the parent’s capital-labor ratio, whereas relocating to more labor-abundant countries increase this ratio.
Production is increasingly a global activity. Not just VCRs or computers, but also cars and
clothing contain components from all over the globe. In this ongoing internationalization of
production, multinational corporations (MNCs) have played a critical role. Foreign direct
investment has been steadily increasing and worldwide sales of multinational corporations are
known to dwarf worldwide exports. While most multinationals still originate from advanced,
developed nations, there is a growing number of MNCs from countries that do not belong to this
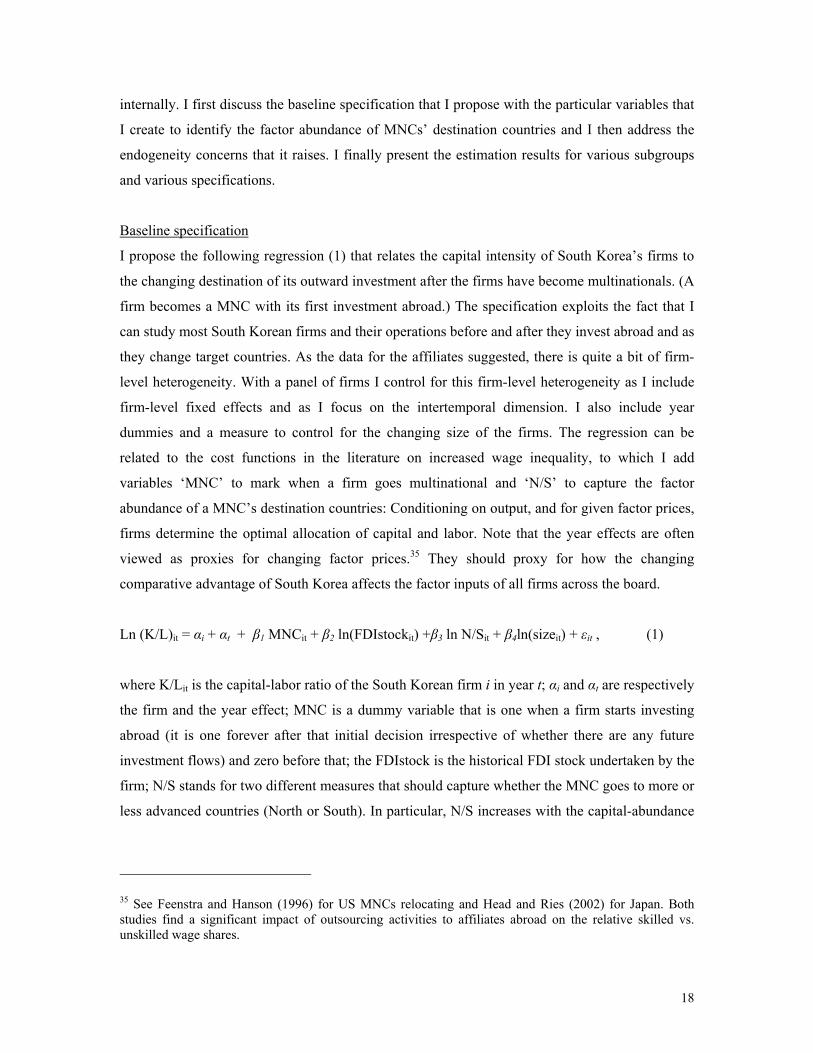
select group. The UN (2000) reports that developed countries accounted for almost 95 percent of
the world’s outward foreign direct investment (FDI) in the early 1980s. In the 1990s, however,
their share shrank to about 85 percent right before the East Asian financial crisis. MNCs from
countries such as the Asian Tiger economies are responsible for a major part of this shift. 1 These
MNCs and what they teach us about the international organization of production within the MNC
are the subject of the present study.
There is a range of international activities that takes place within the framework of the
multinational corporation and these activities can be analyzed from a number of different points
1 See Figure 1.
1

of view. 2 Recent work has tried to distinguish what is produced inside the MNC from what is
produced outside. Specifically, contract theory has been used to analyze the internalization
decision of vertically integrating MNCs. Antras (2003) for example seeks to differentiate foreign
affiliate input production within the boundaries of the MNC from production outside its
boundaries in order to characterize intra-firm and arm’s length trade and to explain why some 35
percent of worldwide trade takes place within the MNC’s boundaries.3 An alternative approach
that is prevalent in a large part of the MNC literature takes the internalization decision as given
and focuses primarily, and in more detail, on the division of labor between parent and affiliate
within the MNC: How it varies with the characteristics of the host country of the affiliates, how it
differs from domestic firms.4 Helpman (1984, 1985) and Helpman and Krugman (1985) are
central to this latter approach. In their view MNCs that relocate activities internationally organize
production both in scope (the set of products) and in depth (stages of production) between the
parent and the affiliate in such a way as to take advantage of international differences in factor
abundance and factor prices. It is this view of MNC activity that I will investigate for MNCs from
middle-income countries.
Interestingly enough, the theory of the multinational corporation as initially developed by
Helpman (1984, 1985) and Helpman and Krugman (1985) is primarily conceived from the
perspective of advanced, developed countries.5 These theories primarily view the MNCs as a 2 As corporations with affiliates abroad, MNCs almost by definition have a vertical component. A MNC’s affiliates abroad need firm-specific (intangible) assets such as headquarter services, R&D, patents etc. to operate and these will be traded within the firm. Since this latter vertical component is part of any MNC, Markusen and Maskus (2001) do not make it the distinguishing characteristic between, what have been called, vertical and horizontal integration models of the MNCs. Essential for the vertical models in their view are differences in factor intensities of the components of the production process and relocating these to take advantage of factor price differences. 3 Note that Antras (2003) investigates the share of intra-firm trade in total US trade, not in total US MNC trade. He finds that more capital-intensive inputs will be produced (and traded) by affiliates inside the MNC (instead of produced outside and traded at arm’s length). 4 Data on intrafirm trade as a fraction of total MNC trade is hard to come by. Back of the envelope calculations suggest that this fraction must be fairly high. Roughly 35 percent of total worldwide trade is intra-firm trade (Antras, 2003). If about half of trade takes place through MNCs, then about 70 percent of MNC trade is intra-firm trade. Moreover, the ratio of intrafirm trade to total trade is not evenly spread. Dobson (1997) and Encarnation (1994) suggest that there is significantly more intra-firm trade in East Asia. (80 percents of Japan’s total (not MNC!) exports and 50 percent of its total (not MNC) imports are intra-firm transactions and the South Korean MNCs that I study are considered modeled after Japan). Obviously, the more intra-firm trade relative to total trade there is for MNCs, the less relevant outsourcing to independent foreign suppliers is, in order to understand the organization of production within the MNC and the more important it is to study what distinguishes affiliate and parents within the MNC. 5 See also Rodriguez-Clare (1996) and the literature on fragmentation or breaking up the value-chain:
2

vehicle to relocate labor-intensive activities to affiliates in low-wage countries. They rationalize
one-way MNC activity in which MNCs from the capital-abundant North set up affiliates in the
labor-abundant South. Similarly, as an empirical matter, outward MNC activities have been
studied primarily for these same developed nations.6 Countries that are not part of this select
group are studied as hosts of foreign (mostly developed-country) affiliates and little is known
about their outward strategies.
In this paper I reverse perspective. I study outward MNC activity from middle-income countries.
Countries such as South Korea and Taiwan whose per capita GDP is in the range of Greece are
interesting because they do not fit the North-South scheme. They are caught in the middle, in
between countries that are clearly more advanced and others that are less developed. 7 The MNCs
from these countries have affiliates in both more and less advanced countries. On the one hand,
the liberalizations in China, Malaysia, Thailand or Vietnam account for the boom of affiliates
from MNCs with parents in these middle-income countries. (China now rivals the US as the main
recipient of the world’s FDI.) In recent policy debates in East Asia this MNC activity has been
associated with “hollowing out” and MNCs in search of cheap labor. Far less attention has gone,
however, to the affiliates from middle-income countries in more advanced countries; respectively
20 and 50 percent of Taiwan and Korea’s FDI is destined for the US, Japan or Europe. The MNC
activities associated with these flows are of particular interest to understand the internal workings
of the MNC. They raise the interesting question whether relocating production to foreign
affiliates is about more than just moving labor-intensive activities. In particular, one wonders
whether the MNCs from middle-income countries can also tap into the resources of more
advanced countries by relocating more capital-and technology-intensive parts of production over
there. Against the background of the exceptional growth performance of the Tiger economies,
Deardorff (1998), Jones and Kierkowski (1997), Arndt (1997) and Feenstra and Hanson (1996). 6 In part, this is a consequence of the available data: Firm-level information on inputs and outputs of MNC’s parents and affiliates that are increasingly used since Brainard (1997) is mostly available for only a few developed nations. See Lipsey (2001) for available data. Lipsey reports that sales data is available for only the US, Germany, Japan, Switzerland, Canada and the UK. Hanson et al. (2002, 2003) and Yeaple (2002) are recent examples of empirical investigations of US outward MNCs activities. Head and Ries (2002) study Japan’s outward FDI. Aitken and Harrison (1999), Feenstra and Hanson (1997) and Haddad and Harrison (1993) study Venezuela, Mexico and Morocco as recipients of FDI. 7 For my argument the specific definition of 'middle-income country' is not essential -- It varies by international organization. What matters is that countries are in terms of capital/labor ratios (per capita GDP) not at the very top and not at the very bottom of the world distribution. Countries such as Taiwan or Korea fit the profile.
3

this relocation to the North opens the possibility that outward MNC activity (FDI) was an
independent factor in their economic development.
There is no all-encompassing theory of the multinational corporation. There are a variety of
models that focus on different aspects of multinational activity that all have some empirical
relevance. As mentioned, the theories by Helpman and Krugman (1985) have MNCs take
advantage of factor prices and have them break up production accordingly. Brainard (1993, 1997)
and Markusen (1984), on the other hand, argue that breaking up production to take advantage of
factor cost differences need not be an essential motivation for MNCs. Access to rich markets is
key and to save transportation costs, MNCs may set up shop in other developed countries instead
of having to supply these markets through exports, even without factor price differences.8 Finally,
there is the view that MNCs emerge in an effort to jump tariffs or other existing costs associated
with trading goods.9 In this paper I want to investigate how differences in the factor abundance of
the host countries of the affiliates affect the organization of production within the multinational
firm from middle-income countries, even when part of the motivation for the emergence of
MNCs is tariff jumping or market access.
I take the standard factor proportions theory à la Helpman and Krugman (1985) to make the basic
point that MNCs will not only relocate labor-intensive activities to labor-abundant countries;
MNCs will also arise in more labor-abundant countries and they will relocate capital-intensive
activities to the more capital-abundant countries. This is important in light of the existing
literature that has defined MNC activity and in particular vertical integration primarily as
relocating labor-intensive activities to labor-abundant countries, a one-way street from North to
South.10 One-way MNC activity, I argue, follows from arbitrarily restricting the equilibrium
outcomes in Helpman and Krugman. In addition, two-way MNC activities are needed to describe
the MNCs from middle-income countries. This extension generates a prediction that can be tested
8 A fair number of variants of Markusen’s basic model exist, some allowing for differences in factor prices. These models typically have to be simulated and do not include vertical integration (beyond the transfer of firm-specific assets). 9 For reference on the literature of tariff jumping, see Blonigen, Tomlin and Wilson (2002). 10 Note that the literature has questioned the empirical relevance of vertical integration models exactly because of its one-way prediction that is in obvious contradiction with the (two-way) MNC activity between developed countries. To the extent that one thinks that factor price differences are also relevant among OECD countries, see Davis and Weinstein (2001), the present extension can also account for two-way MNC activity among OECD countries.
4

with the relatively detailed firm-level data of South Korean MNC parents that I have: As MNC
parents relocate labor-intensive activities of production to more labor-abundant countries they
become more capital intensive and as they move capital-intensive activities to Northern affiliates,
their capital-intensity is likely to decline.
It is understood that this basic prediction derived from the H&K model should prevail in
alternative, more complex settings. For example, in line with Helpman (1985) one could allow for
multi-product firms who will also vary the scope of (final goods) production by country of
destination. Their intra-firm trade between the affiliate and the parent will differ in its
composition (between intermediate and (different) final goods) from the pure vertical integration
case, yet the general proposition about reallocating more labor-intensive ‘activities’ to more
labor-abundant countries, and more capital-intensive ‘activities’ to capital-abundant countries will
remain true. The same holds in the presence of tariffs. Even if tariff jumping is part of the
motivation for why a MNC arise, the hypothesis is that a MNC will in the presence of factor price
differences organize its production between parent and affiliate in such a way that it can take
advantage of these differences. Also market access should not alter the basic premise.
Multinationals may seek access richer markets, yet whenever there is some vertical component to
production or whenever they can vary the scope of final goods production, they will relocate the
more labor-intensive parts to labor-abundant and the more capital-intensive parts to capital-
abundant countries.
To investigate this basic prediction, I rely on unique, unpublished firm-level data of South Korean
firms and multinationals.11 In a first step, I provide some descriptive statistics on the parents and
affiliates of South Korea’s MNCs. Even though these data are too restrictive to formally test any
proposition, they do show significant intra-firm trade flows between parent and affiliate in both
directions and the differences in capital-intensity between parent and affiliate are not
insignificant. This data suggests that as South Korea’s MNCs relocate labor-intensive activities to
China, they also relocate capital-intensive activities to more capital-abundant countries such as
Japan. In a second step, I go beyond these descriptive statistics and exploit the detailed
information on the operational activities of South Korean firms and MNC parents. With a panel
of South Korean MNC parents (1980-1996) I investigate whether, controlling for firm-level
11 Contrary to the extensive (and growing) empirical literature that studies the trade performance of firms with firm-level data, see Bernard and Jensen (1999) and Roberts and Tybout (1997), FDI has been studied far less frequently at the firm level.
5
heterogeneity, changes in the destination of a firm’s affiliates are associated with changes in the
factor intensity of South Korean MNC parents in the way that the hypothesis dictates.12
Note that the South Korean data is particularly well fit for this exercise. First, the parent MNC’s
characteristics can be directly linked with the destination of the outward investment flows at the
firm-level. (Legal constraints prohibit such direct connection for US data at the firm level.) It
turns out the average per capita GDP of the destination country of South Korea’s median
multinational is 2.5 times that of South Korea. In other words, the data includes a significant
number of firms with affiliates in more advanced nations. This is essential to investigate the
hypothesis of relocating more capital-intensive activities to more capital-abundant countries.
Second, the story of South Korea’s outward MNC activity is probably as close as one gets to a
natural experiment. On the one hand, there is the gradual liberalization of outward investment in
South Korea since 1980. On the other hand, there are the liberalizations in Asia since the mid
1980s that have shifted the destination of South Korea’s MNCs.
My results indicate that the capital-intensity of South Korea’s MNC parent decreases as
multinational target more capital-abundant countries; it increases as they direct their activities
towards less capital-abundant countries. This finding is consistent with relocating capital-
intensive parts to capital-abundant countries and labor-intensive parts to labor-abundant countries
in a world in which also tariff jumping or market access may give rise to MNC activity.13 The
result is confirmed across different specifications and different sub samples. I include estimates
for firms that shift the destination of their affiliates from North to South as well as those that
move from South to North; I present results with and without firms that never were involved in
multinational activities as control group. The data suggests that the factor endowments of the
destination country should affect the specific division of labor between the parent and the affiliate
within the MNC.
The paper is organized as follows. I first introduce two-way MNC activity in the factor
proportions theory of the MNC and specifically address the position of a middle-income country.
In section 2 I present some evidence on the operational activities of the affiliates of South Korean 12Cf. Feenstra and Hanson (1999) and Feenstra et al. (2002) for the US and Head and Ries (2002) for Japan. 13 This finding reinforces the observation by Head and Ries (2002) for Japan (in terms of skilled and unskilled labor), that FDI to low-income countries raises the skill-intensity of a multinational, yet this skill-intensity upgrading diminishes as FDI flows to higher income countries.
6
MNCs that corroborates the hypothesis. In section 3 I investigate the parents of the South Korean
MNCs with a panel data set and test whether indeed the factor abundance of the destination
country is a significant factor in the internal organization of MNCs’ production.
1. Middle-income MNCs and two-way MNC activity
The theories of Helpman (1984, 1985) and Helpman and Krugman (1985) were the first to have
MNCs organize their internal production in light of international factor price differences. They
emphasize one-way, North-South outward MNC activities and explain why MNCs from the
capital-abundant North open affiliates in the labor-abundant South. These theories view MNCs
primarily as a vehicle of vertical integration to move the labor-intensive production to low-wage
countries. Moreover, they make intra-firm trade flows esp. for the parent essential for production.
In Helpman and Krugman’s (1985) (H&K) basic setting I show how MNCs from the South can
easily relocate capital-intensive activities to more capital-abundant countries, giving way to, if
you will, two-way MNC activity.14 In spite of the prominence of the one-way prediction of
vertical integration, I argue that two-way MNC activity is not just a possibility in H&K’s setup;
there is a whole class of equilibria that involve MNCs from the South opening affiliates for
capital-intensive activities in the North. I use this possibility of two-way MNC activity to
specifically describe MNCs from middle-income countries and apply the graphical analysis that
H&K do so well.
2.1. Two-way-MNC activity
Take a capital-abundant country, North, and a labor-abundant country, South. There is free,
frictionless trade. Technology is the same everywhere for the two sectors agriculture and
manufacturing. Agriculture is constant returns and supplies homogeneous goods. Consumers
spend a fixed income fraction on agriculture and manufacturing. Manufacturing goods are
differentiated and produced with increasing returns under monopolistic competition and free
entry. Consumers have a CES sub-utility function for manufacturing varieties.
14 See Chapter 13 in Helpman and Krugman (1985). In Helpman (1984) only the production of (intangible) headquarter services takes place in the parent. The actual production of manufacturing goods by MNCs is transferred entirely to Southern affiliates and all intra-firm trade is in these services -- unless one classifies imports of final goods assembled in the affiliates as such. Helpman (1985) makes the theory more realistic by involving the parent also directly in producing (physical) goods and introducing an intermediate good.
7

Fig. 2 depicts the endowment box for North and South. The dark parallelogram reflects
worldwide capital and labor use in manufacturing (03) and agriculture (30’) for the integrated
world economy (IWE), i.e. when factors are internationally mobile. If country endowments lie
inside this parallelogram, factors prices are equalized and countries with internationally immobile
production factors replicate the IWE equilibrium as they exchange factors through their trade.
With equal factor prices (FPE) there is no incentive for MNCs to emerge. However, if
endowments are so different that the endowment vector OE lies outside the parallelogram, trade
can no longer equalize returns. Vertically integrated MNCs emerge in this case and they split
production between parent and affiliates to take advantage of different factor prices.
This ability to relocate production lines abroad follows directly from the setup. Manufacturing
consists of a labor-(23) and a capital-intensive (12) component plus headquarter services (HQ)
(01) that is most capital-intensive of all. HQs are a fixed cost that all firms incur and they
represent management skills and R&D that are tied to the parent. They enable firms to serve
multiple plants elsewhere and they circulate within a firm to make labor-and capital-intensive
components compatible.15 Like the labor-and capital-intensive components, HQ services are
differentiated by firm variety. 16 Now, as MNCs break up production they relocate the labor- and
capital-intensive component.17 In doing so, they enlarge the FPE set to 0123. This gets at the
essence of H&K’s model: MNCs take advantage of international factor price differences and split
production between parent and affiliate. In doing so, MNCs bring factor prices between countries
closer together. H&K choose the analytical convenience of complete FPE to represent the
equilibrium for this limiting case.18
15 IRS for components rationalizes vertical integration to avoid duopolies between suppliers and parents. 16 For factor prices w and r the production cost C of x manufacturing goods consists of plant-specific costs for the labor-and capital-intensive component and a firm-specific cost for HQ services. In H&K the capital intensive component is an intermediate good and the labor-intensive component is just assembly, C(w,r,x) = CPZ(w,r,h,z) + CPA (w,r,h,z,x) + CH(w,r,h)(x and z are final and intermediate goods, h, HQ services, an input in all parts, P stands for plant, A for assembly and Z for intermediates.) CPZ and CPAconsist of a fixed cost F (r,w) and a variable cost V (r,w,h,x or r,w,h,x,z). An alternative to H&K (without any hierarchy between both components) would be to consider both components intermediates and to make assembly costless, and let goods be assembled where consumed. 17 In H&K the first component is assembly and the capital-intensive component an intermediate good. 18 Debaere and Demiroglu (2003) show that world endowments are too different for worldwide FPE.
8

I propose an international allocation of production that differs from H&K and that allows MNCs
from South to relocate capital-intensive activities to North. With full employment, firms’
employment in HQ and capital-or labor-intensive components adds up to North’s endowment.
OabE is such a combination in Fig. 2. The factors of the capital-abundant country (0E) are
employed in HQ (0a) and in capital-intensive components (abE). Northern MNCs do not produce
labor-intensive components. Therefore, they rely on Southern affiliates toward which they
relocate labor-intensive activities. So far, this is a regular North-South story. However, as will
become clear, we also need Southern MNCs to relocate capital-intensive activities to North in
order to employ all factors of endowment OE at the same factor prices.
As in H&K, producing a good requires comparable amounts of capital- and labor-intensive inputs
from one firm, i.e.: For any amount of manufacturing produced by firms of a country, the HQ
services together with the labor- and capital-intensive components should form a trapezoid
isomorphic to the large trapezoid 0123. Hence, to complement their domestic production of
capital-intensive components and HQ services, North’s MNCs relocate labor-intensive
components to Southern affiliates. As drawn, North, however, produces too many capital-
intensive components (Only a fraction (ab) of these (aE) is needed to complement its HQ services
0a). Therefore, part of its capital-intensive components (bE) is matched with South’s HQ services
and labor-intensive components. This amounts to Southern MNCs relocating capital-intensive
components to affiliates in North. In sum, South’s MNCs shift their capital-intensive activities to
Northern affiliates, at the same time that there is the “usual” MNC movement from labor-
intensive activities from North to South, a clear case of two-way MNCs. Fig. 3 shows how
production is distributed between North’s MNCs (that relocate labor-intensive components),
South’s MNCs (that relocate capital-intensive components) and non-MNC firms for our example
– respectively the left, middle and right trapezoid.19
It is easy to show that two-way MNC activity with Southern MNCs that relocate part of their
capital-intensive activities to North is possible for all endowments in area 023. Moreover, two-
way MNC activity is not just a possibility. For each endowment point, there is a whole class of
equilibria with two-way activity. Since MNCs establish FPE one should not be surprised about
this – It is a well-established result that the production pattern in two countries is indeterminate
with FPE when there are more goods than factors. However, H&K’s MNC concept (MNCs
relocate stages of production and take advantage of factor prices differences) and their view of
9

vertical integration (moving production lines abroad while keeping HQ at the parent) restrict the
set of possible allocations that are consistent with FPE. As North MNC’s take advantage of
cheap labor, H&K state -and I follow them- that North’s resources are last poured into the labor-
intensive component. 20 There is, however, a second way in which the FPE allocations are
constrained and it is here that the difference between H&K’s and my allocation arises.
I let Northern MNCs produce at least as many capital-intensive components as HQ services.
H&K, on the other hand, let them produce more HQ services than capital-or labor-intensive
components. H&K propose allocation 0a’b’E for endowment E in Fig. 2. As b’ lies on 02,
Northern MNCs produce enough capital-intensive components to complement HQ services 0a’.
Since North’s MNCs only produce b’E labor-intensive components, they relocate the production
Ec’ of labor-intensive components to South’s affiliates. This is standard, one-way relocation of
labor-intensive activities from North to South within the MNCs. Only Northern MNCs open
affiliates in South. Now compare this allocation with my OabE: With no production of labor-
intensive components, capital-intensive components production in North is the largest possible
(and larger than HQ services). OabE marks the maximum MNCs from South that are active in
North, while there is still MNC activity from North to South. H&K’s solution Oa’b’E, on the
other hand, marks the other extreme: no MNCs from South at all.
Comparing the two solutions, one realizes there are for a given endowment many other (less
extreme) equilibria whose headquarter vector ends between a and a’ and whose capital-intensive
vector between b’ and E. All these equilibria have MNCs from South with capital-intensive
affiliates in North. In fact, moving from a’ to a and from b’ to b, the number of southern MNCs
increases. Interestingly enough, H&K choose the only equilibrium that has no southern MNCs.
H&K do not allow firms from South to take advantage of factor price differences. It is hard to see
why this would happen since North’s firms can. H&K’s allocation could be justified if there were
no manufacturing firms in South before MNC emerged (i.e., complete specialization.) However,
their endowment choice tells us this is not the case.21 It is not entirely clear how H&K motivate
19 Appendix 1A discusses in detail how to obtain these trapezoids. 20 Allocations such as Od' and d'E in Fig. 2 are consistent with a FPE, but (rightly) not considered by H&K. Such allocations would imply that capital-abundant countries relocate capital-intensive components to labor-abundant countries. 21 Before MNCs emerge, North produces in manufacturing and South is active in both sectors. See graph in appendix: The endowments lie in region I.
10

their restriction. Probably their assertion that it is easier (less costly) to move labor- vs. capital-
intensive components abroad does the job. Needless to say, one can easily assume the opposite
(getting us to the other extreme equilibrium) if one wanted to limit the multiplicity of equilibria.22
Ultimately, what combination prevails is an empirical matter.
One may wonder why H&K choose to restrict the equilibria in this way. One reason is analytical
convenience. One can easily draw their solution – However, this is true also for other allocations
such as 0aE. Another possibility is the link between MNC activity and firm-specific assets. Since
most of the world’s R&D takes place in developed countries, it seems natural that these countries
are the primary source for MNCs. Also the history of how MNCs have been analyzed is
informative. There is an older literature that associates MNC activity with capital flows, for
which returns on investment are critical. In this literature capital flows from North to South where
the return to capital is higher. Even though from a micro perspective MNC activity is more about
control than about capital flows (see Markusen and Maskus, 2001), H&K’s allocation is
consistent with that older literature. Finally, and this brings us back to the starting point of the
paper, there is the data availability and there are the empirical analyses that have mostly taken the
vantage point of rich, developed countries. With the increased importance of middle-income
countries, the increased presence from non-OECD multinationals in OECD countries, it is
perhaps time to face the richer implications of the factor proportions theory of the MNC.
2. Middle-income Countries
Having allowed for MNCs from the South to set up capital-intensive affiliates in the North, it is a
small step to now describe MNCs in middle-income countries. In Fig. 4. I extend the setup to
three countries. The country previously named South is now Middle and I introduce a very labor-
abundant country South with endowment E2O’. Taking advantage of factor price differences,
South is engaged in very labor-intensive activities. For expositional simplicity, take the example
where South only produces agriculture (Oi) and labor-intensive components (iE2) that foreign
MNCs want to produce there.23 In this case, O’iE2 is its employment vector. Since North does not
22 Alternatively, one could argue that developed country markets are more open to foreign affiliates than developing countries. In other words, with an infinitesimally small cost for developed country MNCs to move abroad, we would here also move towards the equilibrium with a maximum number of MNCs from the South. 23 I could allow for some HQ services in Middle since there may have been manufacturing firms before MNCs emerged – This does not affect the basic message for Middle.
11

produce any labor-intensive components, Middle produces whatever labor-intensive products
South cannot produce.
It is easy to see what MNC patterns can emerge in Middle. Since Middle cannot satisfy the entire
world demand for labor-intensive components (23), some of its domestic firms can become
MNCs and relocate the production of labor-intensive components. The same can happen to its
MNCs that go north. Some of them may keep labor-intensive components in Middle, whereas
others can go north and south, leaving only HQ services in Middle. Since I have a firm-level data
set that provides most detail on the operational activities of the parents of South Korean MNCs, I
am particularly interested in what these patterns of MNC activity imply for factor intensities of
the parents since this is an implication that I can study empirically with a panel of MNC parents.
Middle’s MNCs that go south become more capital-intensive, since they no longer produce the
labor-intensive component.24 As for the firms that go north: the higher the capital-intensity of the
capital-intensive component (i.e. if higher than the overall firm capital intensity) the more likely
the parent’s capital intensity in Middle will be lower than that of the MNCs that go South.
The basic point of the above analysis is that despite the prominent role of the prediction that
MNCs relocate labor-intensive activities to more labor-abundant countries, MNC activity can
easily be shown to go in the other direction in H&K’s model that arguable conveys best the idea
stripped down to its bare essentials that MNCs organize their in-house production according to
factor prices. MNCs will also relocate capital-intensive production to more capital-abundant
countries. MNCs from middle-income countries will organize their operations between the
affiliate and the parent in such a way as to take into account the differences in factor abundance
between Northern or Southern host countries and themselves. As MNCs relocate capital-intensive
parts to capital-abundant countries the parents become more labor intensive, as MNCs move
labor-intensive parts to labor-abundant countries the parents become more capital intensive. It
needs no arguing that the setup of H&K is very stylized and could be extended or modified in
various ways.25 For example, one could, following Helpman (1985) explicitly consider multi-
product firms. It can be shown that this would not alter the basic premise that MNCs from
middle-income countries can relocate ‘activities’ North and South, even though the specific
24 The most capital-intensive firms go both North and South (and only have HQ services in Middle). 25 I want to show how one can generate two-way MNC activity even when one stays as close as possible to the canonical setup.
12

content of ‘activities’ (intermediate vs. final goods production) may change. The same is true for
other motivations for MNC activity such as tariff jumping or market access. The hypothesis under
investigation is that even if a firm’s decision to move abroad is also determined by such
motivation, the MNC will seek to organize its production between the parent and affiliate to take
advantage of international factor price differences. With data on parent firm operations I formally
test the proposition that relocating to the North vs. the South will decrease vs. increase the capital
intensity of the parent. Before testing this hypothesis, I first provide some supportive evidence
from South Korea’s affiliates abroad.
2. The affiliates
Only since 1968 have South Korean firms been investing abroad and only since the early 1980s
has the South Korean government gradually allowed its manufacturing firms to open affiliates
abroad, see Kim and Kang (1997). Moreover, in the wake of the liberalizations in China and other
East Asian countries, the composition of the countries that MNCs target has changed
dramatically. Initially South Korean MNCs went mainly to rich, developed countries. In recent
years, however, China has rivaled the US as the main destination of worldwide FDI. About half
of South Korea’s outward investment flows stay in the region and about half go to the US, the
UK or Europe. Finally note that more than 50 percent of outward activity (measured by
investment flows) takes place in manufacturing. Moreover, like in Taiwan, for more than a
decade now, electronics has been the most important manufacturing sector with a steady increase
-- accounting for about one third of total outward FDI in manufacturing.26
From unpublished sources of the Export-Import Bank of Korea for 1999, we can get a snapshot of
the interactions between South Korean parents and their affiliates in manufacturing. Table I
reports sales and exports from affiliates for the bigger companies with outstanding investment of
over 10 million dollars. I have chosen firms in electronics, since electronics is the only sector for
which sufficient data for these big firms is available across many different destination countries.
Of particular interest are the columns 4-6 that shed a light on the intra-firm trade between parent
and affiliate. The columns 5 and 6 report the intra-firm affiliate and parent exports as a percent of,
respectively, affiliate and parent sales. I also include the exports of the affiliates to Korea as a
percent of the affiliate total sales in column 4.27 Even though the data for the affiliates are too
26For more details, see Lee H. (2002). From UN (1992) for 1988, we know that South Korean parents own over 50 percent of the affiliates for 81 percent of affiliates or 75 percent of the FDI stock. There is 100 percent South Korean ownership for 65 percent of the affiliates and 55 percent of the FDI stock.
13
limited for a formal test (I use parent-level data in section 3 for a test) and even though there is
considerable heterogeneity, the data do suggest that South Korean outward MNC activities do not
entirely fit the North-North, North-South pattern. There is a steady stream of exports to the
affiliate and from the affiliate back to the parent. This is not only the case for low-wage countries
such as China or the Philippines, but also for high-wage countries. About 60 percent of Japanese
or French sales are exported back to Korea. One may wonder what these flows represent. A
recent OECD study for electronics in South Korea is suggestive. Lee B. (2002) classifies the
affiliates of a sample of South Korean firms in electronics according to their main (not only)
activity. Lee shows that about 55 percent of affiliates have production as their main activity. This
fraction is slightly lower in developed countries, about 40 percent. In other words, affiliates are
only just sales points.28 Lee also reports that about half of South Korean affiliates in electronics
produce intermediates and half finished products, this suggests that while there maybe some
relocation of the production of (different) finished goods between affiliate and parent (what the
multiproduct firm of Helpman (1985) suggests), these flows will also contain intermediate goods.
While this evidence does not preclude that market-access or tariff-jumping matter for MNC
activity, it is clearly inconsistent with the most stripped-down version of horizontal models of
MNC activity in which a foreign affiliate just replicates the final good of the parent and affiliate
production is just a (cheaper) substitute for exports. This data suggests that having affiliates
abroad is not just about producing the same goods from scratch at a different location. Parents
either produce finished or intermediate goods abroad and affiliates import inputs and/or
(different) finished goods from the parent.
In the last two columns of Table I the capital-labor ratios of the affiliates and parents are
compared. (The Export-Import Bank data are merged with the KIS data that contain information
of the parent firms.)29 The parents tend to be less capital-intensive than their affiliates in more
capital-abundant countries and more capital-intensive than their affiliates in more labor-abundant
countries. This observation suggests in my view that the factor endowments of the destination
country will affect how production is distributed between affiliate and parent. There may be
motives such as market access or tariff jumping involved, but what is produced in the affiliate, be 27 These can also include (next to the direct exports to the parent) exports to South Korean firms that are associated with the parent. 28 I focus on production related affiliates in manufacturing, not wholesale.
14

it an intermediate or a different set of final goods, is not independent of the factor endowments of
the destination country. This points to the basic prediction that MNCs will relocate more capital-
intensive activities to more capital-abundant countries and more labor-intensive activities to more
labor-abundant countries.30
Especially interesting are two South Korean MNCs in electronics and communications that have
affiliates both in Japan and in China (and FDI over 10 million dollars). The first firm’s parent has
a capital-labor ratio of 194 thousand dollar per worker. The factor intensity of its four Chinese
subsidiaries is one third of this or less, and its Japanese counterpart is with 527 almost three times
as high. For the second multinational, the numbers are 126 thousand dollars per worker for the
parent, about one tenth of this for the Chinese subsidiary, 13, and about two and a half times the
South Korean capital intensity for the Japanese plant, 191. Also these numbers seem to suggest
that vertical integration is about more than merely relocating labor-intensive activities.
Note that with only a cross section of affiliates available, I have to rely on the historical capital
stock. The pattern of the data is very pronounced (a higher K/L in Japan, a lower in China), and
unlikely to be overturned by more accurate measures. Note that one could argue that the affiliate
and the parent produce the same set of goods and that the difference in their K/L is due to
differences in factor prices. While differences in factor prices surely affect the capital-intensity of
the affiliate (Exactly because of these differences, MNCs should organize production differently
for different destination countries.), this claim is inconsistent with significant intra-firm flows and
Lee (2002)’s observations that I mentioned before. More rigorous testing is needed, however, and
we refer the reader to the next section where we investigate the implications for parent production
of relocating either to more or to less advanced countries.
3. Factor intensities of the Parents
The evidence of South Korean affiliates abroad suggests that middle-income countries relocate
capital-intensive intermediates/finished goods to capital-abundant, and labor-intensive activities
to labor-abundant countries. However, the presented evidence is only for a limited set of fairly
heterogeneous firms and by no means conclusive. In this section I investigate more rigorously to
what extent the direction of outward activities is associated with a change in factor intensities of 29 For a detailed discussion of these parent-level data, see section 3.1. 30 In the knowledge capital model by Carr et al (2001) a fixed set of knowledge based assets and activities are associated with the parent MNC and independent of the destination country of the affiliates.
15
the parent MNC: Is it the case that relocating to capital-abundant countries is associated with a
lower capital intensity of the parent and relocating labor-intensive with a higher capital intensity?
3.1. Data
The South Korean firm-level data are found in the KIS Financial Analysis System 2000 and KIS
Stock Market Analysis Tool 2000 database of the Korea Investors Services Co., Ltd, which
contains the balance sheets and the profit and loss statements of all South Korean firms that are
listed on the Korea Stock Exchange.31 The selected period runs from 1980, the beginning of the
dataset, to 1996, right before the financial crisis. (To avoid complications related to the financial
crisis, the last three years of the dataset are not included in the analysis.) The dataset includes 235
firms in 1980 and 601 firms in the last year.32 In other words, this is an unbalanced dataset: New
firms enter as time goes by, yet no firms leave.33 In total there are some 8893 observations
available. During the period that is covered in the data there is a liberalization of outward FDI
taking place in South Korea, so firms are increasingly allowed to invest abroad. Initially, there are
only 22 MNCs; by 1986 there are about 100; in 1990 one counts about 180 MNCs and by 1996
some 300 firms that have affiliates abroad. In 1987 came a significant liberalization in the wake
of increasing current account surpluses: Foreign exchange constraints on foreign direct
investment were removed in most sectors. Since 1996 any remaining restrictions in particular
sectors have been removed.34 Even though South Korea's outward FDI is with slightly less than
one percent of GDP still fairly moderate compared to the 6 percent for Taiwan, in absolute
amounts it is virtually the same for both countries, see UN (2000). Note that the manufacturing
firms that are listed on the Korean Stock Exchange account for 73 percent of total manufacturing
in 1990, so that the firms that are studied are increasingly representative for South Korean
manufacturing. Overall, the firms that are listed tend to be larger firms, which is in part due to the
criteria that have to be fulfilled before a firm can be listed.
The dataset provides information on a firm’s outputs and inputs. All variables except for FDI
flows are in 1000 Korean Won. For this particular exercise I am especially interested in the
31 For a more detailed discussion of the data, see H. Lee (2003) 32 I have dropped observations with missing data or inconsistent reporting. 33 Before the financial crisis it was very hard for esp. larger firms to go bankrupt, hence no exits. 34For a more detailed discussion, see Kim and Kang (1997)
16

capital-labor ratio of a firm. The data set contains the book value of the capital stock (an
imperfect measure for capital), the yearly employment numbers and total gross output. The firms
are classified by 2-digit Korean Standard Industrial Classification code, containing 13 different
industries. The criteria for assigning a firm to an industry is whether 60 percent or more of a
firm’s output takes place in that sector. This criterion causes some 2000 (firm-year) observations
to be placed in “other manufacturing/non-classified sector”. Table 2 provides some summary
statistics for the all firms, the MNCs (that invested at least once abroad) and the firms that never
invested abroad for the last year of the sample. It is clear that MNCs are on average bigger in
terms of output and in terms of employment. They tend to be more capital-intensive than the
other firms. The output values are deflated with the industry-specific domestic producer price
indices from the Bank of Korea’s Price Statistics Summary. The capital stock is deflated with the
price deflator for the three asset categories buildings, structures, machinery and equipment and
vehicles from The Bank of Korea’s Economic Statistics Yearbook.
The KIS database is then merged with data from the (unpublished) firm-level Export-Import Bank
of Korea data that provides the foreign direct investment flows at the firm level for the same
period. South Korean firms listed on the stock exchange invest in some 87 host countries; see
Table 1A in the appendix for a complete list. During the period covered by the data there is a
fairly dramatic change in the destination countries that MNCs target. Since the late 1980s and
especially since the end of the Cold war and the establishment of diplomatic relations between
South Korea and China in 1992, South Korean MNCs increasingly went to China. In order to
differentiate MNC’s foreign activity abroad I will weight the FDI flows by the real per capita
GDP of the destination countries relative to South Korea, see below. The data that are used for
this are taken from the World Bank (in constant 1995 dollars).
3.2 Specification and results
To study whether indeed South Korean multinational firms relocate capital-intensive activities
(be it the production of intermediate goods or of a subset of finished goods) to capital-abundant
countries and labor-intensive parts to labor-abundant countries, I investigate whether the
particular destination of a MNC’s outward investment, North vs. South, matters for the factor use
of the MNC parent. The prediction is that relocating labor-intensive activities to Southern
countries should increase the capital-intensity of the parent, whereas relocating capital-intensive
components will (most likely) do the opposite. The alternative hypothesis is that the factor
abundance of the destination country does not matter for how the MNC organizes its activities
17
internally. I first discuss the baseline specification that I propose with the particular variables that
I create to identify the factor abundance of MNCs’ destination countries and I then address the
endogeneity concerns that it raises. I finally present the estimation results for various subgroups
and various specifications.
Baseline specification
I propose the following regression (1) that relates the capital intensity of South Korea’s firms to
the changing destination of its outward investment after the firms have become multinationals. (A
firm becomes a MNC with its first investment abroad.) The specification exploits the fact that I
can study most South Korean firms and their operations before and after they invest abroad and as
they change target countries. As the data for the affiliates suggested, there is quite a bit of firm-
level heterogeneity. With a panel of firms I control for this firm-level heterogeneity as I include
firm-level fixed effects and as I focus on the intertemporal dimension. I also include year
dummies and a measure to control for the changing size of the firms. The regression can be
related to the cost functions in the literature on increased wage inequality, to which I add
variables ‘MNC’ to mark when a firm goes multinational and ‘N/S’ to capture the factor
abundance of a MNC’s destination countries: Conditioning on output, and for given factor prices,
firms determine the optimal allocation of capital and labor. Note that the year effects are often
viewed as proxies for changing factor prices.35 They should proxy for how the changing
comparative advantage of South Korea affects the factor inputs of all firms across the board.
Ln (K/L)it = αi + αt + β1 MNCit + β2 ln(FDIstockit) +β3 ln N/Sit + β4ln(sizeit) + εit , (1)
where K/Lit is the capital-labor ratio of the South Korean firm i in year t; αi and αt are respectively
the firm and the year effect; MNC is a dummy variable that is one when a firm starts investing
abroad (it is one forever after that initial decision irrespective of whether there are any future
investment flows) and zero before that; the FDIstock is the historical FDI stock undertaken by the
firm; N/S stands for two different measures that should capture whether the MNC goes to more or
less advanced countries (North or South). In particular, N/S increases with the capital-abundance
35 See Feenstra and Hanson (1996) for US MNCs relocating and Head and Ries (2002) for Japan. Both studies find a significant impact of outsourcing activities to affiliates abroad on the relative skilled vs. unskilled wage shares.
18
of the destination country relative to South-Korea and I discuss these measures shortly. To
control for firm size, I include a firm’s gross output as well.
The hypothesis under investigation states that the more (less) capital-abundant the destination
country is, the less (more) capital-intensive the parent should get. In other words, the β3-
coefficient should be negative, i.e. β3<0. Note that I include a MNC dummy in addition to the
historical FDI stock that should capture the extent of a firm’s foreign activities. This is informed
by the theory of MNCs that assumes there is a fixed cost associated with setting up a foreign
affiliate and with investing abroad. It is expected that the coefficient on the MNC dummy is
positive, i.e. β1 >0.
To identify the factor abundance of the host countries of South Korea’s affiliates, one faces the
challenge that firms may invest in multiple countries. I propose two different measures to indicate
whether or not a firm invests predominantly in the South or predominantly in the North. A first
option is to weigh a firm’s FDI flows with the per capita GDP of the destination country. In
expression (2) below I multiply the share of firm i’s FDI flows in its total historical FDI stock up
to year t by the destination country j’s per capita GDP relative to that of South Korea (sk) (I
suppress i on the right-hand of the expression).36 This indicator of the average per capita income
of the destination country of a firm’s investments should capture the capital abundance of firms’
average destination country relative to South Korea. If the measure is larger than one, we know
that the mass of a firm’s investment goes north, if the measure is smaller than one, on the other
hand, most of it goes south. In my dataset this N/S1 measure is 2.5 times South Korea’s real per
capita income for the median South Korean multinational. This number indicates that there is a
fair amount of activity moving ‘up’, i.e. to higher income countries. In other words, I should be
able to capture the impact of the foreign activities that are typically absent in the studies of MNCs
that take the vantage point of advanced developed countries that either invest ‘south’ or in other
rich countries.37
36 I choose to use the stock of FDI since the affiliates abroad remain active, even when the FDI flows have seized. 37 Head and Ries (2002) for example report that the average destination country of their median Japanese firm is 0.68 of Japan’s per capita GDP.
19

∑==
×=
tN
tj LsktGDPskt
LjtGDPjtFDIjt
,
1',1 '/'
'/'' N/S1it '
,
1',1∑
==
tN
tjFDIjt
(2)
with j indicating the destination country of FDI and t time. GDP/L measures a country’s per
capita GDP. In the regression we take the log of N/S1it.38
Note that the measure and the way it is constructed have some advantages. I take the FDI
activities of a firm as given. As we know, why firms open affiliates abroad can be motivated by a
variety of reasons and this decision can be affected by distance, tariffs, the presence or absence of
large markets, etc. By including N/S in the regression, I study whether there is a relation between
the factor abundance of the destination country for these investments and the factor intensity of
the parent in South Korea, while allowing for motivations other than factor price differences for
these investments.
A variation on N/S1 is to use a dummy variable that is one if the proposed measure (2) is larger
than one (as firms go north) and zero when it is the case that the mass of the FDI stock is going
south. The advantage of the first measure compared to the second is obviously that it gives a
continuum. It measures the changing direction not only of the MNCs that exclusively invest in the
North or exclusively in the South, but also of those that switch between North and South. The
second measure is primarily identified by the firms that switch between north and south. This
involves some 74 firms covering some 1100 (firm-year) observations. To the extent that these
firms represent more dramatic changes and to the extent that relocating production is a more
discrete process, this is a better measure.39
Figure 5 plots the (natural log of) the average per capita GDP of a firm’s destination country,
N/S1, vs. (the natural log of) the stock of the firm’s FDI for the years 1980, 1985, 1990 and 1995.
One sees clearly how the destination of South Korea’s MNCs gradually changes. From initially
being almost exclusively oriented towards the richer, developed countries, the gradual 38 Most of the action in expression (2) comes from the changing FDI-shares over time (not from South Korea’s changing relative per capita GDP vis a vis other countries). Still, the year effects should capture any effects due to Korea’s changing relative per capita GDP. 39 If the decision is to outsource labor-intensive parts, it may not matter whether the destination country is,
20

liberalizations in East Asia bring South Korea’s firms to a position where its stock is fairly evenly
divided between destination countries in the North and countries in the South. This fairly even
distribution puts South Korea in the ideal position to study two-way MNC activity and in
particular to evaluate the position of middle-income countries in the factor proportions theory of
the multinational corporation. 40
Endogeneity
The main objective of the present study is to determine whether indeed the changing capital-
abundance of a firm’s destination country affects the factor use of its parent negatively. One may
worry that the endogeneity of the right-hand side N/S variable will bias the estimation of
regression (1). Theory suggests that as the parent relocates activities to more capital-abundant
countries (proxied by N/S), less capital per worker will be required at the parent plant; the
opposite should hold for relocating to labor-abundant countries, i.e. β3 < 0. However, a feedback
effect in the opposite direction is not inconceivable when N/S also depends on a firm’s K/L. I
approach this issue from three different angles. I first investigate under which (reasonable)
conditions I can judge the sign of β3 even if there is a bias. I also propose an instrument for N/S
and I finally present the estimates with lagged dependent variables.
If indeed the destination of a firm’s investments, N/S, also depends on the firm’s factor intensity,
K/L, the coefficient β3 will be biased. However, to the extent that higher capital use of the parent
induces firms to move to more capital-abundant countries (N/S depends positively on K/L), there
is a (positive) upward bias that does not favor my hypothesis – to confirm the hypothesis I need to
estimate a negative β3.41 In other words, if I estimate the right (negative) sign for N/S, which I
say, two or three times as labor-abundant as South Korea. 40 Head and Ries (2002) argue that the positive impact of outsourcing on firms’ relative share of skilled vs. unskilled labor diminishes as Japanese firms outsource to other high income countries instead of to low-income. To the extent that Japan was a middle-income country early in their sample and to the extent that it outsourced to more advanced countries at the time (most of its FDI went to low-wage countries such as Taiwan, South Korea etc. in the 1970s, however), their findings support my thesis: Middle-income countries outsource labor-intensive parts to labor-abundant and capital-intensive parts to capital-abundant countries. 41 Consider, for expositional purposes, a system of OLS regressions (a) and (b) that would represent the true (simultaneous) relation between K/L and N/S. Regression (a) is similar to our regression (1) (a): K/L = X1β + α1 N/S + ε ; regression (b) indicates that N/S depends on K/L: N/S = X2β + α2 K/L + µ. Under the outsourcing hypothesis the coefficient α1 will be negative. Estimating regression (a) while ignoring regression (b) will yield a biased coefficient. With α2 positive, an independent increase in K/L (due to a positive shock ε in regression (a) that is uncorrelated with µ) will raise N/S. Therefore, N/S will be positively correlated with the error in regression (a) and therefore the estimated coefficient will have an
21
will, we know that the unbiased estimate would be even more negative. Note that it is not
unlikely that a firm’s K/L affects N/S in a positive way. Only for increasingly more capital-
intensive firms does it make sense to relocate capital-intensive activities to capital-abundant
countries. If not much capital is used, why move it? Also, investments to richer countries tend to
be in more capital-intensive sectors, whereas those to poorer ones takes place in more labor-
intensive sectors.42 Note that to the extent that a MNC's outward activities are driven by motives
other than factor prices (i.e. market access), one expects that increasing capital-labor ratios make
firms more likely to move to more capital-abundant countries – esp. if more capital-intensive
products tend to be higher-quality products for which there is a larger market in richer (more
capital-abundant) countries.
One can, of course, also try to instrument for N/S. The gradual shift of South Korea outward
activities may in large part be due to changing policies toward FDI outside (and inside) South
Korea. On the one hand, there is the gradual liberalization in South Korea since the 1980’s.
Gradually the South Korean government allows firms from different sectors and subsectors to
invest abroad. On the other hand, there are the liberalizations that take place in the surrounding
low-wage countries of East Asia in the 1980’s. Both types of liberalizations make the gradual
shifts in the destination of South Korea’s MNCs possible. Ideally one would want to construct
instruments that link N/S to the sectoral liberalizations by the South Korean government or any
destination country government. Unfortunately, these (esp. the South Korean) liberalizations took
place at a much more disaggregate level than the 2-digit KSIC classification of the firm-level data
that I have, so that is impossible to directly link a firm to a liberalization in a sector at a given
time.43 There is, however, a cruder way to instrument for N/S. In particular, one can focus on
China, the main low-wage destination for South Korea’s MNCs. Even though, South Korean
firms had been investing in China for a while, the end of the Cold War and the subsequent
establishment of diplomatic relations between South Korea and China in 1992 carried a stream of
upward (positive) bias. 42 See also for the US, Hanson, Mattaloni and Slaughter (2001). Yeaple (2002) notes a positive interaction between factor intensity and factor abundance for US outward FDI – He uses skilled and unskilled labor. To the extent that skilled-intensive sectors tend to be the more capital-intensive ones, this is in line with the hypothesis. 43 As I, in addition, lack detailed data (beyond FDI flows) on the operational activities (such as sales, input use, etc.) of the affiliates, I have to focus the analysis on the question, given that a firm invests in various countries, how does factor abundance of the destination country help shape the internal workings of the multinational, instead of, why do affiliate operations occur in particular destination country.
22

MNCs to China in its wake. Therefore, I will use a dummy that is one after 1991 to instrument for
the changing direction in South Korea’s target countries as measured by N/S.
Finally, even though this does not fully address the correlation between the right-hand side
variables and the error from the regression, the literature often introduces lagged values of the
independent variables in regressions à la (1) – It also suggest an adjustment lag. I will present
estimation results with lagged variables.
Estimation Results
In this section I present estimates of the baseline regression equation (1) for different sub samples
and with variations in the specification (with/without year effects, with industry trends) that
should illustrate the robustness of the finding. Tables 3 through 6 report the estimation results.
Table 3 focuses on firms that at some point in the sample become a multinational, i.e. the firms
that at least in one year of the sample invest abroad. Table 4 includes the control group of firms
that did never invest abroad during that same period. The results are mostly consistent across the
two datasets; the estimates are similar in sign and magnitude and there are no qualitative
differences between estimates with contemporaneous or lagged right-hand side variables or, for
that matter, with the instrumental variables. In Table 5 I single out the firms that switch between
investing in a more capital-abundant and a more labor-abundant country. I also provide some
estimates at the sectoral level in Table 6.
As the Tables 3 and 4 indicate, one obtains a positive and significant coefficient for the MNC
dummy or MNC lagged. This implies that a higher capital-to-labor ratio is required from firms
that want to invest abroad in all specifications, which is what one would expect if there is a fixed
cost associated with investing abroad. However, this positive impact is mitigated not only by the
destination country of the investment flows, but also by the size of the stock of a firm’s outward
investment. An increase in the total stock of FDI of a firm has a negative impact on its capital-
labor ratio. Note that this still leaves a net positive increase in the capital-labor ratio of the median
MNC firm that invests abroad. (For the median firm that invests abroad: FDI stock of 6.429 x -
0.023 (coefficient of contemporaneous FDI stock in Table 3) = -0.147 is smaller (in absolute
size) than the estimated coefficient of the FDI dummy, 0.34).
Of central interest is the coefficient on N/S. The N/S- variable measures the extent to which firms
invest in the North versus in the South and whether this over time is associated with a higher or a
23

lower capital-labor ratio. For both the continuous variable NS1 and for the North-South dummy
NS2 I obtain a negative estimate in all cases in Tables 3 and 4.44 As argued above, there is a likely,
positive (upward) bias in the estimated coefficient of contemporaneous N/S, as the capital-
intensity of the firm may affect the direction N/S positively. In this light, it is important to note
that we estimate a negative coefficient. Correcting for the bias would yield an even more negative
coefficient, i.e.: the obtained sign is not affected by the bias. Using lagged right-hand side
variables confirms the sign. Across all specifications in Table 3 and 4, the dummy variable is
somewhat more precisely estimated. In all cases and for both datasets is the North-South dummy
significant at the 95 percent level. For the group of firms that at least once invested abroad that is
reported in Table 3, the coefficient estimate for the continuous variable N/S is significant at the
95 percent level in all but one case (i.e. at 90 percent for lagged variable with year effects). For
the entire group of firms in Table 4 (including firms that do not invest abroad) most estimates are
significant at the 95 percent level. (with year effects the coefficient on the continuous variable is
significant at 90 percent; the lagged variable has the right sign but is insignificant.) In last column
of Table 3 and 4 I present the instrumental variable estimates using the beginning of diplomatic
relations with China as instrument (with robust standard errors). As one can see the instrumental
variable estimates confirm the basic result.
All the estimates with the dummy N/S variable suggest that firms investing in a northern country
have declining capital-intensity. On the other hand, firms that move to a southern, low-wage
country are associated with increasing capital-labor ratios. Or, in terms of the continuous variable,
the more south a firm goes the more capital-intensive it is and the more north it goes, the less
capital-intensive. For the median firm, with a destination country of 2.5 times South Korea’s
GDP, one obtains a drop in the capital-intensity. (Note that this drop still does not undo the higher
capital-labor requirement for investing abroad – the coefficient on the MNC dummy.) This
empirical result corroborates the pattern of intra-firm trade and capital-labor ratios of affiliates vs.
parents that I described in section 2. As such, the estimates are consistent with the prediction of
two-way MNC activity for MNCs from middle-income countries. (More than average) capital-
intensive activities are outsourced to the capital-abundant countries of the North and the labor-
intensive stages of production find their way into labor-abundant countries.
In what follows, I investigate the result for different samples. I first consider firms that shift the
direction of their investments from North to South or from South to North. Table 5 reports the 44 One obtains similar results if one includes sector-specific trends in the regression.
24

estimates for this group. As mentioned before, this group includes 74 firms (good for some 1100
firm-year observations). Thirty percent of these firms at least at one point shift the destination of
their MNC activities from South to North. I run regression (1) for this subgroup of firms that
move from South to North. I also include the results for the remaining group of firms that
predominantly move from North to South. As one can see, the coefficients are of the right sign
and they are in most instances significant at the 95 percent level. (I present the estimates with and
without lags and the IV estimates.) To study the robustness of the results, I have also broken
down the sample in a different way (not reported), focusing exclusively on firms that are active in
the North or the South. The firms from the North confirmed our results so far. For the firms of the
South I obtained a positive and insignificant (at 90 percent) coefficient on N/S1. While this may
suggest that moving more to the South, once you are in the South, does not matter as much, it
may as well simply be a function of the relatively small sample size.
Table 6 then provides estimates of the stripped-down fixed effects regression with the N/S
dummy across various sectors for both datasets. I present the estimates for sectors with a
minimum number of observations – more than 200 observations in the dataset with only MNCs.
(The results with lagged independent variables, not reported, are qualitatively similar.) As one
can see, the signs are except in one case (Transportation) consistent with the aggregate estimates
and the coefficient estimates are mostly significant in spite of the limited set of observations. The
magnitudes of the estimated coefficients do vary somewhat across sectors, however. (The
coefficients tend to be more precisely estimated for the larger dataset that also includes domestic
firms.) The results for textiles, electronics and petroleum and chemicals best mimic the aggregate
estimates: a positive coefficient on the MNC dummy, a negative coefficient on the stock of
accumulated outward FDI and a negative coefficient on N/S showing an increase in the capital-
intensity of the parent as it goes south and a drop as it goes north. That the results for electronics,
a sector often referred to exactly because of its extensive outsourcing, is important.
Conclusion
Multinationals predominantly originate from advanced, developed countries. This does not imply,
however, that MNCs from countries that do not belong to this select group are non-existent. In the
1970s and early 1980s countries such as Argentina, Brazil or India did have their own
multinationals. However, this often-called ‘first’ wave of MNCs was mainly regional and directed
towards countries at a similar stage of development; it did not expand dramatically. The more
25

recent wave of MNC activity from the middle-income countries in Asia seems different. Not only
has it experienced a fairly steep increase; it has also been much more diverse in its destinations.45
A significant fraction of the multinationals from these countries have opened affiliates either in
less or in more advanced countries.
In the present study I have exploited this interesting mix of more and less developed nations as
destination countries for MNCs from middle-income countries to learn about the in-house
distribution of production between affiliate and parent within the MNC. What emerges is a view
of MNC activity that complements the way in which we have been used to think about
multinational activity. Relocating stages of production or part of the scope of production is not
merely a one-way, North-South street as implied by the theories of Helpman and Krugman. Using
a unique firm-level data set for South Korean firms and multinationals I document that relocating
production goes beyond moving labor-intensive activities to labor-abundant countries. Statistics
of South Korea’s affiliates suggest that South Korean MNCs are shifting capital-intensive
activities to more advanced countries such as Japan at the same time that they move production to
China. In addition, a panel data analysis of the factor use of South Korea’s MNCs parents bears
out the implications from this ability to relocate both south and north. Targeting more advanced
countries is associated with the decreasing capital intensity of the parent, whereas moving south
with increasing capital use per worker. In the more theoretical part of the paper, I show how this
(empirically relevant) ability to relocate capital-intensive activities to more capital-abundant was
ruled out in the existing literature based on unnecessarily restrictive assumptions.
The ability to relocate more capital-intensive components to more capital-abundant countries is
intriguing. On the one hand, it shows us how the pattern (and function) of outward FDI changes
as countries develop and how MNC activity can be another way to let a country exploit its
specific comparative advantage to the fullest. As a country breaks up stages or scope of
production, it can shed those (labor-intensive) activities that it used to perform all too well in the
past and defer the (more capital/technology-intensive) activities it is not yet as well equipped to
perform competitively. At the same time, it raises a broader issue. The Asian Tiger’s growth
experience has attracted a fair amount of research, in large part in an attempt to disentangle
growth and trade. The question arises, whether these countries’ outward investment had any stake
in their successful development strategy, i.e. whether the changing pattern of MNC activity is
45 See Dunning (1997)
26

more than just an endogenous response to a changing economic environment. To address this
question, however, more careful study is needed of the specific impact of outward activities (and
the differential impact across destination countries) on firm performance and especially on
productivity.
27

Bibliography
Aitken, B, A. Harrison, 1999, Do Domestic Firms Benefit from Foreign Investment? Evidence from Venezuela., American Economic Review, 89, p. 605-618. Arndt, S., 1997, Globalization and the Open Economy, North American Journal of Economics and Finance 8, 71-79. Bernard, A. and B. Jensen, 1999, Exceptional Exporter Performance: Cause, Effect or Both?” Journal of International Economics 47, 1-26. Brainard, L., 1993, A Simple Theory of Multinational Corporations and Trade with a Trade-off between Proximity and Concentration, NBER WP 4236. Brainard, L., 1997, An Empirical Assessment of the Proximity-Concentration Tradeoff between Multinational Sales and Trade, American Economic Review, p. 520-544. Davis, D. and D. Weinstein, 2001, An Account of Global Trade, American Economic Review,
91, 5, 1423-54. Deardorff, A., 1998, Fragmentation Across Cones, Mimeo, Univ. of Michigan. Debaere, P., 2003, Relative Factor Abundance and Trade, Journal of Political Economy 111, 589 -610. Debaere P. and U. Demiroglu, 2003, On the Similarity of Country Endowments, Journal of International Economics 59, 101-136. Dunning, J. Hoesel, R. and R. Narula, 1997 Explaining the 'New' Wave of Outward FDI from Developing countries: the Case of Taiwan and Korea, International Business Review. Feenstra, R. and G. Hanson, 1997, Foreign Direct Investment and Wage Inequality: Evidence from Mexico's Maquiladoras, Journal of International Economics 42, 371-393. Hadad, M. and A. Harrison, 1993, Are There Positive Spillovers from Direct Foreign Investment? Evidence from panel data for Morocco, Journal of Development Economics 42, 51-74. Hanson, G., R. Mataloni and M. Slaughter, 2001, Expansion Strategies of U.S. Multinational Firms: in D. Rodrik and S. Collins (eds) Brookings Trade Forum 2001. Hanson, G, R. Mataloni and M. Slaughter, 2002, Vertical Specialization and Multinational Firms, Mimeo Dartmouth. Head, K. and J. Ries, 2002, Offshore Production and Skill Upgrading by Japanese Manufacturing Firms, Journal of International Economics, 58, 81-105. Helpman, E., 1984, A Simple Theory of Trade with Multinational Corporations, Journal of Political Economy, p. 451-471. Helpman, E., 1985, Multinational Corporations and Trade Structure, Review of Economic Studies, p. 443-458. Helpman, E. and P. Krugman, 1985, Market Structure and Foreign Trade, MIT Press. Jones, R. and H. Kierzkowski, 1997, Globalization and International Fragmentation, Mimeo. Kim, J-D and I-S Kang, 1997, Outward FDI and Exports: The Case of South Korea and Japan, Journal of Asian Economics, 8 (1), p. 39-50. Lee, B., 2002, FDI from Developing Countries: A Vector for Trade and Development, Development Centre Studies, OECD. Lee, H., South Korea's Outward FDI, Firm-level Evidence, Mimeo University of Texas, Austin. Lipsey, R., 2001, Foreign Direct Investment and the Operations of Multinational Firms: Concepts, History and Data, NBER WP 8665. Markusen, J., 1984, Multinationals, Multi-plant Economies, and the Gains from Trade, Journal of International Economics, 205-226. Markusen, J., 1995, The Boundaries of Multinational Enterprises and the Theory of International
28

Trade, Journal of Economic Perspectives, 169-189. Markusen, J. and K. Maskus, 2001, General-Equilibrium Approaches to the Multinational Firm: A Review of Theory and Evidence, NBER WP 8334. Rodriguez-Clare, A., Multinational Linkages and Economic Development, American Economic
Review, 1996.
Roberts, M. and J. Tybout, 1997, The Decision to Export in Columbia: An Empirical
Model of Entry with Sunk Costs, American Economic Review, 87, pp. 545 – 564.
UN, 2000, World Investment Directory, South East Asia and the Pacific, Volume 7, New York. UN, 1992, World Investment Directory, Asia and the Pacific, Volume I, New York. Yeaple, S., 2001, The Determinants of U.S. Outward Foreign Direct Investment: Market Access vs. Comparative Advantage, Review of Economics and Statistics, forthcoming.
29
Figure 1
30
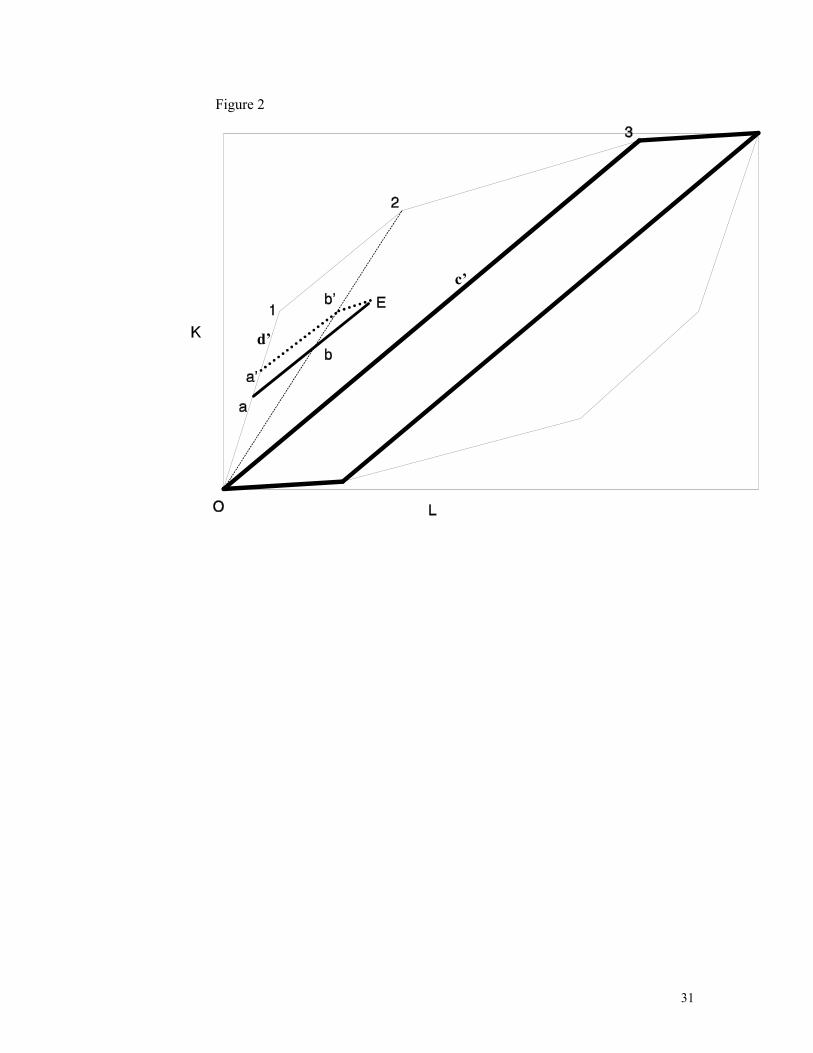
Figure 2
’
d’
c
31
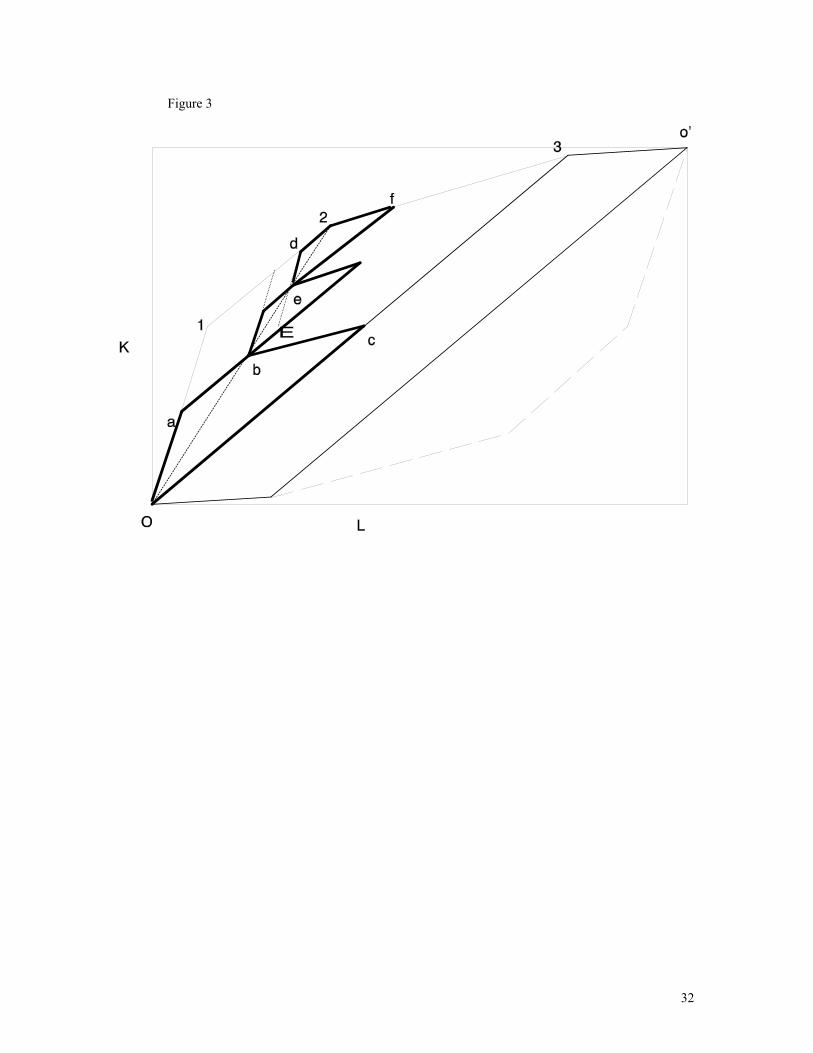
Figure 3
32

Figure 4
i
h E2
F
33
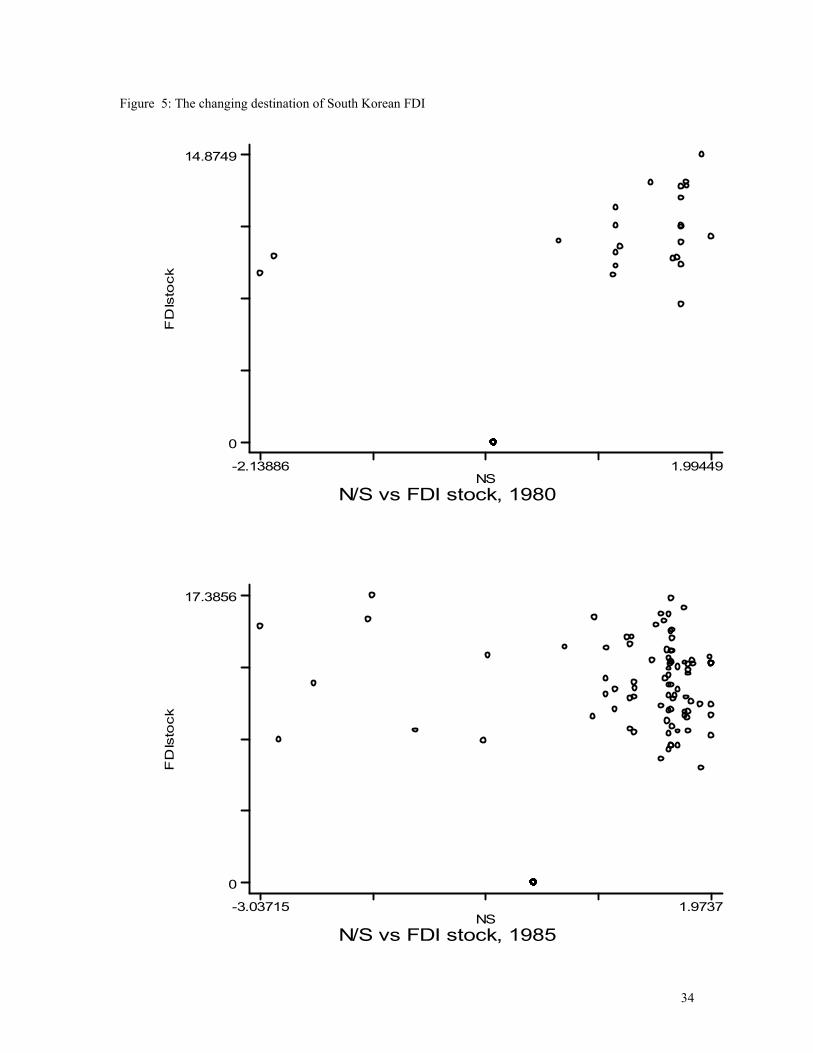
Figure 5: The changing destination of South Korean FDI
FD
Isto
ck
N/S vs FDI stock, 1980NS
-2.13886 1.99449
0
14.8749F
DIs
tock
N/S vs FDI stock, 1985NS
-3.03715 1.9737
0
17.3856
34

FD
Isto
ck
N/S vs FDI stock, 1990NS
-3.24282 1.9737
0
17.6787
35
FD
Isto
ck
N/S vs FDI stock, 1995NS
-3.66663 1.9737
0
19.3553

Table 1 South Korean MNC abroad in Electronics
Avg. Export to
Sales Ratio Avg. K / L Ratio
Location Number
of Affiliates
Sales from affi. To
Korea
from affi. To
Parent
from Parent to affi,
Parent Affiliate
Asia China 11 1,852,202 40.5 27.6 32 107.5 31.2 Indonesia 4 827,764 10.7 9.9 24.1 88.6 17.5 Hong Kong 1 606,231 19.8 14.5 29.3 88.7 80.3
India 3 477,098 0.2 0 8.5 67 26.3 Vietnam 3 156,362 18.6 17.5 27.7 105 45.7 Japan 2 931,564 61.7 53 53.8 159.4 337.9 Singapore 1 1,472,458 22.2 22.2 33 193.7 217.5
Philippines 4 152,206 54 50.7 29.8 103.4 17.2
Thailand 3 338,327 82.7 17.3 50.9 87.1 20.6 Malaysia 3 936,311 9.5 9.2 10.7 80.9 39.3 North America
U.S.A. 7 4,647,956 2 0.5 38 80.2 171.2 Europe UK 5 1,088,411 7.9 6.8 39.4 43.1 99.9
Germany 2 254,490 6.3 5.3 33.3 27.3 83 Poland 2 220,885 41.5 41.5 29 133.3 128.7 France 2 238,475 57.8 57.8 45.8 72.9 134.8
Latin America Brazil 4 404,566 4.6 3.1 72.3 31.2 35.3 Mexico 2 498,314 21.7 20.9 40.5 60.7 14.3
Sources: See previous tables
* Units of K/L ratio = thousand of Won per worker
** number of Korean affiliates that have more than $10 millions outstanding investment in 1999.
36

Table 2 Firm Characteristics, 1996
Average all firms FDI firms Non-FDI firms Output 5.6 108 9.2 108 1.75 108 employment 1,518 2336 635Capital / empl 168,584 196466 138482 Observ. 601 312 289 Notes: Units for employment: number of employees, other values: thousands of Korean Won.
37

Table 3: Estimates of fixed effect regression (1), firms that become multinationals Ln (K/L)it = αi + αt + β1 MNCit + β2 ln(FDIstockit) +β3 ln N/Sit + β4ln(sizeit) + εit dependent variable: firm capital labor ratio independent variables industry trends no year effects
N/S dummy -measure Lagged Lagged Lagged IV for NS
Indep. Var Indep. Var Indep Var. MNC dummy 0.34 0.28 0.36 0.26 0.29 0.25 0.8 **3.8 **3.1 **4 **2.8 **3.2 **2.7 **5 N/S dummy -0.1 -0.1 -0.11 -0.13 -0.13 -0.13 -0.7 **-3.25 **-3.1 **-3.6 **-3.9 **-4.3 **-3.9 **-4.7 FDI stock -0.02 -0.019 -0.023 -0.01 -0.01 -0.01 -0.03 **-3.3 -*2.6 **-3.4 *-1.8 -1.2 -1.25 **-3.5 R2 0.12 0.1 0.14 0.12 0.09 0.09 0.1 Observ. 4708 4396 4708 4396 4708 4396 4708 N/S continuous measure MNC dummy 0.26 0.2 0.28 0.17 0.19 0.16 0.38 **3.13 **2.4 **3.3 **1.9 **2.3 *1.8 **4.1 N/S -0.024 -0.019 -0.023 -0.027 -0.032 -0.027 -0.2 **-2.32 -*1.8 **-3.2 **-2.6 **-3.2 **-2.6 **-4.5 FDI stock -0.022 -0.018 -0.025 -0.01 -0.01 -0.01 -0.03 **-3.12 *-2.5 **-3.2 *-1.6 -1.2 -1 **-3.3 R2 0.12 0.1 0.14 0.12 0.09 0.09 0.1 Observ. 4708 4396 4708 4396 4708 4396 4708 t-statistics below the estimate ** significant at the 95 percent level * significant at the 90 percent level
38

Table 4: Estimates of fixed effect regression (1), all firms Ln (K/L)it = αi + αt + β1 MNCit + β2 ln(FDIstockit) +β3 N/Sit + β4ln(sizeit) + εit dependent variable: firm capital labor ratio independent variables industry trends no year effects
Lagged Lagged Lagged IV for NS
N/S dummy -measure Indep. Var. Indep. Var. Indep. Var. MNC dummy 0.36 0.3 0.34 0.24 0.32 0.28 0.9 **4.09 **3.4 **3.8 **2.6 **3.53 **3.1 **8.4 N/S dummy -0.08 -0.09 -0.09 -0.11 -0.14 -0.13 -0.7 **-2.6 **-2.8 **-2.8 **-3.4 **-4.3 **-4 **-9 FDI stock -0.03 -0.02 -0.01 -0.02 -0.014 -0.014 -0.09 **-4.5 **-3.7 **-2.8 **-2.4 **-2.1 **-2.1 **-8 R2 0.14 0.13 0.16 0.14 0.09 0.1 0.1 Observ. 8893 8292 8893 8292 8893 8292 8893 N/S continuous measure MNC dummy 0.3 0.23 0.27 0.16 0.22 0.19 2.5 **3.6 **2.7 **3.3 *1.8 **2.6 **2.2 **6 N/S -0.017 -0.015 -0.017 -0.02 -0.03 -0.03 -1.6 *-1.74 -1.5 *-1.8 **-2.2 **-3.2 **-2.7 **-5.5 FDI stock -0.029 -0.02 -0.027 -0.015 -0.012 -0.01 -0.06 **-4.35 **-3.5 **-4 **-2.2 *-1.9 **-1.9 **-5 R2 0.14 0.13 0.16 0.14 0.09 0.09 0.1 Observ. 8893 8292 8893 8292 8893 8292 8893 t-statistics below the estimate ** significant at the 95 percent level * significant at the 90 percent level
39

Table 5: Estimates of fixed effect regression (1), firms that switch between North and South
LnK/Lit=αi +αnindustrytrend +β1MNCit +β2lnFDIstockit +β3 N/Sit +β4lnsizeit+ εit dependent variable: firms capital labor ratio South North independent variables switchers To North To South Before/after initial FDI Lagged IV for NS Lagged Lagged Indep. Var. Indep. Var. Indep. VMNC dummy 0.38 0.45 1.6 0.69 0.51 0.34 **2 **2.3 **2.2 **2.2 *1.7 1.3 N/S dummy -0.17 -0.22 -0.6 -0.15 -0.28 -0.18 **-3.3 **-4.1 **-2.2 **-2.1 **-3.8 **-2.2 **-2.4 FDI stock -0.01 -0.016 -0.09 -0.06 -0.05 -0.003 -0.6 -1.1 **-2.1 **-2.3 *-1.8 -0.17 R2 0.08 0.08 0.08 0.17 0.16 0.15 Observ. 1194 1118 1194 304 284 890 t-statistics below the estimate ** significant at the 95 percent level * significant at the 90 percent level
40
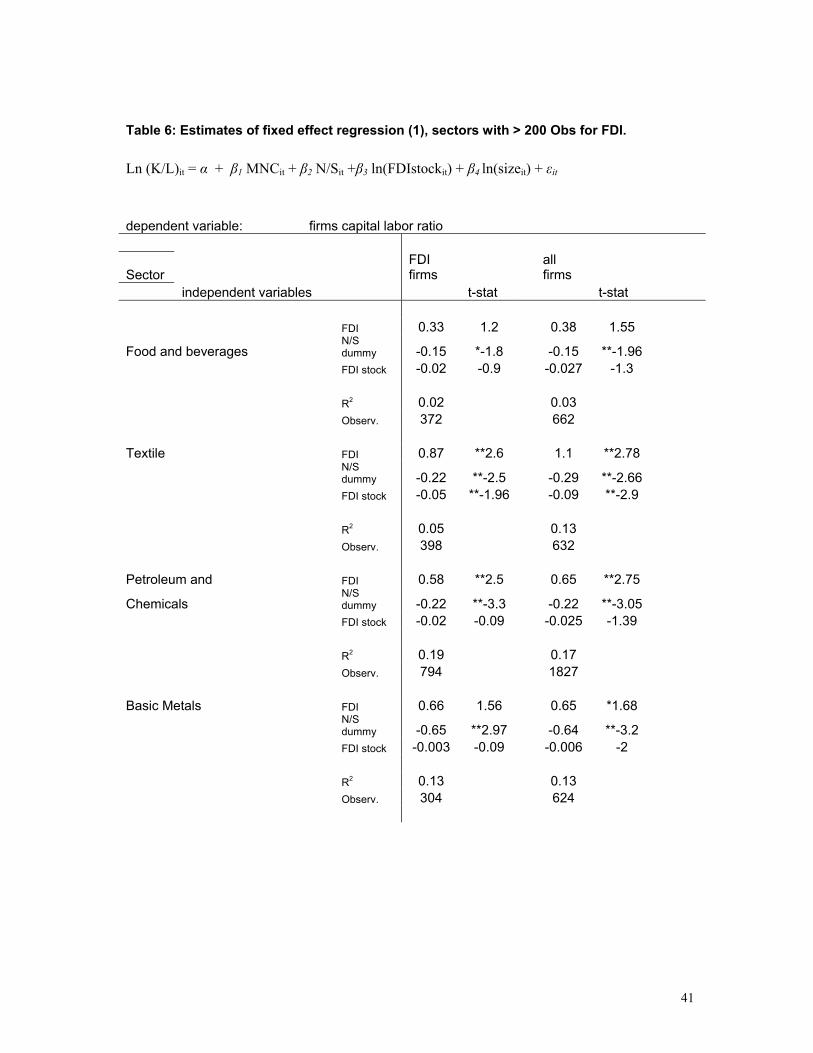
Table 6: Estimates of fixed effect regression (1), sectors with > 200 Obs for FDI. Ln (K/L)it = α + β1 MNCit + β2 N/Sit +β3 ln(FDIstockit) + β4 ln(sizeit) + εit dependent variable: firms capital labor ratio
Sector FDI firms
all firms
independent variables t-stat t-stat FDI 0.33 1.2 0.38 1.55
Food and beverages N/S dummy -0.15 *-1.8 -0.15 **-1.96
FDI stock -0.02 -0.9 -0.027 -1.3 R2 0.02 0.03 Observ. 372 662 Textile FDI 0.87 **2.6 1.1 **2.78
N/S dummy -0.22 **-2.5 -0.29 **-2.66
FDI stock -0.05 **-1.96 -0.09 **-2.9 R2 0.05 0.13 Observ. 398 632 Petroleum and FDI 0.58 **2.5 0.65 **2.75
Chemicals N/S dummy -0.22 **-3.3 -0.22 **-3.05
FDI stock -0.02 -0.09 -0.025 -1.39 R2 0.19 0.17 Observ. 794 1827 Basic Metals FDI 0.66 1.56 0.65 *1.68
N/S dummy -0.65 **2.97 -0.64 **-3.2
FDI stock -0.003 -0.09 -0.006 -2 R2 0.13 0.13 Observ. 304 624
41
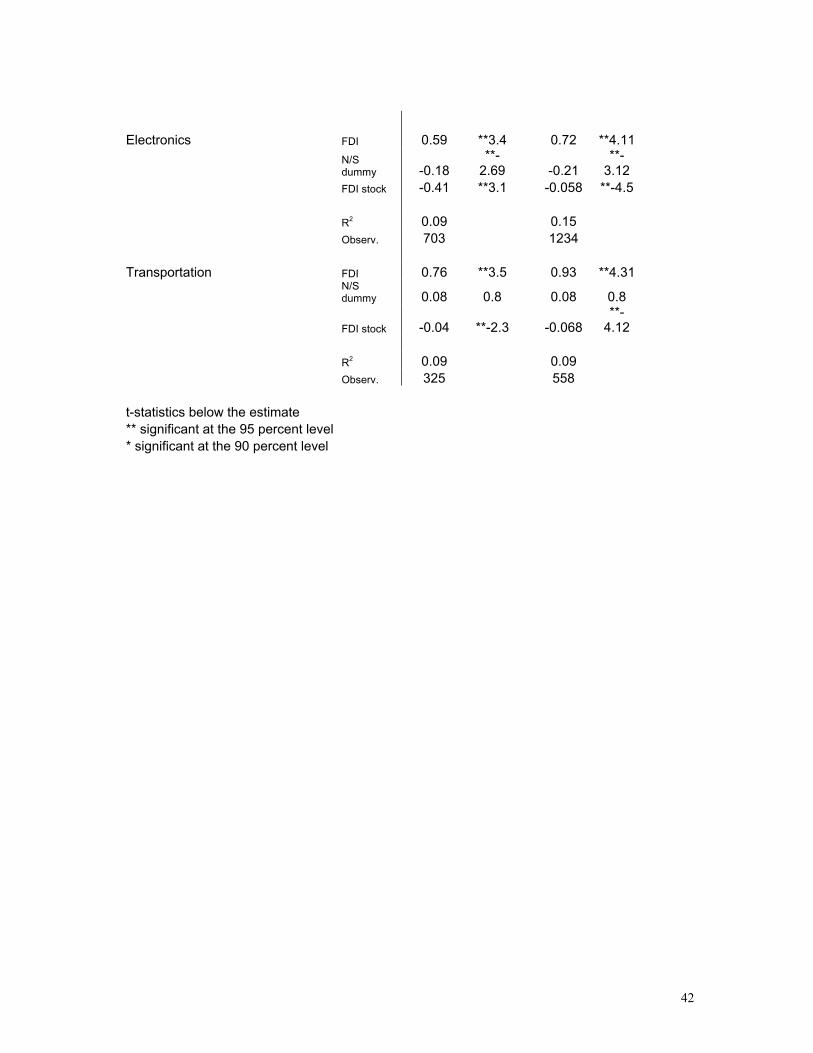
Electronics
FDI 0.59 **3.4 0.72 **4.11
N/S dummy -0.18
**-2.69 -0.21
**-3.12
FDI stock -0.41 **3.1 -0.058 **-4.5 R2 0.09 0.15 Observ. 703 1234 Transportation FDI 0.76 **3.5 0.93 **4.31
N/S dummy 0.08 0.8 0.08 0.8
FDI stock -0.04 **-2.3 -0.068 **-
4.12 R2 0.09 0.09 Observ. 325 558 t-statistics below the estimate ** significant at the 95 percent level * significant at the 90 percent level
42

Figure A1
43

Appendix A1: Distributing Production Between MNCs from the North, the South and domestic firms
Figure 3 pictures three trapezoids. The left trapezoid shows the factor use by the North’s MNCs,
the one in the middle by South’s MNCs and the one to the right is for South’s (non-MNC) firms.
To make North’s trapezoid isomorphic to 0123 we complement 0a and ab that are produced in
North with the labor-intensive vector bc (parallel to 23) that was relocated to South. To obtain the
right trapezoid, we project the fraction of the capital-intensive components that Southern MNCs
relocate to Northern affiliates (bE) on the capital-intensive component’s factor use 12. The
segment d2 then represents the capital-intensive component produced in South by non-MNC
firms. (The segment 1d is what North produces.) The intersection of dE and 02 tells us the
Southern HQ services needed to complement capital-intensive components, i.e. de. As we
supplement de and d2 with labor-intensive parts that are produced in South, we complete the right
trapezoid. What is left, capital-intensive components produced in North by affiliates of Southern
MNCs plus HQ services and labor-intensive components from Southern MNCs, constitutes the
middle trapezoid of South’s MNCs.
44

45
Table A1, Destination countries for South Korean FDI, 1996.
Argentina Germany Netherlands United Ar. Em. Australia Ghana New Zealand Uruguay Austria Greece Norway USA Bahamas Guam Pakistan Uzbekistan Bahrain Guatemala Panama Venezuela Bangladesh Honduras Papua N. Guinea Vietnam Belgium Hong Kong Peru Virgin Islands Bermuda Hungary Philippines Yemen Bolivia Iceland Poland Zambia Brazil India Portugal Bulgaria Indonesia Romania Cambodia Iran Russia Canada Italy Saudi Arabia Chile Jamaica Singapore China Japan South Africa Colombia Jordan Spain Congo Kazachstan Sri Lanka Costa Rica Laos Sudan Dominican RP Macao Sweden Ecuador Malaysia Switzerland Egypt Marshal Islands Syrian Arab Rep El Salvador Mexico Taiwan Ethiopia Mongolia Thailand Fiji Morocco Turkey Finland Myanmar Ukraine France Nepal United Kingdom