the excess emission in classical t tauri stars jorge filipe s. gameiro dma, faculdade de ciências...
TRANSCRIPT

The excess The excess emission in emission in
Classical T Tauri Classical T Tauri StarsStarsJorge Filipe S. GameiroJorge Filipe S. Gameiro
DMA, Faculdade de Ciências Universidade DMA, Faculdade de Ciências Universidade do Portodo Porto
Centro de Astrofísica da Universidade do Centro de Astrofísica da Universidade do Porto (CAUP)Porto (CAUP)
Collaborators:Daniel Folha, Vitor Costa (CAUP)Nuria Calvet (CfA), Rui Azevedo (CAUP/CfA)Peter Petrov (Crimean Astrophysical Observatory)

OutlineOutline
Star disc interactionStar disc interaction Magnetospheric accretion models to fit the Magnetospheric accretion models to fit the
excess emission (veiling) dependence on excess emission (veiling) dependence on wavelengthwavelength
Accretion rate determinationAccretion rate determination The inner disc structure The inner disc structure
Combine NIR and optical observationsCombine NIR and optical observations What is the connection between optical and NIR What is the connection between optical and NIR
excesses?excesses? Short time scale variability – Short time scale variability –
Inhomogeneous accretion Inhomogeneous accretion

I – Star-disc interactionI – Star-disc interaction
RU Lupi – CTTSRU Lupi – CTTS HR7368 – template (K7V)HR7368 – template (K7V) RX1524.0-3209 – WTTS (K7V)RX1524.0-3209 – WTTS (K7V)
Aexcphot FFF 4.0* 10)(

Veiling Measurement procedureFe II (
temptemp
temp
F
Fr
F
FFr
1
DI Cep (G8IV-V)Template (G8V)
-1s km 1.5 20.2 )sin( Iv
Residual spectrum

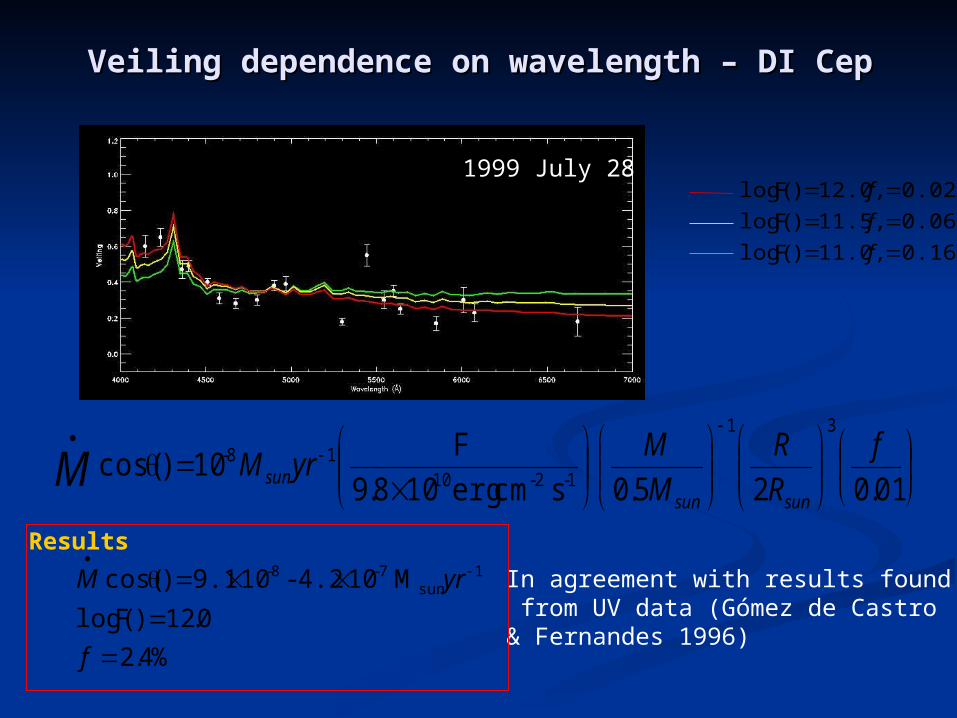
Veiling dependence on wavelength – DI CepVeiling dependence on wavelength – DI Cep
OHP (ELODIE) / 1997
WHT (UES) / 1999
NOT (SOFIN) / 2001
Steep rise clearly seen around 4500 Steep rise clearly seen around 4500 ǺǺ Veiling tends to increase towards short wavelengthVeiling tends to increase towards short wavelength Veiling increase towards near infra-red ?Veiling increase towards near infra-red ? Hump feature centred at 5300 Hump feature centred at 5300 ǺǺ and about 500 and about 500 ǺǺ
wide (also reported by Stempels & Piskunov 2003)wide (also reported by Stempels & Piskunov 2003)

Magnetospheric accretion shock modelsMagnetospheric accretion shock models
Camenzind 1990, Konigl Camenzind 1990, Konigl 1991, Shu et al. 19941991, Shu et al. 1994
Magnetospheric accretion models have been successful in explaining the excess emission (continuum and lines) Calvet & Gullbring Calvet & Gullbring 1998, Gullbring et al. 20001998, Gullbring et al. 2000 (BP Tau)(BP Tau)
Parameters of model – Parameters of model – Excess spectrum depends Excess spectrum depends
mostly on energy flux of the mostly on energy flux of the accretion flow accretion flow FF and the and the projected surface coverage of projected surface coverage of the accretion column the accretion column ff
13
18-1-2-10
01.02
5.0
10
)cos( s cm erg 10 9.8
f
R
R
M
M
yrM
M
sunsunsun
F
fM ,,T ,R , eff** F
(Calvet & Gullbring 1998, Ardilla & Basri 2000)
Accretion column
Hot spot
Disc Dust and gas
Disc gas
(Camenzind 1990)
NIR
FIR
optical
Veiling dependence on wavelength – DI CepVeiling dependence on wavelength – DI Cep
0.168 11.0, )log(
0.067 11.5, )log(
0.024 12.0, )log(
f
f
f
F
F
F1999 July 28
01.025.0
s cm erg108.910 )cos(
31
1-2-1018- f
R
R
M
MyrM
sunsunsunM
F
In agreement with results found from UV data (Gómez de Castro & Fernandes 1996)
%4.2
0.12)log(
M 104.2 -109.1 )cos( 1sun
7-8-
f
yrM
F
Results
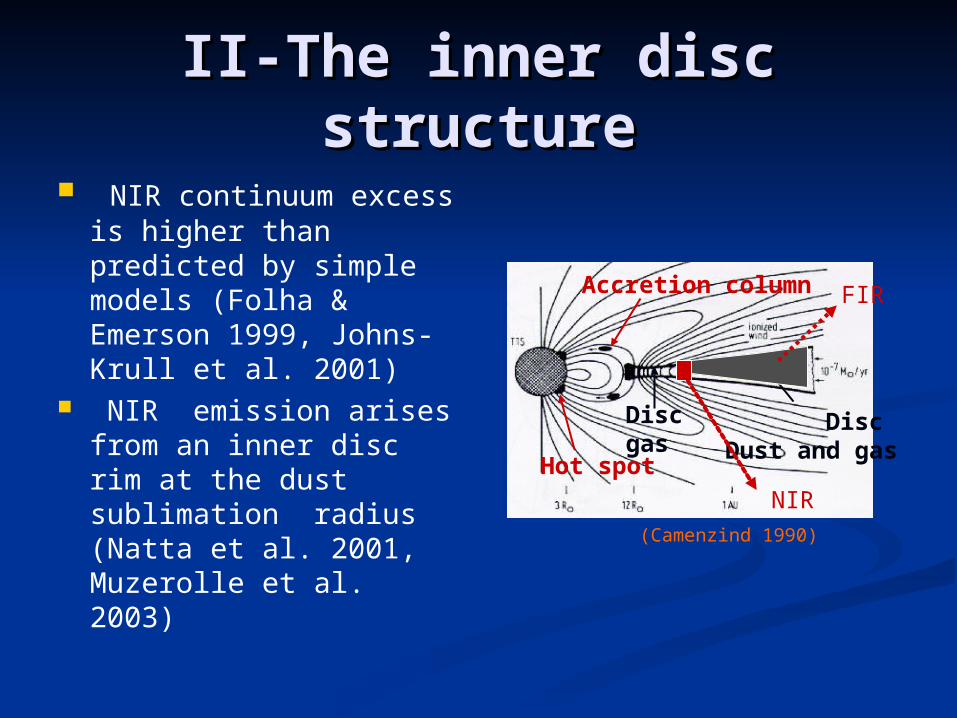
II-The inner disc II-The inner disc structurestructure
NIR continuum excess is higher than predicted by simple models (Folha & Emerson 1999, Johns-Krull et al. 2001)
NIR emission arises from an inner disc rim at the dust sublimation radius (Natta et al. 2001, Muzerolle et al. 2003)
Accretion column
Hot spot
Disc Dust and gas
Disc gas
(Camenzind 1990)
NIR
FIR

Simultaneous observations Simultaneous observations in the NIR and optical in the NIR and optical
bandsbands South hemisphere (ESO)South hemisphere (ESO)
NIR – NTT (SOFI) [cover the 0.9-2.5NIR – NTT (SOFI) [cover the 0.9-2.5m m wavelength range]wavelength range]
Optical – 1.52m [Boller & Chiven Optical – 1.52m [Boller & Chiven spectrograph (low resolution)]spectrograph (low resolution)]
27 CTTS, 9 WTTS27 CTTS, 9 WTTS North hemisphere (La Palma)North hemisphere (La Palma)
NIR – TNG NIR – TNG Optical WHT (ISIS) [spectral coverage Optical WHT (ISIS) [spectral coverage
3600-9000 A]3600-9000 A] 16 CTTS, 8 WTTS16 CTTS, 8 WTTS

CTTS span a large range of excess emissionCTTS span a large range of excess emission WTTS used to derive the excess emission WTTS used to derive the excess emission
spectra. They spectral type cover those of spectra. They spectral type cover those of CTTS in the sampleCTTS in the sample
The spectra are calibrated in absolute fluxThe spectra are calibrated in absolute flux The observations allow us to determine the The observations allow us to determine the
spectrum of excess continuum from the spectrum of excess continuum from the blue , where emission from the shock blue , where emission from the shock dominates, to the K band, where emission dominates, to the K band, where emission from accretion disc starts dominatingfrom accretion disc starts dominating
Disentangle the various source of excess emission

T=2400K
6200
0.4A*
*
V10
2002) Piskunov & (Stempels 3.0AF
F1. = Dereddened flux
2. Measure veiling at 6200 A (r=4.0)
3. Scale template spectrum
4. Get absolute excess emission1
10 4.0
r
FF
Aphot
photF
AF 4.0* 10grisms

Absolute excess emissionAbsolute excess emission
• With these observation we relate excess continua from the blue to the NIR. Adjust various component to the obtained spectra, namely those resulting from accretion shock and accretion disc models• Two independent way to determine mass acretion rate (accretion shock component from optical observations, Pa and Br line fluxes [Muzerolle et al. 1998])
photAexc FFF 10*

Veiling excessVeiling excess
6200
• Veiling determined from the absolute fluxes of star and template• Veiling increase towards NIR wavelength.• Bump at 5300 A due to molecular absorption band (TiO)
Veiling = 4 at 6200 Ǻ

III – Accretion rate III – Accretion rate variability in short time variability in short time
scalesscales BP Tau ObservationsBP Tau Observations
Double arm spectrograph ISIS on the WHT Narrow slit (≈1”) Δv≈6 km/s (blue arm) + Δv≈20
km/s (red arm) One hour long time series: Δt≈5 min. (blue arm) +
Δt≈1 min. (red arm)

BP TauBP Tau
Classical T Tauri star, K7Classical T Tauri star, K7 Teff=4055 Teff=4055 ±112 K±112 K Log Log g =g = 3.67 3.67 ±0.50±0.50 vv sin sini = i = 10.210.2 ± 1.8 km/s± 1.8 km/s ii = 28º = 28º ±2º ±2º Dutrey, Guilloteau & Simon Dutrey, Guilloteau & Simon
(2003)(2003)
Photometric period = 6.1 – 8.3 daysPhotometric period = 6.1 – 8.3 days Irregular short time scale variabilityIrregular short time scale variability
Johns-Krull, Valenti & Koresko (1999)

Lines variabilityLines variabilityH e I (6678)
• H displays a decrease in intensity and significant narrowing at the base• He I reveals the presence of an inverse P Cygni profile on the first 12 minutes that disappears• The veiling decreases

Variability can be due to:Variability can be due to: Obscuration by circunstellar material – Obscuration by circunstellar material – But veiling variations !But veiling variations ! Flare like event – Flare like event – possible but the likelihood of catching a flare possible but the likelihood of catching a flare
in one hour is very small, Gullbring et al. 1996 found no in one hour is very small, Gullbring et al. 1996 found no pronounced flare activity on BP Taupronounced flare activity on BP Tau
Rotational modulation – P=6.1-8.3 daysRotational modulation – P=6.1-8.3 days Accretion rate variation – Inverse P Cygni He IAccretion rate variation – Inverse P Cygni He I
1 hour

Model fits BP Tau data set:
M*=0.5 M, R*=2 R, Teff= 4000 K (no Av assumed)
1-component models (1C)
single log F2-component models (2C)
pair of log F
phot,0λ
shockλ
λ F)-(1
F1r
f
fphot,0λ21
shock,2λ2
shock,1λ1
λ F)1(
FF1r
ff
ff

log F =10.5 log F =11.0 log F =11.5
log F =10.5
log F =11.0
log F =10.5
log F =11.5
log F =11.0
log F =11.5
1C
2C
observations model results
1C
2C

Inhomogeneous Inhomogeneous accretionaccretion
The accretion rate starts off at The accretion rate starts off at relatively high value relatively high value
Decrease in 1 hour to Decrease in 1 hour to
17107.1 yrM sun
18100.5 yrM sun