the evolution of threshold traits: effects of selection on...
TRANSCRIPT
The evolution of threshold traits: effects of selection on fecundityand correlated response in wing dimorphism in the sand cricket
D. A. ROFF,* J. TUCKER, G. STIRLING* & D. J. FAIRBAIRN *Department of Biology, McGill University, 1205 Dr Pen®eld Ave., Montreal, Quebec, Canada, H3A 1B1
Department of Biology, Concordia University, 1455 de Maisonneuve Blvd., West, Montreal, Quebec, Canada H3G 1M8
Introduction
Directional selection produces a change in the population
mean of a phenotype, but this shift will only be
translated into a phenotypic difference between gener-
ations if the trait is heritable, in the sense that there is
additive genetic variance in the trait. Thus any study of
evolutionary change must concern itself both with the
factors causing phenotypic change and the genetic
architecture of the traits under investigation. In the case
of a single trait the relevant genetic parameter is the
narrow sense heritability, de®ned as the ratio of the
additive genetic variance to the phenotypic variance
(Falconer, 1989). Heritability can be estimated by pedi-
gree analysis (e.g. full-sibs, half-sibs) or by response to
selection, the latter estimate frequently being called the
realized heritability. Estimation of the heritability from
pedigree analysis is the more generally adopted method,
because it is typically both less labour-intensive and
quicker, requiring only one or two generations of
breeding.
A selection experiment is not simply an alternative
method of estimating heritability but can provide insights
into the genetic architecture of a trait that are not evident
from the sib analysis. For example, according to the
standard response equation (Response � Heritability ´
Keywords:
correlated responses;
quantitative genetics;
selection;
threshold trait;
trade-offs.
Abstract
The quantitative genetic basis of traits can be determined using a pedigree
analysis or a selection experiment. Each approach is valuable and the
combined data can contribute more than either method alone. Analysis using
both sib analysis and selection is particularly essential when there are likely to
be nonlinearities in the functional relationships among traits. A class of traits
for which this occurs is that of threshold traits, which are characterized by a
dichotomous phenotype that is determined by a threshold of sensitivity and a
continuously distributed underlying trait called the liability. In this case, traits
that are correlated with the liability may show a nonlinear relationship due to
the dichotomy of expression at the phenotypic level. For example, in wing
dimorphic insects fecundity of the macropterous (long-winged) females
appears in part to be determined by the allocation of resources to the ¯ight
muscles, which are almost invariably small or absent in the micropterous
(short-winged, ¯ightless) females. Pedigree analysis of the cricket Gryllus ®rmus
has shown that wing morph, fecundity and the trade-off between the two
have additive genetic (co)variance. It has also been shown that selection on
proportion macroptery produced an asymmetric correlated response of
fecundity. The present paper details the results of direct selection on fecundity
and the correlated response in proportion macroptery. Selection for increased
fecundity resulted in increased fecundity within both wing morphs and a
correlated decrease in proportion macroptery. Similarly, selection for de-
creased fecundity resulted in a decrease within morphs and a correlated
increase in the proportion of macropterous females. This provides additional
evidence that the trade-off between fecundity and wing morphology has a
genetic basis and will thus modulate the evolution of the two traits.
Correspondence: Dr Derek A. Roff, Department of Biology, McGill Univer-
sity, 1205 Dr Pen®eld Ave., Montreal, Quebec, Canada, H3A 1B1.
Tel: 514 398 6464; fax: 514 398 5069; e-mail: [email protected]
J . E V O L . B I O L . 1 2 ( 1 9 9 9 ) 5 3 5 ± 5 4 6 ã 1 9 9 9 B L A C K W E L L S C I E N C E L T D 535
Selection differential) the response should be the same in
both directions of selection. This is frequently not the
case (see Table 4.2, Roff, 1997), and many reasons for
asymmetry in response have been advanced (Roff, 1997,
pp. 134±137).
A central feature of evolutionary theory, particularly
that associated with the evolution of life history traits, is
that trait evolution is a function of the interaction of
several traits (Roff, 1992; Stearns, 1992). Selection
favouring an increase in a particular trait may be opposed
by a ®tness trade-off between this trait and a second trait.
As with directional selection on a single trait, for the
trade-off to be evolutionarily important in determining
the trajectory of trait values and the ®nal equilibrium
combination, the trade-off must be determined in part by
additive genetic variance. This genetic determination is
measured by the additive genetic correlation between the
two traits. As a consequence of the genetic correlation,
selection on one trait will produce a change in other traits
with which it is correlated. As with the response to
selection, the `simple' correlated response equation pre-
dicts that the correlated response will be symmetric. But,
as might be expected from the frequent occurrence of
asymmetric direct responses to selection, the correlated
response often depends upon the direction of direct
selection (Roff, 1997, pp. 171±182). The genetic analysis
of two traits thus involves both a pedigree analysis and
two selection experiments: divergent selection (i.e. one
`up' line and one `down' line) on trait X with measure-
ment of the direct response of X and the correlated
response of trait Y, and divergent selection on trait Y with
measurement of the direct response of Y and the
correlated response of trait X.
The above triad of experiments is particularly impor-
tant if there are nonlinearities in the phenotypic expres-
sion of one or more of the traits under study. In such
cases, even if there is continuity at the genetic level, the
direct and correlated responses may not be symmetric.
Threshold traits are quantitative genetic traits for which
there is a clear nonlinearity at the phenotypic level.
These traits are characterized by two phenotypically
distinct morphs that are assumed to be genetically
determined by a continuously distributed underlying
trait called the liability (Falconer, 1989). Individuals
which have liabilities above a particular threshold
develop into one morph while individuals below the
threshold develop into the alternative. Examples of
threshold traits are widespread (reviewed in Roff, 1996)
and include cyclomorphosis, paedomorphosis, dimor-
phism in morphology (e.g. weaponry, trophic structures,
wings), in reproductive behaviour or life history (e.g.
semelparity vs. iteroparity; diapause vs. direct develop-
ment), sex determination in some insects and reptiles,
twinning in some mammals, and responses to physio-
logical challenges (e.g. disease resistance). The presence
of two distinct morphs suggests that there are both costs
and bene®ts associated with each morph. In this regard,
wing dimorphism in insects has been particularly well
studied and serves as a model for the evolution of
threshold traits.
Wing dimorphism is found in many different taxa of
insects and comprises a winged morph that is typically
capable of ¯ight, and a short-winged or wingless morph
that cannot ¯y. The primary feature of the habitat of
wing dimorphic insects (we here exclude sexual dimor-
phisms) is that they form a mosaic of patches that are
spatially and temporally heterogeneous (den Boer, 1970,
1979; den Boer et al., 1979; Dingle, 1985; Roff, 1990a;
1994a; Denno et al., 1991). In such an environment,
migration of at least part of the population is essential for
long-term persistence (reviewed in Roff, 1994b). How-
ever, being capable of ¯ight considerably reduces the
fecundity of females (Roff, 1986; Roff & Fairbairn, 1991)
and in males decreases the success of obtaining mates
(Crnokrak & Roff, 1995; Fairbairn & Preziosi, 1996). A
trade-off between the two traits, wing morphology and
reproduction, is thus maintained by the balance between
the bene®ts of present reproductive success and long-
term persistence (Roff, 1994b). Similar trade-offs
between the threshold trait and reproductive parameters
have been observed in other types of threshold traits
(Roff, 1996).
The trade-offs reported for wing dimorphism and other
threshold traits have in almost all cases been documented
only at the phenotypic level. As described above, it is
minimally necessary to demonstrate that these trade-offs
have a genetic basis, which means showing that the two
traits in the trade-off are genetically correlated (Reznick,
1985). The heritability of threshold traits is typically large
enough (>0.30; Roff, 1998a) to respond to modest
selection intensity, and life history traits such as fecun-
dity have heritabilities frequently between 0.15 and 0.30
(Mousseau & Roff, 1987; Roff & Mousseau, 1987;
Weigensberg & Roff, 1996), suggesting that a genetic
correlation between a threshold trait and a reproductive
trait such as fecundity is plausible. Estimation by pedi-
gree analysis of the genetic correlation between wing
morphology and fecundity in the two cricket species
Allonemobius socius (Roff & Bradford, 1996) and Gryllus
®rmus (Roff, 1994c; Roff et al., 1997) has shown that the
trade-off is genetically based and thus will potentially
modulate the joint evolution of the two traits.
Directional selection on proportion macropterous
(long-winged) in G. ®rmus produced a rapid direct
response in accord with the heritability estimated from
both full-sib (Roff, 1994c) and half-sib (Roff et al., 1997)
experiments. There was, however, asymmetry in the
response, with selection for decreased macroptery pro-
ducing a faster response than selection for increased
macroptery (Roff, 1990b). Analysis of the correlated
response in fecundity showed that the fecundity of the
macropterous females in the lines selected for high
proportion macroptery decreased relative to the macro-
pterous females from the control line, and was in
536 D. A. ROFF ET AL .
J . E V O L . B I O L . 1 2 ( 1 9 9 9 ) 5 3 5 ± 5 4 6 ã 1 9 9 9 B L A C K W E L L S C I E N C E L T D

reasonable accord with predictions from the correlated
response equation (Roff, 1994c). However, the fecundity
of the micropterous (short-winged) females in the lines
selected for low proportion macroptery did not differ
statistically from the fecundity of the micropterous
females from the control lines. Roff (1994c) suggested
that this asymmetrical response resulted from the pres-
ence of the large ¯ight muscles in the macropterous
females. The trade-off between fecundity and wing
morphology is hypothesized to be due to competition
for resources between the gonads and the ¯ight muscles
(Roff, 1984; Roff & Fairbairn, 1991; Zera & Denno, 1997;
Zera et al., 1997): selection for increased macroptery
changes the pattern of allocation and changes the early
fecundity of macropterous females. Because they lack the
¯ight muscles, micropterous females should not be
affected by this shift in allocation and hence there should
little correlated response (Roff, 1994c).
From the heritabilities and genetic correlation estimat-
ed from the pedigree analyses we predict that selection
for increased fecundity in G. ®rmus will decrease the
proportion of macropterous females, while selection for
decreased fecundity will increase the proportion of
macropterous females. However, the asymmetry of the
response to selection on macroptery makes such predic-
tions uncertain. If fecundity were itself dichotomous,
with each morph having a characteristic value, a shift
solely due to a change in morph frequency would occur
(hereafter referred to as the `dichotomy' hypothesis).
Such a scenario is generally assumed in the analysis of
threshold traits (Lively, 1986; Moran, 1992; Pfennig,
1992; Rowell & Cade, 1993; Roff, 1994b), although it has
been shown to be theoretically unlikely (Fairbairn, 1986,
1994; Fairbairn & Roff, 1990). The appropriate genetic
model is for a trait such as fecundity to be genetically
correlated with the underlying continuously distributed
trait (� liability; for a discussion of liability see Falconer,
1989, and for its extension to the correlation between
two traits see Mercer & Hill, 1984), and as a consequence
selection on the proportion macropterous will cause a
shift in trait values within morphs (Fairbairn & Roff,
1990; Fairbairn, 1994). Such shifts in the macropterous
morph were observed in fecundity (Roff, 1994c), and in
rates of ¯ight muscle histolysis and ¯ight propensity
(Fairbairn & Roff, 1990), providing evidence against the
dichotomy hypothesis. On the other hand, the asymme-
try of the fecundity response suggests that we must
incorporate a nonlinearity into the model possibly due to
a nonlinear relationship between muscle size, wing
morph and fecundity. It can be shown (see Appendix)
that such a model can produce an asymmetrical corre-
lated response in fecundity when direct selection is
applied to wing morph but a symmetrical correlated
response in the liability when direct selection is applied
to fecundity. Given this potential complexity it is essen-
tial to measure the correlated response of macroptery to
selection on fecundity.
Materials and methods
Organism and experimental protocol
Gryllus ®rmus is a relatively large (»0.7 g) wing-dimorphic
cricket that typically inhabits sandy sites along the
eastern seaboard of the United States (Alexander, 1968;
Harrison, 1985). The individuals used in the present
experiment were from a stock culture that originated
from »20 males and 20 females collected in northern
Florida in 1981. The stock culture is maintained with a
standing adult population of several hundred individuals.
To prevent diapause the temperature is maintained in
excess of 25 °C. Nymphs and adults in both the stock and
the selection experiments were fed Purina rabbit chow.
The selection protocol followed a standard mass selec-
tion design with two lines selected for increased fecun-
dity, two lines selected for decreased fecundity and four
control lines. The `high fecundity' and `low fecundity'
selection experiments were initiated at different times
and followed slightly different protocols, the most
important difference being in the de®nition of fecundity
in the two experiments. From previous experiments
(Roff, 1994c; Roff et al., 1997) it has been shown that
total fecundity, measured as eggs laid in the ®rst week
after eclosion plus the fully formed eggs in the ovaries,
has a higher heritability and is more normally distributed
than the number of eggs laid. We therefore selected on
total fecundity in the following manner. Adult females
were separated into individual cages, each with a mate,
food, water and an oviposition dish, and the number of
eggs laid in the ®rst 7 days post eclosion measured. The
females were then killed and the number of eggs in the
ovaries counted. The eggs laid by the 25 females with the
highest total fecundity were used to form the next
generation, each female contributing the same number
of offspring.
The above protocol could not be followed when
selecting for reduced fecundity because in this case the
required females typically did not lay any eggs in the ®rst
week after eclosion, and thus had to be retained for
several weeks to obtain the required eggs. For the low
fecundity lines we therefore selected on eggs laid in the
®rst week, the 25 females laying the lowest number of
eggs being used as parents of the next generation.
Because of the different protocols the experiment is not
strictly a bidirectional selection experiment: to avoid
confusion we shall refer to the high fecundity line as
`high total fecundity line' and the low fecundity line as
`low eggs laid line'
To initiate the `high total fecundity' experiment 25 adult
females were chosen haphazardly from the stock culture
and from each female 32 nymphs obtained. The 800
nymphs were distributed among 16 cages, each cage
receiving two nymphs from each female (giving 50
nymphs per cage): this generation is designated as gener-
Evolution of threshold traits 537
J . E V O L . B I O L . 1 2 ( 1 9 9 9 ) 5 3 5 ± 5 4 6 ã 1 9 9 9 B L A C K W E L L S C I E N C E L T D
ation 1. Upon ®nal eclosion, 100 ®rst-generation females
were selected at random and the 25 females with the
highest fecundity were used to initiate two high total
fecundity selection lines. Each female contributed 24
nymphs to each of the two selection lines, these lines being
thereafter treated independently. In each subsequent
generation the fecundities of 100 randomly selected
females in each line were measured and the 25 females
with the highest fecundities selected as parents for the
next generation. A minimum of 12 cages per line were
used for each generation, each female contributing
equally to each cage (50 nymphs per cage). Two control
lines were established using the same protocol as above
except that females to be used as parents were selected at
random. Due to an error the total fecundities of the two
control lines were not measured in the second generation.
The low eggs laid selection experiment followed the
above protocol except that the two replicates (selection
line and control line) were initiated 3 weeks apart. In this
case each control line can be matched with a particular
selection line. Because counting eggs alone is much less
labour intensive than measuring total fecundity it was
possible to count the eggs laid by all adult females. We
still selected the lowest 25 females which meant that in
some generations the selection intensity was modestly
higher than that used in the high total fecundity
selection experiment.
Statistical analyses
There are three primary questions to be addressed: (1) Is
there a direct response to selection? (2) What is the
realized heritability of fecundity? (3) Is there a signi®cant
correlated response of wing morph frequency for both the
high fecundity and low eggs laid selection experiments?
To address the ®rst question we used two approaches.
First, we used ANCOVAANCOVA to analyse the change in fecundity
over the generations of selection. To remove changes not
directly associated with selection we subtracted the
control means from the selected lines. In the case of
the high total fecundity lines, because there is not a one
to one match between control and selected lines, we
subtracted the average of the two control lines
F�i;j � Fi;j ÿ�x1;j � �x2;j
2
� ��1�
where F�i;j is the adjusted mean total fecundity of the ith
selected line (i � 1,2) in the jth generation, Fi,j is the
mean total fecundity of the ith selected line in the jth
generation, and xk,j is the mean fecundity of the kth
control line (k � 1, 2) in generation j. Because of a lack
of the correction for the control line, generation 2 was
excluded from the analysis of the high total fecundity
lines. For the low eggs laid line the adjusted fecundity
was calculated by subtracting the mean value of the
appropriate control line.
The second method of testing for a direct response to
selection consisted of comparing the fecundity of control
and selected-line females in the ®nal generation. For the
high total fecundity experiment we gave each line a
unique designator and then tested for signi®cant varia-
tion among the means with a one-way ANOVAANOVA, following
this with a Tukey HSD multiple comparison test to locate
the sources of variation. For the low eggs laid selection
experiment we used a two-way ANOVAANOVA because control
and selected lines could be paired.
We estimated the realized heritability as twice the slope
of the regression forced through zero of the adjusted
response on the adjusted cumulative selection differential
(the slope is multiplied by two because selection is applied
only to females). In the high total fecundity line we
included the second generation by making the conserva-
tive assumption that there was no change in total
fecundity in the selected lines. The standard error of the
heritability was estimated using the formula given by Hill
(1972) which takes into account drift,
Var�h2� � 6
t�t � 1��2t � 1�Scum
t
� �ÿ2
2t2 � 2t � 1
5Var�drift� � Var�error�
� �where (2)
Var�drift� � h2VP1ÿ h2
N� 1
L
� �Var�error� � VP
1ÿ h2
M� h2
K
� �where L and N are the effective number of parents used
per generation in the control and selected lines (= twice
the number of actual individuals, because each female
contributes the same number of offspring), respectively;
K and M are the effective number of individuals
measured per generation in the control and selected
lines, respectively; t is the number of generations of
selection; VP is the phenotypic variance; Scum is the
adjusted cumulative selection differential.
As a second method of estimating the standard error
we computed the standard error using the estimates of
realized heritability from the two selection lines
(Falconer, 1989, p. 211):
Var�h2� � 1
2
Xi�2
i�1
h2i ÿ
h21 � h2
2
2
� �2
: �3�
To analyse the correlated response of wing morph
frequency we used the proportion of macropterous
females per cage as individual data points. The correlated
response should be measured as the change in the
liability, which can be estimated as the abscissa of the
standard normal curve corresponding to the observed
proportion macroptery (Roff, 1994c). However, in some
cases the proportion macroptery was zero, precluding the
use of this transformation. For the purposes of testing for
538 D. A. ROFF ET AL .
J . E V O L . B I O L . 1 2 ( 1 9 9 9 ) 5 3 5 ± 5 4 6 ã 1 9 9 9 B L A C K W E L L S C I E N C E L T D

a deviation between control and expected lines we
therefore used the arcsine square-root transformation
of the individual proportions. This procedure is valid for
testing the deviation but gives only a crude measure of
the actual shift in the liability.
We tested for a change in proportion macroptery as a
function of treatment (selected or control) and genera-
tion. Because there is a nonlinear relationship between
the value of the liability and the observed proportion we
could not adjust the values in the selected lines by
subtracting the control line values. Instead, after ®nding
no signi®cant variation between replicate lines within
each experiment, we used the mean transformed values
per generation, Ptrans, in the covariance model,
Ptrans � c0 � c1t � c2TREAT � c3�t��TREAT� � error �4�where t is generation, TREAT is a categorical variable
designating treatment (selected or control), and c0, . . ., c3
are ®tted constants.
Results
Direct response to selection
In both the high total fecundity and low eggs laid lines
there was a clear deviation from the control lines in the
direction expected as a result of selection (Fig. 1). The
ANCOVAANCOVA analysis indicated that there was no signi®cant
interaction (F1,6 � 1.71, P � 0.24, and F1,4 � 0.18,
P � 0.70, for the high total fecundity and low eggs laid
lines, respectively), no signi®cant effect attributable to
replicate (F1,7 � 0.83, P � 0.39, and F1,5 � 3.37,
P � 0.13, respectively), but a highly signi®cant change
in fecundity with generation (F1,7 � 15.3, P � 0.0058
and F1,5 � 16.4, P � 0.0098, respectively: note that the
analysis is sequential, the additive terms being tested
after deletion of the nonsigni®cant interaction terms).
One-way analysis of variance of total fecundity in the
last generation of the high total fecundity selection
experiment indicated highly signi®cant variation among
lines (F3,386 � 46.47, P < 0.00005). The Tukey test
showed no signi®cant difference between the two control
lines (P � 0.99), but all other comparisons were highly
signi®cant (P < 0.001). Two-way analysis of variance of
fecundity in the last generation of the low eggs laid
selection experiment gave a nonsigni®cant interaction
(P � 0.93) between replicate and treatment (control vs.
selected), but signi®cant effects due to both treatment
(F1,394 � 20.44, P < 0.00005) and replicate (F1,394 �6.25, P � 0.0128). The two foregoing analyses indicate
that selection was successful in changing fecundity in the
direction intended.
Estimation of the realized heritability
The realized heritabilities of total fecundity in the high
total fecundity selection experiment and eggs laid in the
low eggs laid experiment were similar, ranging from 0.14
to 0.34, and were all signi®cant (Table 1). Statistical
difference between the estimates from the two replicate
lines was tested using the model
R � c0Scum � c1REP�Scum � error �5�where R is the response, Scum is the cumulative selection
differential, REP is a variable designating the replicate
line (coded as 0,1), and c0, c1 are ®tted constants. For the
reason given earlier (see Materials and methods) the
equation is forced through the origin and hence there is
no constant or additive term for REP in the above
equation. A signi®cant interaction would indicate that
the heritability estimates (� 2 ´ Slope) are signi®cantly
different. In neither experiment was the interaction term
signi®cant (for the high total fecundity experiment,
F1,8 � 1.86, P � 0.21; for the low eggs laid experiment,
F1,4 � 5.66, P � 0.08). The heritabilities from the
combined analysis are very similar to the averaged values
and both regressions are highly signi®cant (Table 1).
Correlated response of wing morph frequency
The proportion of macropterous females decreased in
lines selected for high total fecundity and increased in the
Fig. 1 Direct response to selection for increased total fecundity (top
panel) and decreased number of eggs laid (bottom panel) in G. ®rmus.
Solid line: selected lines; dashed lines: control lines.
Evolution of threshold traits 539
J . E V O L . B I O L . 1 2 ( 1 9 9 9 ) 5 3 5 ± 5 4 6 ã 1 9 9 9 B L A C K W E L L S C I E N C E L T D

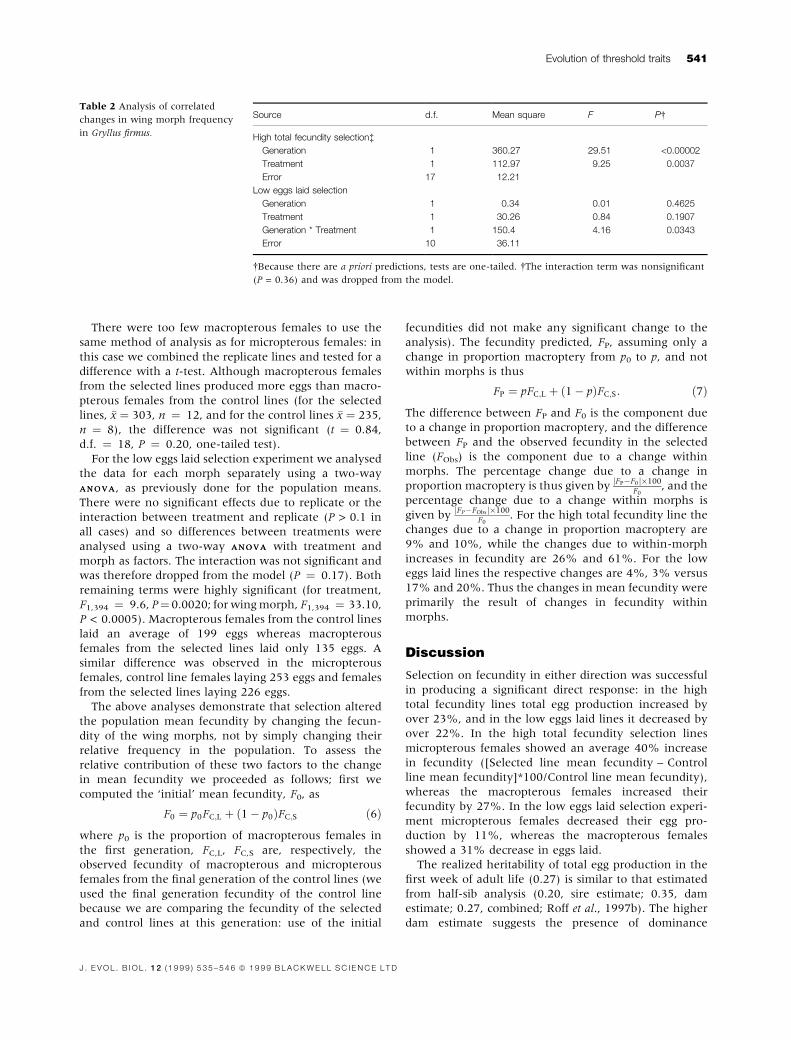
lines selected for low eggs laid (Fig. 2). In the high total
fecundity experiment there was a signi®cant decline in
proportion macroptery over the course of selection and a
signi®cant difference between control and selected line
but there was no signi®cant interaction (Table 2). Thus
the control line differed signi®cantly from the selected
line but this difference did not increase over generations,
as expected. The lack of a signi®cant interaction in the
high total fecundity experiment is a consequence of the
decline in the control line (Fig. 2). This generational
change in the control line makes interpretation of the
results ambiguous, although the signi®cant treatment
effect does suggest that there was at least a small
correlated response
There was a signi®cant interaction between treatment
and generation in the low eggs laid selection experiment
(Table 2) indicating, as would be expected, that the
control and selected lines diverged in the proportion
macropterous.
Is the change in fecundity a consequence of a changein proportion macroptery?
A change in the mean fecundity in the selected lines
could be the result of two processes: response in
fecundity within wing morphs, and/or a change in the
proportion of macropterous females. To assess the rela-
tive importance of these two processes we examined
fecundity in the ®nal generation and changes in fecun-
dity within morphs over the generations. Both analyses
gave the same qualitative answer and we present only
the analyses based on the ®nal generation.
We tested for variation among micropterous females in
the high total fecundity selection experiment in the same
manner as for total fecundity (one-way ANOVAANOVA, followed
by a Tukey test). In the two control lines micropterous
females produced an average of 323 and 329 eggs, whereas
the micropterous females from the selected lines produced
413 and 511 eggs. As with total fecundity, there is highly
signi®cant variation among groups (F3,363 � 48.04,
P < 0.00005), no difference between the control lines
(P � 0.94), and highly signi®cant differences between all
other pair-wise comparisons (P < 0.0004).
Table 1 Realized heritability estimates of fecundity in Gryllus ®rmus.
Type of selection Replicate Heritability Standard error* P
High total fecundity 1 0.2 0.05 (0.04) 0.006
2 0.34 0.06 (0.09) 0.0097
averageà 0.27 0.07 ±
combined§ 0.27 0.06 (0.05) 0.0003
Low eggs laid 1 0.14 0.04 (0.03) 0.0233
2 0.30 0.06 (0.06) 0.0206
averageà 0.22 0.08 ±
combined§ 0.20 0.05 (0.05) 0.0035
*The standard error outside the parentheses was calculated using the formula of Hill (1972), that inside the parentheses is that obtained directly
from the regression. Probabilities are one-tailed. àThe average heritability is the mean of the two realized heritability estimates with the
standard error estimate estimated using eqn 3. §Estimate made by using both replicates in the same regression. The standard error estimated
using the Hill (1972) formula was based on the mean values from the two replicate lines.
Fig. 2 Correlated response of proportion macroptery to direct
response to selection for increased total fecundity (top panel) and
decreased number of eggs laid (bottom panel) in G. ®rmus. Solid line:
selected lines; dashed lines: control lines.
540 D. A. ROFF ET AL .
J . E V O L . B I O L . 1 2 ( 1 9 9 9 ) 5 3 5 ± 5 4 6 ã 1 9 9 9 B L A C K W E L L S C I E N C E L T D
There were too few macropterous females to use the
same method of analysis as for micropterous females: in
this case we combined the replicate lines and tested for a
difference with a t-test. Although macropterous females
from the selected lines produced more eggs than macro-
pterous females from the control lines (for the selected
lines, �x � 303, n � 12, and for the control lines �x � 235,
n � 8), the difference was not signi®cant (t � 0.84,
d.f. � 18, P � 0.20, one-tailed test).
For the low eggs laid selection experiment we analysed
the data for each morph separately using a two-way
ANOVAANOVA, as previously done for the population means.
There were no signi®cant effects due to replicate or the
interaction between treatment and replicate (P > 0.1 in
all cases) and so differences between treatments were
analysed using a two-way ANOVAANOVA with treatment and
morph as factors. The interaction was not signi®cant and
was therefore dropped from the model (P � 0.17). Both
remaining terms were highly signi®cant (for treatment,
F1,394 � 9.6, P� 0.0020; for wing morph, F1,394 � 33.10,
P < 0.0005). Macropterous females from the control lines
laid an average of 199 eggs whereas macropterous
females from the selected lines laid only 135 eggs. A
similar difference was observed in the micropterous
females, control line females laying 253 eggs and females
from the selected lines laying 226 eggs.
The above analyses demonstrate that selection altered
the population mean fecundity by changing the fecun-
dity of the wing morphs, not by simply changing their
relative frequency in the population. To assess the
relative contribution of these two factors to the change
in mean fecundity we proceeded as follows; ®rst we
computed the `initial' mean fecundity, F0, as
F0 � p0FC;L � �1ÿ p0�FC;S �6�where p0 is the proportion of macropterous females in
the ®rst generation, FC,L, FC,S are, respectively, the
observed fecundity of macropterous and micropterous
females from the ®nal generation of the control lines (we
used the ®nal generation fecundity of the control line
because we are comparing the fecundity of the selected
and control lines at this generation: use of the initial
fecundities did not make any signi®cant change to the
analysis). The fecundity predicted, FP, assuming only a
change in proportion macroptery from p0 to p, and not
within morphs is thus
FP � pFC;L � �1ÿ p�FC;S: �7�The difference between FP and F0 is the component due
to a change in proportion macroptery, and the difference
between FP and the observed fecundity in the selected
line (FObs) is the component due to a change within
morphs. The percentage change due to a change in
proportion macroptery is thus given by jFPÿF0 j�100F0
, and the
percentage change due to a change within morphs is
given byjFPÿFObsj�100
F0. For the high total fecundity line the
changes due to a change in proportion macroptery are
9% and 10%, while the changes due to within-morph
increases in fecundity are 26% and 61%. For the low
eggs laid lines the respective changes are 4%, 3% versus
17% and 20%. Thus the changes in mean fecundity were
primarily the result of changes in fecundity within
morphs.
Discussion
Selection on fecundity in either direction was successful
in producing a signi®cant direct response: in the high
total fecundity lines total egg production increased by
over 23%, and in the low eggs laid lines it decreased by
over 22%. In the high total fecundity selection lines
micropterous females showed an average 40% increase
in fecundity ([Selected line mean fecundity ± Control
line mean fecundity]*100/Control line mean fecundity),
whereas the macropterous females increased their
fecundity by 27%. In the low eggs laid selection experi-
ment micropterous females decreased their egg pro-
duction by 11%, whereas the macropterous females
showed a 31% decrease in eggs laid.
The realized heritability of total egg production in the
®rst week of adult life (0.27) is similar to that estimated
from half-sib analysis (0.20, sire estimate; 0.35, dam
estimate; 0.27, combined; Roff et al., 1997b). The higher
dam estimate suggests the presence of dominance
Table 2 Analysis of correlated
changes in wing morph frequency
in Gryllus ®rmus.
Source d.f. Mean square F P
High total fecundity selectionà
Generation 1 360.27 29.51 <0.00002
Treatment 1 112.97 9.25 0.0037
Error 17 12.21
Low eggs laid selection
Generation 1 0.34 0.01 0.4625
Treatment 1 30.26 0.84 0.1907
Generation * Treatment 1 150.4 4.16 0.0343
Error 10 36.11
Because there are a priori predictions, tests are one-tailed. The interaction term was nonsigni®cant
(P = 0.36) and was dropped from the model.
Evolution of threshold traits 541
J . E V O L . B I O L . 1 2 ( 1 9 9 9 ) 5 3 5 ± 5 4 6 ã 1 9 9 9 B L A C K W E L L S C I E N C E L T D
variance, which has been con®rmed by the observation
of considerable inbreeding depression in fecundity (Roff,
1998). An earlier full-sib estimate of total egg production
gave a higher value (0.65, SE � 0.16; Roff, 1994c). Full-
sib estimates of heritability contain in their numerator
one half of the dominance variance; after correcting for
this using the half-sib analysis, the narrow sense herita-
bility of fecundity is 0.47. This is larger than the present
estimate, but given the con®dence limits (0.15±0.39 for
the realized heritability and 0.15±0.79 for the corrected
full-sib estimate) the difference is not statistically signi-
®cant.
Analysis of half-sib data for eggs laid in the ®rst week
gave a low sire estimate (0.07, SE � 0.08) and a low
dam estimate (0.18, SE � 0.10; unpublished data). The
large standard errors do not permit an assessment of
nonadditive effects, but the similarity between the
realized heritability (0.20) and dam estimate (0.18)
argues for primarily additive genetic variance.
In both selection experiments there was a correlated
response in the proportion of macropterous females. The
extent of the correlated response can be estimated using
the standard formulae (Falconer, 1989)
RF � ih2F
�������VPF
p
CRM � irGhMhF
������������������VPM=VPF
p �8�
where RF is the direct response of selection on fecun-
dity, i is the intensity of selection, h2F is the heritability
of fecundity, h2M is the heritability of wing morphology
(= heritability of the liability), VPF is the phenotypic
variance of fecundity, VPM is the phenotypic variance of
wing morph, which by de®nition equals 1 (Roff,
1994c), CRM is the correlated response of wing morph
(on the underlying scale), and rG is the additive genetic
correlation between fecundity and wing morph. Rear-
ranging the above to eliminate the intensity of selection
gives
CRM � rGRFhM
hF
���������VPM
VPF
r: �9�
The above equation gives the change in the liability from
which the change in the proportion macroptery is readily
calculated using the standard normal distribution.
To calculate the predicted correlated change in pro-
portion macroptery using the above equation we used
the realized heritability estimates of fecundity and the
phenotypic variances in fecundity from the control line
females. We obtained all other estimates from a half-sib
analysis (Roff et al., 1997; unpublished data). For the
high total fecundity experiment the proportion of mac-
ropterous females is predicted to change from its initial
value of 0.30 to 0.08. The observed values (0.04 and
0.02) are similar to that predicted but the decrease in the
control lines confounds the comparison. For the low eggs
laid lines the predicted changes are (initial ! ®nal,
observed): line 1, 0.19! 0.32, 0.36; line 2, 0.37! 0.49,
0.56. The predicted changes slightly underestimate the
observed.
To analyse changes over a larger range in fecundity
changes we calculated the predicted change in propor-
tion macropterous for a change in total fecundity from 50
to 600 eggs and for eggs laid from 50 to 400 eggs (Fig. 3).
Selection for a change in fecundity can dramatically alter
the proportion of macropterous females in the popula-
tion: for example, a change in total fecundity from the
observed value of 343 eggs to 50 eggs is predicted to
increase the proportion of macropterous females from
30% to 96%, while a decline to 50 eggs laid shifts the
proportion macropterous to »70% macroptery (Fig. 3).
The observed changes in proportion macroptery tend to
be somewhat greater than predicted but show the same
general trend (Fig. 3).
Because of the genetic and phenotypic correlation
between trait values, the mean values of fecundity
within morphs cannot be computed directly from the
above equations. To obtain these values we modi®ed the
model given in Roff & Preziosi (1994), correcting the
output to the appropriate scale. For each predicted
fecundity±morph combination we generated 5000 indi-
viduals using the algorithm,
Xi � lx � ax;i
����������1
2h2
M
r� bx;i
�������������������1ÿ 1
2h2
M
rY �i � rGax;i
���������1
2h2
F
r� ay;i
�������������������������1
2�1ÿ r2
A�h2F
r� rEbx;i
�����������������1ÿ 1
2h2
F
r� by;i
�������������������������������������1ÿ 1
2h2
F��1ÿ r2E
ÿ �qYi �Y �i
��������VPF
p � ly
�10�
where:
Xi is the liability for the ith individual. The threshold
value is set at 1 and the mean value in the initial
population set such that the proportion of macropterous
females, p, is the same as that observed. The threshold
value remains constant but the mean liability, lx,
changes as a result of selection. If individual i exceeds
the threshold then it is designated a macropterous
morph, otherwise it is the micropterous morph.
Yi is the value of the fecundity for the ith individual.
ax,i, ay,i, bx,i and by,i are random standard normal values,
N(0,1),
ly is the mean value of fecundity in the population after
selection,
rE is the environmental correlation, given by
rE �rP ÿ 1
2rG
�����������h2
Mh2F
p������������������������������������������1ÿ 1
2h2
M��1ÿ 12
h2F�
q �11�
where rP is the phenotypic correlation.
As found from the statistical comparisons of fecundity
within morphs, as the mean population fecundity (total
or eggs laid) changes then so also does fecundity within
542 D. A. ROFF ET AL .
J . E V O L . B I O L . 1 2 ( 1 9 9 9 ) 5 3 5 ± 5 4 6 ã 1 9 9 9 B L A C K W E L L S C I E N C E L T D

each morph, the difference in fecundity remaining
approximately constant (Fig. 3; in the case of total
fecundity the lines tend to diverge at extreme fecundi-
ties). Because the relative ®tness of each morph is equal
to the ratio of their fecundities (other life history
components being kept constant), a constant difference
implies a changing relative ®tness (Fig. 4). For a fecun-
dity greater than 250 eggs the relative SW ®tness
(micropterous fecundity/macropterous fecundity) is
»1.4, but increases markedly below 250 eggs (Fig. 4).
Thus selection on fecundity will change proportion
macroptery by two processes: ®rstly, there will be a
correlated response and secondly, the relative ®tness of
the two morphs itself changes with the mean fecundity.
The latter process will be particularly strong when
fecundity is less than 250 eggs.
There are important differences between the correlated
responses observed for selection acting directly on pro-
portion macroptery versus selection acting directly on
fecundity. In the ®rst case direct selection produced a
direct response in the proportion macroptery but only a
statistically signi®cant correlated response in the fecun-
dity of one morph (macropterous females: Roff, 1994c).
Selection on fecundity, however, produced direct
responses in fecundity within both wing morphs and a
correlated change in the proportion macroptery (present
paper). This difference in correlated responses can be
accounted for by a model that incorporates a nonlinear
pattern of resource allocation between the two wing
morphs (see Appendix). Speci®cally it is postulated that
Fig. 3 Predicted (solid symbols) and observed (open symbols) direct and correlated responses to selection on fecundity. The x-axis shows the
fecundity after selection, the initial fecundity being set at that observed in the selection experiments.
Fig. 4 Relative ®tness of micropterous females as a function of the
fecundity (total eggs or eggs laid: the two different symbols for the
latter refer to the two replicates from the selection experiment) after
selection, the initial fecundity being set at that observed in the
selection experiments. Fitness is calculated as SW/LW (�micro-
pterous fecundity/macropterous fecundity), where the fecundities
are as shown in Fig. 3.
Evolution of threshold traits 543
J . E V O L . B I O L . 1 2 ( 1 9 9 9 ) 5 3 5 ± 5 4 6 ã 1 9 9 9 B L A C K W E L L S C I E N C E L T D

there is a trade-off between the maintenance of ¯ight
muscles and egg production: because micropterous
females almost always have only very small ¯ight
muscles their fecundity cannot be radically changed by
changing the age schedule of ¯ight muscle histolysis as
can and does occur in macropterous females (Fairbairn &
Roff, 1990; Roff, 1994c). However, a change in the
fecundity of the macropterous morph as a result of
selection on macroptery will produce a change in the
fecundity of the micropterous morph because it will
change the relative ®tnesses of the two morphs (Roff,
1994c). To understand the evolutionary dynamics of
fecundity and wing morph requires a model that directly
incorporates the functional architecture and the chang-
ing trade-off relationship. These results reinforce the
conclusion reached by Riska (1986, 1989) and Houle
(1991) that the analysis of functional architecture is
important for an understanding of quantitative genetic
variation and its relation to evolutionary change.
Acknowledgments
This work was supported by a NSERC collaborative grant
to D.A.R and D.J.F. We are grateful to K. Doohrendorf
and M. Cayer for their invaluable technical assistance.
References
Alexander, R.D. 1968. Life cycles, specialization and related
phenomena in crickets. Quart. Rev. Biol. 43: 1±41.
den Boer, P.J. 1970. On the signi®cance of dispersal power for
populations of carabid-beetles (Coleoptera, Carabidae). Oeco-
logia 4: 1±25.
den Boer, P.J. 1979. The signi®cance of dispersal power for the
survival of species, with special reference to the carabid
beetles in a cultivated countryside. Fortschr. Zool. 25: 79±94.
den Boer, P.J., Van Huizen, T.H.P., den Boer-Daanje, W.,
Aukema, B. & den Bieman, C.F.M. 1979. Wing polymor-
phism and dimorphism in ground beetles as stages in an
evolutionary process (Coleoptera: Carabidae). Ent. Generalis
6: 107±134.
Crnokrak, P. & Roff, D.A. 1995. Fitness differences associated
with calling behaviour in the two wing morphs of male sand
crickets, Gryllus ®rmus. Anim. Behav. 50: 1475±1481.
Denno, R.F., Roderick, G.K., Olmstead, K.L. & Dobel, H.G. 1991.
Density-related migration in planthoppers (Homoptera: Del-
phacidae): the role of habitat persistence. Am. Nat. 138: 1513±
1541.
Dingle, H. 1985. Migration. In: Comprehensive Insect Physiology,
Biochemistry and Pharmacology, Vol. 9, Behaviour (G. A. Kerkut
& L. I. Gilbert, eds), pp. 375±415. Pergamon Press, New York.
Fairbairn, D.J. 1986. Does alary polymorphism imply dispersal
dimorphism in the waterstrider, Gerris remigis? Ecol. Ent. 11:
355±368.
Fairbairn, D.J. 1994. Wing dimorphism and the migratory
syndrome: correlated traits for migratory tendency in wing
dimorphic insects. Res. Popul. Ecol. 36: 157±163.
Fairbairn, D.J. & Preziosi, R. 1996. Sexual selection and the
evolution of sexual dimorphism in the waterstrider, Aquarius
remigis. Evolution 50: 1501±1511.
Fairbairn, D.J. & Roff, D.A. 1990. Genetic correlations among
traits determining migratory tendency in the sand cricket,
Gryllus ®rmus. Evolution 44: 1787±1795.
Falconer, D.S. 1989. Introduction to Quantitative Genetics. Long-
mans, New York.
Harrison, R.G. 1985. Barriers to gene exchange between closely
related cricket species. II. Life cycle variation and temporal
isolation. Evolution 39: 244±259.
Hill, W.G. 1972. Estimation of realized heritabilities from
selection experiments. II. Selection in one direction. Biometrics
28: 767±780.
Houle, D. 1991. Genetic covariance of ®tness correlates: what
genetic correlations are made of and why it matters. Evolution
45: 630±648.
Lively, C.M. 1986. Predator-induced shell dimorphism in the
acorn barnacle Chthamalus anisopoma. Evolution 40: 232±
242.
Mercer, J.T. & Hill, W.G. 1984. Estimation of genetic parameters
for skeletal defects in broiler chickens. Heredity 53: 193±203.
Moran, N. 1992. The evolutionary maintenance of alternative
phenotypes. Am. Nat. 139: 971±989.
Mousseau, T.A. & Roff, D.A. 1987. Natural selection and the
heritability of ®tness components. Heredity 59: 181±198.
Pfennig, D.W. 1992. Polyphenism in spadefoot toad tadpoles as a
locally adjusted evolutionarily stable strategy. Evolution 46:
1408±1420.
Reznick, D. 1985. Costs of reproduction: an evaluation of the
empirical evidence. Oikos 44: 257±267.
Riska, B. 1986. Some models for development, growth and
morphometric correlation. Evolution 40: 1303±1311.
Riska, B. 1989. Composite traits, selection response and evolu-
tion. Evolution 43: 1172±1191.
Roff, D.A. 1984. The cost of being able to ¯y: a study of wing
polymorphism in two species of crickets. Oecologia 63: 30±
37.
Roff, D.A. 1986. The evolution of wing dimorphism in insects.
Evolution 40: 1009±1020.
Roff, D.A. 1989. Exaptation and the evolution of dealation in
insects. J. Evol. Biol. 2: 109±123.
Roff, D.A. 1990a. The evolution of ¯ightlessness in insects. Ecol.
Monogr. 60: 389±421.
Roff, D.A. 1990b. Selection for changes in the incidence of wing
dimorphism in Gryllus ®rmus. Heredity 65: 163±168.
Roff, D.A. 1992. The Evolution of Life Histories: Theory and Analysis.
Chapman & Hall, New York.
Roff, D.A. 1994a. The evolution of ¯ightlessness: is history
important ? Evol. Ecol. 8: 639±657.
Roff, D.A. 1994b. Habitat persistence and the evolution of wing
dimorphism in insects. Am. Nat. 144: 772±798.
Roff, D.A. 1994c. Evidence that the magnitude of the trade-off in
a dichotomous trait is frequency dependent. Evolution 48:
1650±1656.
Roff, D.A. 1996. The evolution of threshold traits in animals.
Quart Rev. Biol. 71: 3±35.
Roff, D.A. 1997. Evolutionary Quantitative Genetics. Chapman &
Hall, New York.
Roff, D.A. 1998a. Evolution of threshold traits: the balance
between directional selection, drift and mutation. Heredity 80:
25±32.
Roff, D.A. 1998b. Effects of inbreeding on morphological and life
history traits of the sand cricket, Gryllus ®rmus. Heredity 81:
28±37.
544 D. A. ROFF ET AL .
J . E V O L . B I O L . 1 2 ( 1 9 9 9 ) 5 3 5 ± 5 4 6 ã 1 9 9 9 B L A C K W E L L S C I E N C E L T D

Roff, D.A. & Bradford, M.J. 1996. Quantitative genetics of the
trade-off between fecundity and wing dimorphism in the
cricket Allonemobius socius. Heredity 76: 178±185.
Roff, D.A. & Fairbairn, D.J. 1991. Wing dimorphisms and the
evolution of migratory polymorphisms among the insecta.
Am. Zool. 31: 243±251.
Roff, D.A. & Mousseau, T.A. 1987. Quantitative genetics and
®tness: lessons from Drosophila. Heredity 58: 103±118.
Roff, D.A. & Preziosi, R. 1994. The estimation of the genetic
correlation: the use of the jackknife. Heredity 73: 544±548.
Roff, D.A., Stirling, G. & Fairbairn, D.J. 1997. The evolution of
threshold traits: a quantitative genetic analysis of the phys-
iological and life history correlates of wing dimorphism in the
sand cricket. Evolution 51: 1910±1919.
Rowell, G.A. & Cade, W.H. 1993. Simulation of alternative male
reproductive behavior: calling and satellite behavior in ®eld
crickets. Ecol. Model. 65: 265±280.
Sokal, R.R. & Rohlf, F.J. 1995. Biometry. W.H. Freeman and Co.,
San Francisco.
Stearns, S.C. 1992. The Evolution of Life Histories. Oxford Univer-
sity Press, New York.
Weigensberg, I. & Roff, D.A. 1996. Natural heritabilities: Can
they be reliably estimated in the laboratory. Evolution 50:
2149±2157.
Zera, A.J. & Denno, R.F. 1997. Physiology and ecology of
dispersal polymorphism in insects. Ann. Rev. Entomol. 42: 207±
230.
Zera, A.J., Sall, J. & Grudzinski, K. 1997. Flight-muscle
polymorphism in the cricket Gryllus ®rmus: muscle character-
istics and their in¯uence on the evolution of ¯ightlessness.
Physiol. Zool. 70: 519±529.
Received 17 February 1998; revised 3 June 1998; accepted 25 June 1998
Appendix
The following model demonstrates how differences in
correlated responses can arise when one of the compo-
nent traits is a threshold trait. We shall use wing
dimorphism and fecundity as example traits.
Fecundity is assumed to be in¯uenced in two ways by
pleiotropic effects of the liability genes: one effect is
directly due to the liability genes, and corresponds to the
usual genetic correlation between traits. A second effect
is due to the `competition' for resources between the
¯ight muscles and the gonads. In the latter case the
pleiotropic effects of the liability genes are produced via
the threshold response, because the effect will be felt
almost solely in the macropterous females, micropterous
females having no or very small muscles (Roff, 1989;
Fairbairn & Roff, 1990; Zera et al., 1997). For simplicity of
discussion we shall assume that the two pleiotropic
effects are uncorrelated. Fecundity can now be decom-
posed into two components
F � X ÿ A �A1�where X is the fecundity component that is correlated
with liability alone and A is the fecundity lost from
allocation to ¯ight muscle maintenance. Assuming,
without loss of generality, that macropterous females
are those that lie above the threshold (large liabilities),
the genetic correlation between the liability and X is
negative, whereas the genetic correlation between the
liability and A is positive (i.e. large liabilities lead to
increased commitment to maintenance of ¯ight muscles
and hence reduced fecundity).
First consider selection on proportion macroptery: the
correlated response of fecundity is given by
CRF � iM�������VPF
phM hXrMX � hArMA� � �A2�
where VPF is the phenotypic variance in fecundity, rMX
is the genetic correlation between X and the liability
(macroptery), and rMA is the genetic correlation be-
tween A and the liability. Now if the product hXrMX is
small, the correlated response in fecundity will come
about primarily by a change in allocation: consequently
the correlated change in fecundity will occur primarily
in macropterous females, as has been observed (see
Introduction).
To predict the correlated responses to selection on
fecundity we must consider the correlations between the
components of fecundity and fecundity itself. The prob-
lem is one of part-whole correlation (Sokal & Rohlf,
1995). Under the assumption of no correlation between
X and A we have
rFX ������������������
VX
VX � VA
r; rFA � ÿ
�����������������VA
VX � VA
r�A3�
and the genetic correlation between the liability and
fecundity is
rMF � CovMX � CovMA������������������������������������VAX � VAA�VAM
p �A4�
where Cov designates the covariance between the liability
(M) and the two fecundity components (X, A). The direct
response to selection on fecundity is given by
RF � iFVAX � VAA
VPX � VPA
���������������������VPX � VPA
p: �A5�
And the correlated responses are
CRX � iF
����������������������VAX
VAX � VAA
rhXhF
��������VPX
p
CRA � iF
����������������������VAA
VAX � VAA
rhAhF
��������VPA
p
CRM � iFCovMX � CovMA������������������������������������VAX � VAA�VAM
p hMhF
���������VPM
p �A6�
For direct selection on fecundity to alter fecundity
within morphs we require a large correlated response in
X. Recall that the product hXrMX is small: for the
correlated response in X, CRX, to be large we require hX
to be relatively large. Therefore, rMX must be small,
which requires CovMX to be small and/or VAX to be large.
The magnitude of CovMX does not affect CRX while the
Evolution of threshold traits 545
J . E V O L . B I O L . 1 2 ( 1 9 9 9 ) 5 3 5 ± 5 4 6 ã 1 9 9 9 B L A C K W E L L S C I E N C E L T D
effect of an increase in VAX on CRX depends on the value
of VAX relative to VAA. The correlated response in
allocation also does not depend on CovMX and could be
large or small independently of the correlated response
in X.
Finally, we must consider the correlated response of
macroptery to selection on fecundity. Even if, as sug-
gested above, CovMX is small the correlated response in
macroptery can be large if CovMA is large.
Thus if the genetic covariance between the liability and
the fecundity component correlated directly with the
liability (CovMX) is small then (i) direct selection on
proportion macroptery will produce a change in macro-
ptery and a correlated response in fecundity primarily in
the macropterous morph, and (ii) direct selection on
fecundity will produce a direct response in fecundity in
both morphs and a correlated response in proportion
macroptery.
546 D. A. ROFF ET AL .
J . E V O L . B I O L . 1 2 ( 1 9 9 9 ) 5 3 5 ± 5 4 6 ã 1 9 9 9 B L A C K W E L L S C I E N C E L T D