the evolution of the spanish agriculture during the 20th ... · book (2009) considers the history...
TRANSCRIPT

Draft version for this Conference use only. Do not quote without author’s permission.
The evolution of the Spanish agriculture during the 20th century from the point of view of biophysical macro magnitudes.
Manuel González de Molina (UPO)
David Soto
(UPO) ([email protected])
Juan Infante (UPO)
Gloria I. Guzmán (UPO)
Guiomar Carranza Gallego
(UPO) ([email protected])
Eduardo Aguilera
(UPO) ([email protected])
Roberto García Ruiz
(Universidad de Jaén) ([email protected])
_____________________________________________________________________________
Abstract: For decades the history of Spanish agriculture has been interpreted from a backwardness perspective. This idea arose comparing the cereals and other crop yields to those obtained in the countries of northern Europe. But recent studies have refuted this interpretation, giving rise to a new one. The quantitative Economic History has played a central role in these interpretations. Nevertheless our knowledge of evolution in physical term during the 20th century still is fragmentary, since the new narrative has been focused in monetary issues, and our knowledge of key economic indicators for the first half of the twentieth century is still insufficient. This paper tries to address both problems by reconstructing the main figures of Spanish agriculture during the whole twentieth century from a physical point of view. Our study on agrarian statistics enables a more precise and critical evaluation of their reliability by contrasting data with the physical possibilities of the Spanish agro-ecosystems and the caloric requirements of its population or livestock. It allows in addition correcting some problematic data (e.g. cattle censuses) and offering new estimations for data not provided by the statistics (residues, pastures, forest products). Our analysis in physical terms offers relevant information for reinterpret some myths of the Spanish historiography as the role of trade, the successful process of industrialization or the cattle specialization, as well as the impact of the civil war and the autarchy in the agrarian sector.
_____________________________________________________________________________
Old and New Worlds: the Global Challenges of Rural History | International Conference, Lisbon, ISCTE-IUL, 27-30 January 2016
2
1. Introduction
The more recent Spanish historiography has given rise to an optimistic interpretation of Spain’s agrarian past, tending to position itself at the opposite side of the traditional interpretation (Pujol et al., 2001; Robledo, 2010). The new narrative is in line with the main theses of Federico’s world... book (2009) considers the history of the Spanish agriculture to be an “outstanding success story”. Production grew faster than the population, as opposed to what had happened in the 19th century. This made nutritional transition easier, putting an end to the traditional lacks in the consumption of meat and dairy, and significantly improving the standard of living of citizens. The increase in volume of agrarian production put an end to the problems of hunger and subsistence, so frequent in the past.
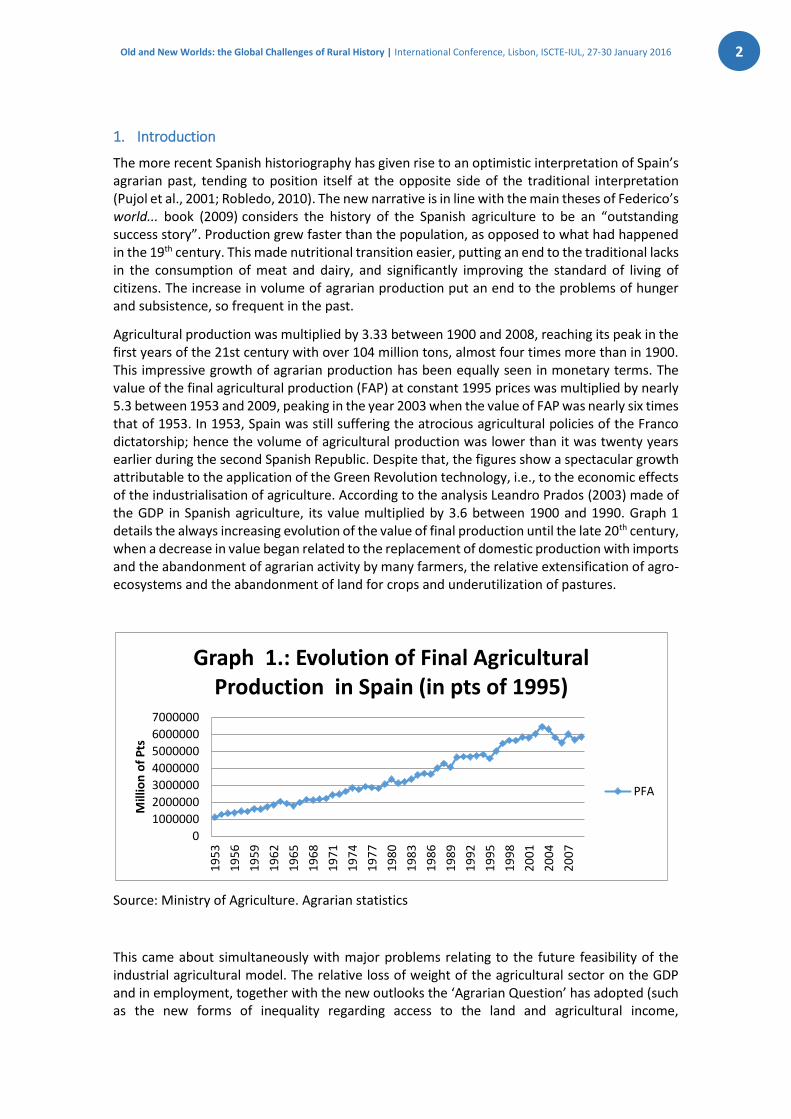
Agricultural production was multiplied by 3.33 between 1900 and 2008, reaching its peak in the first years of the 21st century with over 104 million tons, almost four times more than in 1900. This impressive growth of agrarian production has been equally seen in monetary terms. The value of the final agricultural production (FAP) at constant 1995 prices was multiplied by nearly 5.3 between 1953 and 2009, peaking in the year 2003 when the value of FAP was nearly six times that of 1953. In 1953, Spain was still suffering the atrocious agricultural policies of the Franco dictatorship; hence the volume of agricultural production was lower than it was twenty years earlier during the second Spanish Republic. Despite that, the figures show a spectacular growth attributable to the application of the Green Revolution technology, i.e., to the economic effects of the industrialisation of agriculture. According to the analysis Leandro Prados (2003) made of the GDP in Spanish agriculture, its value multiplied by 3.6 between 1900 and 1990. Graph 1 details the always increasing evolution of the value of final production until the late 20th century, when a decrease in value began related to the replacement of domestic production with imports and the abandonment of agrarian activity by many farmers, the relative extensification of agro-ecosystems and the abandonment of land for crops and underutilization of pastures.
Source: Ministry of Agriculture. Agrarian statistics
This came about simultaneously with major problems relating to the future feasibility of the industrial agricultural model. The relative loss of weight of the agricultural sector on the GDP and in employment, together with the new outlooks the ‘Agrarian Question’ has adopted (such as the new forms of inequality regarding access to the land and agricultural income,
0
1000000
2000000
3000000
4000000
5000000
6000000
7000000
19
53
19
56
19
59
19
62
19
65
19
68
19
71
19
74
19
77
19
80
19
83
19
86
19
89
19
92
19
95
19
98
20
01
20
04
20
07
Mill
ion
of
Pts
Graph 1.: Evolution of Final Agricultural Production in Spain (in pts of 1995)
PFA

Old and New Worlds: the Global Challenges of Rural History | International Conference, Lisbon, ISCTE-IUL, 27-30 January 2016
3
environmental problems, the rethinking of the role of agriculture in economic development in each country, etc.) question this optimistic vision. But it may be the global food crisis in which we are immersed, epiphenomenon of the global economic crisis, which is challenging the very foundations of industrial agriculture and its claim to being the overall unique model of material welfare1.
These inherent problems to industrial agriculture model should lead us to a less complacent attitude regarding the industrialisation process and its virtues, considering not only the growing increase in land and labour productivity, but bringing into light how it has been done and to what costs as well. This text attempts to provide a panoramic view of the evolution of the Spanish agrarian sector from 1900 to the present from a biophysical point of view, providing a more diverse picture of agricultural industrialization process throughout the twentieth century.
2. Methods and data sources
From a biophysical perspective, the evolution of Spanish agriculture offers a positive, yet much more nuanced, view and offers more realistic explanations of the growth of agrarian production in developed countries. To draw up a series on 20th century Spanish agriculture from a biophysical perspective, we used the methodology of Social Metabolism (González de Molina & Toledo, 2014) and more specifically the methodology of balances of materials (MFA, Material Flow Accounting) (Schandl et al., 2002; Giljum, 2006; Risku-Norjaa, H. Mäenpää, 2007), but adapted to the agrarian sector, taking into account some suggestions made by Giampietro (2003) and Ramos et al. (2009). All the collected data have been processed according with the last developments of using this methodology by Krausmann et al. (2008), Muñoz et al. (2009), and especially by Fischer-Kowalski et al. (2011).
The study of the evolution of Spanish agriculture requires the collection and treatment of wide-ranging quantitative information. It was only in the late 19th century, after isolated and generally unsuccessful attempts, that the Administration, through the Junta Consultiva Agronómica, began to compile statistical information on the surface performances and production of different crops. Annual production series are available of the production of plant biomass –cereals, legumes, grape, and olive– beginning in the late nineteenth century (GEHR, 1991) and until the 1930s, but data about total agricultural production is only available from 1922, and disaggregated per year from 1929 (Junta Consultiva Agronómica, 1920; Ministerio de Fomento, 1923, MAPA, 1933-1952). We also have the most significant information for 1902 products (MAPA, 1902, s.a, 1905, Miniterio de Fomento, 1892). Previously, the missing information was reconstructed from complementary sources, namely the annual memoirs published about assorted topics by the Junta Consultiva Agronómica (Ministerio de Fomento, 1912, 1913, 1914 and 1915). Thus, the Spanish agricultural production has been estimated for three moments: 1900, 1910, and 1922. From 1929, annual series of agricultural production have been published –since 1929 in the Anuarios Estadísticos de las Producciones Agrícolas and since 1972 in the Anuarios de Estadística Agraria. Also considered were five-year averages with centres in the years 1933, 1940, 1950, 1960, 1970, 1980, 1990, 2000, and 2008. Also using five-year averages, the exports and imports of biomass were calculated from foreign trade sources (Consejo de la Economía Nacional, 1925-2008). From such sources, the quantity and evolution of biomass of the Spanish economy were calculated.
For the biophysical data we have also considered all crop residues with some sort of use (mostly for livestock), like straw and chaff, browse and shoots or residue from tubers and vegetables. For straw, browse and shoots we have used information from sources of the time and for the rest of the residues we have used the converters provided by the literature, and which we 1 See the comprehensive report by United Nations Conference on Trade and Development UNCADT, 2013) or that published three years earlier by the United Nations Environment Programme (UNEP, 2010).
Old and New Worlds: the Global Challenges of Rural History | International Conference, Lisbon, ISCTE-IUL, 27-30 January 2016
4
compiled in the working paper Methodology and Conversion Factors to Estimate the Net Primary Productivity of Historical and Contemporary Agro-ecosystems ( Guzmán et al., 2014). From the reconstructions of soil use based on the same sources we have also calculated the production of pastures and fallow. For wood and fuel wood we used our own calculations and those of Iñaqui Iriarte and Isabel Ayuda (2008).
We used the livestock censuses to reconstruct production in this subsector. For this we used data on meat and milk production from the Anuarios Estadísticos de las Producciones Agrícolas of the 1930s, applying the coefficient for the previous censuses. For the production of fertilizer, fodder for livestock and the average weight of the different species we have applied converters created using the livestock advance of 1891 and the livestock report of 1917. One of the methodological advantages of the biophysical approach is that it allows different problems in the sources to be detected and corrected. Indeed the unreliability of livestock statistics is a recurring element in Spanish agrarian historiography. Most authors have highlighted the unreliability and the overall underestimation of livestock censuses (GEHR, 1991; García Sanz, 1994; Domínguez, 1995; Soto Fernández, 2006). However, no attempts have been made to support this underestimation or provide elements to correct it from a biophysical perspective. By cross-referencing the food needs of the livestock, the agricultural demands of animal labour and the availability of feed for livestock, we have concluded that the underestimation of the types of livestock is true of the livestock censuses from the start of the 20th century (which correspond to the first two cuts) but not for the 1920s and 1930s. Therefore, we recalculated the livestock for 1900 and 1910 based on the labour needs (labour livestock) and food availability (income livestock), also recalculating livestock production.
3. The agricultural growth from a biophysical point of view
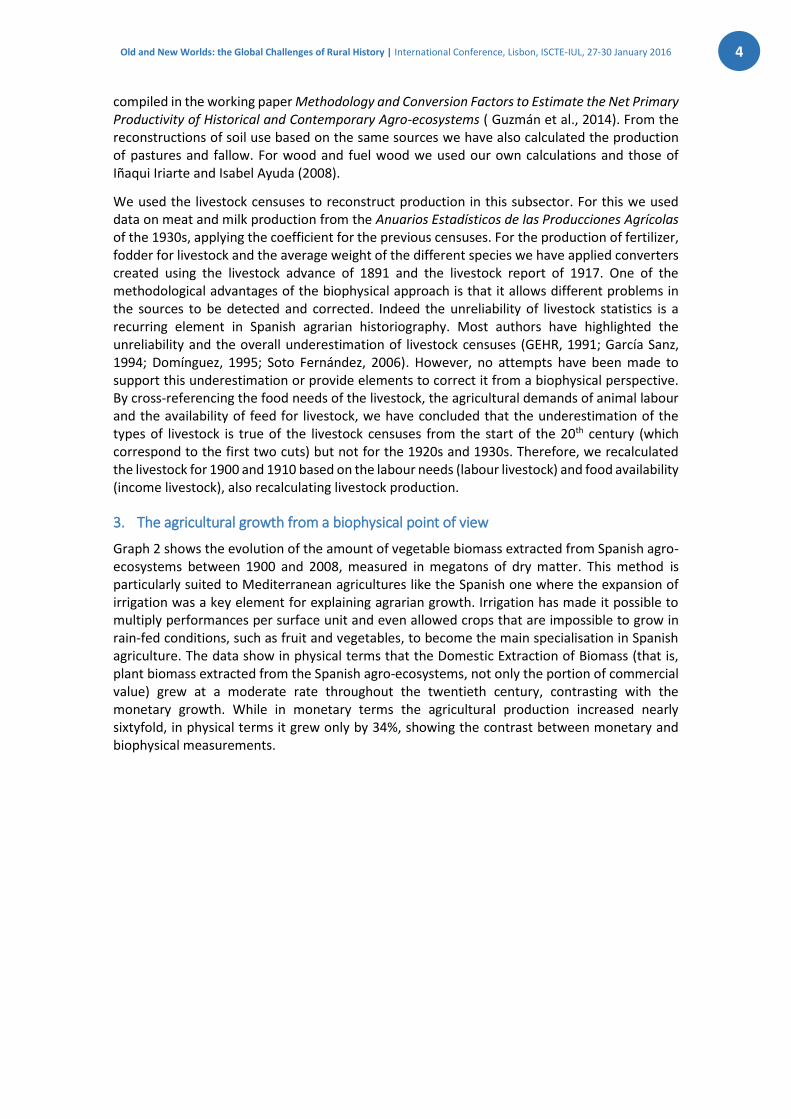
Graph 2 shows the evolution of the amount of vegetable biomass extracted from Spanish agro-ecosystems between 1900 and 2008, measured in megatons of dry matter. This method is particularly suited to Mediterranean agricultures like the Spanish one where the expansion of irrigation was a key element for explaining agrarian growth. Irrigation has made it possible to multiply performances per surface unit and even allowed crops that are impossible to grow in rain-fed conditions, such as fruit and vegetables, to become the main specialisation in Spanish agriculture. The data show in physical terms that the Domestic Extraction of Biomass (that is, plant biomass extracted from the Spanish agro-ecosystems, not only the portion of commercial value) grew at a moderate rate throughout the twentieth century, contrasting with the monetary growth. While in monetary terms the agricultural production increased nearly sixtyfold, in physical terms it grew only by 34%, showing the contrast between monetary and biophysical measurements.

Old and New Worlds: the Global Challenges of Rural History | International Conference, Lisbon, ISCTE-IUL, 27-30 January 2016
5
Table 1 Basic data of biomass production in Spanish agriculture, 1900-2008
(Megatons of dry matter)
1900 1933 1950 1970 1990 2008
Vegetal biomass
Current NPP * D E** Primary crops Crop residues Grazed biomass Woodlands Imports Exports DMC***
123 50 11 13 14 11
1 0
50
132 61 17 16 17 11
1 0
61
132 61 14 14 23 11
1 0
62
147 57 25 18
6 8 5 1
60
159 63 36 15
5 8
14 5
72
171 67 38 13
8 9
32 13 86
DMC Vegetal Biomass
Food Feed Seeds Wood and Fuelwood Raw Materials
4.4 27.8
0.6 16.3
0.7
6.4 36.7
1.0 16.2
1.0
5.1 39.0
0.7 16.00.7
7.7 36.0
1.1 14.5
1.1
10.9 40.7
1.2 16.9
1.9
11.7 50.8
1.7 18.1
4.1
DMC Animal Biomass
Food Raw Materials
0.33 0.03
0.54 0.05
0.52 0.06
1.54 0.15
3.15 0.24
4.05 0.36
Source: Soto et al., 2014 * Net Primary Productivity **Domestic Extraction *** Domestic Material Consumption
In fact, the evolution of the Spanish agriculture during the last century can be considered as a process of growing commoditization of production and of the factors that make it possible. The technological and productive efforts were oriented towards maximising the portion of biomass having higher market value and mobility, reducing the multifunctionality of crops. As shown in Table 1, the Domestic Extraction of Crops grew considerably between 1900 and 2008 (by 353%),
0
10
20
30
40
50
60
70
80
1900 1910 1922 1933 1940 1950 1960 1970 1980 1990 2000 2008
Mt
dm
Graph 2 Spain Evolution ofDomestic Extraction
Wood and firewood
Grazed Biomass
Crop Residues
Primary Crops
Old and New Worlds: the Global Challenges of Rural History | International Conference, Lisbon, ISCTE-IUL, 27-30 January 2016
6
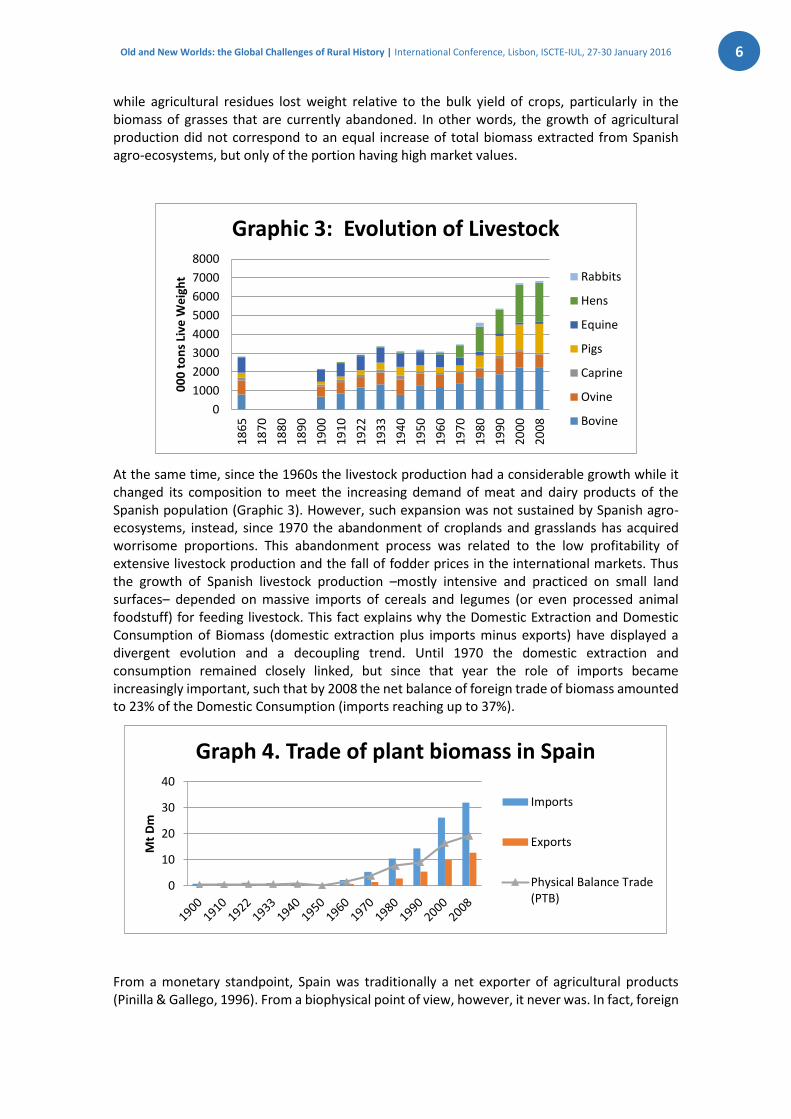
while agricultural residues lost weight relative to the bulk yield of crops, particularly in the biomass of grasses that are currently abandoned. In other words, the growth of agricultural production did not correspond to an equal increase of total biomass extracted from Spanish agro-ecosystems, but only of the portion having high market values.
At the same time, since the 1960s the livestock production had a considerable growth while it changed its composition to meet the increasing demand of meat and dairy products of the Spanish population (Graphic 3). However, such expansion was not sustained by Spanish agro-ecosystems, instead, since 1970 the abandonment of croplands and grasslands has acquired worrisome proportions. This abandonment process was related to the low profitability of extensive livestock production and the fall of fodder prices in the international markets. Thus the growth of Spanish livestock production –mostly intensive and practiced on small land surfaces– depended on massive imports of cereals and legumes (or even processed animal foodstuff) for feeding livestock. This fact explains why the Domestic Extraction and Domestic Consumption of Biomass (domestic extraction plus imports minus exports) have displayed a divergent evolution and a decoupling trend. Until 1970 the domestic extraction and consumption remained closely linked, but since that year the role of imports became increasingly important, such that by 2008 the net balance of foreign trade of biomass amounted to 23% of the Domestic Consumption (imports reaching up to 37%).
From a monetary standpoint, Spain was traditionally a net exporter of agricultural products (Pinilla & Gallego, 1996). From a biophysical point of view, however, it never was. In fact, foreign
0
1000
2000
3000
4000
5000
6000
7000
8000
18
65
18
70
18
80
18
90
19
00
19
10
19
22
19
33
19
40
19
50
19
60
19
70
19
80
19
90
20
00
20
08
00
0 t
on
s Li
ve W
eig
ht
Graphic 3: Evolution of Livestock
Rabbits
Hens
Equine
Pigs
Caprine
Ovine
Bovine
0
10
20
30
40
Mt
Dm
Graph 4. Trade of plant biomass in Spain
Imports
Exports
Physical Balance Trade(PTB)
Old and New Worlds: the Global Challenges of Rural History | International Conference, Lisbon, ISCTE-IUL, 27-30 January 2016
7
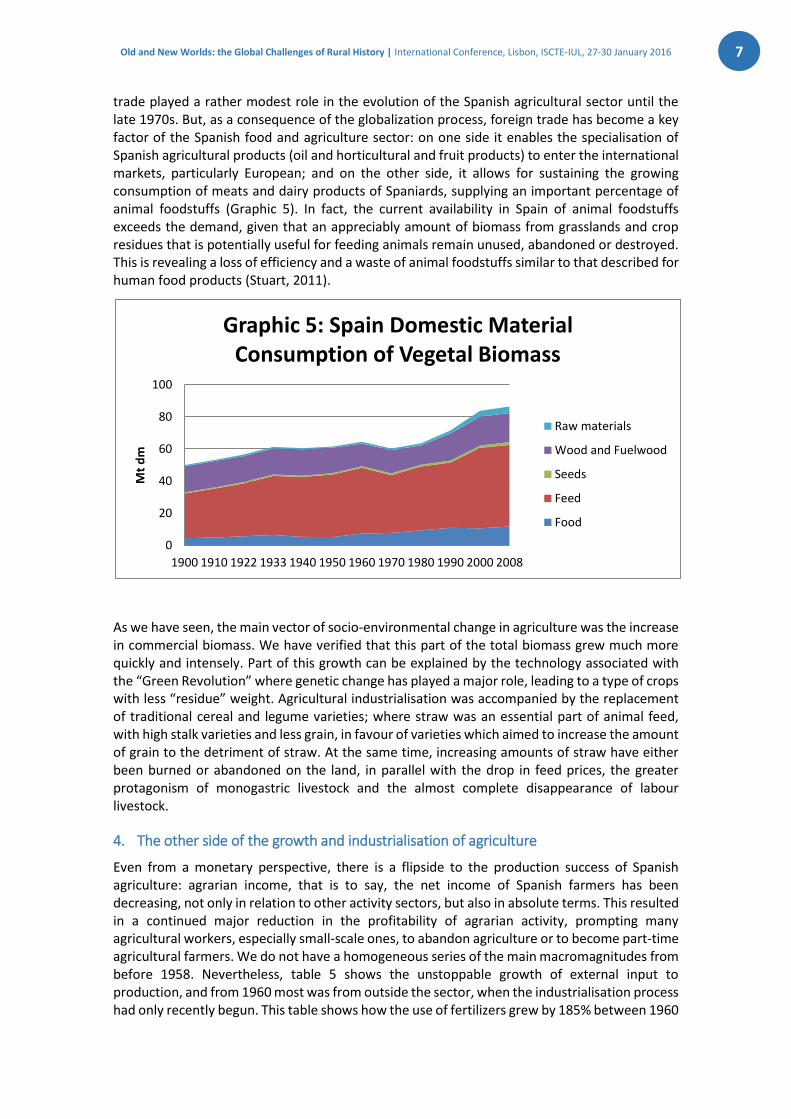
trade played a rather modest role in the evolution of the Spanish agricultural sector until the late 1970s. But, as a consequence of the globalization process, foreign trade has become a key factor of the Spanish food and agriculture sector: on one side it enables the specialisation of Spanish agricultural products (oil and horticultural and fruit products) to enter the international markets, particularly European; and on the other side, it allows for sustaining the growing consumption of meats and dairy products of Spaniards, supplying an important percentage of animal foodstuffs (Graphic 5). In fact, the current availability in Spain of animal foodstuffs exceeds the demand, given that an appreciably amount of biomass from grasslands and crop residues that is potentially useful for feeding animals remain unused, abandoned or destroyed. This is revealing a loss of efficiency and a waste of animal foodstuffs similar to that described for human food products (Stuart, 2011).
As we have seen, the main vector of socio-environmental change in agriculture was the increase in commercial biomass. We have verified that this part of the total biomass grew much more quickly and intensely. Part of this growth can be explained by the technology associated with the “Green Revolution” where genetic change has played a major role, leading to a type of crops with less “residue” weight. Agricultural industrialisation was accompanied by the replacement of traditional cereal and legume varieties; where straw was an essential part of animal feed, with high stalk varieties and less grain, in favour of varieties which aimed to increase the amount of grain to the detriment of straw. At the same time, increasing amounts of straw have either been burned or abandoned on the land, in parallel with the drop in feed prices, the greater protagonism of monogastric livestock and the almost complete disappearance of labour livestock.
4. The other side of the growth and industrialisation of agriculture
Even from a monetary perspective, there is a flipside to the production success of Spanish agriculture: agrarian income, that is to say, the net income of Spanish farmers has been decreasing, not only in relation to other activity sectors, but also in absolute terms. This resulted in a continued major reduction in the profitability of agrarian activity, prompting many agricultural workers, especially small-scale ones, to abandon agriculture or to become part-time agricultural farmers. We do not have a homogeneous series of the main macromagnitudes from before 1958. Nevertheless, table 5 shows the unstoppable growth of external input to production, and from 1960 most was from outside the sector, when the industrialisation process had only recently begun. This table shows how the use of fertilizers grew by 185% between 1960
0
20
40
60
80
100
1900 1910 1922 1933 1940 1950 1960 1970 1980 1990 2000 2008
Mt
dm
Graphic 5: Spain Domestic Material Consumption of Vegetal Biomass
Raw materials
Wood and Fuelwood
Seeds
Feed
Food

Old and New Worlds: the Global Challenges of Rural History | International Conference, Lisbon, ISCTE-IUL, 27-30 January 2016
8
and 1985, and how by 2010 this growth had become more moderate due to the results of the economic and financial crisis. The yields per unit area increased thanks to the addition of higher amounts of chemical fertilizers, especially in irrigated lands and in the territories which used new seed varieties, both hybrid and improved. The most immediate effect of the application of this land-saving technology was not only the possibility of using these varieties, far more productive than traditional ones in optimum nutrient and water supply conditions, but it also put an end to the rotations imposed by traditional farming to adapt to the scarcity of both factors. This is how monoculture progressed, with the alternation of crops determined by the demands of agrarian markets, rather than by agronomic rationality. The consequent reduction in biodiversity encouraged the appearance of plagues and plant illnesses and the use of phytosanitary products, which had been quite limited until then. The application of this type of chemical remedy caused a vicious circle in which breaking the trophic chains (the disappearance of beneficial insects which controlled insect plagues is the result of insecticide use), along with advances in crops and homogeneous varieties in large expanses of land, brought about the growing use of these substances to control plagues and illnesses. This explains the fact that the use of phytosanitary products was multiplied by 21 between 1960 and 2010, as there has been no proportional increase in yields per unit of area or land cultivated.
Table 2 Evolution of the use of input in Spanish agriculture (1960-2010)
1960 1985 2010
Fertilizers
[tons]
599,279 1,709,533 1,593,451
Nitrogen Phosphorus Potassium
242,824 287,147
69,308
942,293 463,340 303,900
940,984 337,825 314,642
Machinery
[Thousands]
64,137 949,371 1,389,606
Tractors Cultivators Harvesters
56,845 2,273 5,019
633,210 271,058
45,103
1,049,950 280,515
59,141
Insecticides
[tons]
4,146 74,450 89,161
Insecticides Herbicides Fungicides Others
2,395 254
1,311 187
29,347 21,212 14,235
9,655
27,802 26,895 19,955 14,510
Final energy consumption
[TJ]
3,621 118,566 90,393
Fuel Electricity
2,519 1,101
109,096 9,470
75,446 14,947
Forced crops
[has]
7,840 90,397 118,401
Mulching Open-air sandy soil Tunnels Fixed installations
4,800 -
1,800 1,240
55,873 8,795 5,469
20,260
47,655 10,259 12,868 47,619
Source: Infante-Amate et al. (2014)
But the most spectacular advance, the most defining for this industrialisation phase, was the mechanisation of most agrarian tasks. The number of tractors was multiplied by 18, cultivators by 123 and the number of harvesters increased from little over five thousand to almost sixty thousand. This began with large farms and cereals and extended to vegetable gardens and greenhouses, affecting practically all the smaller ones. Table 2 does not include irrigation installations or collective and individual infrastructures built to store superficial waters and elevate underground water, one of the keys of industrialisation. We do not have space in this text to refer to this subject, which will be examined at a later stage. Nevertheless, both mechanisation and the provision of irrigation infrastructures caused a significant increase in the

Old and New Worlds: the Global Challenges of Rural History | International Conference, Lisbon, ISCTE-IUL, 27-30 January 2016
9
demand for final energy in the agrarian sector. As can be seen in table 2, fuel consumption was multiplied by 30 and electricity consumption by 13.5.
Finally, it is worth noting how forced cultivation under plastic in its different forms has developed in Spain, mostly greenhouses for growing vegetables and tunnels for fruit production, a reflection of the production specialisation of Spanish agriculture in general. Table 2 details the growth undergone in surfaces devoted to these crops, which went from over 7,200 to almost 12,000 hectares, mainly greenhouses. These surfaces, with various cultivation cycles in the same year, reach high levels of production which have conditioned and contributed to the lowering of the prices received by farmers and further reducing the profitability of open air crops, and especially, production in the rain-fed crops of the inner peninsula.
Graph 6 shows the vast amount of energy from the agrarian sector which had to be injected into the agro-ecosystems to maintain continuous growth in agrarian production. All the input has been reduced to primary energy, that is, energy costs both for manufacturing and for operation and maintenance of the production process, expressed in terajoules. It can therefore be observed that since 1960 the primary energy invested has been multiplied by seven, an increase much higher than that experienced by actual crops. Table 6 breaks down this consumption, showing the relative importance in terms of energy for Spanish agriculture of four inputs: the use of fertilizers, particularly the manufacturing of nitrogen fertilizers, a process which consumes a lot of energy; the consumption of fuel to sustain the stock of agricultural machinery; the electricity, mostly to bring water from underground; and finally, the feed, which consumes the most primary energy, highlighting the focus on intensive livestock farming recorded in the agrarian sector in recent years.
Table 3 Energy consumption of Spanish Agriculture (TJ)
1960 1985 2010
0
50
100
150
200
250
300
350
400
450
500
1960 1985 2010
Others
Seeds
Animal feeding
Electricity
Fuels
Treatments
Machinery
Fertilizers
Graphic 6: Energy consumption of Spanish agriculture

Old and New Worlds: the Global Challenges of Rural History | International Conference, Lisbon, ISCTE-IUL, 27-30 January 2016
10
Fertilizers 27,251 72,426 61,844
N P K
18,773 7,811
667
58,696 10,804
2,927
52,324 6,489 3,030
Machinery 523 9,853 12,008
Phytosanitary prods. 1,265 21,434 24,952
Fuel 3,213 138,927 98,511
Electricity 1,811 27,480 45,766
Feed 9,832 75,100 191,176
Seeds 2,136 286 8,239
Forced crops 220 3,157 6,625
Total 73,502 421,090 510,965
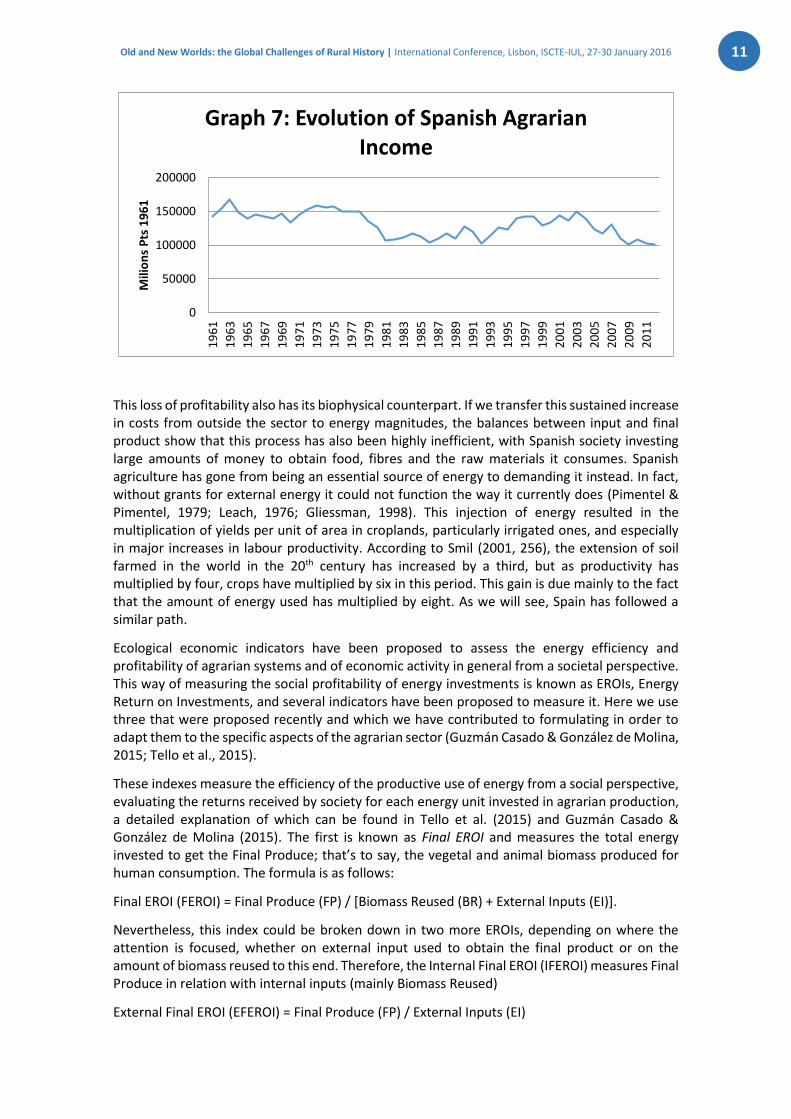
This model, based on the growing use of input from outside the sector has had and continues to have very important economic consequences: the continued increase in costs from outside the sector has made farmers increasingly dependent on markets, has caused a reduction in agrarian income and has destroyed employment in a mad race to save on labour costs in order to compensate for the fall in income. It is extremely difficult to reconstruct the evolution of agrarian income between 1958 and the present, partly due to the continued changes in the accountancy of the statistics service of the Ministry of Agriculture and the habitual continuous corrections in the macromagnitudes of the sector. Nevertheless, we have constructed a provisional series with the data of agrarian income, as they appear in the statistics, ensuring maximum continuity. Despite this several leaps appear, the most important of which took place in the 1990s due to the effects of Spain joining the European Economic Community and the arrival of grants from the Common Agricultural Policy following a period of transition. This series has been deflated using Consumer Price Index data provided by the National Statistics Institute. Graph 7 shows a series expressed in “pesetas” of 1961. As can be observed, agrarian income in real terms has decreased by thirty per cent since 1961, while other branches of activity have continuously increased their income. The fact is that agriculture stopped being profitable some time ago, even with the grants from the Common Agricultural Policy.
From the start of mechanisation, the best way to counteract the fall in agrarian income has been to increase labour productivity by replacing manpower with machines. For example, since 1990 the number of people employed in the agrarian sector has gone from 1,286,000 to 881,000 in 2012, so that the agrarian income per worker employed has gone from 10,699 € to 12,981 in 2012, increasing by 12.45% (Ministry of Agriculture, Food and Environment, consultation from June 2014). This destruction of employment is not new and has been a constant in the sector from the early 20th century. According to the National Institute of Statistics (www.ine.es), the agrarian active population has fallen dramatically to a tenth of that of 1950. At that time it provided almost half of the country’s employment, while in 2010 it provided approximately 4%. Numbers have dropped from almost five million farmers in the early 20th century to under half a million at present, many of whom can only practice agrarian activities on a part-time basis.
Old and New Worlds: the Global Challenges of Rural History | International Conference, Lisbon, ISCTE-IUL, 27-30 January 2016
11
This loss of profitability also has its biophysical counterpart. If we transfer this sustained increase in costs from outside the sector to energy magnitudes, the balances between input and final product show that this process has also been highly inefficient, with Spanish society investing large amounts of money to obtain food, fibres and the raw materials it consumes. Spanish agriculture has gone from being an essential source of energy to demanding it instead. In fact, without grants for external energy it could not function the way it currently does (Pimentel & Pimentel, 1979; Leach, 1976; Gliessman, 1998). This injection of energy resulted in the multiplication of yields per unit of area in croplands, particularly irrigated ones, and especially in major increases in labour productivity. According to Smil (2001, 256), the extension of soil farmed in the world in the 20th century has increased by a third, but as productivity has multiplied by four, crops have multiplied by six in this period. This gain is due mainly to the fact that the amount of energy used has multiplied by eight. As we will see, Spain has followed a similar path.
Ecological economic indicators have been proposed to assess the energy efficiency and profitability of agrarian systems and of economic activity in general from a societal perspective. This way of measuring the social profitability of energy investments is known as EROIs, Energy Return on Investments, and several indicators have been proposed to measure it. Here we use three that were proposed recently and which we have contributed to formulating in order to adapt them to the specific aspects of the agrarian sector (Guzmán Casado & González de Molina, 2015; Tello et al., 2015).
These indexes measure the efficiency of the productive use of energy from a social perspective, evaluating the returns received by society for each energy unit invested in agrarian production, a detailed explanation of which can be found in Tello et al. (2015) and Guzmán Casado & González de Molina (2015). The first is known as Final EROI and measures the total energy invested to get the Final Produce; that’s to say, the vegetal and animal biomass produced for human consumption. The formula is as follows:
Final EROI (FEROI) = Final Produce (FP) / [Biomass Reused (BR) + External Inputs (EI)].
Nevertheless, this index could be broken down in two more EROIs, depending on where the attention is focused, whether on external input used to obtain the final product or on the amount of biomass reused to this end. Therefore, the Internal Final EROI (IFEROI) measures Final Produce in relation with internal inputs (mainly Biomass Reused)
External Final EROI (EFEROI) = Final Produce (FP) / External Inputs (EI)
0
50000
100000
150000
200000
19
61
19
63
19
65
19
67
19
69
19
71
19
73
19
75
19
77
19
79
19
81
19
83
19
85
19
87
19
89
19
91
19
93
19
95
19
97
19
99
20
01
20
03
20
05
20
07
20
09
20
11
Mili
on
s P
ts 1
96
1
Graph 7: Evolution of Spanish Agrarian Income
Old and New Worlds: the Global Challenges of Rural History | International Conference, Lisbon, ISCTE-IUL, 27-30 January 2016
12
and External Final EROI measures the Final Produce in relation with external inputs (mainly, but not always, fossil fuels)
Internal Final EROI (IFEROI) = Final Produce (FP) / Biomass Reused (BR)
We applied these indexes to Spanish agriculture at three key points in its evolution: at the start of the period, when most production was still organic, that is to say, when it only used minimal amounts of artificial phosphoric fertilizers. A second period in the early 1960s when mechanisation, or rather the industrialisation process of Spanish agriculture, had already begun. The final stage takes place in the present when almost all agriculture can be considered to be industrial.
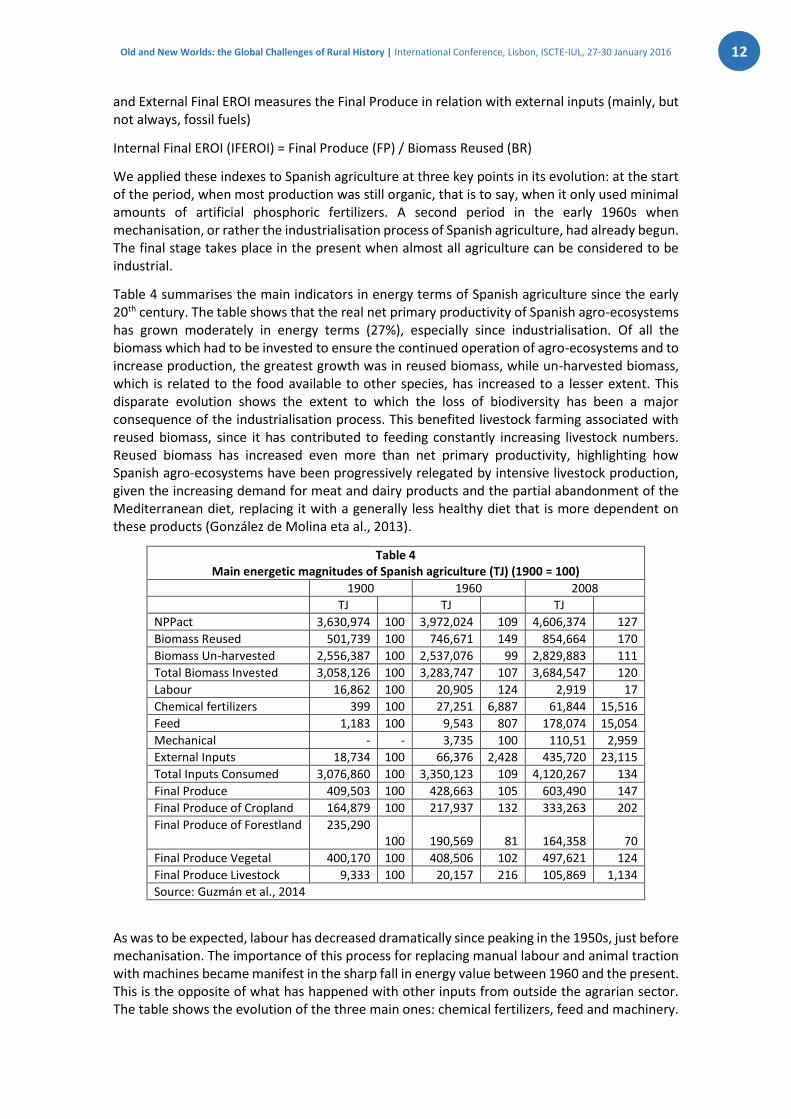
Table 4 summarises the main indicators in energy terms of Spanish agriculture since the early 20th century. The table shows that the real net primary productivity of Spanish agro-ecosystems has grown moderately in energy terms (27%), especially since industrialisation. Of all the biomass which had to be invested to ensure the continued operation of agro-ecosystems and to increase production, the greatest growth was in reused biomass, while un-harvested biomass, which is related to the food available to other species, has increased to a lesser extent. This disparate evolution shows the extent to which the loss of biodiversity has been a major consequence of the industrialisation process. This benefited livestock farming associated with reused biomass, since it has contributed to feeding constantly increasing livestock numbers. Reused biomass has increased even more than net primary productivity, highlighting how Spanish agro-ecosystems have been progressively relegated by intensive livestock production, given the increasing demand for meat and dairy products and the partial abandonment of the Mediterranean diet, replacing it with a generally less healthy diet that is more dependent on these products (González de Molina eta al., 2013).
Table 4 Main energetic magnitudes of Spanish agriculture (TJ) (1900 = 100)
1900 1960 2008
TJ TJ TJ
NPPact 3,630,974 100 3,972,024 109 4,606,374 127
Biomass Reused 501,739 100 746,671 149 854,664 170
Biomass Un-harvested 2,556,387 100 2,537,076 99 2,829,883 111
Total Biomass Invested 3,058,126 100 3,283,747 107 3,684,547 120
Labour 16,862 100 20,905 124 2,919 17
Chemical fertilizers 399 100 27,251 6,887 61,844 15,516
Feed 1,183 100 9,543 807 178,074 15,054
Mechanical - - 3,735 100 110,51 2,959
External Inputs 18,734 100 66,376 2,428 435,720 23,115
Total Inputs Consumed 3,076,860 100 3,350,123 109 4,120,267 134
Final Produce 409,503 100 428,663 105 603,490 147
Final Produce of Cropland 164,879 100 217,937 132 333,263 202
Final Produce of Forestland 235,290 100 190,569 81 164,358 70
Final Produce Vegetal 400,170 100 408,506 102 497,621 124
Final Produce Livestock 9,333 100 20,157 216 105,869 1,134
Source: Guzmán et al., 2014
As was to be expected, labour has decreased dramatically since peaking in the 1950s, just before mechanisation. The importance of this process for replacing manual labour and animal traction with machines became manifest in the sharp fall in energy value between 1960 and the present. This is the opposite of what has happened with other inputs from outside the agrarian sector. The table shows the evolution of the three main ones: chemical fertilizers, feed and machinery.
Old and New Worlds: the Global Challenges of Rural History | International Conference, Lisbon, ISCTE-IUL, 27-30 January 2016
13
Synthetic chemical fertilizers have experienced the highest relative growth although their contribution to external input has not exceeded 14% of the total energy expenditure for 2008. This small percentage ought to be put into relation with a phenomenon characteristic of semi-arid agro-ecosystems like the Mediterranean ones: the lack of rainfall and ensuing limitations, even to the expansion of irrigation systems, means that the application of fertilizers is of limited use in terms of the increase in net primary productivity in the absence of optimal hydric conditions. In terms of energy, the introduction of mechanical technology, developed from the 1960s onwards, has had greater importance, since today it accounts for over a quarter of external energy invested in agrarian production. However, the input which has acquired the greatest importance has been that of animal feed, mainly fodder, which has grown exponentially so that it currently represents 41% of external input. As we will see, this fact, along with the growing importance of reused biomass mentioned earlier, is the main reason for the significant reduction in the efficiency of our ecosystems in biomass production.
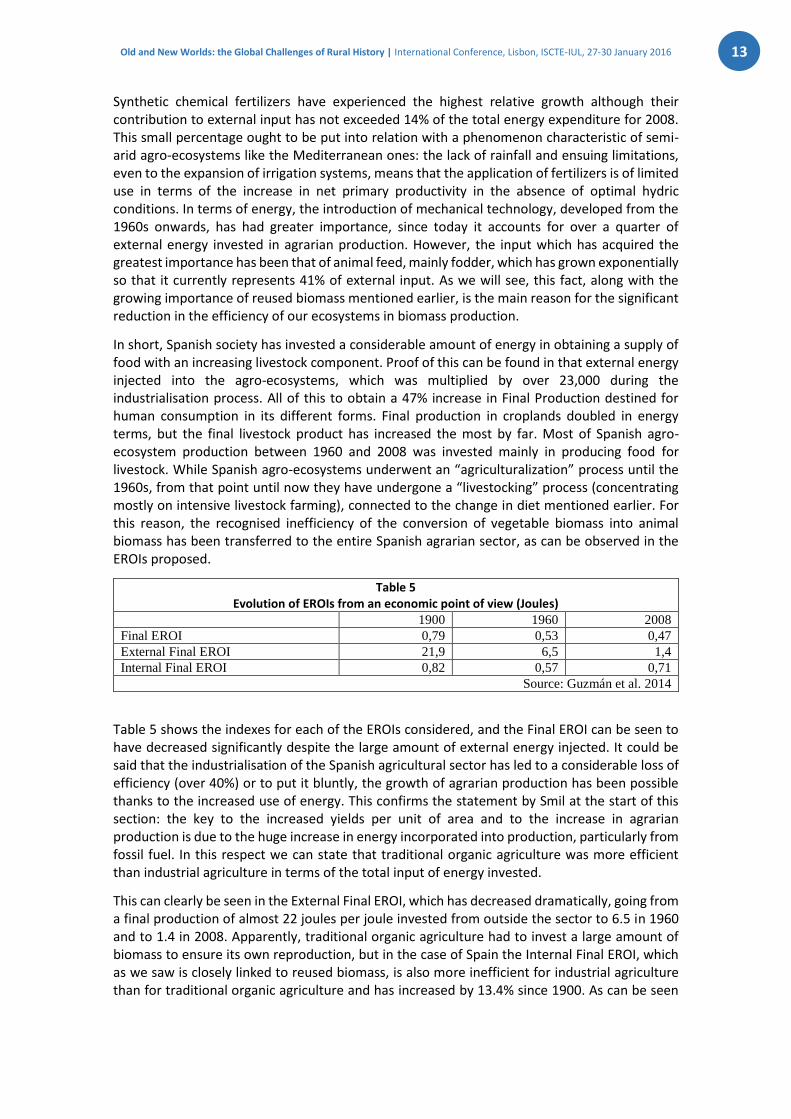
In short, Spanish society has invested a considerable amount of energy in obtaining a supply of food with an increasing livestock component. Proof of this can be found in that external energy injected into the agro-ecosystems, which was multiplied by over 23,000 during the industrialisation process. All of this to obtain a 47% increase in Final Production destined for human consumption in its different forms. Final production in croplands doubled in energy terms, but the final livestock product has increased the most by far. Most of Spanish agro-ecosystem production between 1960 and 2008 was invested mainly in producing food for livestock. While Spanish agro-ecosystems underwent an “agriculturalization” process until the 1960s, from that point until now they have undergone a “livestocking” process (concentrating mostly on intensive livestock farming), connected to the change in diet mentioned earlier. For this reason, the recognised inefficiency of the conversion of vegetable biomass into animal biomass has been transferred to the entire Spanish agrarian sector, as can be observed in the EROIs proposed.
Table 5 Evolution of EROIs from an economic point of view (Joules)
1900 1960 2008
Final EROI 0,79 0,53 0,47
External Final EROI 21,9 6,5 1,4
Internal Final EROI 0,82 0,57 0,71
Source: Guzmán et al. 2014
Table 5 shows the indexes for each of the EROIs considered, and the Final EROI can be seen to have decreased significantly despite the large amount of external energy injected. It could be said that the industrialisation of the Spanish agricultural sector has led to a considerable loss of efficiency (over 40%) or to put it bluntly, the growth of agrarian production has been possible thanks to the increased use of energy. This confirms the statement by Smil at the start of this section: the key to the increased yields per unit of area and to the increase in agrarian production is due to the huge increase in energy incorporated into production, particularly from fossil fuel. In this respect we can state that traditional organic agriculture was more efficient than industrial agriculture in terms of the total input of energy invested.
This can clearly be seen in the External Final EROI, which has decreased dramatically, going from a final production of almost 22 joules per joule invested from outside the sector to 6.5 in 1960 and to 1.4 in 2008. Apparently, traditional organic agriculture had to invest a large amount of biomass to ensure its own reproduction, but in the case of Spain the Internal Final EROI, which as we saw is closely linked to reused biomass, is also more inefficient for industrial agriculture than for traditional organic agriculture and has increased by 13.4% since 1900. As can be seen

Old and New Worlds: the Global Challenges of Rural History | International Conference, Lisbon, ISCTE-IUL, 27-30 January 2016
14
below, this is due to the vast amount of energy that has to be devoted to feeding Spanish livestock.
This loss of efficiency of industrial agriculture compared with traditional organic agriculture may have its origin in three main factors. Firstly, the progressive loss of production capacity undergone by Spanish agro-ecosystems as a result of industrial management itself: high erosion rates (Vanwalleghem et al. 2011), the reduction in organic matter in the soil, the salinization of underground water in some places in Spain, the loss of agrarian biodiversity (MAPA, 1995), etc.. are resulting in increasingly lower amounts of additional biomass being obtained with the same amount of external input. The deterioration of basic assets (soil, water, biodiversity, etc.) provoked by industrial agriculture is taking its toll. Secondly, the great amount of biomass from outside the sector which is being invested in the form of feed for Spanish livestock. In third place, its maintenance, not only requires increasing amounts of external feed but also dedicating increasing agricultural production to feed, increasing the amount of reused biomass considerably. This last result is somewhat unexpected. In theory, given the high territorial cost required to restore fertility and produce the necessary energy for the production process, traditional organic agriculture should be more inefficient than industrial agriculture as regards the investment of internal energy (a more detailed explanation can be found in Guzmán & González de Molina, 2009). The availability of external inputs allows them to save on productive land, that is to say, to reduce the investment of reused biomass. Consequently, the Internal Final EROI and even the Final EROI should be increasing. However, this has not been the case, as the increase in production seen between 1960 and 2008 was mostly invested in feeding the livestock, recognised for its inefficiency in converting energy.
5. Conclusions
In short, Spanish agrarian production has experienced impressive growth during the 20th century which has allowed it to ensure the supply of food to the population and even to transform some crops into important chapters in foreign trade for Spain. However, this growth has had its negative side since it was based on the injection of large amounts of external energy, on the destruction of employment and the loss of profitability of agricultural activity. But perhaps the most serious part is the impact of the current industrialised agriculture model on Spanish agro-ecosystems, exposed to the overexploitation of hydric resources, pollution of the water by nitrates and pesticides (European Commission, 2013), high erosion rates (Gómez & Giráldez, 2008) and an alarming loss of biodiversity (Garrido, 2012). Damage which in the immediate future will end up reducing production capacity. Therefore, the history of Spanish agriculture cannot merely be considered a success story.
REFERENCES
Clar, E., Pinilla, V., Serrano, R. (2014), El comercio agroalimentario español en la segunda globalización, 1951-2011, Documentos de Trabajo de la Asociación de Historia Económica, nº 1414.
Consejo de la Economía Nacional (1925-2008), Estadística General del Comercio exterior de España en 1924, Consejo de la Economía Nacional, Madrid.
Domínguez Martín, R. (1995), La vocación ganadera del norte de España. Del modelo tradicional a los desafíos del mercado mundial, MAPA, Madrid.
European Commission (2013), Report from the commission to the council and the European parliament on the implementation of Council Directive 91/676/EEC concerning the

Old and New Worlds: the Global Challenges of Rural History | International Conference, Lisbon, ISCTE-IUL, 27-30 January 2016
15
protection of waters against pollution caused by nitrates from agricultural sources based on Member State reports for the period 2008–2011. Brussels, 4.10.2013.
Federico, J. (2009), Feeding the world. An Economic History of Agriculture, 1800-2000, Princeton University Press.
Fischer-Kowalski, M., Krausmann, F., Giljum, S., Lutter, S., Mayer, A., Bringezu, S., Moriguchi, Y., Schütz, H., Schandl, H., Weisz, H. (2011), “Methodology and Indicators of Economy-wide Material Flow Accounting. State of the Art and Reliability across Sources”. Journal of Industrial Ecology. 15 (6), 855-875.
García Sanz, A. (1994), “La ganadería española entre 175 y 1865. Los efectos de la reforma agraria liberal”, Agricultura y Sociedad, 72, pp. 81-119.
Garrido, A. (coord.) (2012), Indicadores de sostenibilidad de la agricultura y ganadería españolas. Fundación Cajamar, Almería.
Giljum, S. (2006), “Material Flow-Based Indicators for Evaluation of Eco-Efficiency and Dematerialisation Policies”, in P. Lawn (ed.), Sustainability indicators in Ecological Economics. Edward Elgar, Cheltenham, pp. 376-398.
Gliessman, S.R. (1998), Agroecology. Ecological Processes in Sustainable Agriculture. CRC Press, Boca Raton, 1998.
Gómez, J. A., Giráldez, J. V. (2008), Erosión y degradación de suelos. Consejería de Agricultura y Pesca Junta de Andalucía, Sevilla.
González de Molina, M., Soto, D., Aguilera, E., Infante, J. (2013), “¿Una o varias transiciones? Nuevos datos sobre el consumo alimentario en España (1900-2008)”. XIV Congreso de Historia Agraria (Badajoz, noviembre 2013). Session B.1: La transición nutricional en perspectiva comparada: mitos y realidades. Badajoz, November 7 and 8 2013 (www.seha.info).
González de Molina, M., Soto, D., Aguilera, E., Infante, J. (2014), “Crecimiento agrario en España y cambios en la oferta alimentaria, 1900-1933”. Historia Social, nº. 80, 157-183.
González de Molina, M., Toledo, V. M. (2014) The Social Metabolism. A Socio-ecological Theory of Historical Change. Springer, New York.
M. González de Molina, D. Soto, J. Infante, E. Aguilera (2013), “¿Una o varias transiciones? Nuevos datos sobre el consumo alimentario en España (1900-2008)”. XIV Congreso de Historia Agraria (Badajoz, noviembre 2013). Session B.1: La transición nutricional en perspectiva comparada: mitos y realidades. Badajoz, November 7 and 8 2013 (www.seha.info).
Grupo de Estudios de Historia Rural, Estadísticas Históricas de la producción agraria española, 1859-1935, MAPA, Madrid, 1991.
Guzmán, G., Aguilera, E., Soto, D., Cid, A., Infante, I., García, R., Herrera, A., Villa, I. and González de Molina, M. (2014), Methodology and Conversion Factors to Estimate the Net Primary Productivity of Historical and Contemporary Agro-ecosystems. Working Paper of the SEHA (Spanish Society for Agrarian History), Available at “www. seha. Info”.
Guzmán, G., González de Molina, M. (2009), “Preindustrial agriculture versus organic agriculture. The land cost of sustainability”. Land Use Policy, Vol. 26, 502-510.
Gloria I. Guzmán & Manuel González de Molina (2015) Energy Efficiency in Agrarian Systems From an Agroecological Perspective, Agroecology and Sustainable Food Systems, 39:8, 924-952, DOI: 10.1080/21683565.2015.1053587.
Old and New Worlds: the Global Challenges of Rural History | International Conference, Lisbon, ISCTE-IUL, 27-30 January 2016
16
Infante, I., Aguilera, E., González de Molina, M. (2014), La gran transformación del sector agroalimentario español. Un análisis desde la perspectiva energética. Working Paper from Sociedad Española de Historia Agraria, 14-03.
Infante, J., González de Molina, M. (2013), “‘Sustainable de-growth’ in agriculture and food: an agro-ecological perspective on Spain’s agri-food system (year 2000)”. Journal of Cleaner Production, 38, 27-35.
Iriarte Goñi, I., Ayuda, M. I. (2008), “Wood and industrialization: Evidence and hypotheses from the case of Spain, 1860–1935”, Ecological Economics, 65, pp. 177-186.
J. Infante, J., Soto, D., Iriarte, I., Aguilera, E., Cid, A., Guzmán, G., García, R., and González de Molina, M. (2014), La producción de leña en España y sus implicaciones en la transición energética. Una serie a escala provincial (1900-2000). Working Paper from Asociación Española de Historia Económica DT-AEHE-1415.
J. Ramos, J., Cañellas, S., Giampietro, M., Gamboa, G. (2009), “Catalonia’s energy metabolism: Using the MuSIASEM approach at different scales”. Energy Policy 37, 4658–4671.
Krausmann, F., Erb, K., Gingrich, S., Lauk, C., Haberl, H. (2008), “Global patterns of socioeconomic biomass flows in the year 2000: A comprehensive assessment of supply, consumption and constraints”. Ecological Economics, 65, 471-487.
Krausmann, F., Schandl, H., Sieferle, R. P. (2008), “Socio-ecological regime transition in Austria and United Kingdom”. Ecological Economic Vol. 65, 2008, 187-201.
M: Giampietro (2003), Multi-Scale Integrated Analysis of Agro-ecosystems.CRC Press, Boca Raton, 472 pp.
Ministerio de Agricultura (1952), Anuario Estadístico de las producciones agrícolas, año 1933-51, Ministerio de Agricultura, Madrid.
Ministerio de Agricultura, Industria, Comercio y Obras Públicas (s.a.), Noticias estadísticas sobre la producción agrícola española por la Junta Consultiva Agronómica. 1902, Ministerio de Agricultura, Industria, Comercio y Obras Públicas, Madrid, s.a.
Ministerio de Agricultura, Industria, Comercio y Obras Públicas (1905), Prados y pastos. Resumen hecho por la Junta Consultiva Agronómica de las memorias sobre dicho tema remitidas por los ingenieros jefes del servicio agronómico provincial, Ministerio de Agricultura, Industria, Comercio y Obras Públicas, Madrid.
Ministerio de Agricultura, Pesca y Alimentación (MAPA) (1995), Informe sobre la situación de los recursos fitogenéticos en España. International Conference and Programme for Plant Genetic Resources. MAPA. Madrid.
Ministerio de Fomento (1892), La ganadería en España. Avance sobre la riqueza pecuaria en 1891, formada por la Junta Consultiva Agronómica, conforme a las memorias reglamentarias que en el citado año han redactado los ingenieros del Servicio Agronómico, Ministerio de Fomento, Madrid.
Ministerio de Fomento (1912), Memoria relativa a los servicios de la Dirección General de Agricultura, Minas y Montes, Ministerio de Fomento, Madrid.
Ministerio de Fomento (1913), Avance estadístico de la riqueza que en España representa la producción media anual de árboles y arbustos frutales, tubérculos, raíces y bulbos. Resumen hecho por la Junta Consultiva Agronómica de las memorias de 1910, remitidas por los ingenieros del Servicio Agronómico Provincial, Ministerio de Fomento, Madrid.
Ministerio de Fomento (1914a), Avance estadístico de la riqueza que en España representa la producción media anual de las plantas hortícolas y plantas industriales. Resumen hecho

Old and New Worlds: the Global Challenges of Rural History | International Conference, Lisbon, ISCTE-IUL, 27-30 January 2016
17
por la Junta Consultiva Agronómica de las memorias de 1911, remitidas por los ingenieros del Servicio Agronómico Provincia, Ministerio de Fomento, Madrid.
Ministerio de Fomento (1914b), Avance estadístico de la riqueza que en España representa la producción media anual de pastos, prados, y algunos aprovechamientos y pequeñas industrias zoógenas anexas. Resumen hecho por la Junta Consultiva Agronómica de las memorias de 1912, remitidas por los ingenieros del Servicio Agronómico Provincial, Ministerio de Fomento, Madrid.
Ministerio de Fomento (1915), Avance estadístico de la riqueza que en España representa la producción media anual en el decenio de 1903 a 1912 de cereales y leguminosas, vid y olivo y aprovechamientos diversos derivados de estos cultivos. Resumen hecho por la Junta Consultiva Agronómica de las memorias de 1913, remitidas por los ingenieros del Servicio Agronómico Provincial, Ministerio de Fomento, Madrid.
Ministerio de Fomento (1923), Avance estadístico de la producción agrícola en España. Resumen hecho por la Junta Consultiva Agronómica de las memorias de 1922 remitidas por los ingenieros del servicio agronómico provincial, Ministerio de Fomento, Madrid.
Ministerio de Fomento Ministerio de Fomento (1920), Estudio de la ganadería en España. Resumen hecho por la Junta Consultiva Agronómica de las memorias de 1917, Ministerio de Fomento, Madrid.
Muñoz, P., Giljum, S., Roca, J. (2009), “The raw material equivalents of international trade”. Journal of Industrial Ecology. 13 (6), 881-898.
Pimentel, D., Pimentel, M. (1976), Food, Energy, and Society. Edward Arnold, London, 1979; G. Leach, Energy and Food Production. IPC Science and Technology Press, Guildford.
Pinilla Pinilla, V. (2001), “El comercio exterior en el desarrollo agrario de la España contemporánea: un balance”, Historia Agraria, 23, pp. 13-37;
Pinilla, V., Gallego D. (1996), “Del librecambio matizado al proteccionismo selectivo: el comercio exterior de productos agrarios y alimentos en España entre 1849 y 1935”. Revista de Historia Económica. 14 371-420.
Prados de la Escosura, L. (2003), El progreso económico de España (1850-2000). Fundación BBVA, Madrid, 2003.
Pujol, J., González de Molina, M., Fernández Prieto, L., Gallego, D, Garrabou, R. (2001), El pozo de todos los males. Sobre el atraso en la agricultura española contemporánea, Crítica, Barcelona.
Risku-Norjaa, H. Mäenpää, H. 2007. “MFA model to assess economic and environmental consequences of food production and consumption”. Ecological Economics, 60, 2007, 700-711.
Robledo, R. (ed.) (2010), Sombras del progreso: las huellas de la Historia Agraria. Estudios en homenaje a Ramón Garrabou. Barcelona, Crítica.
Schandl, H., Grünbühel, C., Haberl, H., Weisz, H. (2002), Handbook of Physical Acounting. Measuring Bio-physical Dimensions of Socio-Economic Activities, MFA-EFA-HANPP, Social Ecology Working Paper, 3.
Schmidhüber, J. (2006), “The EU Diet – Evolution, Evaluation and Impacts of the CAP”, FAO Working Papers, 2006. http://www.fao.org/fileadmin/templates/esa/Global_persepctives/Presentations/Montreal-JS.pdf;
Simpson, J. (1997), La agricultura española (1765-1965): la larga siesta, Alianza, Madrid, 1997.
Old and New Worlds: the Global Challenges of Rural History | International Conference, Lisbon, ISCTE-IUL, 27-30 January 2016
18
Smil, V. (2001), Energías. Una guía ilustrada de la biosfera y la civilización. Editorial Crítica, Barcelona.
Soto Fernández, D. (2006), Historia dunha agricultura sustentabel. Transformacións productivas na agricultura galega contemporánea, Xunta de Galicia, Santiago.
Stuart, T. (2011), Despilfarro. El escándalo global de la comida. Alianza, Madrid.
Enric Tello, E.; Galán, E; Cunfer, G.; Guzmán-Casado, G. I.; González de Molina, M.; Krausmann, F.; Gingrich, S.; Sacristán, V.; Marco, I.; Padró, R.; Moreno-Delgado, D. (2015), A proposal for a workable analysis of Energy Return On Investment (EROI) in agroecosystems. Part I: Analytical approach. S o c i a l e c o l o g y w o r k i n g p a p e r 1 5 6. Vienna, May 2015.
UNCADT- United Nations Conference on Trade and Development (2013), Trade and Environment Review. 2013: Wake up before it is too late. Make agriculture truly sustainable now for food security in a changing climate. United Nation Publication, Genève.
UNEP-United Nations Environment Programme (2010), Assessing the Environmental Impacts of Consumption and Production. Priority Products and Materials. UNEP, Paris, 2010.
Vanwalleghem, T., Infante, J., González de Molina, M., Soto, D., Gómez, J. A. (2011), “Quantifying the effect of historical soil management on soil erosion rates in Mediterranean olive orchards”. Agriculture, Ecosystems and Environment 142, 341– 351.
Witzke, H., Noleppa (2010), S., EU agricultural production and trade: Can more efficiency prevent increasing “land grabbing” outside of Europe? OPERA Re-search Center, Available at, http://www.appgagscience.org.uk/linkedfiles/Final_Report_Opera.pdf.;