the evolution of super-basins - beg.utexas.edu evolution of... · million tonnes oil equivalent....
TRANSCRIPT

Tinker, 2015Tinker 2018Tinker 2018
AAPG ACE
May, 2018
The Evolution of Super-Basins
Scott W. Tinker
Tinker, 2015Tinker 2018
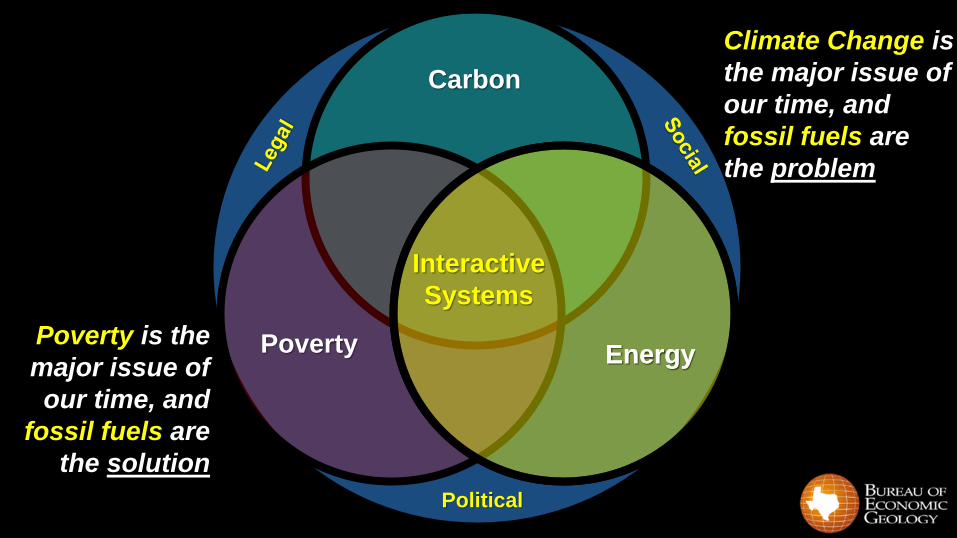
Political
Carbon
Poverty EnergyEnergy
Climate Change is
the major issue of
our time, and
fossil fuels are
the problem
Poverty is the
major issue of
our time, and
fossil fuels are
the solution
Interactive
Systems

Tinker, 2015Tinker 2018
Energy
Environment
Economy
Radical
Middle

Tinker, 2015Tinker 2018
Energy
What role will hydrocarbon
Super Basins play?

Tinker, 2015Tinker 2018
Outline
Global Energy Mix
US Shale Super Basins
Super Basin Sustainability

Tinker, 2015Tinker 2016
Global PopulationEach color on the map represents ~ 1 billion people
Petroleum
Nat Gas
Coal
Nuclear
Hydro Renew
The Global Energy Mix
4331
3135
3840
583 893
365
Tinker 2017
86%
Data: BP Statistical View of World Energy (2016)
Million Tonnes Oil Equivalent

Tinker, 2015Tinker 2016
Global PopulationEach color on the map represents ~ 1 billion people
Petroleum
Nat Gas
Coal
Nuclear
Hydro Renew
The Global Energy MixTinker 2017
86%
Data: BP Statistical View of World Energy (2016)
Million Tonnes Oil Equivalent
1036
881
429
216
151 83
323
15737
5
153
24
862
903
468
264
194 143
426
441
11 1 6 0
183
122
97
2 27 41501
6312798
95362 111

Tinker, 2015Tinker 2016
Global PopulationEach color on the map represents ~ 1 billion people
Petroleum
Nat Gas
Coal
Nuclear
Hydro Renew
Global Energy DemandTinker 2017
Data: BP Statistical View of World Energy (2016)
Million Tonnes Oil Equivalent
1036
881
429
216
151 83
323
157
375
15324
862
903
468
264
194143
426
441
11 1 6 0
183
122
97
2 27 4 1501
6312798
95
362 111

Tinker, 2015Tinker 2016
0
2,000
4,000
6,000
8,000
10,000
12,000
14,000
1965 1970 1975 1980 1985 1990 1995 2000 2005 2010 2015
Global Energy Consumption (MTOE)
Oil Natural Gas Coal Nuclear Hydro Solar Wind Biomass
Global Energy Mix
Data: BP Statistical View of World Energy (2016)

Tinker, 2015Tinker 2016
0
2,000
4,000
6,000
8,000
10,000
12,000
14,000
1965 1970 1975 1980 1985 1990 1995 2000 2005 2010 2015
Global Energy Consumption (MTOE)
Oil Natural Gas Coal Nuclear Hydro Solar Wind Biomass
Global Energy Mix
Data: BP Statistical View of World Energy (2016)

Tinker, 2015Tinker 2016
0
200
400
600
800
1,000
1,200
1,400
1965 1970 1975 1980 1985 1990 1995 2000 2005 2010 2015
Renewable Consumption (MTOE)
Hydro Solar Wind Biomass
Global Energy Mix
Data: BP Statistical View of World Energy (2016)

Tinker, 2015Tinker 2016
0
200
400
600
800
1,000
1,200
1,400
1965 1970 1975 1980 1985 1990 1995 2000 2005 2010 2015
Renewable Consumption (MTOE)
Hydro Solar Wind Biomass
Global Energy Mix
Data: BP Statistical View of World Energy (2016)

Tinker, 2015Tinker 2016
0
50
100
150
200
250
300
350
400
1965 1970 1975 1980 1985 1990 1995 2000 2005 2010 2015
Renewable Consumption (MTOE)
Solar Wind Biomass
Global Energy Mix
Data: BP Statistical View of World Energy (2016)

Tinker, 2015Tinker 2016
0
50
100
150
200
250
300
1965 1970 1975 1980 1985 1990 1995 2000 2005 2010 2015
Renewable Consumption (MTOE)
Solar Wind
Global Energy Mix
Data: BP Statistical View of World Energy (2016)

Tinker, 2015Tinker 2016
0
50000
100000
150000
200000
250000
300000
350000
400000
450000
500000
1995 2000 2005 2010 2015
Installed Wind Capacity (MW)
Total Asia Pacific Total Africa Total Middle East
Total S. & Cent. America Total North America Total Europe & Eurasia
Global Energy Mix
Data: BP Statistical View of World Energy (2016)

Tinker, 2015Tinker 2016
Global Energy Mix
Growth in U.S. Wind Generation 2000–2014
Iowa
OklahomaKansas
QAe5771
California
Illinois
Texas
2000 2006 2008 2012
45,000
25,000
35,000
20,000
30,000
40,000
5,000
15,000
0
10,000
2002 2004 2010 2014
Million Kwh

Tinker, 2015Tinker 2016
0
50,000
100,000
150,000
200,000
250,000
1996 2001 2006 2011
Installed Photovoltaic Capacity (MW)
China Japan Total North America Total Europe Total Others
Global Energy Mix
Data: BP Statistical View of World Energy (2016)
Tinker, 2015Tinker 2016
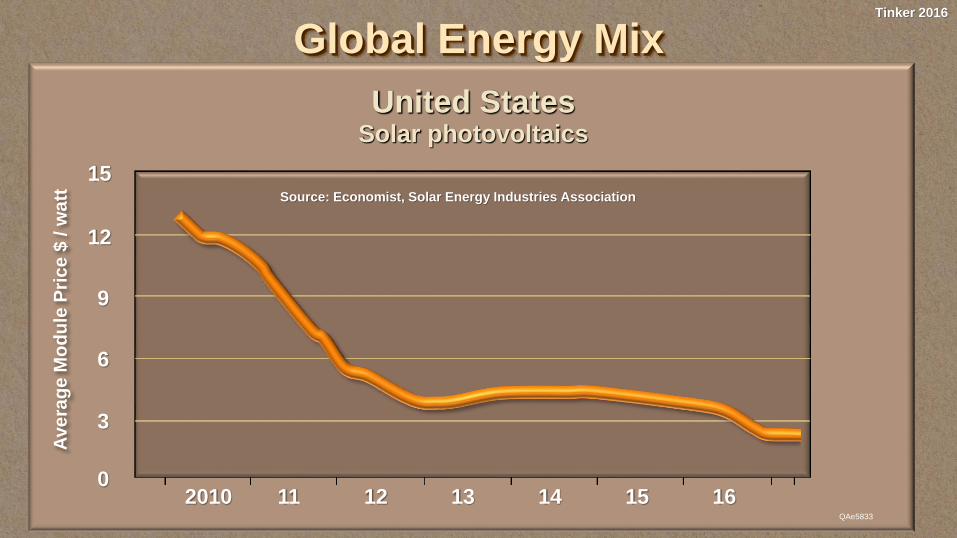
Global Energy Mix
QAe5833
United StatesSolar photovoltaics
2010 13 1411 12 15 16
Source: Economist, Solar Energy Industries Association
Ave
rag
e M
od
ule
Pri
ce
$ / w
att
15
12
9
6
3
0

Tinker, 2015Tinker 2016
0
2,000
4,000
6,000
8,000
10,000
12,000
14,000
1965 1970 1975 1980 1985 1990 1995 2000 2005 2010 2015
Global Energy Consumption (MTOE)
Oil Natural Gas Coal Nuclear Hydro Solar Wind Biomass
0
50
100
150
200
250
300
1965 1970 1975 1980 1985 1990 1995 2000 2005 2010 2015
Renewable Consumption (MTOE)
Solar Wind
0
200
400
600
800
1,000
1,200
1,400
1965 1970 1975 1980 1985 1990 1995 2000 2005 2010 2015
Renewable Consumption (MTOE)
Hydro Solar Wind Biomass
0
50
100
150
200
250
300
350
400
1965 1970 1975 1980 1985 1990 1995 2000 2005 2010 2015
Renewable Consumption (MTOE)
Solar Wind Biomass
0
100000
200000
300000
400000
500000
1995 2000 2005 2010 2015
Installed Wind Capacity (MW)
Total Asia Pacific Total Africa
Total Middle East Total S. & Cent. America
Total North America Total Europe & Eurasia
0
50,000
100,000
150,000
200,000
250,000
1996 2001 2006 2011
Installed Photovoltaic Capacity (MW)
China Japan Total North America Total Europe Total Others
Global Energy Mix
Data: BP Statistical View of World Energy (2016)
0%
10%
20%
30%
40%
50%
60%
70%
80%
90%
100%
1965 1970 1975 1980 1985 1990 1995 2000 2005 2010 2015
Global Energy Consumption Mix
Oil Natural Gas Coal Nuclear Hydro Solar Wind Biomass
Nuclear
41%
16%
38%
29%
24%
33%
95% 86%

Tinker, 2015Tinker 2016
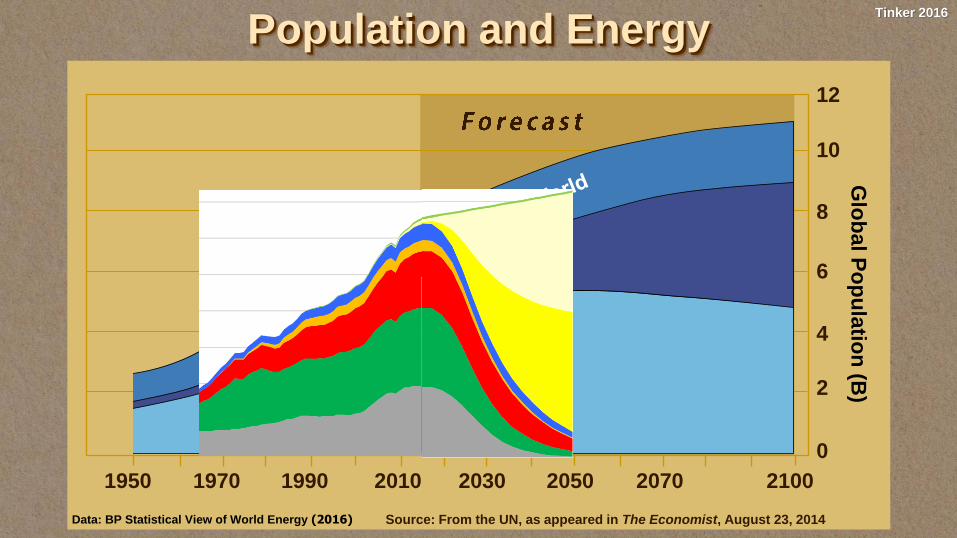
Source: From the UN, as appeared in The Economist, August 23, 2014
4
10
12
8
6
2
0
1950 1970 1990 2010 2030 2050 2070 2100
Asia
Glo
ba
l Po
pu
latio
n (B
)
Population and Energy
Data: BP Statistical View of World Energy (2016)

Tinker, 2015Tinker 2016
Source: From the UN, as appeared in The Economist, August 23, 2014
4
10
12
8
6
2
0
1950 1970 1990 2010 2030 2050 2070 2100
Asia
Glo
ba
l Po
pu
latio
n (B
)
Asia
Population and Energy
Data: BP Statistical View of World Energy (2016)

Tinker, 2015Tinker 2016
Source: From the UN, as appeared in The Economist, August 23, 2014
4
10
12
8
6
2
0
1950 1970 1990 2010 2030 2050 2070 2100
Asia
Glo
ba
l Po
pu
latio
n (B
)
Asia
Population and Energy
Data: BP Statistical View of World Energy (2016)
~45%

Tinker, 2015Tinker 2016
Source: From the UN, as appeared in The Economist, August 23, 2014
4
10
12
8
6
2
0
1950 1970 1990 2010 2030 2050 2070 2100
Asia
Glo
ba
l Po
pu
latio
n (B
)
Population and Energy
Data: BP Statistical View of World Energy (2016)
“The world
could be 100%
wind, wave and
solar by 2030,
if just for
political will…”~45%
Tinker, 2015Tinker 2016
Source: From the UN, as appeared in The Economist, August 23, 2014
4
10
12
8
6
2
0
1950 1970 1990 2010 2030 2050 2070 2100
Asia
Glo
ba
l Po
pu
latio
n (B
)
Population and Energy
Data: BP Statistical View of World Energy (2016)
~45%

Tinker, 2015Tinker 2016
Source: From the UN, as appeared in The Economist, August 23, 2014
4
10
12
8
6
2
0
1950 1970 1990 2010 2030 2050 2070 2100
Asia
Glo
ba
l Po
pu
latio
n (B
)
Population and Energy
Data: BP Statistical View of World Energy (2016)
~45%

Tinker, 2015Tinker 2016
Source: From the UN, as appeared in The Economist, August 23, 2014
4
10
12
8
6
2
0
1950 1970 1990 2010 2030 2050 2070 2100
Asia
Glo
ba
l Po
pu
latio
n (B
)
Population and Energy
Data: BP Statistical View of World Energy (2016)
~45%

Tinker, 2015Tinker 2016
Source: From the UN, as appeared in The Economist, August 23, 2014
4
10
12
8
6
2
0
1950 1970 1990 2010 2030 2050 2070 2100
Asia
Glo
ba
l Po
pu
latio
n (B
)
Population and Energy
Data: BP Statistical View of World Energy (2016)
~45%
Are there affordable, available, reliable and sustainable:
• fossil energy and nuclear resources to meet this demand?
• renewable energy resources to meet this demand?
~15,000 TcF
(5X to date)
~2,600 BBO
(2X to date)

Tinker, 2015Tinker 2018
0 3,000 6,000 12,0009,000 15,000 30,00018,000 21,000 24,000 27,000
Resources (Tcf)
Pro
du
cti
on
co
st
(2008 $
/Mb
tu)
Hydrates
15
10
5
0
Natural Gas Cost of Supply
Resources v. Cost
QAe980Modified from: IEA World Energy Outlook (2009)
Global Consumption 2015
123 Tcfy
Arc
tic
Co
nv
en
tio
na
l
Sour
De
ep
Wa
ter
Shale
Co
al
Be
dM
eth
an
e
Tight
Pro
du
ce
d

Tinker, 2015Tinker 2018
Oil Cost of SupplyResources and Cost
0 2000 4000 10,0006000 8000
140
20
0
Resources (billion barrels)
Pro
du
cti
on
co
st
(2
00
8 $
)
Produced MENA
40
60
80
100
120
Arctic
Modified from: IEA World Energy Outlook (2009)
Coal
to
liquids
Gas
to
liquidsOther
conventionaloil
EOR
Deepwater and
ultra-deepwater
Oil shales
Shale oil
Heavy
oil
&
bitumen
CO2 EOR

Tinker, 2015Tinker 2018
Source: From the UN, as appeared in The Economist, August 23, 2014
4
10
12
8
6
2
0
1950 1970 1990 2010 2030 2050 2070 2100
Asia
Glo
ba
l Po
pu
latio
n (B
)
Population and Energy
Data: BP Statistical View of World Energy (2016)
~40%
~25%
~35%

0 0.25 0.5 0.75 1
1
0.75
0.5
0.25
01
0.75
0.5
0.25
0
Natural Gas, Nuclear
Coal, Oil, BiomassWind, Solar, Hydro
Global
Primary
Energy
1965
2015
Natural Gas, Nuclear
Coal, Oil, BiomassWind, Solar, Hydro
2065
40% 25% 35%
60% 30% 10%
80% 15% 5%
40% 40% 20%
2065

Tinker, 2015Tinker 2018
60 Years and CountingW
TI
($/b
arr
el)
Inflation Adjusted Oil Price

Tinker, 2015Tinker 2018
Outline
Global Energy Mix
US Shale Super Basins
Super Basin Sustainability

Tinker, 2015Tinker 2018
For presentation or publication, reference:
Bureau of Economic Geology Shale Resource and Production Project
http://www.beg.utexas.edu/research/programs/shale
Marcellus
Fayetteville
Haynesville
Barnett
Eagle Ford
Bakken/Three Forks
Permian Basin

Production Outlook
• Pace of drilling by year and area,• Expected gas/oil/water
production depending on economics, technology, regulation
Well Economics
Expected well profitability
as a function of
• Well production profile
• Operational
• Market and regulatory parameters
Well Decline Analysis
• Production and its decline for gas/oil/water
• Stimulated/drained rock volume
Geologic Analysis
•Reservoir characterization
•Original-Resource-in-Place
•3-D Geologic Model
Recovery and Productivity
Statistical Analysis
Expected production
as a function of
• Well productivity drivers
• Location and Completion
• Inventory of future wells
• Technically Recoverable Resources
For presentation or publication, reference: Bureau of Economic Geology Shale Resource and Production Project http://www.beg.utexas.edu/research/programs/shale
BEG Tight Oil Resource Assessment (TORA)Integrated Study Workflow

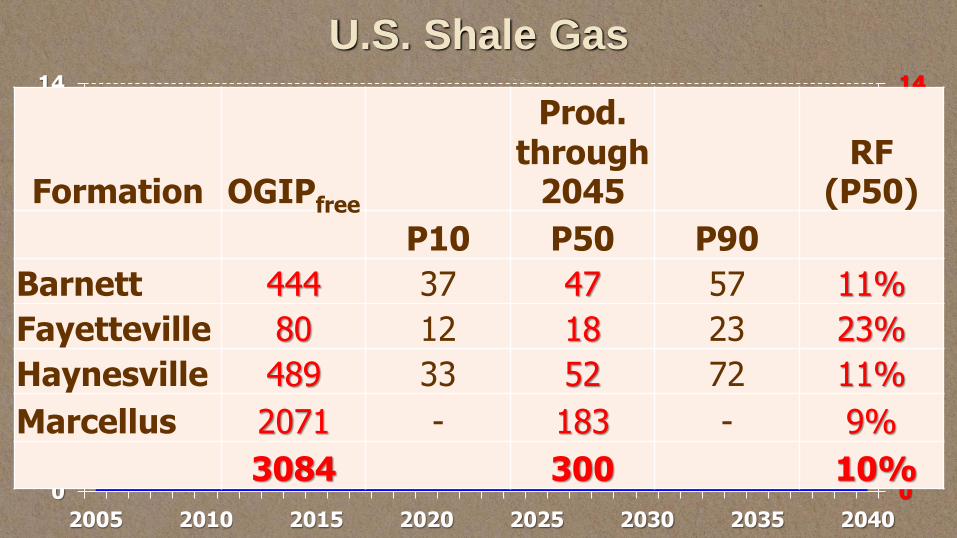
U.S. Shale Gas
0
2
4
6
8
10
12
14
0
2
4
6
8
10
12
14
2005 2010 2015 2020 2025 2030 2035 2040
$/M
MB
tu
TC
F
Marcellus
Haynesville
Fayetteville
Barnett
EIA Price Scenario
Source: BEG Shale Resources and Reserves Team
U.S. Shale Gas
0
2
4
6
8
10
12
14
0
2
4
6
8
10
12
14
2005 2010 2015 2020 2025 2030 2035 2040
$/M
MB
tu
TC
F
Marcellus
Haynesville
Fayetteville
Barnett
EIA Price Scenario
Source: BEG Shale Resources and Reserves Team
Formation OGIPfree
Prod. through
2045RF
(P50)
P10 P50 P90
Barnett 444 37 47 57 11%
Fayetteville 80 12 18 23 23%
Haynesville 489 33 52 72 11%
Marcellus 2071 - 183 - 9%
3084 300 10%

U.S. Shale Gas 2012
Base High
2017
Low
For presentation or publication, reference: Bureau of Economic Geology Shale Resource and Production Project
http://www.beg.utexas.edu/research/programs/shale

Tinker, 2015Tinker 2018
U.S. Shale Gas 2012
Base High
2017
Low
For presentation or publication, reference: Bureau of Economic Geology Shale Resource and Production Project http://www.beg.utexas.edu/research/programs/shale
$3 $4 $6
$2.75 $3.75 $4.50
2963
653
182 215327
3311
692
158305
415
1
10
100
1000
10000
OGIP TRR Low EUR Base EUR High EUR
TcF
Barnett, FV, HV, Marcellus
5%
9% 16%
2012 BEG Studies
2017 BEG Update
% of OGIP21%
$3 $4 $6
$2.7
5
$3.7
5
$4.5
0

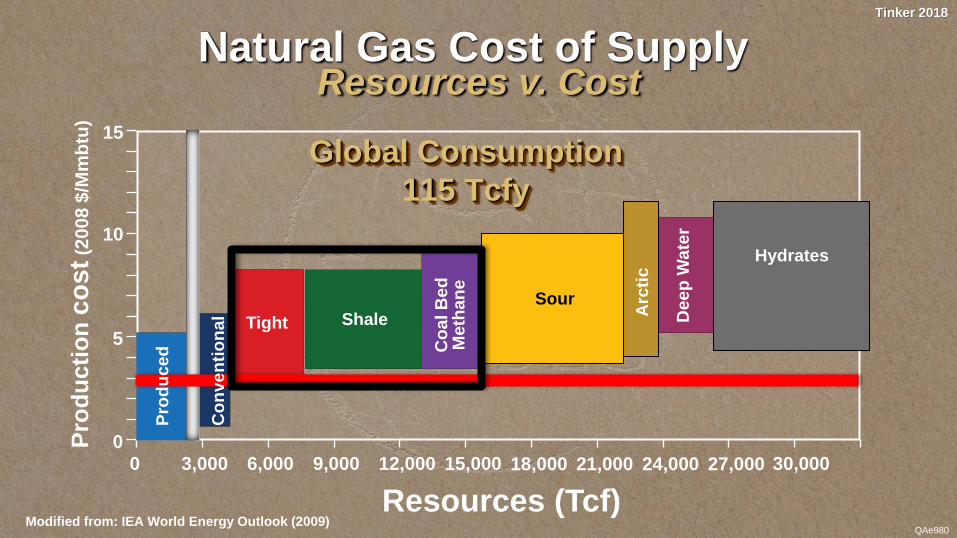
Tinker, 2015Tinker 2018
0 3,000 6,000 12,0009,000 15,000 30,00018,000 21,000 24,000 27,000
Resources (Tcf)
Pro
du
cti
on
co
st
(2008 $
/Mm
btu
)
Hydrates
15
10
5
0
QAe980Modified from: IEA World Energy Outlook (2009)
Global Consumption
115 Tcfy
~ 300 year total resource
Sour
Arc
tic
De
ep
Wa
ter
Shale
Co
al
Be
dM
eth
an
e
Co
nv
en
tio
na
l Tight
Pro
du
ce
d
Natural Gas Cost of SupplyResources v. Cost
Tinker, 2015Tinker 2018
0 3,000 6,000 12,0009,000 15,000 30,00018,000 21,000 24,000 27,000
Resources (Tcf)
Pro
du
cti
on
co
st
(2008 $
/Mm
btu
)
Hydrates
15
10
5
0
QAe980Modified from: IEA World Energy Outlook (2009)
Global Consumption
115 Tcfy
Sour
Arc
tic
De
ep
Wa
ter
Shale
Co
al
Be
dM
eth
an
e
Co
nv
en
tio
na
l Tight
Pro
du
ce
d
Natural Gas Cost of SupplyResources v. Cost

Tinker, 2015Tinker 2018
0 3,000 6,000 12,0009,000 15,000 30,00018,000 21,000 24,000 27,000
Resources (Tcf)
Pro
du
cti
on
co
st
(2008 $
/Mm
btu
)
Hydrates
15
10
5
0
QAe980Modified from: IEA World Energy Outlook (2009)
Global Consumption
115 Tcfy
Sour Arc
tic
De
ep
Wa
ter
Shale
Co
al
Be
dM
eth
an
e
Co
nv
en
tio
na
l
Tight
Pro
du
ce
d
Natural Gas Cost of SupplyResources v. Cost

Tinker, 2015Tinker 2018
0 3,000 6,000 12,0009,000 15,000 30,00018,000 21,000 24,000 27,000
Resources (Tcf)
Pro
du
cti
on
co
st
(2008 $
/Mb
tu)
Hydrates
15
10
5
0
Natural Gas Cost of Supply
Resources v. Cost
QAe980Modified from: IEA World Energy Outlook (2009)
Global Consumption 2015
123 Tcfy
~ 300 year total resource
Arc
tic
Co
nv
en
tio
na
l
Sour
De
ep
Wa
ter
Shale
Co
al
Be
dM
eth
an
e
Tight
Pro
du
ce
d
Reserves are a function of
Price, Cost, Technology,
Policy and Demand

Tinker, 2015Tinker 2018
Gas OilTcf Bbbl
Original In-Place 3100 450
Tech. Recoverable 700 27
Production to date 70 5
Horizontal wells to date ~ Future wells (base case) ~500,000
Gas Oil
Resource-in-Place
Produced to-date
TRR
~75,000~500,000
Fayetteville
~6,500~13,000
Haynesville
~6,000~35,000
Marcellus ~10,500~200,000
Barnett~16,500~63,000
For presentation or publication, reference: Bureau of Economic Geology Shale Resource and Production Project http://www.beg.utexas.edu/research/programs/shale

Tinker, 2015Tinker 2018
Eagle FordOil Production Scenarios
0
100
200
300
400
500
600
700
800
2008 2013 2018 2023 2028 2033 2038 2043
Oil
pro
du
cti
on
MM
bb
l/ye
ar
at $100/bbl
at $80/bbl
at $50/bbl
at $40/bbl
Historical through 2014
For presentation or publication, reference: Bureau of Economic Geology Shale Resource and Production Project http://www.beg.utexas.edu/research/programs/shale

Tinker, 2015Tinker 2018
Shale Oil SupplyEIA price scenario
0
20
40
60
80
100
120
140
160
0
200
400
600
800
1000
1200
2008 2013 2018 2023 2028 2033 2038 2043
$/b
bl
An
nu
al liq
uid
s p
rod
ucti
on
MM
bb
l
Middle Bakken and Three Forks EGLF Eagle Ford WTI price $2013
27 Bbbl out of 450 Bbbl6% Recovery
For presentation or publication, reference: Bureau of Economic Geology Shale Resource and Production Project http://www.beg.utexas.edu/research/programs/shale

Tinker, 2015Tinker 2018
Gas OilTcf Bbbl
Original In-Place 3100 450
Tech. Recoverable 700 27
Production to date 70 5
Horizontal wells to date ~ Future wells (base case) ~500,000
Gas Oil
Resource-in-Place
Produced to-date
TRR
~75,000~500,000
Fayetteville
~6,500~13,000
Eagle Ford
~16,500~90,000
Bakken/Three Forks
~18,000~100,000
Haynesville
~6,000~35,000
Marcellus ~10,500~200,000
Barnett~16,500~63,000
Permian Basinin progress
For presentation or publication, reference: Bureau of Economic Geology Shale Resource and Production Project http://www.beg.utexas.edu/research/programs/shale

Tinker, 2015Tinker 2018
HF: hydraulic fracturingUnc PW: unconventional produced waterConv PW: conventional produced water SWD P: salt water disposal into producing SWD NP: into non-producing intervalsEORI: enhanced oil recovery injection
From Scanlon BEG
Used with Permission

Tinker, 2015Tinker 2018
Flowback
and
Produced
Water
Outlook
For presentation or publication,
reference: Bureau of Economic
Geology Shale Resource and
Production Project
http://www.beg.utexas.edu/research/p
rograms/shale

Tinker, 2015Tinker 2018
Super Basins Environmental Impact
Mining and Manufacturing
Drilling and Completion: Land and Water
Transportation: Pipelines, Trucks, Ships, Rail
Refining and Petrochemicals: Emissions
Combustion: Vehicle and Power Plant Emission
Social and Political

Tinker, 2015Tinker 2018
Mining and Processing Land, Water, Emissions
Manufacturing: Turbines, Panels, Batteries
Production: Land for “Farms”
Transmission: Electricity
Disposal: Landfill
Environmental ImpactRenewables and Batteries

Tinker, 2015Tinker 2018
Outline
Global Energy Mix
US Shale Super Basins
Super Basin Sustainability

Tinker, 2015Tinker 2018
Political
Energy
Environment
Economy
Super
Basins
Infrastructure
Energy Mix
Talent
Education
Data
Analytics

Tinker, 2015Tinker 2018
U.S. Electric Generation Shares (2005-15)
QAe4744Source: EIA
Perc
en
t o
f to
tal
Other
Natural gas
Coal
100%
80%
60%
40%
20%
0%2005 2007 2009 2011 2013 20152006 2008 2010 2012 2014
Nuclear
Renewables
20%
8%
18%
51%
21%
13%
32%
34% 68%
% of
CO2
30%
2%
~ 20% CO2
Reduction!

Tinker, 2015Tinker 2018
0
20
40
60
80
100
120
140
160
180
200
1950 1960 1970 1980 1990 2000 2010
Qu
adri
llio
n B
tuUS Energy Mix
After Jim Sweeney, 2015. Data: EIA, Monthly Energy Review
Oil
Natural Gas
Coal
Nuclear
Total Energy Consumed Imports
HydroBiofuelsWind & Solar
Growth 0.55% less than GDP
80 Quads
“Efficiency”
Fracking

Tinker, 2015Tinker 2018
Electricity and Poverty
QAe5021Sources: World Bank; IEA; World Energy Outlook 2015
Poverty and electricity
access in selected
developing countries,
circles sized by
total population
100
0 40 8020 60 100
80
60
40
20
0
Income % (<$3.10 a day at 2011 PPP†, %)
Ele
ctr
ific
ati
on
ra
te 2
01
3,
%
Africa
Asia
Latin America
* Bangladesh uses
2005 PPP and $2
a day poverty line
† Purchasing power
parity
Vietnam
China
India
Bangladesh*
Brazil
Nigeria
Tanzania
Kenya
Uganda
Ethiopia
Cameroon
Electricity
Poverty
Photos Tinker, Lynch, Ecuador, 2017

Tinker, 2015Tinker 2018
There is “good” energy and
“bad” energy…
What do the “Educators” Communicate
Renewables and batteries are “good”
Fossils and nuclear are “bad”…

Tinker, 2015Tinker 2018
Keep IT in the Ground. Keep THEM in Poverty.

Tinker, 2015Tinker 2018
Super BasinKey Issues
Manage Complexity
• Oil & Gas supply and demand dynamics
• Power sector
• Human infrastructure
• Agriculture
• Regulators, policy makers, public perception
Cooperate and Coordinate
• Across states and stakeholders
• Availability of water, land, energy
• Conflicts of interest
• Planning and Financing
• Law and politics
New York!

Tinker, 2015Tinker 2018
Sustainability of Super Basins
Energy: Scale and Diversity Matter
Public Engagement: Vital
Education: A Contact Sport

Tinker, 2015Tinker 2018
…for what you do!
Thank You…