the evolution of stars and gas in galaxies: phd midterm philip lah a journey with noise and...
Post on 21-Dec-2015
214 views
TRANSCRIPT

The Evolution of Stars and Gas in Galaxies:
PhD Midterm
Philip Lah
A journey with noise and astrometry

Supervisor: Frank Briggs
Supervisory Panel:
• Erwin de Blok (RSAA)
• Jayaram Chengalur (National Centre for Radio Astrophysics, India)
• Matthew Colless (Anglo-Australian Observatory)
• Roberto De Propris (Cerro Tololo Inter-American Observatory, Chile)

Those that deserve special mentions:
• Brian Schmidt
• Agris Kalnajs
• Michael Pracy
• Tony Martin-Jones
• Scott Croom (AAO) & Rob Sharp (AAO)
• Nissim Kanekar (NRAO)

Goal of PhD
• to relate the star formation rate, the stellar mass and the mass in neutral hydrogen gas in galaxies as they evolve
• to examine galaxy evolution over last 4 Gyr, (a third of the age of the universe, z~0.4)
• to study galaxies in a variety of different environments
• UNIQUE PART to study galaxy properties in the same systems – optically selected galaxies

Background

Star Formation Rate
SubaruField
Hα Spectroscopy
Hα Narrow Band Imaging
UV (with no dust correction)

HI redshift
Zwaan et al. 2005HIPASSHI 21cm
Rao et al. 2006
Prochaska et al. 2005

HI look back

HI 21cm Emission at
High Redshift

HI emission• HI – single atom of hydrogen – radiation from an excited state were proton & electron have the same spin - 10 million year half life• Assuming an optically thin neutral hydrogen cloud
• MHI* = 6.3 ×10⁹ M (HIPASS, Zwaan et al. 2005)
1
2
1
236
kms
V
Mpc
d
mJy
S
zM
M LHI

Previous highest redshift HI
Westerbork Synthesis Radio Telescope (WSRT)
Netherlands
Abell 2218 z = 0.18
integration time 36 days, Zwaan et al. 2001
Very Large Array (VLA)
Abell 2192 z = 0.1887
integration time ~80 hours, Veheijen et al. 2004

Giant Metrewave Radio Telescope

GMRT Antenna Positions

GMRT Collecting Area
30 dishes of 45 m diameter
GMRT Collecting Area
21 × ATCA
15 × Parkes
6.9 × WSRT
3.6 × VLA

Method of HI Detection
RA
DEC
Radio Data Cube
• pick out HI signal using optical redshifts
• coadd faint signals to make measurement

Observational Targets

Table of Targets
Target Type zLook Back
TimeGMRT Obs
Time
Subaru Fieldfield galaxies
with H emission
0.24 2.8 Gyr 80.5 hours
Abell 370cluster and
surroundings0.37 4.0 Gyr 70 hours
Cl0024+1654cluster and
surroundings0.39 4.2 Gyr 18 + 45 hours

Galaxy Cluster Abell 370

Galaxy Cluster Abell 370
RA
DEC 27’ × 27’
Cluster Centre

Galaxy Cluster Abell 370
RA
DEC ~3’ × 3’

HI Abell 37033 literature
redshifts but σz ≥ ± 300 kms-1
Upper limit MHI = 1.3 MHI
*
with 95% confidence

Galaxy Cluster Abell 370
• need more redshifts for reasonable analysis
• the plan is to use WFI on SSO 40 inch for imaging – Mike Pracy took some data last year and hopefully take more this year
• hopefully use AAOmega for spectroscopic follow-up in October/November 2006
• also made improvements to my data reduction methods so redo reduction

The Subaru Field - H emission galaxies

Subaru Field
RA
DEC
24’ × 30’
Fujita et al. 2003 narrow band imaging - H emission
flux
We used 2dF to get redshifts

SDF positions
GMRT beam 10% level
GMRT beam 50% level
Blue Points Subaru galaxies
Red Points NVSS Radio Continuum
Sources

SDF uv coverage
Subaru Field is
equatorial

Image of Dirty Beam
image
7’ × 7’
radio equivalent of optical point
spread function

Self Calibration
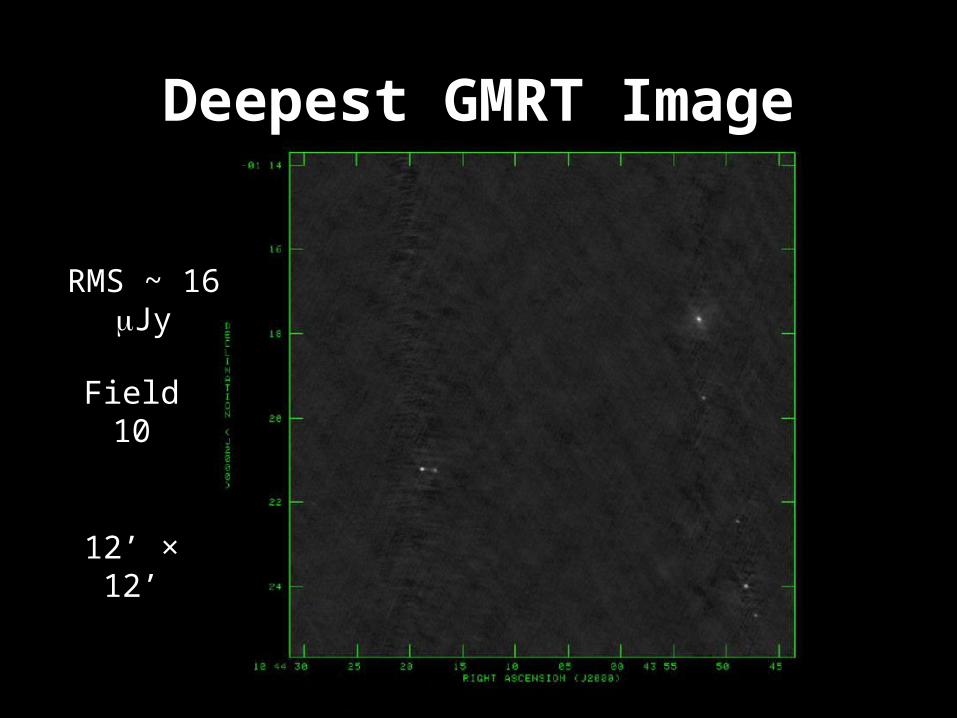
Deepest GMRT Image
Field 10
12’ × 12’
RMS ~ 16 Jy

Sad cont sources
From AIPS auto detection routine -
SAD
Blue > 5 mJyRed > 1 mJy
Black > 0.32 mJyGrey > 80 Jy
RMS ~ 16 Jy
SubaruField
boundary

Continuum Images
Thumbnails 20’’ sq

Fuzzy RC
IntegratedFlux = 17.035
0.077 mJy

Fuzzy B
galaxyUGC 05849
atredshift
z=0.026045

Astrometry
• need optical and radio positions to agree to a high level of precision
• shift in radio data – corrected by comparing with FIRST continuum source positions
• optical data – PROBLEM coordinates that I had been given for the Subaru galaxies rounded to the 5th decimal place before converting to degrees/hours, minutes, seconds format
eg. 10.56479302 10.56479 10h 33m 53.24s

Position change
Rounding error:
0.18’’ DEC2.7’’ RA
PROBLEMS2dF fibre
diameter is 2’’
many galaxies
smaller than 2’’
Radio Continuum of the
Subaru Galaxies
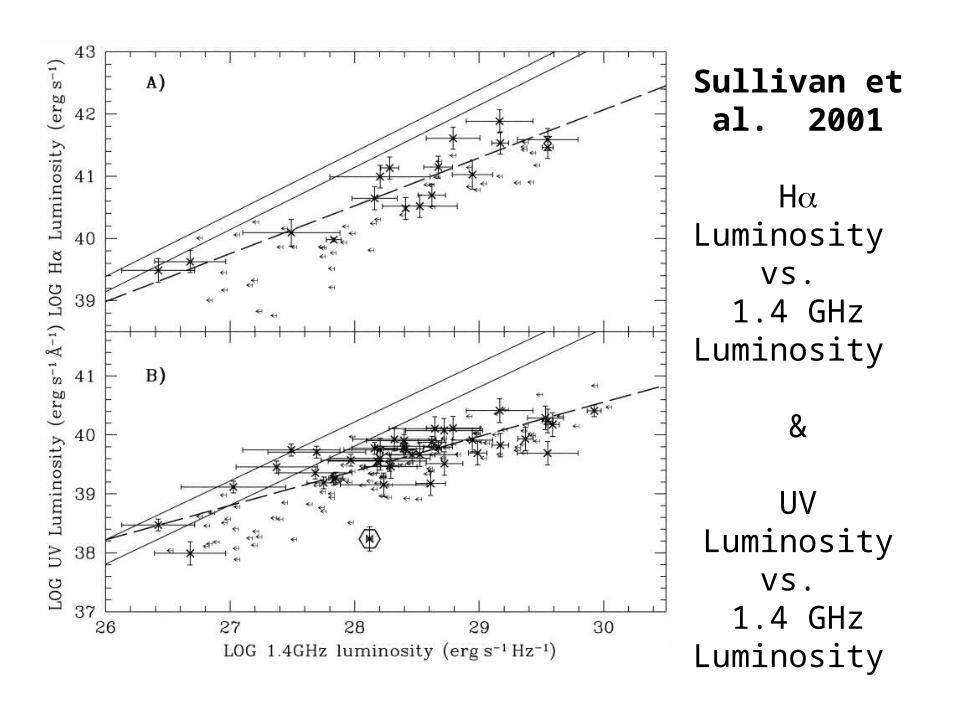
Sullivan et al. 2003
Sullivan et al. 2001
H Luminosity vs.
1.4 GHz Luminosity
&
UV Luminosity vs.
1.4 GHz Luminosity

Subaru Galaxies - B magnitude
Thumbnails 10’’ sq
Ordered by H
luminosity

Subaru Galaxies – Continuum
Thumbnails 10’’ sq

Halpha vs. RC
line from Sullivan et al.
2001

Neutral Hydrogen in the
Subaru Galaxies

Subaru Galaxies - B magnitude
Thumbnails 10’’ sq
Ordered by H
luminosity

Subaru Galaxies - redshifts
Thumbnails 10’’ sq
Ordered by H
luminosity

2dF spectrum good
good spectrum

2dF spectrum poornot so greatspectrum

Redshift histogram
Subaru Narrow Band Filter
FWHM (120 Å)
GMRT HI freq range
112 redshifts in GMRT data

Galaxy Sizes
Thumbnails 10’’ sq
Ordered by H
luminosity
Variety of sizes –
measured size at 25th
mag arcsec-2 isophote

Diameter HI
unsmoothed beam
FWHM ~3’ (10 kpc)
smoothed beam FWHM ~5.3’
(20 kpc)
smoothed beam FWHM ~8.0’
(30 kpc)
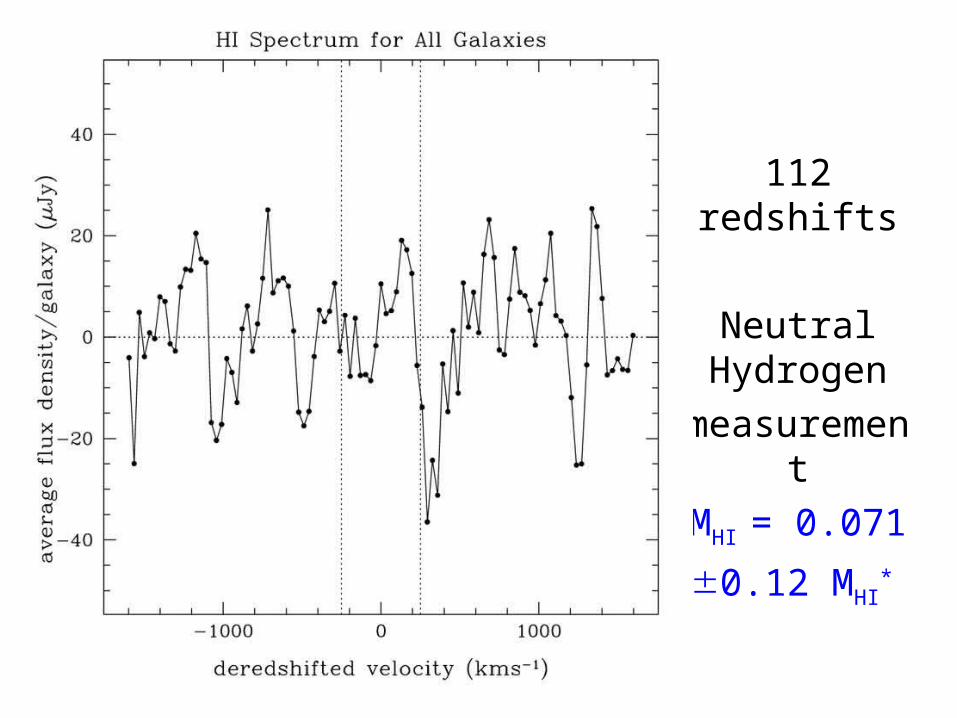
HI spectrum all
112 redshifts
Neutral Hydrogen
measurement
MHI = 0.071
0.12 MHI*

HI spectrum bright
Log H Luminosity
> 41 erg s-1
36 redshifts
Neutral Hydrogen
measurement
MHI = 0.57
0.26 MHI*

HI spectrum faint
Log H Luminosity
40.4 erg s-1
33 redshifts
Neutral Hydrogen
measurement
MHI = 0.31
0.19 MHI*

HI spectrum mid
40.4 < Log H Luminosity
41 erg s-1
43 redshifts
Neutral Hydrogen
measurement
MHI = 0.44 0.20 MHI
*

HI redshift mine all
taking into account
narrow band (H) filter
shape – brighter
galaxies will be seen over
a larger volume

Future Work: Galaxy Cluster Cl0024+1654

Galaxy Cluster Cl0024+1654
RA
DEC 21’ × 21’
Cluster Centre

Galaxy Cluster Cl0024+1654
RA
DEC ~1’ × 1’

Cl0024+1654 Data
• HST imaging 2181 galaxies with morphologies of which 195 spectroscopically confirmed cluster members (Treu et al. 2003)
• Hα narrow band imaging with Subaru star formation rates (Kodama et al. 2004)
• 296 literature redshifts within HI frequency limits of the GMRT observation (Cszoke et al. 2001)
• 18 + 45 hours GMRT observations

Cl0024 positions
GMRT Beam 50% level

Cl0024 z slice GMRT HI freq limits

PhD Timetable of CompletionRest of 2006:
• finish analysis of the Subaru Field (to be completed by the end of August 2006)
• analysis of galaxy cluster Cl0024+1652 (analysis to be finished by January 2007)
• optical imaging of galaxy cluster Abell 370 using SSO 40 inch and AAOmega follow-up to get redshifts – Mike Pracy doing much of this but I will be involved
2007:
• complete analysis of galaxy cluster Abell 370 (to be finished no later than June 2007)
• write up my thesis throughout 2007 finish between September 2007 & March 2008 (3½ - 4 year mark)

The End


Additional Slides

The UV Plane

Model no error

model

B mag vs. Halpha Lum

UV Plane

Stellar Mass Density
Dickenson et al. 2003

HI spectrum bright faintMHI= 0.41 0.15
MHI*

Method of HI Detection
• individual galaxies HI 21cm emission below radio observational detection limits
• large sample of galaxies with known positions & precise redshifts (from optical observations)
• coadd weak HI signals isolated in position & redshift (velocity) space
• measure integrated HI signal – total HI mass of whole galaxy population – can calculate the average HI galaxy mass

Galaxy Cluster Abell 370
• originally started working on this data in 3 month project – worked on to learn radio astronomy
• 42 literature redshifts for Abell 370 cluster members 33 are usable – large error in σz ≥ ± 300 kms-1 (from Soucail et al. 1988 )

Galaxy Environment
galaxy environment cluster, cluster outskirts and the field
• density - morphology relation
• density - star formation relation
• density - neutral hydrogen relation
Cause of density relations?