the evolution of human and ape hand proportions
TRANSCRIPT
ARTICLE
Received 6 Feb 2015 | Accepted 4 Jun 2015 | Published 14 Jul 2015
The evolution of human and ape hand proportionsSergio Almecija1,2,3, Jeroen B. Smaers4 & William L. Jungers2
Human hands are distinguished from apes by possessing longer thumbs relative to fingers.
However, this simple ape-human dichotomy fails to provide an adequate framework for
testing competing hypotheses of human evolution and for reconstructing the morphology of
the last common ancestor (LCA) of humans and chimpanzees. We inspect human and
ape hand-length proportions using phylogenetically informed morphometric analyses and
test alternative models of evolution along the anthropoid tree of life, including fossils like
the plesiomorphic ape Proconsul heseloni and the hominins Ardipithecus ramidus and
Australopithecus sediba. Our results reveal high levels of hand disparity among modern
hominoids, which are explained by different evolutionary processes: autapomorphic evolution
in hylobatids (extreme digital and thumb elongation), convergent adaptation between
chimpanzees and orangutans (digital elongation) and comparatively little change in gorillas
and hominins. The human (and australopith) high thumb-to-digits ratio required little change
since the LCA, and was acquired convergently with other highly dexterous anthropoids.
DOI: 10.1038/ncomms8717 OPEN
1 Center for the Advanced Study of Human Paleobiology, Department of Anthropology, The George Washington University, Washington, DC 20052, USA.2 Department of Anatomical Sciences, Stony Brook University, Stony Brook, New York 11794, USA. 3 Institut Catala de Paleontologia Miquel Crusafont (ICP),Universitat Autonoma de Barcelona, Edifici Z (ICTA-ICP), campus de la UAB, c/ de les Columnes, s/n., 08193 Cerdanyola del Valles (Barcelona), Spain.4 Department of Anthropology, Stony Brook University, Stony Brook, New York 11794, USA. Correspondence and requests for materials should be addressedto S.A. (email: [email protected]).
NATURE COMMUNICATIONS | 6:7717 | DOI: 10.1038/ncomms8717 | www.nature.com/naturecommunications 1
& 2015 Macmillan Publishers Limited. All rights reserved.

The hand is one of the most distinctive traits of humankindand one of our main sources of interaction with theenvironment1. The human hand can be distinguished
from that of apes by its long thumb relative to fingers1–4 (Fig. 1a),which has been related functionally to different selectiveregimes—manipulation vs locomotion—acting on human andape hands1,5. During the first half of the twentieth century,theories on human evolution were dominated by the view thathumans split very early from the common stock of apes, andlargely preserved generalized (plesiomorphic) hand proportionssimilar to other anthropoid primates6–8. To the contrary, extantapes were seen as extremely specialized animals adapted forbelow-branch suspension6,7. However, since the molecularrevolution in the 1980–1990s (which provided unequivocalevidence for humans and chimpanzees being sister taxa)9 aprevalent and influential evolutionary paradigm—said to be basedon parsimony—has assumed that the last common ancestor(LCA) of chimpanzees and humans was similar to a modernchimpanzee (for example, ref. 10). This shift resurrected the‘troglodytian’ stage in human evolution, which assumes that achimp-like knuckle-walking ancestor preceded human bipedalism(for example, ref. 11). Most subsequent hypotheses dealing withhuman hand evolution have been framed assuming a ‘long-handed/short-thumbed’ chimp-like hand as the starting points ofthe LCA and basal hominins, with strong selective pressuresacting to reverse these proportions in the context of stone tool-making and/or as a by-product of drastic changes in footmorphology in the human career (for example, ref. 12). However,the current fossil evidence of early hominins2,5,13,14 and fossil
apes15–18 challenges this paradigm. Collectively these fossilssuggest instead that hand proportions approaching the modernhuman condition could in fact be largely plesiomorphic2,4,13, aswas previously suggested before the advent of molecularphylogenetics. If that were the case, this would have profoundimplications relevant to the locomotor adaptations of thechimpanzee-human LCA, as well as the relationship betweenhuman hand structure and the origins of systematized stone toolculture.
To address this complex discussion, and to provide a deeperunderstanding on the evolution of the human and ape hand, inthis study we perform a stepwise series of detailed morphometricand evolutionary analyses on the hand-length proportions ofmodern apes and humans, as compared with a large sample ofextant anthropoid primates and key fossils preserving sufficientlycomplete associated hands. This fossil sample is constituted bythe early hominins Ardipithecus ramidus (4.4 Myr ago)2 andAustralopithecus sediba (B2 Myr ago)14, as well as the primitiveAfrican ape Proconsul heseloni (B18 Myr ago)15 and the Europeanfossil great ape Hispanopithecus laietanus (9.6 Myr ago)17. First, weinspect thumb length relative to the lateral digits (as revealed byray four; that is, intrinsic hand proportions) to show thathumans are distinctive from apes for this important functionalmeasure, but not from some other anthropoids. Second, weanalyse individual hand elements as proportions adjusted viaoverall body size (that is, extrinsic hand proportions) to testwhether modern apes—and more especially African greatapes—represent a homogeneous group from which humansdepart. Here we further show that modern hominoids constitute
Alouatta
Cebus
Nasalis
Macaca
Mandrillus
Papio
Theropithecus
Hylobatidae
Po. pygmaeus
Po. abelii
G. gorilla
G. beringei
Pa. paniscus
Pa. troglodytes
Ho. sapiens
ARA-VP-6/500Ar. ramidus
Pr. heseloniKebara 2
Ho. neanderthalensis
MH2Au. sediba
Qafzeh 9early Ho. sapiens
Relative thumb length (intrinsic)
0.850.750.650.550.450.35
Chimpanzee Human
a b Modern humansModern apes
*
Figure 1 | Intrinsic hand proportions of humans and other anthropoid primates. (a) Drawings of a chimpanzee and human hands are shown to similar
scale. (b) Relative length of the thumb¼ pollical/fourth ray lengths (minus distal fourth phalanx; see inset). Box represents the interquartile range,
centerline is the median, whiskers represent non-outlier range and dots are outliers. The ranges of humans and modern apes are highlighted (green and
red-shaded areas, respectively). Samples for each boxplot are Homo sapiens (n¼40), Pan troglodytes (n¼ 34), Pan paniscus (n¼ 12), Gorilla beringei (n¼ 21),
Gorilla gorilla (n¼ 13), Pongo abelii (n¼8), Pongo pygmaeus (n¼ 19), Hylobatidae (n¼ 14), Theropithecus (n¼ 5), Papio (n¼ 50), Mandrillus (n¼ 3), Macaca
(n¼ 18), Nasalis (n¼ 14), Cebus (n¼ 11) and Alouatta (n¼ 8). The values for Pr. heseloni and Ar. ramidus are projected onto the remaining taxa to facilitate
visual comparisons.
ARTICLE NATURE COMMUNICATIONS | DOI: 10.1038/ncomms8717
2 NATURE COMMUNICATIONS | 6:7717 | DOI: 10.1038/ncomms8717 | www.nature.com/naturecommunications
& 2015 Macmillan Publishers Limited. All rights reserved.

a highly heterogeneous group with differences that cannot beexplained by phylogenetic proximity or size-related effects.Third, we enlist phylogenetically informed comparative methodsto map how the evolution of hand-length proportions has playedout along the individual lineages of our comparative sample.These methods employ statistical models that establish principlesof how continuous trait change is likely to have unfoldedover time, and we explore those principles to infer how thevariation observed in comparative trait measurements is likely tohave changed along the individual branches of a (independentlyderived molecular-based) phylogeny. Importantly from astatistical viewpoint, these methods allow the comparative data(including the fossils) to be analysed within an alternative-hypothesis-testing framework that assesses the statistical fit ofalternative evolutionary scenarios. In our case, we determine howhand-length proportions changed over time and quantify therelative likelihood support of alternative evolutionary hypothesis,thus providing a novel and rigorous analysis of human and apehand evolution.
Our results reveal that the different hand morphologiesexhibited by modern hominoids reflect different evolutionaryprocesses: hylobatids display an autapomorphic hand due toextreme digital and thumb elongation; chimpanzees and orangu-tans exhibit convergent adaptation related to digital elongation (toa lesser degree than hylobatids); whereas the gorilla and homininlineages experienced little change by comparison (that is, theiroverall hand proportions are largely plesiomorphic withincatarrhines). These results support the view that the long thumbrelative to fingers characterizing the human (and australopith)hand required little change since the chimpanzee-human LCA,and was acquired in convergence with other highly dexterousanthropoids such as capuchins and gelada baboons.
ResultsIntrinsic hand proportions. Hand proportions of humans areusually compared with those of apes using the thumb-to-digitratio (or IHPs), which is a good functional measure of thumbopposability and therefore a proxy for manual dexterity (forexample, refs 1,14,19). Accordingly, we queried our anthropoidsample (see details of our sample in Supplementary Table 1) tosee whether our IHP measure (as revealed by the thumb-to-
fourth ray ratio; Fig. 1b) was consistent with previous observa-tions that humans can easily be distinguished from modern apesby a long thumb relative to the other digits4,5,14. The modernhuman IHP range is well above that of modern apes (that is, nooverlap; analysis of variance (ANOVA) with Bonferroni post hoccomparisons, Po0.001; see Supplementary Table 2 for details onthe taxa-specific comparisons), which can be linked directly tothe human capability (unique among modern hominoids20) toperform an efficient ‘pad-to-pad precision grasping’ (that is,broad contact of the distal pads of the thumb and index finger,Supplementary Note 1)1,4,5,13. In contrast, chimpanzees andespecially orangutans are found to have significantly shorterthumbs than gorillas and hylobatids (ANOVA with Bonferronipost hoc comparisons, Po0.001). Fossil hominins fall withinthe modern human range, but Ar. ramidus exhibits a shorterthumb (within the gorilla-hylobatid range), implying limitsto its precision grasping capabilities. Most non-hominoidanthropoids, including the fossil ape Pr. heseloni, exhibit IHPranges in-between modern apes and humans. Both Cebus andTheropithecus overlap in this index with humans, supporting therelationship between this ratio and enhanced manipulative skills(see Supplementary Note 1).
Extrinsic hand proportions. Despite the aforementioned func-tional connections, IHPs provide limited information regardingwhat distinguishes humans from apes: is it a longer thumb,shorter digits or a combination of both? More specifically, whichelements contribute most to the overall ray length? To clarify thisand inspect how each of the individual elements of the thumb andray IV contribute to IHPs (Fig. 1b), we standardized each lengthrelative to overall body size (approximated by the cube root of itsbody mass, BM), creating relative length shape ratios of externalhand proportions (EHPs; Supplementary Fig. 1). Major trends ofEHP variation between the individuals in our anthropoid sampleare summarized and inspected by means of principal componentsanalysis of extant and fossil individuals (Supplementary Table 3),revealing high EHP heterogeneity in extant hominoids (and innon-hominoid anthropoids; Fig. 2a, Supplementary Fig. 1). Inother words, there is a clear EHP structure that allows thecharacterization of the hominoid taxa. Statistical differences inEHP between each great ape genus, hylobatids and humans were
–2.0–1.00.0
1.02.0
3.0
2.0
1.0
0.0
–1.0
4.03.02.01.00.0–1.0–2.00
10
20
30
40
50
60
70
80
Pollicalmetacarpal
Pollicaldistal phalanx
Fourthmetacarpal
Fourthproximal phalanx
Fourthintermediate phalanx
Pollicalproximal phalanx
Rel
ativ
e le
ngth
Po. pygmaeus
Hy. lar
G. beringei
Pa. troglodytes
Ho. sapiens
ARA-VP-6/500
Ar. ramidus S
Pr. heseloni
Al. seniculus
ARA-VP-6/500
Ar. ramidus L
T. geladaPC 3 (6.69%)
PC
2 (
10.4
8%)
PC 1 (79.77%)
Theropithecus
Po. pygmaeusPo. abelii
Papio
Pa. troglodytesPa. paniscus
NasalisMacaca
Hylobatidae
Ho. sapiens
G. beringeiG. gorilla
CebusAlouatta
Qafzeh 9
Kebara 2MH 2
ARA-VP-6/500 SARA-VP-6/500 L
Pr. heseloni
a b
Mandrillus
Figure 2 | Extrinsic hand proportions of humans and other anthropoid primates. (a) Principal components analysis of the body mass-adjusted hand
lengths. (b) Summary of the contribution of each hand element in selected anthropoids. Species are arranged by maximum length of ray IV (notice that the
thumb does not follow the same trend). ARA-VP-6/500 L refers to an iteration of Ar. ramidus with an estimated body mass of 50.8 kg, whereas ARA-VP-6/
500 S uses a smaller estimate of 35.7 kg.
NATURE COMMUNICATIONS | DOI: 10.1038/ncomms8717 ARTICLE
NATURE COMMUNICATIONS | 6:7717 | DOI: 10.1038/ncomms8717 | www.nature.com/naturecommunications 3
& 2015 Macmillan Publishers Limited. All rights reserved.
established (Po0.001) by means of multivariate analysis of var-iance (MANOVA with Bonferroni-corrected post hoc pairwisecomparisons; see Supplementary Table 4). Differences amongextant great ape genera are more apparent when the eigenanalysisis carried out exclusively on great ape individuals (SupplementaryFig. 3), even revealing significant differences between species ofgorillas (P¼ 0.014) and chimpanzees (P¼ 0.047). EHPs ofselected species are depicted to help understand extrememorphologies along the major axes of variation in shape space(Fig. 2b). A complex pattern is revealed: hylobatids, orangutansand chimpanzees (in this order) exhibit longer digits thanhumans, but gorillas do not. Thumb length follows a ratherdifferent trend: hylobatids have both the longest digits and thelongest thumbs, whereas Theropithecus displays the shortest digitsbut not the shortest thumbs (rather, eastern gorillas do). ForAr. ramidus we inspect two different relative shape possibilitiesbased on substantially different but plausible BM estimations:50.8 kg (as a quadruped) and 35.7 kg (as a biped). Fossil homininsdisplay a modern human pattern, but Ar. ramidus shows onlyslightly longer or shorter (BM-depending) digits than Pr. heseloni(that is, it is intermediate between humans and chimpanzees), butin both cases it exhibits shorter thumbs (specifically shorterpollical phalanges; Supplementary Table 3) than this fossil ape
and other hominins, and occupies a different region of EHPshape space (Fig. 2 and Supplementary Fig. 2). The observeddifferences in EHP between hominoid taxa cannot be merelyattributed to size-dependent effects (that is, allometry;Supplementary Fig. 4, Supplementary Table 5).
The evolution of human and ape hand proportions. Previousobservations on modern ape thoraces and limbs suggest thatliving apes show similar but not identical adaptations toaccommodate similar functional demands related to specializedclimbing and suspension (especially Pan and Pongo), reinforcingthe role of parallelism in ape evolution3,21,22, a phenomenonexplained by common evolutionary developmental pathways inclosely related taxa23. To test this homoplastic hypothesis forsimilarities in hand-length proportions between suspensory taxa,we enlist the ‘surface’ method24, which allows inferring thehistory of adaptive diversification in hominoids (and otheranthropoids) using a phylogeny (Fig. 3) and phenotypic data, inthis case the two major axes of EHP variation among extant andfossil species (accounting for 94.5% of variance; see Fig. 4 andSupplementary Table 7). This method models adaptiveevolutionary scenarios by fitting a multi-regime Ornstein
Alouatta belzebulAlouatta palliataAlouatta seniculusCebus albifronsCebus apellaNasalis larvatusMandrillus leucophaeusMandrillus sphinxTheropithecus geladaPapio hamadryasMacaca sylvanusMacaca fascicularisMacaca sinicaMacaca mauraMacaca nigraMacaca silenusMacaca nemestrinaMacaca fuscata
Proconsul heseloni
Hylobates pileatusHylobates lar
Hylobates agilis
Hylobates molochHylobates muelleri
Pongo abeliiPongo pygmaeusGorilla gorillaGorilla beringeiPan paniscusPan troglodytes
Ardipithecus ramidusAustralopithecus sediba
Homo neanderthalensisHomo sapiens
Symphalangus syndactylus
Hom
inoidea
40 30 20 10 0Myr
Hylobatidae
Hom
inidaeC
ercopithecidae
Platyrrhini
Catarrhini
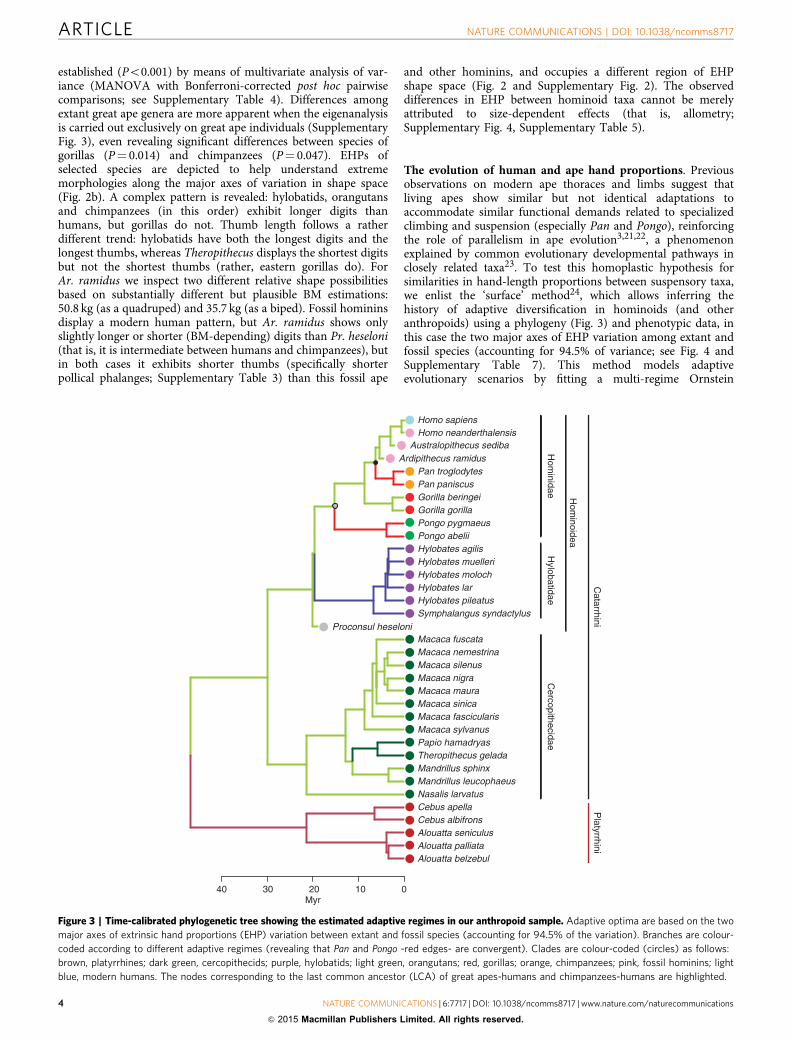
Figure 3 | Time-calibrated phylogenetic tree showing the estimated adaptive regimes in our anthropoid sample. Adaptive optima are based on the two
major axes of extrinsic hand proportions (EHP) variation between extant and fossil species (accounting for 94.5% of the variation). Branches are colour-
coded according to different adaptive regimes (revealing that Pan and Pongo -red edges- are convergent). Clades are colour-coded (circles) as follows:
brown, platyrrhines; dark green, cercopithecids; purple, hylobatids; light green, orangutans; red, gorillas; orange, chimpanzees; pink, fossil hominins; light
blue, modern humans. The nodes corresponding to the last common ancestor (LCA) of great apes-humans and chimpanzees-humans are highlighted.
ARTICLE NATURE COMMUNICATIONS | DOI: 10.1038/ncomms8717
4 NATURE COMMUNICATIONS | 6:7717 | DOI: 10.1038/ncomms8717 | www.nature.com/naturecommunications
& 2015 Macmillan Publishers Limited. All rights reserved.
Uhlenbeck (OU) stabilizing selection model25 to the tip data. Thisprocedure allows taxonomic units to undergo shifts towardsdifferent phenotypes (‘adaptive peaks’) and can be used toidentify cases where multiple lineages have discovered the sameselective regimes (that is, convergence). Regimes are hereunderstood as comprising a group of taxonomic units that areinferred to have similar phenotypes. Adaptive peaks can beunderstood as the optimal phenotypic values that characterize thedifferent regimes. The advantage of the surface method is that itlocates regime shifts without a prior identification of regimes. Themethod hereby fits a series of stabilizing selection models anduses a data-driven stepwise algorithm to locate phenotypic shiftson the tree. Thus, this method allows to ‘naively’ detect instancesof phenotypic convergence in human and ape hand proportions.Starting with an OU model in which all species are attracted to asingle adaptive peak in morphospace, ‘surface’ uses a stepwisemodel selection procedure based on the finite-samples Akaikeinformation criterion (AICc)26,27 to fit increasingly complexmulti-regime models. At each step, a new regime shift is added tothe branch of the phylogeny that most improves model fit acrossall the variables inspected, and shifts are added until no furtherimprovement is achieved. To verify true convergence, thismethod then evaluates whether the AICc score is further
improved by allowing different species to shift towards sharedadaptive regimes rather than requiring each one to occupy itsown peak. For the EHPs, ‘surface’ detects five adaptive optima(see edge colours in phylogenetic tree in Fig. 3) corresponding to(1) Cebus and Alouatta; (2) Papio and Theropithecus; (3) Macaca,Mandrillus, Nasalis, Gorilla and hominins; (4) hylobatids; and (5)Pan and Pongo. In other words, in terms of human and great apeevolution ‘surface’ identifies convergent evolution between theEHPs of Pan and Pongo, whereas Gorilla and hominins share amore plesiomorphic condition for catarrhines. To verify thisresult, we compare the statistical fit of this evolutionary scenariowith that of five other evolutionary hypotheses based on therespective relative AICc weights (Supplementary Fig. 5;Supplementary Table 8). The alternative models includeBrownian motion evolution, a single-regime OU model, amulti-regime OU model differentiating the different clades, andmost importantly an alternative version of the five-regime OUmodel detected by ‘surface’ in which the condition shared by Panand Pongo is hypothesized to represent the plesiomorphic statefor great apes (OU5 ‘alt’ in Supplementary Fig. 5). Our resultssupport the ‘surface’ output as the best fit model using either alarge or a small body size estimate for Ar. ramidus (DAICc¼ 0.00,AICc weight¼ 1.00), and even when excluding Ar. ramidus and
−10 −5 0 5 10 15 20
−5
05
PC 1 (86.21%)
PC
2 (
8.30
%)
b
Ar. ramidus**
Ar. ramidus*
−10 −5 0 5 10 15 20
–50
5
PC 1 (86.34%)
PC
2 (
8.18
%)
Al. belzebul Al. palliata Al. seniculus
C. albifrons C. apella
N. larvatus
Man. leucophaeus Man. sphinx
T. gelada
Pap. hamadryas
Pr. heseloni
S. syndactylus
Hy. pileatus
Hy. lar
Hy. agilisHy. molochHy. muelleri
Po. abelii
Po. pygmaeusG. gorillaG. beringei
Pa. paniscus Pa. troglodytes
Ho. sapiens
Ho.neanderthalensis
Au. sediba
Root
a
Great ape-human LCA
Chimpanzee-humanLCA
(+ 95% CI)
(Ar. ramidus** = 35.7 kg)
0
10
20
30
40
50
60Relative length
Pa. troglodytes
Ho. sapiens
Chimpanzee-
human LCA
(Ar. ramidus* = 50.8 kg)
Chimpanzee-
human LCA
0
10
20
30
40
50
60
Pa. troglodytes
Ho. sapiens
Relative length
c
d
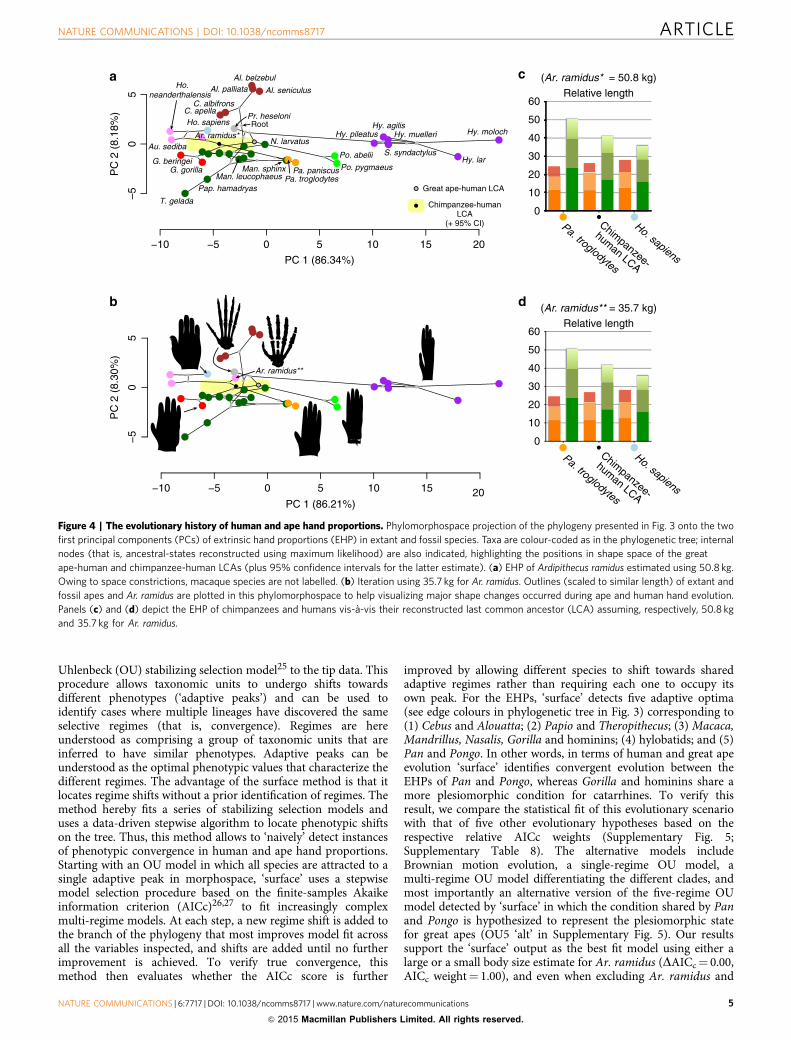
Figure 4 | The evolutionary history of human and ape hand proportions. Phylomorphospace projection of the phylogeny presented in Fig. 3 onto the two
first principal components (PCs) of extrinsic hand proportions (EHP) in extant and fossil species. Taxa are colour-coded as in the phylogenetic tree; internal
nodes (that is, ancestral-states reconstructed using maximum likelihood) are also indicated, highlighting the positions in shape space of the great
ape-human and chimpanzee-human LCAs (plus 95% confidence intervals for the latter estimate). (a) EHP of Ardipithecus ramidus estimated using 50.8 kg.
Owing to space constrictions, macaque species are not labelled. (b) Iteration using 35.7 kg for Ar. ramidus. Outlines (scaled to similar length) of extant and
fossil apes and Ar. ramidus are plotted in this phylomorphospace to help visualizing major shape changes occurred during ape and human hand evolution.
Panels (c) and (d) depict the EHP of chimpanzees and humans vis-a-vis their reconstructed last common ancestor (LCA) assuming, respectively, 50.8 kg
and 35.7 kg for Ar. ramidus.
NATURE COMMUNICATIONS | DOI: 10.1038/ncomms8717 ARTICLE
NATURE COMMUNICATIONS | 6:7717 | DOI: 10.1038/ncomms8717 | www.nature.com/naturecommunications 5
& 2015 Macmillan Publishers Limited. All rights reserved.

Pr. heseloni from the analysis (DAICc¼ 0.00, AICc weight¼ 0.77).To test the sensitivity of our results to a possible sampling biasdue to the higher number of hominoid species in comparisonwith monkey clades in our sample, we repeat the analysis oncemore after excluding the most speciose and morphologicallyderived group of hominoids (the hylobatid species), together withthe fossil closest to the hominoid LCA in our sample (that is,Pr. heseloni). Again, ‘surface’ identifies a best fit model in whichPan and Pongo are convergent, with the difference that theslightly reduced digits of gorillas and hominins are nowinterpreted as being convergent with baboons, while theremaining monkey taxa share a common, more plesiomorphic,regime (Supplementary Fig. 6). This evolutionary scenario alsohas the best support (DAICc¼ 0.00, AICc weight¼ 0.92) whencompared with Brownian motion, and four other alternativeevolutionary scenarios (Supplementary Table 8). Importantly interms of human and ape evolution, irrespective of the differencein results between the full vs reduced hominoid sample,the similarities between the EHP of hominins and gorillas arereconstructed as representing the plesiomorphic condition for theAfrican ape and human clade (Fig. 3), while Pan would be morederived (and convergent with Pongo).
Furthermore, to visually track major evolutionary changesdriving differences between apes and humans, we summarize theevolutionary history of hominoid hand length diversification (ascompared with platyrrhine and cercopithecid monkey out-groups) by means of a phylomorphospace approach28. Theseare the steps that we followed: First, we reconstructedhypothetical ancestral morphologies (that is, internal nodes inFig. 3) using a maximum likelihood approach and plotted themon the shape space defined by the two major EHP axes ofvariation among extant and fossil species (Fig. 4). Second, wemapped our time-calibrated phylogenetic tree (Fig. 3) onto thisshape space by connecting the ancestral sate reconstructions andthe terminal taxa. The lengths and orientations of the branches ofthis phylomorphospace allows one to intuitively visualize themagnitude and directionality of inferred shape changes alongeach branch of the tree. Owing to the possible impact ofAr. ramidus in the reconstruction of the chimpanzee-human LCA(based on its proximity in time), we present this analysis withboth large and small body size estimates (Fig. 4a,b respectively),as well as by excluding Ar. ramidus and Pr. heseloni(Supplementary Fig. 7). In all cases, major evolutionary changesalong PC1 (B86% of variance; see Supplementary Table 7) relateto digital (primarily metacarpal and proximal phalanx)lengthening/shortening (positive and negative values,respectively), whereas PC2 (B8% of variance) relates to thumbproximal phalanx (positive values) and digital metacarpal(negative values) lengthening, and thereby serves to separateour platyrrhine and catarrhine taxa (especially baboons).Although the position of Ar. ramidus in shape space differsdepending on estimated BM, the overall evolutionary patternremains constant: from moderate digital length, digitallengthening has been achieved to different degrees andindependently in chimpanzees, orangutans and hylobatids (inthis increasing order; with Pan and Pongo sharing the sameadaptive optimum, see Fig. 3). In contrast, hominins and gorillas(especially eastern gorillas) have slightly reduced their digitallengths (although both would still represent the sameevolutionary regime, see Fig. 3). In terms of thumb evolution,only a modest reduction in extant great apes and slight elongationin later hominins appears to have occurred. It is worth noticingthat, irrespective of which Ar. ramidus BM estimate is used, Panfalls clearly outside of the 95% confident interval for the estimatedchimpanzee-human LCA, whereas Ar. ramidus is very close to it(Fig. 4), as previously suggested2,29. This supports the idea that
chimpanzees exhibit derived hands, in this case convergent withPongo (Fig. 3).
This previous phylogenetic patterning observed in our EHPmorphospace (that is, homoplasy along PC1, and more clade-specific groups along PC2; see Fig. 4) was tested with Blomberg’sK statistic30. Our results indicate that for PC2 variance isconcentrated among clades (K41; 1,000 permutations,P¼ 0.001): Alouatta (long thumb proximal phalanx and shortdigital metacarpal) and baboons (reverse condition of howlermonkeys) are situated at opposite extremes, and othercercopithecids and hominoids exhibit intermediate values. ForPC1, however, the variance is concentrated within clades (Ko1;1,000 permutations, P¼ 0.001), indicating that the observedvariance in finger length (that is, PC1) is larger than expectedbased on the structure of the tree. This supports the idea ofadaptive evolution (that is, shape change associated with changein function)31 in hominoid finger length uncorrelated withphylogeny30. In other words, finger lengthening has beenachieved homoplastically in different ape lineages (probably inrelation to increased suspensory behaviours), as also revealed byour multi-regime OU modelling (Fig. 3, Supplementary Figs 5and 6) and phylomorphospace approach (Fig. 4).
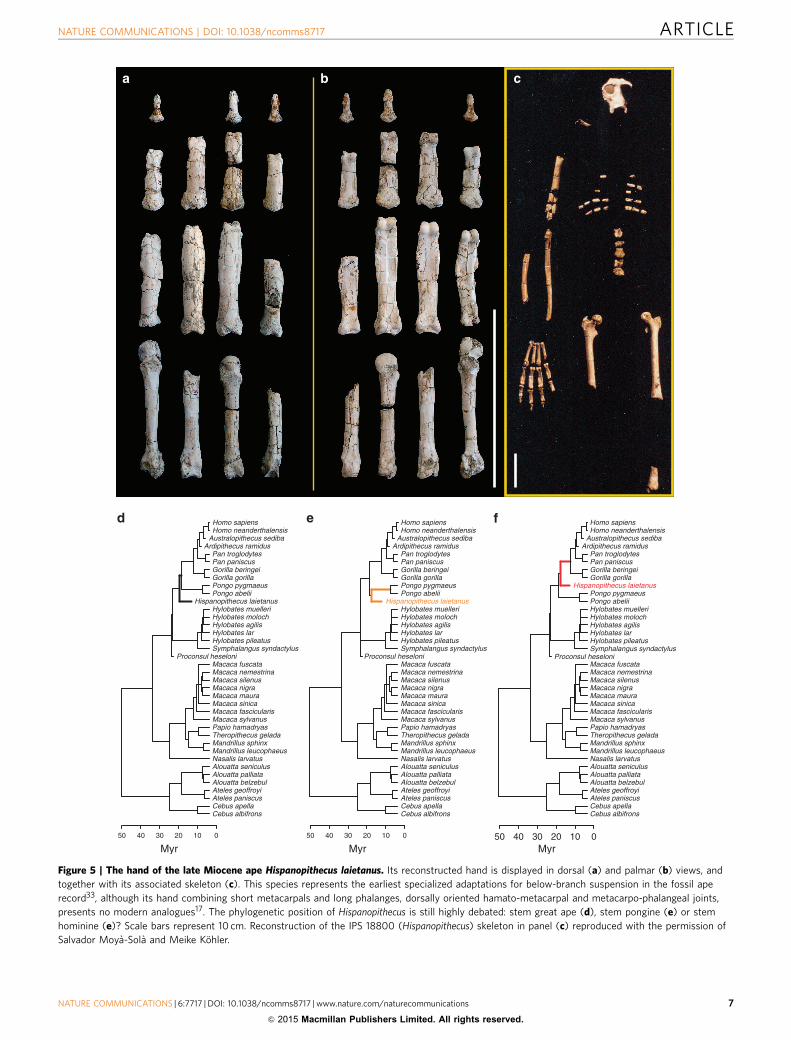
To inspect how the addition of more taxa with long fingersaffects our evolutionary reconstructions of digital length, werevisit the phylomorphospace after excluding the thumbelements. Specifically, we incorporate the fossil ape Hispano-pithecus laietanus17 (which does not preserve thumb elements;Fig. 5a–c) and the suspensory platyrrhine Ateles (which exhibitsonly a vestigial thumb32). Hi. laietanus represents the earliestevidence of specialized adaptations for below-branch suspensionin the fossil ape record17,33. However, its phylogenetic position isnot resolved, being alternatively considered as a stem great ape, astem pongine or even a stem hominine (Fig. 5d–f). In the fourthray morphospace (Fig. 6), PC1 (B92% of variance;Supplementary Table 7) is mainly related positively tometacarpal and proximal phalanx lengths, whereas PC2 (B6%of variance) is positively related to metacarpal length andnegatively to proximal phalanx length. When ancestral statereconstructions and phylogenetic mapping are inspected in thisphylomorphospace, the overall evolutionary pattern reflectinghomoplasy in modern (and fossil) ape digital elongation is alsoevident, irrespective of the BM estimate of Ar. ramidus and thephylogenetic position of Hi. laietanus (Fig. 6). Specifically, theseresults also indicate independent digital elongation (to differentdegrees) in hylobatids, orangutans, chimpanzees, spider monkeysand Hi. laietanus. Although chimpanzees and Hi. laietanusexhibit a similar relative digital length (Supplementary Fig. 4b), ithas been achieved by different means. In contrast to chimpanzeesand baboons that display long metacarpals relative to proximalphalanges (as revealed by PC1 in Fig. 6), Hi. laietanus approachesa condition similar to that of howler monkeys by exhibiting longphalanges relative to short metacarpals (as revealed by PC2 inFig. 6). Overall, these results match the previously recognizedmosaic nature of the Hi. laietanus hand morphology17, whichsuggests that its suspensory-related adaptations evolvedindependently from that of other apes. More broadly, eventhough the living hominoid lineages represent the few remnantsof a much more prolific group during the Miocene22, the evidencepresented above indicate that hominoids constitute a highlydiversified group in terms of hand proportions (as identified inFig. 2, Supplementary Fig. 1, and Figs 4 and 6).
Finally, we reconstruct the evolution of IHPs (see Fig. 1) ofhumans and modern apes as having evolved in oppositedirections from moderate IHP similar to those exhibited byPr. heseloni (Supplementary Fig. 8). On the basis of the previousresults on EHP evolution (Fig. 4), this implies that the relatively
ARTICLE NATURE COMMUNICATIONS | DOI: 10.1038/ncomms8717
6 NATURE COMMUNICATIONS | 6:7717 | DOI: 10.1038/ncomms8717 | www.nature.com/naturecommunications
& 2015 Macmillan Publishers Limited. All rights reserved.
50
Cebus albifronsCebus apellaAteles paniscusAteles geoffroyiAlouatta belzebulAlouatta palliataAlouatta seniculusNasalis larvatusMandrillus leucophaeusMandrillus sphinxTheropithecus geladaPapio hamadryasMacaca sylvanusMacaca fascicularisMacaca sinicaMacaca mauraMacaca nigraMacaca silenusMacaca nemestrinaMacaca fuscata
Proconsul heseloniSymphalangus syndactylusHylobates pileatusHylobates larHylobates agilisHylobates molochHylobates muelleri
Hispanopithecus laietanusPongo abeliiPongo pygmaeusGorilla gorillaGorilla beringeiPan paniscusPan troglodytes
Ardipithecus ramidusAustralopithecus sedibaHomo neanderthalensisHomo sapiens
40 30 20 10 0
Cebus albifronsCebus apellaAteles paniscusAteles geoffroyiAlouatta belzebulAlouatta palliataAlouatta seniculusNasalis larvatusMandrillus leucophaeusMandrillus sphinxTheropithecus geladaPapio hamadryasMacaca sylvanusMacaca fascicularisMacaca sinicaMacaca mauraMacaca nigraMacaca silenusMacaca nemestrinaMacaca fuscata
Proconsul heseloniSymphalangus syndactylusHylobates pileatusHylobates larHylobates agilisHylobates molochHylobates muelleri
Hispanopithecus laietanusPongo abeliiPongo pygmaeusGorilla gorillaGorilla beringeiPan paniscusPan troglodytes
Ardipithecus ramidusAustralopithecus sedibaHomo neanderthalensisHomo sapiens
50 40 30 20 10 0
Cebus albifronsCebus apellaAteles paniscusAteles geoffroyiAlouatta belzebulAlouatta palliataAlouatta seniculusNasalis larvatusMandrillus leucophaeusMandrillus sphinxTheropithecus geladaPapio hamadryasMacaca sylvanusMacaca fascicularisMacaca sinicaMacaca mauraMacaca nigraMacaca silenusMacaca nemestrinaMacaca fuscata
Proconsul heseloniSymphalangus syndactylusHylobates pileatusHylobates larHylobates agilisHylobates molochHylobates muelleriPongo abeliiPongo pygmaeus
Hispanopithecus laietanusGorilla gorillaGorilla beringeiPan paniscusPan troglodytes
Ardipithecus ramidusAustralopithecus sedibaHomo neanderthalensisHomo sapiens
50 40 30 20 10 0
d e f
a b c
Myr MyrMyr
Figure 5 | The hand of the late Miocene ape Hispanopithecus laietanus. Its reconstructed hand is displayed in dorsal (a) and palmar (b) views, and
together with its associated skeleton (c). This species represents the earliest specialized adaptations for below-branch suspension in the fossil ape
record33, although its hand combining short metacarpals and long phalanges, dorsally oriented hamato-metacarpal and metacarpo-phalangeal joints,
presents no modern analogues17. The phylogenetic position of Hispanopithecus is still highly debated: stem great ape (d), stem pongine (e) or stem
hominine (e)? Scale bars represent 10 cm. Reconstruction of the IPS 18800 (Hispanopithecus) skeleton in panel (c) reproduced with the permission of
Salvador Moya-Sola and Meike Kohler.
NATURE COMMUNICATIONS | DOI: 10.1038/ncomms8717 ARTICLE
NATURE COMMUNICATIONS | 6:7717 | DOI: 10.1038/ncomms8717 | www.nature.com/naturecommunications 7
& 2015 Macmillan Publishers Limited. All rights reserved.

long thumb of humans and short thumb of modern apes wouldhave been driven primarily by digital elongation/shorteningrather than by drastic changes in thumb length. The comparisonof eight multi-regime OU models (Supplementary Table 8)identifies a best fit model (DAICc¼ 0.00, AICc weight¼ 1.00)based on four different optima in which Cebus and Theropithecusare convergent with Australopithecus/Homo for a relatively long(that is, easily opposable) thumb; Pan is convergent with Pongoand Nasalis for very short thumbs; and hylobatids, gorillas andAr. ramidus share the putative plesiomorphic, ‘moderate’condition for crown apes (Supplementary Fig. 9).
DiscussionCollectively, our results support several evolutionary scenarioswith profound and far-reaching implications regarding ape andhuman origins (see Supplementary Note 2 for an extendedbackground in this matter): (1) extant apes are heterogeneous interms of hand-length proportions (as inspected by means of theirEHP; Fig. 2, Supplementary Figs S1–S3), a finding contrary to aPan-like ancestor ‘based on parsimony’. In other words, ourresults falsify the view that extant apes, and particularly Africanapes, constitute a homogeneous group with subtle deviationsfrom a similar allometric pattern (for example, ref. 34; see alsoour Supplementary Fig. 4). This previous idea, together with thephylogenetic proximity between Pan and Homo, has beencommonly used as support for the hypothesis that homininsevolved from a Pan-like ancestor (for example, ref. 10). Ourresults, and the palaeontological evidence indicating
mosaic-manner evolution of the hominoid skeleton16,17,33,should caution us against relying on evolutionary scenarios thatassume that extant apes are good ‘overall’ ancestral models22.(2) Low levels of inter-limb integration in hominoids relative toother anthropoids (that is, higher postcranial heterogeneity)have been used to claim that during hominoid evolutionnatural selection operated for functional dissociation betweenhomologous pairs of limbs, allowing for evolutionary‘experimentation’35. For hand length proportions, our resultsindicate that Pan and Pongo are convergent (Fig. 3,Supplementary Fig. 9), whereas hylobatids evolved long digitsin parallel to them, but to a larger extent (PC1 in Figs 4 and 6),thus representing extreme outliers (related to their small size andspecialized ricochetal brachiation). Thus, in terms of evolution ofdigital elongation, we hypothesize that in some ape lineagesnatural selection acted on (co)variation in inter-limb lengths andhand proportions in the context of specialized adaptation forbelow-branch suspension. This scenario matches previousevidence suggesting the extant ape lineages survived the lateMiocene ape extinction event because they specialized, and wereable to share habitats with the radiating and soon to be dominantcercopithecids23,36. (3) Similarities in hand proportions betweenhumans and gorillas and our ancestral African ape reconstruction(Figs 2–4) indicate that the possession of very long digits was nota requisite for the advent of knuckle walking. (4) Thesesimilarities also indicate that specialized tree climbing was notprecluded in australopiths based on hand length. (5) Humanshave only slightly modified finger and thumb lengths sincetheir LCA with Pan (Fig. 4, Supplementary Fig. 8), probably inrelation to refined manipulation, as suggested by the convergentsimilarities with Cebus and Theropithecus (Fig. 1, SupplementaryFigs 8 and 9). This probably occurred with the advent of habitualbipedalism in hominins, and almost certainly preceded regularstone culture4,5,13.
Our results provide a detailed picture on the evolution of thehand that is drawn from a multiple-regime model-fittingapproach that infers the evolutionary scenario that indicates theoptimal statistical fit for the observed differences in handproportions between apes and humans, in terms of both thetotal amount and direction of shape changes. These results arealso most consistent with previous observations on pervasivehomoplasy and complex evolution of the modern ape post-cranium3,21,35, as well as with the available evidence from fossilapes and early hominins1,2,22,29,37.
MethodsIntrinsic hand proportions. The IHPs were computed as the ratio between thelong bones of the thumb (metacarpal, proximal and distal phalanges) and the longbones of the fourth ray but excluding the distal phalanx, which is not wellrepresented in the fossil record (that is, metacarpal, proximal and intermediatephalanges). A total of 270 modern anthropoids, including humans, all the speciesof great apes, hylobatids, as well as cercopithecid and platyrrhine monkeys(Supplementary Table 1) were compared with available fossils (Fig. 1), and dif-ferences between extant taxa were tested via ANOVA (with Bonferroni posthoccomparisons; Supplementary Table 2). As the emphasis of this work is on theevolution of the human hand, comparisons were made to our closest living relatives(that is, the great apes) at the species level. Hylobatids were pooled at the familylevel and extant non-hominoid anthropoids at the genus level. Some of the monkeygroups are represented by small samples (for example, Theropithecus, Mandrillus)due to the difficulty of finding associated distal phalanges (pollical in this case) inthe museum collections (most of them were apparently lost during the skinningand preparation process). However, we still included these taxa because theyprovide relevant phylogenetic background to understanding the evolution of handproportions in apes and humans.
The fossil sample included the associated hands of Ar. ramidus (ARA-VP-6/500)and Au. sediba (MH2), whose measurements were taken from published sources2,14;the hands of Homo neanderthalensis (Kebara 2) and fossil Homo sapiens (Qafzeh 9),which were measured from the originals, and the fossil ape Proconsul heseloni,measurements of which were also taken from the originals (KNM-KPS 1,KNM-KPS 3 and KNM-RU 2036). For Ar. ramidus, pollical proximal phalanx
−10 −5 0 5 10 15 20
−5
0
5
PC 1 (92.83%)
PC
2 (
6.88
%)
Al. belzebul Al. seniculus
C. albifrons C. apella
N. larvatus
Man. leucophaeusMan. sphinx
T. gelada
Pap. hamadryas
S. syndactylusHy. pileatus
Hy. lar
Hy. agilis
Hy. moloch
Hy. muelleri
Po. abeliiPo. pygmaeus
G. gorillaG. beringei
Pa. paniscus
Pa. troglodytes
Ar. ramidus*
Ho.neanderthalensis
Au. sediba
−10 −5 0 5 10 15 20
−5
0
5
PC 1 (92.75%)
PC
2 (
6.96
%)
Hi. laietanusAl. palliata
At. geoffroyiAt. paniscusHo. sapiens
Pr. heseloni
(Ar. ramidus* = 50.8 kg)
(Ar. ramidus** = 35.7 kg)b
a
Ar. ramidus**
Great ape-human LCA
Chimpanzee-human LCA
Root
Figure 6 | Reconstructed evolutionary histories of human and ape digital
extrinsic proportions. The phylomorphospace approach was limited to the
three long bones of ray IV to include the fossil ape Hispanopithecus laietanus
and Ateles species. The same analysis was iterated with the large (a) and
small (b) body mass estimates of Ardipithecus ramidus (finding no
differences in the overall evolutionary pattern). Internal nodes (that is,
ancestral-state reconstructions) and branch lengths are indicated for three
different phylogenetic hypotheses: Hi. laietanus as a stem great ape (black),
a stem pongine (orange) and stem African ape (red). Species names are
indicated in (a) with the exception of macaques.
ARTICLE NATURE COMMUNICATIONS | DOI: 10.1038/ncomms8717
8 NATURE COMMUNICATIONS | 6:7717 | DOI: 10.1038/ncomms8717 | www.nature.com/naturecommunications
& 2015 Macmillan Publishers Limited. All rights reserved.
length in ARA-VP-6/500 was estimated in 25.7 mm from the pollical proximalphalanx/fourth metacarpal proportion in the ARA-VP-7/2 individual, and thefourth metacarpal length in ARA-VP-6/500, as in Lovejoy et al., 2009 (ref. 2). ForPr. heseloni, the estimated length of the KNM-RU 2036 pollical metacarpal wasextracted from the literature15,38. IHP in Pr. heseloni was computed from the meanproportions obtained after standardizing each manual element by the BM in thethree specimens (see next section).
Shape analyses of extrinsic hand proportions. EHPs were computed for anextant sample of 187 anthropoid primates (Supplementary Table 1) and the fossilsdescribed above by standardizing the length (in mm) of each of the six manualelements (inspected in the IHP) by cube root of the BM (kg) associated with eachindividual. As tissue density is very similar in all terrestrial organisms (and closelyapproaches unity), mass can be taken as roughly equivalent to volume, and thecube root of BM (‘the nominal length of measure’) is therefore proportional tolinear ‘size’39–41.
Major trends in EHP variation between the individuals of our sample wereexamined by means of a principal components analysis carried out on thecovariance matrix (Fig. 2; Supplementary Figs 2 and 3; Supplementary Table 3).Differences between groups were tested via MANOVA (and Bonferroni post hoccomparisons; Supplementary Table 4) of the first three PCs. EHPs were furtherexamined for the fourth ray only (if thumb bones are missing) to include the lateMiocene ape Hispanopithecus laietanus (IPS 18800; Figs 5 and 6), for whichmanual lengths were taken from the original fossil17. As this latter analysis wasrestricted to the fourth ray, we also included species of Ateles, which shows a‘rudimentary’ thumb32.
Allometric regressions. We relied on ratios to assess intrinsic and extrinsic handproportions in our sample, and thus quantify the actual shape of each individual asa scale-free proportion. We favour ratios here over residuals because residualsderived from allometric regressions are not a property inherent to the individuals,but rather are sample-dependent42. However, to test whether differences betweenthe hand length proportions in our ape sample could be attributed to size-relatedshape changes (that is, allometry), we constructed separate bivaritate plots for thenatural log-transformed lengths of the thumb and fourth ray relative BM(Supplementary Fig. 5). Least square regressions were fitted to these dataindependently for the extant hominid genera and hylobatids, and grade shifts wereinspected through Bonferroni post hoc comparisons between estimated marginalmeans (Supplementary Table 5) after checking for homogeneity of slopes viaanalysis of covariance (ANCOVA).
Body mass estimation. Known BMs (kg) were taken from museum records forthe extant samples whenever available. Individuals with recorded BM were used toderive genus-specific regressions of BM on femoral head diameter (FHD; in mm).These equations were then used to estimate the BM of additional individuals ofunknown BM from their FHD (for example, the Pan-specific regression was usedto estimate the BM of Pan specimens only). Generic regressions are provided inSupplementary Table 6.
We also derived our own BM estimates for fossils. For example, we used aregression of BM on FHD of sex-specific means of a diverse group of ‘smallhumans’ (Supplementary Table 6) to estimate the BM of Au. sediba; this yielded avalue of 32.5 kg, close to the previous (slightly higher) estimate based on thecalcaneus43, but slightly lower than a previous estimate based on FHD44. The caseof Ar. ramidus is more complex: first, a published FHD is not available for thisspecies, although estimated FHD can be bracketed from acetabular diameter45 asapproximately 32–37 mm; second, since Ar. ramidus is described as a facultativebiped still practicing above-branch pronograde quadrupedalism2,37, the mostappropriate reference sample (bipeds versus quadrupeds) for estimates of its BM isopen to question (see also Sarmiento and Meldrum for a different interpretation)46.Accordingly, we estimated the BM in ARA-VP-6/500 twice using alternativeregressions based on chimpanzees (the hominoid quadrupedal reference sample)and the aforementioned ‘small humans’ (the bipedal training sample), whichyielded values of 50.8 and 35.7 kg, respectively. For Hispanopithecus laietanus (IPS18800) BM estimates using a Pongo or a Pan regression generate very similarresults (36.9 and 37.6 kg, respectively); therefore, an average of these two values wasused, which is comparable to previous estimates33. For other hominin fossils, a BMestimate based on FHD was available in the literature for Qafzeh 9 (ref. 47), andanother prediction based on bi-iliac breadth was used for Kebara 2 (ref. 48). For theProconsul heseloni individuals, BM estimates using different methods andregressions from various preserved anatomical regions were also available49.
Phylogenetic trees. The time-scaled phylogeny used in this work is based on aconsensus chronometric tree of extant anthropoid taxa downloaded from 10kTreesWebsite (ver. 3; http://10ktrees.fas.harvard.edu/), which provides phylogeniessampled from a Bayesian phylogenetic analysis of eleven mitochondrial and sixautosomal genes available in GenBank, and adding branch lengths dated withfossils50. With the exception of Neanderthals (for which molecular data isavailable), other fossil species were introduced post hoc. For these fossil species, as acriterion of standardization, ghost lineages of one million years were added to the
published age of the fossil. Au. sediba and Ar. ramidus were introduced into thehominin lineage as it is most commonly accepted29,51, although controversy existsfor Ar. ramidus52–54. Pr. heseloni is most universally interpreted as a stemhominoid15,16,55,56, although others consider it as a stem catarrhine52. There is notgeneral consensus for placement of the late Miocene ape from Spain Hi. laietanus.Its phylogenetic position is debated between stem great ape57, stem pongine33 orstem hominine55. Therefore, we created three different trees including this taxonand reiterated the analyses (Figs 5 and 6).
Multi-regime OU modelling. Based on its mathematical tractability, the mostfrequently used statistical model of evolution is Brownian motion, which assumesthat traits change at each unit of time with a mean change of zero and unknownand constant variance58–60. Within Brownian motion, the evolution of acontinuous trait ‘X’ along a branch over time increment ‘t’ is quantified asdX(t)¼ sdB(t), where ‘s’ constitutes the magnitude of undirected, stochasticevolution (‘s2’ is generally presented as the Brownian rate parameter) and ‘dB(t)’ isGaussian white noise. Although novel phylogenetic comparative methods continueusing Brownian evolution as a baseline model, they incorporate additionalparameters to model possible deviations from the pure gradual mode of evolutionassumed by Brownian motion. Ornstein–Uhlenbeck (OU) models incorporatestabilizing selection as a constraint and hereby quantify the evolution of acontinuous trait ‘X’ as dX(t)¼ a[y�X(t)]dtþsdB(t) where ‘s’ captures thestochastic evolution of Brownian motion, ‘a’ determines the rate of adaptiveevolution towards an optimum trait value ‘y’ (see ref. 25). This standard OU modelhas been modified into multiple-optima OU models allowing optima to vary acrossthe phylogeny61. In these implementations the parameters are defined a priori,which allows testing the relative likelihood of alternative parameterizations(whereby each parameterization characterizes a different evolutionary scenario thatexplains the evolution of a trait). Importantly, this approach allows fittingmultivariate data, circumventing issues that stem from iteratively fitting univariatedata. These model-fitting approaches are available in the R package ‘ouch’ (ref. 62)and are particularly powerful in testing the relative likelihood of alternativeevolutionary scenarios explaining multivariate data. Although this OU modelfitting approach comprises a powerful way of comparing the likelihood ofalternative evolutionary scenarios, it leaves open the possibility that the ‘best-fit’evolutionary scenario is not included in the research design. In this context, Ingram& Mahler (ref. 24) expanded the OU model fitting approach by developing a way toestimate the number of shifts and their locations on the phylogeny, rather than apriori assuming them. This method (‘surface’) was developed specifically to identifyinstances of convergent evolution and can be used to extract the evolutionaryscenario that indicates the best statistical fit (that is, the lowest Akaike informationcriterion based on the finite samples, AICc)26,27 between the phylogeny and theobserved measurements. We subsequently translated the best fit model from‘surface’ to ‘ouch’ to compare it with alternative hypotheses in a fully multivariateframework.
Phylomorphospace. The phylomorphospace approach allows one to visualize thehistory of morphological diversification of a clade and infer the magnitude anddirection of shape change along any branch of the phylogeny28. Thus, wereconstructed the evolutionary history of extrinsic hand proportions in apes andhumans (and other anthropoid primates) by projecting our phylogenetic trees(Fig. 3; Fig. 5d,e,f) into our morphospaces (¼ shape space; Figs 4 and 6), based oneigenanalyses of the covariance matrices of the species means (SupplementaryTable 7). This was accomplished by reconstructing the position of the internalnodes (that is, ancestral states) using a maximum likelihood (ML) method forcontinuous characters63,64. For an evolutionary model based on normallydistributed Brownian motion58–60 the ML approach yields identical ancestral stateestimates to the squared-change parsimony method accounting for branch length,which minimizes the total amount shape change along all the branches of thetree65,66. In our case, our results including (Fig. 4) and not including(Supplementary Fig. 7) key fossils, or using different phylogenetic positions of thesame fossils (Fig. 6) were essentially unchanged. This suggests that, although fossilsare useful to more accurately bound ancestral state reconstructions67, in our casethe overall evolutionary patterns recovered are robust. These visualizations werecomputed using the R package ‘phytools’ (ref. 68). 95% confidence intervals(95% CIs) for the last common ancestor (LCA) of chimpanzees and humans werecomputed using the ‘fastAnc’ function implemented in ‘phytools’, and are based onequation [6] of Rohlf (ref. 69) that computes the variance on the ancestral statesestimates. Once these variances are known, 95% CIs on the estimates can becomputed as the estimates þ /� 1.96� the square root of the variances.
Phylogenetic signal. Phylogenetic signal is generally defined as the degree towhich related species resemble each other60,70. We relied on Blomberg’s Kstatistic30 to assess the amount of phylogenetic signal relative to the amountexpected for a character undergoing Brownian motion. This statistic is based on acomparison of the mean squared error of the tip data (measured from thephylogenetic mean) with the mean squared error of the data calculated using thevariance-covariance matrix of the tree. This ratio reflects whether the treeaccurately describes the variance-covariance pattern in the data, and is
NATURE COMMUNICATIONS | DOI: 10.1038/ncomms8717 ARTICLE
NATURE COMMUNICATIONS | 6:7717 | DOI: 10.1038/ncomms8717 | www.nature.com/naturecommunications 9
& 2015 Macmillan Publishers Limited. All rights reserved.
subsequently compared with the expected ratio given the size and the shape of thetree (resulting in the K statistic). When Ko1, close relatives resemble each otherless than expected under Brownian motion, thus indicating that variance isconcentrated within clades rather than among clades. Ko1 is suggestive of a modeof evolution that departs from pure Brownian motion. This departure fromBrownian motion could be caused, among others, by adaptive evolutionuncorrelated with the phylogeny (that is, homoplasy). KB1 indicates that thevariance in the tips accurately reflects phylogenetic relatedness (a mode ofevolution aligning with Brownian motion). When K41, close relatives resembleeach other more than expected under Brownian motion (possibly reflectingstabilizing selection). K is also a measure of the partitioning of variance. Thus,(with Brownian motion as reference) whether K41 the variance tends to bebetween clades, whereas if Ko1 the variance tends to be within clades (LiamRevell, personal communication). The statistical significance of K was evaluatedwith the permutation test (1,000 iterations) described by Blomberg et al. (ref. 30).
References1. Napier, J. Hands. 180 (Princeton Univ. Press, 1993).2. Lovejoy, C. O., Simpson, S. W., White, T. D., Asfaw, B. & Suwa, G. Careful
climbing in the Miocene: The forelimbs of Ardipithecus ramidus and humansare primitive. Science 326, 70–708 (2009).
3. Tuttle, R. in Phylogeny of the Primates. (eds Luckett, W. Patrick & Szalay,Frederick S.) 447–480 (Springer, 1975).
4. Almecija, S. & Alba, D. M. On manual proportions and pad-to-pad precisiongrasping in Australopithecus afarensis. J. Hum. Evol. 73, 88–92 (2014).
5. Alba, D. M., Moya-Sola, S. & Kohler, M. Morphological affinities of theAustralopithecus afarensis hand on the basis of manual proportions and relativethumb length. J. Hum. Evol. 44, 225–254 (2003).
6. Schultz, A. H. Characters common to higher primates and characters specificfor man. Q. Rev. Biol. 11, 259–283 (1936).
7. Straus, W. L. Jr. The riddle of man’s ancestry. Q. Rev. Biol. 24, 200–223 (1949).8. Le Gros Clark, W. E. The Fossil Evidence for Human Evolution 200 (University
of Chicago Press, 1964).9. Ruvolo, M., Disotell, T. R., Allard, M. W., Brown, W. M. & Honeycutt, R. L.
Resolution of the African hominoid trichotomy by use of a mitochondrial genesequence. Proc. Natl Acad. Sci. USA 88, 1570–1574 (1991).
10. Wrangham, R. & Pilbeam, D. in All Apes Great and Small. (eds Galdikas, BiruteM. F. et al.) 5–17 (Kluwer Academic/Plenum Publishers, 2001).
11. Richmond, B. G., Begun, D. R. & Strait, D. S. Origin of human bipedalism: theknuckle-walking hypothesis revisited. Yearb. Phys. Anthropol. 44, 70–105(2001).
12. Rolian, C., Lieberman, D. E. & Hallgrımsson, B. The coevolution of humanhands and feet. Evolution 64, 1558–1568 (2010).
13. Almecija, S., Moya-Sola, S. & Alba, D. M. Early origin for human-like precisiongrasping: A comparative study of pollical distal phalanges in fossil hominins.PLoS ONE 5, e11727 (2010).
14. Kivell, T. L., Kibii, J. M., Churchill, S. E., Schmid, P. & Berger, L. R.Australopithecus sediba hand demonstrates mosaic evolution of locomotor andmanipulative abilities. Science 333, 1411–1417 (2011).
15. Napier, J. R. & Davis, P. R. The fore-limb skeleton and associated remains ofProconsul africanus. Foss. Mamm. Afr. 16, 1–69 (1959).
16. Moya-Sola, S., Kohler, M., Alba, D. M., Casanovas-Vilar, I. & Galindo, J.Pierolapithecus catalaunicus, a new Middle Miocene great ape from Spain.Science 306, 1339–1344 (2004).
17. Almecija, S., Alba, D. M., Moya-Sola, S. & Kohler, M. Orang-like manualadaptations in the fossil hominoid Hispanopithecus laietanus: first steps towardsgreat ape suspensory behaviours. Proc. Biol. Sci. 274, 2375–2384 (2007).
18. Almecija, S., Alba, D. M. & Moya-Sola, S. Pierolapithecus and the functionalmorphology of Miocene ape hand phalanges: paleobiological and evolutionaryimplications. J. Hum. Evol. 57, 284–297 (2009).
19. Schultz, A. H. The skeleton of the trunk and limbs of higher primates. Hum.Biol. 2, 303–438 (1930).
20. Christel, M. in Hands of Primates. (eds Preuschoft, Holger & Chivers, David J.)91–108 (Springer, 1993).
21. Larson, S. G. Parallel evolution in the hominoid trunk and forelimb. Evol.Anthropol. 6, 87–99 (1998).
22. Almecija, S. et al. The femur of Orrorin tugenensis exhibits morphometricaffinities with both Miocene apes and later hominins. Nat. Commun. 4, 2888(2013).
23. Reno, P. L. Genetic and developmental basis for parallel evolution and itssignificance for hominoid evolution. Evol. Anthropol. 23, 188–200 (2014).
24. Ingram, T. & Mahler, D. L. SURFACE: detecting convergent evolution fromcomparative data by fitting Ornstein-Uhlenbeck models with stepwise AkaikeInformation Criterion. Methods Ecol. Evol. 4, 416–425 (2013).
25. Hansen, T. F. Stabilizing selection and the comparative analysis of adaptation.Evolution 51, 1341–1351 (1997).
26. Akaike, H. A new look at the statistical model identification. IEEE Transact.Automatic Control 19, 716–723 (1974).
27. Hurvich, C. M. & Tsai, C.-L. Regression and time series model selection insmall samples. Biometrika 76, 297–307 (1989).
28. Sidlauskas, B. Continuous and arrested morphological diversification in sisterclades of characiform fishes: A phylomorphospace approach. Evolution 62,3135–3156 (2008).
29. White, T. D. et al. Ardipithecus ramidus and the paleobiology of earlyhominids. Science 326, 64–86 (2009).
30. Blomberg, S. P., Garland, T. Jr. & Ives, A. R. Testing for phylogeneticsignal in comparative data: behavioral traits are more labile. Evolution 57,717–745 (2003).
31. Gould, S. J. & Vrba, E. S. Exaptation-a missing term in the science of form.Paleobiology 8, 4–15 (1982).
32. Straus, W. L. Jr. Rudimentary digits in primates. Q. Rev. Biol. 17, 228–243(1942).
33. Moya-Sola, S. & Kohler, M. A Dryopithecus skeleton and the origins of great-ape locomotion. Nature 379, 156–159 (1996).
34. Shea, B. T. Allometry and heterochrony in the African apes. Am. J. Phys.Anthropol. 62, 275–289 (1983).
35. Young, N. M., Wagner, G. P. & Hallgrımsson, B. Development and theevolvability of human limbs. Proc. Natl Acad. Sci. USA 107, 3400–3405 (2010).
36. Jablonski, N. G., Whitfort, M. J., Roberts-Smith, N. & Qinqi, X. The influence oflife history and diet on the distribution of catarrhine primates during thePleistocene in eastern Asia. J. Hum. Evol. 39, 131–157 (2000).
37. Lovejoy, C. O., Latimer, B., Suwa, G., Asfaw, B. & White, T. D. Combiningprehension and propulsion: The foot of Ardipithecus ramidus. Science 326,72–728 (2009).
38. Walker, A. C. & Pickford, M. in New Interpretations of Ape and HumanAncestry. (eds Ciochon, R. L. & Corruccini, R. S.) 325–351 (Plenum Press,1983).
39. Sneath, P. H. & Sokal, R. R. Numerical Taxonomy. The Principles and Practiceof Numerical Classification (1973).
40. Jungers, W. L. in Size and Scaling in Primate Biology. (ed. Jungers, W. L.)345–381 (Plenum Press, 1985).
41. Vogel, S. Life’s Devices: the Physical World of Animals and Plants (PrincetonUniv. Press, 1988).
42. Jungers, W. L., Falsetti, A. B. & Wall, C. E. Shape, relative size, and size-adjustments in morphometrics. Yearb. Phys. Anthropol. 38, 137–161 (1995).
43. Zipfel, B. et al. The foot and ankle of Australopithecus sediba. Science 333,1417–1420 (2011).
44. de Ruiter, D. J., Churchill, S. E. & Berger, L. R. in The Paleobiology ofAustralopithecus 147–160 (Springer, 2013).
45. Plavcan, J. M., Hammond, A. S. & Ward, C. V. Brief Communication:Calculating hominin and nonhuman anthropoid femoral head diameter fromacetabular size. Am. J. Phys. Anthropol. 155, 469–475 (2014).
46. Sarmiento, E. E. & Meldrum, D. J. Behavioral and phylogenetic implications ofa narrow allometric study of Ardipithecus ramidus. HOMO 62, 75–108 (2011).
47. Trinkaus, E. & Ruff, C. Femoral and tibial diaphyseal crosssectional geometryin Pleistocene. Homo. PaleoAnthropology 13, 62 (2012).
48. Ruff, C., Niskanen, M., Junno, J.-A. & Jamison, P. Body mass prediction fromstature and bi-iliac breadth in two high latitude populations, with application toearlier higher latitude humans. J. Hum. Evol. 48, 381–392 (2005).
49. Rafferty, K. L., Walker, A., Ruff, C. B., Rose, M. D. & Andrews, P. J. Postcranialestimates of body weight in Proconsul, with a note on a distal tibia of P. majorfrom Napak, Uganda. Am. J. Phys. Anthropol. 97, 391–402 (1995).
50. Arnold, C., Matthews, L. J. & Nunn, C. L. The 10kTrees website: A new onlineresource for primate phylogeny. Evol. Anthropol. 19, 114–118 (2010).
51. Berger, L. R. et al. Australopithecus sediba: A new species of Homo-likeaustralopith from South Africa. Science 328, 195–204 (2010).
52. Harrison, T. Apes among the tangled branches of human origins. Science 327,532–534 (2010).
53. Wood, B. & Harrison, T. The evolutionary context of the first hominins. Nature470, 347–352 (2011).
54. Sarmiento, E. E. Comment on the paleobiology and classification ofArdipithecus ramidus. Science 328, 1105-b (2010).
55. Begun, D. R., Nargolwalla, M. C. & Kordos, L. European Miocene hominidsand the origin of the African ape and human clade. Evol. Anthropol. 21, 10–23(2012).
56. Rossie, J. B. & MacLatchy, L. A new pliopithecoid genus from the early Mioceneof Uganda. J. Hum. Evol. 5, 568–586 (2006).
57. Perez de los Rıos, M., Moya-Sola, S. & Alba, D. M. The nasal and paranasalarchitecture of the Middle Miocene ape Pierolapithecus catalaunicus (primates:Hominidae): Phylogenetic implications. J. Hum. Evol. 63, 497–506 (2012).
58. Cavalli-Sforza, L. L. & Edwards, A. W. Phylogenetic analysis. Models andestimation procedures. Am. J. Hum. Genet. 19, 233 (1967).
59. Felsenstein, J. Maximum-likelihood estimation of evolutionary trees fromcontinuous characters. Am. J. Hum. Genet. 25, 471 (1973).
60. Felsenstein, J. Phylogenies and the comparative method. Am. Nat. 125, 1–15(1985).
ARTICLE NATURE COMMUNICATIONS | DOI: 10.1038/ncomms8717
10 NATURE COMMUNICATIONS | 6:7717 | DOI: 10.1038/ncomms8717 | www.nature.com/naturecommunications
& 2015 Macmillan Publishers Limited. All rights reserved.

61. Butler, M. A. & King, A. A. Phylogenetic comparative analysis: a modelingapproach for adaptive evolution. Am. Nat. 164, 683–695 (2004).
62. King, A. A. & Butler, M. A. ouch: Ornstein-Uhlenbeck models for phylogeneticcomparative hypotheses (R package). http://ouch.r-forge.r-project.org (2009).
63. Felsenstein, J. Phylogenies and quantitative characters. Annu. Rev. Ecol. Syst.19, 445–471 (1988).
64. Schluter, D., Price, T., Mooers, A. Ø. & Ludwig, D. Likelihood of ancestor statesin adaptive radiation. Evolution 51, 1699–1711 (1997).
65. Rohlf, F. J. in Morphology, Shape, and Phylogeny. (eds MacLeod, N. & Forey, P. L.)175–193 (Taylor and Francis, 2002).
66. Maddison, W. P. Squared-change parsimony reconstructions of ancestral statesfor continuous-valued characters on a phylogenetic tree. Syst. Zool. 40, 304–314(1991).
67. Slater, G. J., Harmon, L. J. & Alfaro, M. E. Integrating fossils with molecularphylogenies improves inference of trait evolution. Evolution 66, 3931–3944(2012).
68. Revell, L. J. Phytools: an R package for phylogenetic comparative biology (andother things). Methods Ecol. Evol. 3, 217–223 (2012).
69. Rohlf, F. J. Comparative methods for the analysis of continuous variables:geometric interpretations. Evolution 55, 2143–2160 (2001).
70. Harvey, P. H. & Pagel, M. D. The Comparative Method in Evolutionary BiologyVol. 239 (Oxford univ. press, 1991).
AcknowledgementsWe are indebted to the following researchers and curators for granting access tocollections under their care: Emma Mbua, National Museum of Kenya;Salvador Moya-Sola, Institut Catala de Paleontologia Miquel Crusafont; Yoel Rak,Tel Aviv University; Emmanuel Gilissen, Royal Museum of Central Africa; EileenWestwig, American Museum of Natural History; Lyman Jellema, Cleveland Museum ofNatural History; Darrin Lunde, National Museum of Natural History; Judy Chupasko,Museum of Comparative Zoology; and Randy Susman, Stony Brook University. We are
also grateful to Liam Revell for technical advice, to David Alba, Biren Patel and SteveFrost for helping compiling the data and to Matt Tocheri, Caley Orr and Biren Patel forfeedback in previous versions of this work. This research was supported by the NationalScience Foundation (NSF-BCS 1316947, NSF-BCS-1317047, NSF-BCS 1317029), theSpanish Ministerio de Economıa y Competitividad (CGL2014-54373-P), the IreneLevi Sala CARE Archaeological Foundation (S.A.) and the AAPA ProfessionalDevelopment Grant (S.A.).
Author contributionsS.A. designed the study; S.A. and W.L.J. collected the data and performed the morpho-metric analyses; S.A. and J.B.S. performed the evolutionary analyses. S.A., J.B.S. andW.L.J. discussed the results and wrote the paper.
Additional informationSupplementary Information accompanies this paper at http://www.nature.com/naturecommunications
Competing financial interests: The authors declare no competing financial interests.
Reprints and permission information is available online at http://npg.nature.com/reprintsandpermissions/
How to cite this article: Almecija, S. et al. The evolution of human and ape handproportions. Nat. Commun. 6:7717 doi: 10.1038/ncomms8717 (2015).
This work is licensed under a Creative Commons Attribution 4.0International License. The images or other third party material in this
article are included in the article’s Creative Commons license, unless indicated otherwisein the credit line; if the material is not included under the Creative Commons license,users will need to obtain permission from the license holder to reproduce the material.To view a copy of this license, visit http://creativecommons.org/licenses/by/4.0/
NATURE COMMUNICATIONS | DOI: 10.1038/ncomms8717 ARTICLE
NATURE COMMUNICATIONS | 6:7717 | DOI: 10.1038/ncomms8717 | www.nature.com/naturecommunications 11
& 2015 Macmillan Publishers Limited. All rights reserved.