the evaluation of the occupational safety and health administration
TRANSCRIPT
U.S. Department of Labor
The Evaluation of the Occupational Safety and Health Administration
Site Specific Targeting Program
Implementation and Random Assignment Evaluation of the OSHA SST11 Program
September 2014
Authors: Marios Michaelides
Scott Davis Kassim Mbwana
Prepared and Submitted by:
IMPAQ International, LLC 10420 Little Patuxent Parkway
Columbia, MD 21044
Submitted to:
U.S. Department of Labor Chief Evaluation Office
200 Constitution Avenue, NW Washington, DC 20210

IMPAQ International, LLC OSHA SST Evaluation
TABLE OF CONTENTS
EXECUTIVE SUMMARY ............................................................................................................ i
1. Introduction .................................................................................................................... 1
2. Implementation of the SST11 Program ............................................................................. 3
2.1 Establishment Selection ............................................................................................... 3
2.2 Random Assignment Evaluation of the SST11 Program ............................................... 7
2.3 Inspection Process ...................................................................................................... 10
2.4 Citation Process .......................................................................................................... 14
3. Analyses of SST11 Establishment Characteristics ............................................................ 15
3.1 Data Overview ............................................................................................................ 16
3.2 Characteristics of All SST11 Establishments ............................................................... 16
3.3 Characteristics of Evaluation Establishments ............................................................. 27
4. Impact Analyses Plan ..................................................................................................... 31
4.1 Impact Analyses for Study A – Impact of High Rate Letter ........................................ 31
4.2 Impact Analyses for Study B – Impact of High Rate Letter Plus Inspection ............... 33
5. Conclusion ..................................................................................................................... 34
Appendix ............................................................................................................................ 36
Exhibit 1: Overview of the SST11 Program ..................................................................................... 6
Exhibit 2: Random Assignment Evaluation Study of the SST11 Program ....................................... 9
Exhibit 3: SST11 Inspection Process .............................................................................................. 12
Exhibit 4: SST11 Citation Process .................................................................................................. 14
Exhibit 5: Injury/Illness Rates, All SST11 Sites .............................................................................. 17
Exhibit 6: Characteristics of SST11 Sites ....................................................................................... 19
Exhibit 7: Inspection History of SST11 Sites .................................................................................. 22
Exhibit 8: Prior Violation Outcomes of SST11 Sites, 2005–2010 .................................................. 24
Exhibit 9: Penalty History of SST11 Sites....................................................................................... 26
Exhibit 10: Characteristics and Inspection History of Primary List Evaluation Sites .................... 28
Exhibit 11: Characteristics and Inspection History of Secondary List Evaluation Sites ................ 30

IMPAQ International, LLC Page i OSHA SST Evaluation
EXECUTIVE SUMMARY The Site Specific Targeting (SST) program, one of OSHA’s targeted inspection programs, focuses on establishments with at least 20 workers in non-construction, high-hazard industries. The SST program implements two types of interventions:
High Rate Letter – This letter is sent to establishments that exceed an injury/illness rate threshold set by OSHA. The letter notifies the establishments that they are among workplaces with high injury/illness rates, urges them to take corrective action, and informs them of available OSHA resources to help establishments comply with Federal safety and health standards.
Inspection – OSHA Area Office Compliance Safety and Health Officers (CSHOs) conduct inspections of establishments with the highest injury/illness rates to determine compliance with Federal workplace safety and health standards and to assess penalties when violations are detected.
To select establishments for inclusion in the SST program, OSHA uses information collected in the annual OSHA Data Initiative (ODI) survey, which requires establishments in specific industries to provide annual summary data on work-related injuries and illnesses that occurred during the reporting period. Using these data, OSHA calculates establishment-specific injury/illness rates and categorizes establishments that exceed predetermined rate threshold into three lists: (1) primary inspection list, which includes establishments with the highest injury/illness rates; (2) secondary inspection list, which includes establishments with lower injury/illness rates than primary inspection list establishments; and (3) high rate letter only list, which includes establishments with the lowest injury/illness rates above the predetermined rate threshold. OSHA then sends a high rate letter to all establishments in these three lists and begins inspecting establishments on the primary inspection list. If resources permit, OSHA inspects establishments on the secondary inspection list; high rate letter only establishments do not typically receive SST inspections. In recent years, OSHA has initiated efforts to assess the efficacy of its programmed inspection and consultation programs to improve employer compliance with Federal safety and health standards. One of those efforts was the implementation of a random assignment evaluation study of the SST11 program, which conducted inspections of selected establishments in the period September 2011 through September 2012. The purpose of the evaluation is to provide OSHA with statistically unbiased estimates of the short-term impacts of the program’s interventions (high rate letters and inspections) on primary and secondary inspection list establishments. The random assignment evaluation of the SST11 program consists of two studies:
Study A – Impact of High Rate Letter. OSHA randomly assigned 420 primary list and 420 secondary list establishments to Treatment Group A (receive SST11 high rate letter but no SST11 inspection), and 204 primary list and 211 secondary list establishments to Control Group A (no SST11 high rate letter and no SST11 inspection). OSHA inspected all

IMPAQ International, LLC Page ii OSHA SST Evaluation
Treatment Group A and Control Group A establishments under SST12 (January 2013-January 2014) to collect information on their violation outcomes and injury/illness rates. The short-term impact of the high rate letter will be estimated by comparing the SST12 violation outcomes and injury/illness rates for Treatment Group A and Control Group A.
Study B – Impact of High Rate Letter Plus Inspection. OSHA randomly assigned 420 primary list and 420 secondary list establishments to Treatment Group B (receive SST11 high rate letter and SST11 inspection), and 216 primary list and 209 secondary list establishments to Control Group B (no SST11 high rate letter and no SST11 inspection). OSHA is currently inspecting all Treatment Group B and Control Group B establishments under SST14 (March 2014-March 2015) to collect information on their violation outcomes and injury/illness rates. The short-term impact of the high rate letter plus inspection will be estimated by comparing the SST14 violation outcomes and injury/illness rates for Treatment Group B and Control Group B.
This paper provides a review of the SST11 program and the random assignment evaluation design implemented by OSHA to assess the short-term impacts of the program. The paper discusses the implementation of the SST11 program, including: (1) the process used by the OSHA Federal Office to select establishments for SST11 participation; (2) the random assignment evaluation design implemented by the OSHA Federal Office to assess the program’s short-term impacts; and (3) the processes used by OSHA Area Offices to inspect SST11 establishments and issue citations to violators of OSHA standards. This discussion is based on reviews of relevant program documentation provided by OSHA and on information obtained in phone interviews with OSHA Federal and Area Office staff. Furthermore, the paper uses OSHA administrative data to examine the characteristics of all SST11 establishments and of SST11 establishments that were randomly selected for inclusion in the evaluation. Key findings of these analyses include the following:
SST11 establishments had 7.7 cases per 100 full-time employees in which employees suffered a workplace injury/illness that resulted in losing days from work, restricted work activity, or job transfer.
By design, primary list establishments had higher injury/illness rates (12.2 cases per 100 employees) than did secondary list establishments (7.6 cases per 100 employees) and high rate letter only establishments (5.6 cases per 100 employees).
Primary list establishments were smaller in size than secondary list and high rate letter only establishments; the average primary list establishment had 98 employees compared with an average of 151 and 157 employees for secondary and high rate letter only list establishments, respectively.
Primary list establishments were predominantly in the manufacturing sector (81 percent), while the remaining establishments were nursing and personal care facilities (8 percent) and in other industries (11 percent). Most secondary list establishments were in other industries (62 percent), followed by manufacturing (31 percent) and nursing and personal care (7 percent). Half of the high rate letter only establishments

IMPAQ International, LLC Page iii OSHA SST Evaluation
were in nursing and personal care, 36 percent in manufacturing, and 14 percent in other industries.
Analyses of 2005–2010 inspection histories show that primary list establishments were more likely than secondary list establishments to have received a prior inspection, a prior violation, and a monetary penalty as a result of a violation. Similarly, secondary list establishments were more likely than high rate letter only establishments to have received a prior inspection and have prior violations and associated penalties.
Analyses of the characteristics of the 1,260 primary list and 1,260 secondary list establishments randomly selected for the evaluation show that the primary list evaluation establishments are similar to the primary list non-evaluation establishments in terms of characteristics, injury/illness rates, and prior inspection outcomes. Likewise, the secondary list evaluation establishments have characteristics, injury/illness rates, and prior inspection outcomes similar to those of the secondary list non-evaluation establishments. These results show that random assignment was correctly implemented, and thus the SST11 establishments included in the evaluation are representative of all SST11 primary and secondary list establishments. Finally, this paper presents a proposed analytic plan for estimating the short-term impacts of SST11 using the Study A and Study B design. We suggest that impact analyses to estimate the short-term impact of the high rate letter under Study A should rely on multivariate regression models that compare the SST12 violation outcomes and injury/illness rates for Treatment Group A and Control Group A establishments. These analyses will be conducted separately for primary list and secondary list establishments and will provide unbiased estimates of the impact of the high rate letter on violation outcomes and injury/illness rates. Similarly, we suggest that the impact analyses for Study B should rely on multivariate regression models that compare the SST14 violation outcomes and injury/illness rates for Treatment Group B and Control Group B. The analyses will be conducted separately for primary list and secondary list establishments and will provide unbiased estimates of the impact of the high rate letter plus inspection on violation outcomes and injury/illness rates.

IMPAQ International, LLC Page 1 OSHA SST Evaluation
IMPLEMENTATION AND RANDOM ASSIGNMENT EVALUATION OF THE OSHA SST11 PROGRAM
1. Introduction
The Occupational Safety and Health Act was enacted in 1970 as a response to public concern about the alarming increase in the number and severity of work-related injuries that occurred during the 1960s.1 The overarching objectives of this Act were to improve worker safety by encouraging employers to provide a place of employment free from safety and health hazards and to implement new or improve existing safety and health standards. To support these objectives, the Act established the Occupational Safety and Health Administration (OSHA), an agency within the U.S. Department of Labor (DOL), which is tasked with setting workplace safety and health standards and conducting workplace inspections to determine whether employers are complying with the standards. In addition to on-site inspections of employers in targeted high-hazard industries, OSHA is responsible for offering consultation programs under which employers can work cooperatively with the agency to help prevent workplace fatalities, injuries, and illnesses. One of OSHA’s targeted inspection programs is the Site Specific Targeting (SST) program, which targets establishments with at least 20 workers in non-construction high-hazard industries.2 The SST program implements two interventions:
High Rate Letter – This letter is sent to establishments that exceed an injury/illness rate threshold set by OSHA. The letter informs establishments that they are among workplaces with high injury/ illness rates, urges them to take corrective action, and informs them of available OSHA resources to help them comply with Federal safety and health standards.
Inspection – OSHA Area Office Compliance Safety and Health Officers (CSHOs) conduct inspections of establishments with the highest injury/illness rates to determine compliance with Federal workplace safety and health standards. In the event that CSHOs detect violations of these standards, OSHA may issue citations and fines. Employers are required to take actions to remedy the cited violations and to pay the penalties assessed, though they have the right to contest both violation citations and assessed penalties.
To select establishments for inclusion in the SST program, OSHA uses information collected in the annual OSHA Data Initiative (ODI) survey, which requires establishments in specific industries to provide data on serious work-related injuries and illnesses that occurred during the reporting period. Using these data, OSHA calculates establishment-specific injury/illness rates for each establishments and categorizes establishments that exceed the predetermined
1 Occupational Safety and Health Act, Public Law 91-596, December 29, 1970.
2 Other OSHA inspection programs include targeted programs, such as National Emphasis Programs (NEPs) and
Local Emphasis Programs (LEPs), as well as unprogrammed inspections, for example, in response to a worker complaint.
IMPAQ International, LLC Page 2 OSHA SST Evaluation
injury/illness rates thresholds in three lists: (1) primary inspection list, which includes establishments with the highest injury/illness rates; (2) secondary inspection list, which includes establishments with lower injury/illness rates than primary list establishments; and (3) high rate letter only list, which includes establishments with the lowest injury/illness rates among those exceeding the thresholds. OSHA sends a high rate letter to all establishments in these three lists and then begins inspections of primary list establishments. When inspections of primary list establishments are completed and as resources permit, OSHA proceeds to inspect secondary inspection list establishments; high rate letter only establishments do not typically receive SST inspections. In recent years, OSHA has initiated efforts to assess the efficacy of its programmed inspection and consultation programs to improve employer compliance with Federal safety and health standards. These include the implementation of a random assignment evaluation of the SST11 program, which conducted inspections of selected establishments in the period September 2011 through September 2012. The purpose of the evaluation is to provide OSHA with unbiased estimates of the short-term impacts of the SST11’s interventions on establishments with the highest reported injury/illness rates. The evaluation comprises two studies:
Study A – Impact of High Rate Letter. OSHA randomly assigned 420 primary list and 420 secondary list establishments to Treatment Group A (receive SST11 high rate letter but no SST11 inspection) and 204 primary list and 211 secondary list establishments to Control Group A (no SST11 high rate letter and no SST11 inspection). OSHA inspected all Treatment Group A and Control Group A establishments in SST12 (January 2013-January 2014) to collect information on their violation outcomes and injury/illness rates. The short-term impact of the high rate letter will be estimated by comparing the violation outcomes and injury/illness rates obtained through SST12 inspections for Treatment Group A and Control Group A.
Study B – Impact of High Rate Letter Plus Inspection. OSHA randomly assigned 420 primary list and 420 secondary list establishments to Treatment Group B (receive SST11 high rate letter and SST11 inspection) and 216 primary list and 209 secondary list establishments to Control Group B (no SST11 high rate letter and no SST11 inspection). OSHA is currently inspecting all Treatment Group B and Control Group B establishments under SST14 (March 2014-March 2015) to observe their violation outcomes and injury/illness rates. The short-term impact of the high rate letter plus inspection will be estimated by comparing the violation outcomes and injury/illness rates obtained through SST14 inspections for Treatment Group B and Control Group B.
This paper provides an overview of the SST11 program and the random assignment evaluation design implemented by OSHA to assess the short-term impacts of the program. Based on reviews of relevant program documentation and interviews with OSHA Federal and Area Office staff, this paper describes the implementation of the SST11 program, including: (1) the process used by the OSHA Federal Office to select establishments for SST11 participation; (2) the random assignment evaluation design implemented by the OSHA Federal Office to assess the program’s short-term impacts; and (3) the processes used by OSHA Area Offices to inspect

IMPAQ International, LLC Page 3 OSHA SST Evaluation
SST11 establishments and issue citations to violators of OSHA standards. In addition, this paper examines the characteristics of all SST11 establishments and the characteristics of SST11 establishments that were randomly selected for inclusion in the evaluation. To conduct these analyses, we used OSHA administrative data that provide information on all SST11 establishments, including: (1) establishment characteristics (e.g., location, industry, and number of employees), (2) injury/illness rates reported in the 2010 ODI survey, and (3) inspection history from 2005 through 2010. Finally, the paper describes our proposed analytic plan for estimating the short-term impacts of the SST11 program using the random assignment evaluation implemented by OSHA. The remainder of this paper is organized as follows. Section 2 discusses the implementation of the SST11 program based on document reviews and interviews with OSHA staff. Section 3 provides descriptive analyses of the characteristics of all establishments targeted by SST11 and the characteristics of establishments included in the evaluation. Section 4 provides an overview of the impact analysis plan that will be used to estimate program impacts. Finally, Section 5 summarizes the main findings.
2. Implementation of the SST11 Program
In this section, we describe the implementation of the SST11 program – which conducted inspections of selected establishments from September 2011 through September 2012 – including how the program was modified to accommodate the evaluation. This description is based on relevant documents provided by OSHA and information obtained in phone interviews with OSHA Federal and Area Office staff. 2.1 Establishment Selection The OSHA Federal Office was responsible for identifying the establishments to be targeted by the SST11 program. Exhibit 1 presents the selection process used. As the first step in the process, in 2009, the OSHA Federal Office obtained data from Dun & Bradstreet (D&B)3 that provided a list of establishments that satisfied the following criteria: (1) they were not in the construction sector; (2) they were in high-hazard industries, as defined by the injury/illness data collected by the Bureau of Labor Statistics (BLS);4 (3) they had at least 20 employees; and (4) they were not in the six states that opted not to participate in the ODI survey.5 This process
3 These data include information on more than 99 percent of the entire universe of U.S. businesses.
4 BLS’ Injuries, Illnesses, and Fatalities Program provide annual data on workplace injuries, illnesses, and fatalities
by incident, industry, geography, and other characteristics (see http://www.bls.gov/iif/home.htm). 5 Twenty-one states were authorized to run their own workplace safety and health inspection plans in high-hazard
industries: Alaska, Arizona, California, Hawaii, Indiana, Iowa, Kentucky, Maryland, Michigan, Minnesota, Nevada, New Mexico, North Carolina, Oregon, South Carolina, Tennessee, Utah, Vermont, Virginia, Washington, and Wyoming; see http://www.osha.gov/dcsp/osp/index.html for details. These states were excluded from the SST11

IMPAQ International, LLC Page 4 OSHA SST Evaluation
resulted in an initial list of about 170,000 establishments in 91 high-hazard 4-digit Standard Industrial Classification (SIC) industries. OSHA divided the list of targeted industries into three groups: manufacturing, nursing and personal care facilities, and other industries.6 The next step was to identify the sample of establishments from this list that would be required to respond to the 2010 ODI survey. OSHA used the following criteria to generate a 2010 ODI survey sample of about 80,000 establishments:
Establishments that reported the highest injury/illness rates in the 2009 ODI survey were automatically added to the 2010 ODI sample (about 15,000 establishments).
From the remaining establishments on the initial list of 170,000, OSHA selected about 65,000 establishments from certain industries for inclusion in the 2010 ODI sample.7
In June 2010, all employers in the 2010 ODI sample were mailed paper copies of the survey instrument (OSHA Form 196B) to collect information for calendar year 2009. This instrument asked employers to provide the following: (1) number of full-time employees; (2) total number of hours worked; (3) number of workplace injury and illness incidents; (4) whether such incidents resulted in workers experiencing time away from work, restricted work activity, or job transfers; (5) number of days away from work, restricted work activity, or job transfers; and (6) employer characteristics (industry, location, etc.). Establishments could complete the survey using the paper instrument or online. As shown in Exhibit 1, the 2010 ODI survey collected data from 78,256 establishments. Of these, 51,295 were under Federal jurisdiction and were thus included in SST11; the remaining establishments were from the 15 states that had their own inspection plans (i.e., state plan states) and were thus excluded from SST11. At the beginning of 2011, OSHA used the completed 2010 ODI surveys to calculate two establishment-specific injury/illness rates. The first measure is the DART rate, which captures the number of workplace injury/illness cases that result in employees experiencing days away from work, restricted work activity, or job transfers. The DART rate is produced using the following formula:
A In this formula, C is the number of injury/illness cases involving employees experiencing days away from work, restricted work activity, and job transfers; and H is the number of hours worked by all employees, including temporary workers and contractors. The ratio of cases per
program; of these, six states (Alaska, Oregon, South Carolina, Virginia, Washington, and Wyoming) declined to participate in the ODI survey, while the remaining 15 states opted to participate. 6 Manufacturing covers SIC codes 2000–3900; nursing and personal care facilities cover SIC codes 8051, 8052, and
8059; and the other industries cover selected 4-digit SIC codes, including agriculture, transportation, sanitary services, wholesale trade, and retail trade. For the full list, see Appendix A of OSHA Directive 11-03, Site-Specific Targeting 2011 (https://www.osha.gov/OshDoc/Directive_pdf/CPL_02-11-03.pdf). 7 OSHA divides the pool of 170,000 sites into three groups of industries, with each group roughly the same size. In
a single year, the 65,000 sites added to the ODI are generally the universe of sites from one of the three groups.

IMPAQ International, LLC Page 5 OSHA SST Evaluation
hour is multiplied by 200,000 to produce an assumed rate per 100 full-time equivalent employees. The second measure is the DAFWII rate (days away from work due to injury and illness), which has the same formula as the DART rate, except that C only includes cases involving days away from work (i.e., DAFWII excludes cases involving temporary transfers to another job and cases involving restricted work). The next step in the selection process was to use the DART and DAFWII rates for the 51,295 SST11-eligible establishments to determine which establishments would receive the program's interventions. First, using the calculated DART rate, OSHA set a threshold that determined which establishments would receive a high rate letter. OSHA selected a DART threshold of 2.5, meaning that any establishment with a DART rate of 2.5 or greater was placed on the high rate letter list. Using this threshold, 15,697 establishments were scheduled to receive letters. Then, OSHA used the DART and DAFWII rates to categorize these establishments into three lists:
Primary inspection list – Includes the 3,637 establishments with the highest DART and DAFWII rates among those that received the high rate letter.8 These establishments were assigned the highest priority for receiving an SST11 inspection in the period September 2011 through September 2012.
Secondary inspection list – Includes the 4,251 establishments with DART and DAFWII rates that were lower than the rates of primary inspection list establishments, but still above the high rate letter threshold.9 These establishments were to receive an SST11 inspection in the period September 2011-September 2012 only after all primary inspection list establishments in an Area Office’s jurisdiction were inspected.
High rate letter only list – Includes the 7,809 establishments with the lowest injury/illness rates among those receiving the high rate letter. These establishments would not receive an SST11 inspection.
If SST11 had been implemented in a typical year, the OSHA Federal Office would have uploaded the 3,637 primary inspection list establishments into OSHA’s Integrated Management Information System (IMIS). This would allow each OSHA Area Office to use an interface to select a random sample of establishments (known as an inspection cycle) from IMIS for inspection. OSHA Area Offices are required to inspect all establishments in the inspection cycle and, once those inspections are completed, to select a new cycle. In the event that an Area Office is able to inspect all primary inspection list establishments before the end of the SST11 implementation period, it asks the OSHA Federal Office to upload secondary inspection list establishments into IMIS for inspection. However, as discussed below, the process of selecting establishments to receive an inspection was modified to accommodate the random assignment impact evaluation of the SST11 program. 8 Due to industry differences in injury/illness rates, OSHA uses separate thresholds for inclusion in the primary
inspection list: (1) manufacturing: A ≥7 or AFWII≥5; (2) nursing and personal care: A ≥16 or AFWII≥13; and (3) other sectors: A ≥15 or AFWII≥14. 9 The thresholds for inclusion in the secondary inspection list are (1) manufacturing: 7> A ≥5 or 5> AFWII≥4; (2) nursing and personal care facilities: 16> A ≥13 or 13> AFWII≥11; and (3) other industries: 15> A ≥5 or 14> AFWII≥4.

IMPAQ International, LLC Page 6 OSHA SST Evaluation
Exhibit 1: Overview of the SST11 Program
ODI Survey(78,256)
Federal Jurisdiction(51,295)
Exceed Letter Threshold
NO YES
Exceed Secondary Inspection Threshold
(4,251)
No High Rate Letter (35,598)
Receive High Rate Letter,Not on Inspection Lists
(7,809)
Exceed PrimaryInspection Threshold
(3,637)
High Rate Letter (15,697)
Dun & Bradstreet Data(All U.S. Establishments)
Non-Construction,High-Hazard Industries
with 20+ Employees(170,000)

IMPAQ International, LLC Page 7 OSHA SST Evaluation
2.2 Random Assignment Evaluation of the SST11 Program In an effort to obtain statistically unbiased estimates of the short-term impacts of SST interventions on establishment compliance with Federal safety and health standards and on establishment injury/illness rates, OSHA modified the SST11 processes to accommodate a random assignment evaluation of the program. Specifically, OSHA adopted a design consisting of two studies:
Study A – Impact of High Rate Letter, a study designed to estimate the impact of the high rate letter on primary and secondary list establishments.
Study B – Impact of High Rate Letter Plus Inspection, a study designed to estimate the impact of the high rate letter plus inspection on primary and secondary list establishments.
For participation in these two studies, OSHA randomly selected 1,260 primary list and 1,260 secondary list establishments; half of these establishments were randomly selected to participate in Study A and the other half in Study B.10 A description of the two studies is presented below; see Exhibit 2 for an illustration. Study A – Impact of High Rate Letter. The objective of this study is to estimate the short-term impact of the high rate letter on the violation outcomes and injury/illness rates of primary and secondary inspection list establishments. This study required the implementation of the following steps:
Step 1: Random Selection of Primary and Secondary List Establishments. OSHA randomly selected 624 primary list and 631 secondary list establishments for this study. As shown in Exhibit 2, 204 primary list and 211 secondary list establishments were randomly assigned to Control Group A (no SST11 high rate letter and no SST11 inspection), while the remaining 420 primary list and 420 secondary list establishments were assigned to Treatment Group A (receive SST11 high rate letter but no SST11 inspection). The establishments were not made aware of their participation in the study nor the group to which they were assigned.
Step 2: Send SST11 High Rate Letters to Treatment Group A Establishments. OSHA sent SST11 high rate letters to the primary and secondary inspection list establishments assigned to Treatment Group A. SST11 high rate letters were withheld from all Control Group A establishments.
Step 3: Conduct SST12 Inspections of All Control Group A and Treatment Group A Establishments. OSHA withheld SST12 high rate letters and inspected all Control Group A and Treatment Group A establishments under the SST12 program (January 2013-January 2014). During the SST12 inspections, OSHA obtained information on
10
All establishments in the high rate letter only list were excluded from the study since they are not typically targeted for an SST inspection.

IMPAQ International, LLC Page 8 OSHA SST Evaluation
establishment violation outcomes and injury/illness rates.11
Step 4: Estimate High Rate Letter Impacts. Estimate short-term impacts of the high rate letter for primary and secondary list establishments by comparing the violation outcomes and injury/illness rates obtained through SST12 inspections for Treatment Group A and Control Group A.
Study B – Estimate Impact of High Rate Letter Plus Inspection. The objective of this study is to estimate the short-term impact of the high rate letter plus inspection on the violation outcomes and injury/illness rates of primary and secondary list establishments. This study required the implementation of the following steps:
Step 1: Random Selection of Primary and Secondary List Establishments. OSHA randomly selected 636 primary list and 629 secondary list establishments for this study.12 As shown in Exhibit 2, 216 primary list and 209 secondary list establishments were randomly assigned to Control Group B (no SST11 high rate letter and no SST11 inspection), while the remaining 420 primary list and 420 secondary list establishments were assigned to Treatment Group A (receive SST11 high rate letter and an SST11 inspection). Again, establishments were not made aware of their participation in the study nor the group to which they were assigned.
Step 2: Send SST11 High Rate Letters to Treatment Group B Establishments. OSHA sent SST11 high rate letters to all primary and secondary inspection list establishments in Treatment Group B. High rate letters were withheld from Control Group B establishments.
Step 3: Conduct SST11 Inspections of all Treatment Group B Establishments. OSHA inspected all primary and secondary list establishments in Treatment Group B under the SST11 program (September 2011-September 2012).
Step 4: Conduct SST14 Inspections of All Control Group B and Treatment Group B Establishments. OSHA withheld SST14 high rate letters and is currently inspecting all establishments in Control Group B and Treatment Group B under the SST14 program (March 2014-March 2015).13 During the SST14 inspections, OSHA obtains information on establishment violation outcomes and injury/illness rates.
Step 5: Estimate High Rate Letter Plus Inspection Impacts. Estimate short-term impacts of the high rate letter plus inspection for primary and secondary list establishments by comparing the violation outcomes and the injury/illness rates obtained through SST14 inspections for Treatment Group B and Control Group B.
Based on the design of the two studies, as shown in Exhibit 2, the 3,637 SST11 primary list establishments were randomly assigned as follows: 624 establishments in Study A (204 in Control Group A and 420 in Treatment Group A), and 636 establishments in Study B (216 in
11
The ODI survey was discontinued; injury/illness data are now collected by OSHA during the inspection process. 12
These sites are different from the sites selected for Study A. 13
Because SST12 ran through January 2014, there was no SST13 program.

IMPAQ International, LLC Page 9 OSHA SST Evaluation
Control Group B and 420 in Treatment Group B). The remaining 2,377 establishments were excluded from the study but received the SST11 high rate letter. Similarly, the 4,251 SST11 secondary list establishments were randomly assigned as follows: 631 in Study A (211 in Control Group A and 420 in Treatment Group A), 629 in Study B (209 in Control Group B and 420 in Treatment Group B), and 2,991 were excluded from the study but received the SST11 high rate letter. All 7,809 high rate letter only establishments were excluded from the study but received the SST11 high rate letter.
Exhibit 2: Random Assignment Evaluation Study of the SST11 Program
Exceed Letter Threshold
NO
YES
Exceed Secondary Inspection Threshold
(4,251)
Not Eligible for High Rate Letter (35,598)
Receive High Rate Letter,Not on Inspection Lists
(7,809)
Exceed PrimaryInspection Threshold
(3,637)
Eligible for High Rate Letter (15,697)
RandomAssignment
RandomAssignment
Control Group A(No SST11 Letter, No
SST11 Inspection)
Excludedfrom the Study
Treatment Group A(SST11 Letter, No SST11 Inspection)
Treatment Group B(SST11 Letter, SST11
Inspection)
204 Sites
420 Sites
216 Sites
420 Sites
Excluded from the Study (SST11 Letter)
2,377 Sites 2,991 Sites
Control Group B(SST11 Letter, No SST11 Inspection)
Control Group A(No SST11 Letter, No
SST11 Inspection)
Treatment Group A(SST11 Letter, No SST11 Inspection)
Treatment Group B(SST11 Letter, SST11
Inspection)
Excluded from the Study (SST11 Letter)
Control Group B(SST11 Letter, No SST11 Inspection)
211 Sites
420 Sites
209 Sites
420 Sites
SST12 INSPECTION(All Control Group A and Treatment Group A Sites)
SST14 INSPECTION(All Control Group B and Treatment Group B Sites)
S
T
U
D
Y
A
S
T
U
D
Y
B

IMPAQ International, LLC Page 10 OSHA SST Evaluation
OSHA began implementing the above design in March 2011, as follows:
March 2011: OSHA compiled primary, secondary, and high rate letter only lists for SST11. Random assignment was used to select the establishments for inclusion in the evaluation.
April 2011: OSHA sent SST11 high rate letters to all primary and secondary list establishments, except for establishments assigned to Control Groups A and B.
June 2011: OSHA uploaded establishment information to IMIS so that OSHA Area Offices were able to begin inspections. To ensure that Treatment Group B establishments (both primary and secondary list) would receive an inspection, these establishments were the first to be uploaded. Primary and secondary list establishments in Control Groups A and B and in Treatment Group A were not uploaded to the interface for an inspection.
September 2011–September 2012: OSHA Area Offices conducted SST11 inspections of Treatment Group B establishments.
January 2013–January 2014: OSHA Area Offices conducted SST12 inspections of all primary and secondary list establishments in Control Group A and Treatment Group A.
March 2014–March 2015: OSHA Area Offices are conducting SST14 inspections of all primary and secondary list establishments in Control Group B and Treatment Group B.
The two random assignment studies will be used to produce accurate estimates of the short-term impacts of the high rate letter and of the high rate letter plus inspection for primary and secondary list establishments. For example, differences in the SST12 inspection outcomes for Treatment Group A and Control Group A will estimate the short-term effect of the high rate letter for primary and secondary list establishments. Similarly, differences in the SST14 inspection outcomes between Treatment Group B and Control Group B will estimate the short-term effect of the high rate letter plus inspection for primary and secondary list establishments. 2.3 Inspection Process Once the OSHA Federal Office uploaded the 840 Treatment Group B establishments to IMIS, OSHA Area Offices were responsible for conducting SST11 inspections of those establishments from September 2011 through September 2012. The SST11 inspection process consisted of the following steps: (1) use IMIS to access establishments for inspection; (2) plan inspection; (3) conduct inspection; and (4) issue citations. These steps are discussed below. Use IMIS to Access Establishments for Inspection. Once establishments were uploaded to IMIS by the OSHA Federal Office, OSHA Area Offices could begin accessing establishments for inspection. The Area Directors or Assistant Area Directors logged into an interface that allowed them to pull a random sample of establishments (known as an inspection cycle) from IMIS for inspection. Typically, an inspection cycle included 5 to 15 establishments; the number of establishments in an inspection cycle was determined by OSHA Area Directors based on their

IMPAQ International, LLC Page 11 OSHA SST Evaluation
available staff resources. Area Offices were required to inspect all establishments in the inspection cycle before selecting a new cycle. In the event that they inspected all establishments uploaded to IMIS, they could ask the Federal Office to upload more establishments.14 After the Area Directors or Assistant Area Directors pulled an inspection cycle, they reviewed the establishments in that cycle to determine which establishments were eligible for inspection. Establishments were deemed ineligible for inspection if (1) their DART or DAFWII rates did not exceed the thresholds set by OSHA for inclusion in the primary or secondary inspection list; or (2) they had received a prior inspection within the past 2 years, because it is against OSHA regulations to do a targeted inspection until two years have passed since the previous inspection. The Area Directors and/or Assistant Area Directors were then responsible for assigning establishments to CSHOs for inspection. There was variation in how inspection assignments were made. Some Area Directors/Assistant Directors assigned inspections by taking into consideration each CSHO’s skill set, workload, and geographic proximity. Other Area Offices delegated the responsibility of assigning inspections to the CSHOs themselves. At these offices, CSHOs would voluntarily pick a set of establishments to inspect from the inspection cycle, many times using a similar set of criteria (expertise, workload, and geographic proximity). If all establishments were not picked voluntarily, the Area Directors/Assistant Area Directors would assign the remaining establishments. This variation in procedures was partly driven by personal preferences and availability of resources. The order of inspections was not predetermined; rather it was driven by the CSHOs’ schedules as they worked through the inspection cycle list. As noted, the CSHOs had to complete the inspections of all establishments in the inspection cycle before a new inspection cycle was pulled from IMIS. Plan Inspection. Once they were assigned their establishments, CSHOs reviewed their assignments and made preparations to conduct the inspections. They reviewed the research on each inspection establishment that was gathered by the Area Directors or Assistant Area Directors. The CSHOs used various methods to prepare for the inspection, conduct the inspection, and organize the information gathered, depending on the complexity of the inspection. For example, while SST inspections are safety inspections, they can be expanded to include a health inspection, which requires more sophisticated data collection and testing procedures. Other factors that determine the complexity of an inspection include the size of the establishment and the number of employees. Larger establishments take longer to inspect because more observations must be made due to the greater potential for violations, and more employees must be interviewed. Depending on the complexity of the inspection, the Area Directors or Assistant Area Directors (or the CSHOs themselves when self-assigning inspections)
14
In the event that an OSHA Area Office asked for additional establishments for inspection, the OSHA Federal Office would upload primary and secondary inspection list establishments that were not included in the evaluation; primary and secondary inspection list establishments in Control Groups A and B and in Treatment Group A would not be uploaded for an inspection.

IMPAQ International, LLC Page 12 OSHA SST Evaluation
determined whether an inspection required more than one CSHO. Conduct Inspection. The inspection process, as shown in Exhibit 3, consists of four steps: (1) arrival and formal introduction; (2) opening conference; (3) inspection walk-around; and (4) closing conference. Each step is discussed in detail below.
Exhibit 3: SST11 Inspection Process
Additional Research Required? Different Type of Inspection Required?
Arrival and Formal
Introduction
Opening Conference –
Review Records
Conduct Walk-around
Closing Conference
Issue Citations
No
Yes
Step 1: Arrival and Formal Introduction. The CSHO arrives at the inspection site unannounced; CHSOs are not allowed to contact the establishment in advance. Upon arrival at the establishment, the CSHO asks to speak with a member of management and, if applicable, a union representative. The standard procedure is for the CSHO to: (1) introduce himself/herself; (2) present his/her credentials, (3) explain the purpose of the visit, and (4) explain how the establishment was selected and inform the employer that he/she has the right to refuse entry. Throughout the inspection, the CSHO refers to the Field Operations Manual for guidance. Step 2: Opening Conference. The CSHO asks to hold an opening conference with establishment management to provide more details on the purpose of the visit and confirm that the establishment should be inspected. The CSHO explains how the SST program works, emphasizing that the selection of establishment for inspection is unbiased and based on injury rates, not complaints. The CSHO also reviews the establishment’s documents on safety and health programs to ensure that they are in compliance with OSHA requirements. In addition, the CSHO reviews the ISO 300 and 300a safety logs and recalculates the DART and DAFWII rates. If the rates differ from those reported in IMIS, the CSHO determines whether the establishment is still eligible for a full SST inspection or whether to conduct a document review only and then end the inspection. The CSHO may also end the inspection if the establishment provides evidence that it had been inspected in the past 2 years; OSHA regulations do not allow programmed inspection of such establishments. These facts are usually identified by the Area Director and/or the Assistant Area Director when they select the inspection cycle, but once on site the CSHO must ensure that the information is accurate. Some interviewees noted that it is rare that an inspection ends because a CSHO finds that the establishment is ineligible for inspection. Once it is confirmed that the establishment will be inspected, the CSHO explains the scope of

IMPAQ International, LLC Page 13 OSHA SST Evaluation
the inspection and describes the walk-around process. In addition, the CSHO collects documentation and policies on certain workplace safety and health measures that the establishment should be implementing, depending on the nature of its activities. For example, establishments are required to have a safety inspection schedule of equipment and machinery, implement precautionary measures and provide workers with equipment for avoiding injuries or exposure to hazardous materials, and have a rigorous waste management policy. The CSHO collects and reviews these policies and assesses whether the establishment is implementing them consistently. Step 3: Inspection Walk-around. The inspection process involves a physical walk-through of the facility to collect data and document any safety and health hazards. There are no standardized forms for collecting data during inspections; instead, the CSHO takes handwritten notes about the surroundings and supports those notes with a variety of sources, as necessary. Common sources include audio recordings, video recordings, digital photographs, and noise and air samples. The CSHO also records employee interviews and/or obtains signed statements from employees about possible violations. While the employer is welcome to accompany the CSHO during the walk-around, the results of employee interviews are kept confidential. SST inspections are comprehensive – compared with complaint-driven inspections, which are partial and usually focus on the areas identified in the complaint – and thus require a longer time to perform. The duration of a typical inspection varies from a few hours to a few weeks, depending on the complexity of the inspection. For example, factors that influence the duration of the inspection are the complexity of the equipment and production processes used; physical size of the establishment; number of establishment employees; level of cooperation of management and the employees being interviewed; and when a health inspection is conducted in addition to the safety inspection. During the inspection, the CSHO notes safety violations (e.g., equipment/machinery operating without the required safety precautions, workers not provided with required protective equipment, and visible equipment/machinery defects) and health violations (e.g., excessive noise levels, exposure to dangerous chemicals or other materials, and noticeable sources of air pollution). Closing Conference. When the inspection is complete, the CSHO sits down with management to conduct the closing conference. During this meeting, the CSHO identifies the observed hazards and actions for remediation, and describes the citation process. In particular, the CSHO informs establishment management of the violations detected, including (1) minor hazards that can be remedied quickly; (2) hazards that require more time and resources to remedy; and (3) hazards identified as violations of Federal safety and health regulations that may result in a citation. Establishment management is offered the opportunity to ask questions about the inspection process and the hazards detected. Then, the CSHO discusses with establishment management how the detected hazards can be remedied. Citations are not formalized during this conference. Notably, a CSHO may opt to conduct a closing conference on a separate day and inspect the minor violations to ensure that they were abated.

IMPAQ International, LLC Page 14 OSHA SST Evaluation
2.4 Citation Process After each inspection is completed, Area Office staff use a standard process for citing violations and informing employers about citations and follow-up activities. As displayed in Exhibit 4, the CSHO is initially responsible for completing the documentation for each citation. The Area Director or Assistant Area Director has the responsibility for deciding whether to issue the citation and take any additional actions. Before assessing penalties, the Area Director or Assistant Area Director may ask the CSHO to re-inspect the establishment to determine whether the violations have been abated. This process is discussed below.
Exhibit 4: SST11 Citation Process
CSHO:· Determines if OSHA
standard was violated· Documents evidence of
employer knowledge and employee exposure
· Completes Form 1B electronically
Area Director:· Reviews Form 1B· Determines if additional
inspection is required· Issues citation by
certified mail
Employer receives citation
Pay fine, address
violations
Take settlement
(EISA)
Informal conference
Contest
Up to 15 days*
Close case and data
record
*May vary depending on individual case and
negotiations
The process for filing and saving the information collected during inspections is fairly standardized throughout the Area Offices. Upon completion of an inspection, the CSHO is responsible for preparing and finalizing the case file. OSHA has recently implemented OIS, a web-based system, through which the CSHO fills out information about the establishment, a narrative discussion of the inspection, and the necessary information about each violation. Photographs and recordings taken during the inspection can be uploaded and saved to the system. The CSHO also prepares a hard copy case file, which includes the notes taken during the inspection, a copy of the OSHA 1B Form, and violation and citation information. All photographs and recordings are burned on a CD. To issue a citation, the CSHO must document that the identified hazard meets the following criteria:
Violation of a standard – A citation is issued when an existing OSHA standard has been violated. Where an OSHA standard does not exist, CSHOs may use the General Duty Clause of the Occupational Safety and Health Act, which states that “Each employer …
IMPAQ International, LLC Page 15 OSHA SST Evaluation
shall furnish to each of his employees employment and a place of employment which are free from recognized hazards that are causing or are likely to cause death or serious physical harm to his employees.”15
Employer knowledge – Sufficient evidence must be supplied to show that the employer had knowledge of the hazard. During the walk-around, CSHOs establish employer knowledge by asking appropriate questions and looking at records. For example, if an employer states that he/she knew an employee was working in the area where the hazard was identified, employer knowledge has been established.
Employee exposure – Sufficient evidence must be provided that there was employee exposure to the hazard. CSHOs may cite a hazard only if someone could have been physically harmed as a result of the hazard during the preceding 6 months.
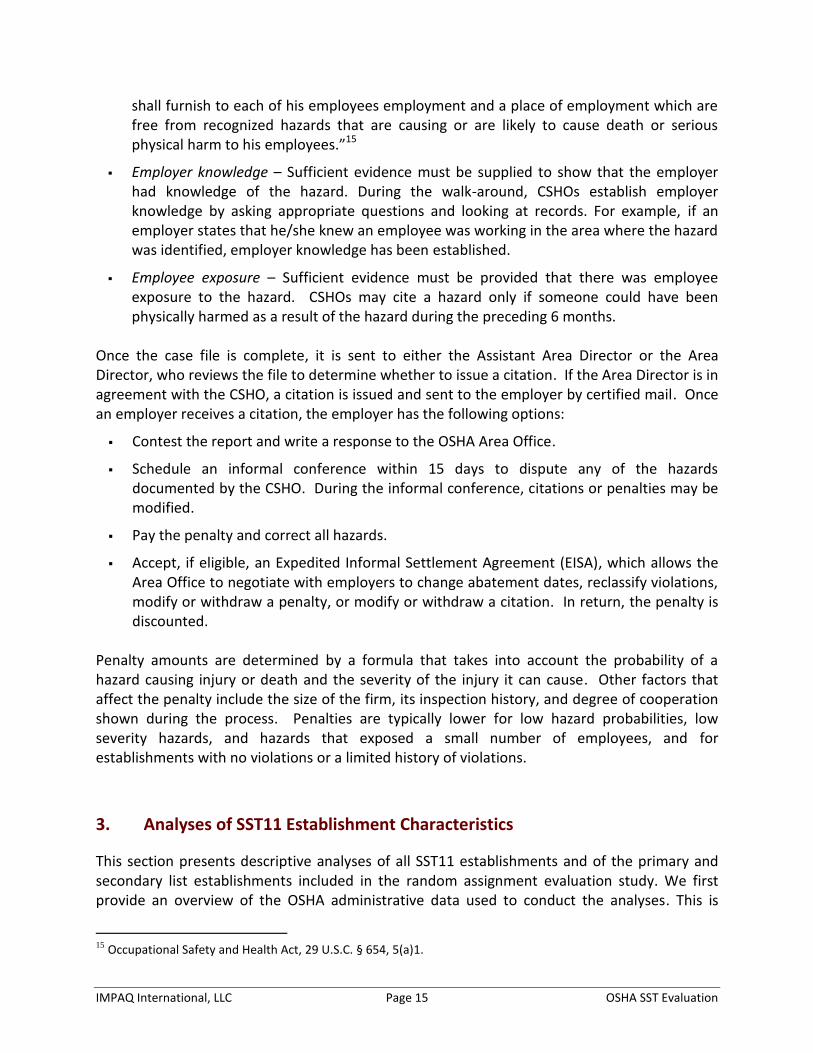
Once the case file is complete, it is sent to either the Assistant Area Director or the Area Director, who reviews the file to determine whether to issue a citation. If the Area Director is in agreement with the CSHO, a citation is issued and sent to the employer by certified mail. Once an employer receives a citation, the employer has the following options:
Contest the report and write a response to the OSHA Area Office.
Schedule an informal conference within 15 days to dispute any of the hazards documented by the CSHO. During the informal conference, citations or penalties may be modified.
Pay the penalty and correct all hazards.
Accept, if eligible, an Expedited Informal Settlement Agreement (EISA), which allows the Area Office to negotiate with employers to change abatement dates, reclassify violations, modify or withdraw a penalty, or modify or withdraw a citation. In return, the penalty is discounted.
Penalty amounts are determined by a formula that takes into account the probability of a hazard causing injury or death and the severity of the injury it can cause. Other factors that affect the penalty include the size of the firm, its inspection history, and degree of cooperation shown during the process. Penalties are typically lower for low hazard probabilities, low severity hazards, and hazards that exposed a small number of employees, and for establishments with no violations or a limited history of violations.
3. Analyses of SST11 Establishment Characteristics
This section presents descriptive analyses of all SST11 establishments and of the primary and secondary list establishments included in the random assignment evaluation study. We first provide an overview of the OSHA administrative data used to conduct the analyses. This is
15
Occupational Safety and Health Act, 29 U.S.C. § 654, 5(a)1.

IMPAQ International, LLC Page 16 OSHA SST Evaluation
followed by a detailed examination of establishment injury/illness rates (DART and DAFWII), characteristics (number of employees, hours worked, industry, etc.), and prior inspection outcomes in 2005–2010 (types of inspections received, number and types of violations, and penalties). We then present analyses of the characteristics of the evaluation establishments, including statistical tests to confirm that random assignment was correctly implemented for selecting the evaluation establishments. 3.1 Data Overview OSHA provided IMPAQ with two administrative data sources that contain information on the characteristics, injury/illness rates, and prior inspection outcomes of all SST11 establishments. These data are described below. OSHA Inspection Data. OSHA provided prior inspection data for all SST11 establishments, which contain information on all programmed and un-programmed inspections received in the period January 2005 through December 2010. The data provided information on establishment violation outcomes (whether found in violation, number and types of violations, severity of violations), enforcement actions taken (e.g., financial penalties), and establishment identifiers (DUNS number, name, and address). This information was used to identify SST11 establishments that received OSHA programmed and un-programmed inspections in the six-year period prior to their selection for the SST11 program. OSHA ODI Data. OSHA provided the 2010 ODI survey data, which include information on workplace injuries and illnesses that occurred in 2009. We merged these data with the OSHA inspection data to examine the injury/illness information reported by SST11 establishments. The data include injuries and illnesses causing lost work days, restricted work activity, or job transfers, as well as the DART and DAFWII rates. Also reported are establishment identifiers (DUNS number, name, and address), location, industry, number of employees, and total hours worked by employees. 3.2 Characteristics of All SST11 Establishments As discussed in Section 2, a total of 15,697 establishments exceeded the SST11 high rate letter threshold and were thus targeted by the program. Of these, 3,637 were on the primary inspection list; 4,251 were on the secondary inspection list; and the remaining 7,809 were on the high rate letter only list. Using the data provided by OSHA, we present below descriptive analyses of the injury/illness rates, characteristics, and prior inspection outcomes of the SST11 establishments, both overall and for each of the three lists. Injury/Illness Rates. Exhibit 5 presents the 2009 injury/illness rates for SST11 establishments, as calculated from the 2010 ODI data. The top half of Exhibit 5 presents the distribution of DART rates across all SST11 establishments. The mean DART rate was 7.7, meaning that in 2009, the average SST11 establishment had 7.7 cases per 100 full-time employees in which employees suffered a workplace injury or illness that resulted in losing days from work, restricted work

IMPAQ International, LLC Page 17 OSHA SST Evaluation
activity, or job transfers. The primary list establishments had a mean DART rate of 12.2, which was roughly 1.5 times higher than the mean rate for the secondary list establishments (7.6) and more than twice the mean rate for the high rate letter only establishments (5.6). For each of the three groups, the median DART rate was lower than the mean, indicating that the distribution includes some establishments with very high DART rates.
Exhibit 5: Injury/Illness Rates, All SST11 Establishments
Mean (St. Dev.)
Percentiles
10th 25th Median 75th
90th
DART Rates
All Establishments 7.7 (5.0) 3.2 4.3 6.3 9.5 13.7
Primary Inspection List 12.2 (6.5) 6.6 7.8 10.2 15.7 19.8
Secondary Inspection List 7.6 (2.9) 4.9 5.5 6.6 9.2 12.6
High Rate Letter Only List 5.6 (3.6) 2.8 3.4 4.3 6.7 9.8
DAFWII Rates
All Establishments 4.1 (4.4) 0.0 1.4 3.1 5.5 9.1
Primary Inspection List 6.9 (6.2) 0.0 2.9 5.7 9.0 14.4
Secondary Inspection List 4.1 (3.0) 0.0 1.8 3.7 5.6 8.5
High Rate Letter Only List 2.9 (3.2) 0.0 1.1 2.3 3.7 6.1
The bottom half of Exhibit 5 presents the distribution of DAFWII rates. The mean DAFWII rate for all SST11 establishments was 4.1, indicating that the average SST11 establishment had 4.1 cases per 100 full-time employees in which employees suffered a workplace injury or illness that resulted in losing days from work. The distributions of DAFWII rates for the three groups exhibit patterns similar to those observed for DART rates. The primary list establishments had the highest average DAFWII rate (6.9), which was more than 1.5 times higher than the secondary list average rate (4.1) and more than twice the high rate letter only average rate (2.9). Moreover, the median DAFWII rate was slightly lower than the mean for each of the three groups. Interestingly, the 10th percentile of the DAFWII distribution was zero for all establishments, indicating that at least 10 percent of establishments in each group did not have workplace injuries/illnesses that resulted in either restricted work activity or job transfers. To assess whether the observed injury/illness rates among groups were statistically significant, we conducted separate t-test analyses to identify differences in DART and DAFWII rates across the three groups. Results showed that the observed DART differences between primary and secondary list establishments and between secondary and high rate letter only establishments were statistically significant at the 1 percent level.16 Similarly, the observed primary-secondary list and secondary-high rate letter only list differences in DAFWII rates were statistically
16
T-test analyses showed that the primary-secondary list DART difference was 4.6 with a .1 standard error and the secondary-high rate letter list DART difference was 2.1 with a .1 standard error; in both cases, the p-value was zero which means that the null hypothesis (no differences in DART means) is rejected more than 99 percent of the time.

IMPAQ International, LLC Page 18 OSHA SST Evaluation
significant at the 1 percent level.17 The differences in DART and DAFWII rates across the three lists are a direct result of the fact that OSHA set higher injury/illness thresholds for primary list establishments, followed by secondary list establishments and high rate letter only establishments. Characteristics. Exhibit 6 summarizes the characteristics of SST11 establishments as reported in the 2010 ODI survey, including the number of full-time employees, the number of hours worked by all employees, the industry, and the OSHA region. As shown in Exhibit 6, the average SST11 establishment had 142 employees. Interestingly, primary list establishments had an average of 98 employees, much lower than the average of secondary list (151 employees) and the high rate letter only establishments (157 employees). In fact, tabulations show that 75 percent of primary list establishments had fewer than 100 employees, 45 percent had 0–49 employees, and 30 percent had 50–99 employees. These figures are much lower than those for the secondary list and high rate letter only establishments, of which 57 percent and 42 percent, respectively, had fewer than 100 employees. Basically, larger employers (i.e., those with at least 150 employees) made up a higher proportion of both the secondary list and the high rate letter only group. The fact that primary list establishments had fewer employees than all other SST11 establishments is also reflected in the total hours worked. On average, employees in primary list establishments worked 181,000 hours, compared to 288,000 for secondary list establishments and 289,000 for high rate letter only establishments. Separate analyses showed that the differences between primary list and secondary list establishments and between primary list and high rate letter only establishments in the number of employees and total hours worked were statistically significant at the 1 percent level. However, no statistically significant differences were detected between the secondary and the high rate letter only list. These analyses show that SST11 primary list establishments were typically smaller than SST11 secondary list and high rate letter only establishments. There were also significant differences in the industry composition of SST11 establishments across the three lists. Among all SST11 establishments, 45 percent were in manufacturing, 29 percent in nursing and personal care facilities, and 26 percent in other industries (which includes agriculture, transportation, wholesale trade, and retail trade). Manufacturing establishments were overrepresented on the primary list; 81 percent of the primary list were in manufacturing compared to 31 percent of the secondary list and 36 percent of the high rate letter only list. The reason is partly driven by the fact that OSHA set lower injury/illness thresholds for manufacturing establishments than for non-manufacturing establishments. The primary list DART threshold for manufacturing was 7 or above, compared to 16 or above for nursing and personal care facilities, and 15 or above for establishments in the other industries category.
17
T-test analyses showed that the primary-secondary list DAFWII difference was 2.8 with a .1 standard error and the secondary-high rate letter list DART difference was 1.2 with a .1 standard error; in both cases, the p-value was zero which means that the null hypothesis (no difference in means) is rejected more than 99 percent of the time.

IMPAQ International, LLC Page 19 OSHA SST Evaluation
Exhibit 6: Characteristics of SST11 Establishments
All
Establishments Primary
List Secondary
List High Rate Letter
Only
Number of Establishments 15,697 3,637 4,251 7,809
Number of Employees 142 (349) 98 (211) 151 (453) 157 (333)
Establishment Size
Very small (20–49 employees) 23% 45% 27% 9%
Small (50–99 employees) 31% 30% 30% 33%
Medium (100–149 employees) 20% 11% 19% 24%
Large (150–249 employees) 15% 8% 12% 21%
Very large (250+ employees) 11% 6% 12% 13%
Total Hours Worked (thousands) 264 (645) 181 (390) 288 (768) 289 (663)
Total Hours Worked (thousands)
<50 6% 14% 4% 4%
50–149 40% 54% 45% 30%
150–299 33% 20% 31% 40%
300–499 12% 7% 10% 16%
500+ 9% 5% 10% 10%
Industry
Manufacturing 45% 81% 31% 36%
Nursing & Personal Care Facilities 29% 8% 7% 50%
Other Industries 26% 11% 62% 14%
OSHA Region*
1 – Boston 12% 14% 11% 11%
2 – New York City 12% 12% 13% 11%
3 – Philadelphia 12% 15% 12% 12%
4 – Atlanta 15% 12% 15% 16%
5 – Chicago 22% 22% 21% 23%
6 – Dallas 14% 14% 16% 14%
7 – Kansas City 7% 7% 6% 8%
8 – Denver 5% 4% 5% 5%
10 – Seattle 1% 1% 1% 1%
Note: Table entries are sample proportions; for number of employees and total hours worked, the sample mean is reported with the standard deviation in parentheses. *Region 9 is omitted because all states in the region are State plan states and thus were not part of the study.

IMPAQ International, LLC Page 20 OSHA SST Evaluation
Secondary list establishments were predominantly in the “other industries” category (62 percent), followed by manufacturing (31 percent). In the high rate letter only list, 50 percent of establishments were nursing and personal care facilities, with 36 percent in manufacturing and 14 percent in other industries. The overrepresentation of the "other industries" category in the secondary list is due to the fact that the DART range was wider for these establishments: 5–15 for other industries compared to 5–7 for manufacturing and 13–16 for nursing and personal care. Overall, the DART/DAFWII rate thresholds set by OSHA resulted in the overrepresentation of manufacturing in the primary list and other industries in the secondary list. Exhibit 6 also presents the geographic distribution of SST11 establishments by OSHA Regional Office. OSHA has 10 Regional Offices, each covering a set of states and territories, as follows (Regional Office location in parentheses):
Region 1 (Boston): Connecticut*, Massachusetts, Maine, New Hampshire, Rhode Island, Vermont
Region 2 (New York City): New Jersey*, New York*, Puerto Rico*, Virgin Islands*
Region 3 (Philadelphia): District of Columbia, Delaware, Maryland*, Pennsylvania, Virginia*, West Virginia
Region 4 (Atlanta): Alabama, Florida, Georgia, Kentucky*, Mississippi, North Carolina*, South Carolina*, Tennessee*
Region 5 (Chicago): Illinois*, Indiana*, Michigan*, Minnesota*, Ohio, Wisconsin
Region 6 (Dallas): Arkansas, Louisiana, New Mexico*, Oklahoma, Texas
Region 7 (Kansas City): Iowa*, Kansas, Missouri, Nebraska
Region 8 (Denver): Colorado, Montana, North Dakota, South Dakota, Utah*, Wyoming*
Region 9 (San Francisco): Arizona*, California*, Hawaii*, Nevada*,, Guam, American Samoa, Northern Mariana Islands
Region 10 (Seattle): Alaska*, Idaho, Oregon*, Washington*. States with an asterisk (*) have a State Plan. The State Plans in Connecticut, Illinois, New Jersey, New York, and Virgin Islands cover public (state and local) employees only. As shown in Exhibit 6, there do not appear to be any differences across the three lists in their regional distributions. Region 5 had the highest representation in the SST11 sample (22 percent), followed by Region 4 (15 percent) and Region 6 (14 percent). Regions 7, 8, and 10 had the smallest representation. None of the Region 9 states are in the SST11 sample, because all states covered by this region had State Plans and were thus excluded from SST11. Inspection History. Using OSHA inspection data, we provide descriptive analyses of the inspections received by SST11 establishments in the period January 2005 through December 2010, that is, the six-year period before these establishments were selected for SST11. These inspections fell under two general categories: (1) programmed inspections, which are
IMPAQ International, LLC Page 21 OSHA SST Evaluation
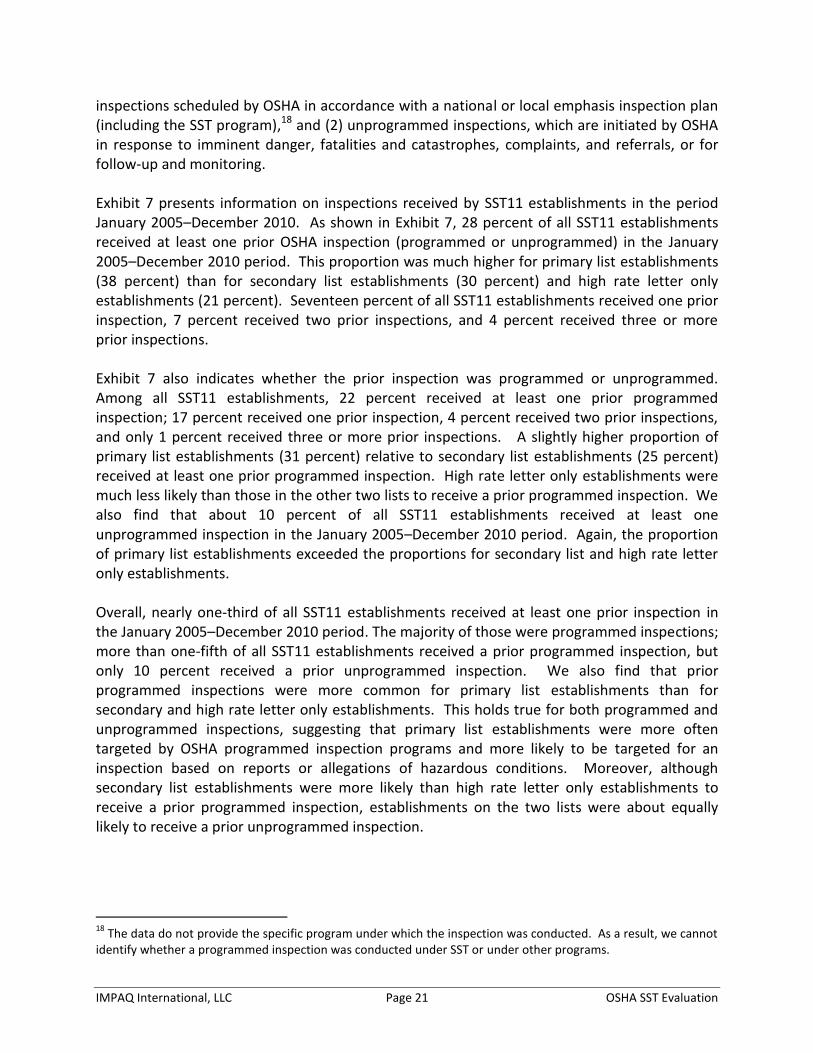
inspections scheduled by OSHA in accordance with a national or local emphasis inspection plan (including the SST program),18 and (2) unprogrammed inspections, which are initiated by OSHA in response to imminent danger, fatalities and catastrophes, complaints, and referrals, or for follow-up and monitoring. Exhibit 7 presents information on inspections received by SST11 establishments in the period January 2005–December 2010. As shown in Exhibit 7, 28 percent of all SST11 establishments received at least one prior OSHA inspection (programmed or unprogrammed) in the January 2005–December 2010 period. This proportion was much higher for primary list establishments (38 percent) than for secondary list establishments (30 percent) and high rate letter only establishments (21 percent). Seventeen percent of all SST11 establishments received one prior inspection, 7 percent received two prior inspections, and 4 percent received three or more prior inspections. Exhibit 7 also indicates whether the prior inspection was programmed or unprogrammed. Among all SST11 establishments, 22 percent received at least one prior programmed inspection; 17 percent received one prior inspection, 4 percent received two prior inspections, and only 1 percent received three or more prior inspections. A slightly higher proportion of primary list establishments (31 percent) relative to secondary list establishments (25 percent) received at least one prior programmed inspection. High rate letter only establishments were much less likely than those in the other two lists to receive a prior programmed inspection. We also find that about 10 percent of all SST11 establishments received at least one unprogrammed inspection in the January 2005–December 2010 period. Again, the proportion of primary list establishments exceeded the proportions for secondary list and high rate letter only establishments. Overall, nearly one-third of all SST11 establishments received at least one prior inspection in the January 2005–December 2010 period. The majority of those were programmed inspections; more than one-fifth of all SST11 establishments received a prior programmed inspection, but only 10 percent received a prior unprogrammed inspection. We also find that prior programmed inspections were more common for primary list establishments than for secondary and high rate letter only establishments. This holds true for both programmed and unprogrammed inspections, suggesting that primary list establishments were more often targeted by OSHA programmed inspection programs and more likely to be targeted for an inspection based on reports or allegations of hazardous conditions. Moreover, although secondary list establishments were more likely than high rate letter only establishments to receive a prior programmed inspection, establishments on the two lists were about equally likely to receive a prior unprogrammed inspection.
18
The data do not provide the specific program under which the inspection was conducted. As a result, we cannot identify whether a programmed inspection was conducted under SST or under other programs.

IMPAQ International, LLC Page 22 OSHA SST Evaluation
Exhibit 7: Inspection History of SST11 Establishments
All
Establishments Primary
List Secondary
List High Rate
Letter Only
Number of Establishments 15,697 3,637 4,251 7,809
All Inspections
Received any prior inspection, 2005–2010 28% 38% 30% 21%
Number of prior inspections, 2005–2010 .4 (.9) .7 (1.2) .5 (.9) .3 (.8)
No Inspections 72% 62% 70% 79%
1 Inspection 17% 21% 19% 14%
2 Inspections 7% 11% 8% 5%
3+ Inspections 4% 6% 3% 2%
Programmed Inspections
Received programmed inspection, 2005–2010 22% 31% 25% 16%
Number of programmed inspections, 2005–2010 .3 (.6) .4 (.7) .3 (.6) .2 (.5)
No Inspections 78% 69% 75% 84%
1 Inspection 17% 22% 19% 13%
2 Inspections 4% 7% 5% 3%
3+ Inspections 1% 2% 1% 0%
Unprogrammed Inspections
Received unprogrammed inspection, 2005–2010 10% 16% 10% 8%
Number of unprogrammed inspections, 2005–2010 .2 (0.6) .3 (0.7) .1 (0.5) .1 (0.5)
No Inspections 90% 84% 90% 92%
1 Inspection 7% 11% 7% 5%
2 Inspections 2% 3% 2% 2%
3+ Inspections 1% 2% 1% 1%
Note: Reported are sample proportions; for number of prior inspections, the sample mean is reported with the standard deviation in parentheses.

IMPAQ International, LLC Page 23 OSHA SST Evaluation
The violation history of SST11 establishments, based on the outcomes of prior inspections they received in the 2005–2010 period, is presented in Exhibit 8. The average number of prior violations for all SST11 establishments (including both those that did and those that did not receive an inspection in the 2005-2010 period) was 1.5 violations. Among all SST11 establishments, 77 percent had zero prior violations, either because they were not inspected or because no violations were detected during the inspections. The remaining 23 percent had at least one violation: 9 percent had 1 to 3 violations, 6 percent had 4 to 6 violations, and 8 percent had at least 7 violations. By dividing the proportion of establishments with at least one violation (23 percent) by the proportion of establishments that received a prior inspection (28 percent; see Exhibit 7), we find that 82 percent of the SST11 establishments that received a prior inspection had at least one violation. Primary list establishments had a higher average number of prior violations than secondary list and high rate letter only establishments. The average number of violations for primary list establishments (2.7) was more than twice the average for secondary list establishments (1.3) and more than 2.5 times the average for high rate letter only establishments (1.0). These disparities are in part driven by the fact that a relatively higher proportion of primary list establishments received a prior inspection compared with secondary list and high rate letter only establishments (see Exhibit 7). If we divide the proportion of establishments that had at least one prior violation by the proportion of establishments that received a prior inspection, we find that among establishments that received a prior inspection, the violation rate was 89 percent for primary list establishments compared with 80 percent for secondary list and high rate letter only establishments. These figures show that – conditional on receiving a prior inspection –primary list establishments were more likely than other establishments to have at least one prior violation. It is worth noting that disparities in the number of prior violations are also partly driven by the high proportion of primary list establishments that had a large number of violations. As shown in Exhibit 8, 14 percent of primary list establishments had at least 7 prior violations compared with 7 percent for secondary list and 5 percent for high rate letter only establishments. Exhibit 8 provides additional detail on the types of violations cited in prior inspections. Prior violations are grouped into two categories: (1) serious, repeat, or willful violations, and (2) all other violations.19 As shown in the exhibit, the average SST11 establishment had 1.0 serious, repeat, or willful violation in the 2005–2010 period. Primary list establishment had 2.0 such violations, more than twice the number for secondary list establishments (0.9) and almost three times the number for high rate letter only establishments (0.7). This result is driven to some extent by the fact that primary list establishments were more likely to receive a prior inspection and to have 7 or more serious, repeat, or willful violations. Similar patterns are observed for other violations. In general, Exhibit 8 shows that prior violations were much more common among primary list establishments, in part because they were more likely to receive a prior inspection and in part because, conditional on receiving a prior inspection, these establishments were more likely to be in violation.
19
he available data do not disaggregate “other violations” into separate types.

IMPAQ International, LLC Page 24 OSHA SST Evaluation
Exhibit 8: Prior Violation Outcomes of SST11 Establishments, 2005–2010
All
Establishments Primary
List Secondary
List High Rate
Letter Only
Number of Establishments 15,697 3,637 4,251 7,809
All Violations
Number of all violations, 2005–2010 1.5 (4.3) 2.7 (6.1) 1.3 (3.5) 1.0 (3.4)
0 Violations 77% 66% 76% 83%
1–3 Violations 9% 11% 11% 8%
4–6 Violations 6% 9% 6% 4%
7+ Violations 8% 14% 7% 5%
Serious, Repeat, or Willful Violations
Number of serious violations, 2005–2010 1.0 (3.4) 2.0 (5.0) .9 (2.6) .7 (2.7)
0 Violations 81% 69% 80% 86%
1–3 Violations 10% 13% 11% 8%
4–6 Violations 4% 8% 4% 3%
7+ Violations 5% 10% 5% 3%
Other Violations
Number of other violations, 2005–2010 .4 (1.3) .7 (1.7) .4 (1.3) .3 (1.1)
0 Violations 83% 75% 83% 88%
1–3 Violations 13% 19% 14% 10%
4–6 Violations 3% 4% 3% 2%
7+ Violations 1% 2% 0% 0%
Note: Reported are sample proportions; for number of violations, the sample mean is reported with the standard deviation in parentheses.

IMPAQ International, LLC Page 25 OSHA SST Evaluation
Exhibit 9 presents descriptive analyses of OSHA penalties assessed on SST11 establishments based on violations detected in prior inspections conducted in the 2005–2010 period. The top panel of the exhibit presents penalty amounts associated with any prior violations (i.e., both serious, repeat, or willful violations and other types of violations). Among all SST11 establishments (including those that did not receive a prior inspection), 21 percent were assessed some penalty amount as a result of violations cited in one or more prior inspections, with an average penalty amount of $1,700. Mirroring the results for violations, primary list establishments were more likely to have a prior penalty assessed and had higher average penalty amounts. The proportion of primary list establishments with a prior penalty (32 percent) was 10 percentage points higher than the proportion for secondary list establishments (22 percent) and 17 percentage points higher than the proportion for high rate letter only list establishments (15 percent). Moreover, the average penalty amount assessed for the primary list was $3,200, compared to $1,400 for the secondary list and $1,200 for the high rate letter only list. Examining penalty amounts in more detail, a high proportion of primary list establishments were assessed large penalty amounts – 15 percent of the primary list were assessed prior penalties of over $4,000, compared with 9 percent for the secondary list and 5 percent for the high rate letter only list. Exhibit 9 also presents separate results for penalties associated with serious, repeat, or willful violations and for penalties associated with other violations. These results are similar to the analyses of penalty amounts for all prior violations. About 15 percent of all SST establishments were assessed penalties as a result of prior serious, repeat, or willful violations, and 19 percent were assessed penalties as a result of other violations. The average penalty assessment amounts were $1,700 in cases involving serious, repeat, or willful violations and $1,400 in cases involving other types of violations. Primary list establishments were more likely than establishments on the other two lists to be assessed penalties for each category of violations, and had much higher penalty amounts assessed. The latter result is produced partly because primary list establishments were more likely to be assessed a penalty, but also because a larger proportion of primary list establishments were assessed more than $4,000 in prior penalties, both for serious, repeat, or willful violations and for other violations.

IMPAQ International, LLC Page 26 OSHA SST Evaluation
Exhibit 9: Penalty History of SST11 Establishments
All
Establishments Primary
List Secondary
List High Rate
Letter Only
Number of Establishments 15,697 3,637 4,251 7,809
Penalty Amounts for All Violations
Assessed Penalty Amount, All Violations 21% 32% 22% 15%
Penalty Amounts, 2005–2010 (thousands USD) 1.7 (11.9) 3.2 (16.6) 1.4 (7.3) 1.2 (11.4)
No Penalty 79% 68% 78% 85%
≤$2,000 7% 10% 8% 6%
$2,001–4,000 5% 7% 5% 4%
$4,001+ 9% 15% 9% 5%
Penalty Amounts for Serious, Repeat, or Willful Violations
Assessed Penalty Amount, Serious Violations 19% 31% 20% 14%
Penalty Amounts, 2005–2010 (thousands USD) 1.7 (11.9) 3.2 (16.6) 1.4 (7.2) 1.2 (11.4)
No Penalty 81% 69% 80% 86%
≤$2,000 6% 9% 6% 5%
$2,001–4,000 5% 7% 5% 4%
$4,001+ 9% 15% 9% 5%
Penalty Amounts for Other Violations
Assessed Penalty Amount, Other Violations 15% 24% 15% 10%
Penalty Amounts, 2005–2010 (thousands USD) 1.4 (10.3) 2.7 (16.4) 1.1 (6.8) .9 (7.9)
No Penalty 85% 76% 85% 90%
≤$2,000 5% 6% 5% 4%
$2,001–4,000 3% 5% 3% 3%
$4,001+ 7% 13% 7% 3%
Note: Reported are sample proportions; for penalty amounts, the sample mean is reported with the standard deviation in parentheses.

IMPAQ International, LLC Page 27 OSHA SST Evaluation
3.3 Characteristics of Evaluation Establishments In this section, we provide an overview of the characteristics of the primary and secondary list establishments selected for the evaluation and then describe the results of the statistical tests used to confirm that the random assignment was correctly implemented. Primary Inspection List Establishments. OSHA randomly selected 1,260 primary list establishments for the evaluation as follows: 624 establishments were randomly selected to be part of Study A (420 in Treatment Group A and 204 in Control Group A) and 636 establishments were randomly selected to be part of Study B (420 in Treatment Group B and 216 in Control Group B). Exhibit 10 presents the characteristics and inspection history of all primary list establishments included in the evaluation. We also report the characteristics and inspection history of the primary list establishments that were not included in the evaluation (i.e., non-evaluation establishments) and the results of t-tests performed to compare the characteristics of the evaluation and non-evaluation establishments. If random assignment was done correctly, we should observe few or no statistically significant differences in the characteristics and prior inspection outcomes between the evaluation and non-evaluation establishments. This would indicate that the primary list evaluation establishments are representative of all SST11 primary list establishments. Exhibit 10 shows the average primary list evaluation establishment had a DART rate of 12.2 and a DAFWII rate of 7.1. These are very similar to the rates of the primary list non-evaluation establishments; in fact, as shown in the right-hand column, the differences in DART and DAFWII rates between the evaluation and non-evaluation establishments were not statistically significant. The average evaluation establishment had 90 employees who worked a total of 166,000 hours. These averages are not statistically different from those of the non-evaluation establishments,20 and thus indicate that the primary list establishments selected for the evaluation were representative in terms of size of all SST11 primary list establishments. About 82 percent of the primary list evaluation establishments were in manufacturing, 8 percent were nursing and personal care facilities and 10 percent were in other industries. The industry distribution of the evaluation establishments was similar to that of the non-evaluation establishments; as shown in the right-hand column, there were no significant differences. In addition, there were only minor differences in regional distribution between the evaluation and non-evaluation establishments. With the exception of OSHA Regions 1 and 6, the proportions of evaluation and non-evaluation establishments in each region were not statistically different. The fact that evaluation establishments were slightly more likely than non-evaluation establishments to be located in Region 1 and slightly less likely to be located in Region 6 is attributed to chance.
20
Though not shown in the table, median employment and hours were also similar in the two groups. For evaluation sites, the median number of employees was 53 and the median hours worked was 97,000. For non-evaluation sites, the corresponding medians were 55 and 102,000.

IMPAQ International, LLC Page 28 OSHA SST Evaluation
Exhibit 10: Characteristics and Inspection History of Primary List Evaluation Establishments
Primary List Evaluation
Establishments
Primary List Non-evaluation Establishments Difference
Number of Establishments 1,260 2,377
DART Rate 12.2 (7.0) 12.2 (6.1) .0 (.2)
DAFWII Rate 7.1 (7.0) 6.8 (5.7) .3 (.2)
Number of Full-Time Employees 90 (188) 101 (222) -11 (7)
Total Hours Worked (thousands) 166 (354) 189 (407) -23 (130)
Industry Manufacturing Nursing & Personal Care Facilities Other Industries
.82 (.39) .08 (.27) .10 (.30)
.81 (.39) .08 (.27) .11 (.31)
.01 (.01) .00 (.01) -.01 (.01)
OSHA Region 1 – Boston 2 – New York City 3 – Philadelphia 4 – Atlanta 5 – Chicago 6 – Dallas 7 – Kansas City 8 – Denver 10 – Seattle
.15 (.36) .11 (.31) .16 (.36) .12 (.33) .22 (.41) .12 (.32) .06 (.25) .05 (.21) .01 (.10)
.13 (.33) .12 (.33) .14 (.35) .12 (.33) .22 (.41) .14 (.35) .07 (.25) .04 (.20) .01 (.11)
.02 (.01)** -.01 (.01) .02 (.01) .00 (.01) -.00 (.01)
-.02 (.01)* -.01 (.01) .01 (.01) .00 (.00)
Received any prior inspection, 2005–2010 .40 (.49) .41 (.49) -.01 (.02)
Received unprogrammed inspection, 2005–2010 .15 (.36) .16 (.37) -.01 (.01)
Received programmed inspection, 2005–2010 .30 (.46) .31 (.46) -.00 (.02)
Number of all violations, 2005–2010 2.6 (6.0) 2.7 (6.1) -.1 (.2)
Number of serious violations, 2005–2010 2.0 (4.9) 2.0 (5.0) .0 (.2)
Number of other violations, 2005–2010 .7 (1.6) .7 (1.7) .0 (.1)
Penalty Amounts, 2005–2010 (thousands USD) 3.7 (21.3) 2.9 (13.5) .8 (.6)
Note: The first two columns report sample means (DART rate, DAFWII rate, number of employees, total hours worked, number of prior inspections, and prior penalty amounts) or sample proportions (establishment size, industry, OSHA Region, and received prior inspection), with standard deviations in parentheses. The Difference column reports t-test differences between the evaluation and non-evaluation establishments, with standard errors in parentheses; statistical significance: *= 5 percent, **= 1 percent.

IMPAQ International, LLC Page 29 OSHA SST Evaluation
Finally, 40 percent of the primary list evaluation establishments received a prior inspection in 2005–2010; 15 percent received at least one unprogrammed inspection and 30 percent received at least one programmed inspection. On average, primary list evaluation establishments had 2.6 violations (2.0 serious violations and 0.6 other violations) and were assessed $3,700 in penalty amounts. As shown in the right-hand column, differences in prior inspection outcomes between evaluation and non-evaluation establishments were not statistically significant, indicating that the primary list establishments included in the evaluation are representative of all SST11 primary list establishments in terms of inspection history. Overall, based on the figures presented in Exhibit 10, we conclude that the primary list establishments selected for the random assignment evaluation of SST11 were representative of all SST11 primary list establishments. This suggests that the results of the impact study will be representative of the entire population of SST11 primary list establishments. Secondary Inspection List Establishments. OSHA randomly selected 1,260 secondary list establishments for the evaluation. Of these, 631 were randomly selected for Study A (420 in Treatment Group A and 211 in Control Group A) and 629 were selected for Study B (420 in Treatment Group B and 209 in Control Group B). Exhibit 11 presents the characteristics and inspection history of the secondary list evaluation establishments and compares these with the characteristics and inspection history of the secondary list non-evaluation establishments. The average secondary list evaluation establishment had a DART rate of 7.6 and a DAFWII rate of 4.1, which were not statistically different from the corresponding rates of the non-evaluation establishments. The secondary list evaluation establishments had, on average, 156 employees who worked 282,000 hours, compared to an average of 150 employees and 290,000 hours for the non-evaluation establishments; these differences were not statistically significant.21 The majority of secondary list evaluation establishments were nursing and personal care facilities (65 percent), followed by manufacturing (29 percent) and other industries (7 percent). No statistical differences were detected in the industry distribution between evaluation and non-evaluation establishments.
21
Though not shown in the table, median employment and hours were also similar in the two groups. For evaluation sites, the median number of employees was 82 and the median hours worked was 154,000. For non-evaluation sites, the corresponding medians were 84 and 155,000.

IMPAQ International, LLC Page 30 OSHA SST Evaluation
Exhibit 11: Characteristics and Inspection History of Secondary List Evaluation Establishments
Secondary List
Evaluation Establishments
Secondary List Non-evaluation Establishments Difference
Number of Establishments 1,260 2,991
DART Rate 7.6 (2.8) 7.7 (.2.9) -.1 (.1)
DAFWII Rate 4.1 (3.1) 4.0 (3.0) .1 (.1)
Number of Full-Time Employees 156 (574) 150 (390) 6 (18)
Total Hours Worked (thousands) 282 (928) 290 (690) -8 (29)
Industry Manufacturing Nursing & Personal Care Facilities Other Industries
.29 (45) .65 (.48) .07 (.25)
.32 (.47) .61 (.49) .07 (.26)
-.03 (.02) .04 (.02) -.00 (.01)
OSHA Region 1 - Boston 2 - New York City 3 - Philadelphia 4 - Atlanta 5 - Chicago 6 - Dallas 7 - Kansas City 8 – Denver 10 – Seattle
.12 (.32) .12 (.33) .13 (.34) .17 (.37) .21 (.41) .15 (.35) .05 (.21) .05 (.21) .01 (.10)
.11 (.31) .13 (.34) .12 (.32) .15 (.36) .21 (.41) .16 (.37) .06 (.24) .05 (.22) .01 (.10)
.01 (.01) -.01 (.01) .01 (.01) .02 (.01) .00 (.01) -.01 (.01) -.01 (.01) -.00 (.01) .00 (.00)
Received any prior inspection, 2005–2010 .29 (.45) .31 (.46) -.02 (.02)
Received unprogrammed inspection, 2005–2010 .09 (.29) .11 (.31) -.02 (.01)
Received programmed inspection, 2005–2010 .24 (.43) .25 (.43) -.01 (.01)
Number of all violations, 2005–2010 1.2 (3.6) 1.3 (3.3) -.1 (.1)
Number of serious violations, 2005–2010 .8 (2.8) .9 (2.6) -.1 (.1)
Number of other violations, 2005–2010 .5 (1.4) .4 (1.2) .1 (.1)
Penalty Amounts, 2005–2010 (thousands USD) 1.3 (8.0) 1.4 (6.9) .1 (.2)
Note: The first two columns report sample means (DART rate, DAFWII rate, number of employees, total hours worked, number of prior inspections, and prior penalty amounts) or sample proportions (establishment size, industry, OSHA Region, and received prior inspection), with standard deviations in parentheses. The Difference column reports t-test differences between the evaluation and non-evaluation establishments, with standard errors in parentheses; statistical significance: **=1 percent, *=5 percent.

IMPAQ International, LLC Page 31 OSHA SST Evaluation
OSHA Region 5 had the highest proportion of secondary list evaluation establishments (21 percent), followed by OSHA Region 4 (17 percent) and Region 6 (15 percent), while no more than 5 percent of the secondary list evaluation establishments were located in each of Regions 7, 8, and 10. T-tests showed that there were no differences in the regional distribution of evaluation and non-evaluation establishments. Finally, about 29 percent of the secondary list evaluation establishments received a prior inspection in the period 2005–2010; 9 percent received at least one prior unprogrammed inspection and 24 percent received at least one prior programmed inspection. Prior inspections resulted in 1.2 violations (0.8 serious and 0.4 other violations) and $1,300 in OSHA penalties. As shown in the right-hand column of Exhibit 11, there were no significant differences in prior inspection history between the evaluation and non-evaluation establishments. Based on the figures presented in Exhibit 11, we conclude that the secondary list establishments selected for the random assignment impact evaluation of SST11 had characteristics and an inspection history similar to those of the secondary list establishments not selected for the evaluation. This suggests that the secondary list evaluation establishments were representative of all SST11 secondary list establishments, and thus the results of the impact study will be representative of the entire population of secondary list establishments.
4. Impact Analyses Plan
The random assignment evaluation design of SST11 provides OSHA with an opportunity to produce reliable estimates of the short-term impacts of the SST program on the violation outcomes and injury/illness rates of primary and secondary inspection list establishments. In particular, Study A can be used to estimate the impact of the high rate letter on the violation outcomes and the injury/illness rates of primary and secondary list establishments. Study B can be used to estimate the impact of the high rate letter plus inspection on the violation outcomes and the injury/illness rates of the primary and secondary list establishments. Below, we provide an overview of our proposed analyses for estimating the SST11 impacts under each study. 4.1 Impact Analyses for Study A – Impact of High Rate Letter The objective of Study A is to estimate the impact of the high rate letter for primary and secondary list establishments. As discussed in Section 2.2, OSHA randomly selected 1,255 establishments (624 primary list and 631 secondary list) to participate in Study A, with establishments randomly assigned to either Treatment Group A or Control Group A. Since random assignment was used to assign establishments to Treatment Group A and Control Group A, there should not be any treatment–control differences in injury/illness rates, characteristics, and inspection history. T-test comparisons confirmed that the primary list establishments in Treatment Group A are statistically equivalent to those in Control Group A (see Appendix Exhibit A). Similarly, secondary list establishments in Treatment Group A are

IMPAQ International, LLC Page 32 OSHA SST Evaluation
statistically equivalent to those in Control Group A (see Appendix Exhibit B). Since random assignment was successfully implemented, the impact of the high rate letter can be estimated by comparing violation outcomes and injury/illness rates (as reported in SST12 inspection data) for Treatment Group A and Control Group A establishments. To estimate program impacts, we propose the use of multivariate regression models that control for available establishment characteristics and prior inspection history. These models remove variation in the outcomes of interest that result from observed establishment characteristics and prior inspection history and thus estimate program impacts with greater statistical power. The baseline impact analysis model can be expressed by the following equation:
(1) The dependent variable in this model ( ) is the outcome of interest (establishment was cited for a SST12 violation, number of SST12 violations, establishment was assessed a SST12 penalty, SST12 penalty amounts assessed, SST12 injury/illness rate, etc.). Control variables include:
, a treatment indicator, which equals 1 if the establishment was in Treatment Group A and 0 otherwise.
, which includes a constant term and all available establishment characteristics (industry, number of employees, number of workers, OSHA Area Office, etc.).
, which includes OSHA inspection history variables for the period prior to SST11 selection (received prior programmed/unprogrammed inspection, number of prior programmed/unprogrammed inspections, number of prior violations, etc.).
, a zero-mean error term. This model will be estimated for each outcome of interest separately for primary list establishments and for secondary lists establishments.22 For continuous variables (e.g., number of violations in SST12, penalty amounts assessed in SST12, and SST12 injury/illness rate), a linear regression model should be used; for binary dependent variables (e.g., establishment was cited for a violation in SST12 and establishment was assessed a penalty in SST12), a logistic regression model is more appropriate. The parameter of interest in the above model is α, which is the short-term effect of the high rate letter on the outcome of interest. To account for differences in the outcomes distribution across Area Offices, robust clustered standard errors by Area Office should be produced, which will ensure that the standard errors of the model parameters are accurately estimated.
22
In the event that attrition due to site closings or other reasons reduces sample sizes substantially, this model can be estimated using both primary list and secondary list sites. Under this scenario, the model will also include (1) an indicator of whether the site was on the secondary inspection list and (2) a treatment indicator of whether the site was in the secondary inspection list and in the treatment group.

IMPAQ International, LLC Page 33 OSHA SST Evaluation
After estimating these models, t-tests should be used to assess if α is statistically significant, that is, if the high rate letter had an impact on the outcome of interest. Moreover, F-tests should be used to assess whether the impact of the high rate letter for primary list establishments was higher than, equivalent to, or lower than the impact of the high rate letter for secondary list establishments. These analyses will enable OSHA to assess if the high rate letter alone is effective in reducing the violation outcomes and injury/illness rates of primary list and secondary list establishments, and the extent to which such impacts differ between the two lists. 4.2 Impact Analyses for Study B – Impact of High Rate Letter Plus Inspection Study B will enable OSHA to estimate the short-term impact of the high rate letter plus inspection on the violation outcomes and injury/illness rates of the primary and secondary list establishments. As discussed in Section 2.2, OSHA randomly selected 1,265 establishments (636 primary list and 629 secondary list) for inclusion in Study B, with establishments randomly assigned to either Treatment Group B or Control Group B. T-test comparisons confirmed that primary list establishments in Treatment Group B are not statistically different from those in Control Group B (see Appendix Exhibit C) and that secondary list establishments in Treatment Group B are not statistically different from those in Control Group B (see Appendix Exhibit D). Thus, the impact of the high rate letter plus inspection for primary list and secondary list establishments will be estimated by comparing SST14 violation outcomes and injury/illness rates (as reported in SST14 inspection data) in Treatment Group B and Control Group B. We propose that program impacts be estimated using multivariate regression models, which will enable OSHA to estimate impacts with increased statistical power. The regression model is similar to the one presented above for Study A and can be expressed by the following equation:
(2) The dependent variable in this model ( ) is the outcome of interest. Control variables include:
, a treatment indicator, which equals 1 if the establishment was in Treatment Group B and 0 otherwise.
, which includes a constant term and all available establishment characteristics (industry, number of employees, number of workers, OSHA Area Office, etc.).
, which includes OSHA inspection history variables for the period prior to SST11 selection (received prior programmed/unprogrammed inspection, number of prior programmed/unprogrammed inspections, number of prior violations, etc.).
, a zero-mean error term.

IMPAQ International, LLC Page 34 OSHA SST Evaluation
This model will be estimated separately for primary list and for secondary lists establishments, for each outcome of interest. For continuous variables, a linear regression model should be used; for binary dependent variables, a logistic regression model is more appropriate. The parameter of interest in the above model is α, which is the short-term effect of the high rate letter on the outcome of interest. To account for differences in the outcomes distribution across Area Offices, robust clustered standard errors by Area Office should be produced. After estimating these models, t-tests will be used to assess if α is statistically significant, that is, if the high rate letter plus inspection had an impact on the outcome of interest. Moreover, F-tests should be used to assess if the impact for primary list establishments was higher than, equivalent to, or lower than the impact for secondary list establishments. These analyses will enable OSHA to assess if the high rate letter plus inspection is an effective intervention for reducing the violation outcomes and injury/illness rates of primary list and secondary list establishments, and the extent to which such impacts differ between the two lists.
5. Conclusion
This paper has presented a detailed description of the implementation and random assignment evaluation of the SST11 program, as well as analyses of the characteristics of all SST11 establishments and the establishments included in the evaluation sample. A summary of the main findings is provided below. Random Assignment Evaluation of SST11. To estimate the short-term impacts of the SST11 program, OSHA implemented a random assignment evaluation composed of two studies:
Study A – Impact of High Rate Letter. OSHA randomly assigned 840 SST11 establishments to Treatment Group A (receive SST11 high rate letter but no SST11 inspection) and 415 SST11 establishments to Control Group A (no SST11 high rate letter and no SST1 inspection). OSHA conducted SST12 inspections of all Treatment Group A and Control Group A establishments to observe their violation outcomes and injury/illness rates. The short-term impact of the high rate letter will be estimated by comparing the SST12 violation outcomes and injury/illness rates for Treatment Group A and Control Group A.
Study B – Impact of High Rate Letter Plus Inspection. OSHA randomly assigned 840 SST11 establishments to Treatment Group B (receive SST11 high rate letter and an SST11 inspection) and 425 SST11 establishments to Control Group B (no SST11 high rate letter and no SST11 inspection). OSHA is currently conducting SST14 inspections of all Treatment Group B and Control Group B establishments to observe their violation outcomes and injury/illness rates. The short-term impact of the high rate letter plus inspection will be estimated by comparing the SST14 violation outcomes and injury/illness rates for Treatment Group B and Control Group B.
Characteristics of SST11 Establishments. Analyses of the characteristics of the 15,697 SST11

IMPAQ International, LLC Page 35 OSHA SST Evaluation
establishments showed that, based on 2009 injury/illness data, the average establishment had 7.7 cases per 100 full-time employees in which employees suffered a workplace injury or illness that resulted in losing days from work, restricted work activity, or job transfers. By design, primary list establishments had a much higher number of such cases compared to secondary list and high rate letter only establishments. Analyses also show that primary list establishments were typically smaller than secondary list and high rate letter only establishments. Primary inspection list establishments were predominantly in manufacturing, whereas a substantial proportion of secondary inspection list establishments were in the other industries category. The large proportion of manufacturing establishments on the primary list is intentional; OSHA set lower primary list injury/illness thresholds for manufacturing establishments than for non-manufacturing establishments to achieve this result. The larger proportion of secondary list establishments in the other industries category is also by design; the range of secondary list injury/illness rates for this category was wider than the ranges for manufacturing or nursing and personal care establishments. There were important differences in inspection history (2005–2010) across the SST11 primary, secondary, and high rate letter only lists. Primary list establishments were more likely to have received a prior inspection (both programmed and unprogrammed) and had a higher number of prior violations than secondary and high rate letter only list establishments. As a result, primary list establishments were assessed higher penalty amounts in the 2005–2010 period. These results show that establishments with the highest injury/illness rates in 2009 were more likely to have been inspected in the 2005–2010 period, had a larger number of prior violations, and were assessed higher penalty amounts. Characteristics of Evaluation Establishments. Analyses of the characteristics of the primary and secondary list establishments randomly selected for the evaluation showed that these establishments were very similar to non-evaluation primary and secondary establishments in terms of characteristics, 2009 injury/illness rates, and 2005–2010 inspection outcomes. This shows that random assignment was correctly implemented and thus the evaluation establishments are representative of all SST11 primary and secondary list establishments. Impact Analyses Plan. Finally, the paper presented the proposed impact analyses plan for Study A and Study B. The impact analyses for Study A should rely on multivariate regression models that compare the SST12 violation outcomes and injury/illness rates for Treatment Group A and Control Group A establishments. These analyses will be conducted separately for primary list and secondary list establishments and will provide unbiased estimates of the impact of the high rate letter on violation outcomes and injury/illness rates. Similarly, the impact analyses for Study B should rely on multivariate regression models that compare the SST14 violation outcomes and injury/illness rates for Treatment Group B and Control Group B establishments. The analyses will be conducted separately for the primary list and secondary list establishments and will provide unbiased estimates of the impact of the high rate letter plus inspection on violation outcomes and injury/illness rates.

IMPAQ International, LLC Appendix OSHA SST Evaluation
APPENDIX
Exhibit A: Characteristics and Inspection History, Primary List Establishments, Study A
Primary List
Establishments, Treatment Group A
Primary List Establishments, Control Group A Difference
Number of Establishments 420 204
DART Rate 12.1 (7.2) 13.1 (6.9) -1.0 (.6)
DAFWII Rate 7.2 (7.3) 7.4 (6.5) -.2 (.6)
Number of Full-Time Employees 98 (287) 102 (121) -4 (21)
Total Hours Worked (thousands) 179 (533) 188 (240) -9 (392)
Industry Manufacturing Nursing & Personal Care Facilities Other Industries
.81 (.39) .08 (.27) .11 (.32)
.76 (.43) .11 (.32) .13 (.33)
.05 (.03) -.03 (.02) -.02 (.03)
OSHA Region 1 - Boston 2 - New York City 3 - Philadelphia 4 - Atlanta 5 - Chicago 6 - Dallas 7 - Kansas City 8 – Denver 10 – Seattle
.18 (.38) .11 (.32) .16 (.36) .11 (.31) .24 (.43) .11 (.32) .04 (.20) .04 (.19) .01 (.12)
.15 (.36) .12 (.32) .14 (.35) .15 (.36) .21 (.41) .10 (.30) .10 (.30) .03 (.17) .00 (.08)
.03 (.03) -.01 (.03) .02 (.03) .04 (.03) .03 (.04) .01 (.03)
-.06 (.02)* .01 (.02) .01 (.01)
Received any prior inspection, 2005–2010 .36 (.48) .37 (.48) -.01 (.04)
Received unprogrammed inspection, 2005–2010 .13 (.34) .18 (.39) -.05 (.03)
Received programmed inspection, 2005–2010 .30 (.46) .27 (.44) .03 (.04)
Number of all violations, 2005–2010 2.6 (6.2) 2.7 (6.4) -.1 (.5)
Number of serious violations, 2005–2010 1.9 (5.1) 2.1 (5.3) -.2 (.4)
Number of other violations, 2005–2010 .7 (1.6) .7 (1.6) .0 (.1)
Penalty Amounts, 2005–2010 (thousands USD) 3.3 (23.2) 5.3 (27.0) -2.0 (2.1)
Note: The first two columns report sample means (DART rate, DAFWII rate, number of employees, total hours worked, number of prior inspections, and prior penalty amounts) or sample proportions (establishment size, industry, OSHA Region, and received prior inspection), with standard deviations in parentheses. The Difference column reports t-test differences between the evaluation and non-evaluation establishments, with standard errors in parentheses; statistical significance: * = 5 percent.

IMPAQ International, LLC Appendix OSHA SST Evaluation
Exhibit B: Characteristics and Inspection History, Secondary List Establishments, Study A
Secondary List
Establishments, Treatment Group A
Secondary List Establishments, Control Group A Difference
Number of Establishments 420 211
DART Rate 7.8 (3.0) 7.5 (2.6) .3 (.20)
DAFWII Rate 4.2 (3.1) 4.0 (2.9) .2 (.30)
Number of Full-Time Employees 159 (669) 134 (273) 25 (48)
Total Hours Worked (thousands) 275 (864) 254 (455) 21 (635)
Industry Manufacturing Nursing & Personal Care Facilities Other Industries
.27 (.44) .07 (.26) .66 (.47)
.29 (.46) .04 (.20) .66 (.47)
-.02 (.04) .03 (.02) .00 (.04)
OSHA Region 1 - Boston 2 - New York City 3 - Philadelphia 4 - Atlanta 5 - Chicago 6 - Dallas 7 - Kansas City 8 – Denver 10 – Seattle
.13 (.34) .13 (.34) .13 (.33) .18 (.38) .20 (.40) .12 (.33) .05 (.22) .05 (.22) .01 (.10)
.15 (.36) .11 (.32) .14 (.35) .14 (.35) .17 (.38) .19 (.40) .03 (.18) .04 (.20) .01 (.12)
-.02 (.03) .02 (.03) -.01 (.03) .04 (.03) .03 (.03)
- .07 (.03)* .02 (.02) .01 (.02) .00 (.01)
Received any prior inspection, 2005–2010 .30 (.46) .29 (.46) .01 (.04)
Received unprogrammed inspection, 2005–2010 .08 (.28) .09 (.29) -.01 (.02)
Received programmed inspection, 2005–2010 .25 (.43) .25 (.43) .00 (.04)
Number of all violations, 2005–2010 1.3 (3.2) 1.2 (3.3) .1 (.3)
Number of serious violations, 2005–2010 .8 (2.5) .9 (2.6) -.0 (.2)
Number of other violations, 2005–2010 .4 (1.2) .3 (1.0) .1 (.1)
Penalty Amounts, 2005–2010 (thousands USD) 1.1 (3.4) 1.8 (7.6) -.7 (.4)
Note: The first two columns report sample means (DART rate, DAFWII rate, number of employees, total hours worked, number of prior inspections, and prior penalty amounts) or sample proportions (establishment size, industry, OSHA Region, and received prior inspection), with standard deviations in parentheses. The Difference column reports t-test differences between the evaluation and non-evaluation establishments, with standard errors in parentheses; statistical significance: * = 5 percent.

IMPAQ International, LLC Appendix OSHA SST Evaluation
Exhibit C: Characteristics and Inspection History, Primary List Establishments, Study B
Primary List
Establishments, Treatment Group A
Primary List Establishments, Control Group A Difference
Number of Establishments 420 216
DART Rate 11.8 (6.9) 12.3 (7.2) -.5 (.6)
DAFWII Rate 6.8 (7.3) 7.0 (6.4) -.2 (.6)
Number of Full-Time Employees 79 (96) 86 (126) -7 (9)
Total Hours Worked (thousands) 146 (189) 160 (236) -14 (173)
Industry Manufacturing Nursing & Personal Care Facilities Other Industries
.85 (.36) .06 (.25) .08 (.28)
.82 (.39) .10 (.30) .08 (.28)
.03 (.03) -.04 (.02) .00 (.02)
OSHA Region 1 - Boston 2 - New York City 3 - Philadelphia 4 - Atlanta 5 - Chicago 6 - Dallas 7 - Kansas City 8 – Denver 10 – Seattle
.15 (.36) .10 (.30) .16 (.36) .12 (.33) .19 (.40) .13 (.33) .07 (.25) .07 (.25) .01 (.12)
.13 (.33) .10 (.30) .17 (.38) .13 (.34) .23 (.42) .12 (.32) .07 (.25) .04 (.20) .01 (.11)
.02 (.03) .00 (.03) -.01 (.03) -.01 (.03) -.04 (.03) .01 (.03) .00 (.02) .03 (.02) .00 (.01)
Received any prior inspection, 2005–2010 .37 (.48) .39 (.49) -.02 (.04)
Received unprogrammed inspection, 2005–2010 .16 (.37) .15 (.36) .01 (.03)
Received programmed inspection, 2005–2010 .30 (.46) .32 (.47) -.02 (.04)
Number of all violations, 2005–2010 2.5 (5.9) 2.7 (5.3) -.2 (.5)
Number of serious violations, 2005–2010 1.8 (4.7) 2.1 (4.3) -.3 (.4)
Number of other violations, 2005–2010 .70 (1.6) .7 (1.4) .02 (.1)
Penalty Amounts, 2005–2010 (thousands USD) 3.2 (16.0) 3.7 (20.5) -.5 (1.5)
Note: The first two columns report sample means (DART rate, DAFWII rate, number of employees, total hours worked, number of prior inspections, and prior penalty amounts) or sample proportions (establishment size, industry, OSHA Region, and received prior inspection), with standard deviations in parentheses. The Difference column reports t-test differences between the evaluation and non-evaluation establishments, with standard errors in parentheses.

IMPAQ International, LLC Appendix OSHA SST Evaluation
Exhibit D: Characteristics and Inspection History, Secondary List Establishments, Study B
Secondary List
Establishments, Treatment Group B
Secondary List Establishments, Control Group B Difference
Number of Establishments 420 209
DART Rate 7.6 (2.7) 7.5 (2.9) .10 (.2)
DAFWII Rate 4.2 (3.1) 4.1 (3.1) .10 (.3)
Number of Full-Time Employees 158 (600) 168 (546) -10 (49)
Total Hours Worked (thousands) 293 (117) 303 (855) -10 (91)
Industry Manufacturing Nursing & Personal Care Facilities Other Industries
.30 (.46) .06 (.25) .63 (.48)
.29 (.46) .07 (.26) .64 (.48)
.01 (.04) -.01 (.02) -.01 (.04)
OSHA Region 1 - Boston 2 - New York City 3 - Philadelphia 4 - Atlanta 5 - Chicago 6 - Dallas 7 - Kansas City 8 – Denver 10 – Seattle
.09 (.28) .14 (.35) .14 (.35) .17 (.38) .23 (.42) .13 (.34) .04 (.19) .05 (.21) .02 (.13)
.12 (.33) .09 (.28) .11 (.31) .15 (.36) .25 (.43) .19 (.40) .06 (.24) .03 (.18) .00 (.00)
-.03 (.03) .05 (.03)* .03 (.03) .02 (.03) -.02 (.04) -.06 (.39) -.02 (.02) .02 (.02) .02 (.01)
Received any prior inspection, 2005–2010 .28 (.45) .29 (.45) -.01 (.04)
Received unprogrammed inspection, 2005–2010 .09 (.28) .11 (.31) -.02 (.03)
Received programmed inspection, 2005–2010 .24 (.43) .24 (.43) .00 (.04)
Number of all violations, 2005–2010 1.3 (4.3) 1.2 (3.4) .1 (.3)
Number of serious violations, 2005–2010 .8 (3.3) .8 (2.6) -.0 (.3)
Number of other violations, 2005–2010 .5 (1.9) .4 (1.2) .1 (.1)
Penalty Amounts, 2005–2010 (thousands USD) 1.7 (12.2) .8 (2.7) .9 (.9)
Note: The first two columns report sample means (DART rate, DAFWII rate, number of employees, total hours worked, number of prior inspections, and prior penalty amounts) or sample proportions (establishment size, industry, OSHA Region, and received prior inspection), with standard deviations in parentheses. The Difference column reports t-test differences between the evaluation and non-evaluation establishments, with standard errors in parentheses; statistical significance: *=5 percent.