the evaluation of a cone penetrometer asdigitool.library.mcgill.ca/thesisfile49062.pdf · the...
TRANSCRIPT

·e
THE EVALUATION OF A CONE PENETROMETER AS AN INDEX OF FARM VEHICLE MOBILITY
by
Sung Sam Kim
A the sis submitted to the Facu1ty of Graduate Studies and Research in partial fu1fi1ment of the requirements
for the degree of Master of Science
Department of Agricu1tural Engineering, Macdonald Co11ege of McGi11 University, MOntreal, Quebec.
o Sung Sam Kim 1970
December 1969

M.Sc.
ABSTRACT
Sung Sam Kim Agricu1tura1 Engineering
THE EVALUATION OF A CONE PENETROMETER AS AN INDEX OF FARM VEHICLE MOBILITY
An eva1uation of the use of a cone penetrometer as
an index of farm vehic1e mobi1ity is the purpose of this
study.
Tractor performance which inc1uded no 10ad tractor
tests and maximum drawbar pull tests on soft soi1 was re-
1ated to the penetration resistance of the cone penetrometer.
These tests were specia11y p1anned to determine the point at
which the tractor fai1ed to perform as a terrain vehic1e.
The tests were conducted on Ste. Rosalie clay and Soulanges
fine sandy 10am soi1s for Massey Ferguson 135 tractor.
It was found that a co ne index value at 4 inches
depth cou1d be used to predict tractor immobi1ity with no
drawbar pull and that a cone index of a depth of 2.5 indhes
cou1d provide a reasonab1e prediction of maximum obtainab1e
drawbar pull.
It is conc1uded that a cone index can be used to
determine differences in soi1 trafficabi1ity for the farm
tractor.

ACKNOWLEDGEMENTS
The author acknowledges the financial support of
Canada Department of Agriculture in the form of a Research
Grant for this study.
The author wishes to express his deep gratitude to
Professor R.S. Broughton, Chairman of the Department of
Agricultural Engineering, Macdonald College of McGill
University, for his heIpful suggestions, guidance and en
couragement throughout the course of this study and in
the preparation of this manuscript as thesis supervisor.
The author is glad to express his appreciation to
Professor R.M. Halyk for his advice and numerous vaIuabIe
suggestions during this study.
Special thanks are also extended to his friends,
Mr. E.R. Lising and Mr~ S.C. Negi, who have given much
heIpful assistance, and to Mrs. Jean Vauthier, who typed
so nicely this thesis.
ii

TABLE OF CONTENTS
Page
ACI<NOWLEDGEMENTS • ii
LIST OF TABLES • v
LIST OF PLATES vi
LIST OF FIGURES vii
Chapter
I.
II.
III.
IV.
INTRODUCTION
REVIEW OF' LITERA TURE
2.1. previous Study of Vehicle Mobility 2.2. Factors Affecting Vehicle Mobility 2.3. Measuring Vehicle Mobility · . . · 2.4. W.E.S. Cone Index · · · · · · · 2.5. Theory of Vehicle Immobility · 2.6. Penetrometer · · · · · · · 2.7. Factors Affecting Cone Penetrometer
Performance . . . · · · · · · . . · EXPERIMENTAL APPARA TUS •
· · · · · · · ·
1
4
4 6 9
12 14 16
17
21
3. 1. Cone Penetrometer • • • • • • • • • •• 21 3.2. Test Tractor • • . • • • • • • • • •• 23 3.3. Test Areas and Soil Properties • • •• 27
EXPERIMENTAL PROCEDURE • 29
V. ANALYSIS AND DISCUSSION OF RESULTS • 35
5.1. Soil Physical Characteristic Tests. 35
5.1.1. Laboratory Soil Compaction test. 35 5.1.2. Water Infiltration Test. • • •• 41 5.1.3. Bulk Density-cone Index Relation-
ship . . . . . . . .. . . . . .. 44
iii

Table of Contents (cont'd)
Chapter
V. 5.2. Trafficability Test ••
5.2.1. No Load Traction Test 5. 2. 2. Maximum Drawbar Pull Test
VI. SUMMARY AND CONCLUSIONS
VII. RECOMMENDATIONS FOR FURTHER RESEARCH •
VIII. REFERENCES • • • • • • • • • • • • • •
APPENDICES
A. Terminology • • • B. Data Tables • C. Computer program
iv
Page
47
47 55
62
67
69
75
76 79 83

• LIST OF TABLES
Table
1. Partic1e size distribution - Soulanges fine s;ëlI1Ci~ JL()ëtD! • • • • • • • • • • • • • • • • • •
2. Partic1e size distribution - Ste. Rosalie clay . . . . . . . . . . . . . . . . .
3. The effect of moisture content on soi1 compaction, 1aboratory soi1 test for fine sandy loam
4. The effect of moisture content on soi1 compaction, 1aboratory soi1 test for clay soi1 •
5. Bu1k density-cone index re1ationship . •
6. Tractor performance with cone index on the
Page
28
28
clay soi1 • • • • • • • • • • • •• • •• .81
7. Whee1 sirikage-s1ippage re1ationship 82
8. Maximum drawbar pull test - Ste. Rosalie c.1ay. 83- '
9. Maximum drawbar pull test - Soulanges fine sandy loam • • • • • • • • • • • • • • • • : 83
v

LIST OF PLATES
Plate Page
1. Portable, electric speed controlled cone pene-trometer • • • • . 22
2. Test tractor • • • • • • • • • • • • • • • • •• 26
3. Artificial soil-wetting prior to trafficability test . . . . . . . . . . . . . . . . . . . . .. 30
4. Travel reduction measurement • • • • • • • • •• 32
5. Tractor at stuck point . . • • • • • • • • • • • 32
vi

LIST OF FIGURES
Figure Page
1. Layout of components for soil penetrometer circu.it . . . . . . . . . . . . . . . . . .. 24
2. A representative sample of penetrometer read-ings
3. Soil compaction test: penetration resistance vs. penetration depth for different values of
34
soil moisture content • • • • • • • • • • •• 37
4. The effect of soil moisture content on soil compaction 38
5. Water infiltration tester • • • 42
6. The influe~ce of soil water infiltration on the cone penetrometer readings •• • • • 43
7. Variation of cone index with bulk Qensity 46
8. The effect of cone penetration resistance on the tractor mobility on Ste. Rosalie clay soil
9. Limit of tractor mobility •
10. Cone index vs. slippage for several penetrometer depths, no-drawbar pull, Ste. Rosalie
48
49
clay soil . . . . . . . . . . . . . . . . .. 51
Il. The variation of tractor wheel sinkage with slippage • • • • • • • • • • • • •• 53
12. Cone penetrometer resistance with different maximum drawbar pulls on st~. Rosalie clay 56
13. Cone penetrometer resistance with different maximum drawbar pulls on Soulanges fine sandy loam . . . . . . . . . . . . . . . . . . .. 57
vii

List of Figures (oont'd)
Figure
14. Cone index vs. drawbar pull for co ne indexes obtained at several penetrometer depths, Ste.
Page
RGsalie clay soil • • • •• • • • • • •• 58
15. Cone index vs. drawbar pull for cone indexes obtained atseveral penetrometer depths, Sou-langes fine sandy loam • • • • • • • •• 59
viii

I. INTRODUCTION
Mechanization in agricu1ture in the twentieth century
has'been a major factor contributing to outstanding deve10p
ments in food production per farm worker and to the advance
ment of civilization. Under economic and sociologie pressures
field crop mechanization continues to move toward larger mo
bile power units and associated maChines.
Extensive use of large mobi1e power units and the
need to grow intensive annua1 crops with critical planting
and harvesting timing in humid c1imate regions bring on
problems of farm vehicle mobi1ity and soil compact ion.
If tractors and maChines s1ip excessively, and even
get stuck, in field operations, not only does the field effi
ciency of the machines decrease but a1so the soil structure
is damaged and crop yields are decreased. Damage to struc
ture of clay soils may also reduce water infiltration and
cause even poorer traction conditions in the future.
More efficient use of powered field machir"'''· 3 and par
ticularly tractors will be the focus of further emphasis in
the future. To reduce machine and field operation costs it
is desirable to extend the number of hours and days that
field operations can be undertaken. To aChieve this goal,

2
something suCh as sub-drainage might be done to improve
soil surface travel conditions, or sorne Changes might be
made in the design of the power maChines to improve their
mobility on the soils as found. As a fundamental factor of
the tractor operation, soil will determine the traction
performance to a muCh greater extent than any operational
control or design factor.
Soil condition is described by many parameters, for
example, strength in shear, tension and compression, plastic
elastic flow, water content, friction, cohesion, particle
size distribution, Chemical constitution, and temperature.
It has not yet beeD possible to correlate aIl of these fac
tors with vehicle mobility. It would be very desirable to
have a simple compact device which is easy to operate in
the field or the laboratory, to de termine the relation be
tween soil physical properties and the tractor performance.
This would aid both. in the design of better tractors and in
the specification of field requirements suCh as sub-drainage,
surface drainage, clean cultivation, field size, etc.
Much of the drainage research done in the past has
aimed at improving crop yields and extending the crop season
between planting and harvesting. Drainage research workers
recognize that Changes in mechanization and the difficulties
of hiring people to harvest manually indicate that the main

criterion for drainage improvements in the future will be
improved farm vehicle rnobility rather than crop yield.
3
Crops will be harvested mechanically rather than by
hand. It is yield of high quality food and feed at the con
surnption point rather than merely yield on the plant in the
field which is important. Drainage research workers have
not yet found a suitable, convehient way of defining ade
quate soil trafficability.
The soil penetrometer has been used as a means for
evaluating the mechanical strength of the soil and predic
tion of rnilitary vehicle rnobility by the U.S. Army Corps of
Engineers. There seemed good promise of using a cone pene
trometer to obtain an index of farm vehicle rnobility to pro
vide guidance for further improvernents in land drainage de
sign or farm vehicle design. It is the purpose of this
study to provide an evaluation of the use of a cone pene
trometer as an index of farm vehicle rnobility, and to ob
tain sorne experience with vehicle rnobility problerns on St.
Lawrence Lowland soils, and to suggest the emphasis needed
for further work on land irnprovements and farm vehicle
design.

4
• II. REVIEW OF LITERATURE
2.1. previous Study of Vehic1e Mobi1ity
The 1ack of a genera1 re1ationship between the per-
formance of a vehic1e and its physica1 environment has been
recognized for many years. Recently, greater emphasis has
been p1aced on the basic aspects of soi1-vehic1e mechanics
for mi1itary mobi1ity, agricu1tura1 mechanization, and earth
moving equipment. In the past twenty years there has been
an increase in research effort in this field to obtain a
• better understanding of the action of soi1-vehic1e systems.
~e purpose of these investigations has been the prediction
and eva1uation of performance and design:~ for off-the-road
or cross-country locomotion vehic1es. These studies are
genera11y directed toward the prob1ems in the field by land
vehic1es operating over loose or soft soi1. Basic prob1ems
in these soi1 types are excessive whee1 or track sinkage due
to physica1 characteristics of both the soi1 and the vehic1e,
and excessive whee1 or track slippage caused by a combination
of insufficient shearing strength of the soi1 and vehic1e
characteristics. > . • Since Mick1ethwaite (1944) tried to predict the maxi-
mum possible tractive effort of tracked vehic1esby application

5
of the well known Coulomb equation (S = c +.p tan~), Bekker
and his colleagues at the Land Locomotion Laboratory at
Warren, MiCh., U.S.A., contributed to the foundation of pres
ent theoretical work (Bekker, 1956: Bekker, 1960: Liston,
1965: and Reece, 1965). Also the Ar.my Mobility ResearCh
Center of the U.S. Army Corps of Engineers at the Waterways
Experimental Station, Vicksburg, Miss., U.S.A., has conducted
research to determine the trafficability of soil since 1943.
Knight, Freitag and Rush et al. have adopted an empirical
approach to determine whether a particular soil condition
is trafficable for a particular vehicle (Forster and Knight,
1955). The empirical approaCh consists of a correlation of
cone penetrometer reading with the ability of soil to support
traffic.
Recently Reece (1958, 1965, 1967) and his colleagues
at the University of Newcastle upon Tyne, Great Britain,
conducted some experimental tests of Bekker1s theories and
also made significant theoretical contributions.
McKibben (1960), Vanden Berg (1962), Gill (1968),
Taylor (1968) and many researchers of the National Tillage
Machinery Laboratory of the U.S.D.A. have worked to deter
mine the basic dynamic relationships of the various forces
acting on wheels or tools and the soil, and soil reaction
using large soil bins in which full size wheels, tracks,

6
vehicles and tillage tools are operated (Gill and Vanden
Berg, 1968). Although they reported many tillage techniques
and the resulting soil compaction, they were prirmarily con
cerned with dynamic properties of the soil, and soil traf
ficability was only noted indirectly (MêKibben, 1940:
Nichol, 1923).
Several other university laboratories are undertaking
experimental and theoretical developments in terramechanics.
2.2. Factors Affecting Vehicle Mobility
The mobility and traction performance of a vehicle is
determined by the relationships between all environmental con
ditions and vehicle factors.
In general, environmental conditions affecting mobility
can be expressed in three families: soil physical properties
(Perrson and Vanden Berg, 1968: Smith, 1966; McKibben, 1940):
surface compositions (Bekker, 1960; W.E.S., 1963, 1964); and
the climate (Rutledge and Machardy, 1968). The vehicle fact
ors are also divided into vehicle form, weight, and support
ing devices including dimensions such as wheel or track size,
contact pressure. In farm operations, however, the perform
ance of a vehicle on the soil may be described by its mobil
ity and tractive effort produced.
This tractive effort (D) is tractive thrust (H) minus

7
vehic1e ro11ing resistance (R) (Bekker, 1956; Reece, 1965):
D=H-R
For the tractive thrust (H), a modification of cou
lomb's shear strength equation (S = C + P tan~) has been
deve10ped by Bekker (1956) and many others (Onafeco and
Reece, 1965, 1967; Masuta and Tanaka, 1966). They proceeded
from there to the deve10pment of an equation for thrust in
the manner of Mick1ethwaite (1944) who mu1tip1ied both sides
of the Coulomb equation by the ground contact area and ob
tained
H = (AC + pA tan~)
AlI of these modifications attempted to account for
the effect of disp1acement on soi1 shear strength.
A1so ro11ing resistance (R) theories were deve10ped
based on pressure-sinkage 1aws - an ide a that originated with
Bernstein (p = kzn) (1913), and which have been deve10ped
principa11y by Bekker (1956) and Uffe1man (1961).. Experi
mental investigations (Wi11s, 1965; Vincent, 1961; Hegedus,
1965; Onafeco, 1967; Sitker, 1961) showed that ro11ing resist
ance shou1d be considered as a function of slippage which is
re1ated to the soi1 fai1ure pattern. Assuming the stress
strain in the ana1ysis of the pressure-shrinkage re1ationship,
the bearing capacity is a1so considered by many researchers

8
(Reece, 1965~ WiendieCk, 1968~ Wong and Reece, 1967) such as
soil shear strength for development of equation to predict
traction performance. The general Terzaghi (Terzaghi and
PeCk, 1948, p. 170) soil bearing capa city equation is:
q = CN + rDN + ~l'BNr c q
where
q = ultimate bearing capacity (psf) B = width of footing (ft)
c = soil cohesion (psf) r= unit weight of soil (lb)
Nc,Nq,Nr = Terzaghi's bearing capacity factors
D = depth from the ground surface to bottom of footing (ft)
Bekker (1956) proposed that soil trafficability cou Id
be defined in terms of values which have a more real physical
meaning: 1. cohesion - C
2. soil friction angle - ~
3. specifie gravit y - r 4. structural soil constant - KI' K2
5. modulus of sinkage - K
6. exponent of sinkage - N
The values of C and ~ are determined by constructing the
shear strength envelope from in situ shear device data. KI
and K2 coefficients are determined by using shear stress-
strain curves for a given soil. The value of N expresses
the physico-geometrical structure of the soil profile, and

9
the K relates the soil properties as weIl as the form and
size of the loading area. But these Bekker soil parameters
have limitations such as those pointed out by Reece (1965)
and Clark (1967), for applying to general soil-vehicle prob
lems, and they also have many difficulties for practical
purposes.
Thus, soil trafficability is defined in terms of soil
shear strength, bearing capacity criteria and such factors as
cohesion, friction and bulk density. Vehicle mobility is
also affected by the interaction of the soil trafficability
and vehicle characteristics.
2.3. Measuring Vehicle Mobility
Engineering evaluation of terrain vehicle systems is
based on measurements of a number of parameters of the math
ematical models of soil-vehicle relationships. The main
requirement for developing these methods is to make the
loading conditions of the vehicle and the loading conditions
exerted by the soil-measuring apparatus as similar as pos
sible. Accordingly, since Bernstein (1913) had introduced
soil penetration tests, the Waterways Experimental Station
(W.E.S.) of the U.S. Army Corps of Engineers developed a
non-recording penetrometer to define soil trafficability
(W.E.S., 1947). Also in the same period, a British Military

Operations Research Unit deve10ped a penetrometer with a
circu1ar plate, and a recorder to plot the constant rate
load-penetrations curve for the measured soil strength
(Evans, 1948).
Measurement of soil friction and cohesion was pro
posed during the wartime studies of mobility in England
10
(MiCk1ethwaite, 1944). The first field instrument for that
purpose was developed independently in Canada,practically
at the same time (Bekker, 1947). This state of the art in
terrain measurement prevailed until 1955, when the need for
more quantitative information became urgent and new types
of measurements were introduced. These were based on the
concept of vertical and horizontal stress-strain relation
ships, and on the definition of geometry of terrain rough
ness (Bekker, 1969).
Empirical studies of soil trafficability were carried
out by the U.S. Army Corps of Engineers (W.E.S., 1948).
Measurement of mud viscosity in studies of mobility was un
known until a decade ago (Bekker, 1969).
Recently, a bevameter has been developed by the U.S.
Army Tank Automotive Cornmand's Land Locomotion Laboratory
(Bekker, 1956; Reece, 1964; Liston, 1965). This instrument
consists of two or three penetration plates, and shear plates
together with appropriate recorders of stress-strain

•
•
•
:
Il
relationships. Several types of the bevameterhave been
developed by the vehicle mobility research laboratories (Reece,
1964; Bekker, 1960: Bekker, 1969).
The bevameter teChnique, which applies to aIl soils
and· snow and consists of a number of penetration tests and a
shear test, produces a number of soil parameters. In addi
tion, the correlation of bevameter data with vehicle design
and/or performance parameters can he achieved throughexperi
mentally tested mathematical models. Furthermore, the sev
eral indices defined by a number of shear and penetration
tests conta in more information (Bekker, 1969). Although
this bevameter is particularly useful in cases such as lab
oratory investigations under fully controlled conditions to
verify mathematical models of soil-vehicle relationships,
this structure is also too complex for practical purposes,
and a simpler more versatile one is required for use on a
farm.
Another method for determining soil characteristics
developted in the early 1940's by the Wate:rways Experimental
Station, has lumped the mechanical properties that char
acterize soil bearing strength and thrust resistance into
one value, called the cone index.

12
2.4. W.E.S. Cone Index
The cone index is defined as the force required to
sink the cone divided by the cone base area. A rating cone
index is used to estimate the cone index that will be ob-
tained under a moving vehicle operating on fine grained
soils (Knight and Freitag, 1962).
The rating cone index is ·obtained by multiplying the
in situ cone index by a remolding index whidh is obtained by
measuring the cone index of the soil confined in a small
cylinder before and after pounding it with 100 blows of a
2~ pound tamper fa11ing 12 inches. Tb determine whiCh
cone index is to be used, soils are classified as fine-
grained or sandy.
Knight and Freitag (1962) reported that the rating
cone index taken from a given area can be used to predict
confidently -
1. whether a given vehic1e can cross the area once
2. whether 50 vehic1es can cross the area in the same traCk
3. the load that a vehicle can tow through the area, or
4. the slope that the vehic1e can negotiate in the area.
The mobility index system out1ined by Knight and Freitag
(1962) was developed to assist in evaluating the effects of
vehicles characteristics on the mobility index formula.

e developed for self-propelled wheeled vehicles operating on
fine-grained soils. This was given as:
where MI = Mobility Index
Pf = gross weight in lbs tire width xrim diameter x number of tires
Wf = weight factor
greater than 3,500 pounds = 1.1
1,500 to 3,500 pounds = 1.0
less than 1,500 pounds = 0.9
tf = tire factor = 1.25 x tire width in inChes/lOO
tIf = tire lug factor = 1.05 with chains
1.00 without chains
W = wheel load = gross weight number of wheels
Cf = clearance factor = clea~~nce (inCh)
Ef = engine factor = 1.0 greater than 10 hp per ton
1.05 less than 10 hp per ton
Uf = transmission factor = 1.0 hydrau1ic
1. 05 meChanical
13
Vehicle cone index can be predicted from the relation
between mobility index and vehicle cone index.
But in spite of the considerable efforts that have been
made in the direction of solving this mobility problem, the

14
cone index is used only as a means of indicatingthe soil
strength. Bekker (1956)pointed out that "these soil stren-
gth factors did not provide the sought for definition of
trafficability because the theoretical knowledge of the re-
lationship between shearing strength of soil and vehicle
locomotion was not considered." As yeti there are· not enough
theoretical analysis relatingvehicle motion and the cone
penetrometer readings. Also these various cone indices apply
only to particular military vehicles which have different
requirements from farm vehicles.
For milita:cy vehicles:
1. General traffic unit is passage of 50 vehicles.
2. Soil characteristics of the area are not known.
3. Power efficiency is of little concerne
4. Damage to soil structure for future crop growth is disregarded.
For agricultural vehicles the above points should be
taken into consideration.
2.5. Theory of Vehicle Immobility
Vehicle immobility can be divided into two extreme
cases:
1. when a wheel device sinks deeply into sticky mud
and is just capable of moving itself forward so that its net

15
pull is zero, the whee1 wi11 probab1y be spinning,
2. and the other case when the ro11ing resistance is
the same as or bigger than the soil thrust or input energy,
the wheel wi11 be braking.
According to the suggestion of Bekker's tractive effort
equation, these phenomena can be indicated
from D = H - R
1. H = 0 (spinning)
2. R ~ H (braking)
At present, the spinning state (forward velocity =
0) seerns to be the most 1ègical basis on whidh to define the
stuck point and thus provide one of the more important
criteria of performance. It occurs usually in extremely
soft soil or stiCky and s1ippery soi1.
Particular1y in the case of conventional rear-wheel
drive tractors, the tractive effort is a function of the
front and rear whee1s ro11ing resistance and front axle
load towing force.
where
D = H - (Rf + Rr) - Wf
D - tractive effort
H - soil wheel thrust (per unit contact area)
Rf- front whee1 ro1ling resistance
Rr- rear wheel r011ing resistance
Wf-front ax1e 10ad towing force

As a tractor, its tractive effort is zero at the spinning
point since aIl input energy is lost in the contact zone.
This spinning state can be a1so c1early defined as energy
loss (Yong, 1966: SChuring, 1966).
2.6. Penetrometer
16
Since measuring soil strength is a difficult and in
convenient process, soil scientists have searched for sim
pler and more convenient methods of measurement. Because
of their relative simplicity of construction and use, and
because of their ability to be used in the field as weIl as
in the laboratory, penetrometers have been used to obtain
soil strength indications.
Many sizes and shapes of penetrometers have been
employed including: Needle penetrometer (Bernstein, 1913)~
Impact penetrometer (Nichols, 1923): Co ne penetrometer
(Proctor, 1933~ Richards, 1941): Drop-type penetrometer
(stone and William, 1939).
Penetrometers can also be divided into two groups
depending on the methods of applying force:
1. static penetrometers, and
2. impact penetrometers.
The majority of penetrorneters have been the static

17 ,
type, because the static penetrometer is a simp1er instru-
ment than the impact penetrometer. Two mathematica1 mode1s
are used depending on the teChnique of driving the penetro-
meter into the soi1. At Vanden Berg and Gillis suggestion
(1968), (1) one mode1 expresses the force required to cause
penetration, either in terms of magnitude or on a unit area
basis (genera1 penetrometer): (2) the other mode1 measures
the energy required to cause penetration (Ze1enin, 1950:
House1, 1939). Genera11y an average energy value over some
depth is considered representative of penetration resist-
ance.
Some recording penetrometers have been deve10ped
to provide a continuous record of resistance with depth for
various special purposes (Vanden Berg and Gill, 1967: Broms,
1965: Mathieu, 1958: Proctor, 1968: Terry, 1968: Wi11iford,
1968).
2.7. Factors Affecting Cone Penetrometer Performance
Since the W.E.S. has deve10ped the cone index system
for deterrnining soi1 trafficabi1ity by cone penetrometer,
some researchers have concentrated on the investigation of
the re1ationship of the cone characteristics and soi1 condi-
tions. These resu1ts are as fo11ows:

18
1. The cene tip size and angle effects.
The W.E.S. (1948) reported that the shape of the
tip of the probe hadlittle effect on the resistance to
penetrometer projected end area. But recently many resear
chers who studied the influence of the geometry of penetro
meters on resistance to penetration with dimènsional anal
ysis techniques, reported that (a) for any given tip shape
penetr0meter tip size and an.gle had no effect on the trans
formed data (i.e. bath model and prototype tips conformed
to the theoretical relationship (Kondnor, 1962): (b) the
only apparent effect of variation of tip size was in the
magnitude of the penetrometer load-depth readings. The
functional relationship was unchanged (Shuman, 1967).
2. The size of the cone shaft.
The size of the penetrometer shaft relative to the
diameter of the cone can influence the results of the test
(Freitag, 1967). If the shaft is relatively small, the
pressure relief will tend to reduce the penetration re
sistance. On the other hand, if the shaft has nearly the
same diameter as the cone, the drag of the soil on the
shaft could cause an apparent increase in penetration re
sistance.
3. The sFeed of the penetration into the soil.
The speed of the penetration into the soil also

19
affects the pressure required to cause the penetration. The
penetration resistance is relatively low at slow speeds but
increases as the speed of the penetration increases in a
wet, fine-grained soil. In sandy soils little or no speed
effects were observed other than those that cou Id be accounted
for by inertia effects (Freitag, 1967).
4. The relation of soil shear strenqth and penetrometer.
Smith (1966), Shuman (1967), Freitag (1967), Gill
(1967) and Williford and Larson (1968a) also studied indi
vidual factors such as soil bulk volume weight, cohesion,
frictional angle and shear strength relate with cone index
for many soils.
5. The very thin soil surface condition.
From the results of a study of the effect of wet
surface soil conditions on the performance of a single
wheel (Smith, 1966), a cone penetrometer does not completely
describe the effects of the soil variable on pull when water
is introduced. This is not unreasonable, because the cone
index is a gross description of a group of soil properties,
while the loss of pull in the flooded test is due to a thin
film of weak material on the soil surface. If the cone
index used is from the soil resistance at a six-inch depth,
the surface condition is not adequately measured.

Willford (1968) reported that the cone index is an
indication of the soil condition at the depth of the cone
tip rather than at the base of the cone.
General conclusions are that cone penetrorneter is a
useful field instrument and a test device for sorne of the
more simple soil conditions.
20

21
III. EXPERIMENTAL APPARATUS
3.1. Cone Penetrometer
In preliminary tests using a W.E.S. portable cone
penetrometer it was not possible to obtain consistent re
sisting force measurements because it was not possible to
have a constant penetration speed when forcing the penetro
meter into the ground by hand.
The penetrometer used in this study was designed
for use both in the field and in the laboratory. It was
mounted on the frame as shown in Plate 1. The cone and
stem are forced into the soil by a motor. The speed of
penetration is varied by changing the motor speed by use of
an electrical control system. The force on the penetro
meter cone was measured by a strain gage which produced an
electrical signal proportional to the resisting force of
the soil. The potentiometer produced an electrical signal
proportional to the extension of the position of the pene
trometer point. These electrical signaIs were transmitted
to an X-y recorder which plotted the axial force acting on
the cane as a function of the depth of penetration into
the sail.
The zero point was arbitrarily selected as the

PLATE 1. PORTABLE, ELECTRIC SPEED CONTROLLED
CONE PENETROMETER
22

(
(
PLATE L PORTABLE, ELECTRIC SPEED CONTROLLED
CONE PENETROMETER
22

23
point at which the tip of the cone was level with the sur-
face of the soil. This means that, due to the irregulari-
ties in the soil surface caused by cultivation or tillage,
the zero reading is not always the same.
A circuit diagram of the force measuring system is
shown in Figure 1.
The cone used on the penetrometer had an included
angle of 30 (degrees) with a cross sectional base area of
~ square inch and was made of stainless steel. The stem
diameter was 0.625 inches.
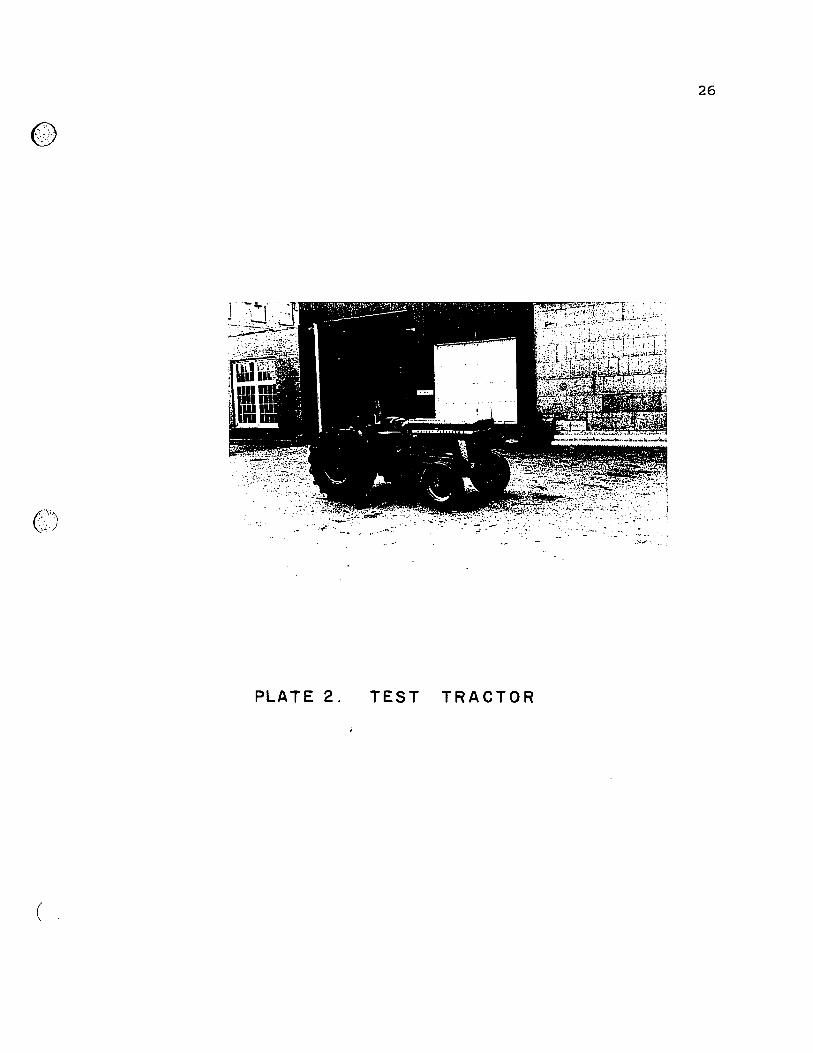
3.2. Test Tractor
The Massey-Ferguson model 135 (gasoline engine)
farm tractor used for the field tests had the following
pertinent data:
Weight
Tires
Gross 3,566 lbs. (including driver. but no wheel balast)
Front axle 1,326 lbs.
Rear axle 2,240 lbs.
Nominal width (inch) Front-6 Rear-12.4
Rim diameter (inch) Front-16 Rear-28
Nominal outside (inch) Front-28 Rear-50.4 diameter
Inflation pressure (psi) Front-20 Rear-15
Ply rating Front-4 Rear-4

+ +
y INPUT
X INPUT
y AXIS CALIBRATION
SWITCH
1 2
12500
330 K
X AXIS CALIBRATION
FIGURE 1. LAYOUT OF COMPONENïS FOR SOIL
PENETROMETER CIRC UIT
24

y - AXIS CALIBRATION CIRCUIT
r _S~_n_s_ijj.y! 'tt J~P-l1.~. 1 1 1 1
~---~---T-------------------------------~ 1 1 : 5K pot 270 : ~----------------~
-=.6V Rz1
y - IN PUT
3
R1 = R2 = R3 = R4 = 120 1,000 Then
Rz 2 = 100R1 = 12,000 RZ2 used = 12,500
6V
Rz1 = 25 K pot
Sensitivity Control
strain gage
lower 1imit
current 1imit 6 = _ll' __ = ____ _
Rt 5,270 V 6 -----= upper 1 imi t = ----=
270 R
l = 0.03 amps.
= 1.14 ma.
22.2 ma.
x - AXIS CALIBRATION CIRCUIT
J turn • Zero Adjust lOOK pot X - IN PUT
Zero Adjust
- Determines maximum range of x def1ection.
- Compensates for battery ageing·'.
25

26
PLATE 2. TEST TRACTOR
ft
26
PLATE 2. TEST TRACTOR
('

Maximum drawbar pull 2,147 lbs. (5.28 mph)
at slip 7.82%
(on the Nebraska Test - No. 899)
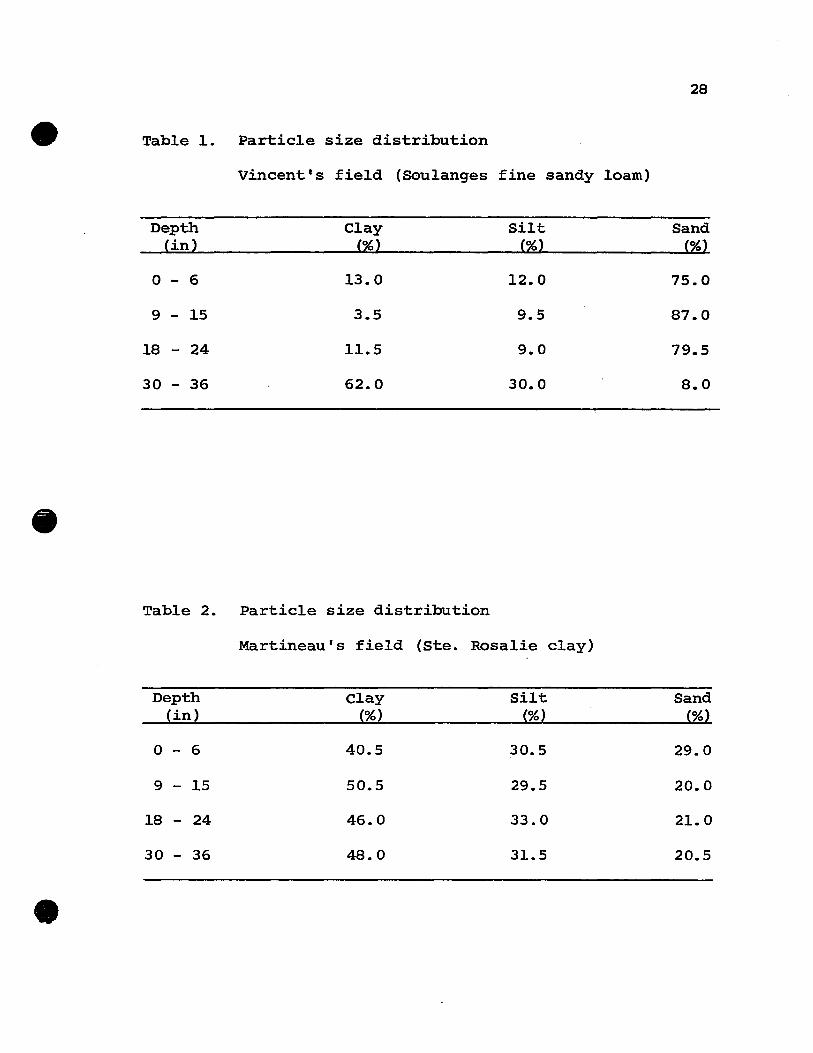
3.3. Test Areas and Soil Properties
TWo test areas, located near st. Clet in Soulanges
County, Quebec, about twenty miles ~outhwest of Macdonald
College, were used in this study. The soils in the test
areas were classified as a heavy clay, Ste. Rosalie clay
(Mr. Martineau farm), and Soulanges fine sandy loam soil
(Mr. Vincent farm).
27
The fine sandy loam and clay soils are potentially
fertile but suffer from poor or imperfect drainage because
of the fIat topography of the region and low permeability
of the subsoil which makes farm vehicle mobility a severe
problem, particularly in the early spring seedbed prepara
tion time and at harvesting time. These two soils are re
presentative of large acreage of st. Lawrence lowland soils.
The particle size distributions of the soils at the test
sites as found by Tu (1968) are given in Tables 1 and 2.
A more complete description of the soils at the test site
is given by Tu (1968). Vehicle mobility tests were made
for ploughed and unplowed conditions in the 1969 spring on
both soils.
28
Table 1. Particle size distribution
Vincent's field (Soulanges fine sandy loam)
Depth Clay Silt Sand (in) (%) (%) (%)
o - 6 13.0 12.0 75.0
9 - 15 3.5 9.5 87.0
18 - 24 11.5 9.0 79.5
30 - 36 62.0 30.0 8.0
Table 2. Particle size distribution
Martineau's field (Ste. Rosalie clay)
Depth Clay Silt Sand (in) (%) (%) (%)
o - 6 40.5 30.5 29.0
9 - 15 50.5 29.5 20.0
18 - 24 46.0 33.0 21. 0
30 - 36 48.0 31.5 20.5

29
IV. EXPERIMENTAL PROCEDURE
Tests were conducted by running the tractor in its
low-third gear at a speed of approximately 4 m.p.h. These
tests included no load tractor tests and maximum drawbar
pull tests with a four-wheel drive truck towed against com
pression by the tractor. Tests were conducted on soft soil
and on artificially wetted soil as shown in Plate 3.
For the drawbar pull tests, the tractor was made to
move forward in a straight line path at a constant engine
speed. The four-wheel drive truck vehicle was put in gear,
with the brakes off and provided a near constant pull when
towed by the tractor. A hydraulic dynamometer, at the end
of the cable at the rear of the tractor, measured drawbar
pull. Tests were carried out with the truck set in differ
ent gears to provide different drawbar pulls.
In each test, as soon as the tractor moved forward,
a stick was placed in the ground to mark the beginning of
one revolution of the rear wheel on whose side a line was
drawn to help the observer to note the complete revolutions.
With the tractor continuously moving, sticks were placed in
the ground to indicate the distance travelled by the tractor
after each revolution of the rear wheels as shown in Plate 4.

PLATE 3. ARTIFICIAL SOIL- WETTING PRIOR TO
TRAFFICABILITY TEST (SEPTEMBER, 1968 )

30
(
PLATE 3. ARTIFICIAL SOIL- WETTING PRIOR TO
(-TRAFFICABILITY TEST (SEPTEMBER, 1968 )
\

31
Wheel slippage was then deter.mined by measuring the distance
between the sticks. Also sudh factors as soil compact ion
and sinkage were measured in eadh track directly after each
test. Cone-penetrometer readings, soil moisture content and
buIk volume weight, were measured outside the zone of disturb-
ance created by the wheel of the tractor near the position
where the tractor failed to move forward and at intervals
along the route in the region of significant slippage approa-
Ching the point of getting stuck.
,"/
Tractor performance was related to the force dis-
placement characteristics of the cone penetrometer. These , ~l
tests were specially planned to de termine the point at
whiCh the tractor failed to perform as a terrain vehicle (go
or no go) (shown in Plate 5). Soil samples were taken to
find the moisture content and bulk density at two inch\'.
vertical increments to a depth of 12 indhes. Since the effect
of speed of penetration was not considered in the study, a
constant speed of 72 inches per minute was used throughout
the tests as recommended by Freitag (1967).
A series of six penetrometer readings were taken at
random in the region of high slippage in the test area at
positions either between or just outside the wheel tracks.
The six readings were then combined to obtain an average

32
PLATE 4. TRAVEL REDUCTION MEASUREMENT
PLATE 5. TRACTOR AT STUCK POINT

(:.~ ... \ \;.~~~·ï
PLATE 4. TRAVEL REDUCTION MEASUREMENT
.' .-- . ;'*·.· .... 0-'·_·;·,~
PLATE 5. TRACTOR AT STUCK POINT
32

33
force versus depth curve for the test. By dividing the
force by the cross-sectional area of the base of the cone, a
cone index was obtained. Then, a plot of cone index versus
depth was drawn (a representative sample is shown in Figure
2). The cone index showed a definite variation over the
depth range studied. There was not much variation in the
force required to penetra te the soil near the surface at
the several locations along the test strip. For depths
greater than seven inches the required force varied greatly.
This may be due fiEstly to the cultivation of the top soil
giving more uniformity in the top seven inches than lower
down, and secondly, to the surface of the soil in the test
fields not being fIat. ~ughness undulations of up to
two inches were quite possible on the plowed or cultivated
soil. Thus the penetrometer might strike the harder soil
below the plough layer at six inches in one place or at
eight inches in another place. A depth difference of two
inches could cause sorne of the variability between the
graphs for two different rneasuring locations.

e e e
300 > i •.
:A copy of penetration curves obtained in the
250 Soulanges fine sandy loam field
- t NO LOAD DRAWBAR PULL TEST N
~ 200 t wheel sinkage • 3.5 inch. , slippa ge • 24 (°/0) ,
..J
- SOll WATER CONTENT
i 150
1
,
depth 0 11- 3 11 43 (%)
3 - 6 35
6 - 9 30 ~ 100 t 0 9 - 12 24 0
50
MAY 14 t 1969
o o 2 3 4 5 6 7 8 9 10 Il I~ 13 ~
penetration depth (Inch)
FI G. 2. A REPRESENTAT IVE SAMPLE OF PENETROMETER READINGS IN THE FIELD

35
v. ANALYSIS AND DISCUSSION OF RESULTS
Results and discussion are given for the tests to
determine (l) the relationship between soil physical Char
acteristics and penetrometer readings, (2) the vehicle mobil
ity of a farm tractor and penetrometer readings and (3) max
imum drawbar pull for certain soil conditions.
The value of the co ne index (p.s.i.) and penetro
meter tip depth were taken from the X-y Recorder Chart. The
program for the I.B.M. 360 computer shown in the APpendix
was used to convert these data to the analysis equations
presented.
5.1. Soil Physical Characteristic Tests
5.1.1. Laboratory Soil Compaction Test
Experiments were undertaken to determine whether
there appeared to be any consistent relationship between soil
compaction and the soil penetrometer readings and between
soil moisture content and the penetrometer readings.
It is probable that different results would be ob
tained with a different compaction procedure. However, since
the main object of the research for this thesis was to obtain
observations on vehicle performance, the laboratory compaction
tests were made only to check out the reliability and repro
duceability of the penetrometer readings in a particular soil.

36
The method of preparing the soil for these tests was similar
to the processing of the soil which is used in laboratory
soil bins and is subjected to surface compaction.
The ste. Rosalie clay and Soulanges fine sandy loam
soils were prepared in accordance with the procedure as de
scribed for Method A in Section 3,4 (A.S.T.M., 1964, Designa
tion D-1557-67T, p. l20) except that the compaction device
consisted of a steel cylinder six inches in diameter and 18
inChes long and a drop hammer weighing 10 pounds. For the
tests, the cylinder was filled with thesoil and the drop
hammer was made to drop ten times on the soil from a height
of 18 inches.
Triplicate penetrometer resistance tests were made
for each soil moisture content. The results of cone index
versus depth·measurements are given in Figure 3. The tri
plicate test curves are reproduced for the 6.1% moisture con
tent. Since the relative response in the triplicate penetra
tions for other moisture contents performed with as good re
produceability as the 6.1% moisture content case, only the
average of the three penetrations is reproduced in Figure 3
for the other moisture content conditions. As can be seen
for the 6.1% moisture content case, for a particular moisture
content and compaction, the variation between penetrations is
less than 2% from the mean value. This variation includes
both instrumentation response differences and differences due

e
140
130
120
110 -C\I ZIOO "'-al 90 -l -x 80
LLI Cl 70 Z
60 IJJ Z 50 0 (.)
40
30
20
10
0 0
e
STE ROSALIE CLAY S 0 IL
SOULANGES FINE SANDY LOAM
e
Data are the average of 3 penetrometer tests at each soil condition,
Infilividual teSTS were very close to the average.
1 1
1
.. ------ ..... , ... , ...... ~.. ... ...... "
' ---- 27% ' --- . / ------ ~ , ----
' ----1 ~ __ ..
1 6.1 %
SOll MOISTURE CONTENT
(WET BASE) "
:::::> 7-"'~ ...
h"'' 10. 6 0/0 1 l "'-"'" ~ 1 1 ......... _ 1 __ ... ______ _
1 .. __ - - - -____ 14 1 01 1"" .. -..... - _____________________ . 10 1 ..... __ ...
1 ... -- ... ---- ~2 501
1 - ... - - - - - _ _ . 10 1.1. ________________________ ~ " .. --:r· ... ~~ .... -.~-:.:::.==-=':.-=----=--=:.-:..--==::::=--------_____________ ~-_30.8 0/0 ,"--- ----------- .. - -- --------~r- . --::... 6. %
/ ~ ~-----------.------------------
J 2 3 4 5 6 7 8 9 10 Penetration de pth (inch)
FIG.3. SOll COMPACTION TEST: PENETRATION RESISTANCE VS. PENETRATION
w .-.,J i '
DEPTH FOR DIFFERENT VALUES OFSOIL MOISTURE CONTENT
...

38
to soil non-unifor.mities and experimental handling. For the
combination of probe, transducers and recorder, and soil
preparation used, this close agreement between repeat pene
trations is considered to be very good.
For the purpose of this qualitative test, the com
paction (which is defined as a soil reaction caused by the
application of mechanical forces in whiCh a reduction in
specifie volume of the soil oceurs (A.S.A.E., 1969, p. 292»
was measured as the percentage reduction in total volume.
The compaction results are given in Figure 4.
From these tests, it was found that the laboratory
compacted soil is quite different from the natural field soil.
The curves in Figure 3 show that for laboratory soil, the
resistance to the penetration increases with depth, at the
beginning, but then remains more or less constant as the
depth increases beyond about three inches. However, for the
natural field soil (Figure 2), the resistance to penetration
increases continuously with the depth. This difference is
due to the laboratory compaction procedure which undoubtedly
gives more dense compaction near the surface where the hammer
strikes.
Appendix Tables 3 and 4 show that the moisture content
of the soil also has an influence on the amount of compaction
and soil penetration resistance. This is in accordance with
general soil findings (Yong and Warkentin, 1966). As the soil

e e e
40~[------------------------------------------------------------------------~
35
30
IJ.I 1 5 ~ ::) ...J g 10
5
c:,~ 'Y,
~v'Y, ~ot::J
SOULANGES F 'NE SANDY LOAM -•
,,~~
. "
Data are the· average of 3 . compo'cti'on·· . tests at each ,J'"
soil condition. Individual tests were very close'" to the average.
01 , i , •
o 10 20 30 40 SO IL MOISTURE CONTENT (% ... W. B.)
FIG.4. ·THE EFFECT OF SOIL MOISTURE CONTENT ON SOIL
COMPACTION
'w, :\0: \.- ~

40
moisture content decreases, the penetration resistance of the
soil increases. However, for clay soil, at a moisture con
tent (wet weight basis) above 35% and for the sandy loam above
15%, there is almost no Change in the penetration resistance
with moisture content. This phenomenon seems to be associa
ted with the fact that the clay soil was almost saturated at
35% moisture content and the sandy loam has water films around
soil grains above 15% moisture content.
From Figure 4 it can be seen that for sandy loam. com
paction increases with moisture content, but at 15% moisture
content there is no Change in the compaction. For clay soil
the compaction, at first increases,with moisture content, but
then decreases as the moisture content increases compaction
being highest at moisture content 23% for clay and 16% for
sandy loam.
It is realized that these compaction tests give only
qualitative results, as the calculation of the percentage com
paction used assumes that the initial soil placement in the
compaction Chamber produces a unique density for its particu
lar moisture content.
These compaction tests did show that for a particu
lar compaction procedure and soil moisture content duplicate
and triplicate penetrometer passes gave very close results.

41
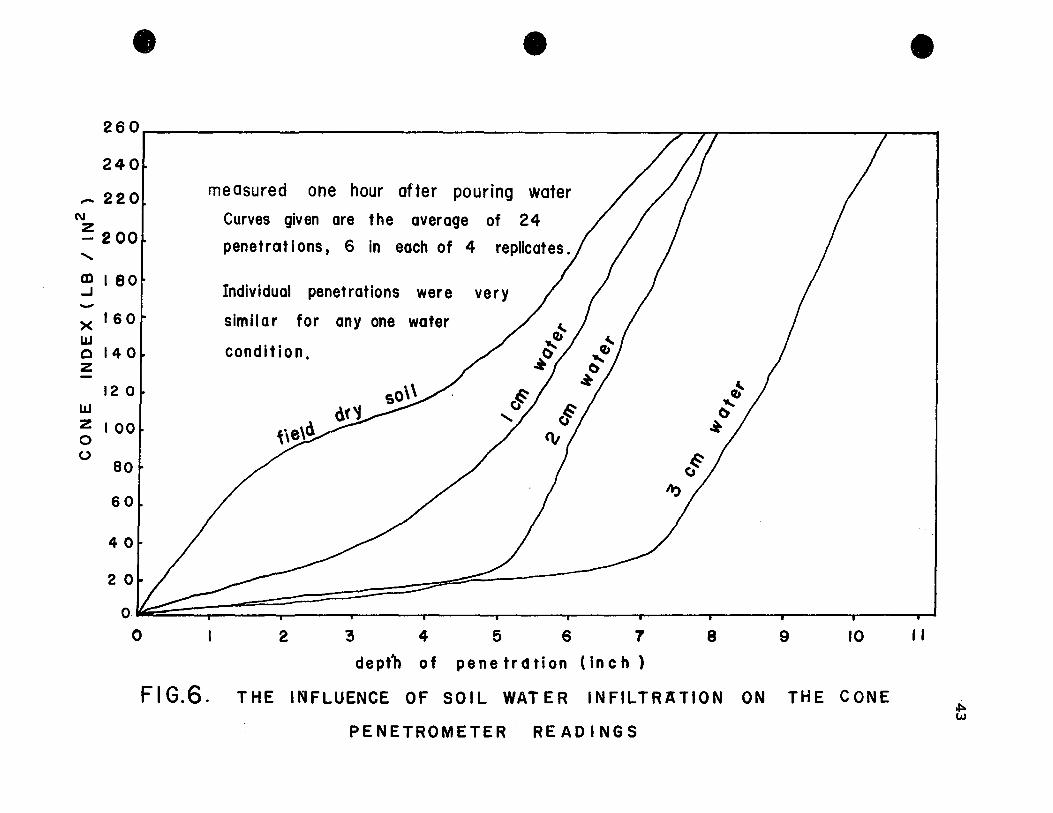
5.1.2. Water Infiltration Test
A test was conducted to determine the relationship
between soil water infiltration and penetrometer readings.
The tests consisted of inserting metal boxes, 4 feet x 2 feet
x 1 foot, into field clay soil to a depth of six inches as
indicated in Figure 5.
Water was added to these boxes to a depth of 1, 2
and 3 cm, respectively. Six penetrometer runs were made in
each of four boxes at eaCh of the three water addition
treatments at one-hour intervals for five hours after adding
water. The boxes were moved to adjacent undisturbed soil
locations for each of the three water addition treatments.
The results of this experiment are shown in Figure 6
for one hour after the water was applied. The results of
penetration runs at the end of two, three, four and five
hours were almost identical with the one-hour readings.
For the same depth, the penetration resistance is
found to decrease with an increase in soil moisture •. The
abrupt change in penetration resistance is probably associ
ated with the depth of wetting front. The lack of differ
ence with time is probably an indication that the top soil
had a high hydraulic conductivity and that translocation of
water was nearly complete one hour after the water was added.

42
7#~~#N~P~M~~~fi~ 1 1 1 1 L _________________________ J
If'------- + .... -------.,1
F/ ~ ;ri
~.:~Qr~~~ ~~~~~~~ 1
" ~
FIGURE 5. WATER INFILTRATION TESTER
e
260
240
_ 220 N
~ 200 ..... III 1 80 -J -x 160 LLJ o 140 z
12 0 LLJ Z 100 0 ()
80
60
40
2 0
0 0
e
measured one hour after pouring water
Curves given are the average of 24
penetrat Ions, 6 in each of 4 repllcates .
Individual penetrations were very
similar for any one water
condition,
2 :3 4 5 S 7
dept'h of penetrdtion (Inch)
8 9 10
FIG.6. THE INFLUENCE OF SOll WATER INFilTRATION ON THE CONE
PENETROMETER READINGS
e
Il
,J::. w

44
As shown in Figure 3 for the clay soil, the pene-
tration resistance is almost negligible for a moisture con-
te nt above 35%. This is in accordance to many research
studies (e.g. Yong and Warkentin, 1966), which have found
that at saturated moisture conditions, the soil friction
and adhesion between particles is practically nil because
actual particle to parti cIe contact is only established
through layers of water.
It can be seen from Figure 6 that the curves change
slopes at the wetting front. As a result, after irriga-
tion or after the rain has fallen, one can find the depth
of infiltration of the wetting front simply by taking
penetrometer readings and noting the point where a sudden
increase in readings is registered.
5.1.3. Bulk Density - Cone Index Relationship
The following analysis is used to predict the bulk
density of soil from a knowledge of the cone index. The
wet bulk density increases with the a~ount of moisture as
has been found previously (W.E.S., 1964), and it also increases
due to compaction of the soil underneath the paths of the
tractor. It also directly affects the soil bearing capa-
city (Terzaghi, 1959).

45
The sei1 samp1es for the wet bu1k density (grams wet
soi1/cc of field volume) were taken fram each tractor test
area where the penetration resistances were measured.
These resu1ts are shawn in Figure 7.
For clay soi1, the relation between bu1k density and
cane index is different for every cone penetration depth,
but for sandy loam soi1 the depth of penetration has no
effect on the cone index - bu1k density re1ationship.,
Thus, Gill (1967) has suggested that the cone index
has an advantage in the sandy loam soi1 and the specific
resistance appears to have an advantage in the clay soi1.
Because a basic cone-soil interaction in a compactib1e soil,
such as clay soi1, results in a compact ion of the sail in
the path of the cone, the penetration resistance increases
with depth above the zone of saturation.
For the clay soil used the bu1k density cannot be
predicted by cone index a10ne but it can be predicted by
knowing both cone index and depth of penetration. The
1inear regression equation expressing the re1ationship
between cone index and bu1k density for the clay soi1
measured is:
Bu1k density (gr of wet soil/cc of field soi1)
= 0.0049 (c.i.) + 1.1283 : at 3 in depth
= 0.00074 (c.i.) + 1.3953: at 6 in depth


o

47
and for the sandy loam soi1 is:
Bu1k density = 0.0006476 (c.i.) + 1.67195
Since this test was not done on other clay soi1
types this specifie resu1t app1ies on1y to the ste. Rosalie
soi1 used. It is suspected that the princip1e will app1y
to other clay soi1s. Testing this property with other soi1s
might 1ead to usefu1 genera1 resu1ts.
5.2. Trafficabi1ity Test
5.2.1. No Load Traction Test
Penetration resistance curves in relation to the
tractor performance are shown in Figure 8. Mobi1ity 1imit
1ines for the sandy loam and clay soi1s are found to be
quite different and are shown ïn Figure 9.
The minimum penetration resistance curves from the
series of six curves drawn in Figure 2 were chosen to plot
the graphs in Figure 8. Because the immobi1ity phenomenon
depends main1y on the softness of the soi1, the minimum and
not the average penetration resistance curve was used.
For farm land, which is usua11y cu1tivated to a depth
of about four to eight inches, the critica1 soi1 depth for
cone index was observed to be between two inches and six
inches. Be10w the six inches depth, the soi1 is more


C)

()

50
compacted and the penetration resistance and soil strength
begins to increase faster with the depth. It is also diffi-
cult to evaluate the original strength of the soil at a
level less than 1.5 inches below the soil surface because the
top of the cone is about 1.5 inches long. A good reading is
obtained only when the full length of the cone (1.5 inches)
is below the soil surface.
From the full curves of cone index versus depth
given in Figure 8 for locations on the ste. Rosalie clay
soil giving different amounts of slip, cone index values
for depths of two, three, four, five and six inChes were
obtained and plotted against percentage slip in Figure 10.
From this Figure it can be seen that the data for cone
index at the four-inch depth fit much more closely to the
smooth estimated curve than do the data for other depths.
From this, it is concluded that a single cone index value
at a four-inch depth gives the best relationship for esti-
mating slippage from a cone index reading. At the optimum
depth (four inches) the relationship between the tractor
performance and cone index can be indicated by the follo~ing
equation:
slippage = 481.053-26.19 (c.i. )+0.478 (c.i.)2-0.00283 (c. i. )3
The curves .in Figure 10 change slope at about 25%

F Iri . ;j:;+i .
~r ·H Fil
li !~!~:t!f !:ii ~tf1
. '+1:;-::
:F t,1 . H~ .
H·
.' ~*~H~!it! or.
:Iit
ml· EHl
';:;:i

o

52
slippage. This appears to be a property for rubber tires
on soil. It is noted that in the Nebraska tractor tests,
the pull at 15% slippage is taken to be the maximum pull for
the tractor. This was partly decided because tires wear
severely on the concrete test track. This slippage criteria
might be extended to 25% for lugged rubber tires on field
soils.
Immobility on clay and sandy loam soils generally
depends on the amount of sinkage of the tractor wheel.
Actual observation on the farm showed that sinkage is 'partly
due to vertical sinkage and partly due to slip sinkage con-
firming observations reported by Onafeco and Reece (1967).
This sinkage and slippage'relationship is similar for both
sandy loam and clay soils (Figure Il).
For no-go conditions, it can be seen from Figure 9
that for the same sinkage depth the penetration resistance
of the soil is greater in sandy loam than in clay soil.
These curves can be formulated as follows:
for clay soil (good for 2 inches-7 inches depth below surface)
Cone index at d inch depth = 3.6 (d) + 8.5
for sandy loam (good for 1 inch-9 inches depth below surface)
Cone index at d inch depth = 1.57 + 4.05 (d) - 0.237 (d2 )


: '
"
, i:; ~':
• 1. :
[Of '

54
In clay soil, the tractor wheel is more easily made
to spin than in sandy loam soil because of the interaction
of clay soil and the tire treads. At a sinkage depth of
about four inches it was observed that the clay soil filled
the spa ces between the treads making the tire appear smooth.
This condition also depended on the surface condition, the
soil moisture and organic content. But in the sandy loam
soil, the spaces between the tire treads are not completely
and readily filled with soil because the ad~erence of sandy
loam soil to the tire is not as great as that of clay soil
to the tire. In this series of tests, spinning only began
wh en the spaces between the tire treads were completely
filled with the sandy loam soil at a sinkage depth of about
six inches. Most of the theoretical work done by Leflave
(1966) and Masuta (1966) shows that sinkage varies linearly
with slippage, contrary to the curve obtained in Figure Il
which rises rapidly as the depth of sinkage increases, beyond
approximately five inches. The equation of this curve was
found to be obtained in the following:
slip (%) = 21.50 - 15.18 z + 3.90 z2
where z is wheel sinkage (inches).
These observations apply to a spring time field
condition. When the soil had been wetted to field capacity
or more right down to the water table and the soil was

beginning ta dry out from surface evaporation.
5.2.2. Maximum Drawbar Pull Test
This test was conducted on the ste. Rosalie clay
and Soulanges fine sandy loam soils to find the relation
ship between penetrometer resistance and tractor drawbar
pull.
55
From the results of the test, as shown in Figure 12
and 13, the maximum drawbar pull capacity can be found from
the penetration curves. These curves for different towing
loads as shO~ln in Figures 12 and 13 are drawn from penetro
meter readings obtained at the point where the tractor
wheels started spinning. From these curves it can be seen
that for any particular penetrometer depth a high cane
index value fits with a high drawbar pull ability. This
agrees with the traction theory whidh says that soil thrust
depends on the soil.
Cone index values for depths of two, two and a half,
three, four and six inches were obtained and plotted against
drawbar pull (lb) in Figures 14 and 15. From these figures
it can be seen that the data for cane index at two and a half
inches depth fit much more closely to the smooth estimated
curve than do the data for oLher depths. From this analysis

l.i n:
. En
;; W;i t!l E rijfr. ,
tIrJTI i~V '

~ ~
-._"-_." -----_.-
e ._-.
~i I~ l. '
-;_._----- -- : /.: ~ .. -;r::~'-.~-:--------. . ..JGu,! . l' ----. ' . . ,',' 1'------
["
ln .... , ,",
., ') ,'"
.1/.\"
:ie'l .: L "]
icJI ~·r~. ,
li .. '.~ ~ ... ".: 1 . _. 1 :;., ,.
! : ::. '.~ :.-':'f:···'I' l' :--:. 'ri 1'>.:1 :' l' ... "., l'r._ 1,:--,:,,;---:-; ':r u , 1
Il .• j~::;g ... :
'.~. • > :,- 1:. -~~:, .l. ~ ::. '1
l ' . '1 .. , ; . ; :;' . ! . 1 ~'.j . :. .
f, ~". -~-1:··· ':"j:-i:: '.',' 'l' . ... . . .. i : ~. ..' : :. '. . 1::,:. 1 . " :, ..•... ,.
r ", '. ", L'I 1 '··· •• '· •• l~~~!l:, 1 •• •· .•••• -; •• ;,· 1 .. .<: ! .. ' i . _.- :' .. --i~' 1:' .,!
, 1 l,
:;.'
,. ,
,
r·. v
'i ~,".'" i, ";; " J,' , ., '/: : .. '
:!' V!,:;' . """ ',' . . ' .." ," 1, , '. '
.. l' " l" , ., ' • .' ' r . , . . "
" ' .. :. .Hi IJ:>p4·~L.I~f;-f/··J,· i ,ii!: 1 i" . 1 .. ." ,!' , ,. i'" .,. ,. . l' -", i .. , i ' ' . '.'
' ... ' .. ' . ,./( .!< r i .>/1, .'. \ ,.,..1: .1; '1' :: , ..... 1 .. ch,; .. , . 'j' .. J' , 1·' •.. ,.1 .j .. " 1 . 1 • , .. ,.
1'; .. 1·. "'1 i.
'\. \~"
{'<;-'~'
.1 . '!'
t/i .1 .. :1 •.. ·.1.'·;.!·· , ..•... " · .. I·····i· " ,1 ;. ,~230a,,). Vii ...• J!.;}.~~{:;.i;' :" ... v,~;:J-;i:! ::;1_ ... ' ... , ., ......
1 . .+ ..... . .' r'i'+'" ,. ·1· ··.1 .1 ··1 l' .. , ... .,
~7 .. : .. ; ·f?-~JJ:j·.i-li.J·"···!(J! ","!"'irEl'r:~~~}+}"L-, ~~'" J'~~'T'" :.1' ;. 'i.e'",'" l':'';''-l'::'''~:l':-''~--~'' ::.~!.-(:-=-:r::.-":----1--1~O·O,:::t ,j .. :' , . l ,. l ".' __ . i' --1'"'' .... . ...... . " "' "1" " "Il'" //'G~~ .. l' '." ....... , ...... , ', .. "1"'" ~. " . .. ," ... 1·· .. )·1 -.--f~(Y! i..-; ...•. ~.': J;:c~ç~~~J'-"~~~:):! i~06~;,J ..••• ~~~. ,.' "" ., •. ' .••. ":c:~;"., .• L.r,I.:,:;I.",,,.k ..... L:::.'.· .1'· ..... ~ .• T.,!i,r '1"::':" ,'J:' L ' .' J:) ,",: i :;:;J,:.! ,::~:,:.':""J;=; '.' ::':1,:1':-
_ , ' , '.' .. '1 ",".' .1 ..•. '." 1 '1"""""" ' .. ' '·;·· .. 1· ""j' '''''1' """"1' ;.' '( :~ z:e~-o"lb!:"""';-' :; ". l,A. 'i'" ~.' ..... : ']":'::I:ll.:J,:::;.]:t1~r}i:hiA~C.1Jj1IY ,. ,., .. 1. 1'"'' .• '. 1" '. i" 1 . ,,'. "'1 .'".' .. 1· .... ,· 1 .. , .. , .........
1
. __ :-~l.~----:..:,-:_;,,--l: : '1":.:- :'1' :,,;' : "':. !.l'.!' 5 . ~ ... , .. , .• ,., ..... " '.,.'.: :.,,"."" •. , ".1'.,:;: .. ,' '·.i " . .-, .. 1-. :',", ',' : .. ' 1·.. :, ...... J ".' ... 6· [., . 1 • 1 .. , .. ,,,,,'''j " 1 ........ , . [. . [ ..i' '. 1 i' :.T.!"'· T"p
c4
o•i',à ,,(bl~' '.':'1 i, l' I:' l" 's,' " " .!':. : .,:.: .. ';'::' c: .~ . ,;. '. (
F"g',re leo c~ ... I., ... ! ':: .. ,'. ' .. i .• ,,1:, .. :. '. '.' "~Iept.ll (tuç:.,) • i .::.::1 /:1 '::1' ".".s,'.' •. 10 ... ·[ • 1 ?J p~"O.I •... O,.,ct., ... , ...... '.' .1.' 1 .".'.'. ,.'.' 1 .' '1 . ""1 . '1"''''' ·1-::::···· .... ·: .!' ., : l'~ .," ï .·c.:, 'j":' 1
...... J.J .. '.:C: rrcrt~-t"r;?( +iil' ~iif~feÙ ~."r: 1 :" C ~ 'f ,·1· :Fril
';'- i cT;);
1
._ .. .! __ ., .,. L~..J ... , s'!'ldy 10."; •.• 1 ':'U\1l drarloa',· p'dl:/' .,]" .;. • Le ,).. .. 1"'" r '" '1 . ........ " .. , ...•.. ,.:~.L ... ~. ~ ... :e ... l.:. ,."j:'J~~:1L::'t~g~ir[:rtf;~1;Ed


' , .;;iFF l~t\t :;1' "
, ,
, co;· ne; , !~! ;:1~:
e- !1! d:' Fi: +i'
je; 1 , ,
;:;;: ::: " "
ir. tH! , ll::i i:tl' :jY'W: "
:;tl: [jo 1
~ , " 1: : • 1.1
~' i
: :
: 1
j
,,1
':E : :;:;'
j:i"
i\i: :il il ~;:! ' :,i:i'
;.: j:!: li,:;
e!i l , 1
l ' 1 :; :3WrtlT ' ': :~:l!.iüilf ' if" F !~,
..: . "
1 :

60
it is concluded that a single cone index value at a two and
a half inch depth gives the best relationship for estimating
the maximum drawbar pull capacity from a cone index reading.
The maximum drawbar pull capacity for the soil condi-
tions used can be found from the following equation using
cone index (P.S.I.) for a depth of two and a half inches.
For clay soil
M.D. (C) = 0.0598 (c.i.)3 - 8.94 (c.i.)2 + 448.5 (c. i.) - 5162.88
For sandy loam
M.D. (S) = 0.048 (c.i.)3 - 6.8 (c.i.)2 + 319.2 (c. i.) - 2565.2
where M.D. = maximum drawbar pull (lb).
As a result of the various tests, the optimum pene-
trometer depth for cone index reading for a farm tracto"r is
found to be between two and a half and four inches. In
comparison, for military vehicles, according to the W.E.S.
vehicle cone index system, the optimum depth for cone index
reading is six inches. The difference in the two reading
depths appears to be due to the fact that for military
vehicles the cone index is correlated with 50 vehicle passes
and generally for natural soil conditions. For farm vehicles
on the other hand, the mobility index is correlated for only
one vehicle pass for minimum tillage or traffic, and due to

61
cultivation, for soft soil conditions. Sinceother critical
far;m vehicle mobility problems oceur in theharvest season,
it would be a useful extension of this work to correlate
cone penetrometer readings with vphicle mobility at harvest
time. A critical case would be corn harvesting where a '
tractor is pulling a corn picker and a loaded wagon. If a
two-row picker is used there will be a second pass of the
vehicles in a previous wheel track. Thus, six vehicle
passes might be considered. Required drawbar pulls and
cone indices could be measured.

62
VI. SUMMARY AND CONCLUSIONS
The results of the investigations conducted for this
thesis indicate the following conclusions concerning the use
of a cone penetrometer to obtain an index of farm vehicle
mobility.
1. The cone penetrometer must be power driven at, constant
penetration rate to give repeatable results. Hand penetro-
meters did not give repeatable results.
2. It was found that a cone index value at four inches ~
depth could be used to predict tractor immobility with no
drawbar pull. It was also found that a cone index value of
a depth of two and one half inches could be used to give a
reasonable prediction of maximum drawbar pull obtainable on
Ste. Rosalie clay and Soulanges fine sandy loam soils for
M-F 135 tractor.
3. The analysis curves of tractor performance (Figure 10)
slip versus cone index show a change in slope at about 25%
slippage. This appears to be a property for rubber tires
on soil. It is noted that in the Nebraska tractor tests, the
pull at 15% slippage is taken to be the maximum pull for the
tractor. This was partly decided because tires wore severely

63
on the concrete test track. The full load allowable slippage
criteria might be extended to 25% for lugged rubber tires on
field soils.
4. The cone penetrometer gave more consistent results on
fields in springtime when the soil was moist right to the
water table th an on soils wetted in late summer by irregular
rain or experimental watering. The spring condition gives
soil which is drier at the surface and wetter below while
the late summer rain gives a slippery surface with firmer
and dryer soil below.
5. It was found that the laboratory compacted soil is quite
different from the natural field soil. The penetration re
sistance curves show that for compacted soil in accordance
with the A.S.T.M. designation, the resistance to the pene
tration increases with depth at the beginning, but then re
mains more or less constant as the depth increases. However,
for the natural field soil, the penetration resistance in
creases continuously with the depth.
6. In these tests the no load tractor immobility cone index
curves can be indicated by the following equations:
for the ste. Rosalie clay soil
c.i. at Ud U inch depth = 3.6 (d) + 8.5

64
for the Soulanges fine sandy loam soil
c. i. at "d" inch depth = 1.57 + 4.05 (d) - 0.237 (d)2
and for the Ste. Rosalie clay soil, the tractor general per-
formance equations are as follows for the optimum penetration
depth of four inches cone penetration
slip (%) = 481.053 - 26.190 (c.i.) + 0.478 (c.i.)2 -0.003 (c. i. )3
The maximum tractor drawbar pull for a certain soil condi-
tion can be indicated by the cone index at the optimum pene-
tration depth of 2.5 inches
for Ste. Rosalie clay soil
M.D. = 0.0598 (c.i.)3 - 8.94 (c.i.)2 + 448.5 (c.i.) -5162.88
for Soulanges fine sandy loam soil
M. D. = o. 048 ( c. i. ) 3 - 6.8 (c. i. ) 2 + 319. 2 ( c. i.) -2565.2
where M.D. = maximum drawbar pull (lb)
c.i. = cone index at 2.5 inches depth (lb/in2 )
7. Soil bulk density (wet weight basis) also can be indi-
cated by a cone index. The cone index is dependent on the
depth for the clay soil but not for the sandy loam soil.
The bulk density-cone index relationships are as follows:
for clay at 3 inches depth
B.D. = 1.13 + 0.0048 (c.i.) (wet soil gr/cm3 )
at 6 inches depth

B.D. = 1.395 + 0.00074 (c.i.)
for sandy loam
B.D. = 1.671 + 0.00065 (c.i.)
65
(wet soil gr/cm3 )
(wet soil gr/cm3 )
8. It was found that the sinkage-slip relationship for farm
vehicles can be shown by the following equatiom:.
S = 21.5 - 15.18 (z) + 3.9 (z)2
where
S = slippage (%)
z = wheel sinkage (inch)
9. From the literature theoretical relations between cone
penetrometer reading and commonly used soil properties such
as undrained shear strength, unconfined compressive strength,
plasticity, soil moisture, etc., have not yet been adequately
elucidated.
10. It appears that a cone index can be used to determine
differences in soil trafficability capacity. Since soil
moisture content had a considerable effect on the cone index
and the maximum drawbar pull, trafficability differences due
to drainage should be able to be indicated by the co ne index.
Since local moisture conditions at harvest time in a
corn field can be affected by run-off along corn rows to low
spots in the micro-relief a number of locations would need to

66
be tested to evaluate soil conditions at harvest time.
11. There appeared to be sorne relation between vehicle mobil
ity and water table level, but it was not feasible in the
short time available in the 1969 spring to make sufficient
tests to obtain any definite relationship.
12. Vehicle mobility was adequate to allow tillage to pro
ceed on the clay soil at soil moisture contents too high for
satisfactory seed bed preparation. Thus it appears that for
clay soils, soil trafficability at harvest time is a more
severe limitation than at planting time.

67
VII. RECOMMENDATIONS FOR FURTHER RESEARCH
1. It is desirable to develop a standard method for measur
ing and relating vehic1e mobi1ity to the cone index for suCh
farm vehicles as tractor-cornpiCker combinations, grain com
bines, forage and vegetab1e crop harvesters, instead of only
the tractor as used in this work.
2. Cone index is a composite property of the soil. Its
relationship to common1y used soil properties such as shear
strength, friction angle, unconfined compression strength,
cohesion, etc. needs to be more adequate1y e1ucidated.
3. From the results of this experiment the optimum depth
for cone index readings is genera11y sha110w (2.5" -. 4.0"),
and sma1l differences in co ne index affect vehicle perform
ance a great deal. So, it is advisab1e to test other pene
trometers with other angles and base areas with constant
speed of penetration to determine whether more reliab1e pre
diction is feasible.
4. Domier (1968) suggested that the advantage of four wheel
drive or dual tires depends on soi1 conditions. It is desir
able to define the soil trafficability in terms of cone index
for farm vehic1es' tire configurations.

68
5. A cone penetrometer might be used as a soil structure
measuring device. Sail conditions for germination and growth
of plants might be indicated by a cone index instead of by
bulk density. Aiso a cone penetrometer can be used ta mea
sure the sail moisture content.
6. Cane penetrometers might be used ta indicate some physi
cal properties of farm products such as grain, hay and si1age.
Because those physica1 properties are difficult to measure
and also its procedure is more comp1icated.
7. A know1edge of the traction mechanics of the sail is
needed for the management, design and development of farm
vehicles. Traction mechanics which are related ta soil
strength and traction devices have sa far been described
in very general terms by most researchers (Persson, 1969).
This means that"no quantitative measure of the sail strength
is known, and so, a prediction of the traction or mobility of
a vehicle on a particular sail is not possible.
Thus, it is recommended that a study be made on the
effects of traction device contact area and thread configur
ation on mobility and traction using the cane index ta de
scribe the sail strength.

69
IX. REFERENCES
A.S.A.G. (1969). "Agricultural Engineering Yearbook rr by A.S.A.G.
A.S.T.M. (1964). IlProcedures for Testing Soil ll by A.S.T.M.
Bekker, M.G. (1945). "Proposed field soil testing device. rr
Nat. Res. Council of canada, Assoc. COmm. on soil and snow mech. T.M. No. 1, ottawa, Ont.
Bekker, M.G. (1955). uA system of physical and geometrical soil values for determination of vehicle performance and soil trafficability. Il Proc. Inter Serv. Symposium Stevens, Inst. of TeCh. and Duke Univ. Office of Ord. Res., Durham, N.C.
Bekker, M. G. (1956) . "Theory of Land Locomotion: the Mechanics of Vehicle Mobility.1l The Univ. of MiChigan Press, Ann Arbor, Mi ch •
Bekker, M. G. (1960) • 1l0ff-the-Road Locomotion: Research and Development in TerrameChanics." The Univ. of MiChigan Press, Ann Arbor, MiCh.
Bekker, M.G. (1969). "Introduction to Terrain-Vehicle Systems. Il The Univ. of MiChigan Press, Ann Arbor, Mich.
Bernstein, R. uProbleme zur experimentallen motor pfugmechanik der motorwargen." 16: 1913 (original not available), cited in Bekker, M.G. IlTheory of Land Locomotion. Il
Broms, B.B. and D.G. Broussard (1965). IlSe lf-recording soil penetrometer. Il Am. Soc. of Civil Eng. Proc. Vol. 19, No. 4200.
Clark, S.J. (1966). "Pneumatic tire meChanics of a tractive performance of single, dual and tandem tires on soil. Il Ph.D. Thesis, Purdue university.
Domier, K. W. and o. H. Friesen (1968). IlPerformance para- _ meters of tractors equipp~d with singles, duals and four wheel drive. Il C.S.A.E. paper.
Evans, I.C. (1948). "The measurement of shear strength of soft soils in the field. Il Soil Mech. Symposium, Ministry of Supply, London.

70
Evans, I. (1948a). "The measurement of the surface bearing capacity of soils in the study of earth-crossing machinery." Geotechique. Vol. 2, No. 1.
Freitag, D.R. (1965). "A di.mensional analysis of the performance of pneumatic tires on soft sail. Il Ph. D. Thesis, Arburn, Alabama.
Freitag, D.R. (1967). IIPenetration tests for sail measurements." A.S.A.E. paper No .. 67.:"·652.
Gill, W.R. (1967). Il'rhe influence of compaction hardening of sail on penetration resistance. 1I A.S.A.E. paper No. 67-651.
Gill, W.R. and Vanden Berg, G.E. in Tillage and Traction. Il
(1968). IISoil Dynamics U.S.D.A. Hand Book No. 316.
Hegedus, E. (1965). IIPressure distribution under rigid wheel. Il A.S.A.E. Trans. Vol. 8: 3.
Housel, W.S. (1935). liA penetration method of measuring sail resistallce. Il Am. Soc. for Testing' and Materials. 35: 472-490 (1935).
Jo-Young Wang and A.R. Reece (1967). IIprediction of rigid wheel performance ba.sed on the analysis of sail wheel stress. Il Jour. of Terramech. Vol. 4, No. 1.
Keen, B.A. and G.H. Cashen (1932). of sheep folding on the sail." 22: 126-134 (1932).
IIrrhe physical effect Jour. of Agr. Science,
Knight, S.J. (1962) and Freitag, D.R. trafficability characteristics. 1I
5: 121-124, 132.
IIMeasurement of sail A.S.A.E. Trans.
Kondner, R.L. (1962). liA penetrometer study of the in situ strength of clays." Materials Research and Standards. March, 1962. pp. 193-195.
Leflaive, E. (1966). IIMechanics of wheels on soft sail. A method for presenting test results." Jour. of Terramech. Vol. 3, No. 1.
Liston, R.A. (1965). IIrrhe land locomotion laboratory." Jour. of Terramech. Vol. 2, No. 4.

71
Masuda, S. and T. Tanaka (1966). ItTraction of the tractor based on soi1 parameters. Il Proc. 2nd Inter. Conf. of Inter. Soc. Terr-vehic1e System, Quebec.
Mathieu, A.L. and J.A. Toogood (1958). liA se1f-recording soi1 penetrometer. Il Canada Jour. of Soi1 Sci. Vol. 38, 100-102.
McKibben, E. G. (1940) and D. o. Hull. ItSoil penetration tests as a means of predicting rolling resistance. 1I
Agr. Eng. Vol. 21, No. 6.
McRae, J. L. (1967). ItTheory for a powered whee1 in soil. Il Jour. of Terramech. Vol. 4, No. 3.
Mick1ethwaite, E.W.E. (1944). IISo i1 mechanics in relation to fighting vehicles. Il Mi1itary Col1ege of Science, Chertsey (original not avai1ab1e), cited in Reece, A.R. IIThe principles of soi1-vehic1e mechanics. 1t
Nicho1s, M.L. (1923). ItAn analysis of soi1 dynamics factors affecting the operation of tillage and tractor machinery.1I A.S.A.E. Trans. 17: 174-184.
Onafeko, o. and A.R. Reece (1967). mations beneath rigid whee1s. 1t
Vol. 4, No. 1.
IISo il stress and deforJour. of Terramech.
Persson, S.P.E. (1966). "Parameters for tractor wheel performance." A. S.A.E. paper No. 66-142.
Prather, O. C., J. G. Hendrick and R. L. Schafer (1968). ItAn e1ectronic hand-operated recording penetrorneter." A. S.A.E .• paper No. 68-518.
Proctor, R.R. (1933). "Description of field and 1aboratory methods." Eng. News-Record 3 (10), 286-289, 1933.
Reece, A.R. (1964). "Prob1erns of soi1-vehic1e rnechanics." u. S. Army Land Locomotion Lab. A.'r.A. C. No. 8479, Warren, Mich.
Reece, A.R. (1965). Itprincip1es of soi1-vehic1e mechanics." Proc. Vol. 180, Part 2A, The Institution of Mech. Engrs., London.

72
Richards, S.J. (1941). liA soil penetrometer. 1I Soil Science Soc. of Am~ Proceeding, Vol. 6, 104-107.
Rush, E.S. (1967). Il Trafficabilit y tests with a two-wheeldrive industrial tractor. 1I A.S.A.E. paper No. 67-607.
Rutledge, • L. and F. V. Ma cha rdy. (1968). lIr.rhe influence of the weather on field tractability in Alberta. Il C.S.A.E. Journal, No. 2, Vol. 10, pp. 70-73. 1968.
Schuring, D. (1966). "The energy loss of a wheel." Proc. 2nd Inter. Conf. of Inter. Sco. Terr-vehicle System. pp. 391-424. Quebec.
Shuman, F.L. (1965). "A similitude study of soil strength instrument. Il Ph.D. 'rhesis, Iowa State Univ.
Sitkei, G. (196l). "Sinkage and rolling resistance of wheels on loose land. 1I Proc. lst Int. Conf. of Inter. Soc. Terr-vehicle system. Turin, p. 377.
Smith, J.L. (1966). "A study of the effects of wet surface soil conditions on the performance of a single wheel." Jour. of TerrameCh. Vol. 3, No. 2.
Soltynski, A. (1963). IISlip sinkage as one of the performance factors of a m.odel pneumatictyred vehicle." Jour. of Terramech. Vol. 2, No. 3. 1963.
Stone, A.A. and williams, I.L. {1939}. "Measurement of soil hardness." Agr. Eng. 20: 25-26. 1939.
Taylor, J.H. and G.E. Vanden Berg (1966). "'rhe role of displacement in a simple traction system." A.S.A.E. paper No. 65-122. st. Joseph, Mich. or Jour. of Terramech. Vol. 3, No. 1. 1966.
T.B. Eng. 37 (1959). "Soil Trafficabilityo" Dept. of the Army Tech. Bull., Washington, D.C.
Terry, C.W. and C.S. Winkelblech. (1968). "Hydraulic soil penetrometer indicates physical conditions." New York's Food and Life Sciences, Vol. 4.
Terzaghi, K. (1927). "Determination of consistency of soils by means at penetration test." Public Roads, 7: 240-247.

73
Terzaghi, K. (1959). "'rheoretical Soil Mechanics." John Wileyand Sons, New York, N.Y.
Tu, King Woo (1968). "'rhe effect of depth and spacing of subsurface drains." M.Sc. 'rhesis, McGill University,
Dept. of Agr. Eng. Uffelman, F. L. (196l). "'rhe performance of rigid cyl"inder
wheel on clay soil." Proc. lst Conf. Mech. SoilVehicle System, Turin.
Vincent, E.T. (196l). "Pressure distribution on and flow of sand past a rigid wheel. " Proc. lst Int. VehicleTerrain System, Turin. pp. 858-877.
W.E.S. (1947). "Trafficabilityof soil, pilot tests -self propelled vehicles." Waterways Experiment Station, T.M. No. 3-240, Vicksburg, Miss.
W.E.S. (1948). "Development of testing instruments." ~eCh. Memo No. 3-240. Trafficability of soils, 3rd sm;,. 66 p.
W.E.S. (1951). "Trafficabilityof soils, slop studies. Tech. Memo 3-240, 29 p. (1951).
W.E.S. (1963a). "Field moisture content investigation." Tech. Report 3-610. 1963. W.E.S., Vicksburg, Miss.
W.E.S. (1963b). "Environmental factors affecting ground mobi1ity." Waterways Exper. Station, No. 5-625, 1963.
W.E.S. (1964a). "Measuring soil properties in vehicle mobility research." W.E.S. T.R. 3-652, Vicksburg, Miss.
W.E.S. (1964b). IIstrength-moisture density relations of fine grained soils." W.E.S. T.R. 3-639, Vicksburg, Miss.
Wiendieck, K.W. (1968). "Stress-displacement relations and terrain vehicle mechanics: a critical discussion." Jour. of Terramech. Vol. 5, No. 3. (1968).
williford, J.R. and L.W. Larson. (1968). liA study of soil strength valuesincluded in cone index readings. 1I
A.S.A.E. paper No. 68-666.

74
Wills, B.M.D. and F.M. Barrett. (1965). "An investigation into rolling resistance theories for towed rigid wheel. " Jour. of Terramech. Vol. 2, No. 1. 1966.
Yong; R.N. and B. P. Warkentin. (1966). "Introduction to soil behavior." The Macmillan Co., New York. p. 451.
·Yong, R.N. and J.D. Fitzpatrick-Nash. (1968). "Drawbar pull prediction from energy losses in wheel-clay interaction." Soil Mech. Series No. 22. Soil Mech. Lab., McGill University. August, 1968.
Zelenin, A. N. (1950). "Basic physics of the theory of soil cutting." 353 pp. Moscow (1950) (ol.iginal not available) from Gill and Vanden" Berg "Soil dynamics in tillage and traction.

APPENDICES

76
A. TERMINOLOGY
1. Bearing Capacity: The ability of soil to support a
vehicle without undue settlement of the vehicle.
2. Cone index: An index of soil consistency or strength.
It is the force per unit base area required to move a
30 degree right circular cone of 0.5 sq. in. base
area through the soil at a rate of 72 in. per min.
3. Drawbar pull: Force at the drawbar produced by the
vehicle in the direction of travel.
4. Maximum tractive effort: The maximum continuous towing
force or pull a vehicle can exert expressed as pounds.
5. Slip: Relative movement in the direction of travel at
the mutual contact surface of the traction or trans-
port device and the surface which supports it.Slip and
travel ratios are sometimes used synonymously, and are
frequently expressed in percent.
slip (%) = (1 - actual travel distance )x 100 theoretical travel distance
6. Soil shear strength: A function of cohesion between the
soil particles and intergranular friction. This re-
lationship can be represented as the culomb equation:

77
S = c + Ptan~
where S = shear strength (lb/in2 )
C = cohesion or shear strength when normal stress (P) is zero (lb/in2 )
P = intergranular stress normal to the shear surface (lb/in2 )
~ = friction angle between the soil particles (dimension-less)
7. Soil trafficability: A soil property which is the capa-
city of soil to support specifie vehicle action. It
is related to the vehicle mobility environment factor.
8. Thrust: Net traction, plus rolling resistance of trac-
tion device while pulling.
Tractive thrust~ the total force developed by a trac-
tion device in the direction of motion.
Soil thrust: Soil behaviour under the traction device
by which the soil resists the vehicle-tread thrust.
9. Tractive capacity: Ability of a soil to resist the
vehicle-tread thrust required for steering and pro-
pulsion.
10. Traction device: Any element of the vehicle (track and
wheel) that is in contact with the ground under nor-
mal motion.

78
Il. Tractive effort (force): force applied to a vehicle in
the direction of travel by a traction device and is
equal in magnitude to tractive thrust.
12. Travel ratio: Ratio of distance travelled per revolu
tion of the traction device while pulling to the dis
tance travelled perrevolution of the traction device
with zero drawbar pull on a concrete surface.
13. Vehicle mobility: A vehicle property which is the
vehicle movement ability.
14. Wheel sinkage: The depth to which the tire penetrates
the soil, measured relative to the original soil sur
face.

79 B. DATA TABLES
Table 3. The effect of moisture content on soi1 compaction at 1aboratory soi1 test for fine sandy loam
ComEaction Moisture Content Depth Volume Change Depth for
% cm % Eeak, C. I.
2.7 5.6 12.25 3.2 in
6.1 9.0 19.69 2.3
10.6 13.5 29.73 1.5
14.1 14.8 32.37 1.4
22.6 14.5 31. 71 1.3
30.8 14.6 31.93 1.0
Table 4. The effect of moisture content on soi1 compaction at 1aboratory soi1 test for clay soi1
ComEaction Moisture Content Depth Volume Change Depth for
% cm % Eeak, C. I.
6 4.75 10.39 3.6 in
16 8.75 19.14 4.1
25 11. 75 25.70 6.0
32 9.70 21. 22 increase with depth
37 8.50 18.59 Il

B. DATA TABLES
Table 5. Bu1k density - cone index re1ationship
CLAY SOIL CLAY SOIL SANDY LOAM at 3 in de12th at 6 in.de12th
c.i. B.D. M.C. c. i. B.D. M.C. c. i. B.D. M.C. 21 1.203 44.2 33 1.391 37.1 44 1.688 34.13
25 1.250 43.1 44 1.450 35.6 47 1.695 32.35
35 1. 287 41.5 46 1.420 35.7 49 1.701 30.80
48 1.360 39.6 60 1.475 36.3 65 1.730 27.76
60 1.454 37.2 143 1.480 34.2 72 1.754 24.9
68 1.495 36.4 148 1.495 35.8 82 1.710 25.1
85 1.532 35.3 166 1.537 33.0 94 1.742 25.8
77 1. 555 34.0 191 1.530 32.4 100 1.720 25.4
89 1. 597 33.8 238 1.595 30.6 118 1.749 21.6
106 1.625 32.9 261 1.646 29.1 140 1.765 22.5
106 1.650 32.5 278 1.613 30.3 162 1.775 22.2
114 1.661 30.3 310 1.618 31. 0
119 1. 732 29.8 366 1.682 29.5
Cone index is average value of six series test curve.
M.C. is soi1 moisturecontent (%) of dry weight.
B.D. is soil bulk density or wet basis. (gr of wet soi1/cc of field soi1 Volume).
c.i. is cone index (lb/ln2 ).
De12th 3
3
5
7
9
3
5
5
7
9
9

81'
Table 6. Tractor performance with cone index on the clay soi1
Depth
1 2 3 4 5 6 7 8 9 10 Slip Test No. Incb~s %
1 1.5 2.5 4 4 5 6 7 7 8 10 100
2 2.5 6 8 10 12 15 18 21 26 74 100
3 6 Il 15 18 22 25 29 46 76 108 100
4 7 13 17 21 25 29 33 49 72 95 100
5 9 16 19 23 26 30 34 55 91 126 100
6 9 17 21 27 32 38 41 53 85 115 66
7 10 18 24 28 32 36 40 55 101 152 60
8 9 18 25 31 38 46 66 91 126 160 42
9 Il 20 28 34 41 50 56 66 110 165 27
10 8 16 24 38 55 83 132 184 25
Il 12 20 30 36 44 58 81 105 132 154 23
12 13 24 32 40 49 66 90 114 138 161 21
13 14 28 39 50 62 75 87 120 156 187 17
14 20 32 46 59 72 88 104 170 210 14
15 20 40 59 78 95 113 132 189 267 4
Sink in. 9.5
7.5
7.0
6.8
6.5
6.2
5.5
5.2
4.5
4.5
4.0
3.5
2.5
1.7
0.5

i82
Table 7. Whee1 sinkage - slippage re1ationship
Whee1 Sinkage Slippage Whee1 Sinkage Slippage (inches) (%) (inches) (%)
0.5 4* 4.5 25*
1.0 7 4.5 27*
1.5 Il 5.0 37
2.0 14* 5.2 42*
2.5 13 5.5 38
3.0 13.5 5.5 60*
2.5 17* 6.0 62
3.0 17 6.2 66*
3.5 21* 6.0 80
4.0 21 6.3 100
4.0 23* 6.5 100*
4.2 25 6.8 100*
*C1ay soi1. (ste. Rosalie clay soi1) Other data are from tests on Soulanges fine sandy loam.

! 83
Table 8. Maximum drawbar pull test - ste. Rosalie clay (Cone Index Values p.s.i.)
pounds Load Zero 1000 1300 2000 2500 3000
Depth 1" 9 10 Il 10 20 18 2" 16 18 20 24 44 52 3" 19 22 25 56 67 88 4" 23 29 32 94 102 130 5" 26 34 45 128 126 164 6" 30 43 65 180 150 228 7" 34 56 80 232 176 284 8" 55 69 9A 290 206 330
Table 9. Maximum drawbar pull test - Soulanges fine sandy loam
(Cone Index Values p.s.i.)
pounds Load Zero 1000 1500 1900 2300 3000
Depth 1 5 8 Il 14 20 22 2 9 13 20 24 35 60 3 12 16 22 28 39 82 4 14 18 24 31 42 91 5 16 20 25 33 47 98 6 17 22 27 35 50 105 7 18 24 29 38 56 110 8 19 26 32 41 59 128 9 19 30 35 44 62 159

COMPUTER PRO GRAM
Fortran subroutine for polynomial Regression IBM system 360 Scientific subroutine package (360A-cM-03X) Version III Programmerls Manual was used to obtain curves of best fit given in figures in this thesis.
84