the essential role of venture apital
TRANSCRIPT

Stockholm School of Economics Master’s Thesis in Finance
Tutor: Per Strömberg Presentation: 15.15-17.00, November 6, 2008
Venue: Stockholm School of Economics Discussants: Johan Aggeryd, Fredrik Strömquist
THE ESSENTIAL ROLE OF VENTURE CAPITAL The determinants of formal and informal venture capital presence in Swedish entrepreneurial
firms at the point of IPO, and investor characteristics
Sofia Hallström♠ & Bita Yazdani♣
ABSTRACT This paper attempts to analyze the determining factors of formal and informal venture capital (VC) in entrepreneurial firms going public in Sweden between the years 1994 and 2005. Further is described each investor type’s ex-post investment characteristics; the exit behavior of informal and formal VC. In addition, we examine – and confirm – the complementary between these investors. We find VC investments in IPO-firms to be functions of firm size, firm age, and we find evidence of sector biases. Firms with no VC compared to firms with VC take longer time to be introduced on the equity markets and are remarkably smaller in terms of equity size. VCs board representation is found to increase with firm size and with diminishing asset tangibility, and informal VCs result more represented on the board than formal. We also find indications of small firms more frequently having lock-ups of venture capital, as VCs exits are unusually low in these at the IPO. Venture capital is concluded to be vital for entrepreneurial firms to get relatively well-funded and fast at entering stock markets. ♠ [email protected] ♣ [email protected] KEY WORDS Business angels; Venture Capital; Early-stage investments; Investment preferences
Acknowledgements: Our thanks go first of all to our inspiring tutor Per Strömberg, who has been of invaluable guidance throughout the work with the thesis. Kind help has come from Carl-Henrik Wigren at the Swedish Financial Supervisory Authority and from Maria Nilsson at the Swedish Venture Capital Association. We would also like to thank Per-Olov Edlund who supported our questions on econometric analysis. Last, but not least, a great thank you to FFF who have supported us along the way.

S. Hallström & B. Yazdani, 2008 THE ESSENTIAL ROLE OF VENTURE CAPITAL
2
TABLE OF CONTENTS THE ESSENTIAL ROLE OF VENTURE CAPITAL................................................................................... 1 TABLE OF CONTENTS................................................................................................................................ 2 1 INTRODUCTION AND DEFINITIONS.............................................................................................. 3 2 BACKGROUND AND THEORETICAL FRAMEWORK .................................................................. 6
2.1 ENTREPRENEURS AND VENTURE CAPITALISTS ........................................................................................... 6 2.2 THE IMPORTANCE OF THE IPO FOR THE VENTURE CAPITAL MARKET .......................................................... 8 2.3 THE ENTREPRENEUR AS AGENT ................................................................................................................ 9
3 HYPOTHESIS..................................................................................................................................... 11 3.1 MODELING THE DETERMINANTS OF VENTURE CAPITAL............................................................................ 11
3.1.1 VC presence as ownership of equity – The dependent variable ...................................................... 11 3.1.2 Firm size....................................................................................................................................... 12 3.1.3 Firm age....................................................................................................................................... 13 3.1.4 Industry biases.............................................................................................................................. 13 3.1.5 The market.................................................................................................................................... 14 3.1.6 Complementarity – Formal and informal VC as dummy variable ................................................... 15
3.2 POST-INVESTMENT BEHAVIOR: BOARD REPRESENTATION........................................................................ 15 3.3 POST-INVESTMENT BEHAVIOR: EXIT ...................................................................................................... 16
4 METHODOLOGY AND DATA SET ................................................................................................ 19 4.1 DATA COLLECTION AND SAMPLING ........................................................................................................ 19
4.1.1 Long-list of IPO firms ................................................................................................................... 19 4.1.2 Short-list of IPO firms................................................................................................................... 19 4.1.3 Definition of investors ................................................................................................................... 20
3.2 REGRESSION ANALYSIS.......................................................................................................................... 21 3.2.1 Probit regression: Firms with at least one formal or informal VC present ...................................... 21 3.2.2 OLS versus Tobit regression.......................................................................................................... 21
5 DESCRIPTIVE RESULTS & VC BEHAVIOR ................................................................................. 22 5.1 GENERAL DESCRIPTIVE RESULTS: WHERE IS THE VENTURE CAPITAL? ...................................................... 22 5.2 MODELING VC BEHAVIOR – REGRESSION RESULTS................................................................................. 23
5.2.1 Model component 1. The firm size ................................................................................................. 24 5.2.2 Model component 2. The firm’s age............................................................................................... 29 5.2.3 Model component 3. The industry.................................................................................................. 31 5.2.4 Model component 4. The market.................................................................................................... 32 5.2.5 Complementarity........................................................................................................................... 33
5.3 POST-INVESTMENT BEHAVIOR................................................................................................................ 38 5.3.1 Post-investment behavior 1. Board representation ......................................................................... 38 5.3.2 Post-investment behavior 2. Exit behavior ..................................................................................... 41
6 CONCLUSION & AREAS OF FURTHER STUDIES....................................................................... 43 6.1 SUGGESTIONS FOR FURTHER RESEARCH.................................................................................................. 44
REFERENCES ............................................................................................................................................. 45 APP. 1. APPENDIX - DEFINITIONS ................................................................................................................. 47 APP. 2. DEFINITION OF VARIABLES .............................................................................................................. 48 APP. 3. FIRMS INCLUDED IN THE SAMPLE...................................................................................................... 50 APP. 4. LONG-LIST OF FIRMS........................................................................................................................ 52

S. Hallström & B. Yazdani, 2008 THE ESSENTIAL ROLE OF VENTURE CAPITAL
3
1 INTRODUCTION AND DEFINITIONS Venture capital (VC) and its importance to entrepreneurial firms have gained increased attention of
researchers and politicians since the late 1970s. In the US and UK the recognition of the informal part
of the VC market, as mainly represented by so called business angels, has reached far the last decade,
but the studying of this important investor group is still limited and often performed based on the
investors perspective, through interviews and qualitative analysis. In this paper we intend to contribute
to the field by conducting a quantitative research on the behavior of investors.
The importance of entrepreneurial firms has recently been underlined by the European Commission
(1998), with a special emphasis on the financing of these firms. Entrepreneurs are now recognized for
their role in driving economic growth and job creation, particularly for the mature markets of the West
European countries. In the same process, policy makers and researchers focus on the crucial role that
venture capital has for the creation and expansion of these firms at an early-stage (European
Commission, 1998). In this paper, we aim to explore the factors determining the presence of venture
capital in new firms, with emphasis on the high potential firms that manage to get listed on stock
exchanges in Sweden during 1994 and 2005. An attempt is done to build a model reflecting how
investor behavior is affected by the firm’s size, age, sector, and also macroeconomic factors external
to the firm, where the latter is represented by the time period when the firm was listed. Certain
characteristics of the investors are also explored, with the purpose to extend the modest amount of
present research on the Swedish venture capital market. A unique dataset has been collected for the
purpose with information spanning over 71 prospectuses from firms doing an initial public offering
(IPO) during the chosen time period.
The listing occasion is an important exit opportunity for investors in entrepreneurial firms –
enterprises that are strong creators of economical growth and that account for a substantial part of all
net new jobs (Wetzel, 1996; Birch, Haggerny, Parsons and Rossel, 1993; Storey, 1994). For policy
issues, understanding the underlying mechanisms that drive VC presence in these firms is important.
We contribute to this with our study, encompassing 289 formal and informal venture capital
investments in 71 Swedish companies listed between 1994 and 2005, where the formal VCs are
mainly represented by venture capital funds and the informal VCs by private investors, or so called
business angels. The lack of digital archive over Swedish venture capital investments turns any
research in this field challenging. For the purpose of understanding the characteristics and behavior of
venture capitalists, we thus collected an exclusive set of data from issued prospectuses from listed
companies in Sweden, with 154 investments performed by informal venture capitalists and 135 by
formal. Each prospectus contains an immense amount of information that each firm is required to
disclose in order to go public, hence providing us an excellent opportunity to study the characteristics
of venture capital for the most innovative companies.

S. Hallström & B. Yazdani, 2008 THE ESSENTIAL ROLE OF VENTURE CAPITAL
4
The time period studied surrounds and gives focus to the IT boom at the end of the 1990s. The four
proceeding and the four succeeding years are included in order to study a whole cycle of 12 years,
where the crescendo of the IT boom has been identified as the years 1998 to 2001. The research thus
encompasses macroeconomic changes’ affects on the venture capital market as well as venture capital
cycle theories (Gompers and Lerner, 1999; Bhide, 1992). Further, the limitation of the data collection
to a static point in time, the IPO, offers both the possibility to describe the actual situation of
companies and their investors at that event, and singles out the companies that have been successful
enough to go public.
The first part of this paper explores the determinants of venture capital presence in the firms, where we
find that venture capital seem to be a crucial reason for entrepreneurial firms to prosper. The firms
with access to both formal and informal VC were at the point of IPO almost four times as big as firms
with no access to venture capital, when size is measured by common equity available to the firm. The
firms with no VC are also the firms that struggle the longest time to get listed, taking on average 36
percent longer time to get there in comparison with the whole sample, with respect to the time passing
from firm foundation to the point of IPO. The finding of VC’s decreasing effect on firm age and
increasing effect on firm size at the point of IPO, confirms previous findings on venture capital
stimulating start-ups to enter stock markets more rapidly and less underpriced by providing them with
expert advice as well as with strict incentives to perform (Barry et al., 1990; Sahlman, 1990, Lerner,
1994b, Kaplan and Stromberg, 2000).
In accordance with theories on a cyclical feature of formal venture capital, we find a somewhat
recurring pattern in graphs and descriptive analysis of the sample. However, regression analysis
cannot confirm a cyclic aspect of neither formal nor informal investors. Indications show that it
seemed more difficult to bring firms to IPO without risk capital before the IT market hit the ceiling in
the end of the 1990s.
We also find proof of sector bias as a determinant of VC presence: IT and healthcare are found to be
the sectors that VC particularly focuses on.
Finally, it was found that informal and formal VC tends to be complementary, with high rates of
coexistence in the same firms. Informal investments are on average 13 percent of the share capital in
the sample, while formal investments display an expectedly higher percentage with 22 percent.
The second, more descriptive, part of the paper evolves around post-investment behavior. Building on
Sahlman (1990), and Kaplan and Stromberg (2002), we model the relationship between the
entrepreneur and the VC as a double-sided incentive problem: A greater fraction of the firm owned by
the VC improves the VCs’ incentives, but weakens the entrepreneur’s, in line with Jensen &
Meckling’s (1976) agency theory. Efficiency requires balancing the incentives, or rather, the
ownership shares. Looking at board representation from an agency-principal perspective, we find

S. Hallström & B. Yazdani, 2008 THE ESSENTIAL ROLE OF VENTURE CAPITAL
5
proof for an increase of VC representation on the board with mounting firm size and diminishing asset
tangibility (as represented by sector). Surprisingly, informal VC result more represented on the board
than formal investors, contradicting previous research and agency theory.
Attention is also given to the exit of each investment, an optional but crucial point for investors to
realize a payoff. In small companies, the venture capitalists show surprisingly small will to exit at the
point of IPO. This could implicate that small firms show greater information asymmetries and that,
according to prior research by Brav and Gompers (1997), so called lock-ups1 are more extensively
used in order to signal commitment. However, only a first analysis of this subject is performed since
these lock-ups limit the reach of the data.
This paper is unique since it is based on empirical data from firms rather than being based on
qualitative interviews with the investors. Thus, we avoid, or at least alter, biases in results from earlier,
similar studies of investor preferences, obtaining a higher degree of calculability. Bhide (1992) used a
similar approach on the US venture capital market, looking at American Inc 500-companies from the
1989 years’ list. However, he based his study on interviews rather than on publicly available
information. A paper by Bottazzi and Da Rin (2002) on the European financing of innovative
companies comes close to our own study, with focus on determinants of venture financing as one of
the main considerations. However, their research is restricted to the Euro.nm exchange, a pan-
European network of regulated markets dedicated to growth companies, and includes the years
between 2000 and 2002, thus not comprising a study of cyclicality in the same manner as this paper.
By primarily geographic limitations, our paper differ from these two, focusing on Sweden and thus
drawing on the advantages from a homogenous market perspective, obtaining a relatively reliable
control sample.
Implications from our study suggest that venture capital is indeed important for innovative firms to
fully reach their capacity in terms of growth. Firms of today seem to more smoothly manage to go
public without VC involvement, compared to the time before the 1990s IT boom, but entrepreneurs
wishing to list on a stock exchange should still embrace VC if the goal is to move as quickly as
possible towards a listing. For policy makers, these results illuminate the need to facilitate for risk
capital in order to achieve economical growth. Throughout the 1990s, the situation for Swedish VC
investors was facilitated through several reforms, resulting in a larger amount of both listings of start-
ups and a larger VC market, underlining the theory of a complementary relationship between stock
markets and VC (Black and Gilson, 1998). In our study, entrepreneurial firms doing IPO have both
grown since the mid-nineties and the average time passed between foundation and IPO has decreased,
demonstrating that their ability to provide society with economic growth and jobs has improved.
1 What is referred to as a lock-up comes from the rules of stock markets limiting sales at the IPO, but it also includes the IPO-firms own statement of locking up the capital of certain investors for some time, usually 3-12 months after the IPO. The data collected for this paper does not include the time period after the actual IPO occasion and is thus insufficient for a full analysis of the IPO as an exit option.

S. Hallström & B. Yazdani, 2008 THE ESSENTIAL ROLE OF VENTURE CAPITAL
6
2 BACKGROUND AND THEORETICAL FRAMEWORK
2.1 Entrepreneurs and venture capitalists The focus of this paper is on firms which could be regarded as entrepreneurial, or “high potential” (see
fig. 2.1), (Sohl, 1999) and also important for economic growth and job creation (Werzel, 1996; Birch,
Haggerny, Parsons and Rossel, 1993; Storey, 1994).
The terms enterprise, entrepreneurial firm and start-up are used interchangeably for the same
phenomenon. The small fraction of truly innovative start-ups are captured by defining entrepreneurs as
mainly being people in the pre-start, start-up and early phases of business ownership (Lundström and
Stevenson, 2001), coinciding in large with the term “high-potential firms”. This definition of the
entrepreneurial start-up was interpreted and used in order to create our data sample (see section 4.1).
Fig. 2.1. A categorization of start-up firms
> 90% < 10% < 1 %
≥50% ≥$50M
20-50% $10-50M
<20% <$10M
Bootstrapping Bootstrapping & Business Angels
Business Angels & Venture Capitalists
Annual growth rate
5 year revenue
projections
Funding source
Lifestyle firms
Middle-market firm
High-potential firm
Source: Van Osnabrugge and Robinson (2000)
Entrepreneurial firms often tackle a so called “equity capital gap” during their first years after
foundation. This gap is representing a scarcity of financing throughout the seed and start-up stages. It
is particularly pronounced for the more innovative, high-risk firms and has been argued to best be
filled by informal investors (Mason & Harrison, 1992). This asserts the difference between
institutionalized capital, streaming from banks and venture capital funds and informal venture capital
in terms of mainly business angels (see fig. 2.2.).
S. Hallström & B. Yazdani, 2008 THE ESSENTIAL ROLE OF VENTURE CAPITAL
7
Since heterogeneous investors not only choose firms to invest in based on different foundations, but
they also add different values to a firm, we have divided our investigated group of venture capitalists
into two – formal venture capitalist and informal venture capitalists.
Venture capital can be defined as private capital invested in non-listed firms, mainly without
collateral. Typically the investment horizon is limited to a few years and characterized by active
investment management (Ehrlich, et al. 1994; Lerner 1995; Sapienza, et al. 1996). The informal
venture capitalists differ from the formal by whose money they invest, namely their own, in contrast to
the formal venture capitalists who invest the money which in turn belong to their investors. This leads
to contrasting incentives for the investors and has a range of implications for the differences in
investor behavior, as developed in this section. See fig. 2.2 for a categorization of venture capital
categories.
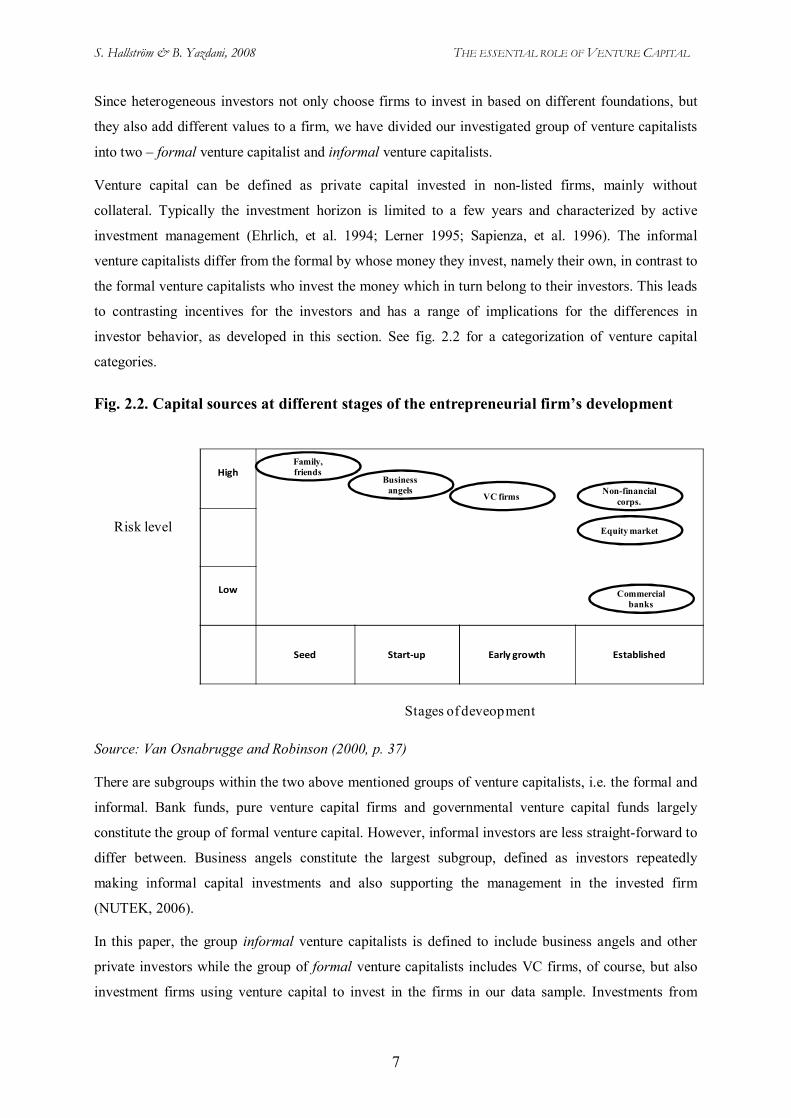
Fig. 2.2. Capital sources at different stages of the entrepreneurial firm’s development
High
Low
Seed Start-up Early growth Established
Risk level
Family, friends
Business angels
VC firms Non-financial corps.
Equity market
Commercial banks
Stages of deveopment
Source: Van Osnabrugge and Robinson (2000, p. 37)
There are subgroups within the two above mentioned groups of venture capitalists, i.e. the formal and
informal. Bank funds, pure venture capital firms and governmental venture capital funds largely
constitute the group of formal venture capital. However, informal investors are less straight-forward to
differ between. Business angels constitute the largest subgroup, defined as investors repeatedly
making informal capital investments and also supporting the management in the invested firm
(NUTEK, 2006).
In this paper, the group informal venture capitalists is defined to include business angels and other
private investors while the group of formal venture capitalists includes VC firms, of course, but also
investment firms using venture capital to invest in the firms in our data sample. Investments from

S. Hallström & B. Yazdani, 2008 THE ESSENTIAL ROLE OF VENTURE CAPITAL
8
family and friends have been excluded as far as possible from the group (see section 4 on
methodology).
Business angels increasingly syndicate investments in networks. The firms they form in order to invest
look more like formal venture capital firms from the outside. Theoretically, however, regarding the
incentive problems described below concerning the agency-principal relation, they tend to follow the
same logic as informal VCs since investments are done with their private resources. We have therefore
chosen, as far as possible, to divide business angel network firms into individuals and treat them as
informal VC, which can be seen as a necessary simplification.
2.2 The importance of the IPO for the venture capital market Data collected from prospectuses issued at IPO permits for a quantitative analysis which qualitative,
interview approaches may not. The limitation of our study to the static point of the IPO also becomes a
tool to select economically important ventures, since an IPO is available to a portfolio company only
when it is successful (Black and Gilson, 1998). For VC fund investors, the frequency with which
portfolio companies go public is central, in order to measure the VC fund’s successfulness (Gompers,
1996).
The phenomenon of IPO is not only important for the data collector, but also a significant factor for
determining the maturity of the venture capital market. Black and Gilson (1998) found in their cross-
country comparison of venture capital markets that venture capital flourishes when there are strong
IPO possibilities in a country. The complementary role of stock exchanges and the venture capital
market has also been confirmed by Michelacci and Suarez (2000). From this springs a notion of
venture capitalists as selectors and supporters of promising start-ups, contributing to a rapid entrance
in stock markets at the optimal moment (Lerner, 1994). However, the relation goes two-ways so that
equity markets and their liquidity are also important for venture capitalists. The preference for IPO as
an investment exit is underlined by table 2.1 on venture capitalists’ favored exit routes in the US – a
country with a traditionally strong VC market.
Table 2.1 Distribution of venture capital exit routes and realized gains (US)
Exit Route Percentage of firms Average gain (times investment)
IPO 30% 2.95
Acquisition 23% 1.40
Company buyback 6% 1.37
Secondary sale 9% 1.41
Liquidation 6% -0.34
Write-off 26% -0.37
Source: Bygrave and Timmons (1992), based on Soja and Reyes (1990)
S. Hallström & B. Yazdani, 2008 THE ESSENTIAL ROLE OF VENTURE CAPITAL
9
The complementary relation between venture capital markets and IPO possibilities is also one of our
rationales for studying a time period that includes the larger parts of the Swedish 1990s. When a
country sees an enhancement of its equity markets in terms of numbers of stock exchanges or
liquidity, this also affects the VC market in the country, which was the case of Sweden, as presented
below. This also coincides with financial theories of a cyclical feature of the venture capital market
(developed in section 2.3.3). The result is that the time period, or more precisely: the market can have
a large impact on the financing forms available for start-ups.
In Sweden, by late 1990s, and with the rise of the IT era, the venture capital market had recovered
from a low point at the beginning of the decennium. In 1999 alone, the Swedish Venture Capital
Association increased its membership number with 40 percent. In 2007, Swedish venture capital firms
also invested 33 percent more than in 2001 (Landström and Månsson, 2006). This rise had come with
a deregulated investors market regarding state-controlled pension funds and insurance companies,
reduced tax rates and new, less regulated secondary markets that were born in Sweden during the
1990s. O-listan and Nya Marknaden were slightly more controlled than other, smaller ones, and hence
enjoyed a good liquidity, largely thanks to being managed by the Stockholm Stock Exchange
(Månsson and Landström, 2006). These markets are also the focus for our study.
2.3 The entrepreneur as agent In this thesis we mainly depart from Jensen and Meckling’s (1976) framework of the principal-agent
problem. Thus we can arrive at modeling the VC behavior before, during and after investing in
entrepreneurial firms.
Conflicting incentives, or moral hazard, between investor (principal) and entrepreneur (agent), can
lead to opportunistic behavior and the pursuing of the entrepreneurs’ private interests, destroying value
for the owners (Admati and Pfleiderer 1994; Bergemann and Hege 1998; Gompers 1995; Jensen and
Meckling 1976). This result in agency costs, are only completely eliminated when the owner and the
entrepreneur is the same person which (Bruton, Fried & Hisrich, 2000). Thus the agency costs will
decrease the more the entrepreneur invests of his own money, when less is left for outside investors to
invest. However, as a consequence from the risks with moral hazard, VCs will also under-invest in
new ventures. Additionally, the entrepreneur may have limited ability to manage the start-up, giving
rise to further agency problem that need the venture capitalists involvement (Sapienza and Gupta
1994).
There is a large structural difference between formal and informal venture capitalists; namely their
investor bases. The formal VCs face an additional level of the agency relationship since they do not

S. Hallström & B. Yazdani, 2008 THE ESSENTIAL ROLE OF VENTURE CAPITAL
10
invest their own private capital but collect funds, illustrated in fig. 2.4. Informal VCs invest their own
money, hence eliminating the moral hazard phenomenon.
On the doubled agency-principal level, between fund providers and the formal VC, the agency risks
are dealt with through aligning incentives with the help of payment structure. This is made in
accordance with option theory, making sure that personal returns of the venture capitalists’ are
maximized at the same time as the limited partners returns. The general partners of the fund, the
venture capitalists, will thus contribute with only some 2 percent of the capital but receive profits of
20-25 percent (Sahlman, 1990). The lifespan of the fund will also be limited so that the general partner
cannot hold on to the money forever. Limited partners can withdraw from the fund after their initial
contribution, and the venture capitalists are prohibited from self-dealing, i.e. investing on preferential
terms with regards to the limited partners (Jeng and Wells, 1998).
In the following sections the agency-principal framework will be used as a foundation to model and
draw hypothesis on the differing behavior of formal and informal VCs.
Fig. 2.4. Comparison of business angel and venture capitalist agency relationships
Source: Van Osnabrugge and Robinson (2000)
Entrepreneur
Fund provider(s)
Informal VC Venture Capital firm
Entrepreneur
Information Money Money Information
Information Money
(Principal) (Principal)
(Principal)
(Agent) (Agent)
(Agent)

S. Hallström & B. Yazdani, 2008 THE ESSENTIAL ROLE OF VENTURE CAPITAL
11
3 HYPOTHESIS
3.1 Modeling the determinants of venture capital As previously stated, this thesis has a two-fold purpose. One is to describe the characteristics and
drivers of VC investments, including a relationship between formal and informal VC investments,
while the other purpose is to explain the differences in post-investment behavior. Thus this section
describes the models we construct to explain the drivers of formal and informal VC investments in the
IPO-firm, while the sections following will focus on post-investment activities – namely the
monitoring of portfolio firms through board representation, and the exit behavior of investors.
The first model attempts to explain the presence of informal venture capital in entrepreneurial firms at
the point of IPO, and is put against a model explaining the occurrence of formal venture capital. As
explanatory variables we have chosen firm size (as measured by common equity), age (the time passed
between firm registration and listing on a stock exchange), industry and market, where the latter two
are included as dummy variables. Part of the regression analysis is also made with a dummy for
informal versus formal VC presence, in order to measure the possible effect of one investor type on
the other’s investment behavior.
Model 1:
15
14
I3
t2
t1
dummyVCFormal βdummyMarketβ
dummyIndustryβIPOtotimeβ
sizefirmβpresenceVC Informal
+
+
+
−−++=
∑∑
Model 2:
t5
t4
13
t2
t1
dummyVCnformalIβdummyMarketβ
dummyIndustryβIPOtotimeβ
sizefirmβpresenceVC Formal
+
+
+
−−++=
∑∑
3.1.1 VC presence as ownership of equity – The dependent variable
For the regression analysis, we use several different dependent variables to look at differences in
investor behavior. First we look at whether formal or informal VCs are present as owners in the firm,
and we also add them together into a combined variable. We also do regressions on the percentage of
equity owned by each investor to see what drives larger investments. The conclusions we draw focus

S. Hallström & B. Yazdani, 2008 THE ESSENTIAL ROLE OF VENTURE CAPITAL
12
partly on what drives VCs to invest in a firm, but we also largely use the study of the variables in order
to theorize on what implications VC investments may have for the entrepreneurial firm. This two-way
reasoning is motivated by our assumption that there is a two-way causality between VC investments
and firm development regarding at least firm size - i.e. growth, and firm age – i.e. velocity at which
the firm goes public. Below are introduced and motivated our choices of explanatory variables for the
models.
3.1.2 Firm size
As one of the explanatory variables, firm size represents the total common equity. The double
principal-agency problem that formal VC-firms face result in investment activities that differ from
those of informal VCs’, which we hypothesize will lead to a positive correlation between the portfolio
firms’ size and the formal VCs ownership share of it. Since formal VC-firms are normally backed by
several individual investors, they have larger funds to invest than informal VCs usually have. There is
also a second reason why formal VCs invest larger sums in their portfolio companies, namely that they
perform a costlier screening, due diligence and contract writing for each firm they invest in than
informal VCs do. The informal VC does not have the same urge to demonstrate credibility with capital
providers, and will often place more focus on informal ways to minimize the agency risks of their
investments, for example by taking on investments that other informal VCs recommend or by actively
monitoring the portfolio company post-investment. Because of the costlier pre-investment activities
that formal VCs perform, they will have a reinforced need to invest in fewer, but larger, projects that
have a chance to pay back what the pre-investment activities have cost the formal VC. Prior research
has also confirmed that venture capital funds typically hold a significant proportion of the shares of
portfolio companies, indicating that there is a positive correlation between firm size and formal VC
ownership (Sahlman 1990).
However, since we look at the VCs equity share (as approximated by the price of common stock) at
the point of IPO, we cannot say exactly how large the initial investment was. The variable will be
clouded by the informal or formal VCs capacity to choose good investment objects, as well as by the
VCs ability to effectively steer start-ups towards the IPO, in terms of providing good advices and
finances that can facilitate the portfolio firms’ growth before being introduced on the stock exchange.
Several studies have shown that formal venture capital is a source of finance that can be helpful for
firms that wants to go public to reach this goal (Busenitz, et al. 1997; Higashide and Birley 2000;
Macmillan, et al. 1989; Rosenstein, et al. 1993; Sapienza 1992; Sapienza, et al. 1996). Black and
Gilson’s (1998) have demonstrated a complementary relation between venture capital and the stock
market and also found that start-ups that are backed by formal VC are less underpriced at IPO than the
those that are not. So, even if we cannot clearly state what the correlation between the initial

S. Hallström & B. Yazdani, 2008 THE ESSENTIAL ROLE OF VENTURE CAPITAL
13
investment and the firm size is, we can still hypothesize that there will be a positive correlation
between firm size and formal VC ownership at the point of IPO.
Regarding the informal VCs, we expect them to focus their investments in smaller firms than formal
VCs do. This comes from an assumption we do that entrepreneurial firms will grow more the more
money they are provided by their investors, and since informal VCs face harsher capital constraints
their portfolio firms will also grow less.
H1. Formal VCs invest in larger firms than informal VCs do.
3.1.3 Firm age
We use the variable time-to-IPO (expressed in years passed between start-up and IPO-occasion), to
illustrate the firm age’s influence on the dependent variable. According to the same reasoning as above
regarding firm size as an independent variable, we expect that the complementary relationship
between venture capital and stock markets will mean that the entrepreneurial firm will move to IPO
faster if there is venture capital present in the firm. With this reasoning, the time passed between start-
up and IPO should be the longest for firms lacking VC completely, since these firms do not have the
guidance of VCs.
In this thesis we do not try to verify the exact stage when investments have been done or obtain exact
information on the investment horizons of the different investors, since we look at the static point of
IPO of the entrepreneurial firm and not the investment occasion. However, we do expect to see more
informal VC present in the oldest IPO-firms, relative to formal VC, since informal VCs in previous
research have shown a more varying investment horizons than formal VCs. Prior studies have shown
that successful investments are exited by informal VCs within 5 years, while unsuccessful can be held
for 10 years while trying to turn things around and in general the investment horizon is more often left
to depend on the performance of the portfolio company than in the case of formal VC investments
(Freear, Sohl, & Wetzel, 1990 Formal VCs instead show a medium investment horizon of 4 years
(Bygrave and Timons, 1992), having very limited investment horizons (Jeng and Wells, 1998), as they
are pressured from short-term fund investors to realize returns.
H2. Firms with VC are younger at the point of IPO than firms with no VC.
3.1.4 Industry biases
We theorize that formal and informal VCs display diversity in their sector biases, which we base on
the structural difference between the two investor groups. The industry bias exhibited by formal VCs
is assumed to have a basis in their preference for due diligence in order to deal with the contractual
problem in its relation with the entrepreneur. The formal VC will run a strict checks and balance
system in order to signal his specialization, since he is paid by his capital providers for his

S. Hallström & B. Yazdani, 2008 THE ESSENTIAL ROLE OF VENTURE CAPITAL
14
specialization in selecting new ventures for investment and supporting them. Bhide (1992) explains
that organizations with a routine of strict checks and balances, can only tolerate a low level of risk if
this risk is immeasurable and unquantifiable, i.e. Knightian uncertainty (Knight, 1921). Therefore the
VC fund will undertake projects that have a relatively low irreducible uncertainty yet large likely
profits – which in turn are assumed to require large investments (Bhide, 1992). The final result is that
formal VCs invest more in sectors where significant investments have to be done at the initial start-up
phase in order to realize returns (Bhide, 2003), such as medical technology, biotechnology and
pharmaceuticals, but also in other high-technology industries (Hustedde & Pulver, 1992) where their
investment strategies can provide significant strategic advantages and lead to rapid firm growth. In the
US in 1994, for example, no less than 68% of investments went to technology-based companies
(Venture Economics, 1995).
H3. Formal VCs invest more than informal VC in technology-based companies (as represented by
Healtchcare and ITC).
3.1.5 The market
Jeng and Wells (2002) considered factors external to the firm in their study of venture capital
investments, which is the foundation for our use of the variable ‘The market’, i.e. an approximation for
factors external to the firm that may influence the dependent variable. In particular, Jeng and Wells
looked at the importance of IPOs, GDP and market capitalization growth, labor market rigidities,
accounting standards, private pension funds, and government programs, where IPOs were found to be
the strongest driver of venture capital investing. Previous studies on the Swedish VC market show that
formal VCs are making fewer investments and in an earlier phase of the firm since the Dot.com-
collapse. Not only investment size and phase has shifted, but the industry focus as well – from IT
focus towards biotechnology and pharmaceuticals (Landström and Månsson, 2006).
The Market variable’s influence on the dependent variable is approximated by the time period when
the investment is done, and it is used both in lagged and non-lagged form in regressions. To construct
the variable, we have divided the period studied, 1994 to 2005, into three parts. The time period 1994-
1997 represents the pre IT era, 1998-2001 represents the IT boom years and finally 2002-2005
represents the market conditions after the IT boom.
Gompers and Lerner (1999) and Inderst and Müller (2003) have brought forward theories on
cyclicality of the VC market, where factors external to the entrepreneurial firm determine formal VCs
investments. Inderst and Müller (2003) modeled this as an equilibrium model in which capital market
characteristics affect the relative supply and demand for capital. When the supply and demand curves
move, changes also occur in the level of new entries in the VC market and the level of capital market
competition, which comes with rises and falls in valuations and venture capitalists’ ownership shares –

S. Hallström & B. Yazdani, 2008 THE ESSENTIAL ROLE OF VENTURE CAPITAL
15
as seen clearly during the IT boom and bust. Gompers and Lerner (1999) could even see that changes
in the supply and demand conditions of the VC market could give 7 to 21 percent overvaluations of
stakes in portfolio companies when formal VC funds were doubled (Gompers and Lerner, 1999).
Hence, the pattern we believe to find regarding this approximation of the influence of factors external
to the firm, is a positive correlation between economic upswings and the presence of formal VC
investments. During rougher periods, we instead expect that informal VCs would step in and more or
less close the financing gap that arises when formal VCs do not invest. In particular, the informal
investors’ money should be worth more in cooler cycles when they can buy comparably bigger stakes
in the invested firms, while they are pressured out of the market during boom periods.
H4. Formal VCs have larger stakes in IPO firms during the IT-boom.
3.1.6 Complementarity – Formal and informal VC as dummy variable
Investments from informal VCs in the start-up phase of a firm tend to have a leveraging effect on the
investee firm, since the firm will become more attractive to other sources of potential finance – in
particular with regards to venture capital funds (Mason and Harrison, 1996b; Mason, Harrison, and
Allen, 1995). Since informal VCs have been shown to often be well-suited to prepare portfolio
companies for subsequent formal VC investment (Månsson and Landström, 2005), we search for
evidence of this complementarity between formal and informal VC in our dependent variables. Since
we look at a static point in time, we do not check for informal VCs precedence of formal VC.
When at descriptive statistics, we look at cases when both investor types are present in entrepreneurial
firms. We also do an attempt to include a dummy variable of informal (formal) VC in order to explain
our dependent variables of formal (informal) VC, to further assess the complementary relationship. A
positive coefficient is expected for the dummy variable, together with an increase in the explanatory
value of the regression, as measured by the adjusted R-Square.
H5. There is a positive correlation between formal and informal VC presence in IPO-firms.
3.2 Post-investment behavior: Board representation Moving outside the modeling of VC investment determinants and over to the post-investment behavior
of the investors, we start out with the presence of investors on the board of directors of the
entrepreneurial firm.
The relationship between the entrepreneur and the venture capitalist gives rise to the basic level of the
agency-principal problem, as described in section 2.3 The entrepreneur as agent. Aligning the
incentives of the entrepreneur with those of the owners can be done by basing compensation on equity
or convertible securities, or by different forms of monitoring, for example through taking a seat on the
firm’s board (Gompers, 1995; Lerner, 1995). In this thesis we choose to focus on the investors' option

S. Hallström & B. Yazdani, 2008 THE ESSENTIAL ROLE OF VENTURE CAPITAL
16
to monitor the agent’s behavior through board representation and we thus examine the level of VC
representation on the board for each firm of our data sample. Prior studies confirm that venture
capitalists monitor their portfolio firms through board representation (Gorman and Sahlman 1989;
Lerner 1995; Macmillan, et al. 1989; Rosenstein, et al. 1993; Sahlman 1990; Sapienza 1992; Sapienza
and Gupta 1994; Sapienza, et al. 1996), also because of the non-financial value that can be added from
VC involvement and increase the value of the portfolio firm (Busenitz, et al. 1997; Higashide and
Birley 2000; Macmillan, et al. 1989; Rosenstein, et al. 1993; Sapienza 1992; Sapienza, et al. 1996).
Since the need to supervise portfolio firms increases with growth options, greater R&D spending, and
declining asset tangibility (Gompers, 1995; Sapienza & Gupta, 1994), we can expect to see a high
degree of monitoring in our sample of firms in their start-up phases since they largely fit in on these
conditions. Firms in high-tech industries, which are highly present in our sample, can with this
reasoning be expected to show an even more intense degree of monitoring through board
representation.
In prior studies in the US, formal VCs have been found to be involved in the board of directors in up
to 90 percent of the cases, in comparison to a lower 71% of all business angels (Rosenstein et al.,
1989; Freear et al., 1990). In 1991 NUTEK found 90 percent of Swedish venture capital firms to state
representation on the board, while business angels stayed at the lower 60 percent. Business angels
though did actively participate in some form in portfolio firms in 88.5 percent of the cases – e.g. as
managers, board members or consultants. Thus we expect that both investor types will be highly
present on the board of directors, with formal VCs more often present than informal VCs.
We further hypothesize that when the firm grows in importance for the investor, i.e. when the firm
shows economical growth, the VC will be triggered to take active part in the firm and monitor it more
vigorously through taking a seat on the board. Thus we expect to see a positive correlation between
firm size and formal and informal VCs’ board representation.
We also expect that the board representation increases in the period after the IT boom – a reasonable
response to lost revenues and confidence in an IT market that has gone bust.
H6. Formal VC’s representation on the board of directors of portfolio companies differs from informal
investors, where formal VC are expected to more often possess a seat on the board.
3.3 Post-investment behavior: Exit Exiting investments is an important mean for both formal and informal VCs to take out the financial
and non-financial contributions they have invested in earlier portfolio companies and reinvest it into
new, early-stage ventures. We expect to see differences in investor behavior regarding the use of the
IPO-occasion as an option to exit portfolio companies. For formal VCs, the IPO as an exit option is
supposedly more used than for the informal VCs, largely since formal VCs build their reputation on

S. Hallström & B. Yazdani, 2008 THE ESSENTIAL ROLE OF VENTURE CAPITAL
17
concluded investments. Their reputation is of utter importance when they deal with other VCs in
syndicating portfolio investments, when negotiating with entrepreneurs concerning new portfolio
investments, and when handling existing and future capital providers, (Sahlman, 1990; Lerner,
1994b),. Specifically, it is important for capital providers to receive information on concluded VC
investments in order to deal with contracting problems stemming from the agency-principal relation
with formal VCs. Since the capital provider hires an intermediary to do venture capital investments, it
can be concluded that he does not possess the skills to assess neither the performance of the non-
concluded investments with regards to risk and return, nor to evaluate the possibility to withdraw from
unsuccessful portfolio companies (Black and Gilson, 1998; Gompers, 1996). So, even though a limited
partnership agreement between a VC fund and its investors typically is set to a maximum term of 7 to
10 years (Sahlman, 1990), VC funds have strong incentives to exit from their portfolio companies
before the end of the partnership period in order to build a performance record of concluded
investments that they can present for potential capital providers (Black and Gilson, 1998). Prior
research has consequently found VC funds to reduce their share holdings in portfolio companies with
on average of 28 percent within a year after the IPO (Barry et al, 1990).
Both formal and informal VCs can use the IPO as a call option for entrepreneurs to regain control over
their own firm, i.e. the IPO can be used as an incentive to make the entrepreneur work hard to reach
the point of IPO and then be able to buy back the company from its investor (Black and Gilson, 1998).
However, formal VCs also tend to have a stronger preference for IPO as an exit opportunity than
informal VCs because of the high returns associated with IPO, and the formal VC is normally more
return-oriented than the informal investor since he have higher pre-investment costs to pay back and is
under higher pressure from short-sighted fund providers to realize returns (Bygrave and Timons, 1992;
Gompers and Lerner 1999). Adding this to the limited investment horizons that prior studies has found
that formal VCs face (Jeng and Wells, 1998), we expect the formal VC level of exit to be higher than
that of the informal VCs.
Another theory regarding the sums exited at the IPO is that informal VCs are more volatile in how
often and how much they exit at IPO. This stems from the notion that informal VCs more often than
formal VCs take on an active, managerial role in the company and spend relatively more time
managing their portfolio companies post-investment than formal VCs do, in order to minimize agency
costs without doing expensive screening or due diligence (NUTEK, 2006). Therefore we hypothesize
that informal VCs gain a higher degree of “insider information” which they in turn can utilize to guide
their exit behavior, which should result in a larger volatility in amounts sold off at the moment of IPO.
Other differences we expect to see in investor behavior considering the exit, regards the time period.
During years of high stock valuations and increased liquidity, such as the years of the IT boom, we
believe that investors stayed put with their portfolio companies in hope for excess returns after the
portfolio company’s entrance on the equity markets. The bust of the IT market in 2001 should instead

S. Hallström & B. Yazdani, 2008 THE ESSENTIAL ROLE OF VENTURE CAPITAL
18
have increased both informal and formal VCs’ concern on exiting their investments early, resulting in
high exits in the following period.
A factor influencing the decision to exit is the period of lock-up. Investors undertake to not sell their
share of the portfolio company during a certain period of time, usually 3 to 12 months, as a way to
signal their commitment to outsiders of the firm. Brav and Gompers (2001) found the lock-up period
prolonged the greater the informational asymmetries, which includes firms that are unprofitable, have
lower quality underwriters, or are not backed by venture capitalists (Lerner, 1994a). Firms with
intangible assets, representing a substantial part of our sample, also confront large information
asymmetries. This means that for a substantial amount of the firms included in our study, the exit at
the IPO could be limited, why future research papers on this topic could preferably include data on
ownership for up to one year after the IPO occasion in order to increase the accurateness by reducing
the lock-up effects. Because of the lock-ups, we expect lower degree of exits in firms with large
informational asymmetries, i.e. firms that are in high-technology industries and healthcare. The
reasoning above regarding the influence of the time period on amounts exited at IPO also makes us
expect lower amounts of exits during the IT-boom, since the new IT market arguably contained large
amounts of information asymmetries – there was no track record for this market and risks were
therefore difficult to calculate.
H7. The amount of capital exited at IPO differs according to investor, time period and industry.

S. Hallström & B. Yazdani, 2008 THE ESSENTIAL ROLE OF VENTURE CAPITAL
19
4 METHODOLOGY AND DATA SET Regression models are estimated in order to explain the level of ownership of informal and formal
investors in entrepreneurial firms at IPO. Board representation and exit behavior are descriptively
explored together with their correlation with ownership of equity.
4.1 Data collection and sampling The main part of data corresponding to the defined variables was extracted from firm prospectuses.
There exists no digital storage for market introduction prospectus information in Sweden up until
today. However, scanned prospectuses from 1996 and onward are stored by the Swedish Financial
Supervisory Authority. The data collection consequently covered these added with hard-copied
prospectuses from 1994 to 1996.
Prospectuses published as of the point of IPO comprise the first detailed information made publicly
available of ownership levels. Hence, it is an information source providing us with an excellent
opportunity to study the presence of VC in start-up companies.
4.1.1 Long-list of IPO firms
The time period chosen for the study stretches from January 1994 to December 2005. Consequently,
the cycle around the IT boom, which here is defined as the years 1998-2001, and the high private
equity activity during these years, can be depicted.
Identifying and defining high-potential start-ups was made by recognizing them as start-ups as a first
step, since these firms all reached the point of IPO. Nya Marknaden (or O-listan) and First North were
the markets decided as the most important to identify the high-potential firms, since they show better
liquidity and thus better exit possibilities, as confirmed by the Swedish Financial Supervisory
Authority.
The data collection up until this step resulted in a list of 188 potential entrepreneurial firms (see
appendix 4).
4.1.2 Short-list of IPO firms
The following criteria were used in order to exclude firms that were not in line with the definition of
the entrepreneurial firm resulting in a short list of 71 IPO firms.
Age of the company. Firms where more than 30 years had passed between foundation and IPO were
excluded. Older firms were approximated as no longer under the capital and managerial constraints
characterizing entrepreneurial firms.

S. Hallström & B. Yazdani, 2008 THE ESSENTIAL ROLE OF VENTURE CAPITAL
20
Spin-offs from existing companies. These do not reasonably face the same capital constraints as
entrepreneurial start-ups according to the definition.
Holding companies, companies buying up mining prospectuses, and venture funds. Different forms of
asset management and facing a different type of capital collection.
Foreign companies. They do not enter into the geographical limitation of the thesis. En plus, they
normally have their initial listing in their home country.
Incomplete prospectus. A number of prospectuses were either badly scanned, or impossible to recover
from the archives of the Swedish Financial Supervisory Authority.
4.1.3 Definition of investors
Formal and informal venture capitalists have been singled out from other investors in the IPO firms in
order to assess the dependent variables of formal and informal venture capital ownership of the
common equity. Several factors and their possible coincidence have been used for the assessment.
The entrepreneur’s investments were specified. Next, excluding capital belonging to family provided a
challenge where surnames were almost the only clue for distinguishing them from informal VCs.
Cases where it was clear that the firm had used equity in employee option programs or equal, where
also excluded from the sample.
A large part of observed investments made by informal VCs were registered as companies.
Information on these was found mainly in the prospectuses, from the databases Capital IQ, Affärsdata,
and on the company homepages. A handful of cases also required general Internet and yellow pages
research. Many investments done by firms are also judged to represent either single informal investors
(particularly if the firm invest its founder’s assets, but in a couple of cases they were very small,
foreign registered firms with no public information available) or as syndicates of informal VCs. The
latter were at times demanding to distinguish clearly from formal VC.
The final classification of the different investors was discussed with a source at the Swedish Financial
Supervisory Authority to reconsider classifications and assumptions. Realistic categories could
thereafter be formed for classifying each investor’s ownership and test in regressions with the
dependent variables, as presented in the next chapter.
We have chosen to measure only common stock ownership in the firm. Venture capitalists have been
shown to often receive convertible debt or convertible preferred stocks carrying the same voting rights
as if already converted into common stock (Benton and Gunderson, 1993; Kaplan and Stromberg,
2000; Gilson and Schizer, 2002), explained by Gompers (1997) as a response to adverse selection
problems in early-stage financing. This both means that some VC investments might have been
excluded from our sample and that some board members have incorrectly been counted as non-VC.

S. Hallström & B. Yazdani, 2008 THE ESSENTIAL ROLE OF VENTURE CAPITAL
21
3.2 Regression analysis
3.2.1 Probit regression: Firms with at least one formal or informal VC present
In this model, Y is a binary outcome variable (i.e. zero for no VC investor, one for at least one formal
or informal VC presence), with vector of regressors X including firm size and age, four sector
dummies and three market dummies. Probit regressions are performed since they capture the binomial
distribution of Y. The error terms will then follow a normal distribution and the test variables are
estimated through maximum likelihood (Finney, 1947)
3.2.2 OLS versus Tobit regression
Here Y is instead a continuous outcome variable. The regression analysis is performed with both
ordinary multiple regression and Tobit regression. Tobit is judged to be a more suitable regression
model since the dependent variables formal and informal VC are left-censored and can take only
values between 0 and 1, i.e. 0 – 100 percent ownership of the equity in a firm, i.e. a dataset for which
the Tobit model is designed. The OLS regression is performed nonetheless, for comparative purposes,
even though our data violates the OLS assumptions when the outcome variable is restricted to an
interval (Amemiya, 1973).

S. Hallström & B. Yazdani, 2008 THE ESSENTIAL ROLE OF VENTURE CAPITAL
22
5 DESCRIPTIVE RESULTS & VC BEHAVIOR
5.1 General descriptive results: Where is the venture capital? As stated, one important purpose of this thesis is to expand the understanding of the circumstances
under which VCs invest and how they act ex-post investment, in order to improve financing options
for entrepreneurial firms. This section consequently examines the characteristics of the firms that
formal and informal venture capitalists invest in – with respect to both their presence and their stakes
in the firms. After this section on general characteristics of investors, follows the descriptive and
regression results from our modeling of the determinants of formal and informal VC investments.
Noteworthy is that we have investigated investment cases, meaning that e.g. the 135 formal VCs in
our study are not represented by 135 physically different formal VCs, but by 135 cases of investments
by formal VCs2.
Table 5.1 Venture capital frequency* in Swedish IPO firms 1994 – 20053
* Absolute number of firms
To begin with, it is useful to have a notion of how common VC financing is in Swedish,
entrepreneurial firms during the period studied. Formal and informal venture capitalists occur in the
same firms in 36 out of 71 cases, i.e. 51 percent (table 5.1), implicating a complementary connection
between the investors, as put forward by Black and Gilson (1998) – more on this in section 5.2.5
Complementarity. Separately, they result almost equally frequent in Swedish start-ups at the point of
IPO, while only ten of all IPO firms have no venture capital at all, representing 14 percent of the firms
studied.
On average the formal and informal VCs together represents a large part of the firms’ ownership, with
an average total stake of 35 percent of common equity (table 5.2), a number that is hardly affected by
outliers since the median is 31 percent. In table 5.2 we can also see that there are 1.9 formal VC
investors per IPO-firm, owning 21.6 percent of firm shares, while informal VCs show up in 2.2
investors per IPO-firm and with only 13 percent of shares (table 5.2). This reflects the double
2 However, plural investments in a firm that are done by the same formal VC but under somewhat differing legal names, due to administrative and legal advantages, have been counted singolarly. 3 Data sample
Formal VC
Informal VC No Yes Total
No 10 13 23
Yes 12 36 48
Total 22 49 71

S. Hallström & B. Yazdani, 2008 THE ESSENTIAL ROLE OF VENTURE CAPITAL
23
incentive problem formal VCs face, as discussed in section 3.1.2 Firm size, driving them to invest
larger sums in fewer companies than informal VCs.
When looking at the absolute amount of money (in MSEK) that the VC ownership represents, the
image of formal VC investing larger sums of money is enhanced. Formal VCs have on average
investments of 284 MSEK at the IPO, which is roughly three times that of informal VCs.
Median investments of formal and informal VCs are much lower than the average investments,
amounting to a combined 102 MSEK per firm, meaning that there are several firms that are extremely
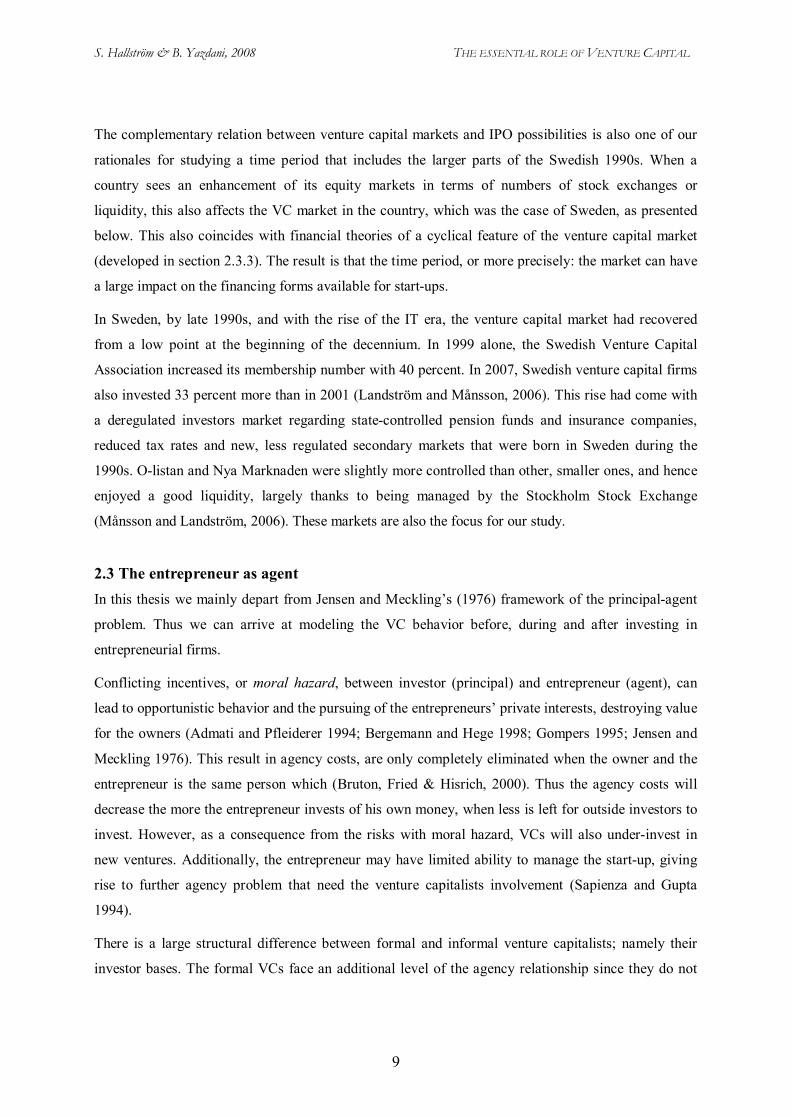
highly valuated in comparison to the large part of all firms. This appears in figure 5.3b to be
particularly the case with firms introduced on the stock exchange during the IT boom when over-
pricings were common (in line with the reasoning in section 3.1.5 The market on the cyclicality of
the VC market leading to formal VCs over-valuating their investments). The figure graphs the time
period against the absolute values of formal and informal VCs stakes in portfolio firms, and the pattern
of high firm values during the IT-boom can clearly be seen.
Table 5.2 Venture capital characteristics in Swedish IPO firms
Inf. VC F. VC TOTAL
Number 154 135 289
Number of investors/IPO-firm
2.17 1.90 4.07
No. investors/IPO-firm with investor present
3.21 2.76 -
Average investment size per individual investor
83.915.612 SEK
160.193.085 SEK
96.225.820 SEK
Average 106.647.423 SEK
283.597.377 SEK
390.244.800 SEK
Venture capital available to firm
Median 25.096.500 SEK
44.912.500 SEK
102.289.000 SEK
Average 13,0% 21,6 % 34.6% Ownership percentage of firm capital Median 8.1% 13.8% 31.2%
Investment size and firm size are sensitive to over-pricing of the common stock at IPO.
5.2 Modeling VC behavior – Regression results On the following pages are presented, together with descriptive results, the outcome from the
regression results (see tables 5.4 a-d). Probit regressions are used when the outcome variable has a
binary distribution, i.e. when we examine which variables explain whether there exists VC, formal
and/or informal, or not. As to the degree of presence, i.e. the level of ownership, we use two different

S. Hallström & B. Yazdani, 2008 THE ESSENTIAL ROLE OF VENTURE CAPITAL
24
regression models, OLS and Tobit, to find factors affecting, not only the presence of VC per se, but
also the level of ownership4.
The regressions often end up having relatively high adjusted R-square, i.e. quite high explanation
value for our models (as seen in tables 5.4 a-d). The Probit regressions, with binary outcome for VC
presence, show lower R-square for informal VCs around 12 percent and increases to 20 percent for
their formal counterparts. The fit of the explanatory variables increases to 43 percent when the
dependent variable instead represents both investor groups added together. When looking at levels of
ownership, the Tobit regressions show higher R-square than the Probit. Here the formal VCs owned
stake in the IPO-firms remains at approximately 20 percent, while the informal VCs stake here is
much better accounted for by the independent variables than in the Probit regressions, with an R-
square at 48 percent. The OLS regressions are less well-fit, which is expected since they are not suited
for the data. Including a dummy for formal VC only slightly increases the R-square for the informal
VC, while a dummy for the informal VC presence more markedly enhances the formal VC Tobit
regressions, raising the R-square from 19 percent to almost 23 percent. Informal VC presence is thus
an important, determinant factor for formal VC investments and should be included in the formal VC-
model.
5.2.1 Model component 1. The firm size
Our data indicate that the portfolio firm size is highly important for determining VC investments. Most
clearly this is shown in how firms absent of VC financing tend to be substantially smaller than those
that have some kind of VC present. These firms’ common equity is on average worth 309 MSEK, in
comparison to the total average of 651 MSEK (when excluding an extreme outlier). This could
implicate that these firms are more indebted than the others; however these firms are also the oldest in
our sample. Our supposition is thus that firms with no VC financing find it more difficult to rapidly
grow to full potential and that formal and informal VCs can be concluded as crucial for corporate
growth during entrepreneurial firm’s youth.
The size of the company clearly distinguishes formal and informal venture capitalists when looking at
both scatter plots (fig. 5.1a) and descriptive results. As expected, a tendency is shown for larger
presence of informal investors in the smaller companies, while the formal have larger stakes in the
larger companies (see table 5.3b). This confirms the reasoning around formal VCs not only being able
to invest larger sums than business angels and, thus investing in companies with larger capital needs
and size, but also the idea that formal venture capital-backed companies grow faster and larger when
injected with the large capital amounts, something that mainly formal VCs have the capacity to
provide.
4 The OLS is included only for comparative purposes since our data violate its underlying assumptions. The regressions are performed with the dependent variables informal VC, formal VC, and formal combined with informal VC, respectively.

S. Hallström & B. Yazdani, 2008 THE ESSENTIAL ROLE OF VENTURE CAPITAL
25
Fig. 5.1a Explaining formal and informal VC presence with firm size5
0%
25%
50%
75%
100%
0 200 400 600 800 1.000 1.200 1.400 1.600
Firm size at IPO (MSEK)
Form
al V
C o
wne
rshi
p (%
)
0%
25%
50%
75%
100%
0 200 400 600 800 1.000 1.200 1.400 1.600
Firm size at IPO (MSEK)
Info
rmal
VC
ow
ners
hip
(%)
The differences between formal and informal VCs are evident both when looking at the average size
of the firms where they are present, and when looking at how much they own in firms of different
sizes. Firms with only informal VC present are roughly a third of the size of firms with only formal
VC present when looking at average values, with 337 MSEK versus 924 MSEK, even if the difference
decreases for the median values to 239 MSEK versus 434 MSEK (as seen in table 5.3a), revealing that
there are more outliers in our sample of formal VC-backed firms. In most firms they own roughly
equal amounts, but for the largest third of firms informal VCs have much smaller stakes than the
formal VCs, with 9 percent ownership against 33 percent (according to table 5.3b).
Funding firms with both types of VC seem to be an effective means to reach a large firm size at IPO,
as the firms where both kinds of investors are present have a higher value of common equity than both
informal VC-backed and formal VC-backed firms, with 1204 MSEK in average terms (however with a
very extreme outlier distorting results) and 555 MSEK in median terms. Formal VC seems to be a
good substitute for having combined formal and informal VC ownership, since formal VC-backed
companies are bigger than firms financed with both informal and formal VC (when excluding the
extreme outlier), which reveals that it could be more important for entrepreneurial firms to try to
complement their informal VC with formal VC, than the other way around.
Lack of VC appears, as expected, to be an ineffective means of financing an entrepreneurial venture,
since these firms are the smallest firms in our sample with an average value of 309 MSEK. However,
in median figures they are not behind the firms with only informal VC present, but are instead a bit
larger with 284 MSEK against 239 MSEK.
5 An extreme outlier of SEK 15B has been excluded from the plot.

S. Hallström & B. Yazdani, 2008 THE ESSENTIAL ROLE OF VENTURE CAPITAL
26
Fig. 5.1b Explaining combined VC presence with firm size6
0%
25%
50%
75%
100%
0 200 400 600 800 1.000 1.200 1.400 1.600
Firm size at IPO (MSEK)
Com
bine
d V
C o
wne
rshi
p (%
)
In the regressions, the positive relationship between firm size and VC investments is to some extent
confirmed.
Informal VC presence, as analyzed by the Probit regression, cannot be confirmed to be determined by
firm size. Looking instead at the determinants of the level of common equity ownership, the
coefficient of firm size results significant, but very small in the OLS regression. We did not expect a
positive sign either, so the low reliance on this variable to explain informal VC is not surprising.
When instead looking at formal VC, the firm size is significant with a small, positive sign in the Probit
regression. Hence, formal VC presence in firms tend to be a positively correlated with firm size.
However, we would have expected a stronger positive effect. When restricting the regression to look
at firms with informal VC present, as represented by a dummy variable, this relationship still holds.
Levels of ownership in the IPO-firms can also be determined by firm size. Adding a dummy for
informal VC, this time the coefficient and the significance are enhanced, which could be interpreted as
informal VCs encouraging formal VCs to invest more in firms that reach a larger valuation at the point
of IPO.
The total amount of VC ownership in IPO-firms, is also significantly dependent on firm size, but with
a much lower coefficient, close to zero. Thus the combined formal and informal VC does not show as
clear relation to firm size as it does for formal VC separately.
6 An extreme outlier of SEK 15B has been excluded from the plot.

S. Hallström & B. Yazdani, 2008 THE ESSENTIAL ROLE OF VENTURE CAPITAL
27
Table 5.3a Formal and informal VC presence and firm characteristics
Only informal VC present
Only formal VC present
Both None Total
Number of firms
12 13 36 10 71
% of firms 15,5% 18,3% 52,1% 14,1% 100,0%
Average 336.999.007 SEK
924.961.730 SEK
1.204.230.227 SEK
Excl extreme outlier
739.963.950 SEK
308.888.414 SEK
868.294.944 SEK
Excl extreme outlier
650.690.731 SEK
Firm size
Median 239.320.000 SEK
434.112.896 SEK
554.832.672 SEK
284.006.400 SEK
350.000.000 SEK
Average 24,6% 46,2% 43,9% - 34.6% Venture capital part of EQ Median 19.6% 47.1 % 40.6 % -
Firm age Average 10,65 10,71 9,49 14,42 10,62
Median 8.97 10.61 8.44 14.0 9.98
Average
21.9 %
32.2 %
45.9%
35.5 %
Industry (% of all firms)
- IT Consultancy Median 18.1 % 39.0 % 45.1% 36.5 %
Average 31,5 % 46.8 % 43.2% 36,5 % - ITC
Median 23.5 % 47.1% 40.6 % 33.1 %
Average 19.6 % 69.5 % 40.7% 44.4 % - Healthcare
Median 19.6 % 69.5 % 35.1% 43.4 %
Average 1,1 % 35.7 % 46.2% 19.2 % - Other
Median 1,1 % 35.7 % 34.9 % 1.1%
Market (% of all firms)
Average 25.9% 49.4% 46.1 % 39.4 % - Before IT boom (1994-07) Median 25.5 % 49.6% 44.6 % 33.4%
Average 23.8 % 46.5 % 43.4 % 33.6 % - During IT boom (1998-2001) Median 18,.9 % 44.7 % 40.7 % 32.1%
Average 0 % 0 % 40.4 % 24.2% - After IT boom (2002-05) Median 0 % 0 % 35.9 % 19.2 %
Note: As measured before IPO.

S. Hallström & B. Yazdani, 2008 THE ESSENTIAL ROLE OF VENTURE CAPITAL
28
Table 5.3b Formal and informal VC ownership levels and firm characteristics
FIRM SIZE 15- 217MSEK 217-625MSEK 625-15.450MSEK Total
Number 23 24 24 71
% of cap owned by inf. VC 15.2% 14.7% 9.2% 13.0%
% of cap owned by f. VC 15.1% 16.0% 33.3% 21.6%
% of cap owned by both inf. & f. VC
30.3% 30.8% 42.6% 34.6%
FIRM AGE 2-8 8-13 13-27 Total
Number 23 24 24 71
% of cap owned by inf. VC 15.1% 14.8%% 8.6%% 13.0%
% of cap owned by f. VC 25.8% 24.9% 13.6% 21.6%
% of cap owned by both inf. & f. VC
41.4% 39.7% 22.2% 34.6%
INDUSTRY IT Consult ITC Healthcare Other Total
Number 23 27 10 11 71
% of cap owned by inf. VC 17.1% 14.5 % 10.3 % 3.4 % 13.0%
% of cap owned by f. VC 18.4 % 22.0 % 34.1 % 15.8 % 21.6%
% of cap owned by both inf. & f. VC
35.5% 36.5% 44.4% 19.2% 34.6%
MARKET Before IT Boom During IT Boom After IT Boom Total
Number 20 46 5 71
% of cap owned by inf. VC 15.1% 12.3% 11.5% 13.0%
% of cap owned by f. VC 24.3% 21.3% 12.7% 21.6%
% of cap owned by both inf. & f. VC
39.4% 33.6% 24.2% 34.6%
*Average ownership percentage in each firm size/age/industry/market group. As measured before IPO.
What may distort, or rather enhance, results is that larger investments ought to increase firm growth.
The consequence can be an overly evident connection between firm size and VC. Another factor of
distortion is overvalued share prices at IPO, which could make firm size a graceless proxy for initial
investment size. Dividing the sample into sectors and time periods could possibly reveal and reduce
misrepresentations in the analysis, our sample is however somewhat small to effectively perform such
an analysis.
H1. Formal VCs invest in larger firms than informal VCs.
− Descriptive results and regression analysis confirm a positive correlation between formal
VC presence and firm size.

S. Hallström & B. Yazdani, 2008 THE ESSENTIAL ROLE OF VENTURE CAPITAL
29
− No clear sign of a negative correlation between informal VC presence and firm size, but
average portfolio firm size is lower than for formal VCs. The variable cannot be
concluded to explain informal VC presence.
5.2.2 Model component 2. The firm’s age
Firm age at the IPO-event does not single out clear differences between investors, at least not when
looking at the percentage of formal and informal venture capital present in the firm plotted against
firm age. For informal VCs, it looks as if it is a decreasing function of firm age, but with a few mid-
size firms showing extremely high informal VC ownership (fig. 5.2a). We expected to find more
informal VC in the oldest firms since informal VCs are expected to have softer investment horizons,
but instead we find that they are much less present in the oldest third of firms than formal VCs are
(table 5.3b). The pattern for the formal VCs is also hard to distinguish, even if it does look decreasing
from the graph in fig. 5.2a. and descriptive results in table 5.3b. The difficulty to distinguish a pattern
could be the result from two contradictory forces, namely that formal VCs might come in at a later
stage in firm life, but they may also have stricter investment horizons and thus exit earlier
A clear pattern in the data is also that both informal and formal investors are much less present in the
oldest firms, which range from being 13 to 27 years old at the IPO occasion. The percentage owned by
venture capitalists drops to nearly the half in comparison to the younger firms. The firms with no VC
funding are thus the oldest in the sample, with an average age of 14,4 years at the point of IPO. This
indicates the difficulty for these firms to develop quickly enough to get listed on a stock exchange.

S. Hallström & B. Yazdani, 2008 THE ESSENTIAL ROLE OF VENTURE CAPITAL
30
Fig. 5.2a Explaining formal and informal VC presence with firm age
0%
25%
50%
75%
100%
0 10 20 30
Firm age at IPO
Form
al V
C o
wne
rshi
p (%
)
0%
25%
50%
75%
100%
0 10 20 30
Firm age at IPO
Info
rmal
VC
ow
ners
hip
(%)
Fig. 5.2b Explaining combined VC presence with firm age
0%
25%
50%
75%
100%
0 10 20 30
Firm age at IPO
Com
bine
d V
C o
wne
rshi
p (%
)
In the regressions the relationships between firm age and formal and informal VCs (as seen in tables
5.4 a-d) are significant, however with coefficients very close to zero. The formal VC presence is
established as decreasing with firm age and this persists when looking at levels of ownership in the
Tobit and OLS regressions.
Informal VC also shows a negative correlation with firm age when looking at the levels of ownership,
but not when explaining the informal investors’ existence in the IPO-firms by the Probit regression.
The coefficient is as low as for the formal investors’.
The combined, i.e. informal plus formal, VC ownership as a dependent variable, also results
negatively correlated with firm age. The coefficient, however, is somewhat larger this time for the
binary outcome variable as analyzed by the Probit regression.
We can thus conclude that age is a determinant for VC ownership in IPO-firms, which is a sign that
firms with no VC investments take longer time to reach the point of IPO. Another, less likely,

S. Hallström & B. Yazdani, 2008 THE ESSENTIAL ROLE OF VENTURE CAPITAL
31
explanation to the results could also be that VCs have sold off their investments when the IPO as an
exit opportunity arrives late in firm history. To verify this more exactly, further research should be
done, following the IPO firms back in time to the start-up occasion.
H2. Firms with VC are younger at the point of IPO than firms with no VC
− It cannot be confirmed that informal VC would be relatively more present in firms with a higher
age at IPO.
− Firms with no VC presence are confirmed by regressions and descriptives to be relatively older at
the IPO, with an average age of 14.4 years in comparison the rest of the sample showing 10.6
years.
5.2.3 Model component 3. The industry
Most of the firms in our sample, or 49 out of 71, are found to be in IT related businesses, showing
similarities even when separated into the two subgroups of IT Consultancy and IT Software. They
have been put into two different sets of firms mainly since we argue that underlying characteristics
may result in different risks for investors and thus in diverging behavior. Apparently this possible
variation is rather small.
IT Consultancy, a group of firms that cannot be considered in great need of external financing is less
backed by formal and informal VC than ITC also in our sample. As expected, the capital intense
industry group of Healthcare instead shows the largest amount of formal venture capital and a
somewhat lowered amount of informal VC. This reflects the reasoning around the possibility for
venture capital firms to invest larger amounts of money. Healthcare also remains strongly significant
in the regressions, indicating that formal VCs are both more present in this industry and are larger
owners in healthcare firms. However, the Wald test for the significance of dummies, does not turn out
significant regarding any of the regressions.
Informal VC show significant, positive coefficients for IT related sectors and healthcare regarding
levels of ownership. The same goes for the regression regarding informal VC presence, but the Wald-
test does not confirm the significance. Adding a dummy for formal VC presence does not alter the
results, as expected.
When adding formal and informal VCs together as one dependent variable, more explanatory variables
become significant. IT consultancy and ITC are positive, meaning that IT related businesses draw
more attention from all kinds of venture capitalists than other industries. The Healthcare variable,
however, shows the greatest coefficient throughout the regressions, even if the significance is
somewhat lower. The Wald test holds for all but the Probit regression regarding the industry dummies.

S. Hallström & B. Yazdani, 2008 THE ESSENTIAL ROLE OF VENTURE CAPITAL
32
H3. Formal VC invest more than informal VC in technology-based companies (as represented
by Healtchcare and ITC)
- Sector biases are confirmed by descriptive statistics and regressions, where formal VCs have
larger investments in Healthcare and ITC
5.2.4 Model component 4. The market
There are some variations for informal VCs regarding time period; their ownership levels decrease
with 24 percent after the IT boom compared to before. Formal investors show a strongly decreased
amount of capital invested after the IT boom, which was expected, where the decline is almost by half
with respect to the amounts owned before the boom.
Fig. 5.3a Explaining formal and informal VC ownership (%) with the market conditions as approximated by the time-period
0%
25%
50%
75%
100%
J-93 J-95 J-97 J-99 J-01 J-03 J-05
IPO occasion
Form
al V
C o
wne
rshi
p (%
)
0%
25%
50%
75%
100%
J-93 J-95 J-97 J-99 J-01 J-03 J-05
IPO occasion
Info
rmal
VC
ow
ners
hip
(%)
As to the effect of market, a cyclical feature cannot be immediately confirmed, since ownership levels
do not increase during the boom, as expected. It could thus be necessary to also look at the value of the
ownership in monetary terms, since overvaluations of stocks at IPO most likely were common during
the IT boom. Graphing this, in figure 5.3b we find evidence of formal VC ownership tending to a
cyclical behavior when measured in monetary terms.
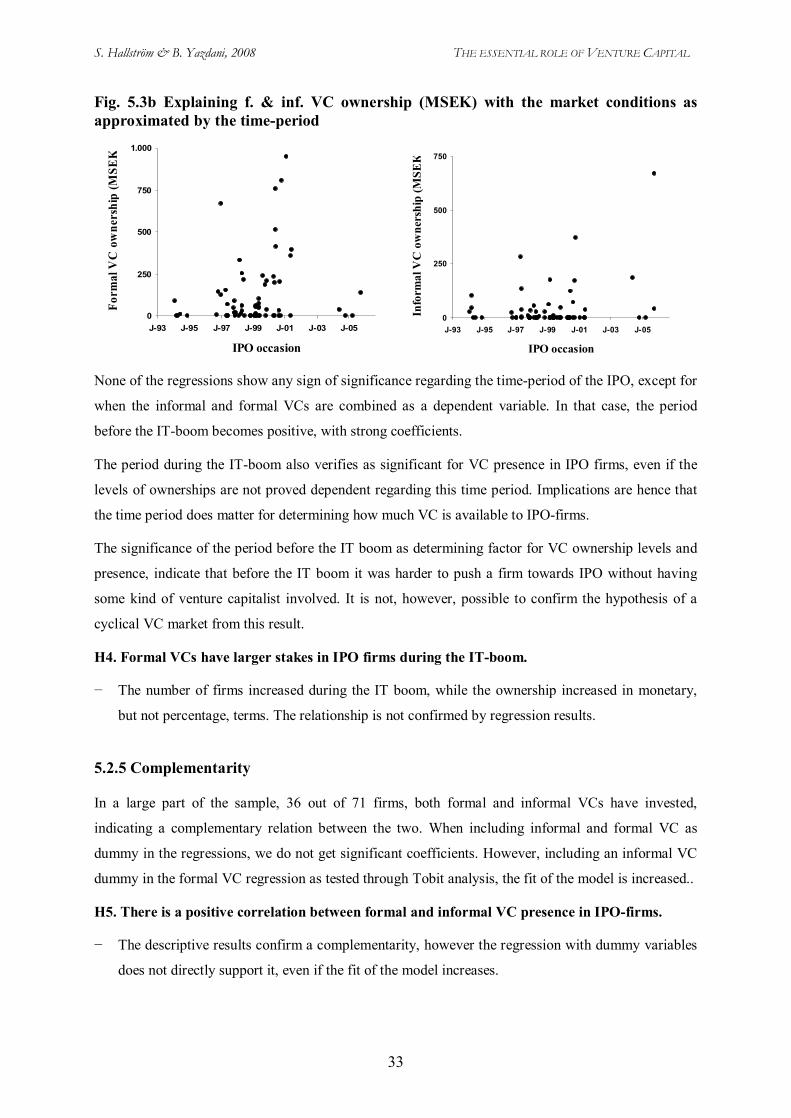
S. Hallström & B. Yazdani, 2008 THE ESSENTIAL ROLE OF VENTURE CAPITAL
33
Fig. 5.3b Explaining f. & inf. VC ownership (MSEK) with the market conditions as approximated by the time-period
0
250
500
750
1.000
J-93 J-95 J-97 J-99 J-01 J-03 J-05
IPO occasion
Form
al V
C o
wne
rshi
p (M
SEK
)
0
250
500
750
J-93 J-95 J-97 J-99 J-01 J-03 J-05
IPO occasion
Info
rmal
VC
ow
ners
hip
(MSE
K)
None of the regressions show any sign of significance regarding the time-period of the IPO, except for
when the informal and formal VCs are combined as a dependent variable. In that case, the period
before the IT-boom becomes positive, with strong coefficients.
The period during the IT-boom also verifies as significant for VC presence in IPO firms, even if the
levels of ownerships are not proved dependent regarding this time period. Implications are hence that
the time period does matter for determining how much VC is available to IPO-firms.
The significance of the period before the IT boom as determining factor for VC ownership levels and
presence, indicate that before the IT boom it was harder to push a firm towards IPO without having
some kind of venture capitalist involved. It is not, however, possible to confirm the hypothesis of a
cyclical VC market from this result.
H4. Formal VCs have larger stakes in IPO firms during the IT-boom.
− The number of firms increased during the IT boom, while the ownership increased in monetary,
but not percentage, terms. The relationship is not confirmed by regression results.
5.2.5 Complementarity
In a large part of the sample, 36 out of 71 firms, both formal and informal VCs have invested,
indicating a complementary relation between the two. When including informal and formal VC as
dummy in the regressions, we do not get significant coefficients. However, including an informal VC
dummy in the formal VC regression as tested through Tobit analysis, the fit of the model is increased..
H5. There is a positive correlation between formal and informal VC presence in IPO-firms.
− The descriptive results confirm a complementarity, however the regression with dummy variables
does not directly support it, even if the fit of the model increases.

Table 5.4a Determinants of f. & inf. VC in IPO firms – Regression results
Percentage of inf. VC ownership (OLS)
Percentage of inf. VC ownership (Tobit)
Percentage of firms with inf. VC present (Probit)
Percentage of f. VC ownership (OLS)
Percentage of f. VC ownership (Tobit)
Percentage of firms with f. VC present (Probit)
Observations All observ. All observ. All observ. All observ. All observ. All observ. N = 71 N = 71 N = 71 N = 71 N = 71 N = 71 Constant 0.08 (5.09e-12 ) -0.04 (0.05) -0.08 (0.64) 0.12 (0.11 ) -0.014 (0.10) -0.21 (0.66)
Firm size -3.01e-12 (5.09e-12) -7.65e-13 (-) 6.65e-11 (7.90e-11) 2.62e-11 (1.87e-11) 3.61e-11 (-) * 9.61e-10 (3.87e-10)**
Firm age -0.005 ( 0.0024)** -0.008 (0.002)* -0.05 (0.03) -.007 ( 0.006) -.0116494 (0.01) * -0.06 (0.03)* Industry dummies IT Consultancy (dummy) 0.14 (0.04)*** 0.25 (0.04)*** 1.06 (0.48)** 0.02 (0.07) .09 (0.07) 0.48 (0.49) ITC (dummy) 0.10 (0.045)** 0.19 (0.04)** 0.77 (0.46)* 0.02 (0.08) .065 (0.07) 0.21 (0.47) Healthcare (dummy) 0.07 (0.04)* 0.18 (0.04)* 1.16 (0.63)* 0.17 (0.10)* .280 (0.09) ** 1.16 (0.67)* Other (dummy) -0,14 (0.04)*** -0.25 (0.04) -1.06 (0.48)** -0.02 (0.07) -0.09 (0.07) -0.48 (0.49) Market dummies Before IT boom 0.05 (0.06) 0 .10 (0.06) 0.65 (0.62) 0.17 (0.09)* .25 (0.08) 0.82 (0.63) During IT boom -0.01 (0.05) 0.01 (0.05) 0.09 (0.52) 0.10 (0.07) .137 (0.07) 0 .28 (0.55) After IT boom -0.05 (0.06) -0.10 (0.06) -0.65 (0.62) -0.17 (0.09)* -0.25 (0.08) -0.82 (0.63) Wald test Industry F(3, 62) = 6.22 F(3, 64) = 2.75 χ2(3) = 5.47 F(3, 63) = 1.12 F(3, 64) = 1.65 χ2(3) = 3.53 [0.00]*** [0.05]** [0.14] [0.35] [0.19] [0.32] Wald test Market F(2, 63) = 0.57 F(2, 64) = 1.34 χ2(2) = 1.86 F(2, 63) = 1.90 F(2, 64) = 1.47 χ2(2) = 2.08 Prob > F [0.57] [0.27] [0.39] [0.16] [0.24] [0.35] Adj. / Ps. R2 0.0325 0.4805 0.1171 0.05 0.19 0.2016 Regression of presence and level of informal and formal venture capital as part of equity in 71 entrepreneurial firms doing IPO during 1994 and 2005. The sample is split into three time periods(1994-1997; 1998-2001; 2002-2005) and in four industries (IT Consultancy, ITC, Healthcare and Other). Huber-White robust standard errors are in parentheses. Asterisks *, ** and *** indicate statistical significance at the levels 10%, 5% and 1% respectively.

S. Hallström & B. Yazdani, 2008 THE ESSENTIAL ROLE OF VENTURE CAPITAL
35
Table 5.4b Inf. VC dummy added to determinants of f. & inf. VC in IPO firms – Regression results
Percentage of inf. VC ownership (OLS)
Percentage of inf. VC ownership (Tobit)
Percentage of firms with inf. VC present (Probit)
Percentage of f. VC ownership (OLS)
Percentage of f. VC ownership (Tobit)
Percentage of firms with f. VC present (Probit)
Observations All observ. All observ. All observ. All observ. All observ. All observ. N = 71 N = 71 N = 71 N = 71 N = 71 N = 71 Constant .010 (0.06)* -0.02 (0.05)* -0.13 (0.65) 0.18 (0.12) 0.07 -0.25 (0.67)
Firm size -1.06e-12 (4.69e-12) 5.17e-13 (-) 5.94e-11 (7.63e-11) 2.84e-11 (1.80e-11) 3.76e-11 (0.11)** 9.58e-10 (3.87e-10)**
Firm age -0.01 (0.00)** -0.01 (0.002)* -0.05 (0.03) -0.01 (0.01)* -0.01 (0.005)** -0.06 (0.03)* Industry dummies IT Consultancy (dummy) 0.15 (0.04)*** 0.25 (0.04)*** 1.04 (0.49)** 0.07 (0.08) 0.14 (0.08) 0.43 (0.52) ITC (dummy) 0 .11 (0.05)** 0.19 (0 .05)** 0.77 (0.47)* 0.06 (0.08) 0.10 (0.08) 0.17 (0.49) Healthcare (dummy) 0.08 (0.05)* 0.19 (0.04)* 1.12 (0.65)* 0.23 (0.10)** 0.33 (0.09)** 1.10 (0.69) Other (dummy) -0.15 (0.04)*** -0.25 (0.04)*** -1.04 (0.49)** -0.07 (0.08) -0.14 (0.08) -0.43 (0.52) Market dummies Before IT boom 0.06 (0.07) 0.11 (0.06) 0.63 (0.62) 0.20 (0.09)** 0.26 (0.09)* 0.77 (0.63) During IT boom 0.002 (0.05) 0.01 (0.05) 0.08 (0.51) 0.10 (0.08) 0.13 (0.08) 0.27 (0.54) After IT boom -0.06 (0.07) -0.11 (0.06) -0.63 (0.62) -0.20 (0.09)** -0.26 (0.09)* -0.77 (0.63) Inf.VC/ f.VC dummy -0.04 (0.05) -0.03 (0.04) 0.10 (0.35) -0.14 (0.07)** -0.13 (0.06) 0.12 (0.37) Wald test INDUSTRY F(3, 62) = 4.53 F(3, 63) = 2.86 χ2(3) = 4.95 F(3, 62) = 2.09 F(3, 63) = 2.16 χ2(3) = 3.12 [0.00]*** [0.04]** [0.18] [0.11] [0.10]* [0.37] Wald test MARKET F(2, 62) = 0.63 F(2, 63) = 1.42 χ2(2) = 1.75 F(2, 62) = 2.46 F(2, 63) = 1.93 χ2(2) = 1.78 [0.54] [0.25] [0.42] [0.09]* [0.15] [0.41] Wald test BA/VC dummy F(1, 62) = 0.78 F(1, 63) = 0.30 χ2(1) = 0.08 F(1, 62) = 4.15 F(1, 63) = 2.73 χ2(1) = 0.10 [0.38] [0.59] [0.78] [0.04]** [0.10]* [0.75] Adj. / Ps. R2 0.0318 0.4914 0.1178 0.1107 0.2273 0.2026 Regression of presence and level of informal and formal venture capital as part of equity in 71 entrepreneurial firms doing IPO during 1994 and 2005. The sample is split into three time periods (1994-1997; 1998-2001; 2002-2005) and in four industries (IT Consultancy, ITC, Healthcare and Other). Huber-White robust standard errors are in parentheses. Asterisks *, ** and *** indicate statistical significance at the levels 10%, 5% and 1% respectively.

S. Hallström & B. Yazdani, 2008 THE ESSENTIAL ROLE OF VENTURE CAPITAL
36
Table 5.4c Determinants of combined f. & inf. VC in IPO firms – Regression results
Percentage of inf. + f. VC ownership (OLS)
Percentage of inf. + f. VC ownership (Tobit)
Percentage of firms with both inf. & f. VC present (Probit)
Observations N = 71 N = 71 N = 61 Constant 0.20 (0.12) 0.09 (0.11) -0.46 (0.80) Firm size 2.32e-11 1.59e-11 2.61e-11 (-)* 1.03e-09 (4.27e-10)** Firm age -0.01 (0.01)** -0.01 (0.005)*** -0.13 (0.04)** Industry dummies IT Consultancy (dummy) 0.16 (0.08)* 0.24 (0.08)** 1.22 (0.74)* ITC (dummy) 0.12 (0.08) 0.18 (0.08)* 1.22 (0.65)* Healthcare (dummy) 0.24 (0.09)* 0.32 (0.08)*** Dropped a) Other (dummy) - 0.16 (0.08)* -0.24 (0.08)** -1.22 (0.74)* Market dummies Before IT boom 0.22 (0.10)** 0.30 (0.10)** 3.25 (1.00)*** During IT boom 0.10 (0.09) 0.14 (0.09) 1.38 (0.58)** After IT boom Wald test INDUSTRY F(3, 63) = 2.50 F(3, 64) = 2.98 χ2(2) = 3.77 [0.07]* [0.04]** [0.15] Wald test MARKET F(2, 63) = 2.47 F(2, 64) = 3.74 χ2(2) = 12.70 [0.09]* [0.03]** [0.00]*** Adj. / Ps. R2 0.1357 0.5508 0.4325 Regression of presence and level of informal and formal venture capital as part of equity in 71 entrepreneurial firms doing IPO during 1994 and 2005. The sample is split into three time periods (1994-1997; 1998-2001; 2002-2005) and in four industries (IT Consultancy, ITC, Healthcare and Other. Huber-White robust standard errors are in parentheses. Asterisks *, ** and *** indicate statistical significance at the levels 10%, 5% and 1% respectively. a) Healthcare variable was since it predicts success in the dependent variable, along with it dropped 10 observations. This means that the effective coefficient on the dropped variables is infinity. This will have no effect on the likelihood or estimates of the remaining coefficients; it increases also the numerical stability of the optimization process.

S. Hallström & B. Yazdani, 2008 THE ESSENTIAL ROLE OF VENTURE CAPITAL
37
Table 5.4d Determinants of combined f. & inf. VC in IPO firms with lagged market variables – Regression results
Percentage of inf. + f. VC ownership (OLS)
Percentage of inf. + f. VC ownership (Tobit)
Percentage of firms with both inf. & f. VC present (Probit)
Observations N = 71 N =71 N = 71 Constant 0.27 (0.12)** 0.53 (0.08)*** 1.46 (0.89)* Firm size -.01 (0.01) 2.15e-11 (-) 8.41e-10 (5.08e-10)* Firm age -0.01 (0.01)* -0.01 (0.05)** -0.08 (0.04)** Industry dummies IT Consultancy (dummy) 0.16 (0.08)* -0.09 (0.09) 0.99 (0.64)*** ITC (dummy) 0.13 (0.09) -0.13(0.06) 0.69 (0.60)*** Healthcare (dummy) 0.24 (0.10)** 0.11(0.09) Dropped Other (dummy) -0.24 (0.10)** -0.33 (0.08)*** -6.44 (0.89)*** Market dummies Before IT boom_lag 0.10 (0.11) 0.17 (0.11) Dropped During IT boom_lag 0.01 (0.08) 0.40 (0.12) -0.49 (0.71) After IT boom_lag -0.09 (0.12) -0.14 (0.12) -1.49(0.81)* Wald test INDUSTRY F(3, 63) = 1.98 F(3, 64) = 2.60 χ2(2) = 55.54 [0.13] [0.06]* [0.00]*** Wald test MARKET_lag F(2, 63) = 0.42 F(2, 64) = 0.61 χ2(2) = 4.15 [0.66] [0.054] [0.13] Adj. / Ps. R2 0.0788 0.3980 0.3202 Regression of presence and level of informal and formal venture capital as part of equity in 71 entrepreneurial firms doing IPO during 1994 and 2005. The sample is split into three time periods (1994-1997; 1998-2001; 2002-2005) and in four industries (IT Consultancy, ITC, Healthcare and Other. Huber-White robust standard errors are in parentheses. Asterisks *, ** and *** indicate statistical significance at the levels 10%, 5% and 1% respectively.

5.3 Post-investment behavior
5.3.1 Post-investment behavior 1. Board representation
We expected to find more formal VC than informal on the boards of directors of the IPO-firms,
however the opposite is found in our sample. In firms where both investor types are present, informal
VCs tend to be on the board much more frequently than the formal VCs. This indicates that the
informal VCs presence on the board could be judged as a sufficient control mechanism for formal VCs
when they invest in a portfolio company.
A total of 39 percent of all informal VCs in our sample take a seat on the board, while the lower 34
percent of formal VCs do so. Informal VCs also dominate the boards they sit in much more, taking
almost 15 percent of the board seats in the companies they invest in, against VCs being represented on
11 percent of all the seats (as seen in table 5.5b). When looking at the firms, formal VCs have roughly
as often a seat on boards in firms where no informal VCs have invested, as informal VCs have in firms
where no formal VCs have invested (as seen in table 5.5a). However, the informal VCs remain much
more present on firm boards, namely 50 percent more often than formal VCs, when including firms
where both investor types have invested.
Larger firms draw more of the attention of both informal and formal VCs in terms of board presence
and domination, while firm age does not offer clear distinctions between investors. The only visible
difference is that the older firms tend to have larger boards and thus provide less opportunity for VCs
to dominate them, and they are also less often present on these boards (which is also explained by the
fact that both VC types less often have investments in the older firms)..

S. Hallström & B. Yazdani, 2008 THE ESSENTIAL ROLE OF VENTURE CAPITAL
39
Table 5.5a Board representation on the firm level
Only inf. VC present
Only f. VC present
Both None Total
Number of firms 12 13 36 10 71
Inf.VC represented on board, in companies where they have invested.
75.0% 69.4 % 70.8 %
F. VC represented on board, in companies where they have invested.
76.9% 50.0% 46.9 %
BOARD REP & FIRM SIZE
15-217MSEK
217-625MSEK
625-15.450MSEK
Total
Number of firms 24 23 24 71
Inf. VC represented on board
52.9 % 53.8 % 100 % 70.8 %
F. VC represented on board 57.1 % 46.7 % 65.0 % 57.1 %
BOARD REP & FIRM AGE
2-8 yrs 8-13 yrs 13-27 yrs Total
Number of firms 23 24 24 71
Inf. VC represented on board
76.5 % 80.0 % 46.2 % 70.8 %
F. VC represented on board 72.2 % 63.9 % 38.5 % 57.1 %
BOARD REP & INDUSTRY
IT Consult ITC Healthcare Other Total
Number of firms 20 26 11 13 71
Inf. VC represented on board
57.1 % 73.7 % 88.9 % 66.7 % 70.8 %
F. VC represented on board 26.7 % 76.5 % 70.0 % 57.1 % 57.1 %
BOARD REP & MARKET
Before IT Boom
During IT Boom
After IT Boom
Total
Number of firms 21 45 5
Inf. VC represented on board
56.3 % 75.9 % 100 % 70.8 %
F. VC represented on board 66.7 % 51.6 % 66.7 % 57.1 %
Board seat representation expressed in percentage of firms with VCs on the board out of total number of VC present in the group. Looking at firm size and informal VCs for example, 52.9% stands for the relationship between the numbers of firms with informal VCs on the board in relation to total number of firms with informal VCs in companies between 15 – 217 MSEK.

S. Hallström & B. Yazdani, 2008 THE ESSENTIAL ROLE OF VENTURE CAPITAL
40
Table 5.5b Board representation on the investor level
BOARD REP & FIRM SIZE 15-217MSEK
217-625MSEK
625-15.450MSEK
Total
Number (%) of all inf. VC with board seat
16/46
34.8%
14/53
26.4%
30/55
54.5%
60/154 (39.0%)
Number (%) of all f. VC with board seat
9/25
36.0%
12/41
29.3%
25/69
36.2%
46/135 (34.1%)
Board domination inf.VC 11.4% 9.9% 18.1% 14.7 %
Board domination f. VC 5.4% 8.3% 12.7% 10.8 %
BOARD REP & FIRM AGE 2-8 yrs 8-13 yrs 13-27 yrs Total
Number (%) of all inf. VC with board seat
23/66
34.8%
28/61
45.9%
9/27
33.3%
60/154 (39.0%)
Number (%) of all f. VC with board seat
23/62
37.1%
17/54
31.5%
6/19
31.6%
46/135 (34.1%)
Board domination inf.VC 14.6% 18.8% 6.1% 14.7 %
Board domination f. VC 14.6% 8.9% 3.2% 10.8 %
BOARD REP & INDUSTRY IT Consult ITC Healthcare Other Total
Number (%) of all inf. VC with board seat
11 /41
(26.8%)
25/60
(41.7%)
14/33
(42.4%)
10/20
(50.0%)
60/154 (39.0%)
Number (%) of all f. VC with board seat
4 /22
(18.2%)
24/50
(48.0%)
12/38
(31.6%)
6/25
(24.0%)
46/135 (34.1%)
Board domination inf.VC 9.8 % 17.1 % 19.9 % 12.2 % 14.7 %
Board domination f. VC 2.7 % 16.1 % 19.0 % 6.8 % 10.8 %
BOARD REP & MARKET Before IT Boom
During IT Boom
After IT Boom
Total
Number (%) of all inf. VC with board seat
12/38
(31.6%)
44/104
(42.3%)
4/12
(33.3%)
60/154 (39.0%)
Number (%) of all f. VC with board seat
16/36
(44.4%)
27/93
(29.0%)
3/6
(50.0%)
46/135 (34.1%)
Board domination inf.VC 11.9% 15.9% 13.2% 14.7 %
Board domination f. VC 13.0% 10.2% 10.4% 10.8 %
Board seat representation as measured per investment occasions divided by total number of investment occasions in this group. Looking at firm size and informal VCs for example, 16/46 - 34,8% stands for 16 informal VCs on the board in relation to 46 total informal VCs in companies between 15 – 217 MSEK in firm size; corresponding to 34,8 percent.
When at firms in ITC and healthcare industry respectively, the board presence increases. This is in
accordance with Gompers’ (1995) and Sapienza and Gupta’s (1994) findings on the need to supervise
increasing with decreasing asset tangibility and increasing weight on R&D – which these two
industries arguably endure.

S. Hallström & B. Yazdani, 2008 THE ESSENTIAL ROLE OF VENTURE CAPITAL
41
The market, however, does not tend to largely affect board representation. It is not clear whether there
was an increase in the board representation after the IT bubble’s burst (possibly due to increased
suspiciousness) – the sample from after the IT boom is too small to state anything securely.
H6. Formal VC’s board representation differs from informal investors, where formal VC are
expected to be more represented
- Against expectations, informal VCs are found to more often sit on board than formal VCs.
- Both formal and informal VCs are more represented on boards in high-tech industries, where assets are more intangible and the need to supervise is higher.
- Board representation is higher for both investor groups in the largest third of all firms, as expected.
5.3.2 Post-investment behavior 2. Exit behavior
The hypothesis on formal VCs exiting a larger amount at the IPO than the informal investors cannot
be confirmed. The formal VCs sell on average 12 percent of their shares, but this is not even 2
percentage points more than informal investors do. Comparing the volatility of formal and informal
VCs should give a hint to the hypothesis on informal VCs either selling off much more or much less
than formal VCs at the IPO. However, the volatility is less for the informal investors than for the
formal, which turns down the premise.
Smaller companies show surprisingly small exits where particularly formal VCs sell off very small
fractions, possibly in expectance for higher returns after the stock exchange introduction. It is also
likely that the small exits have a correlation with lock-ups. The small companies may have a bad
profitability record, thus showing greater information asymmetries, as reasoned by Brav and Gompers
(2001) and Lerner (1994a). In that case the venture capital might be locked-up in the firm as a signal
of commitment, important to increase these firms credibility to the new, external investors at the stock
exchange.
During the IT boom few shares were sold, but afterwards investors have become more cautious on
selling off., as expected. These activities are enhanced for the ITC and IT consultancy sector,
implicating a larger attention to exit routes in the sectors that were hardest hit by the IT bust. The fact
that IT related businesses generally show larger amounts exited could also mean that Healthcare and
other industries are more driven by long-term investors. In healthcare many firms are dependent on
investments during longer periods in order to realize returns, which could be reflected in a pull effect
on investors with long investment horizons.
H7. The amount of capital exited by formal VC is larger than by informal VC .
− The hypothesis that formal VCs do larger exits at IPO than informal investors cannot be confirmed
by descriptive results or regression analysis.
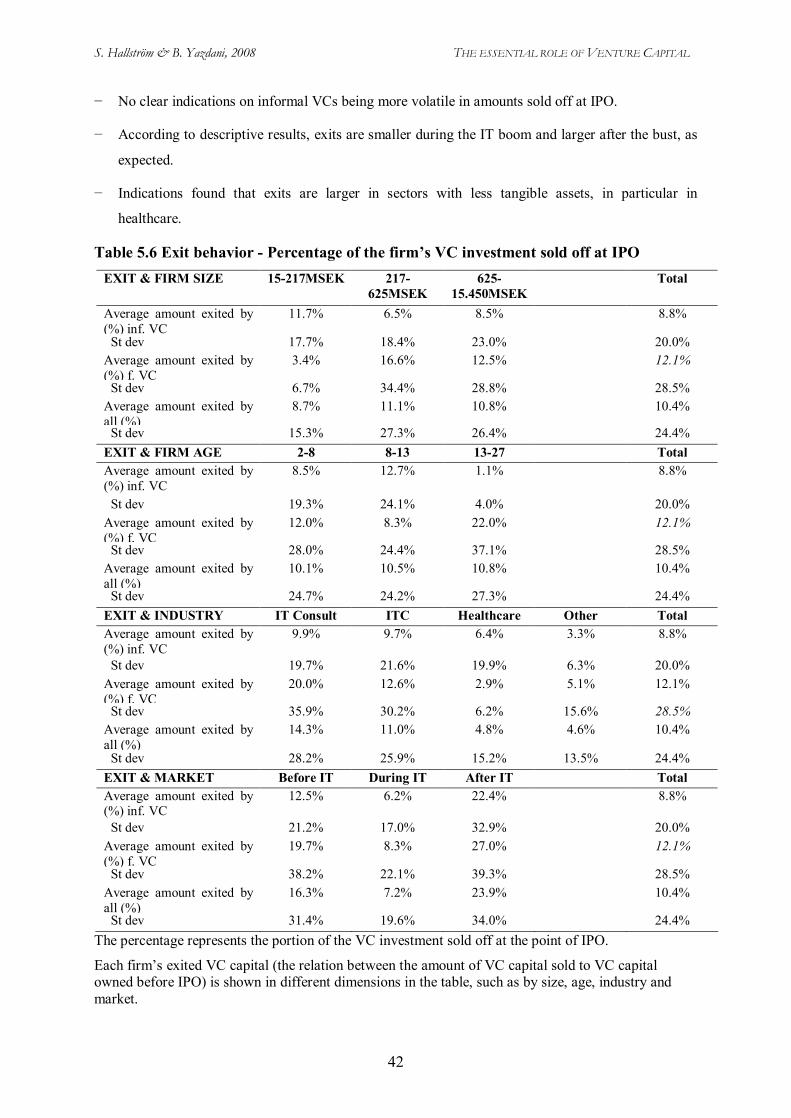
S. Hallström & B. Yazdani, 2008 THE ESSENTIAL ROLE OF VENTURE CAPITAL
42
− No clear indications on informal VCs being more volatile in amounts sold off at IPO.
− According to descriptive results, exits are smaller during the IT boom and larger after the bust, as
expected.
− Indications found that exits are larger in sectors with less tangible assets, in particular in
healthcare.
Table 5.6 Exit behavior - Percentage of the firm’s VC investment sold off at IPO
The percentage represents the portion of the VC investment sold off at the point of IPO.
Each firm’s exited VC capital (the relation between the amount of VC capital sold to VC capital owned before IPO) is shown in different dimensions in the table, such as by size, age, industry and market.
EXIT & FIRM SIZE 15-217MSEK 217-625MSEK
625-15.450MSEK
Total
Average amount exited by (%) inf. VC
11.7% 6.5% 8.5% 8.8%
St dev 17.7% 18.4% 23.0% 20.0% Average amount exited by (%) f. VC
3.4% 16.6% 12.5% 12.1%
St dev 6.7% 34.4% 28.8% 28.5% Average amount exited by all (%)
8.7% 11.1% 10.8% 10.4%
St dev 15.3% 27.3% 26.4% 24.4% EXIT & FIRM AGE 2-8 8-13 13-27 Total Average amount exited by (%) inf. VC
8.5% 12.7% 1.1% 8.8%
St dev 19.3% 24.1% 4.0% 20.0% Average amount exited by (%) f. VC
12.0% 8.3% 22.0% 12.1%
St dev 28.0% 24.4% 37.1% 28.5% Average amount exited by all (%)
10.1% 10.5% 10.8% 10.4%
St dev 24.7% 24.2% 27.3% 24.4% EXIT & INDUSTRY IT Consult ITC Healthcare Other Total Average amount exited by (%) inf. VC
9.9% 9.7% 6.4% 3.3% 8.8%
St dev 19.7% 21.6% 19.9% 6.3% 20.0% Average amount exited by (%) f. VC
20.0% 12.6% 2.9% 5.1% 12.1%
St dev 35.9% 30.2% 6.2% 15.6% 28.5% Average amount exited by all (%)
14.3% 11.0% 4.8% 4.6% 10.4%
St dev 28.2% 25.9% 15.2% 13.5% 24.4% EXIT & MARKET Before IT
Boom During IT
Boom After IT
Boom Total
Average amount exited by (%) inf. VC
12.5% 6.2% 22.4% 8.8%
St dev 21.2% 17.0% 32.9% 20.0% Average amount exited by (%) f. VC
19.7% 8.3% 27.0% 12.1%
St dev 38.2% 22.1% 39.3% 28.5% Average amount exited by all (%)
16.3% 7.2% 23.9% 10.4%
St dev 31.4% 19.6% 34.0% 24.4%

S. Hallström & B. Yazdani, 2008 THE ESSENTIAL ROLE OF VENTURE CAPITAL
43
6 CONCLUSION & AREAS OF FURTHER STUDIES Research on venture capital has largely focused on formal venture capital, including VC funds, but
less has been studied on the informal venture capital market, where business angels comprise the main
part. Increasingly attention is shifting towards a more inclusive view of the investor types and
recognition of their complementary roles of different forms of venture capital for innovative
companies.
In this paper, we have investigated factors determining formal and informal VCs investments in some
of the most successful start-ups – those that manage to go public in Sweden between 1994 and 2005.
One conclusion with major implications is the importance of venture capital for IPO-firms in terms of
growth options and speed to reach the stock exchange. Firms with no venture capital revealed the most
inferior conditions when going public. They were the slowest to perform IPO and the same firms had
the lowest value in the sample, at the point of IPO. In prior studies, firms with venture capital have
been concluded to be less under-priced at the IPO than other start-ups, due to the financial and non-
financial value added by venture capitalists. Our findings support that notion, at the same time as it
opens up for a discussion of a possible lack of growth when firms do not take in venture capital.
Another noteworthy finding is the complementary relationship between formal and informal venture
capital. In our sample, roughly half of the firms demonstrated presence of both formal and informal
VCs, indicating a complementary relation between the two forms of VC. Start-ups that look for a
correct pricing of their stock at the IPO occasion and possibly a healthy growth up until then, should
thus attempt to find both formal and informal VCs that can provide the financial and non-.financial
means necessary.
To sum up results, our modeling shows that firm age and firm size are important variables for
explaining VC presence. We also find, as expected, that formal VCs have biases towards sectors
requiring large investments, such as Healthcare. Some evidence of cyclicality in formal VC
investments is also found, supporting earlier findings by Gompers and Lerner (1999) and Inderst and
Müller (2003).
In order to contribute further to the scarce research on informal venture capitalists and their
relationship to formal venture capital funds, we have also looked at some ex-post investment
behaviors, namely involvement in the portfolio company’s board of directors, and exits of investment
at the point of IPO. As to the board representation, an important mean for VCs to deal with agency-
principal problems with respect to the entrepreneur, informal VCs were found to more often sit on
board than formal VCs, contrary to what previous studies have found. As expected, board
representation is higher for both investor groups in the largest firms and in high-tech industries, where
the need to supervise is larger.

S. Hallström & B. Yazdani, 2008 THE ESSENTIAL ROLE OF VENTURE CAPITAL
44
Regarding the exit behavior between the VC investors, exits were smaller during the IT boom
but larger after the bust. Finally, indications found that exits are larger in sectors with less tangible
assets, in particular in Healthcare.
6.1 Suggestions for further research One suggestion for further research concerns the extension of the time period for which investment
and exit behavior of investors is studied. Expanding the time period researched for each firm beyond
the IPO moment is another. This single moment has given us investment information from two events
– the ownership right before the IPO and the ownership right after the IPO. Ideally, information from
earlier stage (which is not public) could be extracted and included in a study. Investment details after
IPO are also interesting, particularly in order to capture all of the IPO-related exits that formal and
informal VCs perform when the so called lock-ups expire.
The research could be expanded to a Nordic perspective, adding value because of the generally
increased focus on the Nordic market as an entity. Comparing the private equity presence and
investment behavior, entrepreneurship and the differing tax policies in these countries could be of
value.
Further comparisons should be made between Sweden and UK (or US) using a similar quantitative
model. UK and US have more mature venture capital markets, which could provide Swedish
policymakers with interesting “benchmark” information on how to support entrepreneurs and business
angels in the aspiration to create economic development.

S. Hallström & B. Yazdani, 2008 THE ESSENTIAL ROLE OF VENTURE CAPITAL
45
REFERENCES Amemiya, T. 1973. Regression analysis when the dependent variable is truncated normal. (Econometrica 41 (6), 997–1016)
Barry, C., Muscarella, C., Peavy, J. and Vetsuypens, M. 1990. The role of venture capitalists in the creation of public companies. (Journal of Financial Economics2, 7(2), 447-471).
Bhide, A. 1992. Bootstrap Finance: The Art of Start-ups. (Harvard Business Review, 70(6): 109.)
Bhide, A.V. 2003. The Origin and Evolution of New Businesses. (Oxford University Press)
Birch, D., Haggerty, A., Parsons, W., and Rossel, C. 1993. Entrepreneurial hot spots. (Boston: Cognetics)
Black, B., and Gilson, R. 1998. Venture capital and the structure of financial markets: Banks versus stock markets. (Journal of Financial Economics, 47(1), 243-277).
Bottazzi, L. and Da Rin, M. 2002. Venture Capital in Europe and the Financing of Innovative Companies. (Economic Policy, Vol. 17, pp. 229-269)
Brav, A., and Gompers, P. 1997. Myth or reality? The long-run underperformance of initial public offering: evidence from venture and non-venture-backed companies. (Journal of Finance, 52(4), 1791-1820)
Bygrave, W. and Timmons, J. 1992.Venture capital at the crossroads. (Harvard Business School Press, Cambridge, MA)
Erlich, S.B., Noble, A.F., Moore, T., and Weaver, R.R. 1994. After the cash arrives: A comparative study of venture capital firms and private investor involvement in entrepreneurial firms. (Journal of Business Venturing, 1994, 9, pp. 67-82)
European Commission. 1998. Risk Capital: A key to job creation in the European Union. (Enterprise Directorate-General, Brussels: European Commission)
Finney, D.J. 1947, Probit Analysis. (Cambridge University Press, Cambridge, UK.)
Freear, J., Sohl, J. E. and Wetzel, W. E. Angels. 1994. Personal Investors in the Venture Capital Market. (Entrepreneurship and Regional Development, 7/1995, pp. 85-94)
Freear, J., and Wetzel, W. E. 1989. Equity capital for entrepreneurs. (In Frontiers of Entrepreneurship Research. Babson Park, Mass.: Babson College)
Gilson, R J., and Schizer, D. 2002. Understanding Venture Capital Structure: A Tax Explanation for Convertible Preferred Stock (Working Paper, March 2002, Harvard L. Rev.).
Gompers, P. 1995. Optimal investment, monitoring, and the staging of venture capital. (Journal of Financial Economics, No 50, pp. 463-498)
Gompers, P. and Lerner, J. 1999. The Venture Capital Cycle. (Cambridge, MA: MIT Press)
Gorman, M., and Sahlman, W.A. 1989. What do venture capitalists do? (Journal of Business Venturing, 4/1989, pp. 231-248)
Hustedde, R. and Pulver, G. 1992. Factors affecting equity capital acquisition: the demand side. J. Bus. Venturing 7 5, pp. 363–374.
Jeng, L., and Wells, P. 2000. The determinants of venture capital funding: Evidence across countries. (Journal of Corporate Finance, 6 (1), 241-289)
Jensen, M.C. and Meckling, W.H. 1976. Theory of the firm: Managerial behavior, agency costs and ownership structure. (Journal of Financial Economics, no. 3, pp. 305-360)
Kaplan, S. and Stromberg, P.J. 2000. Financial contracting theory meets the real world: An empirical analysis of venture capital contracts. (The Review of Economic Studies, Vol. 70(2), No. 243, pp. 281-316)
Kaplan, S. and Strömberg, P. J., 2002. Characteristics, Contracts and Actions: Evidence from Venture Capitalist Analyses, (CEPR Discussion Papers 3243, C.E.P.R. Discussion Papers.)
Knight, F. H. 1921. Risk, Uncertainty and Profit. (New York: Houghton Mifflin)

S. Hallström & B. Yazdani, 2008 THE ESSENTIAL ROLE OF VENTURE CAPITAL
46
Landström, H. and Månsson, N. 2006. Business angels in a changing economy: the case of Sweden (Venture Capital, Vol. 8, No. 4, p. 281-301, 2006)
Lerner, J. 1994a. The syndication of venture capital investments. (Financial Management, No 23, pp. 16-27)
Lerner, J. 1994b. Venture Capitalists and the Decision to go Public. (Journal of Financial Economics, No. 35)
Lerner, J. 1995. Venture capitalists and the oversight of private firms. (Journal of Finance, No 50, pp.301-318)
Lundström, A. and Stevenson, L. 2001. Entrepreneurship Policy for the Future (Stockholm: Swedish Foundation for Small Business Research).
MacMillan, I.C., Kulow, D.M., and Khoylian, R. 1988. Venture capitalists’ involvement in their investments: Extent and performance. (Journal of Business Venturing, 1988, 4, pp. 27-47)
Mason, C. and Harrison, B. 1992. The Supply of Equity Finance in the UK: A Strategy for Closing the Equity Gap. Entrepreneurship and Regional Development (4/1992, 357-380)
NUTEK. 2006. Riskkapitalbolagens aktiviteter och annan investering i tidiga skeden: Fjärde kvartalet 2006 (NUTEK), p. 15.
Rosenstein, J., Bruno, A.V., Bygrave, W.D., and Taylor, N.T. 1989. Do venture capitalists on boards of portfolio companies add value besides money? (In Frontiers of Entrepreneurship Research. Babson Park, Mass.: Babson College)
Sahlman, W. 1990. The structure and governance of venture-capital organizations. (Journal of Financial Economics, 27(2), 273-321)
Sapienza, H. 1992. When do venture capitalists add value? (Journal of Business Venturing 7, 9-27.)
Sapienza, H., Manigart, S., and Vermeir, W. 1996. Venture capitalist governance and value added in four countries, (Journal of Business Venturing 11, 439-469.)
Sohl, J.E. 1999. The early-stage equity market in the USA. (Venture Capital, 1999, 1(2), pp. 1-20)
Storey, D. 1994. Understanding the Small Business Sector (London: Routledge)
Tyebjee T. T. and Bruno A. V. 1984. A model of venture capitalist investment activity. (Management science, Vol. 30, no9, pp. 1051-1066)
Van Osnabrugge, M. and Robinson, R.J. 2000. Matching start-up funds with start-up companies – The guide for entrepreneurs, individual investors, and venture capitalists. (San Francisco: Jossey Bass, 1st ed.)
Wetzel, W.E. and Freear, J. 1994. “Promoting informal venture capital in the United States: Reflections on the history of the venture capital network.” (In R. Harrison and C.M. Mason (eds.), Informal venture capital: Information, networks, and public policy. Hemel Hempstead, England: Woodhead-Faulkner)
Wetzel, W.E. 1996. “Economic policy in an entrepreneurial world: Seven treacherous misconceptions and half-truths.” (Venture Capital Report, Apr. 1996, pp. 1-4)

S. Hallström & B. Yazdani, 2008 THE ESSENTIAL ROLE OF VENTURE CAPITAL
47
App. 1. Appendix - Definitions The different stages of start-up financing Different stages of start-up financing, according to Sohl (1999): Seed finance Small investment allowing the entrepreneur to verify whether the project is feasible and economically attractive. Venture capitalist is a helpful source in understanding if the project is viable. Start-up finance Investment that allows for rending a firm operational. Company organization and corporate strategy are areas where the venture capitalist may be helpful. Early stage finance, or expansion finance Investment to reach industry-scale production, upgrade production facilities and attract more employees. The venture capitalist may help in finding clients, suppliers and financing. The company’s growth and increased revenue requirements may raise needs for help to recruit marketing and other non-technical executives. Later stage finance Investment to help the company become a market leader and fulfil its earning potential, and prepare for trade sale or IPO. Venture capitalists can help in setting the stage for the trade sale or the IPO.
Definition of industry groups IT Consultancy. IT Consultancy ITC IT Software, Telecom, IT Business Systems, IT Other Healthcare. Pharma, Biotech Other. Media & Entertainment, Other services, Education, Retail, Industrial

S. Hallström & B. Yazdani, 2008 THE ESSENTIAL ROLE OF VENTURE CAPITAL
48
App. 2. Definition of variables In order to model the part of entrepreneurial start-ups owned by formal and informal venture
capitalists, the following variables are used:
Ownership informal VC. A dependent variable, describing the percentage ownership of informal VC
out of the total equity before the IPO. The data is also used in an aggregated manner when analyzing
from a firm perspective rather than the individual investors’ ownership level.
Ownership of the informal VCs after the IPO was also extracted, giving information on exit behavior.
Ownership VC. Same as above, but for VCs.
Firm size. An independent variable measuring the equity size of the firm in SEK just before the IPO
and thus approximating firm size. Using common equity as a size measure instead of total assets is
reasonable both since the dependent variables are based on equity and since common equity reflects
value in the market place and thus the value at which INFORMAL VCs and VCs can sell their firms
shares.
Firm age. An independent variable expressing the time to IPO, i.e. the time passed between firm
foundation and IPO, in discrete years. The exact date of the IPO is known for all the firms in the
sample, but regarding the date of firm foundation information on exact date is not available but only
the year of the foundation. 1 July of each foundation year is used as an approximation in order to
leverage up until the date of IPO.
The market. Independent dummy variables that are used for the three subsequent time periods that the
sample is split into, namely the before the IT-boom, during the IT-boom and finally after the IT-boom:
D_before: The dummy is set to 1 if the firm was listed between 1994 and 1997.
D_during: The dummy is set to 1 if the firm was listed between 1998 and 2001 – the period referred to
as the IT-boom.
D_after: The dummy is set to 1 if the firm was listed between 2002 and 2005.
The sector. Independent dummy variables (X_industry) for four sectors. The 15 industries found in the
data sample of 71 firms were reclassified down to these four.
D_IT_consultancy: The dummy is set to 1 if the firm is considered part of IT consultancy industry,
characterized by a large ratio of human capital and lower on capital intensity.
D_ITC: The dummy is set to 1 if the firm can be viewed as part of ITC (information technology and
communication), for example IT software, telecom, media and entertainment. Firms producing
business software programs constitute a large part of the group.

S. Hallström & B. Yazdani, 2008 THE ESSENTIAL ROLE OF VENTURE CAPITAL
49
D_Helthcare: The dummy is set to 1 when healthcare is judged an appropriate category. Life science
and biotechnology takes part of this set.
D_Other : If the firm was not decide part of any of the other classifications, this dummy is set to 1.
Retail businesses, educational firms, recruitment agencies and other services are found here.
Informal VC presence. An independent dummy variable (D_BA) set to 1 if the firm has at least one
informal VC investment. This variable is used in regressions explaining the ownership of venture
capitalist firms.
Formal VC presence. Same as above, but for formal VCs and put into regressions where INFORMAL
VC ownership is the dependent variable (D_VC).
The dependent variables, BA_% and VC_%, are left censored. This means that the value will always
be zero or above and gravitate towards a lower level, i.e. to the left when depicted in a graph. Both of
the dependent variables will be found in the interval of 0 to 100 percent ownership. In order to
improve estimates, Tobit and Probit models are used and designed for left censored data. OLS
regression is also performed, but rather for comparative purposes since censored outcome variables
break against assumptions of OLS.
Other extraction of data
Additional data was collected from the IPO prospectuses, apart from that relating to the variables
described above.
Exit. Ownership of the investors just after the IPO, used together with ownership data from before IPO
as to build variables around exit behavior.
Board of directors. Information on individuals with seats on the firm boards. The presence of formal
and informal VC on the board was investigated through this information. This section of the
prospectuses was also used to some extent to define informal for its often rich information content.
Minority owners are usually added to a sum of “Other shareholders” in the prospectuses. This limits
data collection to some extent, but at the same time the low ownership levels come with a low level of
importance for the observations. The loss of important observations of formal and informal VCs is
hence judged minimal.
The entrepreneur and founder. Extorted in order to exclude entrepreneur ownership when defining
private investors, but also helpful for understanding which investors to exclude for family connections.
Hence a step in defining the informal VCs
Share data. Price and voting characteristics of the A and B shares respectively, useful for defining
capital ownership.

S. Hallström & B. Yazdani, 2008 THE ESSENTIAL ROLE OF VENTURE CAPITAL
50
App. 3. Firms included in the sample Included in the study:
Company name Year of foundation Date of IPO
A-Com 1993 04/11/1999 Advise 1989 27/03/1998 Adera 1983 10/06/1999 Arete 1980 19/12/1997 Audiodev 1987 20/09/2000 AU-System 1974 21/06/2000 Axis 1984 21/06/2000 BioGaia 1990 28/05/1998 BioInvent 1983 12/06/2001 Biora 1986 07/02/1997 Boss Media 1997 24/06/1999 BTS Group 1985 06/06/2001 Citymail 1996 24/06/1998 Clock 1976 08/07/1994 Connecta 1993 16/09/1999 ConNova 1992 09/12/1997 Cyber Com 1995 01/12/1999 Dimension 1988 20/02/2001 Effnet Group 1997 06/04/1999 Entra Data 1982 14/02/1997 Framtidsfabriken 1995 23/06/1999 Frango 1987 23/04/1999 Gandalf 1984 18/12/1997 Guide 1988 27/05/1998 HiQ International 1992 12/04/1999 IAR Systems 1983 07/06/2000 Impact Coating 1997 16/11/2004 IMS-Data 1986 21/12/1994 Information Highway 1994 19/06/1997 Intentia International 1984 22/11/1996 Jeeves 1992 09/04/1999 Jobline International 1997 14/11/2000 Karobio 1987 03/04/1998 Kipling 1995 29/07/1998 Lindvallen 1961 08/07/1994 Louise Gibeck 1978 11/12/1997 Luvit 1997 15/06/2000 M2S 1991 06/12/1999 Mekonomen 1973 29/05/2000 MSC Konsult 1987 19/05/1998 Neonet 1996 20/10/2000 Netwise 1990 New Wave Group 1990 11/12/1998

S. Hallström & B. Yazdani, 2008 THE ESSENTIAL ROLE OF VENTURE CAPITAL
51
Nilörngruppen 1972 19/11/1997 Nocom 1985 04/01/1998 Note 1999 23/06/2004 Novotek 1986 30/06/1999 ORC Software 1987 19/10/2000 Orexo 1995 09/11/2005 Owell Svenska 1990 08/03/1994 PCQT Holding 1990 25/04/2005 Poolia 1989 23/06/1999 Prevas 1985 29/05/1998 Profilgruppen 1981 19/06/1997 Prosolvia 1988 18/06/1997 Pyrosequencing 1997 30/06/2000 Q-med 1987 06/12/1999 Readsoft 1991 22/06/1999 Resco 1982 31/10/1996 Scandinavian PC Systems 1984 06/06/1997 Sectra 1978 03/03/1999 Semcon 1980 26/05/1997 Softronics 1984 03/12/1998 Synectics Medical 1976 22/04/1994 Tele1 Holding Europe 1995 16/03/2000 Teligent 1990 12/04/1999 TradeDoubler 1999 08/11/2005 Tripep 1997 14/07/2000 TV4 1984 15/04/1994 Viking Telecom 1988 30/05/2000 Vitrolife 1993 26/06/2001

S. Hallström & B. Yazdani, 2008 THE ESSENTIAL ROLE OF VENTURE CAPITAL
52
App. 4. Long-list of firms
1994 AssiDomän AB Autoliv AB Brukens Nordic AB Clock AB Cloetta AB Consilium AB Elekta AB Fastighetspartner NF AB Frigoscandia AB Fristads AB HEBA AB Hemstaden AB Höganäs AB IMS Data AB Kalmar Industries AB Kjessler & Mannerstråle AB Klippan AB Lindvallen AB Matteus AB Nobelpharma AB Nordic Tel AB Nordifa Gruppen AB Norrporten AB Owell AB Senea AB Stancia AB Synectics Medical AB TV 4 AB Verimation AB 1995 Meda AB Althin Medical AB BT industries AB Caran AB Cardo AB Fagerlid Industrier AB Frontec AB IRO AB Lindex AB PLM AB Segerström & Svensson AB The Empire AB 1996 Resco AB Biacore AB Dahl AB Intentia AB Medivir AB Nefab AB OXiGENE AB Peak Performance AB Scandic Hotels AB Scania AB 1997 Alfaskop AB Arete AB Arkivator AB
Artimplant AB Biora AB Castellum AB ConNova AB Daydream Software AB Entra Data AB FB Industri AB Gandalf AB Gibeck AB Handskmakarn AB Hemköpskedjan AB Information Highway AB Karlshamn AB Linné Group AB Mandator AB Maxim Pharaceuticals AB MTV Produktion AB Munters AB New Wave Group AB Nibe AB NK CityFastigheter AB North Atlantic Natural AB Pandox Hotellfastigheter AB Partnertech AB ProAct IT Group AB Profilgruppen AB Prosolvia AB Sardus AB Scandinavia PC System AB Semcon AB Sigma AB Svedbergs AB Svenska Orient Linien AB Ticket AB TMT One AB Wedins Norden AB 1998 Affärsstrategerna AB BioGaia Biologics AB Broström AB Citymail Sweden AB Fingerprint Cards AB Guide Konsult AB Karo Bio AB MSC Konsult AB Nilörngruppen AB Opcon AB Prevas AB Saab AB Softronic AB Tryckinvest i Norden AB 1999 A-Com AB Adera AB Boss Media AB Clas Ohlson AB Connecta AB
Cyber Com AB Digital Vision Sweden AB Enlight Interactive AB Framtidsfabriken AB Frango AB HiQ International AB Jeeves AB Kungsleden AB M2S AB Malmbergs Elektriska AB Naturkompaniet AB Nocom AB Novotek AB Poolia AB Proffice AB Q-Med AB Readsoft AB RKS AB Sectra AB Sorb Industri AB Telelogic AB Teligent AB 2000 AudioDev AB AU-System AB Axis AB Beijer Electronics Eniro AB IAR System AB JC AB Jobline International AB Mekonomen AB Micronic Laser Systems AB Mind AB Neonet AB Netwise AB Orc Software AB Pyrosequencing AB Scandinavia Online AB Tele1 Europe Holding AB Telia AB Tripep AB Viking Telecom AB 2001 BioInvent International AB BTS Group AB D. Carnegie & Co AB Dimension AB Retail and Brands AB Vitrolife AB 2002 Alfa Laval AB Ballingslöv International AB Intrum Justitia AB Nobia AB