the engineering profession: a statistical overview · the engineering profession: a statistical...
TRANSCRIPT

THE ENGINEERING PROFESSION:
A STATISTICAL OVERVIEW
Twelfth Edition, November 2015
The Engineering Profession: A Statistical Overview, ELEVENTH edition, October 2015
ISBN 978 1 922107 78 7 Author: Andre Kaspura
Email: [email protected] Institution of Engineers Australia 2015
All rights reserved. Other than brief extracts, no part of this publication may be reproduced in any form without the written consent of the publisher. The report can be downloaded at www.engineersaustralia.org.au
Public Affairs and Marketing Engineers Australia 11 National Circuit, Barton ACT 2600 Tel: 02 6270 6555 Email: [email protected]
www.engineersaustralia.org.au

Engineers Australia i
THE ENGINEERING PROFESSION: A STATISTICAL OVERVIEW, 2014
Engineers Australia ii
The Engineering Profession: A Statistical Overview, 2015
CONTENTS Chapter 1 Introduction 1
Main Points 1 1.1 Engineers and Engineering 1 1.2 Objective of the Statistical Overview 2 1.3 The Engineering Team 2 1.4 Competent Practicing Engineers 3 1.5 Data Sources and Caveats 4 1.6 What’s New in this Edition? 5
Chapter 2 Structural Features of the Labour Market 7 Main Points 7 2.1 Key Information 7 2.2 Labour Force Participation 8 2.3 Women in Engineering 9 2.4 Engineers and Engineering 9 2.5 Changes in Demand and Supply 10 2.6 Engineering is Dependent on Skilled Migration 10 2.7 Diversity and labour market Experience 10 2.8 The Source of Migrant Engineers 11
Chapter 3 The Engineering Labour Market over Time 13 Main Points 13
3.1 Background 13 3.2 Survey of Education and Work 14 3.3 Engineering Population 15 3.4 Participation Rates and the Supply of Engineers 16 3.5 The Demand for Engineers 17 3.6 Unemployment 18 3.7 Employment in Engineering Occupations 19
Chapter 4 Transition to Engineering Studies 22 Main Points 22 4.1 School Participation to Year 12 22 4.2 Participation in Science Subjects 23 4.3 Participation in Mathematics Subjects 25 4.4 Gender Differences 26 4.5 Basis of Admission to Bachelor Degrees 26 4.6 Transition from School to University Engineering Courses 28
Chapter 5 University Engineering Education 30 Main Points 30 5.1 Course Commencements 31 5.2 Student Enrolments 32 5.3 Course Completions 39 5.4 Annual Retention Rates for Bachelor Degrees 39 5.5 The Engineering Share of Course Completions 41 5.6 State and Territory Shares of Bachelor Degree Completions 43

Engineers Australia iii
The Engineering Profession: A Statistical Overview, 2015
Chapter 6 Developing Our Own Engineers 44 Main Points 44 6.1 Terminology 44 6.2 Labour Market Choices of New Graduates 46 6.3 Labour Market Experiences of New Graduates 47 6.4 Engineering Technologists 48 6.5 Professional Engineers 49 6.6 Associate Engineers 51 6.7 Annual Additions to Supply 53
Chapter 7 Skilled Migration 56 Main Points 56 7.1 Australia’s Skilled Migration Policy 56 7.2 Assessing Overseas Engineering Qualifications 57 7.3 Skilled Migration and the Supply of Engineers 58 7.4 Permanent Visas 60 7.5 Temporary Visas 62
Chapter 8 Engineers in Industry 65 Main Points 65 8.1 The ABS Industry System 65 8.2 Broad Characterization of Engineering Work 66 8.3 Employment at Sub-Division Level 68 8.4 What Industries Employ the Most Engineers? 68
Chapter 9 Geographic Distribution 77 Main Points 77 9.1 The ABS Approach to Geographic Statistics 77 9.2 New South Wales 77 9.3 Victoria 78 9.4 Queensland 78 9.5 South Australia 79 9.6 Western Australia 79 9.7 Tasmania 79 9.8 The Territories 80
Chapter 10 Engineering Specialisations 86 Main Points 86 10.1 Engineering Courses and Engineering Specialisation 86 10.2 Broad Specialist Areas of Engineering 88 10.3 Detailed Engineering Streams 89
Chapter 11 Average Ages and Age Structure 92 Main Points 92 11.1 Average Ages of Engineers 92 11.2 Age Structure and how it has changed 93 11.3 Age and Labour Force Participation 96
Chapter 12 Experience, Remuneration and Age 98 Main Points 98 12.1 The Framework Used 98 12.2 Experience 99

Engineers Australia iv
The Engineering Profession: A Statistical Overview, 2015
12.3 Average Ages 101 12.4 Salary Movements 104
Chapter 13 Indicators for the Engineering Labour Market 107
Main Points 107 13.1 The Need for Change Indicators 107 13.2 Trends in Engineering Construction 108 13.3 Vacancies for Engineers 113
Chapter 14 The Engineering Labour Market in 2015 115 Main Points 115 14.1 Assessing the Engineering Labour Market 115 14.2 Supply of Engineers 116 14.3 Demand for Engineers 116

Engineers Australia v
The Engineering Profession: A Statistical Overview, 2015
LIST OF TABLES Chapter 2
Table 2.1: The Engineering Labour Markets in 2006 and 2011 8 Table 2.2: Labour Force Participation in Australia 9
Chapter 3 Table 3.1: Employment Growth in Engineering Compared to Other Groups 18
Chapter 4 Table 4.1: Year 12 School Students, Australia 23 Table 4.2: Participation in Year 12 Science Subjects 24 Table 4.3: Participation in Year 12 Science Subjects 25
Chapter 5 Table 5.1: Domestic Students Commencing Engineering and Related
Technology Courses 33 Table 5.2: Overseas Students Commencing Engineering and Related
Technology Courses 33 Table 5.3: Students Commencing Engineering and Related Technology
Courses, by Country of Domicile 34 Table 5.4: Students Commencing Engineering and Related Technology
Courses, by Gender 34 Table 5.5: Domestic Students Enrolled in Engineering and Related
Technology Courses 35 Table 5.6: Overseas Students Enrolled in Engineering and Related
Technology Courses 35 Table 5.7: Students Enrolled in Engineering and Related Technology
Courses, by Country of Domicile 36 Table 5.8: Students Enrolled in Engineering and Related Technology
Courses, by Gender 36 Table 5.9: Domestic Students Completing Engineering and Related
Technology Courses 37 Table 5.10: Overseas Students Completing Engineering and Related
Technology Courses 37 Table 5.11: Students Completing Engineering and Related Technology
Courses, by Country of Domicile 38 Table 5.12: Students Completing Engineering and Related Technology
Courses, by Gender 38 Table 5.13: Annual Retention Rates for Bachelor Degree Students, in Engineering And in Institution 40
Chapter 6 Table 6.1 Domestic Students Completing Three Year Bachelors Degrees in Engineering 48 Table 6.2 Domestic Students Completing Four Year Bachelors Degrees in Engineering 50 Table 6.3 Domestic Students Completing Four Year Bachelor Double
Degrees in Engineering 50
Engineers Australia vi
The Engineering Profession: A Statistical Overview, 2015
Table 6.4 Domestic Students Completing Associate Degrees and Advanced Diplomas in Engineering at Universities 52
Table 6.5 Completions of Associate Degrees and Advanced Diplomas in Engineering from Australian TAFE Colleges 52
Table 6.7 Changes in the Supply of Engineers as a Result of Domestic Course Completions 53
Chapter 7 Table 7.1 The Stock of Skilled Migrants Added to the Australian
Supply of Engineers 58 Table 7.2 New Permanent Migration Visas for Engineering Occupations 61 Table 7.3 Temporary 457 Visas Granted, Engineering Team 62 Table 7.4: Stock of 457 Visa Holders, Engineering Team 62 Table 7.5 New Temporary 457 Visas Granted, Australia, 2005-06 to 2014-15 64
Chapter 8 Table 8.1 A Broad Look at Engineers in Australian Industry 66 Table 8.2: Engineering Employment in Sub-Division Industries 74
Chapter 9 Table 9.1: The Distribution of the Engineering Labour Force Throughout NSW, 2011 81 Table 9.2: The Distribution of the Engineering Labour Force throughout Victoria, 2011 82 Table 9.3: The Distribution of the Engineering Labour Force Throughout
Queensland, 2011 83 Table 9.4: The Distribution of the Engineering Labour Force Throughout
South Australia, 2011 84 Table 9.5: The Distribution of the Engineering Labour Force Throughout
Western Australia, 2011 84 Table 9.6: The Distribution of the Engineering Labour Force Throughout
Tasmania, 2011 85
Chapter 10 Table 10.1: The Engineering Labour Force, Broad Streams of Engineering Education, 2006 and 2011 87 Table 10.2: The Engineering Labour Force, Detailed Streams of Engineering Education, 2006 90 Table 10.3: The Engineering Labour Force, Detailed Streams of Engineering Education, 2011 91
Chapter 11 Table 11.1 The Average Age of the Engineering Labour Force 93 Table 11.2 The Age Structure of the Engineering Labour Force, 2006 and 2011 93
Chapter 12 Table 12.1 Average Experience of Professional Engineers in the Private Sector 100 Table 12.2 Average Experience of Public Sector Professional Engineers 100 Table 12.3 Average Age of Private Sector Professional Engineers 102 Table 12.4 Average Age of Public Sector Professional Engineers 103

Engineers Australia vii
The Engineering Profession: A Statistical Overview, 2015
Table 12.5 Average Salary Packages for Professional Engineers in the Private Sector 104 Table 12.6 Average Salary Packages for Professional Engineers in the Public Sector 104 Table 12.8 Average Growth in Professional Engineer Salary Packages 106
Chapter 13 Table 13.1: Summary of Average Growth Rates, Infrastructure Components, Private and Public Sectors 110 Table 13.2: Summary of Average Annual Growth Rates Main Components, Engineering Construction 110
Engineers Australia viii
The Engineering Profession: A Statistical Overview, 2015
LIST OF ILLUSTRATIONS Chapter 2 Figure 2.1: Overseas Qualified Engineers in 2011, Regions of Birth and Time of Arrival in Australia 12
Chapter 3 Figure 3.1: The Engineering population since 2001 15 Figure 3.2: Labour Force Participation of Engineers Compared to Other
Segments of the Labour Force 16 Figure 3.3: Labour Force Participation, Engineering Team
Compared to Period Average 17 Figure 3.4: Engineering Unemployment Rates Compared to Other Groups 19 Figure 3.5: The Relationship between the Supply of Engineers and
Employment in Engineering Occupations 20
Chapter 4 Figure 4.1: Participation Rates for Students Progressing From Year 10 to Year 12 23 Figure 4.2: Participation in Year 12 Physics and Chemistry Subjects 24 Figure 4.3: The Gender Shares in Year 12 Science and
Mathematics Subjects in 2012 26 Figure 4.4: The Basis for Admission to Bachelor Degrees, Domestic Students 27 Figure 4.5: The Basis for Admission to Bachelor Degrees, Overseas Students 27 Figure 4.6: Applications for, Offers Made and Acceptances of Places in University
Engineering Courses, 2001 to 2014 28 Figure 4.7: Offers Made by Universities by ATAR Scores, Engineering and Offers in Total, 2013 and 2014 28 Figure 4.8: Offers to Students with ATAR Scores Above 90 29
Chapter 5 Figure 5.1: Engineering Share of Total Course Completions 41 Figure 5.2: The Engineering Share of Doctoral Degree Completions 41 Figure 5.3: The Engineering Share of Coursework Masters Degree Completions 42 Figure 5.4: The Engineering Share Of Bachelors Degree Completions 42
Chapter 6 Figure 6.1: The Destination of New Engineering Graduates Compared to New Graduates in General, 2009 to 2013 46 Figure 6.2: Labour Market Outcomes for New Graduates: Engineering Compared to All Fields, 2009 to 2014 47 Figure 6.3: Changes in the Potential Supply of Engineers from New Course Completions 54 Figure 6.4: The Proportion of Women in Course Completions 54
Engineers Australia ix
The Engineering Profession: A Statistical Overview, 2015
Chapter 7 Figure 7.1 Additions to the Supply of Engineers from Skilled Migration 59 Figure 7.2 The Impact of Skilled Migration on the Supply of Engineers 59 Figure 7.3 Permanent Visas Granted to Engineering Occupations 60 Figure 7.4 New 457 Visa Approvals by Jurisdiction 63 Figure 7.5 Trends in Temporary 457 Visa Engineers 63
Chapter 8 Figure 8.1 The Distribution of Engineers by Industry Sector, 2011 66 Figure 8.2 The Distribution of Engineers Employed in Engineering Occupations by Sector, 2011 67
Chapter 11 Figure 11.1 The Age Structure of the Engineering Labour Force in 2011
And how it has changed since 2006 94 Figure 11.2 The Age Structure of Engineers in Engineering Occupations in 2011
And how it has changed since 2006 95 Figure 11.3 Labour Force Participation of Engineers and Age Structure 96 Figure 11.4 The Age Profile of Labour Force Participation in Engineering Compared to All Skilled Areas, 2011 97
Chapter 12 Figure 12.1 Comparing Average Work Experience of Professional Engineers in the Private and Public Sectors 100 Figure 12.2 Change in Average Experience Levels for Private Sector Professional Engineers 101 Figure 12.3 Change in Average Experience Levels for Public Sector Professional Engineers 101 Figure 12.4 Average Ages of Professional Engineers in the Private and Public Sectors 102 Figure 12.5 Average Ages of Professional Engineers in the Private Sector 103 Figure 12.6 Average Age of Professional Engineers in the Public Sector 103 Figure 12.7 Trends in Engineering Salary Packages, Private and Public Sectors 105
Chapter 13 Figure 13.1 Cumulative Private and Public Sector Engineering Construction, 1990-91 to 2014-15 109 Figure 13.2 Trends in the Main Components of Public Sector
Engineering Construction, 1990-91 to 2014-15 109 Figure 13.3 Trends in the Main Components of private Sector
Engineering Construction, 1990-91 to 2014-15 109 Figure 13.4 The Public Sector Engineering Construction Pipeline 111 Figure 13.5 The Private Sector Engineering Construction Pipeline 112 Figure 13.6 Vacancies for Engineers Compared to Professional and
All Vacancies, January 2006 to September 2015 113 Figure 13.7 Vacancies for Engineers, NSW and Victoria Compared to Australia 114 Figure 13.8 Vacancies for Engineers, Major resource States Compared to Australia 115 Figure 13.9 Vacancies for Engineers, SA Tasmania & Territories Compared to Australia 115

Engineers Australia 1
The Engineering Profession: A Statistical Overview, 2015
Chapter 1: Introduction
Main Points This Chapter describes the educational qualifications necessary to be part of the engineering team in Australia. The role of the Statistical Overview in piecing together fragmented labour market statistics on engineers and engineering is briefly explained as are key definitions used throughout the Report. This edition updates statistics on trends in education, skilled migration and the characteristics of engineers. Structural characteristics of the engineering labour force based on 2006 and 2011 census statistics are repeated from last year. New material in this edition is a time series analysis of the demand for and supply of engineers using statistics from the ABS Survey of Education and Work.
1.1: Engineers and Engineering Engineers and engineering are indispensable contributors to Australian prosperity and lifestyles. Engineering services are embodied in almost every good or service consumed or used by Australians, now and in the future. In this respect, engineers are the enablers of productivity growth through their role in converting “brilliant ideas” into new products, new processes and new services. Engineers also ensure that society gets the most out of existing facilities through optimising their operations and maintenance.
Fully competent engineers hold accredited academic credentials in engineering and have then satisfactorily completed a process of professional formation that bridges the gap between academic studies and engineering practice. The time necessary to become an engineer is very long, academic studies are specific and highly analytical and the skills of engineering practice are vital to successful outcomes for the individual and society.
Engineering is not homogeneous and there are numerous areas of engineering practice. To some degree specialisation begins with academic studies, for example, students can choose between degrees in mechanical engineering, civil engineering or electrical engineering. Most specialisation, however, takes place through on-the-job practice during professional formation, for example, a graduate with a degree in civil engineering can choose to practice as a structural engineer, a geotechnical engineer, a coastal engineer or as a civil engineer. More detail on engineering specialisations can be found at www.engineersaustralia.org.au/professional-development/what-engineering
Engineering skills and expertise are unique and other skills cannot substitute for them. When engineering decisions made by engineers are over-ruled by general managers, administrators, accountants, lawyers or politicians, outcomes will be problematic. This has become particularly evident in government procurement of infrastructure and/or highly technical equipment by agencies where engineering positions have been abolished and not replaced by arrangements with the technical competence to formulate engineering decisions and recommendations. There are a host of examples that demonstrate how such short term cost savings have resulted in damaging and expensive outcomes1.
In contrast, the training, skills and experience of engineers are transferable to many other fields of work where they are highly valued. As a consequence qualified engineers are employed in most occupations in the Australian economy, and only about 60% are employed in occupations closely related to engineering. The other 40% are employed in a range of other occupations where analytical and problem solving ability is required. This result means that retaining trained engineers in the profession is just as important as encouraging more people to study and complete engineering qualifications.
1 See for example www.anao.gov.au

Engineers Australia 2
The Engineering Profession: A Statistical Overview, 2015
1.2: Objective of the Statistical Overview Engineers Australia was formed to advance the science and practice of engineering for the benefit of the community. Engineers Australia sets and maintains professional standards for its members consistent with international benchmarks, encourages the development of engineering knowledge and competencies, facilitates the exchange of ideas and information and informs community leaders and decision makers about engineers and engineering issues.
This objective can best be achieved through the dissemination of factual information about engineers and about broader policy issues that involve engineering. The Statistical Overview contributes to these efforts by compiling statistics about engineers in Australia, how many of them practice their profession and where, and the circumstances of their work. The Statistical Overview fills a gap created by the fragmented nature of Australian statistics relating to specific professions.
At the macroeconomic level, high quality statistics to assist labour market policy decisions are available monthly. Unfortunately, Labour Force Survey statistics have not included educational attainment, an overwhelming difficulty when such qualifications are mandatory for entry to the profession. Some analysts have chosen to ignore these limitations and have used occupational breakdowns with no educational constraint2. These apples and oranges comparisons add little to satisfactory policy analysis.
The ABS has recognised this problem in recent revisions to the Labour Force Survey. From May 2015 statistics incorporating educational attainment will be available quarterly. This means that contemporary statistics for the engineering labour market that are directly comparable to the labour market as a whole will become available. Some delay,
The interests of Engineers Australia are best served by compiling statistics that represent the engineering profession as closely as possible and that begins by ensuring that those included in statistical counts are actually qualified to be considered part of the profession. This objective can be achieved, to varying degrees, by building on several sources of official statistics, and some unofficial sources, within the structures of well-known labour market definitions, employing as far as possible the statistical classifications of Australia’s official statistical agency the Australian Bureau of Statistics (ABS). The Statistical Overview has employed an incremental approach improving and refining statistics and adding new ones each edition. The framework for arranging statistics is a simple stock formulation; the opening stock plus additions less losses is the closing stock. The collection is far from complete and several important gaps remain, notably statistics on the retirement of older engineers. However, improvements continue to be made so that the Statistical Overview represents a comprehensive and consolidated collection of Australian statistics on engineers and engineering.
1.3: The Engineering Team In Australia the engineering profession is organised into the engineering team. The engineering team comprises Professional Engineers, Engineering Technologists and Engineering Associates. The three groups are differentiated by educational qualifications, which in conjunction with the process of professional formation undertaken, shape the engineer’s degree of conceptualisation and independent decision-making and so determine the complementarity between the groups in engineering practice. In detail, the roles of the three groups are:
Professional Engineers apply lifelong learning, critical perception and engineering judgment to the performance of engineering services. Professional Engineers challenge current thinking and conceptualise alternative approaches, often engaging in research and development of new engineering
2 See for example the Issues Paper released by the Australian Workplace and Productivity Agency (AWPA) in support of their study of the engineering labour force, www.awpa.gov.au/our-work/sector-specific-skill-needs/Pages?Engineering-workforce-study.aspx

Engineers Australia 3
The Engineering Profession: A Statistical Overview, 2015
principles, technologies and materials. Professional Engineers apply their analytical skills and well developed grasp of scientific principles and engineering theory to design original and novel solutions to complex problems. Professional Engineers exercise a disciplined and systematic approach to innovation and creativity, comprehension of risks and benefits and use informed professional judgment to select optimal solutions and to justify and defend these selections to clients, colleagues and the community. Professional Engineers require at least the equivalent of the competencies in a four year full time Bachelor’s Degrees in engineering.
Engineering Technologists exercise ingenuity, originality and understanding in adapting and applying technologies, developing related new technologies or applying scientific knowledge within their specialised environment. The education, expertise and analytical skills of Engineering Technologists equip them with a robust understanding of the theoretical and practical application of engineering and technical principles. Within their specialisation, Engineering Technologists contribute to the improvement of standards and codes of practise and the adaptation of established technologies to new situations. Engineering Technologists require at least the equivalent of the competencies in a three year full time Bachelor Degree in engineering.
Engineering Associates apply detailed knowledge of standards and codes of practice to selecting, specifying, installing, commissioning, monitoring, maintaining, repairing and modifying complex assets such as structures, plant, equipment, components and systems. The education, training and experience of Engineering Associates equip them with the necessary theoretical knowledge and analytical skills for testing, fault diagnosis and understanding the limitations of complex assets in familiar operating situations. Engineering Associates require at least the equivalent of the competencies in a two year full time Associate Degree in engineering or a two year full time Advanced Diploma in engineering from a university or TAFE college.
1.4 Competent Practicing Engineers Engineers Australia believes that formal qualifications in engineering are the first step towards becoming a competent practicing engineer. Demonstrating professional competence is a common feature of most professions, but in engineering professional formation is entirely an on-the-job process. An important reason for an on-the-job process is that specialisation in engineering primarily takes place when new graduates begin their practical careers. Engineers Australia recognises at least forty-five different fields of engineering practice. Many are indispensable in modern societies, yet involve relatively small numbers. This diversity means that formal course programs as conducted in some professions are impractical.
Successful completion of professional formation is recognised at two levels. To become competent practicing engineers, new graduates must satisfy six criteria:
• Hold accredited qualifications in engineering consistent with the engineering team.
• Undertaken professional formation for a period of up to five years under the supervision of a competent practising engineer.
• Accept and adhere to an approved code of ethics for the practice of engineering.
• Demonstrate that professional formation was acquired in a risk management environment that satisfies relevant Australian risk management standards and an understanding of these standards and how they apply to engineering practice.
• Fully appeciate the need for, and importance of, consumer protection and demonstrate that their practice is covered by one of six options for consumer protection.
Engineers Australia 4
The Engineering Profession: A Statistical Overview, 2015
Engineers Australia recognises highly experienced engineers by the conferring of Chartered Status. To become a Chartered Engineer, competent practicing engineers must additionally demonstrate that they satisfy sixteen competencies recognised and audited internationally in their field of expertise. Chartered engineers are acknowledged leaders in engineering practice. Many professions, like doctors, lawyers or accountants, are regulated by governments and practitioners are unable to operate unless registered. Registration in these cases verifies that individuals have the necessary educational qualifications, have satisfied the standards necessary to be admitted to practice adhere to an appropriate code of ethical conduct and are subject to legal sanction if they practice unethically or negligently. Similar registration provisions apply to common trades like plumbers and electricians. However, except for Queensland, Commonwealth, State and Territories Governments have decided that registration of engineers is not necessary and that self-regulation is preferred.
The voluntary regulation of standards for engineers is one of Engineers Australia’s most important functions. The framework is complex but covers the full range of matters relevant to engineering practice:
• Accreditation of university engineering courses consistent with competencies agreed and audited by the International Engineering Alliance.
• Arrangements for the recognition of competent practicing engineers a Professional Standards Scheme for engineers consistent with existing legislative provisions of Commonwealth, State and Territory governments.
• Arrangements for the conferring of Chartered Status for competent practicing engineers that demonstrate their leadership and engineering capacities against sixteen competencies agreed and audited by the International Engineering Alliance.
• Learned Society arrangements to lead and facilitate advancement of engineering knowledge and practice in numerous specialist fields.
• Arrangements which ensure all members reaffirm the Engineers Australia code of ethics each year when membership is renewed and arrangements for dealing with complaints against members regarding the code of ethics.
1.5: Data Sources and Caveats The three primary sources of official statistics used in the Statistical Overview are the Australian Bureau of Statistics (ABS), the Department of Education and Training (DET) and the Department of Immigration and Border Control (DIBC). The ABS is the official Australian statistical agency and as such is responsible for statistical classification systems and these are used by the other agencies mentioned. From time to time, ABS classification systems change and time delays in the adoption of new systems can cause differences between agencies. There are no such problems at present.
This apparent straight-forward situation does contain some inherent limitations. The most notable one being classification of individuals according to their highest qualification. Thus, a practicing engineer who holds an MBA as well a Bachelor degree in engineering is counted as belonging to the field of their highest qualification. There are numerous other minor issues that do not always accord with our preferences, but because classification systems deal with them consistently over time, any impact on trends is negligible.
The ABS is the source for census statistics covered in the Statistical Overview. These statistics are extracted by Engineers Australia using the ABS TableBuilder facility. The Department of Education and Training is the primary source for higher education statistics and the Department of Immigration and Border Control is the primary source for statistics on skilled migrants granted visas. Limited statistics on TAFE completions are extracted from the National Centre for Vocational Education Research (NCVER) Vocstats system.
Non-official statistics are sourced from a number of sources. For the last eight years, Engineers Australia has included several questions on recruiting difficulties experienced by engineering employers in an

Engineers Australia 5
The Engineering Profession: A Statistical Overview, 2015
annual salaries survey conducted by its subsidiary, Engineers Media. This survey is appropriate because survey respondents, HR managers and business principals, are likely to be better informed about recruiting difficulties than individual engineers. On the other hand, statistics on the characteristics of engineers are better reflected in statistics collected by Professions Australia whose survey respondents are individual engineers. Graduate Careers Council statistics are used to inform the progress of new engineering graduates. Unfortunately, these sources do not employ ABS classification systems making it difficult to compare statistics with official sources.
Engineering is a profession and not simply an occupation; how an engineer is qualified and what he/she does with acquired knowledge and expertise both are important. In common with every field of academic study, completion of engineering qualifications does not necessarily mean that an individual follows a career path closely associated with engineering. The Statistical Overview employs two distinct measures to differentiate between people who have engineering qualifications essential for inclusion in the engineering team and those members of this group who choose employment in engineering.
• The first measure is the conventional economists definition of the labour force constrained to engineering, in other words, the engineering labour force comprises all people with recognised engineering qualifications who are actively engaged in the labour market by being employed or if unemployed, actively seeking work. The engineering labour force is also called the supply of qualified engineers.
• The second measure is based on research by Engineers Australia which identified 52 of 358 four-digit ANZSCO occupations as engineering occupations3. These occupations are not constrained by narrow occupational nomenclature but recognise the wide range of work that engineers are engaged in and recognise the range of occupations that engineers move in typical careers. This measure is the number of qualified engineers retained in work closely related to engineering.
Differentiating between these measures has important policy implications. At one level, encouraging more young people to study and complete recognised engineering qualifications is an important aspect of increasing the supply of qualified engineers. However, when skill shortages occur from time to time, the problem is not just a shortage of qualified engineers, the number of engineers retained in engineering work can be just as, and sometimes more, important.
1.6: What’s New in this Edition? As has been the case in past Editions, a wide range of statistics on engineers and engineering are updated as far as possible. This includes statistics on engineering education including the preparatory stages, skilled migration, experience levels, salary packages and average ages. Statistics obtained from the Graduate Careers Council are also updated. Statistics obtained from the 2006 and 2011 censuses are reproduced, sometimes in restructured form.
One of the disadvantages of census statistics is that with the passage of time they lose contemporary relevance as indicators of labour market circumstances. Since the 2011 census, demand for engineers briefly spiked after the GFC and then collapsed. Although trends in vacancy statistics demonstrate this behaviour, conventional measures of employment, labour supply and unemployment are more useful. Chapter 3 describes the application of ABS statistics from the Survey of Education and Work for this purpose. In time this approach will become unnecessary because the ABS has amended the Labour Force Survey to include educational attainment, a key factor to extend this survey to cover professional groups. However, statistics will need to be accumulated for a few years to be useful.
Other new statistics include statistics on year 12 enrolments in science and mathematics subjects, statistics from the Graduate Careers Council on the pathways chosen by new graduates, including further full time studies and participation in the labour market. Census statistics on the industry
3 Engineers Australia, The Engineering Profession in Australia; A Profile from the 2006 Population Census, September 2010, www.engineersaustralia.org.au

Engineers Australia 6
The Engineering Profession: A Statistical Overview, 2015
distribution of engineers has been redesigned to draw out how engineers fit into the characterisation of Australia as a services economy. For the first time, statistics on the stock of 457 temporary visa holders in Australia are reported as well as statistics on new 457 visas approved significantly improving understanding of the link between skilled migration and the supply of engineers. This year, the Engineering Recruitment Difficulties Survey has been discontinued.
An important change is the approach used in Chapter 13 and 14 to assess the status of the engineering labour market in 2015. As before engineering construction and vacancies are used as indicators of change. The precision is the use of engineering construction has been improved and the Beveridge curve used to underpin interpretation of vacancies trends. Vacancies trends are linked to the time series labour force statistics in chapter 3.

Engineers Australia 7
The Engineering Profession: A Statistical Overview, 2015
Chapter 2: Structural Features of the Labour Market Main Points This Chapter reviews some important structural features of the engineering labour market based on comparisons between 2006 and 2011 census statistics.
Labour force participation for the engineering team is high, but not markedly different from other skills areas where the same levels of qualifications are required. The key difference is that more engineers work full time and fewer work part time than other skilled workers and the labour force as a whole. From the perspective of hours worked these points suggest that labour force participation is particularly high in engineering.
The participation of women in engineering remains very low compared to other skills and the labour force as a whole. This is despite quite high growth in the supply of women engineers.
Contrary to many perceptions, people who have engineering qualifications do not all pursue careers in engineering. Many find employment in the skilled labour force and apply acquired analytical and problem solving skills to more general problems instead of engineering problems. This observation changes how we should view skills shortages as far as engineers are concerned. When shortages occur the problem is not necessarily solved by increasing the number of people with engineering qualifications irrespective of whether they are sourced from Australian universities and colleges or from skilled migration. Retention of qualified people in engineering is the issue and requires entirely different policies.
Retention of qualified engineers in engineering varies by gender and ethnicity. Fewer women than men employ engineering qualifications in engineering and fewer skilled migrants than Australian born engineers employ their engineering qualifications in engineering. The proportion of skilled migrants retained in engineering is particularly low.
Engineering in Australia has become excessively dependent on skilled migration. This was the case prior to 2006, but by 2011 the overseas born component of the profession grew to a majority 53.9% because over 70% of the increase in supply was from skilled migration. In comparison, in 2011 38.4% of the skilled workforce was overseas born as was 27.7% of the overall labour force.
Consistent with the overall migration intake, the source countries for Australia’s intakes of skilled migrant engineers has changed. Migrant engineers come to Australia from most regions of the world. Traditional source countries in North Western Europe remain important but their shares have fallen. In recent years the largest intakes have been from countries in the Southern and Central Asian region. There are increasing numbers of engineers coming from the Americas.
2.1 Key Information The key statistics that describe the engineering labour force and population in 2006 and 2011 are shown in Table 2.1. These statistics were compiled from the ABS 2006 and 2011 censuses data bases using the ABS TableBuilder facility.
In 2011, 322,523 Australians held engineering qualifications consistent with the engineering team; 263,890 actively participated in the labour market with 254,515 being employed and 9,375 being unemployed but actively looking for work. The remainder, 58,633, were not active in the labour market. The majority of these people were retired from the labour market with 69.4% aged 55 years or more. This proportion was even higher for men with 77.8% aged 55 years or more. However, the largest group

Engineers Australia 8
The Engineering Profession: A Statistical Overview, 2015
of women not in the labour force, 42.2%, were aged from 25 to 39 years, often regarded as child rearing years.
There are a number of features of Table 2.1 that warrant comment. Most of these have shown little change over the period shown in the Table and it is likely that any change since 2011 has been minor. Some features not covered by Table 2.1 are also covered. The years between 2006 and 2011 covered the height of the resources boom which had profound effects on the engineering labour market. The resources boom has now transition from the construction of extraction, processing and transportation facilities to the production and sale of resources. Far fewer engineers are needed in this phase and combined with a pronounced slow down in infrastructure development and construction generally has led to a collapse in the demand for engineers which cannot be captured using 2011 census statistics. A more detailed examination of changes in the engineering labour market is left until Chapter 3.
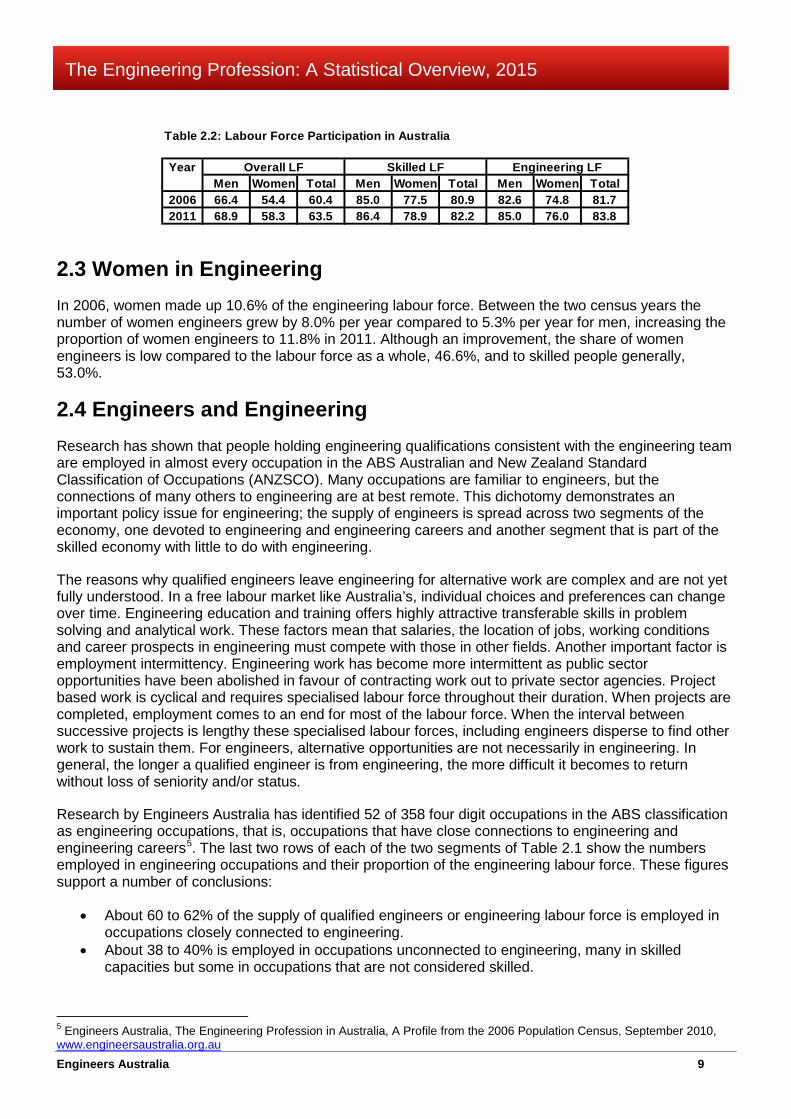
2.2 Labour Force Participation In Australia, engineering is part of the generalisation that more educated people have higher labour force participation. This is demonstrated in Table 2.2 which compares engineering to other skilled groups4 and the general labour force. Labour force participation in engineering is comparable to participation in other skills and participation in both groups is about twenty percentage points higher than in the labour force as a whole. The labour force participation of skilled women whether in engineering or other areas is about ten percentage points lower than for men, a point in common with the overall labour force.
4 When engineering is compared to other skills, qualifications of a level comparable to the engineering team are assumed, that is, at least an associate degree or an advanced diploma.
Table 2.1: The Engineering Labour Markets in the 2006 and 2011 Censuses
2006 CensusLabour force
status Men Women Total Men Women Total Men Women TotalEmployed FT 79915 5794 85709 68051 8365 76416 147966 14159 162125Employed PT 9041 1954 10995 9864 2830 12694 18905 4784 23689
Employed away 4323 558 4881 3297 578 3875 7620 1136 8756TOTAL EMPLOYED 93279 8306 101585 81212 11773 92985 174491 20079 194570
Unemployed (FT) 1309 108 1417 2421 499 2920 3730 607 4337Unemployed (PT) 330 87 417 897 394 1291 1227 481 1708
TOTAL UNEMPLOYED 1639 195 1834 3318 893 4211 4957 1088 6045LABOUR FORCE 94918 8501 103419 84530 12666 97196 179448 21167 200615
Not in labour force 18871 2107 20978 19021 5017 24038 37892 7124 45016ENGINEERING POPULATION 113789 10608 124397 103551 17683 121234 217340 28291 245631
Participation Rate (%) 83.4 80.1 83.1 81.6 71.6 80.2 82.6 74.8 81.7Unemployment Rate (%) 1.7 2.3 1.8 3.9 7.1 4.3 2.8 5.1 3.0
Employed in Engineering 65973 4970 70943 46313 5002 51315 112286 9972 122258% in Engineering 69.5 58.5 68.6 54.8 39.5 52.8 62.6 47.1 60.9
2011 CensusEmployed FT 92614 6785 99399 98910 13214 112124 191524 19999 211523Employed PT 11103 2807 13910 13772 4651 18423 24875 7458 32333
Employed away 4776 794 5570 4148 941 5089 8924 1735 10659TOTAL EMPLOYED 108493 10386 118879 116830 18806 135636 225323 29192 254515
Unemployed (FT) 1888 156 2044 3815 1001 4816 5703 1157 6860Unemployed (PT) 485 120 605 1291 619 1910 1776 739 2515
TOTAL UNEMPLOYED 2373 276 2649 5106 1620 6726 7479 1896 9375LABOUR FORCE 110866 10662 121528 121936 20426 142362 232802 31088 263890
Not in labour force 22867 2476 25343 25418 7872 33290 48285 10348 58633ENGINEERING POPULATION 133733 13138 146871 147354 28298 175652 281087 41436 322523
Participation Rate (%) 82.9 81.2 82.7 82.8 72.2 81.0 82.8 75.0 81.8Unemployment Rate (%) 2.1 2.6 2.2 4.2 7.9 4.7 3.2 6.1 3.6
Employed in Engineering 78290 6636 84926 69710 9276 78986 148000 15912 163912% in Engineering 70.6 62.2 69.9 57.2 45.4 55.5 63.6 51.2 62.1
Source: Compiled using the ABS TableBuilder Pro Facility
Australian Born Overseas Born Engineering Team
Engineers Australia 9
The Engineering Profession: A Statistical Overview, 2015
2.3 Women in Engineering In 2006, women made up 10.6% of the engineering labour force. Between the two census years the number of women engineers grew by 8.0% per year compared to 5.3% per year for men, increasing the proportion of women engineers to 11.8% in 2011. Although an improvement, the share of women engineers is low compared to the labour force as a whole, 46.6%, and to skilled people generally, 53.0%.
2.4 Engineers and Engineering Research has shown that people holding engineering qualifications consistent with the engineering team are employed in almost every occupation in the ABS Australian and New Zealand Standard Classification of Occupations (ANZSCO). Many occupations are familiar to engineers, but the connections of many others to engineering are at best remote. This dichotomy demonstrates an important policy issue for engineering; the supply of engineers is spread across two segments of the economy, one devoted to engineering and engineering careers and another segment that is part of the skilled economy with little to do with engineering.
The reasons why qualified engineers leave engineering for alternative work are complex and are not yet fully understood. In a free labour market like Australia’s, individual choices and preferences can change over time. Engineering education and training offers highly attractive transferable skills in problem solving and analytical work. These factors mean that salaries, the location of jobs, working conditions and career prospects in engineering must compete with those in other fields. Another important factor is employment intermittency. Engineering work has become more intermittent as public sector opportunities have been abolished in favour of contracting work out to private sector agencies. Project based work is cyclical and requires specialised labour force throughout their duration. When projects are completed, employment comes to an end for most of the labour force. When the interval between successive projects is lengthy these specialised labour forces, including engineers disperse to find other work to sustain them. For engineers, alternative opportunities are not necessarily in engineering. In general, the longer a qualified engineer is from engineering, the more difficult it becomes to return without loss of seniority and/or status.
Research by Engineers Australia has identified 52 of 358 four digit occupations in the ABS classification as engineering occupations, that is, occupations that have close connections to engineering and engineering careers5. The last two rows of each of the two segments of Table 2.1 show the numbers employed in engineering occupations and their proportion of the engineering labour force. These figures support a number of conclusions:
• About 60 to 62% of the supply of qualified engineers or engineering labour force is employed in occupations closely connected to engineering.
• About 38 to 40% is employed in occupations unconnected to engineering, many in skilled capacities but some in occupations that are not considered skilled.
5 Engineers Australia, The Engineering Profession in Australia, A Profile from the 2006 Population Census, September 2010, www.engineersaustralia.org.au
Table 2.2: Labour Force Participation in Australia
YearMen Women Total Men Women Total Men Women Total
2006 66.4 54.4 60.4 85.0 77.5 80.9 82.6 74.8 81.72011 68.9 58.3 63.5 86.4 78.9 82.2 85.0 76.0 83.8
Overall LF Skilled LF Engineering LF
Engineers Australia 10
The Engineering Profession: A Statistical Overview, 2015
• The proportion of qualified engineers retained in engineering related occupations depends on gender and ethnicity. Fewer women are retained in engineering than men and fewer overseas born qualified engineers are retained in engineering than Australian born.
2.5 Changes in Demand and Supply Both the supply of, and demand for engineers grew strongly between 2006 and 2011. Table 2.1 shows that the supply of engineers increased by 63,275 or 31.5% from 200,615 to 263,890. This change was equivalent to average annual compound growth of 5.6%. The change in demand for engineers was slightly less; 59,945 or 30.8% increasing demand from 194,570 to 254,515. This was equivalent to average annual growth of 5.5%.
During these years annual growth in the demand for engineers was stronger than for the demand for skilled workers6 and overall employment. Average annual growth in demand for skilled workers was 4.6% and despite the buoyant conditions of the time, total employment grew less than half as fast, increasing by 2.0% per year.
This was not the full story. Demand for engineers in engineering occupations grew by an average 6.0% per year. Combined with differential location, industries and experience and areas of engineering practice, this higher growth in demand for engineers to work in engineering gave rise to the skill shortages experienced at the time.
2.6 Engineering is Dependent on Skilled Migration The majority of the engineering labour market has now been born overseas. In 2006, the overseas born segment of the engineering labour force was 48.4% and the Australian born segment was 51.6%. By 2011, this had changed to 53.9% for the overseas born segment and 46.1% for the Australian born segment. The reason for this change was that in recent years most of the increase in the supply of engineers was from overseas:
• Between 2006 and 2011, the supply of engineers increased by 63,275 with average growth of 5.6% per year.
• The supply of overseas born men grew by 7.6% per year and contributed 59.1% of the increase. • The supply of overseas born women grew by 10.0% per year and contributed 12.3% of the
increase. • In contrast, the supply of Australian born engineers grew much slower, by 3.2% per year for men
and 3.4% per year for women and contributed 28.6% of the increase.
In contrast, the overseas born segment of the skilled labour force in 2011 was 38.4% and in the overall labour force it was 27.7%. Although skilled migration is the largest component of Australia’s annual migration intake, the annual intake of migrant engineers grew rapidly throughout the construction phase of the resources boom and as we shall see in a later Chapter, the numbers of permanent migrant engineers have continued even though it has been widely acknowledged that the resources sector has transitioned from construction to production. Fewer engineers are required at this stage.
2.7 Diversity and Labour Market Experience The labour market experience of groups within the engineering labour force varies markedly.
Retention in Engineering
The previous Section pointed out that retention in engineering occupations, that is employment in occupations closely related to engineering, is higher for men than for women and higher for Australian 6 As measured by the demand for people with qualifications whose level is equivalent to those of the engineering team across all areas of skill.
Engineers Australia 11
The Engineering Profession: A Statistical Overview, 2015
born than overseas born qualified engineers. In 2011, the highest retention is for Australian born men 70.6% of whom are employed in occupations close to engineering and the lowest retention is for overseas born women of whom 45.4% are employed in occupations close to engineering.
Unemployment
Unemployment has been higher for women than men qualified engineers irrespective of ethnicity. However, this gap is magnified for overseas born women whose unemployment rates have been almost double that of overseas born men and twice as high as for Australian born women. In 2011, the lowest unemployment rate was 2.1% for Australian born men and the highest was 7.9% for overseas born women. It is important to note that in 2011 the engineering labour market was experiencing high levels of demand.
Full Time and Part Time Work
A feature of engineering is the high proportion of qualified engineers employed full time. The ABS defines full time work as working 35 hours or more per week. In 2011, 86.7% of qualified engineers worked full time compared to 72.3% for all skilled employees and 67.5% for employees in general. Conversely, fewer qualified engineers work part time. The corresponding comparison of part time employees in 2011 was 13.3% for engineers, 27.7% for all skilled employees and 32.5% for employees overall. The majority of these differences are explained by gender; proportionally, more women work part than men; 27.2% in engineering, 38.8% in all skilled areas and 47.5% in overall employment. An interesting point is that while the proportion of women engineers working part time is higher than the proportion of men, numerically there were almost three times as many men employed part time than women.
When the high proportion of full time employment in engineering is combined with the high labour force participation rates previously noted, total hours worked by engineers is on average higher than for the two other groups used for comparison.
Economic Sectors
Most of the increase in engineering employment has been in the private sector. This sector increased its share of engineering employment from 83.1% in 2006 to 84.3% in 2011. The share of engineering employment in the national government sector fell from 7.6% to 6.3% in 2011. There was a small increase in the proportion of State government employment from 7.2% to 7.4% in 2011 and a fall in the proportion of engineers employed in local government from 2.1% to 1.9% in 2011.
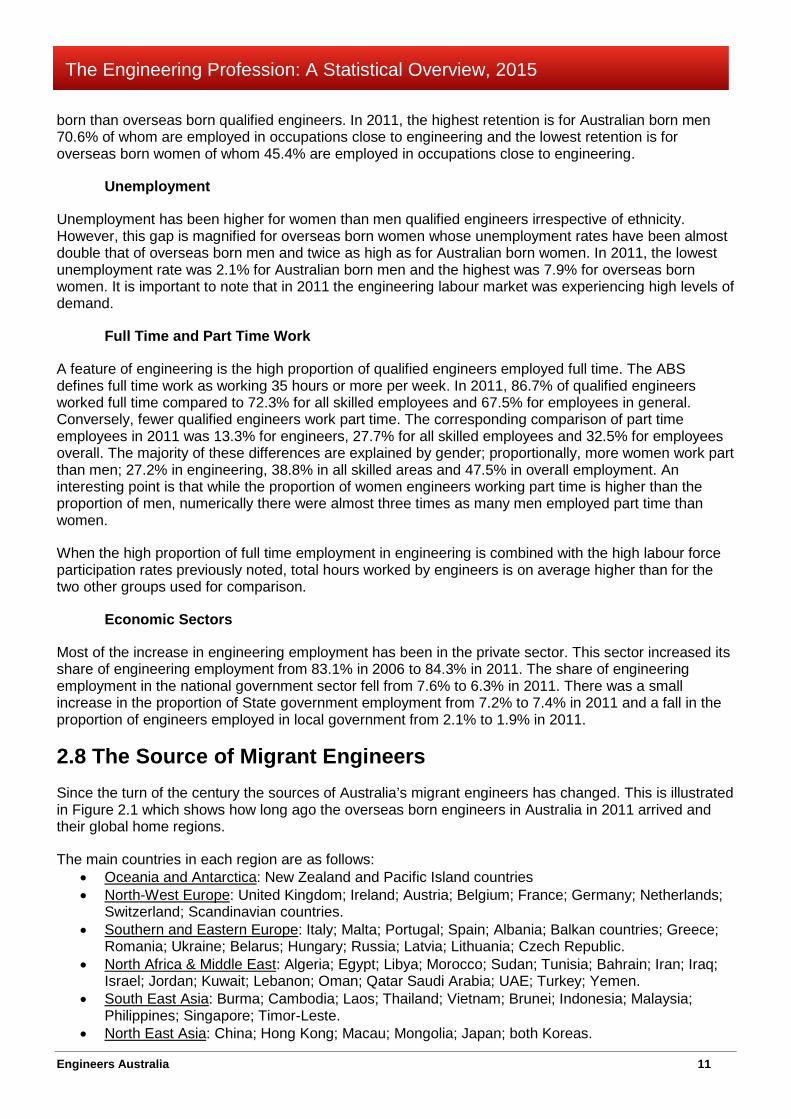
2.8 The Source of Migrant Engineers Since the turn of the century the sources of Australia’s migrant engineers has changed. This is illustrated in Figure 2.1 which shows how long ago the overseas born engineers in Australia in 2011 arrived and their global home regions.
The main countries in each region are as follows: • Oceania and Antarctica: New Zealand and Pacific Island countries • North-West Europe: United Kingdom; Ireland; Austria; Belgium; France; Germany; Netherlands;
Switzerland; Scandinavian countries. • Southern and Eastern Europe: Italy; Malta; Portugal; Spain; Albania; Balkan countries; Greece;
Romania; Ukraine; Belarus; Hungary; Russia; Latvia; Lithuania; Czech Republic. • North Africa & Middle East: Algeria; Egypt; Libya; Morocco; Sudan; Tunisia; Bahrain; Iran; Iraq;
Israel; Jordan; Kuwait; Lebanon; Oman; Qatar Saudi Arabia; UAE; Turkey; Yemen. • South East Asia: Burma; Cambodia; Laos; Thailand; Vietnam; Brunei; Indonesia; Malaysia;
Philippines; Singapore; Timor-Leste. • North East Asia: China; Hong Kong; Macau; Mongolia; Japan; both Koreas.
Engineers Australia 12
The Engineering Profession: A Statistical Overview, 2015
• Southern & Central Asia: Bangladesh; Bhutan; India; Maldives; Nepal; Pakistan; Sri Lanka; Afghanistan; Armenia; Azerbaijan; Georgia; Kazakhstan; Kyrgyzstan; Tajikistan; Turkmenistan; Uzbekistan.
• Americas: all countries of northern and southern America • Sub-Saharan Africa; Benin; Cameroon; Central African Republic; Chad; Congo; Gambia; Ghana;
Liberia; Niger; Nigeria; Senegal; Angola; Kenya; Ethiopia; Lesotho; South Africa; Zimbabwe.
Prior to 1990 just 7.3% of engineers arriving in Australia from overseas came from countries in the Southern and Central Asian region countries. During the 1990s the proportion increased and by 2000 it was 21.2%. Since then it rose to a peak of 31.7% in 2004 and it has been close to this level since. In 2010, 27.9% of migrant engineers came from this region.
Arrivals from countries of the South East Asian region were 19.6% prior to 1990 but have slowly fallen over time to be 12.1% in 2010. Countries of the North West Europe region have historically been important sources for Australia’s migrant engineers making up 27.6% of arrivals prior to 1990. The share of this group has gradually fallen until it was 15.7% in 2009. The proportion increased to 18.8% in 2010, possibly as a result of the GFC impact in the region. Arrivals from countries of the North East Asian region increased from 10.9% prior to 1990 to 18.4% during the 1990s, but the share has steadily fallen to be 10.3% in 2010. There were few migrant engineers from countries in the Americas before 1990 but the share of arrivals from these countries has increased, particularly in more recent years, to be 10.3% in 2010.

Engineers Australia 13
The Engineering Profession: A Statistical Overview, 2015
Chapter 3 The Engineering Labour Market over Time Main Points This Chapter relies on statistics from the annual ABS Survey of Education and Work (SEW) to examine recent developments in the engineering labour market. Announced changes to the monthly ABS Labour Force Survey mean this recourse will not be necessary in the future once sufficient observations for new definitions have been accumulated.
SEW statistics confirm the view based on census statistics that labour force participation by engineers is high, indeed higher than the skilled labour force and substantially higher than the overall labour force. Analysis of changes in engineering labour force participation shows that reductions in participation have played an important role in adjusting the supply of engineers to lower demand.
The GFC impacted engineering more severely than other segments of the labour force in 2009. When this effect is excluded the period 2008 to 2013 was one of especially high demand for engineers. Some of the supply of engineers was absorbed by the skilled labour market and this meant that the demand for qualified engineers in occupations close to engineering was especially high.
Consistent with trends in vacancies statistics, there was a marked change in the engineering labour market in 2014. The demand for the engineering team grew by just 0.9%, a fraction of the growth experienced in previous years. In contrast, the supply of engineers continued to grow by 3.1%.
The result was that the unemployment rate in the engineering labour market increased to 5.3% in 2014. This is now a year ago and the indications from vacancies statistics, from statistics on education completions and skilled migration statistics are that the past year has been a repeat of 2014 and unemployment has likely increased.
A feature of the deterioration in the engineering labour market is that demand for engineers in occupations close to engineering has remained reasonably strong. This observation strengthens the view that public policy concerning the engineering profession should focus on the development of fully competent engineers and their retention in engineering. Growing the number of people who complete engineering qualifications is essential, but insufficient.
3.1 Background For many purposes some of the best statistics are from the ABS Population Census which is conducted every five years. This frequency is not an issue when the focus of interest is a structural issue, but census statistics usually become available 12 to 18 months after the census is held and so are of limited value so far as contemporary change is concerned. The May 2015 Commonwealth Budget provided the ABS with the financial allocations required to conduct the 2016 census. In due course, the results will be used to update structural statistics.
In Australia, changes in the size and structure of the national labour market are usually monitored using statistics from the Australian Bureau of Statistics (ABS) Labour Force Survey (LFS). The LFS is based on 0.32% of the civilian population7 aged 15 years and over and was first conducted in 1960. Since 1978 the LFS has been available monthly.
Historically, the LFS has had limited value for an organization like Engineers Australia which includes mandatory educational qualifications in engineering as a membership condition because the LFS
7 ABS, Information Paper, Labour Force Survey Sample Design, May 2013, Cat No 6269.0, www.abs.gov.au

Engineers Australia 14
The Engineering Profession: A Statistical Overview, 2015
questionnaire did not include questions about respondents’ educational qualifications. Industry and occupation of employment were recorded, but without information about educational attainment, the resulting statistics did not measure engineering as understood by Engineers Australia.
This situation is about to change. The LFS questionnaire has been regularly reviewed and refined and from May 2015 will include educational attainment allowing statistics for the engineering profession to be compiled for the first time8. This is an important development because quarterly statistics on trends in the engineering labour market will be available with no more delay than the labour market information used in government decision making.
The absence of contemporary statistics has been a major barrier to understanding the rapid deterioration in the engineering labour market during the past two years. The main indicator employed by Engineers Australia has been analyses of vacancy trends using statistics produced by the Department of Employment and Training9. These statistics are useful indicators of changes but are not substitutes for comprehensive information about changes in the demand for, and supply of, engineers or about unemployment.
Until sufficient observations from the revised LFS are compiled, Engineers Australia has explored alternative ways to obtain contemporary statistics on trends in the engineering labour force to bridge the gap between 2011 and now. The option chosen was to use the ABS Survey of Education and Work (SEW). The SEW is an annual supplement to the LFS which does cover educational attainment. Until recently access to these statistics as they apply to engineers has been difficult. It was necessary to ask the ABS to extract statistics relating to engineers from each year’s survey on a fee for service basis. This process was made more awkward by standard error limitations which impeded some requests. The ABS has now made SEW statistics for 2011 to 2013 accessible using TableBuilder. Experimentation with these data sets resulted in a more focused request to the ABS for statistics covering prior years.
3.2 Survey of Education and Work The Survey of Education and Work (SEW) is a supplementary survey that draws on the LFS sample and is undertaken annually in May10. Although a subset of the LFS sample there are some differences in survey response rates and the scope of the surveys. The latter are important when comparing trends to other statistics, for example the membership of Engineers Australia.Until 2008, the SEW covered 15 to 64 years age groups. From 2009 until 2012, age groups 65 to 74 years were included in the survey in cases where there was attachment to the labour force. In 2013, all individuals up to 74 years of age were included. These changes mean that some compromise is needed to compile a consistent time series. The most obvious one is to settle on the earlier age range, 15 to 64 years. The shorter interval 2011 to 2014 was used to examine the circumstances of the 65 to 74 years age groups.
In principle, SEW statistics can be compiled by occupation, but given the size of standard errors for many occupations, the results are problematic. Instead, the concept of engineering occupations referred to in Chapter 2 was used and statistics for the aggregate of the 51 (of 358) four digit occupations involved was compiled for each year11.
Ideally, statistics are required for each of the three occupational groups in the engineering team. However, the ABS definition of Bachelor degrees precludes this because it combines full time study durations from three to six years. This means that it is not possible to distinguish between professional engineers and engineering technologists; the two occupational groups need to be considered together in
8 ABS, Information Paper: Forthcoming Changes to Labour Force Statistics, October 2014, Cat No 6292.0, www.abs.gov.au 9 See http://lmip.gov.au/default.aspx?LMIP/VacancyReport 10 ABS, Education and Work, Australia, May 2014, Cat No 6227.0, www.abs.gov.au 11 The research behind this concept is explained in Engineers Australia, The Engineering Profession in Australia; A Profile from the 2006 Population Census, 2010, www.engineersaustralia.org.au

Engineers Australia 15
The Engineering Profession: A Statistical Overview, 2015
a group called degree qualified engineers. It was possible to separate out statistics for associate engineers.
Other noteworthy differences between SEW and census statistics are the exclusion of defence forces from the SEW, the exclusion of people normally resident in another country and exclusion of indigenous communities. Defence is a comparatively large employer of engineers, sufficiently large to cause observable differences employment statistics for other industries. Skilled temporary migrants are normally resident in Australia for the duration of their visas and are included.
This Chapter uses the same labour market concepts as discussed in Chapter 2. However, it is important to bear in mind the differences in the two data sets used. Chapter 2 considers census statistics that cover age groups 19 years and over, and all segments of the population. The statistics in this Chapter have the restrictions outlined in the previous paragraph and cover age groups 15 to 64 years.
3.3 Engineering Population The engineering population is the subset of the population that holds engineering qualifications consistent with the engineering team. Increases in the engineering population occur when new graduates from Australian educational institutions join the labour market after completing engineering qualifications and when overseas engineers join the labour market either as permanent migrants or temporary migrants under 457 visas. The engineering population falls when engineers who are citizens or permanent residents die and when temporary 457 migrant engineers finish contracts in Australia and return to home countries. In this paper, the engineering population also fall when engineers turn 65 years and leave the age range used to compile the time series. Only consideration of net outcomes is feasible.
In 2001, the population with engineering team qualifications was 233,900 and by 2014 it had grown to 416,200, an increase of 77.9%. In most years, annual growth was fairly robust as shown in Figure 3.1. Over the period 2001 to 2014, the engineering population grew by an average 4.6% per year. The impact of the global financial crisis (GFC) reduced growth in 2009 to 0.3%, most likely because temporary migrants on 457 visas did not have contracts renewed and returned to home countries. The most recent statistics showed that the increase in 2014 was 2.2%.
In 2001, there were 178,000 degree qualified engineers, 76.1% of the engineering team population, but over time this group experienced faster growth. By 2014, the population had increased to 330,400 with average annual growth of 5.0% per year. The GFC caused the population of degree qualified engineers

Engineers Australia 16
The Engineering Profession: A Statistical Overview, 2015
to fall by 4.5% in 2009, again most likely due to return of temporary migrants on 457 visas to home countries. In 2014, the increase was 4.2%, robust but lower than the average since 2001.
In 2001, there were 55,900 associate engineers in the population and with average annual growth of 4.3%, by 2014 this had increased to 85,800%. There was much more variability in this population with the numbers of associate engineers falling in five of the thirteen years examined. The population peaked in 2013 at 90,300 associate engineers.
3.4 Participation Rates and the Supply of Engineers
Time series estimates confirm that engineers have very high labour force participation rates compared to the labour force overall as shown in Figure 3.2. Comparison to other skilled groups was limited by data availability and in the diagram degree qualified engineers were compared to degree qualified people in all skilled fields. This comparison showed that labour force participation rates for engineers were higher than for other fields.
Between 2001 and 2014, the average labour force participation rate for the engineering team was 90.2%. Degree qualified engineers had a slightly higher average rate of 90.8%. In comparison, the average participation rate for all degree qualified persons was 87.3% and the average labour force participation rate for the entire labour force was 77.1%.
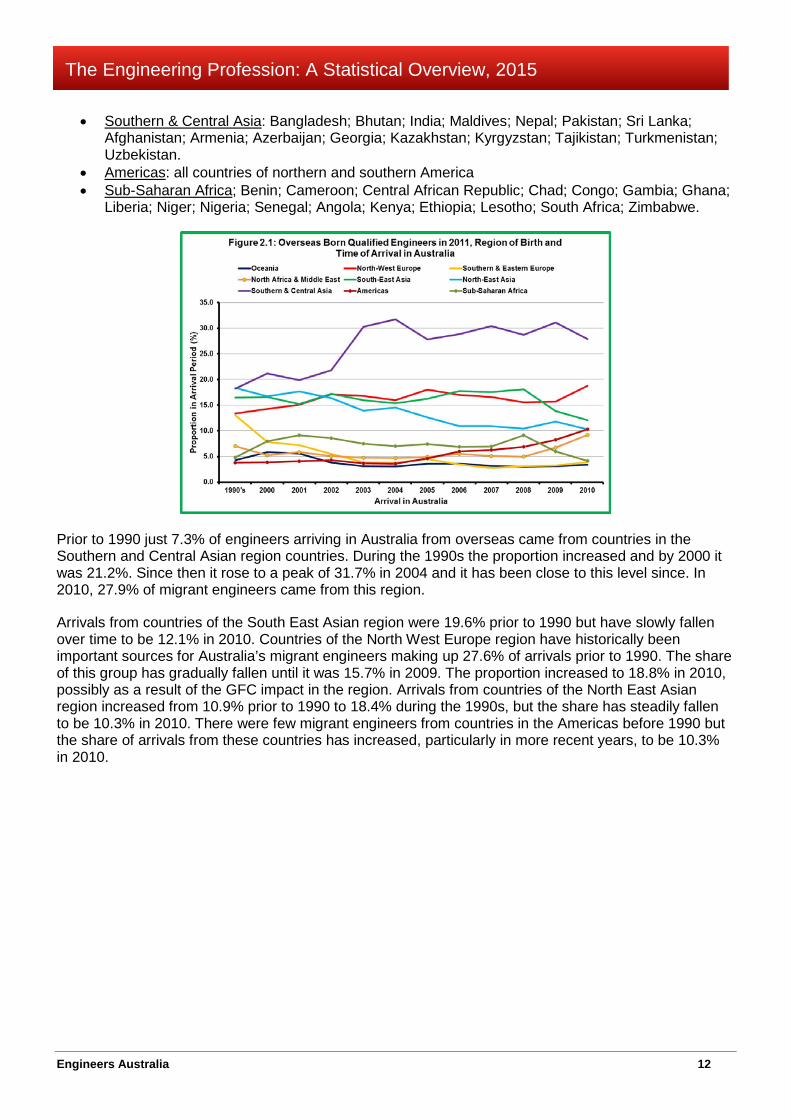
Changes in engineering labour force participation are an important adjustment mechanism in the engineering labour market and this can be demonstrated using Figure 3.3. In most years before the GFC, the participation rate was above average reflecting the attraction of high demand for engineers on labour force participation. The impact of the GFC in 2009 led to falls in participation to below the average in each of the following two years. If instead of falling, participation rates in 2010 and 2011 stayed at the 2009 level, an additional 12,200 engineers would have been in the labour market. Essentially, some engineers chose to retire from the labour market rather than face unemployment. As well, some temporary migrant engineers on 457 visas returned to their home countries.Following the GFC, the engineering labour market recovered, but the recovery was short lived. Vacancies began to fall in December 2012 and Figure 3.3 shows that once again participation played a role. In 2013, the participation rate fell well below average. Had it remained at its 2012 level, the 2013 engineering labour force would have been 8,800 larger. In 2014, participation returned to its average level.
Changes in the engineering labour force are the result of interplay between participation decisions taken by engineers already in Australia and Australia’s skilled migration policies. Permanent skilled
Engineers Australia 17
The Engineering Profession: A Statistical Overview, 2015
migration in recent years has continued to be high and there has been no policy revision to accommodate soft labour market conditions. Temporary skilled migration is designed to act as an automatic stabiliser. When demand for engineers is high, temporary migration is expected to rise as increasing numbers of employers experience skill shortages, but when the demand for engineers is low, temporary migration is expected to fall as employers terminate temporary contracts early or allow them to expire. As the engineering labour market has deteriorated, temporary migration has fallen as expected, but the observed fall has not been as great as expected and a comparatively high level of temporary migration continues to add to supply. This is examined further in a later Chapter.
High participation rates translate into high labour supply. In 2001, the supply of engineers, or labour force, was 206,800 and by 2014 it had grown by 80.9% to 374,100. Between 2001 and 2014, average annual growth in supply was 4.7%. During the GFC, supply growth slower to a standstill with just 0.1% in 2009. Supply grew faster before the GFC than after; average annual growth before the GFC was 5.6% per year, falling to 4.5% per year after the GFC. In 2014, the supply of engineers grew by 3.1%, well below the average but quite strong when compared to employment.
3.5 Demand for Engineers
Labour market demand is measured by employment. In 2001, there were 8,927,000 people employed in Australia; 1,848,000 or 20.7% of them had degree qualifications. The engineering team employed 199,200 engineers, just 2.2% of total employment; 154,000 engineers had degree qualifications. Perceptions about employment growth for engineers are still influenced by views prevalent during the resources boom, but Table 3.1 shows that the situation has changed dramatically. The Table considers employment growth for three measures of engineering employment12 compared to employment in the skilled labour force and in the overall labour force for a number of different time intervals before and after the GFC.
Consistent with the results reported in Chapter 2, employment growth was high for engineers and enjoyed similar annual growth to skilled employment in general. Betweem 2001 and 2014, average employment growth for the engineering team was 4.6% per year and 4.9% per year for degrees qualified engineers. These rates were similar to employment growth averaging 4.5% per year for the skilled labour force. In contrast, employment grew at less than half this pace in the overall labour force. Prior to the GFC, all employment growth rates were higher than the full period average
12 Unfortunately because of the move from the ASCO to the ANZSCO classification system of occupations, it was not feasible to measure the numbers retained in engineering occupations before 2008.

Engineers Australia 18
The Engineering Profession: A Statistical Overview, 2015
The GFC impacted severely on engineering employment but skilled employment growth increased as did overall employment growth. One of the characteristics of engineering employment is that it was particularly strong immediately before and after the GFC. Table 3.1 shows that average annual employment growth for engineers in the period 2008 to 2013, leaving out 2009, was stronger than for period immediately before and for the full period. Indeed, employment growth for the engineering team was an average 5.9% per year, for degree qualified engineers it was 8.0% per year and in engineering occupations it was 7.5% per year. In contrast, skilled employment and overall employment continued to grow consistent with earlier rates.
Statistics on vacancies for engineers began a strong downwards trend in December 201213. Throughout 2013 and into 2014 there were continuing anecdotes about engineers losing their positions for various reasons. The impact of these developments became evident in 2014 when employment growth for the engineering team slowed to 0.9%. Employment for degree qualified engineers was not as badly affected growing by 2.4%. The most interesting result is for employment in engineering occupations which continued to grow by 4.0% per year.
While one factor contributing to the change in 2014 was the impact of the transition from construction to production in the resources sector, another factor was the more widespread softness in the Australian labour market. This view is supported by the sharp contraction in employment growth in the skilled workforce and the fall in employment overall. One of the fastest growing areas of engineering employment was “engineering consulting”. This industry was particularly hard hit by the resources transition and by the downturn in infrastructure investment. However, engineers are employed in most industries throughout the economy and have been affected by soft economic conditions, particularly in manufacturing and construction industries.
3.6 Unemployment
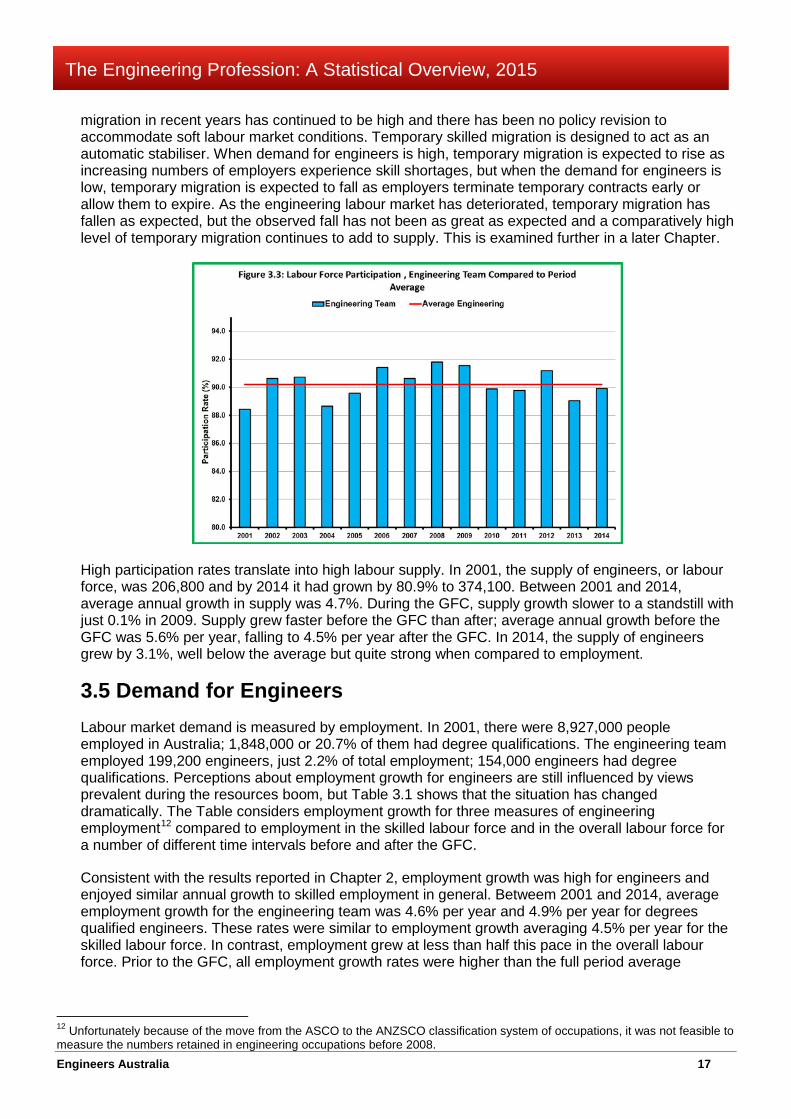
While employment growth for the engineering team slowed to 0.9% in 2014, supply grew by 3.1% and as a result unemployment has increased. Figure 3.4 compares the trends in unemployment rates for the engineering team, degree qualified engineers, the skilled labour force and the overall labour force since 2001. The blue bars illustrate the trend in unemployment rates for engineers, the engineering team in dark blue and degree qualified engineers in light blue. The red bars are the unemployment rates for the skilled labour force and the overall unemployment rates are in yellow.
Several points can be made about Figure 3.4:
• For most of the period illustrated unemployment rates for skilled people, whether engineers or other skills, were substantially lower than the overall unemployment rates.
• Engineers experienced higher unemployment rates than the skilled labour force in most years. In this regard the structural differences related to gender and ethnicity noted in Chapter 2 are likely to be important.
13 These trends are reported in Monthly Vacancies Updates available from www.engineersaustralia.org.au .
Table 3.1: Employment Growth in Engineering Compared to Other Groups (% pa)
Period Engineering Engineering Engineering All AllTeam Degrees Occupations Degrees Employment
2001 to 2014 4.6 4.9 .. 4.5 1.72001 to 2007 5.2 4.5 .. 4.7 2.1GFC (2009) -1.9 -6.1 -4.6 6.7 1.5
2008 to 2013 less 2009 5.9 8.0 7.5 4.5 1.82014 0.9 2.4 4.0 1.5 -0.7
Engineers Australia 19
The Engineering Profession: A Statistical Overview, 2015
• Even though reductions in labour force participation rates eased adjustment in the engineering labour market, unemployment rates for engineers increased substantially in 2014 to levels not far below the overall unemployment rate. In 2014, the rate for the engineering team was 5.3% and for degree qualified engineers 5.6%.
• The nexus between engineering and skilled labour markets has changed with the unemployment rate for skilled people remaining low at 3.3%.
The SEW is an annual survey and these results are now about a year old. The indications from vacancies statistics are that the demand for engineers remains low. At the same time the numbered of domestic students completing engineering qualifications has increased slightly, the intake of migrant engineers on permanent visas was the second highest on record and, although it has fallen, the intake of temporary migrant engineers remains higher than expected. In combination, these indicators suggest that unemployment for engineers has deteriorated further.
3.7 Employment in Engineering Occupations
Many people who have recognised qualifications in engineering choose employment outside engineering. Indeed, engineering is subject to one-way substitutability; engineering qualifications are valued in numerous occupations unconnected with engineering that depend on analytical and problem solving skills. Some with engineering qualifications choose to compete with other tertiary qualified people for opportunities in the skilledlabour market14. However, completing engineering qualifications is simply the first step towards engineering practice. Fully competent engineers undertake and complete a process of professional formation similar to other professions.
Engineers choose opportunities outside engineering for a number of reasons:
• Increasing intermittency of engineering work is incompatible with the aspirations and commitments of career development and modern lifestyles. Infrastructure development in Australia has been characterised by boom/bust cycles for decades. This has been the dominant characteristic of the resources boom. The shift of engineering employment from public sector employment to private sector has meant more contract positions replacing on-going salaried employment.
14 Foot noted earlier.

Engineers Australia 20
The Engineering Profession: A Statistical Overview, 2015
• Engineers have career ambitions like everyone else and opportunities for career development in engineering are limited and are diminishing over time. Instead, engineers have pursued lateral career moves into other areas of work.
• Although starting salaries for new engineering graduates have been high, analysis of salary changes compared to movements in full time adult earnings shows that engineering remuneration simply has not kept up, especially at junior level15.
• Much of the resources boom has occurred in remote locations unattractive to engineers settled into career paths in urban and more conventional regional settings.
• Evidence suggests that unemployment rates for migrant engineers in both 2006 and 2011 were highest in major capital cities, particularly Sydney and Melbourne, suggesting locational ambitions on the part of migrant engineers which are realised by moving out of engineering to other areas of work.
• Migrant engineers are known to experience difficulties integrating into the Australian labour force, beginning with colloquial English language issues, adapting to different institutional settings and how the Australian labour market works. Discrimination is probably still an issue but evidence of this is scant.
This distinction has important implications for policies relating to ensuring that Australia’s has sufficient engineers for future development of Australian technology and infrastructure. The present simple focus on growing the number of people with engineering qualifications is insufficient. This view is supported by Figure 3.5 which illustrates the relationship between the supply of qualified engineers and engineers who deploy their knowledge and expertise in occupations close to engineering.
In 2007, 157,500 engineers, or 57.0% of the supply of engineers, were employed in engineering occupations. By 2010, the proportion in engineering occupations had increased to 62.5%, its highest level with 193,200 employed in these occupations. Since then, the proportion has gradually fallen and in 2014 was 59.4%.
When employers complain about engineering skill shortages, they are concerned about finding suitable qualified competent engineers. This view is consistent with the observations made above that employment growth for qualified engineers in engineering occupations were higher than for the
15 Engineers Australia, Statistical Overview, op cit, p81
Engineers Australia 21
The Engineering Profession: A Statistical Overview, 2015
engineering team and have remained comparatively high even though conditions in the engineering labour market have deteriorated.
Policies to strengthen the engineering profession should focus on retention of engineers in engineering as well as growing the number of people with acceptable engineering qualifications. These policies should address the following:
• That engineering, like other professions, requires formalised professional formation following completion of entry level educational qualifications.
• That the bulk of engineering professional formation is acquired on-the-job and that sufficient job opportunities for new graduates are essential to ensure growth in the number of fully competent engineers.
• That persistent intermittent employment and inadequate career development opportunities mitigate against efforts to grow the number of fully competent engineers.
• Recognise the lower retention of women engineers and migrant engineers.
Economists believe that the key to productivity growth is embodied technological change, that is, new technology in new capital investments. The Intergenerational Reports make it clear that without productivity growth Australia will find it difficult to maintain its standard of living in the future. Fully competent engineers are essential to deliver productivity growth and retaining them in the profession is just as important.
Engineers Australia 22
The Engineering Profession: A Statistical Overview, 2015
Chapter 4 Transition to Engineering Studies Main Points This year new statistics on participation in year 12 science and mathematics subjects estimated by Kennedy, Lyons and Quinn are considered alongside ABS statistics on high school participation to year 12.
Participation rates in year 12 physics have consistently fallen and are now about 14%. In chemistry, participation rates have fluctuated in a band from 17.5% to 18.5% and are now about 17.8%. In both cases, increases in year 12 participation have offset subject participation with the result that physics numbers have remained fairly stable and chemistry numbers have increased.
Something similar has happened in mathematics. Participation in advanced mathematics has continued to fall and is now about 9.6%. Participation in intermediate mathematics has fallen faster and is now about 19.1%. The increase in year 12 participation has kept numbers in advanced mathematics fairly stable but the fall in intermediate mathematics participation was too great to be offset by year 12 participation and numbers fell.
The issues described in the two paragraphs above are exacerbated by gender imbalances. Just 25% of girls study physics and 35% study advanced and intermediate mathematics. These shares indicate that more needs to be done to encourage the participation of girls in these subjects. The gender shares in chemistry and elementary mathematics are reasonably balanced.
Completion of secondary education is the basis of admission to entry level engineering degrees for about two-thirds of domestic students, down from 71% a decade ago. Other means of admission, though small individually, are increasingly important. The basis of admission for overseas students is different and shared more evenly across several means with “open learning and special entry” rising to prominence recently.
Interest in university places in engineering was fairly muted until about 2006. From then until 2013, applications from year 12 students, offers of places by universities and acceptances of places all accelerated rapidly. This trend is evident in the commencement statistics discussed in the next Chapter. However, in 2014 there were abrupt falls in all three measures. It remains to be seen whether this is simply an annual fluctuation or the start of a negative trend in response to labour market conditions. Engineering continues to attract high quality students.
4.1 School Participation to Year 12 In 2014, there were 224,300 students in Year 12 in Australian schools, up 36,190 or 19.2% on the 2001 number (see Table 4.1). This change was the outcome of two complementary factors; an increase in the school age population and an increase in student participation to Year 12. The former was responsible for about 53% or 19,303 of the change and the latter for about 47% or 16,887. Throughout the period shown in the Table, there were more girls than boys in Year 12. In 2001, the gender shares were 47.4% boys and 52.6% girls. In the fourteen years to 2014, the gender gap narrowed to 48.8% boys and 51.2% girls. During the middle of last decade participation rates to Year 1216 rose and fell with little overall change. This is evident in Figure 4.1 which illustrates gender and overall trends in participation rates. From about 2008, participation rates have risen and continue to increase.
16 Participation rates are defined as the proportion of Year 10 students that continues on to Year 12. This definition is now used because below Year 10 compulsory minimum school leaving ages apply.

Engineers Australia 23
The Engineering Profession: A Statistical Overview, 2015
For some time now, the participation rates for girls have been substantially higher than those for boys. In 2001, 70.8% of boys continued on to Year 12 compared to 80.1% of girls. The participation of boys increased to 79.5% by 2014 and meant that 8,146 more boys continued on to Year 12 compared to a constant 2001 participation rate. For boys this change accounted for 40.5% of the increase in their number, the rest coming from an increase in the size of the age cohorts. The participation rate for girls also increased, to 85.7% in 2014 and this change accounted for 53.3% of the increase in the number of Year 12 girls, a higher share of the change because the commencing participation rate was already high in 2001.
Trends in Year 12 participation rates have an important bearing on numbers studying enabling subjects for engineering studies at universities and TAFE colleges. For example, if the participation rate for boys in 2014 were equal to the outcome for girls, there would be an additional 8,528 students in Year 12.
4.2 Participation in Science Subjects There has been lively discussion about the participation of Year 12 students in science subjects in recent years. The statistics presented in recent years relied on outdated sources and figures
Table 4.1: Year 12 School Students, Australia
Year Boys Girls Total2001 89240 98870 1881102002 91959 101713 1936722003 92396 101220 1936162004 92155 101327 1934822005 91848 102317 1941652006 92900 103682 1965822007 94015 104201 1982162008 95586 106991 2025772009 98616 107910 2065262010 102942 111600 2145422011 105296 113245 2185412012 107684 114353 2220372013 107685 112431 2201162014 109353 114947 224300

Engineers Australia 24
The Engineering Profession: A Statistical Overview, 2015
included in a report by the Australian Academy of Science for the Chief Scientist17. These figures proved to be controversial and led to calls for better statistics.
Kennedy, Lyons and Quinn18 settled the dust by collecting raw subject enrolment statistics from State and Territory education Departments and compiled statistics on science enrolments consistent with the participation statistics covered above. Given this background, this Edition of the Statistical Overview discontinues statistics included in earlier editions and replaces them with the more reliable ones produced by Kennedy, Lyons and Quinn.
Participation rates for physics and chemistry are shown in Table 4.2 and are illustrated in Figure 4.2. Kennedy, Lyons and Quinn provided statistics up to 2012 and we have assumed continuation of the 2012 rates in the following two years. There has been a falling trend in physics participation; from 16.5% 17 Australian Academy of Science, The status and Quality of Year 11 and 12 Science in Australian Schools, 2012, http://science.org.au/publications/research-reports-and-policy.html 18 John Kennedy, Terry Lyons and Frances Quinn, The Continuing Decline of Science and Mathematics Enrolments in Australian High Schools, Teaching Science, Volume 60, Number 2, June 2014, accessed on-line, http://eprints.qut.edu.au/73153/1/Continuing_decline_of_science_proof.pdf and a helpful article “20 year Decline in year 12 science and mathematics participation”, by Nicky Phillips in the Sydney Morning Herald on 6 October 2014 that contained an infographic providing the raw data used.
Table 4.2: Participation in Year 12 Science Subjects
Year Year 12 Students Physics Chemistry Physics Chemistry2001 188110 16.5 17.9 31038 336722002 193672 15.9 17.4 30794 336992003 193616 16.1 17.7 31172 342702004 193482 16.4 18.4 31731 356012005 194165 15.3 18.7 29707 363092006 196582 14.8 18.5 29094 363682007 198216 14.8 18.4 29336 364722008 202577 14.9 18.2 30184 368692009 206526 14.5 17.8 29946 367622010 214542 14.3 17.5 30680 375452011 218541 14.0 17.8 30596 389002012 222037 14.0 17.8 31085 395232013 220116 14.0 17.8 30816 391812014 224300 14.0 17.8 31402 39925
Figures in red are EA estimates
Science Participation Rates Science Numbers
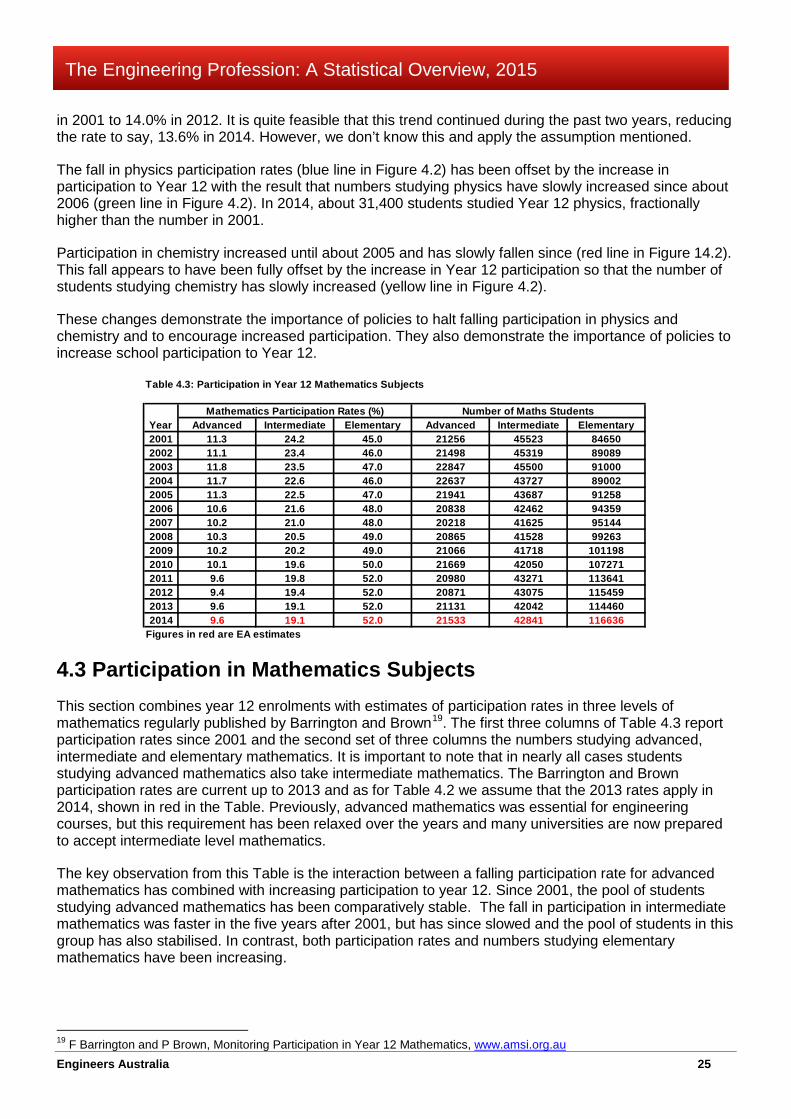
Engineers Australia 25
The Engineering Profession: A Statistical Overview, 2015
in 2001 to 14.0% in 2012. It is quite feasible that this trend continued during the past two years, reducing the rate to say, 13.6% in 2014. However, we don’t know this and apply the assumption mentioned.
The fall in physics participation rates (blue line in Figure 4.2) has been offset by the increase in participation to Year 12 with the result that numbers studying physics have slowly increased since about 2006 (green line in Figure 4.2). In 2014, about 31,400 students studied Year 12 physics, fractionally higher than the number in 2001.
Participation in chemistry increased until about 2005 and has slowly fallen since (red line in Figure 14.2). This fall appears to have been fully offset by the increase in Year 12 participation so that the number of students studying chemistry has slowly increased (yellow line in Figure 4.2).
These changes demonstrate the importance of policies to halt falling participation in physics and chemistry and to encourage increased participation. They also demonstrate the importance of policies to increase school participation to Year 12.
4.3 Participation in Mathematics Subjects This section combines year 12 enrolments with estimates of participation rates in three levels of mathematics regularly published by Barrington and Brown19. The first three columns of Table 4.3 report participation rates since 2001 and the second set of three columns the numbers studying advanced, intermediate and elementary mathematics. It is important to note that in nearly all cases students studying advanced mathematics also take intermediate mathematics. The Barrington and Brown participation rates are current up to 2013 and as for Table 4.2 we assume that the 2013 rates apply in 2014, shown in red in the Table. Previously, advanced mathematics was essential for engineering courses, but this requirement has been relaxed over the years and many universities are now prepared to accept intermediate level mathematics.
The key observation from this Table is the interaction between a falling participation rate for advanced mathematics has combined with increasing participation to year 12. Since 2001, the pool of students studying advanced mathematics has been comparatively stable. The fall in participation in intermediate mathematics was faster in the five years after 2001, but has since slowed and the pool of students in this group has also stabilised. In contrast, both participation rates and numbers studying elementary mathematics have been increasing.
19 F Barrington and P Brown, Monitoring Participation in Year 12 Mathematics, www.amsi.org.au
Table 4.3: Participation in Year 12 Mathematics Subjects
Year Advanced Intermediate Elementary Advanced Intermediate Elementary2001 11.3 24.2 45.0 21256 45523 846502002 11.1 23.4 46.0 21498 45319 890892003 11.8 23.5 47.0 22847 45500 910002004 11.7 22.6 46.0 22637 43727 890022005 11.3 22.5 47.0 21941 43687 912582006 10.6 21.6 48.0 20838 42462 943592007 10.2 21.0 48.0 20218 41625 951442008 10.3 20.5 49.0 20865 41528 992632009 10.2 20.2 49.0 21066 41718 1011982010 10.1 19.6 50.0 21669 42050 1072712011 9.6 19.8 52.0 20980 43271 1136412012 9.4 19.4 52.0 20871 43075 1154592013 9.6 19.1 52.0 21131 42042 1144602014 9.6 19.1 52.0 21533 42841 116636
Figures in red are EA estimates
Mathematics Participation Rates (%) Number of Maths Students
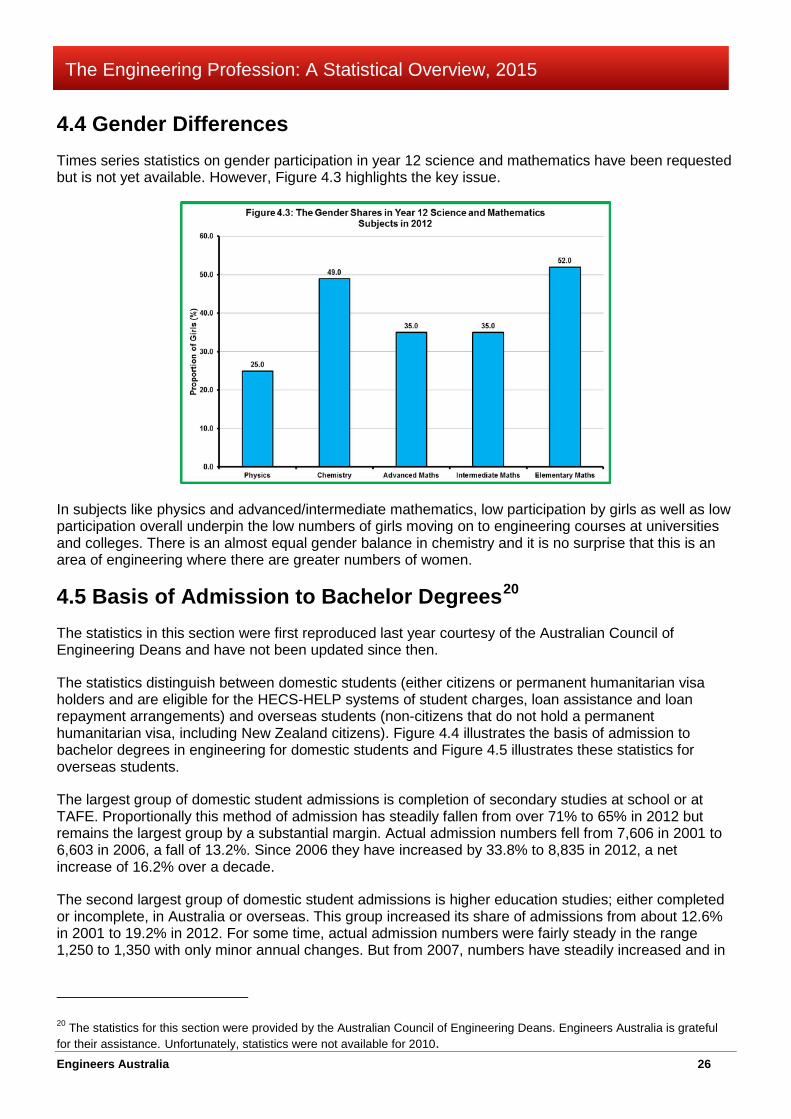
Engineers Australia 26
The Engineering Profession: A Statistical Overview, 2015
4.4 Gender Differences Times series statistics on gender participation in year 12 science and mathematics have been requested but is not yet available. However, Figure 4.3 highlights the key issue.
In subjects like physics and advanced/intermediate mathematics, low participation by girls as well as low participation overall underpin the low numbers of girls moving on to engineering courses at universities and colleges. There is an almost equal gender balance in chemistry and it is no surprise that this is an area of engineering where there are greater numbers of women.
4.5 Basis of Admission to Bachelor Degrees20 The statistics in this section were first reproduced last year courtesy of the Australian Council of Engineering Deans and have not been updated since then.
The statistics distinguish between domestic students (either citizens or permanent humanitarian visa holders and are eligible for the HECS-HELP systems of student charges, loan assistance and loan repayment arrangements) and overseas students (non-citizens that do not hold a permanent humanitarian visa, including New Zealand citizens). Figure 4.4 illustrates the basis of admission to bachelor degrees in engineering for domestic students and Figure 4.5 illustrates these statistics for overseas students.
The largest group of domestic student admissions is completion of secondary studies at school or at TAFE. Proportionally this method of admission has steadily fallen from over 71% to 65% in 2012 but remains the largest group by a substantial margin. Actual admission numbers fell from 7,606 in 2001 to 6,603 in 2006, a fall of 13.2%. Since 2006 they have increased by 33.8% to 8,835 in 2012, a net increase of 16.2% over a decade.
The second largest group of domestic student admissions is higher education studies; either completed or incomplete, in Australia or overseas. This group increased its share of admissions from about 12.6% in 2001 to 19.2% in 2012. For some time, actual admission numbers were fairly steady in the range 1,250 to 1,350 with only minor annual changes. But from 2007, numbers have steadily increased and in
20 The statistics for this section were provided by the Australian Council of Engineering Deans. Engineers Australia is grateful for their assistance. Unfortunately, statistics were not available for 2010.

Engineers Australia 27
The Engineering Profession: A Statistical Overview, 2015
2012, 2,604 domestic students were admitted to bachelor degree programs in engineering through this channel.
Admission based on TAFE or VET studies is an important but relatively small group, accounting for between 5 and 7% of admissions. Numbers have increased from less than 500 in 2001 to 904 in 2012, demonstrating the importance of articulation guidelines. The “other” group includes open learning and special entry, and while annual changes have been wider larger than other admission channels, numbers have remained less than a thousand per year.
The basis of admission for overseas students is quite different to the pattern established for domestic admissions. Admissions fall into three large groups that dominate annual statistics and three small ones that round off annual intakes. About 30% of admissions are students who have completed secondary studies, either in Australia or overseas, in schools or equivalent institutions. About 30% of admissions are students who have complete or incomplete higher education histories, either in Australia or overseas. The shares of these groups have varied from year to year and numbers have increased roughly in line with overall admission increases. The third group, “other” including open learning and special entry, has in size; particularly in recent years to dominate in 2012 with 2,062 or 39.5% of admissions.
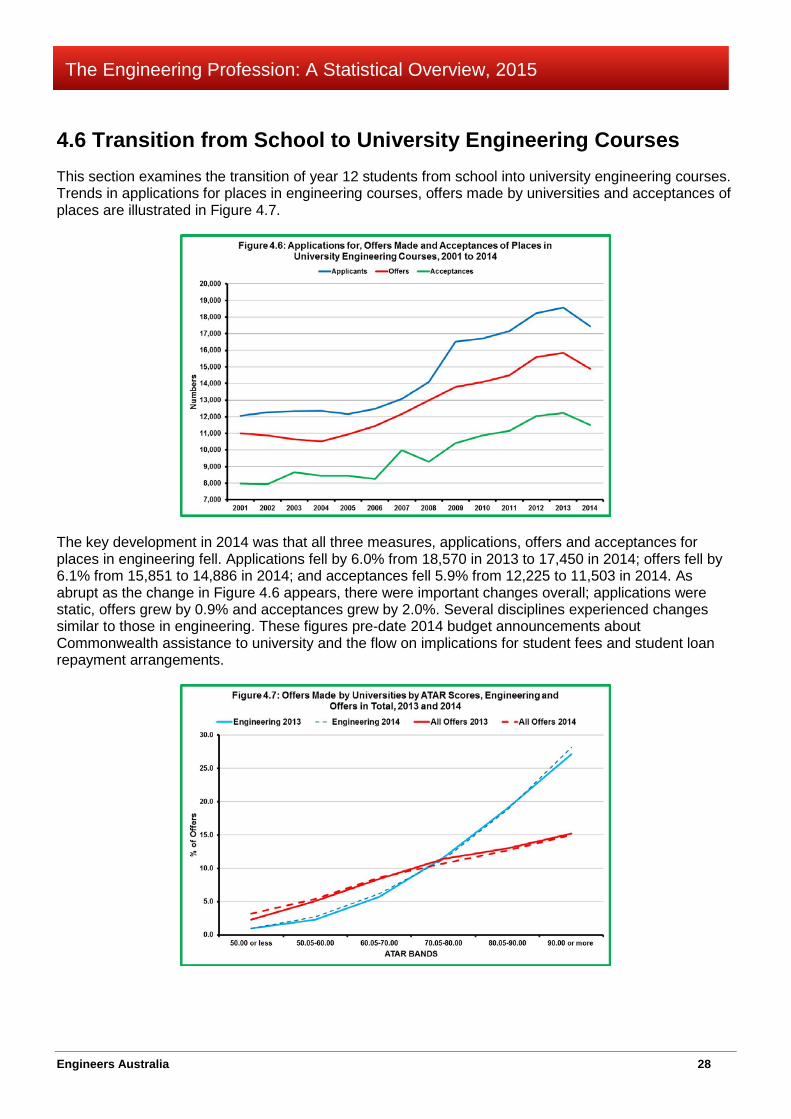
Engineers Australia 28
The Engineering Profession: A Statistical Overview, 2015
4.6 Transition from School to University Engineering Courses This section examines the transition of year 12 students from school into university engineering courses. Trends in applications for places in engineering courses, offers made by universities and acceptances of places are illustrated in Figure 4.7.
The key development in 2014 was that all three measures, applications, offers and acceptances for places in engineering fell. Applications fell by 6.0% from 18,570 in 2013 to 17,450 in 2014; offers fell by 6.1% from 15,851 to 14,886 in 2014; and acceptances fell 5.9% from 12,225 to 11,503 in 2014. As abrupt as the change in Figure 4.6 appears, there were important changes overall; applications were static, offers grew by 0.9% and acceptances grew by 2.0%. Several disciplines experienced changes similar to those in engineering. These figures pre-date 2014 budget announcements about Commonwealth assistance to university and the flow on implications for student fees and student loan repayment arrangements.

Engineers Australia 29
The Engineering Profession: A Statistical Overview, 2015
Engineering continues to attract high quality students as shown in Figure 4.7. Engineering attracts more high ATAR scoring students than the university system overall and fewer lower ATAR scoring students. The profiles in Figure 4.7 are stable between 2013 and 2014 and the changes shown in figure 4.6 do not appear to have affected the mix of students.
Figure 4.8 compares the distribution of the best student, those with ATAR scores 90 or higher, between disciplines. The proportion of these students receiving offers of engineering places fell from 12.6% in 2013 to 12.2% in 2014. In contrast, the proportion receiving offers of places in science courses increased from 20.5% to 21.5%. What is missing from Figure 4.8 is an indication of how students with year 12 science and mathematics subjects were distributed.

Engineers Australia 30
The Engineering Profession: A Statistical Overview, 2015
Chapter 5 University Engineering Education Main Points This Chapter examines trends in university engineering education. Two groups of students study engineering; domestic students are our “home grown” engineers who, when they complete courses and join the labour market, directly add to the supply of engineers. Overseas students studying in Australia contribute to our exports of education services. Some overseas students join the Australian labour market can only do so by first acquiring either a permanent or a temporary migration visa.
Until this year there has been a two year lag in higher education statistics; so for example the 2014 Edition of the Statistical Overview reported statistics for 2012. The Department of Education and Training has this year released statistics for two years, 2013 and 2014, overcoming this problem.
Student commencements in Engineering and Related Technologies courses continue to increase in line with average annual growth since 2001, growing by 4.9% in 2014. However, almost all growth was from commencements by overseas students with barely any growth for domestic student commencements. In 2014, commencements by overseas grew by 13.7% compared to the average since 2001 of 7.9%. Commencements by domestic students increased by just 0.1% compared to an average 3.4% since 2001.
There were opposing changes for domestic student commencements in 2014. Post graduate course commencements increased by 6.5% compared to an average 3.6% since 2001. However, entry level course commencements fell by 1.5% compared to an average increase of 3.2% since 2001. This fall can be attributed to fewer commencements in Associate degrees and Advanced diplomas. Commencements in Bachelor degree courses grew by 1.8% in 2014 compared to an average 2.7% since 2001.
Overseas student commencements grew strongly for most course levels but were particularly strong for post graduate courses for which commencements increased by 16.5% in 2014 compared to an average 10.3% since 2001. None-the-less, the 9.5% growth recorded for entry level courses was substantially higher than occurred for domestic students.
In 2014, the engineering student population at Australian universities broke through 100,000 for the first time. There were 67,671 domestic students and 34,703 overseas students enrolled in engineering courses. Over three quarters of the student population was enrolled in entry level courses, a consistent feature since 2001. During the past five years the proportion of overseas students has been increasing. In 2014, this group comprised 32.4% of total course enrolments (average since 2001 28.6%), 50.8% of post graduate enrolments (average of 44.7% since 2001) and 26.2% of entry level course (average 23.9% since 2001).
In 2014, 19,550 students completed engineering courses conducted by Australian universities. Course completions increased by 6.9% compared to an average of 4.5% since 2001. Domestic student course completions increased by 5.9% to 11,074, a rate of increase over twice the average since 2001. The strongest factor in this result was an increase of 5.2% in completion of entry level course. The share of Australian women completing engineering courses remains low, averaging 16.0% but this is skewed upwards by the greater propensity of women to complete post graduate course; for the latter, the average women’s share was 19.2% compared to 14.3% for entry level courses.
More overseas students completed engineering courses than ever before, 8,476 in 2014, an increase of 8.3% over the previous year. More overseas students than domestic students completed post graduate degrees. The reverse was the case for entry level courses.
Since 2001, engineering course completions have averaged 5.0% of completions by domestic students and 6.7% of completions by overseas students. This relationship is reflected in completions of all
Engineers Australia 31
The Engineering Profession: A Statistical Overview, 2015
courses but is particularly noticeable in respect to doctoral degrees where on average domestic students account for 10.3% of doctoral completions (10.8% in 2014) compared to 16.7% for overseas students (22.7% in 2014).
5.1 Course Commencements This Section covers statistics on commencements in university Engineering and Related Technologies courses. The statistics distinguish between different course levels from Doctoral Degree through to undergraduate diplomas and certificates. This distinction is not always observed and statistics quoted are the total for courses of every level and discussion occurs as if the statistics describe new students. Of course some are, but others are already qualified engineers aiming to upgrade their skills through post graduate studies. The statistics relate to the ABS classification Engineering and Related Technologies which includes Geomatic engineering, or surveying as well as conventional engineering areas. While it is feasible to obtain statistics that exclude Geomatic engineering, the resources required do not justify the small change in information value.
Statistics on in commencements in engineering courses are presented in four Tables. Table 5.1 shows trends for commencements by domestic students. Table 5.2 presents the same information for overseas students. Tables 5.3 and 5.4 consider the change in universities teaching load from all new students combined; Table 5.3 focuses on domestic compared to overseas students and Table 5.4 focuses on gender.
Recent history has emphasized domestic skill shortages, partly explained by the trend in the first five years. Table 5.1 shows that up to 2005 overall commencements in engineering courses fell from 14,031 in 2001 to 13,579, an average annual contraction of -0.8%. The contraction for entry level courses was greater, falling from 11,012 to 10,293 at by an average annual 1.7%.
In the years that followed demand pressures attracted higher levels of commencements in engineering. By 2014, total commencements had increased to 21,456, growing by an average 3.4% per year since 2001. During the last five years annual growth was 4.8% per year, a good deal higher than the fourteen year average. However, in 2014 growth stalled mainly because of a downturn in entry level commencements.
The average rate of growth for entry level commencements since 2001 was a little less than growth in all courses; 3.2% per year compared to 3.4%. Commencements in Bachelor courses have continued to be strong and in 2014 were 15,085 compared to the low point of 9,910 in 2004. After some years of rapid growth commencements in Associate degrees and Advanced diplomas fell to 1,370 in 2014 from a peak of 1,890 the previous year resulting in a fall of 1.5% in entry level commencements last year.
Domestic commencements in post graduate courses have on average increased faster than undergraduate courses, increasing by an average 3.6% per year since 2001. During the last five years the situation was reversed with entry level courses increasing on average by 4.9% per year compared to 4.0% per year for post graduate courses. New commencements in Doctoral degrees have continued in a saw tooth fashion, commencements in Research Masters degrees have fallen over time, and commencements in Coursework Masters degrees have rapidly expanded.
The proportion of women commencing engineering is very low and while the situation is improving change is exceedingly slow. For entry level courses the long term average is 15.1% women. During the past five years, this average increased to 15.5% and last year to 15.8%. Most of this change is due to the higher propensity of women engineers to undertake post graduate studies. Here the long term average was 19.0% women, increasing to 19.5% in the past five years and to 19.8% in 2014. In contrast,

Engineers Australia 32
The Engineering Profession: A Statistical Overview, 2015
the share of women in entry level course commencements was lower. The long term average was equal to the average for the past five years at 13.8%, but in 2014 14.6% of new entry level commencements were women. This figure is not out of the ordinary over the years since 2001 when several similar figures were recorded, the highest being 15.0% in 2001.
Table 5.2 shows that commencements by overseas students have grown much faster than domestic commencements but with more frequent variation. Since 2001, total commencements by overseas students have grown by 7.9% per year. Growth slowed during the past five years to 5.2% but picked up to over 13.7% in each of the past two years. Growth was driven by post graduate commencements where long term average growth was 10.3% per year, 6.9% during the past five years and 9.5% in 2014. However, overseas student commencements in entry level courses also grew strongly with a long term average rate of 5.0% compared to 3.2% for domestic commencements. In contrast to the fall in domestic entry level commencements in 2014, 9.5% more overseas students commenced these courses in 2014 compared to the previous year.
The disparity in growth has led to a steady increase in the proportion of overseas students commencing in Australian engineering faculties. In 2001, overseas students were 27.3% of engineering commencements; 40.6% of post graduate commencements and 23.5% of entry level commencements. Over the past fourteen years these shares have averaged 34.9%, 53.2% and 27.4%, respectively. In 2014, they were 38.5%, 59.5% and 27.2%, respectively.
The proportion of women commencing engineering courses has consistently been higher for overseas students than domestic students. For courses of every level the proportion of women has averaged 17.6% for overseas students compared to 15.1% for domestic students. During the past five years the comparison was 18.2% for overseas students and 15.5% for domestic students and last year it was 18.4% compared to 15.8%. Although overseas students showed a similar higher propensity to undertake post graduate courses, the gap between the women’s share of post graduate and entry level courses was narrower than for domestic students.
5.2 Student Enrolments Academic courses typically extend over a number of years and entry level courses in engineering are typically longer than for many other subjects. This means that the population of engineering students expands as a multiple of new commencements. Statistics to illustrate this issue are at Tables 5.5 to 5.8 structured to correspond to the Tables for new course commencements. In 2014, domestic enrolments were 67,671, an increase of 2.4% on the previous year. Since 2001 domestic enrolments have increased by 44.2% from 46,917 an average annual increase of 2.9%. Domestic enrolments are dominated by entry level courses which on average have accounted for 82.3% of enrolments. Typically there has been little deviation from this share.
Overseas student enrolments have increased much faster than domestic enrolments increasing by over 200% since 2014 at an annual average rate of 9.1%. Enrolments increased slightly faster than this in 2014, by 9.5% over 2013. Although enrolments in entry level courses were also a majority for overseas students, their average share was much lower than for domestic students, 63.9% compared to 82.1%. Unlike domestic students the entry level share of overseas student enrolments has been falling reflecting greater interest in coursework masters and doctoral degrees by this group.
In 2014 for the first time, total enrolments in engineering courses exceeded 100,000, having increased by an annual average 4.5% since 2001. On average overseas student enrolments have accounted for 28.6% but this share has increased over time to 33.9% in 2014. The overseas student share of post graduate course enrolments is particularly high and has been increasing. It averaged 44.7% with 54.3% in 2014.

Engineers Australia 33
The Engineering Profession: A Statistical Overview, 2015
Table 5.1: Domestic Students Commencing Engineering and Related Technologies Courses
MenLevel 2001 2002 2003 2004 2005 2006 2007 2008 2009 2010 2011 2012 2013 2014
Doctoral 406 472 492 537 437 378 418 380 443 514 480 435 496 490Research masters 272 292 246 269 232 211 179 143 247 244 171 174 179 208
Coursework masters 646 849 840 795 727 759 853 916 1211 1284 1287 1423 1447 1651Other postgraduate 906 823 947 850 901 841 791 864 937 909 490 530 938 934
Bachelors 9148 8792 8667 8574 8663 8913 9460 9698 10300 10731 11327 11739 12677 12800Ass degrees & advanced diplomas 212 232 233 240 331 349 459 759 849 1221 1155 1396 1715 1256
Diplomas 26 67 42 45 46 45 155 163 200 259 274 332 353 478Other undergraduate 208 519 547 496 366 394 421 137 172 294 742 726 295 255
Total 11824 12046 12014 11806 11703 11890 12736 13060 14359 15456 15926 16755 18100 18072
WomenDoctoral 128 142 123 150 113 108 101 118 143 164 141 166 166 183
Research masters 52 74 76 78 60 46 55 44 51 59 48 57 55 50Coursework masters 152 158 167 169 149 184 178 212 238 257 275 267 333 392Other postgraduate 194 175 159 167 191 198 162 216 221 225 109 117 229 184
Bachelors 1638 1486 1422 1336 1257 1375 1591 1597 1752 1810 1827 1856 2140 2285Ass degrees & advanced diplomas 14 32 17 <10 42 42 65 83 81 136 102 140 175 114
Diplomas 0 4 3 <10 0 2 15 21 33 25 25 26 47 43Other undergraduate 29 54 52 27 64 86 97 89 116 220 360 326 188 133
Total 2207 2125 2019 1936 1876 2041 2264 2380 2635 2896 2887 2955 3333 3384
All domestic commencementsDoctoral 534 614 615 687 550 486 519 498 586 678 621 601 662 673
Research masters 324 366 322 347 292 257 234 187 298 303 219 231 234 258Coursework masters 798 1007 1007 964 876 943 1031 1128 1449 1541 1562 1690 1780 2043Other postgraduate 1100 998 1106 1017 1092 1039 953 1080 1158 1134 599 647 1167 1118
Bachelors 10786 10278 10089 9910 9920 10288 11051 11295 12052 12541 13154 13595 14817 15085Ass degrees & advanced diplomas 226 264 250 240 373 391 524 842 930 1357 1257 1536 1890 1370
Diplomas 26 71 45 45 46 47 170 184 233 284 299 358 400 521Other undergraduate 237 573 599 523 430 480 518 226 288 514 1102 1052 483 388
Total 14031 14171 14033 13742 13579 13931 15000 15440 16994 18352 18813 19710 21433 21456Source: Data provided by the DET
Table 5.2: Overseas Students Commencing Engineering & Related Technologies Courses
MenLevel 2001 2002 2003 2004 2005 2006 2007 2008 2009 2010 2011 2012 2013 2014
Doctoral 190 186 207 213 222 272 336 413 579 600 654 773 830 832Research masters 97 117 133 173 137 135 144 131 144 164 165 160 144 156
Coursework masters 1089 1442 2443 2344 2142 1940 2101 2084 2580 2217 1962 2243 2966 3679Other postgraduate 194 219 128 134 260 269 251 255 316 257 206 156 201 108
Bachelors 2818 3206 3564 3283 3109 3184 3523 3679 4385 4628 4624 4331 4426 4867Ass degrees & advanced diplomas 15 29 14 23 40 47 159 129 181 144 264 184 166 183
Diplomas 1 29 12 17 64 48 345 274 415 590 565 601 923 1115Other undergraduate 2 9 46 34 41 63 34 50 45 53 69 63 0 0
Total 4406 5237 6547 6221 6015 5958 6893 7015 8645 8653 8509 8511 9656 10940
WomenDoctoral 47 40 50 51 50 89 95 162 225 198 253 255 297 329
Research masters 24 23 25 30 40 43 54 49 64 54 67 65 55 55Coursework masters 216 303 407 443 437 355 427 468 520 553 473 515 626 838Other postgraduate 27 38 20 28 35 53 50 54 49 61 32 25 48 21
Bachelors 556 653 716 653 669 670 766 786 926 998 965 892 991 1096Ass degrees & advanced diplomas 1 1 1 2 1 2 3 4 10 13 9 14 38 9
Diplomas 0 18 0 0 44 67 86 39 60 81 53 57 82 120Other undergraduate 3 1 17 8 10 10 19 13 15 12 23 18 0 0
Total 874 1077 1236 1215 1286 1289 1500 1575 1869 1970 1877 1844 2137 2468
All overseas commencemenrsDoctoral 237 226 257 264 272 361 431 575 804 798 907 1028 1127 1161
Research masters 121 140 158 203 177 178 198 180 208 218 232 225 199 211Coursework masters 1305 1745 2850 2787 2579 2295 2528 2552 3100 2770 2435 2758 3592 4517Other postgraduate 221 257 148 162 295 322 301 309 365 318 238 181 249 129
Bachelors 3374 3859 4280 3936 3778 3854 4289 4465 5311 5626 5589 5223 5417 5963Ass degrees & advanced diplomas 16 30 15 25 41 49 162 133 191 157 273 198 204 192
Diplomas 1 47 12 17 108 115 431 313 475 671 618 658 1005 1235Other undergraduate 5 10 63 42 51 73 53 63 60 65 92 81 0 0
Total 5280 6314 7783 7436 7301 7247 8393 8590 10514 10623 10384 10352 11793 13408Source: Data provided by the DET
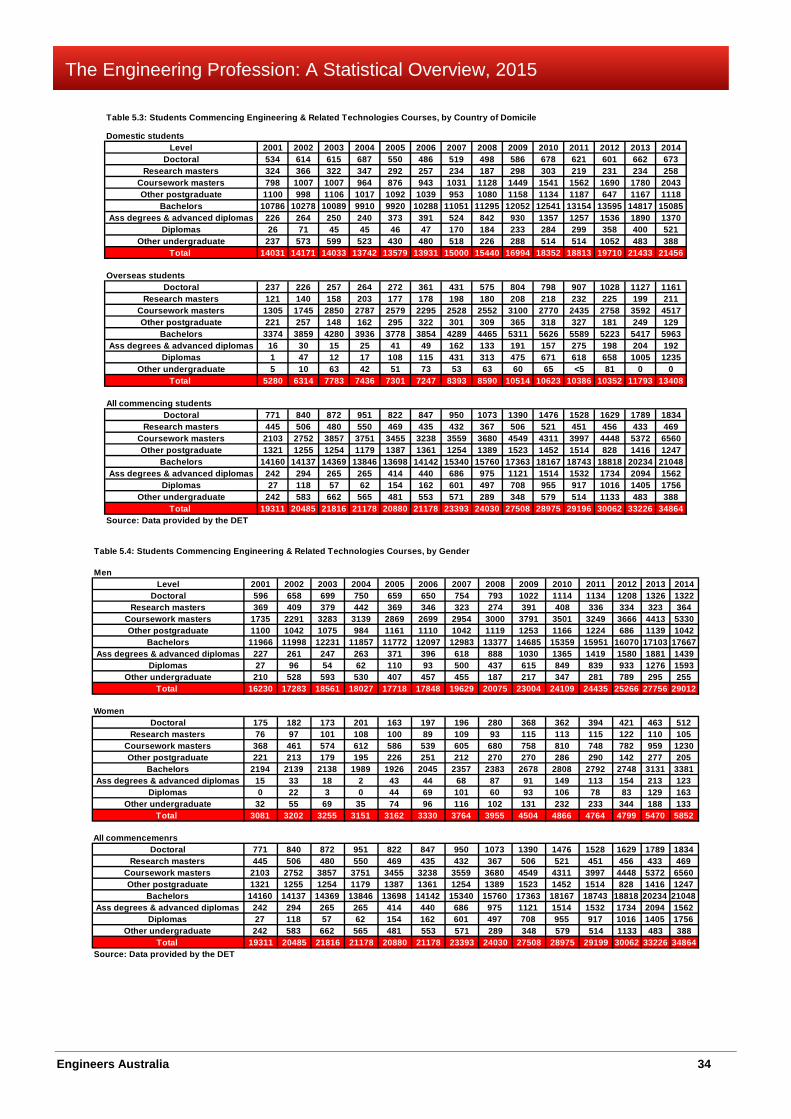
Engineers Australia 34
The Engineering Profession: A Statistical Overview, 2015
Table 5.3: Students Commencing Engineering & Related Technologies Courses, by Country of Domicile
Domestic studentsLevel 2001 2002 2003 2004 2005 2006 2007 2008 2009 2010 2011 2012 2013 2014
Doctoral 534 614 615 687 550 486 519 498 586 678 621 601 662 673Research masters 324 366 322 347 292 257 234 187 298 303 219 231 234 258
Coursework masters 798 1007 1007 964 876 943 1031 1128 1449 1541 1562 1690 1780 2043Other postgraduate 1100 998 1106 1017 1092 1039 953 1080 1158 1134 1187 647 1167 1118
Bachelors 10786 10278 10089 9910 9920 10288 11051 11295 12052 12541 13154 13595 14817 15085Ass degrees & advanced diplomas 226 264 250 240 373 391 524 842 930 1357 1257 1536 1890 1370
Diplomas 26 71 45 45 46 47 170 184 233 284 299 358 400 521Other undergraduate 237 573 599 523 430 480 518 226 288 514 514 1052 483 388
Total 14031 14171 14033 13742 13579 13931 15000 15440 16994 18352 18813 19710 21433 21456
Overseas studentsDoctoral 237 226 257 264 272 361 431 575 804 798 907 1028 1127 1161
Research masters 121 140 158 203 177 178 198 180 208 218 232 225 199 211Coursework masters 1305 1745 2850 2787 2579 2295 2528 2552 3100 2770 2435 2758 3592 4517Other postgraduate 221 257 148 162 295 322 301 309 365 318 327 181 249 129
Bachelors 3374 3859 4280 3936 3778 3854 4289 4465 5311 5626 5589 5223 5417 5963Ass degrees & advanced diplomas 16 30 15 25 41 49 162 133 191 157 275 198 204 192
Diplomas 1 47 12 17 108 115 431 313 475 671 618 658 1005 1235Other undergraduate 5 10 63 42 51 73 53 63 60 65 <5 81 0 0
Total 5280 6314 7783 7436 7301 7247 8393 8590 10514 10623 10386 10352 11793 13408
All commencing studentsDoctoral 771 840 872 951 822 847 950 1073 1390 1476 1528 1629 1789 1834
Research masters 445 506 480 550 469 435 432 367 506 521 451 456 433 469Coursework masters 2103 2752 3857 3751 3455 3238 3559 3680 4549 4311 3997 4448 5372 6560Other postgraduate 1321 1255 1254 1179 1387 1361 1254 1389 1523 1452 1514 828 1416 1247
Bachelors 14160 14137 14369 13846 13698 14142 15340 15760 17363 18167 18743 18818 20234 21048Ass degrees & advanced diplomas 242 294 265 265 414 440 686 975 1121 1514 1532 1734 2094 1562
Diplomas 27 118 57 62 154 162 601 497 708 955 917 1016 1405 1756Other undergraduate 242 583 662 565 481 553 571 289 348 579 514 1133 483 388
Total 19311 20485 21816 21178 20880 21178 23393 24030 27508 28975 29196 30062 33226 34864Source: Data provided by the DET
Table 5.4: Students Commencing Engineering & Related Technologies Courses, by Gender
MenLevel 2001 2002 2003 2004 2005 2006 2007 2008 2009 2010 2011 2012 2013 2014
Doctoral 596 658 699 750 659 650 754 793 1022 1114 1134 1208 1326 1322Research masters 369 409 379 442 369 346 323 274 391 408 336 334 323 364
Coursework masters 1735 2291 3283 3139 2869 2699 2954 3000 3791 3501 3249 3666 4413 5330Other postgraduate 1100 1042 1075 984 1161 1110 1042 1119 1253 1166 1224 686 1139 1042
Bachelors 11966 11998 12231 11857 11772 12097 12983 13377 14685 15359 15951 16070 17103 17667Ass degrees & advanced diplomas 227 261 247 263 371 396 618 888 1030 1365 1419 1580 1881 1439
Diplomas 27 96 54 62 110 93 500 437 615 849 839 933 1276 1593Other undergraduate 210 528 593 530 407 457 455 187 217 347 281 789 295 255
Total 16230 17283 18561 18027 17718 17848 19629 20075 23004 24109 24435 25266 27756 29012
WomenDoctoral 175 182 173 201 163 197 196 280 368 362 394 421 463 512
Research masters 76 97 101 108 100 89 109 93 115 113 115 122 110 105Coursework masters 368 461 574 612 586 539 605 680 758 810 748 782 959 1230Other postgraduate 221 213 179 195 226 251 212 270 270 286 290 142 277 205
Bachelors 2194 2139 2138 1989 1926 2045 2357 2383 2678 2808 2792 2748 3131 3381Ass degrees & advanced diplomas 15 33 18 2 43 44 68 87 91 149 113 154 213 123
Diplomas 0 22 3 0 44 69 101 60 93 106 78 83 129 163Other undergraduate 32 55 69 35 74 96 116 102 131 232 233 344 188 133
Total 3081 3202 3255 3151 3162 3330 3764 3955 4504 4866 4764 4799 5470 5852
All commencemenrsDoctoral 771 840 872 951 822 847 950 1073 1390 1476 1528 1629 1789 1834
Research masters 445 506 480 550 469 435 432 367 506 521 451 456 433 469Coursework masters 2103 2752 3857 3751 3455 3238 3559 3680 4549 4311 3997 4448 5372 6560Other postgraduate 1321 1255 1254 1179 1387 1361 1254 1389 1523 1452 1514 828 1416 1247
Bachelors 14160 14137 14369 13846 13698 14142 15340 15760 17363 18167 18743 18818 20234 21048Ass degrees & advanced diplomas 242 294 265 265 414 440 686 975 1121 1514 1532 1734 2094 1562
Diplomas 27 118 57 62 154 162 601 497 708 955 917 1016 1405 1756Other undergraduate 242 583 662 565 481 553 571 289 348 579 514 1133 483 388
Total 19311 20485 21816 21178 20880 21178 23393 24030 27508 28975 29199 30062 33226 34864Source: Data provided by the DET

Engineers Australia 35
The Engineering Profession: A Statistical Overview, 2015
Table 5.5: Domestic Students Enrolled in Engineering & Related Technologies Courses
MenLevel 2001 2002 2003 2004 2005 2006 2007 2008 2009 2010 2011 2012 2013 2014
Doctoral 1989 2058 2239 2365 2364 2314 2287 2212 2211 2271 2422 2497 2546 2513Research masters 778 810 741 747 673 635 590 491 561 615 564 547 514 535
Coursework masters 1459 1713 1874 1905 1880 1884 2076 2259 2626 3001 3205 3376 3650 3923Other postgraduate 1509 1494 1682 1662 1709 1717 1634 1715 1689 1731 916 1792 1754 1686
Bachelors 32934 32872 32769 32405 31994 32553 33759 35119 36852 38453 40009 41619 43618 44801Assoc degrees & advanced diplomas 628 618 593 624 651 799 1070 1501 1897 2458 2716 5006 3396 3093
Diplomas 46 87 68 56 69 73 191 196 281 374 402 469 533 668Other undergraduate 247 580 579 526 414 450 449 172 210 324 1112 355 360 317
Total 39590 40232 40545 40290 39754 40425 42056 43665 46327 49227 51347 53661 56371 57536
WomenDoctoral 562 562 599 636 635 621 630 640 655 711 761 807 843 859
Research masters 159 158 173 187 184 162 142 131 136 154 140 142 148 149Coursework masters 314 343 376 390 388 429 460 505 538 629 651 685 784 899Other postgraduate 327 346 334 344 363 405 374 407 396 422 202 211 423 365
Bachelors 5896 5839 5675 5416 5117 5069 5299 5574 5874 6203 6380 6464 6929 7334Assoc degrees & advanced diplomas 35 54 45 29 53 81 132 180 198 282 264 305 356 308
Diplomas 0 4 3 1 1 4 18 32 44 43 469 38 66 63Other undergraduate 34 61 60 34 72 102 113 109 136 230 246 444 216 158
Total 7327 7367 7265 7037 6813 6873 7168 7578 7977 8674 8904 9096 9765 10135
Domestic studentsDoctoral 2551 2620 2838 3001 2999 2935 2917 2852 2866 2982 3183 3304 3389 3372
Research masters 937 968 914 934 857 797 732 622 697 769 704 689 662 684Coursework masters 1773 2056 2250 2295 2268 2313 2536 2764 3164 3630 3856 4061 4434 4822Other postgraduate 1836 1840 2016 2006 2072 2122 2008 2122 2085 2153 1118 2003 2177 2051
Bachelors 38830 38711 38444 37821 37111 37622 39058 40693 42726 44656 46389 48083 50547 52135Assoc degrees & advanced diplomas 663 672 638 653 704 880 1202 1681 2095 2740 2980 5311 3752 3401
Diplomas 46 91 71 57 70 77 209 228 325 417 871 507 599 731Other undergraduate 281 641 639 560 486 552 562 281 346 554 1358 799 576 475
Total 46917 47599 47810 47327 46567 47298 49224 51243 54304 57901 60251 62757 66136 67671Source: Data provided by DET
Table 5.6: Overseas Students Enrolled in Engineering & Related Technologies Courses
MenLevel 2001 2002 2003 2004 2005 2006 2007 2008 2009 2010 2011 2012 2013 2014
Doctoral 560 617 704 791 901 1001 1113 1284 1620 1903 2242 2684 3000 3185Research masters 197 213 232 306 320 338 334 309 297 340 351 354 341 367
Coursework masters 1647 2193 3674 4051 4109 3662 3743 4065 4532 4617 4196 4088 5055 6543Other postgraduate 278 332 219 208 335 359 332 346 406 389 286 283 280 188
Bachelors 6673 7815 9045 9613 9683 9931 10507 11414 12471 13899 14728 14971 15470 15900Assoc degrees & advanced diplomas 29 43 31 43 55 73 180 233 311 291 408 471 394 384
Diplomas 1 36 32 40 82 94 526 527 652 927 997 962 1312 1699Other undergraduate 2 12 53 42 48 72 36 54 46 54 82 72 0 0
Total 9387 11261 13990 15094 15533 15530 16771 18232 20335 22420 23287 23818 25852 28266
WomenDoctoral 134 137 157 193 210 263 310 423 568 682 834 971 1038 1111
Research masters 38 47 49 54 81 90 112 111 126 136 136 151 145 140Coursework masters 379 457 660 758 803 682 690 861 934 1019 947 929 1077 1411Other postgraduate 43 51 33 32 45 63 59 66 65 74 49 37 68 47
Bachelors 1394 1682 1919 2025 2061 2125 2284 2449 2645 2963 3123 3153 3325 3525Assoc degrees & advanced diplomas 2 2 3 3 1 2 5 7 13 19 18 29 53 31
Diplomas 0 18 31 31 51 112 167 110 86 120 104 91 122 172Other undergraduate 4 1 18 10 12 12 20 14 15 14 26 23 0 0
Total 1994 2395 2870 3106 3264 3349 3647 4041 4452 5027 5239 5387 5828 6437
Overseas studentsDoctoral 694 754 861 984 1111 1264 1423 1707 2188 2585 3076 3655 4038 4296
Research masters 235 260 281 360 401 428 446 420 423 476 487 505 486 507Coursework masters 2026 2650 4334 4809 4912 4344 4433 4926 5466 5636 5143 5017 6132 7953Other postgraduate 321 383 252 240 380 422 391 412 471 463 335 320 348 235
Bachelors 8067 9497 10964 11638 11744 12056 12791 13863 15116 16862 17851 18124 18795 19425Assoc degrees & advanced diplomas 31 45 34 46 56 75 185 240 324 310 426 500 447 415
Diplomas 1 54 63 71 133 206 693 637 738 1047 1101 1053 1434 1871Other undergraduate 6 13 71 52 60 84 56 68 61 68 108 95 0 0
Total 11381 13656 16860 18200 18797 18879 20418 22273 24787 27447 28526 29205 31680 34703Source: Data provided by DET

Engineers Australia 36
The Engineering Profession: A Statistical Overview, 2015
Table 5.7: Students Enrolled in Engineering & Related Technologies Courses, by Country of Domicile
DomesticLevel 2001 2002 2003 2004 2005 2006 2007 2008 2009 2010 2011 2012 2013 2014
Doctoral 2551 2620 2838 3001 2999 2935 2917 2852 2866 2982 3183 3304 3389 3372Research masters 937 968 914 934 857 797 732 622 697 769 704 689 662 684
Coursework masters 1773 2056 2250 2295 2268 2313 2536 2764 3164 3630 3856 4061 4434 4822Other postgraduate 1836 1840 2016 2006 2072 2122 2008 2122 2085 2153 1118 1224 2177 2051
Bachelors 38830 38711 38444 37821 37111 37622 39058 40693 42726 44656 46389 48083 50547 52135Assoc degrees & advanced diplomas 663 672 638 653 704 880 1202 1681 2095 2740 2980 3311 3752 3401
Diplomas 46 91 71 57 70 77 209 228 325 417 871 507 599 731Other undergraduate 281 641 639 560 486 552 562 281 346 554 1358 1578 576 475
Total 46917 47599 47810 47327 46567 47298 49224 51243 54304 57901 60251 62757 66136 67671
OverseasDoctoral 694 754 861 984 1111 1264 1423 1707 2188 2585 3076 3655 4038 4296
Research masters 235 260 281 360 401 428 446 420 423 476 487 505 486 507Coursework masters 2026 2650 4334 4809 4912 4344 4433 4926 5466 5636 5143 5017 6132 7953Other postgraduate 321 383 252 240 380 422 391 412 471 463 335 320 348 235
Bachelors 8067 9497 10964 11638 11744 12056 12791 13863 15116 16862 17851 18124 18795 19425Assoc degrees & advanced diplomas 31 45 34 46 56 75 185 240 324 310 426 500 447 415
Diplomas 1 54 63 71 133 206 693 637 738 1047 1101 1053 1431 1871Other undergraduate 6 13 71 52 60 84 56 68 61 68 108 95 0 0
Total 11381 13656 16860 18200 18797 18879 20418 22273 24787 27447 28526 29205 31680 34703
All students Doctoral 3245 3374 3699 3985 4110 4199 4340 4559 5054 5567 6259 6959 7427 7668
Research masters 1172 1228 1195 1294 1258 1225 1178 1042 1120 1245 1191 1194 1148 1191Coursework masters 3799 4706 6584 7104 7180 6657 6969 7690 8630 9266 8999 9078 10566 12775Other postgraduate 2157 2223 2268 2246 2452 2544 2399 2534 2556 2616 2560 1544 2525 2286
Bachelors 46897 48208 49408 49459 48855 49678 51849 54556 57842 61518 64240 66207 69342 71560Assoc degrees & advanced diplomas 694 717 672 699 760 955 1387 1921 2419 3050 3408 3811 4199 3816
Diplomas 47 145 134 128 203 283 902 865 1063 1464 1540 1560 2030 2602Other undergraduate 287 654 710 612 546 636 618 349 407 622 580 1673 576 475
Total 58298 61255 64670 65527 65364 66177 69642 73516 79091 85348 88777 91962 97816 102374Source: Data provided by DET
Table 5.8: Students Enrolled in Engineering & Related Technologies Courses, by Gender
MenLevel 2001 2002 2003 2004 2005 2006 2007 2008 2009 2010 2011 2012 2013 2014
Doctoral 2549 2675 2943 3156 3265 3315 3400 3496 3831 4174 4664 5181 5546 5698Research masters 975 1023 973 1053 993 973 924 800 858 955 915 901 855 902
Coursework masters 3106 3906 5548 5956 5989 5546 5819 6324 7158 7618 7401 7464 8705 10466Other postgraduate 1787 1826 1901 1870 2044 2076 1966 2061 2095 2120 2061 1296 2034 1874
Bachelors 39607 40687 41814 42018 41677 42484 44266 46533 49323 52352 54737 56590 59088 60701Assoc degrees & advanced diplomas 657 661 624 667 706 872 1250 1734 2208 2749 3124 3477 3790 3477
Diplomas 47 123 100 96 151 167 717 723 933 1301 1399 1431 1845 2367Other undergraduate 249 592 632 568 462 522 485 226 256 378 333 1206 360 317
Total 48977 51493 54535 55384 55287 55955 58827 61897 66662 71647 74634 77479 82223 85802
WomenDoctoral 696 699 756 829 845 884 940 1063 1223 1393 1595 1778 1881 1970
Research masters 197 205 222 241 265 252 254 242 262 290 276 293 293 289Coursework masters 693 800 1036 1148 1191 1111 1150 1366 1472 1648 1598 1614 1861 2310Other postgraduate 370 397 367 376 408 468 433 473 461 496 499 248 491 412
Bachelors 7290 7521 7594 7441 7178 7194 7583 8023 8519 9166 9503 9617 10254 10859Assoc degrees & advanced diplomas 37 56 48 32 54 83 137 187 211 301 284 334 409 339
Diplomas 0 22 34 32 52 116 185 142 130 163 141 129 188 235Other undergraduate 38 62 78 44 84 114 133 123 151 244 247 467 216 158
Total 9321 9762 10135 10143 10077 10222 10815 11619 12429 13701 14143 14483 15593 16572
All studentsDoctoral 3245 3374 3699 3985 4110 4199 4340 4559 5054 5567 6259 6959 7427 7668
Research masters 1172 1228 1195 1294 1258 1225 1178 1042 1120 1245 1191 1194 1148 1191Coursework masters 3799 4706 6584 7104 7180 6657 6969 7690 8630 9266 8999 9078 10566 12776Other postgraduate 2157 2223 2268 2246 2452 2544 2399 2534 2556 2616 2560 1544 2525 2286
Bachelors 46897 48208 49408 49459 48855 49678 51849 54556 57842 61518 64240 66207 69342 71560Assoc degrees & advanced diplomas 694 717 672 699 760 955 1387 1921 2419 3050 3408 3811 4199 3816
Diplomas 47 145 134 128 203 283 902 865 1063 1464 1540 1560 2033 2602Other undergraduate 287 654 710 612 546 636 618 349 407 622 580 1673 576 475
Total 58298 61255 64670 65527 65364 66177 69642 73516 79091 85348 88777 91962 97816 102374Source: Data provided by DET
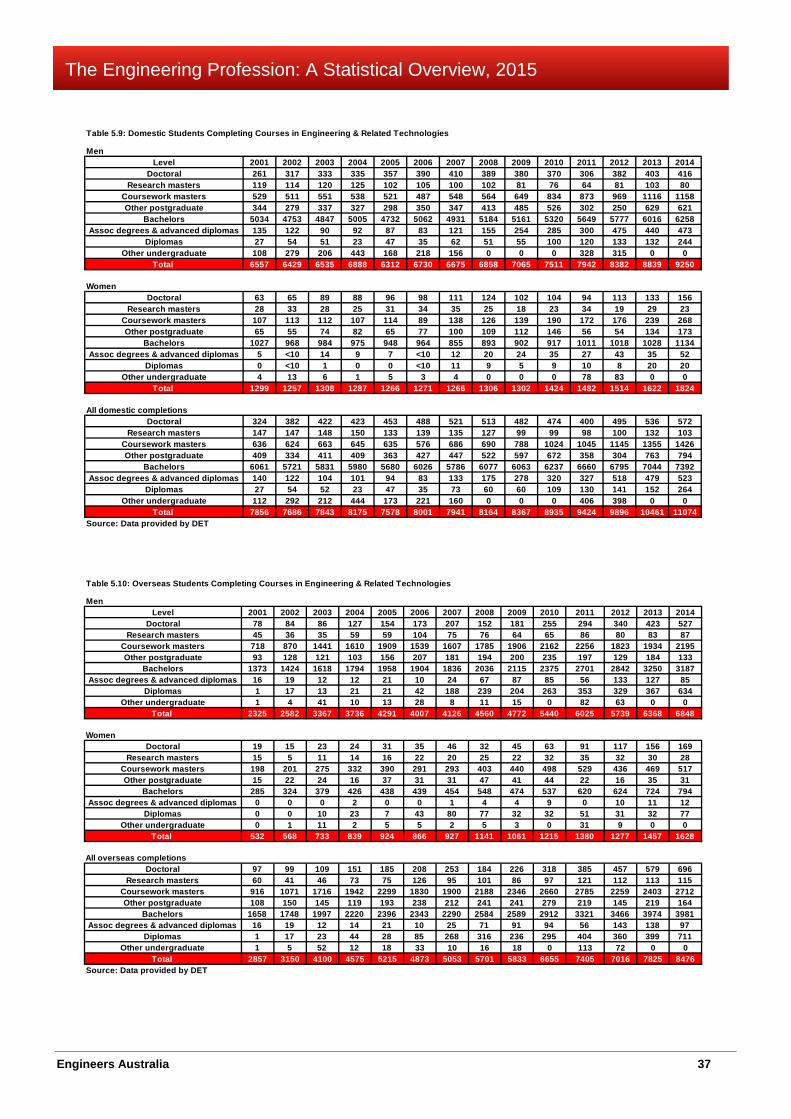
Engineers Australia 37
The Engineering Profession: A Statistical Overview, 2015
Table 5.9: Domestic Students Completing Courses in Engineering & Related Technologies
MenLevel 2001 2002 2003 2004 2005 2006 2007 2008 2009 2010 2011 2012 2013 2014
Doctoral 261 317 333 335 357 390 410 389 380 370 306 382 403 416Research masters 119 114 120 125 102 105 100 102 81 76 64 81 103 80
Coursework masters 529 511 551 538 521 487 548 564 649 834 873 969 1116 1158Other postgraduate 344 279 337 327 298 350 347 413 485 526 302 250 629 621
Bachelors 5034 4753 4847 5005 4732 5062 4931 5184 5161 5320 5649 5777 6016 6258Assoc degrees & advanced diplomas 135 122 90 92 87 83 121 155 254 285 300 475 440 473
Diplomas 27 54 51 23 47 35 62 51 55 100 120 133 132 244Other undergraduate 108 279 206 443 168 218 156 0 0 0 328 315 0 0
Total 6557 6429 6535 6888 6312 6730 6675 6858 7065 7511 7942 8382 8839 9250
WomenDoctoral 63 65 89 88 96 98 111 124 102 104 94 113 133 156
Research masters 28 33 28 25 31 34 35 25 18 23 34 19 29 23Coursework masters 107 113 112 107 114 89 138 126 139 190 172 176 239 268Other postgraduate 65 55 74 82 65 77 100 109 112 146 56 54 134 173
Bachelors 1027 968 984 975 948 964 855 893 902 917 1011 1018 1028 1134Assoc degrees & advanced diplomas 5 <10 14 9 7 <10 12 20 24 35 27 43 35 52
Diplomas 0 <10 1 0 0 <10 11 9 5 9 10 8 20 20Other undergraduate 4 13 6 1 5 3 4 0 0 0 78 83 0 0
Total 1299 1257 1308 1287 1266 1271 1266 1306 1302 1424 1482 1514 1622 1824
All domestic completionsDoctoral 324 382 422 423 453 488 521 513 482 474 400 495 536 572
Research masters 147 147 148 150 133 139 135 127 99 99 98 100 132 103Coursework masters 636 624 663 645 635 576 686 690 788 1024 1045 1145 1355 1426Other postgraduate 409 334 411 409 363 427 447 522 597 672 358 304 763 794
Bachelors 6061 5721 5831 5980 5680 6026 5786 6077 6063 6237 6660 6795 7044 7392Assoc degrees & advanced diplomas 140 122 104 101 94 83 133 175 278 320 327 518 479 523
Diplomas 27 54 52 23 47 35 73 60 60 109 130 141 152 264Other undergraduate 112 292 212 444 173 221 160 0 0 0 406 398 0 0
Total 7856 7686 7843 8175 7578 8001 7941 8164 8367 8935 9424 9896 10461 11074Source: Data provided by DET
Table 5.10: Overseas Students Completing Courses in Engineering & Related Technologies
MenLevel 2001 2002 2003 2004 2005 2006 2007 2008 2009 2010 2011 2012 2013 2014
Doctoral 78 84 86 127 154 173 207 152 181 255 294 340 423 527Research masters 45 36 35 59 59 104 75 76 64 65 86 80 83 87
Coursework masters 718 870 1441 1610 1909 1539 1607 1785 1906 2162 2256 1823 1934 2195Other postgraduate 93 128 121 103 156 207 181 194 200 235 197 129 184 133
Bachelors 1373 1424 1618 1794 1958 1904 1836 2036 2115 2375 2701 2842 3250 3187Assoc degrees & advanced diplomas 16 19 12 12 21 10 24 67 87 85 56 133 127 85
Diplomas 1 17 13 21 21 42 188 239 204 263 353 329 367 634Other undergraduate 1 4 41 10 13 28 8 11 15 0 82 63 0 0
Total 2325 2582 3367 3736 4291 4007 4126 4560 4772 5440 6025 5739 6368 6848
WomenDoctoral 19 15 23 24 31 35 46 32 45 63 91 117 156 169
Research masters 15 5 11 14 16 22 20 25 22 32 35 32 30 28Coursework masters 198 201 275 332 390 291 293 403 440 498 529 436 469 517Other postgraduate 15 22 24 16 37 31 31 47 41 44 22 16 35 31
Bachelors 285 324 379 426 438 439 454 548 474 537 620 624 724 794Assoc degrees & advanced diplomas 0 0 0 2 0 0 1 4 4 9 0 10 11 12
Diplomas 0 0 10 23 7 43 80 77 32 32 51 31 32 77Other undergraduate 0 1 11 2 5 5 2 5 3 0 31 9 0 0
Total 532 568 733 839 924 866 927 1141 1061 1215 1380 1277 1457 1628
All overseas completionsDoctoral 97 99 109 151 185 208 253 184 226 318 385 457 579 696
Research masters 60 41 46 73 75 126 95 101 86 97 121 112 113 115Coursework masters 916 1071 1716 1942 2299 1830 1900 2188 2346 2660 2785 2259 2403 2712Other postgraduate 108 150 145 119 193 238 212 241 241 279 219 145 219 164
Bachelors 1658 1748 1997 2220 2396 2343 2290 2584 2589 2912 3321 3466 3974 3981Assoc degrees & advanced diplomas 16 19 12 14 21 10 25 71 91 94 56 143 138 97
Diplomas 1 17 23 44 28 85 268 316 236 295 404 360 399 711Other undergraduate 1 5 52 12 18 33 10 16 18 0 113 72 0 0
Total 2857 3150 4100 4575 5215 4873 5053 5701 5833 6655 7405 7016 7825 8476Source: Data provided by DET

Engineers Australia 38
The Engineering Profession: A Statistical Overview, 2015
Table 5.11: Students Completing Courses in Engineering & Related Technologies, by Country of Domicile
DomesticLevel 2001 2002 2003 2004 2005 2006 2007 2008 2009 2010 2011 2012 2013 2014
Doctoral 324 382 422 423 453 488 521 513 482 474 400 495 536 572Research masters 147 147 148 150 133 139 135 127 99 99 98 100 132 103
Coursework masters 636 624 663 645 635 576 686 690 788 1024 1045 1145 1355 1426Other postgraduate 409 334 411 409 363 427 447 522 597 672 358 304 763 794
Bachelors 6061 5721 5831 5980 5680 6026 5786 6077 6063 6237 6660 6795 7044 7392Assoc degrees & advanced diplomas 140 122 104 101 94 83 133 175 278 320 327 518 479 523
Diplomas 27 54 52 23 47 35 73 60 60 109 130 141 152 264Other undergraduate 112 292 212 444 173 221 160 0 0 0 406 398 0 0
Total 7856 7686 7843 8175 7578 8001 7941 8164 8367 8935 9424 9896 10461 11074
OverseasDoctoral 97 99 109 151 185 208 253 184 226 318 385 457 579 696
Research masters 60 41 46 73 75 126 95 101 86 97 121 112 113 115Coursework masters 916 1071 1716 1942 2299 1830 1900 2188 2346 2660 2785 2259 2403 2712Other postgraduate 108 150 145 119 193 238 212 241 241 279 219 145 219 164
Bachelors 1658 1748 1997 2220 2396 2343 2290 2584 2589 2912 3321 3466 3974 3981Assoc degrees & advanced diplomas 16 19 12 14 21 10 25 71 91 94 56 143 138 97
Diplomas 1 17 23 44 28 85 268 316 236 295 404 360 399 711Other undergraduate 1 5 52 12 18 33 10 16 18 0 113 72 0 0
Total 2857 3150 4100 4575 5215 4873 5053 5701 5833 6655 7405 7016 7825 8476
All student completionsDoctoral 421 481 531 574 638 696 774 697 708 792 785 952 1115 1268
Research masters 207 188 194 223 208 265 230 228 185 196 219 212 245 218Coursework masters 1552 1695 2379 2587 2934 2406 2586 2878 3134 3684 3830 3404 3758 4138Other postgraduate 517 484 556 528 556 665 659 763 838 951 577 449 982 958
Bachelors 7719 7469 7828 8200 8076 8369 8076 8661 8652 9149 9981 10261 11018 11373Assoc degrees & advanced diplomas 156 141 116 115 115 93 158 246 369 414 383 661 617 620
Diplomas 28 71 75 67 75 120 341 376 296 404 534 501 551 975Other undergraduate 113 297 264 456 191 254 170 16 18 0 519 470 0 0
Total 10713 10836 11943 12750 12793 12874 12994 13865 14200 15590 16829 16912 18286 19550Source: Data provided by DET
Table 5.12: Students Completing Courses in Engineering & Related Technologies, by Gender
MenLevel 2001 2002 2003 2004 2005 2006 2007 2008 2009 2010 2011 2012 2013 2014
Doctoral 339 401 419 462 511 563 617 541 561 625 600 722 826 943Research masters 164 150 155 184 161 209 175 178 145 141 150 161 186 167
Coursework masters 1247 1381 1992 2148 2430 2026 2155 2349 2555 2996 3129 2792 3050 3353Other postgraduate 437 407 458 430 454 557 528 607 685 761 499 379 813 754
Bachelors 6407 6177 6465 6799 6690 6966 6767 7220 7276 7695 8350 8619 9266 9445Assoc degrees & advanced diplomas 151 141 102 104 108 93 145 222 341 370 356 608 567 558
Diplomas 28 71 64 44 68 77 250 290 259 363 473 462 499 878Other undergraduate 109 283 247 453 181 246 164 11 15 0 410 378 0 0
Total 8882 9011 9902 10624 10603 10737 10801 11418 11837 12951 13967 14121 15207 16098
WomenDoctoral 82 80 112 112 127 133 157 156 147 167 185 230 289 325
Research masters 43 38 39 39 47 56 55 50 40 55 69 51 59 51Coursework masters 305 314 387 439 504 380 431 529 579 688 701 612 708 785Other postgraduate 80 77 98 98 102 108 131 156 153 190 78 70 169 204
Bachelors 1312 1292 1363 1401 1386 1403 1309 1441 1376 1454 1631 1642 1752 1928Assoc degrees & advanced diplomas 5 0 14 11 7 0 13 24 28 44 27 53 46 62
Diplomas 0 0 11 23 7 43 91 86 37 41 61 39 52 97Other undergraduate 4 14 17 3 10 8 6 5 3 0 109 92 0 0
Total 1831 1825 2041 2126 2190 2137 2193 2447 2363 2639 2862 2791 3079 3452
All overseas completionsDoctoral 421 481 531 574 638 696 774 697 708 792 785 952 1115 1268
Research masters 207 188 194 223 208 265 230 228 185 196 219 212 245 218Coursework masters 1552 1695 2379 2587 2934 2406 2586 2878 3134 3684 3830 3404 3758 4138Other postgraduate 517 484 556 528 556 665 659 763 838 951 577 449 982 958
Bachelors 7719 7469 7828 8200 8076 8369 8076 8661 8652 9149 9981 10261 11018 11373Assoc degrees & advanced diplomas 156 141 116 115 115 93 158 246 369 414 383 661 617 620
Diplomas 28 71 75 67 75 120 341 376 296 404 534 501 551 975Other undergraduate 113 297 264 456 191 254 170 16 18 0 519 470 0 0
Total 10713 10836 11943 12750 12793 12874 12994 13865 14200 15590 16829 16912 18286 19550Source: Data provided by DET
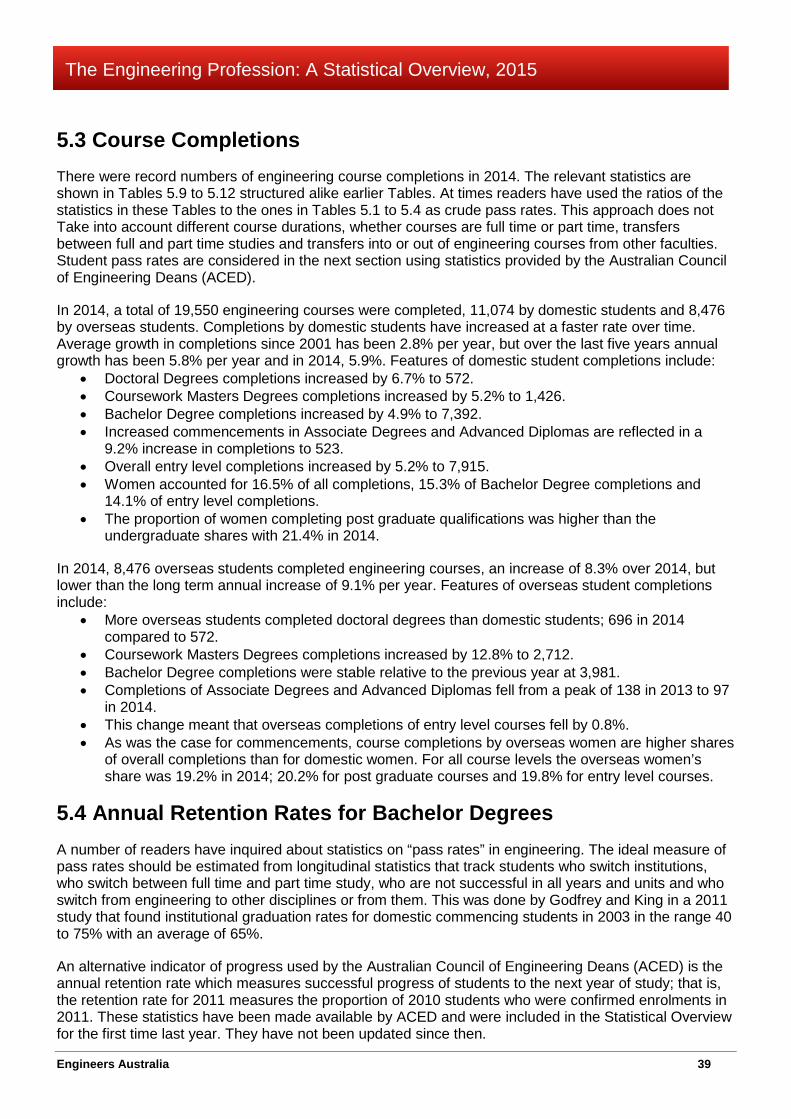
Engineers Australia 39
The Engineering Profession: A Statistical Overview, 2015
5.3 Course Completions There were record numbers of engineering course completions in 2014. The relevant statistics are shown in Tables 5.9 to 5.12 structured alike earlier Tables. At times readers have used the ratios of the statistics in these Tables to the ones in Tables 5.1 to 5.4 as crude pass rates. This approach does not Take into account different course durations, whether courses are full time or part time, transfers between full and part time studies and transfers into or out of engineering courses from other faculties. Student pass rates are considered in the next section using statistics provided by the Australian Council of Engineering Deans (ACED).
In 2014, a total of 19,550 engineering courses were completed, 11,074 by domestic students and 8,476 by overseas students. Completions by domestic students have increased at a faster rate over time. Average growth in completions since 2001 has been 2.8% per year, but over the last five years annual growth has been 5.8% per year and in 2014, 5.9%. Features of domestic student completions include:
• Doctoral Degrees completions increased by 6.7% to 572. • Coursework Masters Degrees completions increased by 5.2% to 1,426. • Bachelor Degree completions increased by 4.9% to 7,392. • Increased commencements in Associate Degrees and Advanced Diplomas are reflected in a
9.2% increase in completions to 523. • Overall entry level completions increased by 5.2% to 7,915. • Women accounted for 16.5% of all completions, 15.3% of Bachelor Degree completions and
14.1% of entry level completions. • The proportion of women completing post graduate qualifications was higher than the
undergraduate shares with 21.4% in 2014.
In 2014, 8,476 overseas students completed engineering courses, an increase of 8.3% over 2014, but lower than the long term annual increase of 9.1% per year. Features of overseas student completions include:
• More overseas students completed doctoral degrees than domestic students; 696 in 2014 compared to 572.
• Coursework Masters Degrees completions increased by 12.8% to 2,712. • Bachelor Degree completions were stable relative to the previous year at 3,981. • Completions of Associate Degrees and Advanced Diplomas fell from a peak of 138 in 2013 to 97
in 2014. • This change meant that overseas completions of entry level courses fell by 0.8%. • As was the case for commencements, course completions by overseas women are higher shares
of overall completions than for domestic women. For all course levels the overseas women’s share was 19.2% in 2014; 20.2% for post graduate courses and 19.8% for entry level courses.
5.4 Annual Retention Rates for Bachelor Degrees A number of readers have inquired about statistics on “pass rates” in engineering. The ideal measure of pass rates should be estimated from longitudinal statistics that track students who switch institutions, who switch between full time and part time study, who are not successful in all years and units and who switch from engineering to other disciplines or from them. This was done by Godfrey and King in a 2011 study that found institutional graduation rates for domestic commencing students in 2003 in the range 40 to 75% with an average of 65%.
An alternative indicator of progress used by the Australian Council of Engineering Deans (ACED) is the annual retention rate which measures successful progress of students to the next year of study; that is, the retention rate for 2011 measures the proportion of 2010 students who were confirmed enrolments in 2011. These statistics have been made available by ACED and were included in the Statistical Overview for the first time last year. They have not been updated since then.

Engineers Australia 40
The Engineering Profession: A Statistical Overview, 2015
Retention statistics can be viewed from different perspectives, but the approach of most interest to the engineering profession is retention of students in engineering and in the institution of enrolment. This measure is shown in Table 5.13 for the past decade differentiating between domestic and overseas students, gender and whether study was full time or part time.
In most university courses, first year students are more likely to drop out of courses for various reasons. About 70% of commencing students were domestic students and 30% were overseas students. In both groups about 90% studied full time. Some of the differences evident in the Table include:
• Retention rates for domestic commencing full time students are lower than for overseas students; averaged over the decade shown in the Table, 83.2% compared to 89.4% for men and 82.7% compared to 90.5% for women.
• The highest retention rates are for overseas women studying full time; 90.5% averaged over the decade.
• Retention rates are significantly lower for commencing students studying part time; averaged over the decade and are lower for men than women; averaged over the decade, 63.5% of domestic men and 58.8% of domestic women proceeded beyond first year and 75.2% of overseas men and 73.7% of overseas women.
• The differential between retention of part time domestic students and part time overseas students was larger than for full time equivalents. Once students progress beyond first year, retention rates increase for full time students and for domestic part time students. However, they are lower for overseas part time students. The differences observed for commencing students are generally repeated.
Table 5.13: Annual Retention Rates for Bachelor Degree Students, in Engineering and in Institution
Year Men Women Men Women Men Women Men Women2001 82.0 81.9 88.1 91.4 85.3 86.8 88.0 91.42002 81.6 82.7 89.2 88.7 84.8 86.4 87.6 89.02003 81.4 80.7 88.9 89.1 84.6 85.5 88.2 89.92004 82.3 82.3 87.5 88.6 85.0 86.7 87.8 89.82005 82.8 81.6 88.2 88.7 85.8 87.0 87.5 89.22006 84.2 83.0 87.8 89.9 86.7 87.7 87.6 89.92007 83.6 84.1 89.7 90.5 86.3 87.8 88.1 89.02008 84.7 82.1 89.9 91.0 87.2 87.2 87.5 90.92009 85.0 83.8 92.7 92.1 87.2 87.7 90.5 92.22010 83.9 84.6 92.0 93.3 86.7 87.5 88.8 91.62011 83.5 82.5 89.9 92.0 86.4 87.0 88.9 90.9
Year Men Women Men Women Men Women Men Women2001 61.7 59.7 69.8 78.8 67.2 68.3 69.9 74.82002 62.3 46.9 62.5 61.5 65.4 63.1 63.9 64.82003 60.5 58.3 73.1 70.1 62.9 62.2 59.7 58.82004 62.6 53.1 74.0 75.0 65.7 60.4 62.0 60.92005 62.4 58.4 72.7 83.0 66.2 65.9 67.2 71.92006 65.0 63.2 77.1 79.0 66.9 66.8 66.9 67.72007 64.2 54.8 74.1 80.9 66.7 68.1 72.4 72.12008 66.8 60.5 80.9 78.5 69.9 64.5 72.5 73.12009 60.3 57.8 82.5 67.7 67.0 65.6 72.4 70.02010 66.7 72.2 83.6 78.1 67.9 67.0 70.8 66.32011 66.1 62.1 77.2 57.6 68.5 66.9 69.0 57.3
Source: Australian Council Of Engineering Deans
Part Time Commencing Students All Part Time StudentsDomestic Students Overseas Students Domestic Students Overseas Students
Domestic Students Overseas StudentsFull Time Commencing Students All Full Time Students
Domestic Students Overseas Students

Engineers Australia 41
The Engineering Profession: A Statistical Overview, 2015
5.5 The Engineering Share of Course Completions Since 2001, engineering course completions have averaged 5.0% of all completions for domestic students and 6.8% for overseas students. All shares have been calculated within the respective student groups. There have been some annual variations, greater among overseas students, as shown in Figure 5.1. The share for domestic students has been comparatively stable. However, in the case of overseas students the changes illustrated appear to reflect changes in the Australian exchange rate. In recent years, the share of completions for overseas students has increased strongly and in 2014 was 8.2%.
Overseas students appear to be particularly attracted to Australian post graduate engineering courses. Figure 5.2 illustrates the domestic and overseas engineering shares for completions of doctoral degrees. The first point to note is that engineers have a higher propensity to complete doctoral degrees than courses in general. On average domestic engineering students complete 10.3% of doctoral completions, over twice the average for all courses. This share has moved in a narrow range since 2001 and in 2014 was higher than average at 10.8%.
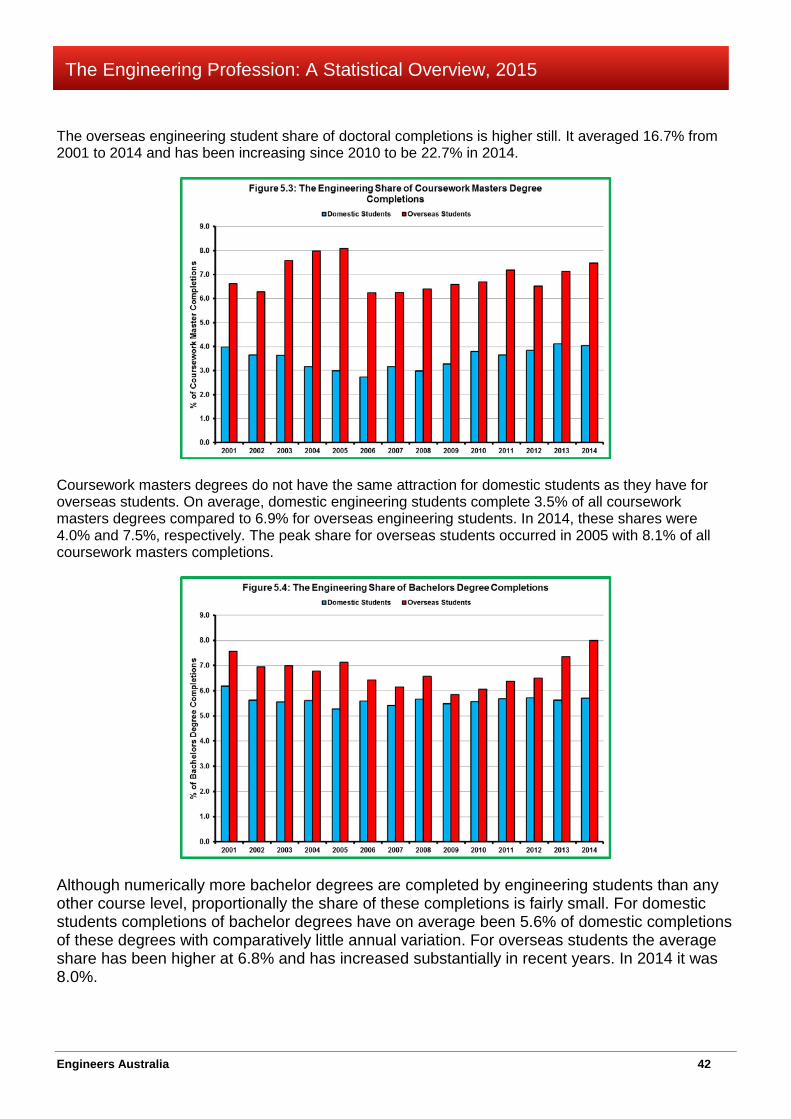
Engineers Australia 42
The Engineering Profession: A Statistical Overview, 2015
The overseas engineering student share of doctoral completions is higher still. It averaged 16.7% from 2001 to 2014 and has been increasing since 2010 to be 22.7% in 2014.
Coursework masters degrees do not have the same attraction for domestic students as they have for overseas students. On average, domestic engineering students complete 3.5% of all coursework masters degrees compared to 6.9% for overseas engineering students. In 2014, these shares were 4.0% and 7.5%, respectively. The peak share for overseas students occurred in 2005 with 8.1% of all coursework masters completions.
Although numerically more bachelor degrees are completed by engineering students than any other course level, proportionally the share of these completions is fairly small. For domestic students completions of bachelor degrees have on average been 5.6% of domestic completions of these degrees with comparatively little annual variation. For overseas students the average share has been higher at 6.8% and has increased substantially in recent years. In 2014 it was 8.0%.

Engineers Australia 43
The Engineering Profession: A Statistical Overview, 2015
5.6 State and Territory Engineering Course Completions This year, details of engineering course completions in States and Territories are outlined in separate reports available from Engineers Australia’s web site (www.engineersaustralia.org.au ).
Engineers Australia 44
The Engineering Profession: A Statistical Overview, 2015
Chapter 6 Developing Our Own Engineers Main Points This Chapter aims to do three things; first, we examine the labour market destinations of new engineering graduates and compare these choices; second, we examine the labour market experiences of new engineering graduates focusing on the period since 2012; and finally, we examine entry level completions of courses acceptable for inclusion in the engineering team to assess trends in the addition to supply of engineers from this source.
On average about 63.5% of new graduates prefer full time work, 11.5% prefer part time work, 19.8% prefer more full time study and just over 5% prefer none of these options. More new engineering graduates prefer to work full time (83.2%), fewer prefer to work part time (3.5%) and fewer prefer to go on to full time study (9.1%). This difference suggests that the loss of full time work is more critical for engineers.
Turning to the actual labour market experiences of new graduates available for work, there has been little difference between new engineers and all new graduates finding some sort of work. However, the mix between full time and part time work outcomes reflects the above preferences. In the past two years and consistent with indicators showing a softening of the labour market, the proportion of new engineering graduates succeeding in finding full time work has fallen to be almost the same as for all new graduates and more new engineering graduates have accepted part time work. Most importantly, there has been a large increase in the proportion of new engineering graduates available for work that was unemployed. This proportion was higher for engineers than new graduates as a whole in 2014.
The Chapter provides a range of detailed statistics on completions of entry level engineering courses for the three components the engineering team. Abstracting from the labour market-study preferences mentioned above, these statistics facilitate estimates of the annual change in the supply of engineers from the outcomes of the engineering education system.
In 2014, 9,667 new engineers were available to join the engineering labour force, 3.9% more than in 2013 and by far the highest number since 2002. The average annual increase has been 3.1% and has been much higher in the past three to four years.
• The number of additional associate engineers was 2,303, up 2.0% on the previous year; 9.0% were women.
• The number of additional engineering technologists was 609, up 25.6% on 2013; 25.1% were women.
• The number of additional professional engineers was 6,755, up 3.0% on 2013; 14.8% were women
6.1 Terminology This chapter looks at annual completions of entry level engineering courses, Bachelor Degrees, Associate Degrees and Advanced Diplomas, in more detail. A small number of universities offer Coursework Masters programs as an entry qualification for Professional Engineer. Most graduates are overseas students seeking to upgrade qualifications from their home country and who subsequently need to negotiate migration formalities before joining the Australian labour market. These graduates are included in the migration statistics covered in the next Chapter. A very small number of domestic graduates also progress through this route, mainly as a means of articulating from Associate Engineer or Engineering Technologists qualifications to another grade. The numbers involved cannot be separately
Engineers Australia 45
The Engineering Profession: A Statistical Overview, 2015
identified causing a small undercount of new graduates to Professional Engineers. But, most are already included in the count of new entrants to engineering by virtue of their existing qualifications.
Before moving on two important caveats need some emphasis. The first has already been mentioned; only statistics relating to domestic completions are taken into account. Overseas student who complete entry level engineering qualifications must obtain either permanent or temporary visas under Australia’s skilled migration programs in order to work in Australia. These statistics are discussed in the Chapter on Skilled Migration.
The second caveat relates to the count of statistics in various engineering specialisations. This issue relates to the way statistics are reported by the universities to Commonwealth authorities. Rather than coding completions to particular specialisations, at times they are attributed to general overflow categories in the statistical framework, causing large discontinuities in annual time series. This problem is most acute for the levels of disaggregation most useful to reader, the four and six digit levels in the Australian and New Zealand Standard Classification of Occupations. The problem can largely be resolved through aggregation to the three digit level, though even here, there are unusually large numbers in catch all “other” categories like ANZSCO 0300 Engineering and Related Technologies (not further defined) and 0399 Other Engineering and Related Technologies which unfortunately also includes several important engineering specialisations.
The following key shows how more familiar engineering specialisations at the four digit level combine into the three digit level statistics reported in this Chapter.
• Engineering and Related Technologies (not further defined)
• Process and Resource Engineering includes o Chemical Engineering o Mining Engineering o Materials Engineering o Food Processing Technology
• Mechanical and Industrial Engineering includes o Mechanical Engineers o Industrial engineers
• Civil Engineering includes o Civil Engineers o Construction Engineers o Building Services Engineers o Water and Sanitary Engineers o Transport Engineers o Geotechnical Engineers o Ocean Engineers
• Electrical and Electronic Engineering includes o Electrical Engineers o Electronic Engineers o Computer Engineers o Communication Technologies
• Aerospace Engineering includes o Aerospace Engineers o Aircraft Maintenance Engineers
• Maritime Engineering includes o Maritime Engineers o Maritime Construction Engineers
• Other Engineering includes o Environmental Engineers
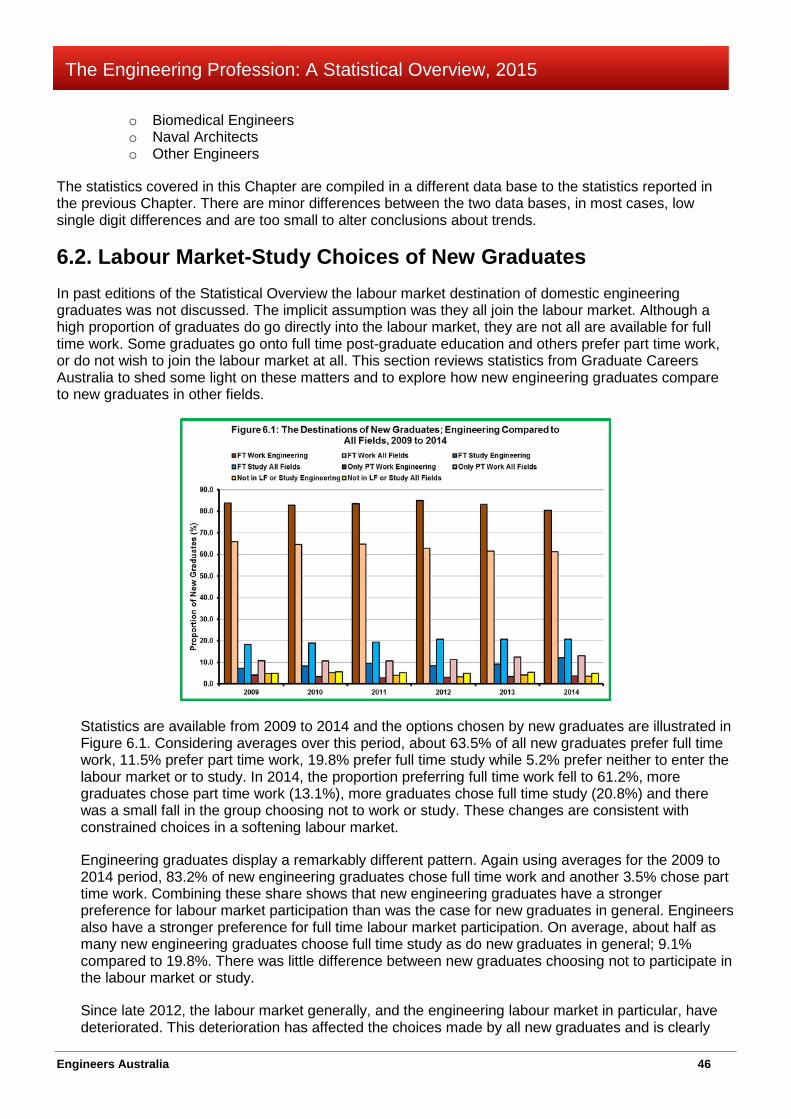
Engineers Australia 46
The Engineering Profession: A Statistical Overview, 2015
o Biomedical Engineers o Naval Architects o Other Engineers
The statistics covered in this Chapter are compiled in a different data base to the statistics reported in the previous Chapter. There are minor differences between the two data bases, in most cases, low single digit differences and are too small to alter conclusions about trends.
6.2. Labour Market-Study Choices of New Graduates In past editions of the Statistical Overview the labour market destination of domestic engineering graduates was not discussed. The implicit assumption was they all join the labour market. Although a high proportion of graduates do go directly into the labour market, they are not all are available for full time work. Some graduates go onto full time post-graduate education and others prefer part time work, or do not wish to join the labour market at all. This section reviews statistics from Graduate Careers Australia to shed some light on these matters and to explore how new engineering graduates compare to new graduates in other fields.
Statistics are available from 2009 to 2014 and the options chosen by new graduates are illustrated in Figure 6.1. Considering averages over this period, about 63.5% of all new graduates prefer full time work, 11.5% prefer part time work, 19.8% prefer full time study while 5.2% prefer neither to enter the labour market or to study. In 2014, the proportion preferring full time work fell to 61.2%, more graduates chose part time work (13.1%), more graduates chose full time study (20.8%) and there was a small fall in the group choosing not to work or study. These changes are consistent with constrained choices in a softening labour market.
Engineering graduates display a remarkably different pattern. Again using averages for the 2009 to 2014 period, 83.2% of new engineering graduates chose full time work and another 3.5% chose part time work. Combining these share shows that new engineering graduates have a stronger preference for labour market participation than was the case for new graduates in general. Engineers also have a stronger preference for full time labour market participation. On average, about half as many new engineering graduates choose full time study as do new graduates in general; 9.1% compared to 19.8%. There was little difference between new graduates choosing not to participate in the labour market or study.
Since late 2012, the labour market generally, and the engineering labour market in particular, have deteriorated. This deterioration has affected the choices made by all new graduates and is clearly
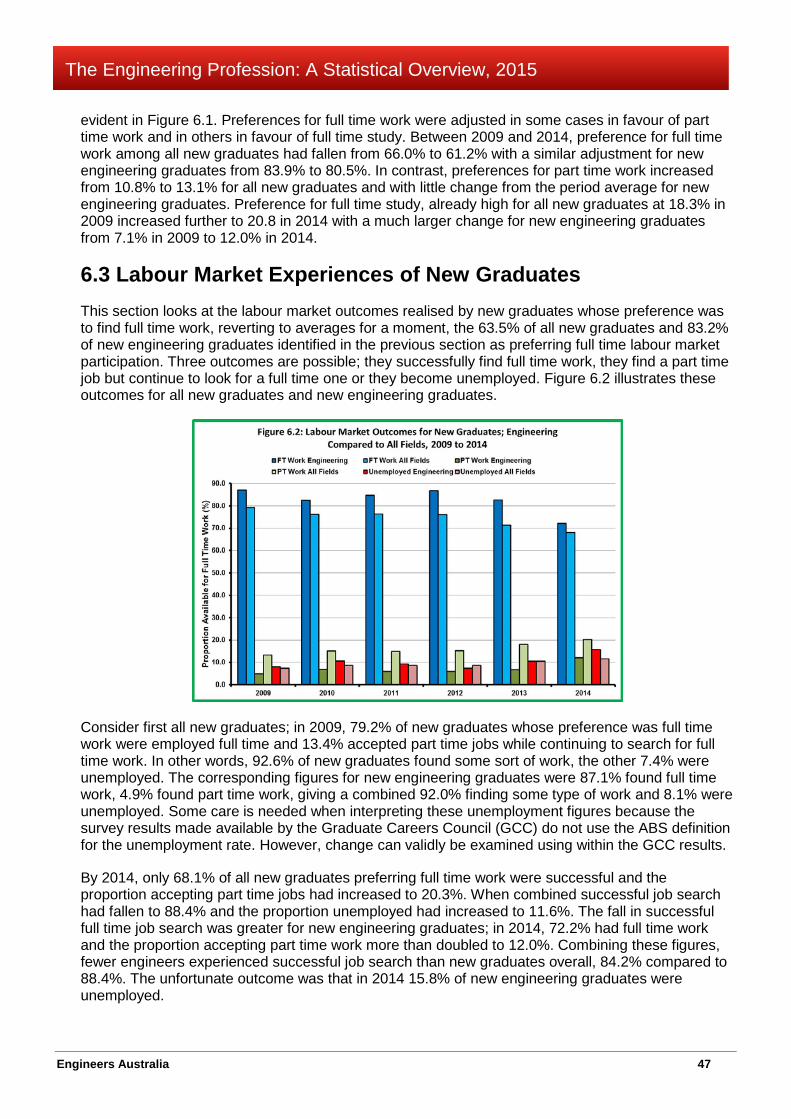
Engineers Australia 47
The Engineering Profession: A Statistical Overview, 2015
evident in Figure 6.1. Preferences for full time work were adjusted in some cases in favour of part time work and in others in favour of full time study. Between 2009 and 2014, preference for full time work among all new graduates had fallen from 66.0% to 61.2% with a similar adjustment for new engineering graduates from 83.9% to 80.5%. In contrast, preferences for part time work increased from 10.8% to 13.1% for all new graduates and with little change from the period average for new engineering graduates. Preference for full time study, already high for all new graduates at 18.3% in 2009 increased further to 20.8 in 2014 with a much larger change for new engineering graduates from 7.1% in 2009 to 12.0% in 2014.
6.3 Labour Market Experiences of New Graduates
This section looks at the labour market outcomes realised by new graduates whose preference was to find full time work, reverting to averages for a moment, the 63.5% of all new graduates and 83.2% of new engineering graduates identified in the previous section as preferring full time labour market participation. Three outcomes are possible; they successfully find full time work, they find a part time job but continue to look for a full time one or they become unemployed. Figure 6.2 illustrates these outcomes for all new graduates and new engineering graduates.
Consider first all new graduates; in 2009, 79.2% of new graduates whose preference was full time work were employed full time and 13.4% accepted part time jobs while continuing to search for full time work. In other words, 92.6% of new graduates found some sort of work, the other 7.4% were unemployed. The corresponding figures for new engineering graduates were 87.1% found full time work, 4.9% found part time work, giving a combined 92.0% finding some type of work and 8.1% were unemployed. Some care is needed when interpreting these unemployment figures because the survey results made available by the Graduate Careers Council (GCC) do not use the ABS definition for the unemployment rate. However, change can validly be examined using within the GCC results.
By 2014, only 68.1% of all new graduates preferring full time work were successful and the proportion accepting part time jobs had increased to 20.3%. When combined successful job search had fallen to 88.4% and the proportion unemployed had increased to 11.6%. The fall in successful full time job search was greater for new engineering graduates; in 2014, 72.2% had full time work and the proportion accepting part time work more than doubled to 12.0%. Combining these figures, fewer engineers experienced successful job search than new graduates overall, 84.2% compared to 88.4%. The unfortunate outcome was that in 2014 15.8% of new engineering graduates were unemployed.

Engineers Australia 48
The Engineering Profession: A Statistical Overview, 2015
The deterioration in the engineering labour market resulted in much higher unemployment among new engineering graduates than all new graduates. We saw in Chapter 5 that record numbers of entry level graduates completed engineering courses in 2014. Based on commencement figures, there is every chance that engineering completions could continue to rise or at least remain at very high levels for another two years, possibly longer. However, Chapter 4 showed that applications for places in engineering courses and subsequent acceptances of offers had all fallen in 2014. While it is too early to call this a trend change, the indications are that labour market factors are feeding back into student choices and there is every likelihood that numbers in engineering education could taper off in the near future.
The balance of this Chapter looks at the flow of new engineering graduates and associate graduates into the supply of engineers. Section 6.2 showed that modelling this flow is no simple exercise. Graduates who move into full time study obviously do not join the labour force immediately but delay this step by the duration of their course. The proportion of new graduates who choose not to study or to participate in the labour market is comparatively small. The approach taken in Table 6.6 which consolidates statistics is to make no adjustments to statistics and to treat them as the potential flow into the labour supply.
6.4 Engineering Technologists The entry level qualification required to become an Engineering Technologist is completion of an accredited three year full time (or part time equivalent) Bachelor Degree in engineering. Table 6.1 shows completions for this qualification since 2001 using the classification system briefly discussed at the beginning of the Chapter.
Completions of three year degrees in engineering have exhibited year on year variation but there is no obvious trend. In 2001, there were 629 completions and in the latest year, 2014, there were 644. Completions peaked at the comparatively high figure of 847 in 2006 but there is reason to believe that some of these completions were brought forward from 2006 were there was an unusually low outcome. Some features of Table 6.1 include:
Table 6.1: Domestic Students Completing Three Year Bachelors Degrees in Engineering
MenASCED Specialisation 2001 2002 2003 2004 2005 2006 2007 2008 2009 2010 2011 2012 2013 2014
0300 Engineering & Related Technologies 66 59 64 62 63 59 45 54 42 20 16 9 8 100301 Manufacturing Engineering & Technology 18 14 3 3 5 4 5 0 < 5 < 5 < 5 <5 6 <50303 Process & Resource Engineering 43 27 32 18 19 54 19 23 23 17 24 15 16 160305 Automotive Engineering & Technology 0 0 0 0 0 0 0 1 9 < 5 6 <5 <5 <50307 Mechanical & Industrial Engineering & Technology 34 49 30 21 22 35 9 13 < 5 6 6 5 <5 <50309 Civil Engineering 14 13 7 19 23 39 13 18 12 5 < 5 0 <5 <50311 Geomatic Engineering 42 65 75 48 23 22 17 18 26 16 31 24 22 320313 Electrical & Electronic Engineering & Technology 124 106 102 110 159 203 130 112 73 61 31 28 23 120315 Aerospace Engineering & Technology 79 102 111 109 147 175 140 171 130 127 139 189 196 2450317 Martime Engineering & Technology 2 3 4 2 6 0 2 1 < 5 < 5 < 5 <5 <5 250399 Other Engineering & Technology 109 102 96 96 94 100 110 91 115 84 115 142 119 142
03 Total 531 540 524 488 561 691 490 502 439 346 377 419 400 490
Women0300 Engineering & Related Technologies 18 4 12 7 15 3 7 1 < 5 5 < 5 0 <5 <50301 Manufacturing Engineering & Technology 2 3 5 4 13 10 8 23 29 44 43 29 56 810303 Process & Resource Engineering 18 20 14 10 <10 31 12 20 10 7 7 11 <5 100305 Automotive Engineering & Technology 0 0 0 0 0 0 0 0 < 5 0 0 0 0 00307 Mechanical & Industrial Engineering & Technology 3 3 2 1 2 2 1 1 0 0 0 0 0 00309 Civil Engineering 0 2 4 0 4 12 0 <10 0 0 0 0 0 00311 Geomatic Engineering 10 24 16 17 12 14 9 12 11 5 9 <5 5 <50313 Electrical & Electronic Engineering & Technology 12 9 6 18 52 41 34 24 29 21 13 8 5 <50315 Aerospace Engineering & Technology 14 22 19 23 28 29 31 39 25 25 32 31 28 410317 Maritime Engineering & Technology 1 1 0 0 1 0 0 0 0 0 0 0 <5 00399 Other Engineering & Technology 20 13 10 8 7 14 5 9 7 10 11 15 14 19
03 Total 98 101 88 88 139 156 109 130 116 117 117 99 112 154
All domestic graduations0300 Engineering & Related Technologies 84 63 76 69 78 62 52 55 46 25 18 9 9 110301 Manufacturing Engineering & Technology 20 17 8 7 18 14 13 23 30 48 47 31 62 830303 Process & Resource Engineering 61 47 46 28 19 85 31 43 33 24 31 26 19 260305 Automotive Engineering & Technology 0 0 0 0 0 0 0 1 10 < 5 6 <5 <5 <50307 Mechanical & Industrial Engineering & Technology 37 52 32 22 24 37 10 14 < 5 6 6 5 <5 <50309 Civil Engineering 14 15 11 19 27 51 13 18 12 5 < 5 0 <5 <50311 Geomatic Engineering 52 89 91 65 35 36 26 30 37 21 40 28 27 340313 Electrical & Electronic Engineering & Technology 136 115 108 128 211 244 164 136 102 82 44 36 28 130315 Aerospace Engineering & Technology 93 124 130 132 175 204 171 210 155 152 171 220 224 2860317 Maritime Engineering & Technology 3 4 4 2 7 0 2 1 < 5 < 5 < 5 <5 <5 250399 Other Engineering & Technology 129 115 106 104 101 114 115 100 122 94 126 157 133 161
03 Total 629 641 612 576 700 847 599 632 555 463 494 518 512 644Source: Data supplied by DET
Engineers Australia 49
The Engineering Profession: A Statistical Overview, 2015
• The dominant specialisation was Aerospace Engineering where in 2014 there were 286 completions, 44.4% of the total. There has been steady growth in this group since 2001.
• There were 83 completions in Manufacturing Engineering in 2014, almost all were women. • There was an extraordinary fall in completions in Electrical and Electronic Engineering from 136
in 2001 and 244 in 2006 to just 13 in 2014. • The group Other Engineering which includes Environmental and Biomedical Engineering had 161
completions in 2014.
• Overall, the proportion of women completing three year degrees was 23.9%, but most was in Manufacturing and Aerospace Engineering.
• Few universities offer three year degrees in engineering.
6.5 Professional Engineers The most common entry level qualification for Professional Engineers is completion of a four year full time (or equivalent part time) Bachelor Degree in engineering. Most students undertake this course as a single Degree, but others study it as part of a double Degree combination. Statistics for completions of these Degrees are shown in Tables 6.221 and 6.3, respectively. A small number of universities offer Masters Degree level entry qualifications, including the relatively new arrangements in Victoria. Completions for these courses are small but likely to grow, but at this stage statistics are not available.
Completions of four year degrees in engineering fell between 2001 and 2006 from 4,100 to 3,707. The latter years of this period saw the emergence of engineering skill shortages resulting from escalating demand in the resource sector and an upsurge in infrastructure development. Pressures from these developments helped to encourage more students into engineering courses and have been a steady upward trend since and in 2014 there were 4,938 completions, the highest number on record.
Understanding the distribution of completions across engineering disciplines in difficult because of the propensity of university administrators to allocate statistics to catch all “other” categories. There are two such categories in the Tables; the first is abbreviated in the Table from “Engineering and Related Technologies not further defined” and the second is “Other Engineering and Technology”. To some extent the latter is a legitimate category because it includes several important strands of engineering detailed at the beginning of this Chapter. However, it also includes a large number of completions allocated to “Other Engineering”.
Between them the two categories discussed in the previous paragraph included 2008 or 40.7% of completions of four year degrees in 2014. There is no information available about how this outcome impacts numbers in the remaining more familiar categories in the Table and so the points made below are necessarily limited in value. Other features of Table 6.2 are:
• The largest number of completions in 2014 was in Civil Engineering with 1,018 completions, an increase of 5.7% on 2013 and 40.4% higher than completions in 2001. There were 145 completions by women, 14.2%.
• The decline in completions in Electrical and Electronic Engineering has continued. In 2014, there were 511 completions, 1.7% fewer than in 2013 and 55.4% fewer than in 2001. There were 43 completions by women in 2014, 4.2% of completions.
• Completions in Mechanical and Industrial Engineering and Technology have been fairly stable within a narrow band since 2001. The lowest number of completions occurred in 2005 with 559 and the highest in 2013 with 677. In 2014 there were 601 completions. There were 47 completions by women in 2014, 7.8% of the total.
21 Table 6.2 includes 248 completions (204 men and 44 women) in 2005 from courses of unknown duration. This situation resulted from coding abnormalities by some universities. Inspection of past completions and completions since 2005 for those universities suggest that the unknown durations were most likely four year courses and they have been treated as such.
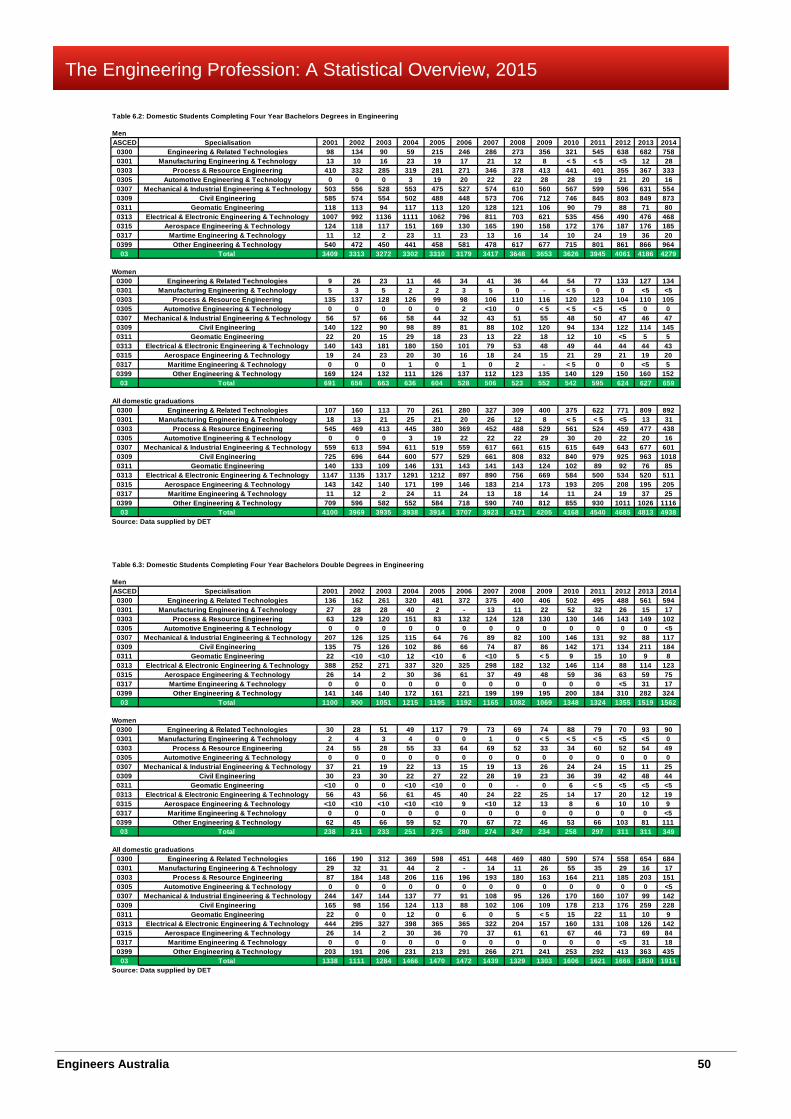
Engineers Australia 50
The Engineering Profession: A Statistical Overview, 2015
Table 6.2: Domestic Students Completing Four Year Bachelors Degrees in Engineering
MenASCED Specialisation 2001 2002 2003 2004 2005 2006 2007 2008 2009 2010 2011 2012 2013 2014
0300 Engineering & Related Technologies 98 134 90 59 215 246 286 273 356 321 545 638 682 7580301 Manufacturing Engineering & Technology 13 10 16 23 19 17 21 12 8 < 5 < 5 <5 12 280303 Process & Resource Engineering 410 332 285 319 281 271 346 378 413 441 401 355 367 3330305 Automotive Engineering & Technology 0 0 0 3 19 20 22 22 28 28 19 21 20 160307 Mechanical & Industrial Engineering & Technology 503 556 528 553 475 527 574 610 560 567 599 596 631 5540309 Civil Engineering 585 574 554 502 488 448 573 706 712 746 845 803 849 8730311 Geomatic Engineering 118 113 94 117 113 120 128 121 106 90 79 88 71 800313 Electrical & Electronic Engineering & Technology 1007 992 1136 1111 1062 796 811 703 621 535 456 490 476 4680315 Aerospace Engineering & Technology 124 118 117 151 169 130 165 190 158 172 176 187 176 1850317 Martime Engineering & Technology 11 12 2 23 11 23 13 16 14 10 24 19 36 200399 Other Engineering & Technology 540 472 450 441 458 581 478 617 677 715 801 861 866 964
03 Total 3409 3313 3272 3302 3310 3179 3417 3648 3653 3626 3945 4061 4186 4279
Women0300 Engineering & Related Technologies 9 26 23 11 46 34 41 36 44 54 77 133 127 1340301 Manufacturing Engineering & Technology 5 3 5 2 2 3 5 0 - < 5 0 0 <5 <50303 Process & Resource Engineering 135 137 128 126 99 98 106 110 116 120 123 104 110 1050305 Automotive Engineering & Technology 0 0 0 0 0 2 <10 0 < 5 < 5 < 5 <5 0 00307 Mechanical & Industrial Engineering & Technology 56 57 66 58 44 32 43 51 55 48 50 47 46 470309 Civil Engineering 140 122 90 98 89 81 88 102 120 94 134 122 114 1450311 Geomatic Engineering 22 20 15 29 18 23 13 22 18 12 10 <5 5 50313 Electrical & Electronic Engineering & Technology 140 143 181 180 150 101 79 53 48 49 44 44 44 430315 Aerospace Engineering & Technology 19 24 23 20 30 16 18 24 15 21 29 21 19 200317 Maritime Engineering & Technology 0 0 0 1 0 1 0 2 - < 5 0 0 <5 50399 Other Engineering & Technology 169 124 132 111 126 137 112 123 135 140 129 150 160 152
03 Total 691 656 663 636 604 528 506 523 552 542 595 624 627 659
All domestic graduations0300 Engineering & Related Technologies 107 160 113 70 261 280 327 309 400 375 622 771 809 8920301 Manufacturing Engineering & Technology 18 13 21 25 21 20 26 12 8 < 5 < 5 <5 13 310303 Process & Resource Engineering 545 469 413 445 380 369 452 488 529 561 524 459 477 4380305 Automotive Engineering & Technology 0 0 0 3 19 22 22 22 29 30 20 22 20 160307 Mechanical & Industrial Engineering & Technology 559 613 594 611 519 559 617 661 615 615 649 643 677 6010309 Civil Engineering 725 696 644 600 577 529 661 808 832 840 979 925 963 10180311 Geomatic Engineering 140 133 109 146 131 143 141 143 124 102 89 92 76 850313 Electrical & Electronic Engineering & Technology 1147 1135 1317 1291 1212 897 890 756 669 584 500 534 520 5110315 Aerospace Engineering & Technology 143 142 140 171 199 146 183 214 173 193 205 208 195 2050317 Maritime Engineering & Technology 11 12 2 24 11 24 13 18 14 11 24 19 37 250399 Other Engineering & Technology 709 596 582 552 584 718 590 740 812 855 930 1011 1026 1116
03 Total 4100 3969 3935 3938 3914 3707 3923 4171 4205 4168 4540 4685 4813 4938Source: Data supplied by DET
Table 6.3: Domestic Students Completing Four Year Bachelors Double Degrees in Engineering
MenASCED Specialisation 2001 2002 2003 2004 2005 2006 2007 2008 2009 2010 2011 2012 2013 2014
0300 Engineering & Related Technologies 136 162 261 320 481 372 375 400 406 502 495 488 561 5940301 Manufacturing Engineering & Technology 27 28 28 40 2 - 13 11 22 52 32 26 15 170303 Process & Resource Engineering 63 129 120 151 83 132 124 128 130 130 146 143 149 1020305 Automotive Engineering & Technology 0 0 0 0 0 0 0 0 0 0 0 0 0 <50307 Mechanical & Industrial Engineering & Technology 207 126 125 115 64 76 89 82 100 146 131 92 88 1170309 Civil Engineering 135 75 126 102 86 66 74 87 86 142 171 134 211 1840311 Geomatic Engineering 22 <10 <10 12 <10 6 <10 5 < 5 9 15 10 9 80313 Electrical & Electronic Engineering & Technology 388 252 271 337 320 325 298 182 132 146 114 88 114 1230315 Aerospace Engineering & Technology 26 14 2 30 36 61 37 49 48 59 36 63 59 750317 Martime Engineering & Technology 0 0 0 0 0 0 0 0 0 0 0 <5 31 170399 Other Engineering & Technology 141 146 140 172 161 221 199 199 195 200 184 310 282 324
03 Total 1100 900 1051 1215 1195 1192 1165 1082 1069 1348 1324 1355 1519 1562
Women0300 Engineering & Related Technologies 30 28 51 49 117 79 73 69 74 88 79 70 93 900301 Manufacturing Engineering & Technology 2 4 3 4 0 0 1 0 < 5 < 5 < 5 <5 <5 00303 Process & Resource Engineering 24 55 28 55 33 64 69 52 33 34 60 52 54 490305 Automotive Engineering & Technology 0 0 0 0 0 0 0 0 0 0 0 0 0 00307 Mechanical & Industrial Engineering & Technology 37 21 19 22 13 15 19 13 26 24 24 15 11 250309 Civil Engineering 30 23 30 22 27 22 28 19 23 36 39 42 48 440311 Geomatic Engineering <10 0 0 <10 <10 0 0 - 0 6 < 5 <5 <5 <50313 Electrical & Electronic Engineering & Technology 56 43 56 61 45 40 24 22 25 14 17 20 12 190315 Aerospace Engineering & Technology <10 <10 <10 <10 <10 9 <10 12 13 8 6 10 10 90317 Maritime Engineering & Technology 0 0 0 0 0 0 0 0 0 0 0 0 0 <50399 Other Engineering & Technology 62 45 66 59 52 70 67 72 46 53 66 103 81 111
03 Total 238 211 233 251 275 280 274 247 234 258 297 311 311 349
All domestic graduations0300 Engineering & Related Technologies 166 190 312 369 598 451 448 469 480 590 574 558 654 6840301 Manufacturing Engineering & Technology 29 32 31 44 2 - 14 11 26 55 35 29 16 170303 Process & Resource Engineering 87 184 148 206 116 196 193 180 163 164 211 185 203 1510305 Automotive Engineering & Technology 0 0 0 0 0 0 0 0 0 0 0 0 0 <50307 Mechanical & Industrial Engineering & Technology 244 147 144 137 77 91 108 95 126 170 160 107 99 1420309 Civil Engineering 165 98 156 124 113 88 102 106 109 178 213 176 259 2280311 Geomatic Engineering 22 0 0 12 0 6 0 5 < 5 15 22 11 10 90313 Electrical & Electronic Engineering & Technology 444 295 327 398 365 365 322 204 157 160 131 108 126 1420315 Aerospace Engineering & Technology 26 14 2 30 36 70 37 61 61 67 46 73 69 840317 Maritime Engineering & Technology 0 0 0 0 0 0 0 0 0 0 0 <5 31 180399 Other Engineering & Technology 203 191 206 231 213 291 266 271 241 253 292 413 363 435
03 Total 1338 1111 1284 1466 1470 1472 1439 1329 1303 1606 1621 1666 1830 1911Source: Data supplied by DET

Engineers Australia 51
The Engineering Profession: A Statistical Overview, 2015
• There were 438 completions in Process and Resource Engineering, down 9.9% on 2013 and down 21.9% on the peak which occurred in 2010. There were 105 completions by women in 2014, 24.0% of the total.
• Completions in Aerospace Engineering continue to grow, albeit slowly, with 205 completions in 2014; 9.8% were women.
• Finally, there were 16 four year degree completions in Automotive Engineering just as it has been announced that motor vehicle production in Australia is to cease in the next two years.
Another qualification is necessary in respect of the statistics in Table 6.3. Statistics on double Degrees are sometimes collected according to engineering discipline, sometimes according to field of the second Degree and sometimes according to both. The result is that the column totals may not necessarily be the sum of its components. The Department assures us that totals are accurate.
In 2014, there were 1,911 completions of double Degrees in engineering, an increase of 4.4% on 2013 and 72.0% higher than the low point recorded in the Table in 2002. A key feature of Table 6.3 is that 349 completions or 18.3% were by women compared to 13.3% in Table 6.2. Allocation of statistics to engineering specialisations is an even bigger problem for Table 6.3; 1,119 or 58.6% of completions are in the two “catch all categories”. Given this issue it is somewhat pointless to discuss trends in the Table. The key areas that are noteworthy are; 151 completions in Process and Resource Engineering, 142 completions in Mechanical and Industrial Engineering, 142 completions in Electrical and Electronic Engineering and 84 completions in Aerospace Engineering.
6.6 Associate Engineers Entry to the engineering Team as an Associate engineer can occur either by completing a two year full time Associate Degree in engineering or a two year full time Advanced Diploma in engineering. Courses leading to these qualifications are available from both universities and TAFE colleges. University outcomes for these courses were included in the aggregate statistics discussed in Chapter 5 and here more disaggregated statistics are provided in Table 6.4. Completions statistics for TAFE courses were sourced from the National Centre for Vocational Education Research (NCVER) from information provided by State and Territory TAFEs. These statistics are presented in Table 6.5.
The main feature of Table 6.4 is that the trend in associate completions has been steadily upwards throughout the period being examined. From 135 completions in 2001, numbers have increased to 503 in 2014. These are small numbers in the overall scheme of things reflecting the fact that just a hand full of universities offer engineering courses at this level. Not much can be read into the distribution of completions other the upsurge in Civil Engineering since 2010. Civil Engineers were in high demand during the skill shortage but the timing of the completions shown in the Table points to the timing difficulties in responding to skill shortages because engineering courses are at least two years full time study, longer if part time study is involved.
The numbers of associate engineer completions in Table 6.5 are more substantial than those in Table 6.4; however the latest statistics are for 2013. In that year there were 1,786 completions, down 5.4% on 2012, but still the second highest level of completions since 2001. The Table shows a fairly widespread distribution of completions across engineering disciplines but what does not come through in national statistics is that completions in States and Territories are often narrowly concentrated in one or two areas with very few completions in the remainder. The three highest numbers of completions are in:
• Electrical and Electronic Engineering where there were 732 completions in 2014 • Manufacturing Engineering where there were 405 completions • Civil engineering where there were 309 completions and • Aerospace engineering where there were 163 completions.
Participation by women in TAFE courses is much lower than at universities and in 2014 just 8.3% of completions were by women.
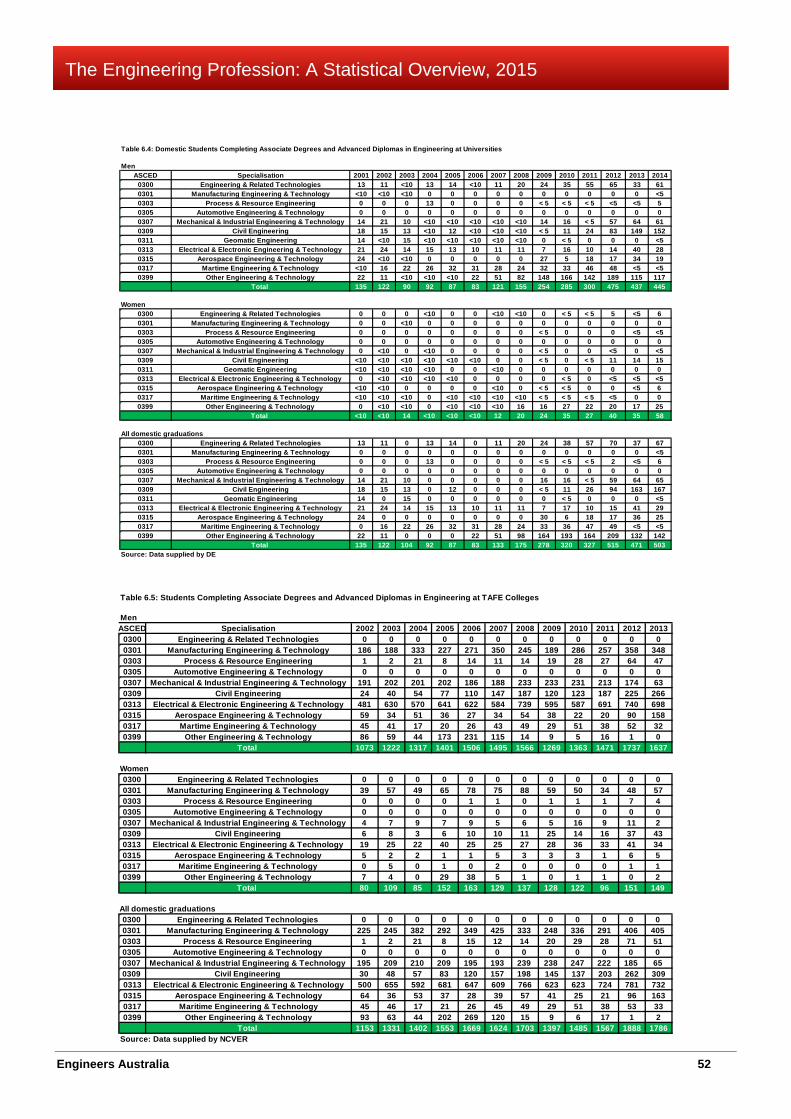
Engineers Australia 52
The Engineering Profession: A Statistical Overview, 2015
Table 6.4: Domestic Students Completing Associate Degrees and Advanced Diplomas in Engineering at Universities
MenASCED Specialisation 2001 2002 2003 2004 2005 2006 2007 2008 2009 2010 2011 2012 2013 2014
0300 Engineering & Related Technologies 13 11 <10 13 14 <10 11 20 24 35 55 65 33 610301 Manufacturing Engineering & Technology <10 <10 <10 0 0 0 0 0 0 0 0 0 0 <50303 Process & Resource Engineering 0 0 0 13 0 0 0 0 < 5 < 5 < 5 <5 <5 50305 Automotive Engineering & Technology 0 0 0 0 0 0 0 0 0 0 0 0 0 00307 Mechanical & Industrial Engineering & Technology 14 21 10 <10 <10 <10 <10 <10 14 16 < 5 57 64 610309 Civil Engineering 18 15 13 <10 12 <10 <10 <10 < 5 11 24 83 149 1520311 Geomatic Engineering 14 <10 15 <10 <10 <10 <10 <10 0 < 5 0 0 0 <50313 Electrical & Electronic Engineering & Technology 21 24 14 15 13 10 11 11 7 16 10 14 40 280315 Aerospace Engineering & Technology 24 <10 <10 0 0 0 0 0 27 5 18 17 34 190317 Martime Engineering & Technology <10 16 22 26 32 31 28 24 32 33 46 48 <5 <50399 Other Engineering & Technology 22 11 <10 <10 <10 22 51 82 148 166 142 189 115 117
Total 135 122 90 92 87 83 121 155 254 285 300 475 437 445
Women0300 Engineering & Related Technologies 0 0 0 <10 0 0 <10 <10 0 < 5 < 5 5 <5 60301 Manufacturing Engineering & Technology 0 0 <10 0 0 0 0 0 0 0 0 0 0 00303 Process & Resource Engineering 0 0 0 0 0 0 0 0 < 5 0 0 0 <5 <50305 Automotive Engineering & Technology 0 0 0 0 0 0 0 0 0 0 0 0 0 00307 Mechanical & Industrial Engineering & Technology 0 <10 0 <10 0 0 0 0 < 5 0 0 <5 0 <50309 Civil Engineering <10 <10 <10 <10 <10 <10 0 0 < 5 0 < 5 11 14 150311 Geomatic Engineering <10 <10 <10 <10 0 0 <10 0 0 0 0 0 0 00313 Electrical & Electronic Engineering & Technology 0 <10 <10 <10 <10 0 0 0 0 < 5 0 <5 <5 <50315 Aerospace Engineering & Technology <10 <10 0 0 0 0 <10 0 < 5 < 5 0 0 <5 60317 Maritime Engineering & Technology <10 <10 <10 0 <10 <10 <10 <10 < 5 < 5 < 5 <5 0 00399 Other Engineering & Technology 0 <10 <10 0 <10 <10 <10 16 16 27 22 20 17 25
Total <10 <10 14 <10 <10 <10 12 20 24 35 27 40 35 58
All domestic graduations0300 Engineering & Related Technologies 13 11 0 13 14 0 11 20 24 38 57 70 37 670301 Manufacturing Engineering & Technology 0 0 0 0 0 0 0 0 0 0 0 0 0 <50303 Process & Resource Engineering 0 0 0 13 0 0 0 0 < 5 < 5 < 5 2 <5 60305 Automotive Engineering & Technology 0 0 0 0 0 0 0 0 0 0 0 0 0 00307 Mechanical & Industrial Engineering & Technology 14 21 10 0 0 0 0 0 16 16 < 5 59 64 650309 Civil Engineering 18 15 13 0 12 0 0 0 < 5 11 26 94 163 1670311 Geomatic Engineering 14 0 15 0 0 0 0 0 0 < 5 0 0 0 <50313 Electrical & Electronic Engineering & Technology 21 24 14 15 13 10 11 11 7 17 10 15 41 290315 Aerospace Engineering & Technology 24 0 0 0 0 0 0 0 30 6 18 17 36 250317 Maritime Engineering & Technology 0 16 22 26 32 31 28 24 33 36 47 49 <5 <50399 Other Engineering & Technology 22 11 0 0 0 22 51 98 164 193 164 209 132 142
Total 135 122 104 92 87 83 133 175 278 320 327 515 471 503Source: Data supplied by DE
Table 6.5: Students Completing Associate Degrees and Advanced Diplomas in Engineering at TAFE Colleges
MenASCED Specialisation 2002 2003 2004 2005 2006 2007 2008 2009 2010 2011 2012 2013
0300 Engineering & Related Technologies 0 0 0 0 0 0 0 0 0 0 0 00301 Manufacturing Engineering & Technology 186 188 333 227 271 350 245 189 286 257 358 3480303 Process & Resource Engineering 1 2 21 8 14 11 14 19 28 27 64 470305 Automotive Engineering & Technology 0 0 0 0 0 0 0 0 0 0 0 00307 Mechanical & Industrial Engineering & Technology 191 202 201 202 186 188 233 233 231 213 174 630309 Civil Engineering 24 40 54 77 110 147 187 120 123 187 225 2660313 Electrical & Electronic Engineering & Technology 481 630 570 641 622 584 739 595 587 691 740 6980315 Aerospace Engineering & Technology 59 34 51 36 27 34 54 38 22 20 90 1580317 Martime Engineering & Technology 45 41 17 20 26 43 49 29 51 38 52 320399 Other Engineering & Technology 86 59 44 173 231 115 14 9 5 16 1 0
Total 1073 1222 1317 1401 1506 1495 1566 1269 1363 1471 1737 1637
Women0300 Engineering & Related Technologies 0 0 0 0 0 0 0 0 0 0 0 00301 Manufacturing Engineering & Technology 39 57 49 65 78 75 88 59 50 34 48 570303 Process & Resource Engineering 0 0 0 0 1 1 0 1 1 1 7 40305 Automotive Engineering & Technology 0 0 0 0 0 0 0 0 0 0 0 00307 Mechanical & Industrial Engineering & Technology 4 7 9 7 9 5 6 5 16 9 11 20309 Civil Engineering 6 8 3 6 10 10 11 25 14 16 37 430313 Electrical & Electronic Engineering & Technology 19 25 22 40 25 25 27 28 36 33 41 340315 Aerospace Engineering & Technology 5 2 2 1 1 5 3 3 3 1 6 50317 Maritime Engineering & Technology 0 5 0 1 0 2 0 0 0 0 1 10399 Other Engineering & Technology 7 4 0 29 38 5 1 0 1 1 0 2
Total 80 109 85 152 163 129 137 128 122 96 151 149
All domestic graduations0300 Engineering & Related Technologies 0 0 0 0 0 0 0 0 0 0 0 00301 Manufacturing Engineering & Technology 225 245 382 292 349 425 333 248 336 291 406 4050303 Process & Resource Engineering 1 2 21 8 15 12 14 20 29 28 71 510305 Automotive Engineering & Technology 0 0 0 0 0 0 0 0 0 0 0 00307 Mechanical & Industrial Engineering & Technology 195 209 210 209 195 193 239 238 247 222 185 650309 Civil Engineering 30 48 57 83 120 157 198 145 137 203 262 3090313 Electrical & Electronic Engineering & Technology 500 655 592 681 647 609 766 623 623 724 781 7320315 Aerospace Engineering & Technology 64 36 53 37 28 39 57 41 25 21 96 1630317 Maritime Engineering & Technology 45 46 17 21 26 45 49 29 51 38 53 330399 Other Engineering & Technology 93 63 44 202 269 120 15 9 6 17 1 2
Total 1153 1331 1402 1553 1669 1624 1703 1397 1485 1567 1888 1786Source: Data supplied by NCVER

Engineers Australia 53
The Engineering Profession: A Statistical Overview, 2015
6.7 Annual Additions to Supply This Section consolidates and adjusts the statistics discussed in this Chapter to draw out the addition to the supply of engineers from completions of engineering courses. Only broad aggregates are considered and the main adjustment is exclusion of completions in Geomatic Engineering.
Section 6.2 discussed choices of labour market destinations exercised by new graduates. Ideally, these choices should lead to other adjustments but at this stage more work is needed to establish the average periods that full time higher education students are away from the labour market and without this knowledge any adjustment becomes guesswork. Readers should bear this complication in mind when evaluating trends.
Table 6.6 shows the flows of engineering completions from 2002 (TAFE statistics start then) to 2014 arranged by gender and component of the engineering team. Since TAFE statistics are not available for 2014, estimates based on 2013 outcomes were used and are highlighted in green. Figure 6.3 illustrates the broad trends from these statistics and how they relate to the components of the engineering team.
In 2014, 9,667 newly qualified engineers were available to join the engineering team, 367 or 3.9% more than in 2013. The average annual increase since 2002 has been 3.1% and Figure 6.2 shows that the rate of increase has risen in recent years.
• The number of additional associate engineers was 2,303, up 2.0% on the previous year; 9.0% were women.
• The number of additional engineering technologists was 609, up 25.6% on 2013; 25.1% were women.
Table 6.6: Changes in the Supply of Engineers as a Result of Domestic Course Completions
Source 2002 2003 2004 2005 2006 2007 2008 2009 2010 2011 2012 2013 2014MenAssociate Engineers Universities 122 90 92 87 83 121 155 254 285 300 475 437 445 TAFE Colleges 1073 1222 1317 1401 1506 1495 1566 1269 1363 1471 1737 1637 1650 Sub-total 1195 1312 1409 1488 1589 1616 1721 1523 1648 1771 2212 2074 2095
Engineering Technologists 475 449 440 538 669 473 484 413 330 346 395 378 456Professional Engineers Four year degree 3200 3178 3185 3197 3059 3289 3527 3547 3536 3866 3973 4115 4199 Four year double degree 898 1049 1203 1193 1186 1160 1077 1068 1339 1309 1345 1510 1554 Sub-total 4098 4227 4388 4390 4245 4449 4604 4615 4875 5175 5318 5625 5753Total completions 5768 5988 6237 6416 6503 6538 6809 6551 6853 7292 7925 8077 8304
WomenAssociate Engineers Universities <10 14 <10 <10 <10 12 20 24 35 27 40 35 58 TAFE Colleges 80 109 85 152 163 129 137 128 122 96 151 149 150 Sub-total 80 123 85 152 163 141 157 152 157 123 191 184 208
Engineering Technologists 77 72 71 127 142 100 118 105 112 108 95 107 153Professional Engineers Four year degree 636 648 607 586 505 493 501 534 530 585 620 622 654 Four year double degree 211 233 249 273 280 274 247 234 252 296 310 310 348 Sub-total 847 881 856 859 785 767 748 768 782 881 930 932 1002Engineering Team 1004 1076 1012 1138 1090 1008 1023 1025 1051 1112 1216 1223 1363
TotalAssociate Engineers Universities 122 104 92 87 83 133 175 278 320 327 515 471 503 TAFE Colleges 1153 1331 1402 1553 1669 1624 1703 1397 1485 1567 1888 1786 1800 Sub-total 1275 1435 1494 1640 1752 1757 1878 1675 1805 1894 2403 2258 2303
Engineering Technologists 552 521 511 665 811 573 602 518 442 454 490 485 609
Professional Engineers Four year degree 3836 3826 3792 3783 3564 3782 4028 4081 4066 4451 4593 4737 4853 Four year double degree 1109 1282 1452 1466 1466 1434 1324 1302 1591 1605 1655 1820 1902 Sub-total 4945 5108 5244 5249 5030 5216 5352 5383 5657 6056 6248 6557 6755Engineering Team 6772 7064 7249 7554 7593 7546 7832 7576 7904 8404 9141 9300 9667

Engineers Australia 54
The Engineering Profession: A Statistical Overview, 2015
• The number of additional professional engineers was 6,755, up 3.0% on 2013; 14.8% were women.
The proportion of women completing engineering courses has increased in recent years, partially reversing a deterioration observed through much of the past decade (see Figure 6.4). In 2003, the proportion of women completing engineering team courses peaked at 15.2%. It fell to a low point of 13.1% in 2008, remained in the low 13s for the next five years and increased to 14.1% in 2014. The main influence on this trend was completions of four year degrees with comparatively few women undertaking courses leading to technologist or associate grades.
The duration of engineering courses is a major constraint to how supply can adjust to the demand for engineers. This is illustrated in Figure 6.3. Engineering skill shortages emerged in about 2006 and persisted through to early 2012, with a brief dip in 2009-10 due to the GFC. During these years, engineering completions did not change very much. They began to increase in 2011 and have continued to increase so that in 2014 Australia produced more engineering completions than ever before. Commencements began to increase much earlier but course durations of three, four and six years for double degrees resulted in lags creating the pattern seen in Figure 6.2. From late 2012, vacancies for engineers collapsed and have not yet recovered. In other words, just as the education system began to

Engineers Australia 55
The Engineering Profession: A Statistical Overview, 2015
produce the additional supply demanded before and just after the GFC, demand in the engineering labour market collapsed.

Engineers Australia 56
The Engineering Profession: A Statistical Overview, 2015
Chapter 7 Skilled Migration Main Points This Chapter reviews statistics on skilled migration of engineers. Both permanent and temporary migration are considered. Permanent migrants increase the supply of engineers on an on-going basis. Temporary skilled migration increases the supply of engineers for shorter periods varying between a few months and up to four years. Until this year statistics on new temporary visas granted have been available but converting that information into a supply figure was impossible because visa durations were not known. This year the Department of Immigration and Border Protection has made available statistics on the stock of temporary migrants working in Australia as well as statistics on new visas approved. This development adds to our understanding of the interaction between the supply of engineers and skilled migration.
In 2014-15, permanent migration of engineers was a record high; 11, 556 engineers were granted permanent visas, 22.6% higher than in 2013-14. This growth was well above the average growth rate since 2003-04 of 14.3% and higher than average growth over the past four years of 17.1%.
Full year statistics for the temporary migration are not yet available, but up to 31 March 8,928 migrant engineers were employed in Australia on temporary visas. On a full year basis, this number is likely to be higher. On a full year basis, the number of new temporary visas approved is likely to be about the same as last year. The number of temporary migrant engineers employed in Australia grew strongly in 2011-12 but fell in 2013-14 and will probably be lower again in 2014-15. However, the number of temporary engineers in Australia is very high given conditions in the engineering labour market.
In 2014-15, skilled migration increased the supply of engineers in Australia by 20,484 compared to 19,798 in 2013-14 and the increase in supply from education completions of 9,667. In other words, skilled migration is increasing the supply of engineers at twice the rate of the education system. The result in 2014-15 was the second highest on record exceeded only by 2012-13. These are substantial numbers and account for about 4.8% of the engineering labour force and 10.0% of employment in engineering occupations.
Statistics on 457 visa holders and new approvals confirm the view that high demand for engineers in the resource States of Western Australia and Queensland was a factor in the large numbers coming to Australia on these visas. However, large numbers of engineers on 457 visas are also employed in NSW and Victoria and to a lesser extent, the smaller jurisdictions.
The number of 457 visa holders in Australia is falling but lags well behind new visa approvals because existing visa holders generally conclude their contracts before departure. The level of new 457 visa approvals in the first three quarters of 2014-15 when scaled to full year suggest an outcome similar to the previous year around 5,200. This seems incompatible with the increase in engineering unemployment discussed in Chapter 3 and other indicators of severe weakness in the engineering labour market.
7.1 Australia’s Skilled Migration Policy Australia has a long history of skilled migration, particularly in engineering. Following major revision, present policies have been in place since 2010. These policies have two objectives; first, permanent migration aims to supplement Australia’s medium to longer term skills capability in areas where the output of our education system is insufficient for future needs and second, temporary migration aims to establish a demand driven mechanism that enables employers to overcome short term skills shortages. The annual Commonwealth budget sets the annual target intake for permanent migration, but the

Engineers Australia 57
The Engineering Profession: A Statistical Overview, 2015
number of temporary visa is not limited in this way and is determined by demand pressures experienced by employers. The annual target for skilled migration has been unchanged at 128,550 in the past three budgets; however, how this is distributed between skills areas has changed.
Employers are expected to deal with skill shortages by taking advantage of fairly liberal arrangements to engage short term skilled migrants on 457 visas. These visas can be for periods as short as three to four months or up to four years. There are no skills assessments for temporary migrants but sponsoring employers are expected to validate their competence. Short term skilled migration is designed to operate as an automatic stabiliser; increasing when labour markets are tight causing skill shortages and falling when labour markets ease and there are no shortages. Employers can elect to sponsor temporary migrants for permanent visas. When this occurs, the normal arrangements for permanent migration apply including the annual cap on visa numbers and formal skills assessment.
Since 2010, the Skilled Occupation List (SOL) has operated as the framework prioritising skills in the skilled migration program. The SOL was initially compiled by the former Australian Workplace Productivity Agency (AWPA). Since the last election the AWPA has been abolished and responsibility for the SOL was initially transferred to the Department of Industry and subsequently to the Department of Employment. In practical terms, unless an engineering occupation is on the SOL, it is unlikely a visa will be granted to independent migrants. The criteria used to compile the SOL are:
• Long training lead time in specialized skills • High Degree of relationship between area of training and subsequent employment • High risk of labour market and economic disruption if the skill is in short supply • Sufficient high quality information to assess future skills requirements.
The SOL is reviewed annually and there have been no changes to the engineering occupations on this list since it came into force. The SOL provides a useful framework to compile consistent statistics on skilled migration of engineers and this approach is used in this Chapter.
7.2 Assessing Overseas Engineering Qualifications Aspiring permanent skilled migrants must have their educational qualifications and labour market experience assessed by an assessment authority appointed by the Department of Immigration and Border Protection (DIBP) prior to submitting their application for a visa. For engineers, Engineers Australia is the authorised assessing authority for nearly all engineering occupations. Assessments are undertaken consistent with Engineers Australia’s stage 1 competencies. These competencies are the basis for Engineers Australia’s accreditation of university entry level engineering courses and for all new members.
Engineering qualifications can be recognised through several pathways22: Qualifications may be treated as accredited qualifications if they are:
• Australian qualifications; • Accredited under the Washington Accord which is an agreement between international
engineering accreditation bodies23 to recognise the equivalence of each other’s undergraduate qualifications for Professional Engineers (the equivalent of an Australian four year full time Bachelors Degree in engineering);
• Accredited under the Sydney Accord which is an agreement between international engineering accreditation bodies24 to recognise the equivalence of each other’s undergraduate educational qualifications for Engineering Technologists (the equivalent of an Australian three year full time Bachelor Degree in engineering).
22 www.engineersaustralia.org.au 23 The signatories to the Washington Accord are Canada, Hong Kong SAR, Ireland, New Zealand, South Africa, the United Kingdom, the United States of America and Australia. 24 The signatories to the Sydney Accord are Canada, Hong Kong SAR, Ireland, New Zealand, South Africa, the United Kingdom and Australia.
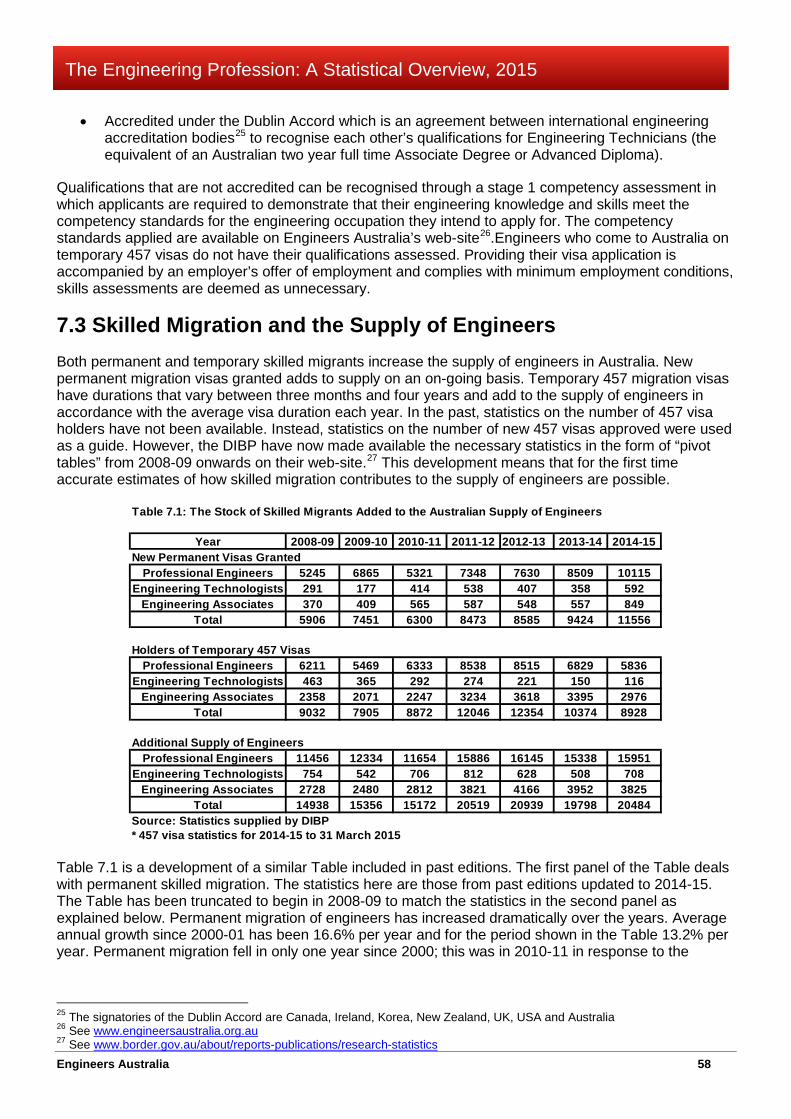
Engineers Australia 58
The Engineering Profession: A Statistical Overview, 2015
• Accredited under the Dublin Accord which is an agreement between international engineering accreditation bodies25 to recognise each other’s qualifications for Engineering Technicians (the equivalent of an Australian two year full time Associate Degree or Advanced Diploma).
Qualifications that are not accredited can be recognised through a stage 1 competency assessment in which applicants are required to demonstrate that their engineering knowledge and skills meet the competency standards for the engineering occupation they intend to apply for. The competency standards applied are available on Engineers Australia’s web-site26.Engineers who come to Australia on temporary 457 visas do not have their qualifications assessed. Providing their visa application is accompanied by an employer’s offer of employment and complies with minimum employment conditions, skills assessments are deemed as unnecessary.
7.3 Skilled Migration and the Supply of Engineers Both permanent and temporary skilled migrants increase the supply of engineers in Australia. New permanent migration visas granted adds to supply on an on-going basis. Temporary 457 migration visas have durations that vary between three months and four years and add to the supply of engineers in accordance with the average visa duration each year. In the past, statistics on the number of 457 visa holders have not been available. Instead, statistics on the number of new 457 visas approved were used as a guide. However, the DIBP have now made available the necessary statistics in the form of “pivot tables” from 2008-09 onwards on their web-site.27 This development means that for the first time accurate estimates of how skilled migration contributes to the supply of engineers are possible.
Table 7.1 is a development of a similar Table included in past editions. The first panel of the Table deals with permanent skilled migration. The statistics here are those from past editions updated to 2014-15. The Table has been truncated to begin in 2008-09 to match the statistics in the second panel as explained below. Permanent migration of engineers has increased dramatically over the years. Average annual growth since 2000-01 has been 16.6% per year and for the period shown in the Table 13.2% per year. Permanent migration fell in only one year since 2000; this was in 2010-11 in response to the
25 The signatories of the Dublin Accord are Canada, Ireland, Korea, New Zealand, UK, USA and Australia 26 See www.engineersaustralia.org.au 27 See www.border.gov.au/about/reports-publications/research-statistics
Table 7.1: The Stock of Skilled Migrants Added to the Australian Supply of Engineers
Year 2008-09 2009-10 2010-11 2011-12 2012-13 2013-14 2014-15New Permanent Visas Granted
Professional Engineers 5245 6865 5321 7348 7630 8509 10115Engineering Technologists 291 177 414 538 407 358 592
Engineering Associates 370 409 565 587 548 557 849Total 5906 7451 6300 8473 8585 9424 11556
Holders of Temporary 457 VisasProfessional Engineers 6211 5469 6333 8538 8515 6829 5836
Engineering Technologists 463 365 292 274 221 150 116Engineering Associates 2358 2071 2247 3234 3618 3395 2976
Total 9032 7905 8872 12046 12354 10374 8928
Additional Supply of EngineersProfessional Engineers 11456 12334 11654 15886 16145 15338 15951
Engineering Technologists 754 542 706 812 628 508 708Engineering Associates 2728 2480 2812 3821 4166 3952 3825
Total 14938 15356 15172 20519 20939 19798 20484Source: Statistics supplied by DIBP* 457 visa statistics for 2014-15 to 31 March 2015

Engineers Australia 59
The Engineering Profession: A Statistical Overview, 2015
disruption caused by the GFC. Even in this year the intake was substantial and discounting this contraction, annual average growth since 2008-09 rises to 18.9%.
In 2014-15, permanent migration of engineers was by far the highest on record with an intake of 11,556, 22.6% higher than in 2013-14. Permanent migration has increased over seven fold since 2000-01 when 1,528 engineers migrated to Australia on permanent visas. By far the largest component of permanent migrants last year was professional engineers who accounted for 87.5%; engineering technologists accounted for 5.1% and associate engineers for 7.3%.
The second panel in the Table is different; in the past we used new temporary visas approved as an indicator of how temporary migration has affected supply. This year we are able to use the number of 457 visa holders working in Australia. The third panel of the Table simply adds the two components into the annual contribution of skilled migration to the supply of engineers.
The objectives of Australia’s skilled migration policies mean that permanent migration is the more stable from year to year, changing only in line with Australia’s annual skilled migration target and the share of that target allocated to engineering occupations. In contrast, temporary migration is intended to be more variable, increasing when the demand for engineers is high enough to cause recruiting difficulties and contracting when demand for engineers weakens and recruiting difficulties disappear. Figure 7.1 illustrates these points since 2008-09.
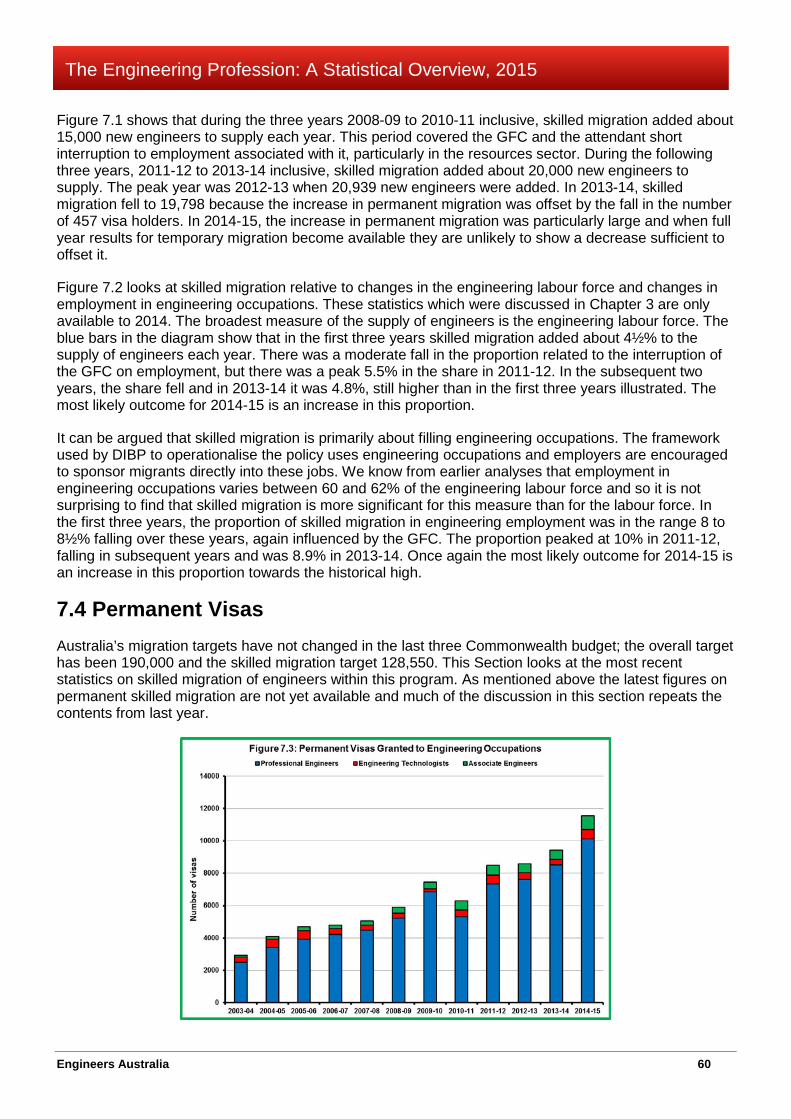
Engineers Australia 60
The Engineering Profession: A Statistical Overview, 2015
Figure 7.1 shows that during the three years 2008-09 to 2010-11 inclusive, skilled migration added about 15,000 new engineers to supply each year. This period covered the GFC and the attendant short interruption to employment associated with it, particularly in the resources sector. During the following three years, 2011-12 to 2013-14 inclusive, skilled migration added about 20,000 new engineers to supply. The peak year was 2012-13 when 20,939 new engineers were added. In 2013-14, skilled migration fell to 19,798 because the increase in permanent migration was offset by the fall in the number of 457 visa holders. In 2014-15, the increase in permanent migration was particularly large and when full year results for temporary migration become available they are unlikely to show a decrease sufficient to offset it.
Figure 7.2 looks at skilled migration relative to changes in the engineering labour force and changes in employment in engineering occupations. These statistics which were discussed in Chapter 3 are only available to 2014. The broadest measure of the supply of engineers is the engineering labour force. The blue bars in the diagram show that in the first three years skilled migration added about 4½% to the supply of engineers each year. There was a moderate fall in the proportion related to the interruption of the GFC on employment, but there was a peak 5.5% in the share in 2011-12. In the subsequent two years, the share fell and in 2013-14 it was 4.8%, still higher than in the first three years illustrated. The most likely outcome for 2014-15 is an increase in this proportion.
It can be argued that skilled migration is primarily about filling engineering occupations. The framework used by DIBP to operationalise the policy uses engineering occupations and employers are encouraged to sponsor migrants directly into these jobs. We know from earlier analyses that employment in engineering occupations varies between 60 and 62% of the engineering labour force and so it is not surprising to find that skilled migration is more significant for this measure than for the labour force. In the first three years, the proportion of skilled migration in engineering employment was in the range 8 to 8½% falling over these years, again influenced by the GFC. The proportion peaked at 10% in 2011-12, falling in subsequent years and was 8.9% in 2013-14. Once again the most likely outcome for 2014-15 is an increase in this proportion towards the historical high.
7.4 Permanent Visas Australia’s migration targets have not changed in the last three Commonwealth budget; the overall target has been 190,000 and the skilled migration target 128,550. This Section looks at the most recent statistics on skilled migration of engineers within this program. As mentioned above the latest figures on permanent skilled migration are not yet available and much of the discussion in this section repeats the contents from last year.
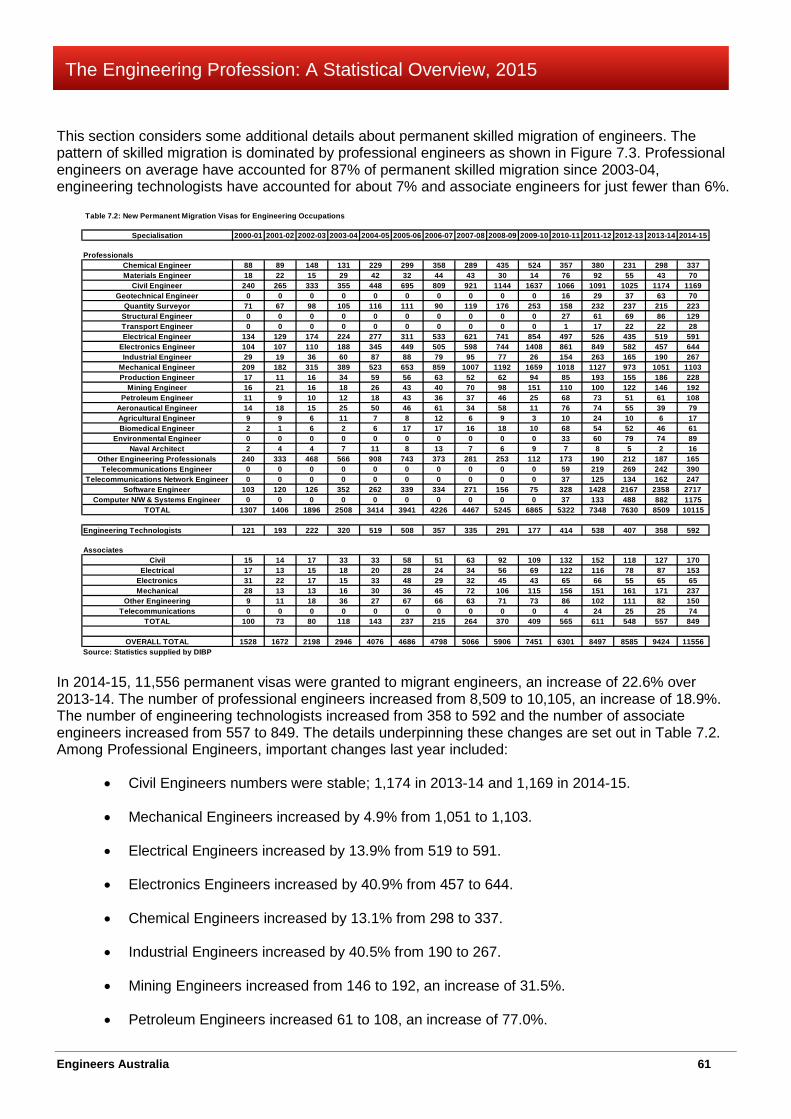
Engineers Australia 61
The Engineering Profession: A Statistical Overview, 2015
This section considers some additional details about permanent skilled migration of engineers. The pattern of skilled migration is dominated by professional engineers as shown in Figure 7.3. Professional engineers on average have accounted for 87% of permanent skilled migration since 2003-04, engineering technologists have accounted for about 7% and associate engineers for just fewer than 6%.
In 2014-15, 11,556 permanent visas were granted to migrant engineers, an increase of 22.6% over 2013-14. The number of professional engineers increased from 8,509 to 10,105, an increase of 18.9%. The number of engineering technologists increased from 358 to 592 and the number of associate engineers increased from 557 to 849. The details underpinning these changes are set out in Table 7.2. Among Professional Engineers, important changes last year included:
• Civil Engineers numbers were stable; 1,174 in 2013-14 and 1,169 in 2014-15.
• Mechanical Engineers increased by 4.9% from 1,051 to 1,103.
• Electrical Engineers increased by 13.9% from 519 to 591.
• Electronics Engineers increased by 40.9% from 457 to 644.
• Chemical Engineers increased by 13.1% from 298 to 337.
• Industrial Engineers increased by 40.5% from 190 to 267.
• Mining Engineers increased from 146 to 192, an increase of 31.5%.
• Petroleum Engineers increased 61 to 108, an increase of 77.0%.
Table 7.2: New Permanent Migration Visas for Engineering Occupations
Specialisation 2000-01 2001-02 2002-03 2003-04 2004-05 2005-06 2006-07 2007-08 2008-09 2009-10 2010-11 2011-12 2012-13 2013-14 2014-15
ProfessionalsChemical Engineer 88 89 148 131 229 299 358 289 435 524 357 380 231 298 337Materials Engineer 18 22 15 29 42 32 44 43 30 14 76 92 55 43 70
Civil Engineer 240 265 333 355 448 695 809 921 1144 1637 1066 1091 1025 1174 1169Geotechnical Engineer 0 0 0 0 0 0 0 0 0 0 16 29 37 63 70
Quantity Surveyor 71 67 98 105 116 111 90 119 176 253 158 232 237 215 223Structural Engineer 0 0 0 0 0 0 0 0 0 0 27 61 69 86 129Transport Engineer 0 0 0 0 0 0 0 0 0 0 1 17 22 22 28Electrical Engineer 134 129 174 224 277 311 533 621 741 854 497 526 435 519 591
Electronics Engineer 104 107 110 188 345 449 505 598 744 1408 861 849 582 457 644Industrial Engineer 29 19 36 60 87 88 79 95 77 26 154 263 165 190 267
Mechanical Engineer 209 182 315 389 523 653 859 1007 1192 1659 1018 1127 973 1051 1103Production Engineer 17 11 16 34 59 56 63 52 62 94 85 193 155 186 228
Mining Engineer 16 21 16 18 26 43 40 70 98 151 110 100 122 146 192Petroleum Engineer 11 9 10 12 18 43 36 37 46 25 68 73 51 61 108
Aeronautical Engineer 14 18 15 25 50 46 61 34 58 11 76 74 55 39 79Agricultural Engineer 9 9 6 11 7 8 12 6 9 3 10 24 10 6 17Biomedical Engineer 2 1 6 2 6 17 17 16 18 10 68 54 52 46 61
Environmental Engineer 0 0 0 0 0 0 0 0 0 0 33 60 79 74 89Naval Architect 2 4 4 7 11 8 13 7 6 9 7 8 5 2 16
Other Engineering Professionals 240 333 468 566 908 743 373 281 253 112 173 190 212 187 165Telecommunications Engineer 0 0 0 0 0 0 0 0 0 0 59 219 269 242 390
Telecommunications Network Engineer 0 0 0 0 0 0 0 0 0 0 37 125 134 162 247Software Engineer 103 120 126 352 262 339 334 271 156 75 328 1428 2167 2358 2717
Computer N/W & Systems Engineer 0 0 0 0 0 0 0 0 0 0 37 133 488 882 1175TOTAL 1307 1406 1896 2508 3414 3941 4226 4467 5245 6865 5322 7348 7630 8509 10115
Engineering Technologists 121 193 222 320 519 508 357 335 291 177 414 538 407 358 592
AssociatesCivil 15 14 17 33 33 58 51 63 92 109 132 152 118 127 170
Electrical 17 13 15 18 20 28 24 34 56 69 122 116 78 87 153Electronics 31 22 17 15 33 48 29 32 45 43 65 66 55 65 65Mechanical 28 13 13 16 30 36 45 72 106 115 156 151 161 171 237
Other Engineering 9 11 18 36 27 67 66 63 71 73 86 102 111 82 150Telecommunications 0 0 0 0 0 0 0 0 0 0 4 24 25 25 74
TOTAL 100 73 80 118 143 237 215 264 370 409 565 611 548 557 849
OVERALL TOTAL 1528 1672 2198 2946 4076 4686 4798 5066 5906 7451 6301 8497 8585 9424 11556Source: Statistics supplied by DIBP
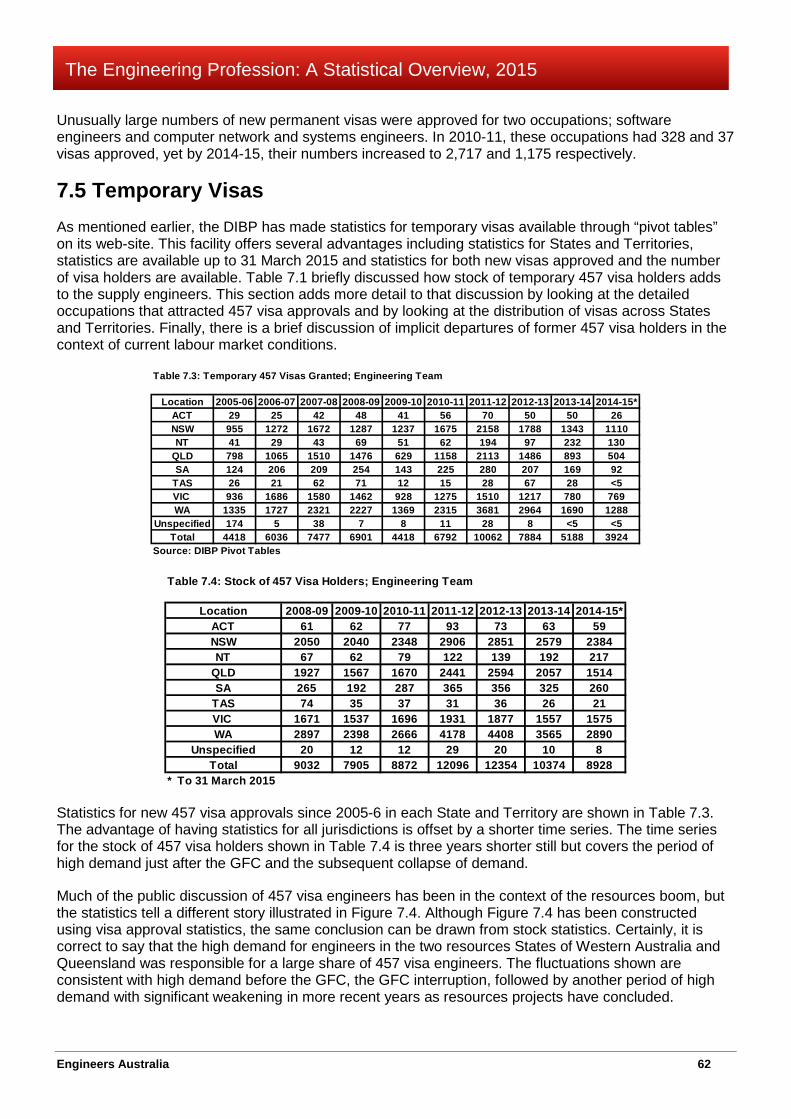
Engineers Australia 62
The Engineering Profession: A Statistical Overview, 2015
Unusually large numbers of new permanent visas were approved for two occupations; software engineers and computer network and systems engineers. In 2010-11, these occupations had 328 and 37 visas approved, yet by 2014-15, their numbers increased to 2,717 and 1,175 respectively.
7.5 Temporary Visas As mentioned earlier, the DIBP has made statistics for temporary visas available through “pivot tables” on its web-site. This facility offers several advantages including statistics for States and Territories, statistics are available up to 31 March 2015 and statistics for both new visas approved and the number of visa holders are available. Table 7.1 briefly discussed how stock of temporary 457 visa holders adds to the supply engineers. This section adds more detail to that discussion by looking at the detailed occupations that attracted 457 visa approvals and by looking at the distribution of visas across States and Territories. Finally, there is a brief discussion of implicit departures of former 457 visa holders in the context of current labour market conditions.
Statistics for new 457 visa approvals since 2005-6 in each State and Territory are shown in Table 7.3. The advantage of having statistics for all jurisdictions is offset by a shorter time series. The time series for the stock of 457 visa holders shown in Table 7.4 is three years shorter still but covers the period of high demand just after the GFC and the subsequent collapse of demand.
Much of the public discussion of 457 visa engineers has been in the context of the resources boom, but the statistics tell a different story illustrated in Figure 7.4. Although Figure 7.4 has been constructed using visa approval statistics, the same conclusion can be drawn from stock statistics. Certainly, it is correct to say that the high demand for engineers in the two resources States of Western Australia and Queensland was responsible for a large share of 457 visa engineers. The fluctuations shown are consistent with high demand before the GFC, the GFC interruption, followed by another period of high demand with significant weakening in more recent years as resources projects have concluded.
Table 7.3: Temporary 457 Visas Granted; Engineering Team
Location 2005-06 2006-07 2007-08 2008-09 2009-10 2010-11 2011-12 2012-13 2013-14 2014-15*ACT 29 25 42 48 41 56 70 50 50 26NSW 955 1272 1672 1287 1237 1675 2158 1788 1343 1110NT 41 29 43 69 51 62 194 97 232 130
QLD 798 1065 1510 1476 629 1158 2113 1486 893 504SA 124 206 209 254 143 225 280 207 169 92
TAS 26 21 62 71 12 15 28 67 28 <5VIC 936 1686 1580 1462 928 1275 1510 1217 780 769WA 1335 1727 2321 2227 1369 2315 3681 2964 1690 1288
Unspecified 174 5 38 7 8 11 28 8 <5 <5Total 4418 6036 7477 6901 4418 6792 10062 7884 5188 3924
Source: DIBP Pivot Tables
Table 7.4: Stock of 457 Visa Holders; Engineering Team
Location 2008-09 2009-10 2010-11 2011-12 2012-13 2013-14 2014-15*ACT 61 62 77 93 73 63 59NSW 2050 2040 2348 2906 2851 2579 2384NT 67 62 79 122 139 192 217
QLD 1927 1567 1670 2441 2594 2057 1514SA 265 192 287 365 356 325 260
TAS 74 35 37 31 36 26 21VIC 1671 1537 1696 1931 1877 1557 1575WA 2897 2398 2666 4178 4408 3565 2890
Unspecified 20 12 12 29 20 10 8Total 9032 7905 8872 12096 12354 10374 8928
* To 31 March 2015

Engineers Australia 63
The Engineering Profession: A Statistical Overview, 2015
There are two important points to note from Table 7.4. First, although the peak in 457 visa holders occurred in 2012-13, about the time when vacancies for engineers began over 30 months of decline, at 31 March 2015 there were still 8,928 engineers working in Australia on temporary 457 visas. Second, the use of 457 visa engineers is widespread across jurisdictions. Numbers in NSW and Victoria are currently similar to those in Western Australia and Queensland. These visas are also prominent in the smaller jurisdictions.
Temporary 457 visas were intended to perform an automatic stabilizing role as economic activity fluctuates year on year, increasing when demand is high and falling when demand weakens. This role is illustrated in Figure 7.5 which plots the stock of 457 visa holders against new 457 visa approvals. Implicit in these statistics is the departures of engineers whose 457 visas have expired. Departures can be estimated because next period’s stock is this period’s stock plus net arrivals which are new approvals less departures. What Figure 7.4 shows is that departures clearly lag new visa approvals. New visa approvals commenced to fall in 2011-12 consistent with the change in engineering labour market conditions. However, the stock of 457 visa holders continued to increase for another year and when it fell in 2013-14, the rate of fall was less than the decline in new approvals.
One of the features of the collapse in the engineering labour market is that it has affected every jurisdiction and not just the resources States. The level of new 457 visa approvals does not seem consistent with these labour market conditions. Table 7.5 shows that new 457 visas were approved
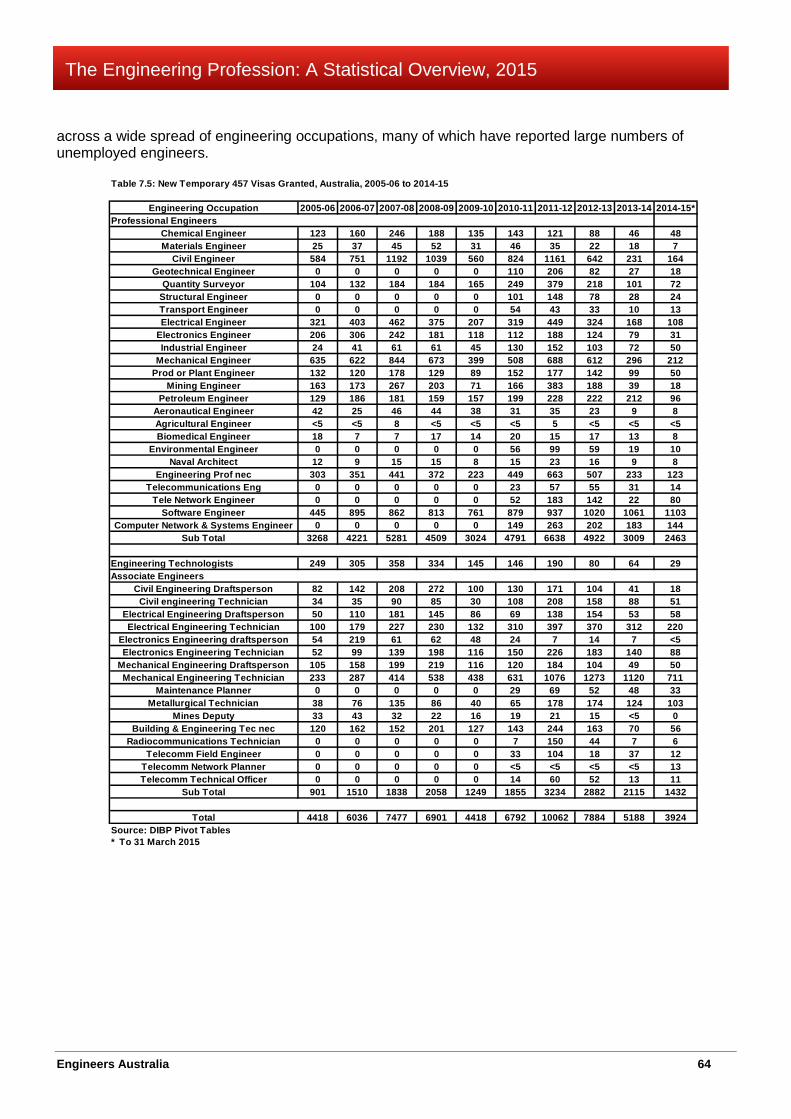
Engineers Australia 64
The Engineering Profession: A Statistical Overview, 2015
across a wide spread of engineering occupations, many of which have reported large numbers of unemployed engineers.
Table 7.5: New Temporary 457 Visas Granted, Australia, 2005-06 to 2014-15
Engineering Occupation 2005-06 2006-07 2007-08 2008-09 2009-10 2010-11 2011-12 2012-13 2013-14 2014-15*Professional Engineers
Chemical Engineer 123 160 246 188 135 143 121 88 46 48Materials Engineer 25 37 45 52 31 46 35 22 18 7
Civil Engineer 584 751 1192 1039 560 824 1161 642 231 164Geotechnical Engineer 0 0 0 0 0 110 206 82 27 18
Quantity Surveyor 104 132 184 184 165 249 379 218 101 72Structural Engineer 0 0 0 0 0 101 148 78 28 24Transport Engineer 0 0 0 0 0 54 43 33 10 13Electrical Engineer 321 403 462 375 207 319 449 324 168 108
Electronics Engineer 206 306 242 181 118 112 188 124 79 31Industrial Engineer 24 41 61 61 45 130 152 103 72 50
Mechanical Engineer 635 622 844 673 399 508 688 612 296 212Prod or Plant Engineer 132 120 178 129 89 152 177 142 99 50
Mining Engineer 163 173 267 203 71 166 383 188 39 18Petroleum Engineer 129 186 181 159 157 199 228 222 212 96
Aeronautical Engineer 42 25 46 44 38 31 35 23 9 8Agricultural Engineer <5 <5 8 <5 <5 <5 5 <5 <5 <5Biomedical Engineer 18 7 7 17 14 20 15 17 13 8
Environmental Engineer 0 0 0 0 0 56 99 59 19 10Naval Architect 12 9 15 15 8 15 23 16 9 8
Engineering Prof nec 303 351 441 372 223 449 663 507 233 123Telecommunications Eng 0 0 0 0 0 23 57 55 31 14
Tele Network Engineer 0 0 0 0 0 52 183 142 22 80Software Engineer 445 895 862 813 761 879 937 1020 1061 1103
Computer Network & Systems Engineer 0 0 0 0 0 149 263 202 183 144Sub Total 3268 4221 5281 4509 3024 4791 6638 4922 3009 2463
Engineering Technologists 249 305 358 334 145 146 190 80 64 29Associate Engineers
Civil Engineering Draftsperson 82 142 208 272 100 130 171 104 41 18Civil engineering Technician 34 35 90 85 30 108 208 158 88 51
Electrical Engineering Draftsperson 50 110 181 145 86 69 138 154 53 58Electrical Engineering Technician 100 179 227 230 132 310 397 370 312 220
Electronics Engineering draftsperson 54 219 61 62 48 24 7 14 7 <5Electronics Engineering Technician 52 99 139 198 116 150 226 183 140 88
Mechanical Engineering Draftsperson 105 158 199 219 116 120 184 104 49 50Mechanical Engineering Technician 233 287 414 538 438 631 1076 1273 1120 711
Maintenance Planner 0 0 0 0 0 29 69 52 48 33Metallurgical Technician 38 76 135 86 40 65 178 174 124 103
Mines Deputy 33 43 32 22 16 19 21 15 <5 0Building & Engineering Tec nec 120 162 152 201 127 143 244 163 70 56
Radiocommunications Technician 0 0 0 0 0 7 150 44 7 6Telecomm Field Engineer 0 0 0 0 0 33 104 18 37 12
Telecomm Network Planner 0 0 0 0 0 <5 <5 <5 <5 13Telecomm Technical Officer 0 0 0 0 0 14 60 52 13 11
Sub Total 901 1510 1838 2058 1249 1855 3234 2882 2115 1432
Total 4418 6036 7477 6901 4418 6792 10062 7884 5188 3924Source: DIBP Pivot Tables* To 31 March 2015
Engineers Australia 65
The Engineering Profession: A Statistical Overview, 2015
Chapter 8 Engineers in Industry Main Points
This Chapter gives an overview of how engineers are distributed across industry using the ABS ANZSIC classification system.
Over two-thirds of engineers, whether the measure used is the number qualified or the number of qualified engineers employed in engineering occupations, are employed in services industries. In 2011, 6% of qualified engineers were employed in mining industries, 16% in manufacturing industries, 8% in construction industries and 69% in services industries. These proportions were almost identical for qualified engineers employed in engineering occupations.
The proportion of women in engineering was quite different between the agricultural and industrial sector where it was 8.8% and the services sector where it was 12.7%.
The contribution of engineers is embodied in almost every good and service produced and/or consumed in the economy and this is reflected in the fact that engineers are employed in almost every industry in the economy.
Industries employing more than 1,000 engineers were ranked according to the number of engineers employed. The top of the list in 2011 was the Architectural, Engineering and Technical Services industry, commonly referred to as engineering consulting, which employed 38,984 qualified engineers. This industry has experienced strong growth (8.9% per year) and a particularly high proportion of engineers (over 90%) were employed in engineering occupations.
The top ten ranked industries comprised of some industries that had experienced strong employment growth and others that had not. At the national level, the first ranked resources industry was metal ore mining ranked 12th followed by oil and gas extraction at 19th and coal mining at 24th. These industries were far more important in other jurisdictions, for example in Western Australia metal ore mining ranked 2nd and oil and gas extraction ranked 3rd and in Queensland coal mining ranked 3rd and oil and gas extraction 10th.
8.1 The ABS Industry System The guiding policy for the Statistical Overview is to use ABS statistical classification systems whenever possible. The main reason for this approach is that it facilitates comparison of statistics from different ABS collections and between ABS statistics and those obtained from other sources. This Chapter examines the distribution of engineers throughout Australian industries and the relevant ABS classification system is the Australian and New Zealand Standard Industry Classification (ANZSIC)28.
ANZSIC is a hierarchical system divided into layers. Industry divisions are the highest level of aggregation and identify the main activity areas of the economy, for example, manufacturing or mining. Industry divisions comprise sub-divisions, or two digit industries; thus manufacturing contains industries such as fabricated metal product manufacturing and mining industries such as coal mining. Sub-divisions are further divided into groups or three digit industries; iron and steel forging is a group in fabricated metal product manufacturing. Finally, industry groups are divided into classes or 4 digit industries. There are 19 industry divisions, 87 sub-divisions, 215 groups and 503 classes. However, in many cases these counts are complicated by statistics that do not readily fit definitions; for example at the 2 digit level, the manufacturing division includes 15 formally defined sub-divisions and an additional
28 www.abs.gov.au

Engineers Australia 66
The Engineering Profession: A Statistical Overview, 2015
one manufacturing not further defined. Examples of the latter are found at sub-division, group and class level.
This Chapter applies the ANZSIC system to examine which industries engineers work in. Division level statistics are used to establish the broad character of the industry distribution of engineers. Sub-division or 2 digit statistics are used to focus more closely on whether or not there are differences in the characteristics of engineering employment between industries.
8.2 Broad Characterization of Engineering Work For some decades the Australian economy has been transitioning from an agricultural and industrial economy to a services economy. Inevitably, such change impacts all workers in the industries involved, including engineers.
Table 8.1 uses division level statistics from the 2011 census to allocate engineers to agricultural, mining, manufacturing and construction industries, the agricultural and industrial sector and remaining industries to the services sector. Figure 8.1 and 8.2 draw out important conclusions from these statistics.
In 2011, when resources sector employment was high, 77,089 qualified engineers were employed in the industrial sector of the economy and 172,626 were employed in the services sector. The gender balance was different between sectors; in the industrial sector 8.8% of qualified engineers were women
Table 8.1: A Broad Look at Engineers in Australian Industry
Labour Force StatusIndustry Men Women Total Men Women Total Men Women Total
Agriculture 1634 159 1793 253 11 264 15.5 6.9 14.7Mining 12230 1313 13543 10062 1105 11167 82.3 84.2 82.5
Manufacturing 36933 3915 40848 23920 2121 26041 64.8 54.2 63.8Construction 19492 1413 20905 13990 1053 15043 71.8 74.5 72.0
Agriculture & Industrial Industries 70289 6800 77089 48225 4290 52515 68.6 63.1 68.1Services Industries 150755 21871 172626 97526 11420 108946 64.7 52.2 63.1
All Industries 225323 29192 254515 148000 15912 163912 65.7 54.5 64.4
Employed Labour ForceEmployed in Engineering % In Engineering
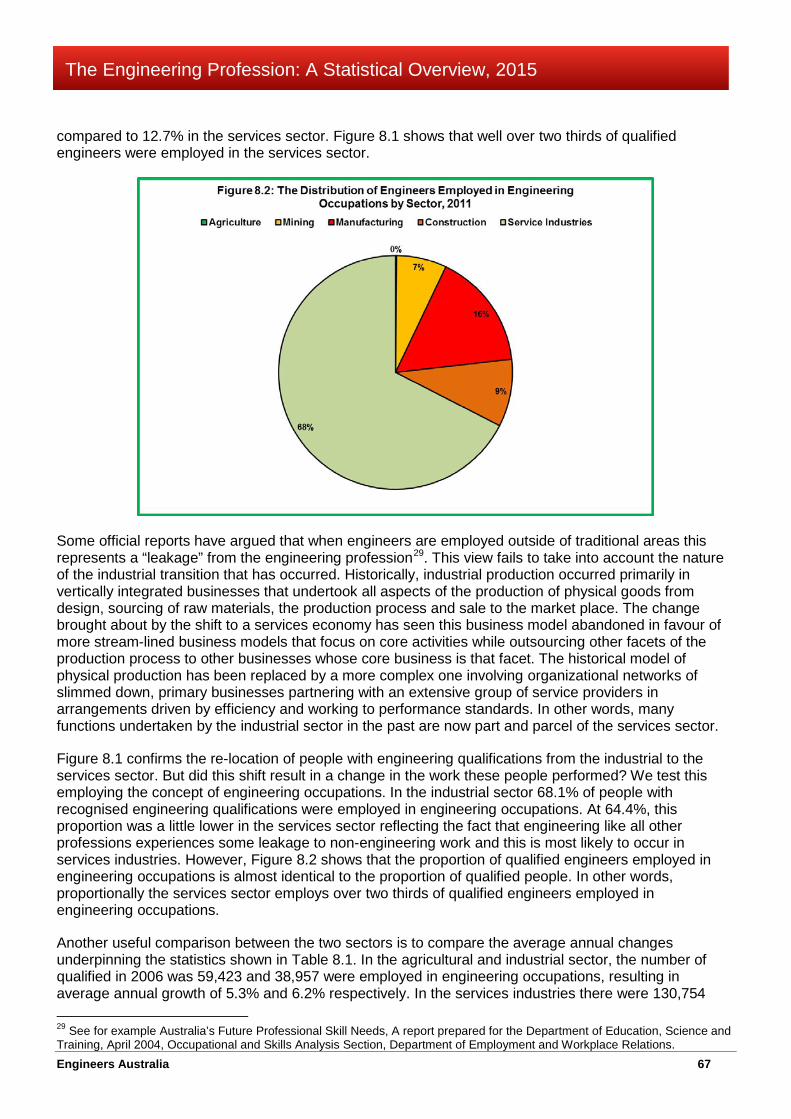
Engineers Australia 67
The Engineering Profession: A Statistical Overview, 2015
compared to 12.7% in the services sector. Figure 8.1 shows that well over two thirds of qualified engineers were employed in the services sector.
Some official reports have argued that when engineers are employed outside of traditional areas this represents a “leakage” from the engineering profession29. This view fails to take into account the nature of the industrial transition that has occurred. Historically, industrial production occurred primarily in vertically integrated businesses that undertook all aspects of the production of physical goods from design, sourcing of raw materials, the production process and sale to the market place. The change brought about by the shift to a services economy has seen this business model abandoned in favour of more stream-lined business models that focus on core activities while outsourcing other facets of the production process to other businesses whose core business is that facet. The historical model of physical production has been replaced by a more complex one involving organizational networks of slimmed down, primary businesses partnering with an extensive group of service providers in arrangements driven by efficiency and working to performance standards. In other words, many functions undertaken by the industrial sector in the past are now part and parcel of the services sector.
Figure 8.1 confirms the re-location of people with engineering qualifications from the industrial to the services sector. But did this shift result in a change in the work these people performed? We test this employing the concept of engineering occupations. In the industrial sector 68.1% of people with recognised engineering qualifications were employed in engineering occupations. At 64.4%, this proportion was a little lower in the services sector reflecting the fact that engineering like all other professions experiences some leakage to non-engineering work and this is most likely to occur in services industries. However, Figure 8.2 shows that the proportion of qualified engineers employed in engineering occupations is almost identical to the proportion of qualified people. In other words, proportionally the services sector employs over two thirds of qualified engineers employed in engineering occupations.
Another useful comparison between the two sectors is to compare the average annual changes underpinning the statistics shown in Table 8.1. In the agricultural and industrial sector, the number of qualified in 2006 was 59,423 and 38,957 were employed in engineering occupations, resulting in average annual growth of 5.3% and 6.2% respectively. In the services industries there were 130,754 29 See for example Australia’s Future Professional Skill Needs, A report prepared for the Department of Education, Science and Training, April 2004, Occupational and Skills Analysis Section, Department of Employment and Workplace Relations.
Engineers Australia 68
The Engineering Profession: A Statistical Overview, 2015
qualified engineers in 2006 and 80,981 were employed in engineering occupations, resulting in average annual growth rates of 5.7% and 6.1%, respectively. Once again, there was strong correspondence between engineers in the two sectors.
These results are consistent with the view that the fall in industrial industries and the rise of services industries are not autonomous changes but are closely related phenomena. In this context, important researchers like Pisano and Shih30 from Harvard conclude that manufacturing still matters and is the principal driver of innovation in the economy. They see engineers and other skilled personnel inter-acting in “industrial commons”, congregations of complementary skills as key ingredients in improving the competitiveness of the US economy. The best known example of “industrial commons” is Silicon Valley but there are also Australian examples, notably the Australian Technology Park in Redfern, Sydney31 and the Australian Marine Complex at Henderson32, Perth.
8.3 Employment at Sub-Division Level This section covers statistics relating to the employment of engineers at sub-division or 2 digit level industries. These statistics are presented in Table 8.2 at the end of the chapter. Since the 2011 census, the engineering labour market has changed dramatically under the influence of three factors; the end of the resources sector construction boom, the abrupt slow-down in infrastructure development and the slow-down in GDP growth. This means the statistics presented should only be used as indicators of where engineers are employed and the relativities between industries. The last column of Table 8.2 gives an indication of changes between the 2006 and 2011 censuses. In all likelihood, the situation since 2011 has changed. There are no statistics that give the size of these changes.
There are two important observations that can be drawn from Table 8.2. First, engineers are employed in an extraordinary spread of industries. This is not surprising given that the contributions of engineers are embodied in almost every good or service used in modern economies. Second, the number of engineers varies substantially across industries, but the highest concentrations occur in industries that provide services to other industries. The following section provides more perspective on this point.
8.4 What Industries Employ the Most Engineers? This section lists in rank order 2 digit industries that employ the most engineers. The ranking is in accord with the number of qualified engineers employed but additional detail on average growth between census years and the proportion of employment in engineering occupations is given. The ranking is limited to industries that employed 1,000 or more qualified engineers in 2011.
The ranking is: 1. Architectural, Engineering and Technical Services
o Employment of qualified engineers; 38,984 o Growth; 8.9% per year o Share employed in engineering occupations; 90.5%
2. Computer System Design and Related Services o Employment of qualified engineers; 12,073 o Growth; 6.0% per year o Share employed in engineering occupations; 77.0%
30 Gary P Pisano and Willy C Shih, Restoring American Competitiveness, Harvard Business Review, July-August 2009 31 www.atp.com.au 32 http://www.australianmarinecomplex.com.au

Engineers Australia 69
The Engineering Profession: A Statistical Overview, 2015
3. Machinery and Equipment Manufacturing o Employment of qualified engineers; 11,353 o Growth; 2.0% per year o Share of employment in engineering occupations; 72.4%
4. Heavy and Civil Engineering Construction o Employment of qualified engineers; 6,972 o Growth; 12.9% per annum o Share of employment in engineering occupations; 86.2%
5 Tertiary Education o Employment of qualified engineers; 6,937 o Growth; 4.5% per year o Share of employment in engineering occupations; 70.8%
6 Transport Equipment Manufacturing o Employment of qualified engineers; 6,911 o Growth; 5.1% per year o Share employed in engineering occupations; 70.1%
7 Telecommunications Services o Employment of qualified engineers; 6,264 o Growth; 4.5% per year o Share in engineering occupations; 75.7%
8 Other Machinery and Equipment Wholesaling o Employment of qualified engineers; 6,091 o Growth; 4.9% per year o Share in engineering occupations; 63.1%
9. Defence o Employment of qualified engineers; 5,397 o Growth; 2.1% per year o Share in engineering occupations; 76.2%
10. Management and Related Consulting Services o Employment of qualified engineers; 4,735 o Growth; 7.0% per year o Share in engineering occupations; 74.5%
11. Air and Space Transport o Employment of qualified engineers; 4,585 o Growth; 5.2% per year o Share in engineering occupations; 79.5%
12. Metal Ore Mining o Employment of qualified engineers; 4,467 o Growth; 12.4% per year o Share in engineering occupations; 85.3%
13. State Government Administration o Employment of qualified engineers; 4,391 o Growth; -0.3% per year o Share in engineering occupations; 76.4%
14. Local Government Administration o Employment of qualified engineers; 4,224 o Growth; 3.3% per year o Share in engineering occupations; 79.9%

Engineers Australia 70
The Engineering Profession: A Statistical Overview, 2015
15. Primary Metal and Metal Products Manufacturing o Employment of qualified engineers; 4,202 o Growth; 3.2% per year o Share in engineering occupations; 70.7%
16. Non-Residential Building Construction o Employment of qualified engineers; 3,513 o Growth; 9.2% per year o Share in engineering occupations; 87.7%
17. Water Supply, Sewerage and Drainage Services o Employment of qualified engineers;; 3,477 o Growth; 5.7% per year o Share in engineering occupations; 81.3%
18. Electricity Distribution o Employment of qualified engineers; 3,284 o Growth; 11.3% per year o Share in engineering occupations; 79.5%
19. Oil and Gas Extraction o Employment of qualified engineers; 3,264 o Growth; 18.7% per year o Share in engineering occupations; 82.4%
20. Building Installation Services o Employment of qualified engineers; 3,237 o Growth; 8.5% per year o Share in engineering occupations; 46.3%
21. Food Product Manufacturing o Employment of qualified engineers; 3,192 o Growth; 5.0%per year o Share in engineering occupations; 45.7%
22. Cafes, Restaurants and Takeaway Food Services o Employment of qualified engineers; 3,025 o Growth; 8.3% per year o Share in engineering occupations; 2.5%
23. Manufacturing, not further defined o Employment of qualified engineers; 2,933 o Growth; 3.3% per year o Share in engineering occupations; 57.9%
24. Coal Mining o Employment of qualified engineers; 2,562 o Growth; 12.7% per year o Share in engineering occupations; 82.4%
25. Residential Building Construction o Employment of qualified engineers; 2,560 o Growth; 3.9% per year o Share in engineering occupations; 69.6%

Engineers Australia 71
The Engineering Profession: A Statistical Overview, 2015
26. Basic Chemicals and Chemical Product Manufacturing o Employment of qualified engineers; 2,554 o Growth; -1.5% per year o Share in engineering occupations; 66.6%
27. Machinery and Equipment Repair and Maintenance o Employment of qualified engineers; 2,308 o Growth; 7.1% per year o Share in engineering occupations; 39.1%
28. Public Order and Safety Services o Employment of qualified engineers; 2,173 o Growth; 3.6% per year o Share in engineering occupations; 28.7%
29. Scientific Research Services o Employment of qualified engineers; 2,168 o Growth; 2.1% per year o Share in engineering occupations; 75.0%
30. Depository Financial Intermediation o Employment of qualified engineers; 2,130 o Growth;11.0% per year o Share in engineering occupations; 53.9%
31. Fabricated Metal Product Manufacturing o Employment of qualified engineers; 2,059 o Growth; 5.2% per year o Share in engineering occupations; 58.7%
32. Central Government Administration o Employment of qualified engineers; 1,921 o Growth; 8.2% per year o Share in engineering occupations; 53.7%
33. Auxiliary Finance and Investment Services o Employment of qualified engineers; 1,685 o Growth; 2.5% per year o Share in engineering occupations; 41.2%
34. Other Transport Support Services o Employment of qualified engineers; 1,671 o Growth; 20.8% per year o Share in engineering occupations; 67.1%
35. Rail Passenger Transport o Employment of qualified engineers; 1,662 o Growth; 8.8% per year o Share in engineering occupations; 66.8%
36. Building Cleaning and Related Services o Employment of qualified engineers; 1,550 o Growth; 7.9% per year o Share in engineering occupations; 5.1%

Engineers Australia 72
The Engineering Profession: A Statistical Overview, 2015
37. Supermarkets and Grocery Stores o Employment of qualified engineers; 1,508 o Growth; 7.4% per year o Share in engineering occupations; 9.6%
38. Other Mining Support Services o Employment of qualified engineers; 1,476 o Growth; 15.6% per year o Share in engineering occupations; 79.9%
39. School Education o Employment of qualified engineers; 1,474 o Growth; 3.8% per year o Share in engineering occupations; 3.8%
40. Non-Metallic Mineral Product Manufacturing o Employment of qualified engineers; 1,473 o Growth; 3.5% per year o Share in engineering occupations; 63.2%
41. Polymer Product & Rubber Product Manufacturing o Employment of qualified engineers; 1,468 o Growth; -2.3% per year o Share in engineering occupations; 50.7%
42. Road Passenger Transport o Employment of qualified engineers; 1,457 o Growth; 9.9% per year o Share in engineering occupations; 6.7%
43. Electricity Generation o Employment of qualified engineers; 1,454 o Growth; 6.5% per year o Share in engineering occupations; 74.1%
44. Hospitals o Employment of qualified engineers; 1,397 o Growth; 6.2% per year o Share in engineering occupations; 35.0%
45. Electrical and Electronic Goods Retailing o Employment of qualified engineers; 1,346 o Growth; 1.8% per year o Share in engineering occupations; 34.3%
46. Road Freight Transport o Employment of qualified engineers; 1,265 o Growth; 4.0% per year o Share in engineering occupations; 29.4%
47. Other Administrative Services o Employment of qualified engineers; 1,236 o Growth; 5.7% per year o Share in engineering occupations; 56.1%
Engineers Australia 73
The Engineering Profession: A Statistical Overview, 2015
48. Employment Services o Employment of qualified engineers; 1,225 o Growth; 3.1% per year o Share in engineering occupations; 42.6%
49. Airport Operations and Other Air Transport Support o Employment of qualified engineers; 1,166 o Growth; 4.5% per year o Share in engineering occupations; 77.0%
50. Legal and Accounting Services o Employment of qualified engineers; 1,123 o Growth; 4.3% per year o Share in engineering occupations; 31.9%
51. Adult, Community and Other Education o Employment of qualified engineers; 1,068 o Growth; 3.8% per year o Share in engineering occupations; 43.4%
52. Construction not further defined o Employment of qualified engineers; 1,052 o Growth; 3.4% per year o Share in engineering occupations; 82.0%
Including engineers who did not state the industry in which they were employed or who inadequately described it, 48,013, or 18.9% of qualified engineers, were employed in 185 industries that employed fewer than 1,000 qualified engineers in 2011.
It is fairly clear that some industries, for example, industry 37 supermarkets and grocery stores are unlikely to offer engineering employment as it is generally understood. These are most likely to be examples of leakage from the engineering profession, in other words, these are people who have recognised qualifications in engineering but who have chosen the occupations concerned as a matter of preference or due to the circumstances they find themselves in. Little more can be said about this without further research to explore these issues.
Both the employment of qualified engineers and their employment in engineering occupations vary enormously between industries. At the same time employment, irrespective of which of these measures is used, in industries that experienced shortages of engineers during the resources and infrastructure boom, was a comparatively small fraction of the engineering labour force. This suggests that the concept of engineering shortage is something more than simply producing enough engineers from the education system. Factors such as industry, its location, the engineering specialisation required, depth of experience desired and the preferences and circumstances of individuals in the engineering labour force. Part of the latter includes continuity of work and career opportunities and prospects.
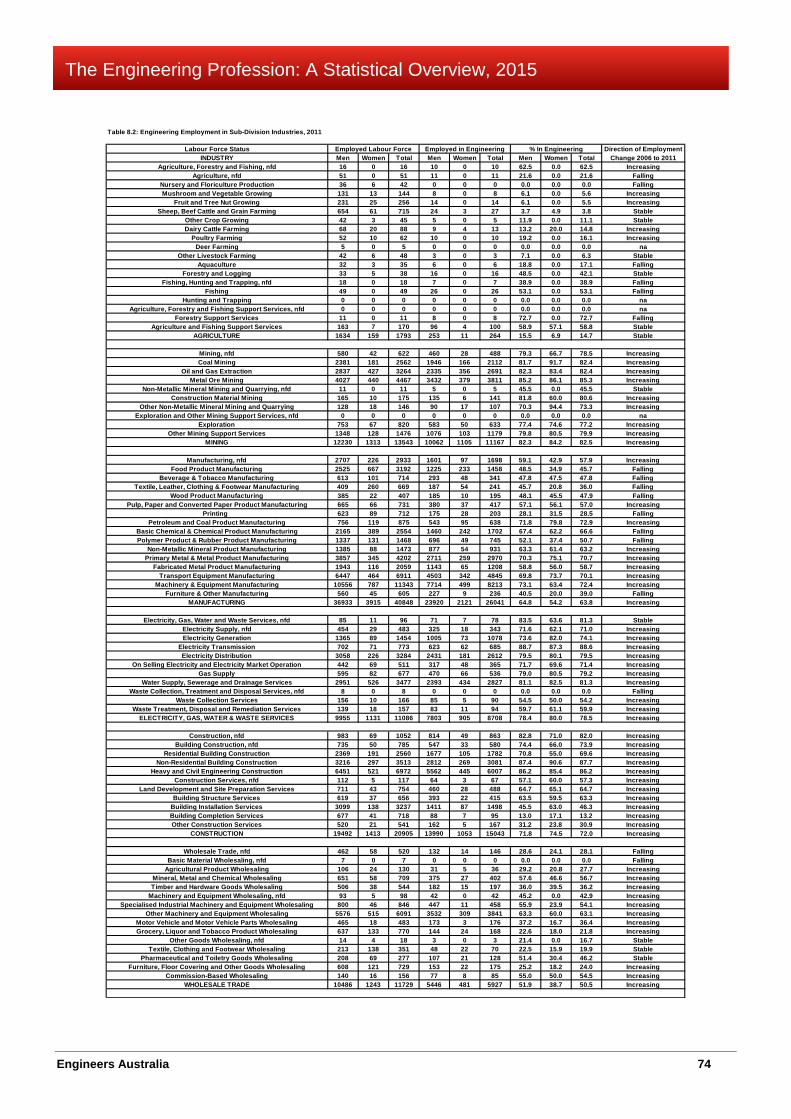
Engineers Australia 74
The Engineering Profession: A Statistical Overview, 2015
Table 8.2: Engineering Employment in Sub-Division Industries, 2011
Labour Force Status Direction of EmploymentINDUSTRY Men Women Total Men Women Total Men Women Total Change 2006 to 2011
Agriculture, Forestry and Fishing, nfd 16 0 16 10 0 10 62.5 0.0 62.5 IncreasingAgriculture, nfd 51 0 51 11 0 11 21.6 0.0 21.6 Falling
Nursery and Floriculture Production 36 6 42 0 0 0 0.0 0.0 0.0 FallingMushroom and Vegetable Growing 131 13 144 8 0 8 6.1 0.0 5.6 Increasing
Fruit and Tree Nut Growing 231 25 256 14 0 14 6.1 0.0 5.5 IncreasingSheep, Beef Cattle and Grain Farming 654 61 715 24 3 27 3.7 4.9 3.8 Stable
Other Crop Growing 42 3 45 5 0 5 11.9 0.0 11.1 StableDairy Cattle Farming 68 20 88 9 4 13 13.2 20.0 14.8 Increasing
Poultry Farming 52 10 62 10 0 10 19.2 0.0 16.1 IncreasingDeer Farming 5 0 5 0 0 0 0.0 0.0 0.0 na
Other Livestock Farming 42 6 48 3 0 3 7.1 0.0 6.3 StableAquaculture 32 3 35 6 0 6 18.8 0.0 17.1 Falling
Forestry and Logging 33 5 38 16 0 16 48.5 0.0 42.1 StableFishing, Hunting and Trapping, nfd 18 0 18 7 0 7 38.9 0.0 38.9 Falling
Fishing 49 0 49 26 0 26 53.1 0.0 53.1 FallingHunting and Trapping 0 0 0 0 0 0 0.0 0.0 0.0 na
Agriculture, Forestry and Fishing Support Services, nfd 0 0 0 0 0 0 0.0 0.0 0.0 naForestry Support Services 11 0 11 8 0 8 72.7 0.0 72.7 Falling
Agriculture and Fishing Support Services 163 7 170 96 4 100 58.9 57.1 58.8 StableAGRICULTURE 1634 159 1793 253 11 264 15.5 6.9 14.7 Stable
Mining, nfd 580 42 622 460 28 488 79.3 66.7 78.5 IncreasingCoal Mining 2381 181 2562 1946 166 2112 81.7 91.7 82.4 Increasing
Oil and Gas Extraction 2837 427 3264 2335 356 2691 82.3 83.4 82.4 IncreasingMetal Ore Mining 4027 440 4467 3432 379 3811 85.2 86.1 85.3 Increasing
Non-Metallic Mineral Mining and Quarrying, nfd 11 0 11 5 0 5 45.5 0.0 45.5 StableConstruction Material Mining 165 10 175 135 6 141 81.8 60.0 80.6 Increasing
Other Non-Metallic Mineral Mining and Quarrying 128 18 146 90 17 107 70.3 94.4 73.3 IncreasingExploration and Other Mining Support Services, nfd 0 0 0 0 0 0 0.0 0.0 0.0 na
Exploration 753 67 820 583 50 633 77.4 74.6 77.2 IncreasingOther Mining Support Services 1348 128 1476 1076 103 1179 79.8 80.5 79.9 Increasing
MINING 12230 1313 13543 10062 1105 11167 82.3 84.2 82.5 Increasing
Manufacturing, nfd 2707 226 2933 1601 97 1698 59.1 42.9 57.9 IncreasingFood Product Manufacturing 2525 667 3192 1225 233 1458 48.5 34.9 45.7 Falling
Beverage & Tobacco Manufacturing 613 101 714 293 48 341 47.8 47.5 47.8 FallingTextile, Leather, Clothing & Footwear Manufacturing 409 260 669 187 54 241 45.7 20.8 36.0 Falling
Wood Product Manufacturing 385 22 407 185 10 195 48.1 45.5 47.9 FallingPulp, Paper and Converted Paper Product Manufacturing 665 66 731 380 37 417 57.1 56.1 57.0 Increasing
Printing 623 89 712 175 28 203 28.1 31.5 28.5 FallingPetroleum and Coal Product Manufacturing 756 119 875 543 95 638 71.8 79.8 72.9 Increasing
Basic Chemical & Chemical Product Manufacturing 2165 389 2554 1460 242 1702 67.4 62.2 66.6 FallingPolymer Product & Rubber Product Manufacturing 1337 131 1468 696 49 745 52.1 37.4 50.7 Falling
Non-Metallic Mineral Product Manufacturing 1385 88 1473 877 54 931 63.3 61.4 63.2 IncreasingPrimary Metal & Metal Product Manufacturing 3857 345 4202 2711 259 2970 70.3 75.1 70.7 Increasing
Fabricated Metal Product Manufacturing 1943 116 2059 1143 65 1208 58.8 56.0 58.7 IncreasingTransport Equipment Manufacturing 6447 464 6911 4503 342 4845 69.8 73.7 70.1 Increasing
Machinery & Equipment Manufacturing 10556 787 11343 7714 499 8213 73.1 63.4 72.4 IncreasingFurniture & Other Manufacturing 560 45 605 227 9 236 40.5 20.0 39.0 Falling
MANUFACTURING 36933 3915 40848 23920 2121 26041 64.8 54.2 63.8 Increasing
Electricity, Gas, Water and Waste Services, nfd 85 11 96 71 7 78 83.5 63.6 81.3 StableElectricity Supply, nfd 454 29 483 325 18 343 71.6 62.1 71.0 IncreasingElectricity Generation 1365 89 1454 1005 73 1078 73.6 82.0 74.1 Increasing
Electricity Transmission 702 71 773 623 62 685 88.7 87.3 88.6 IncreasingElectricity Distribution 3058 226 3284 2431 181 2612 79.5 80.1 79.5 Increasing
On Selling Electricity and Electricity Market Operation 442 69 511 317 48 365 71.7 69.6 71.4 IncreasingGas Supply 595 82 677 470 66 536 79.0 80.5 79.2 Increasing
Water Supply, Sewerage and Drainage Services 2951 526 3477 2393 434 2827 81.1 82.5 81.3 IncreasingWaste Collection, Treatment and Disposal Services, nfd 8 0 8 0 0 0 0.0 0.0 0.0 Falling
Waste Collection Services 156 10 166 85 5 90 54.5 50.0 54.2 IncreasingWaste Treatment, Disposal and Remediation Services 139 18 157 83 11 94 59.7 61.1 59.9 Increasing
ELECTRICITY, GAS, WATER & WASTE SERVICES 9955 1131 11086 7803 905 8708 78.4 80.0 78.5 Increasing
Construction, nfd 983 69 1052 814 49 863 82.8 71.0 82.0 IncreasingBuilding Construction, nfd 735 50 785 547 33 580 74.4 66.0 73.9 Increasing
Residential Building Construction 2369 191 2560 1677 105 1782 70.8 55.0 69.6 IncreasingNon-Residential Building Construction 3216 297 3513 2812 269 3081 87.4 90.6 87.7 Increasing
Heavy and Civil Engineering Construction 6451 521 6972 5562 445 6007 86.2 85.4 86.2 IncreasingConstruction Services, nfd 112 5 117 64 3 67 57.1 60.0 57.3 Increasing
Land Development and Site Preparation Services 711 43 754 460 28 488 64.7 65.1 64.7 IncreasingBuilding Structure Services 619 37 656 393 22 415 63.5 59.5 63.3 Increasing
Building Installation Services 3099 138 3237 1411 87 1498 45.5 63.0 46.3 IncreasingBuilding Completion Services 677 41 718 88 7 95 13.0 17.1 13.2 IncreasingOther Construction Services 520 21 541 162 5 167 31.2 23.8 30.9 Increasing
CONSTRUCTION 19492 1413 20905 13990 1053 15043 71.8 74.5 72.0 Increasing
Wholesale Trade, nfd 462 58 520 132 14 146 28.6 24.1 28.1 FallingBasic Material Wholesaling, nfd 7 0 7 0 0 0 0.0 0.0 0.0 Falling
Agricultural Product Wholesaling 106 24 130 31 5 36 29.2 20.8 27.7 IncreasingMineral, Metal and Chemical Wholesaling 651 58 709 375 27 402 57.6 46.6 56.7 IncreasingTimber and Hardware Goods Wholesaling 506 38 544 182 15 197 36.0 39.5 36.2 Increasing
Machinery and Equipment Wholesaling, nfd 93 5 98 42 0 42 45.2 0.0 42.9 IncreasingSpecialised Industrial Machinery and Equipment Wholesaling 800 46 846 447 11 458 55.9 23.9 54.1 Increasing
Other Machinery and Equipment Wholesaling 5576 515 6091 3532 309 3841 63.3 60.0 63.1 IncreasingMotor Vehicle and Motor Vehicle Parts Wholesaling 465 18 483 173 3 176 37.2 16.7 36.4 IncreasingGrocery, Liquor and Tobacco Product Wholesaling 637 133 770 144 24 168 22.6 18.0 21.8 Increasing
Other Goods Wholesaling, nfd 14 4 18 3 0 3 21.4 0.0 16.7 StableTextile, Clothing and Footwear Wholesaling 213 138 351 48 22 70 22.5 15.9 19.9 Stable
Pharmaceutical and Toiletry Goods Wholesaling 208 69 277 107 21 128 51.4 30.4 46.2 StableFurniture, Floor Covering and Other Goods Wholesaling 608 121 729 153 22 175 25.2 18.2 24.0 Increasing
Commission-Based Wholesaling 140 16 156 77 8 85 55.0 50.0 54.5 IncreasingWHOLESALE TRADE 10486 1243 11729 5446 481 5927 51.9 38.7 50.5 Increasing
% In EngineeringEmployed in EngineeringEmployed Labour Force

Engineers Australia 75
The Engineering Profession: A Statistical Overview, 2015
Table 8.2 (Continued)
Retail Trade, nfd 500 110 610 99 6 105 19.8 5.5 17.2 StableMotor Vehicle and Motor Vehicle Parts Retailing, nfd 4 0 4 0 0 0 0.0 0.0 0.0 Stable
Motor Vehicle Retailing 440 17 457 31 3 34 7.0 17.6 7.4 IncreasingMotor Vehicle Parts and Tyre Retailing 157 8 165 29 0 29 18.5 0.0 17.6 Increasing
Fuel Retailing 619 83 702 161 34 195 26.0 41.0 27.8 IncreasingFood Retailing, nfd 47 16 63 0 6 6 0.0 37.5 9.5 Falling
Supermarket and Grocery Stores 1205 303 1508 125 20 145 10.4 6.6 9.6 IncreasingSpecialised Food Retailing 429 108 537 15 3 18 3.5 2.8 3.4 Stable
Other Store-Based Retailing, nfd 52 5 57 9 0 9 17.3 0.0 15.8 IncreasingFurniture, Floor Coverings, Houseware and Textile Goods Retailing 305 99 404 21 0 21 6.9 0.0 5.2 Increasing
Electrical and Electronic Goods Retailing 1231 115 1346 422 39 461 34.3 33.9 34.2 IncreasingHardware, Building and Garden Supplies Retailing 403 57 460 59 7 66 14.6 12.3 14.3 Increasing
Recreational Goods Retailing 431 64 495 34 0 34 7.9 0.0 6.9 IncreasingClothing, Footwear and Personal Accessory Retailing 344 272 616 44 13 57 12.8 4.8 9.3 Increasing
Department Stores 150 86 236 28 6 34 18.7 7.0 14.4 FallingPharmaceutical and Other Store-Based Retailing 536 171 707 63 8 71 11.8 4.7 10.0 Increasing
Non-Store Retailing and Retail Commission-Based, nfd 4 0 4 0 0 0 0.0 0.0 0.0 StableNon-Store Retailing 76 20 96 23 5 28 30.3 25.0 29.2 Increasing
Retail Commission-Based Buying and/or Selling 5 6 11 9 0 9 180.0 0.0 81.8 IncreasingRETAIL TRADE 6938 1540 8478 1172 150 1322 16.9 9.7 15.6 Increasing
Accommodation and Food Services, nfd 4 0 4 0 0 0 0.0 0.0 0.0 IncreasingAccommodation 806 157 963 106 8 114 13.2 5.1 11.8 Increasing
Food and Beverage Services, nfd 58 15 73 3 0 3 5.2 0.0 4.1 IncreasingCafes, Restaurants and Takeaway Food Services 2397 628 3025 61 14 75 2.5 2.2 2.5 Increasing
Pubs, Taverns and Bars 219 35 254 10 0 10 4.6 0.0 3.9 StableClubs (Hospitality) 97 27 124 4 0 4 4.1 0.0 3.2 Stable
ACCOMODATION & FOOD SERVICES 3581 862 4443 184 22 206 5.1 2.6 4.6 Increasing
Transport, Postal and Warehousing, nfd 179 19 198 109 9 118 60.9 47.4 59.6 FallingRoad Transport, nfd 21 0 21 6 0 6 28.6 0.0 28.6 na
Road Freight Transport 1200 65 1265 353 19 372 29.4 29.2 29.4 IncreasingRoad Passenger Transport 1424 33 1457 91 7 98 6.4 21.2 6.7 Increasing
Rail Transport, nfd 388 40 428 308 30 338 79.4 75.0 79.0 IncreasingRail Freight Transport 428 27 455 336 25 361 78.5 92.6 79.3 Increasing
Rail Passenger Transport 1504 158 1662 1022 89 1111 68.0 56.3 66.8 IncreasingWater Transport, nfd 190 10 200 144 5 149 75.8 50.0 74.5 Stable
Water Freight Transport 476 10 486 405 4 409 85.1 40.0 84.2 IncreasingWater Passenger Transport 78 4 82 66 3 69 84.6 75.0 84.1 Falling
Air and Space Transport 4249 336 4585 3424 217 3641 80.6 64.6 79.4 IncreasingOther Transport, nfd 0 0 0 0 0 0 0.0 0.0 0.0 na
Scenic and Sightseeing Transport 221 7 228 165 6 171 74.7 85.7 75.0 StablePipeline and Other Transport 190 17 207 162 13 175 85.3 76.5 84.5 Increasing
Postal and Courier Pick-up and Delivery Services 802 117 919 106 12 118 13.2 10.3 12.8 IncreasingTransport Support Services, nfd 3 0 3 0 0 0 0.0 0.0 0.0 Stable
Water Transport Support Services 929 30 959 718 16 734 77.3 53.3 76.5 IncreasingAirport Operations and Other Air Transport Support Services 1060 106 1166 824 74 898 77.7 69.8 77.0 Increasing
Other Transport Support Services 1475 196 1671 959 162 1121 65.0 82.7 67.1 IncreasingWarehousing and Storage Services 332 29 361 93 8 101 28.0 27.6 28.0 Increasing
TRANSPORT, POSTAL & WAREHOUSING 15149 1204 16353 9291 699 9990 61.3 58.1 61.1 Increasing
Information Media and Telecommunications, nfd 44 3 47 21 3 25 47.7 100.0 53.2 FallingPublishing (except Internet and Music Publishing), nfd 27 4 31 10 0 10 37.0 0.0 32.3 IncreasingNewspaper, Periodical, Book and Directory Publishing 371 79 450 145 35 180 39.1 44.3 40.0 Increasing
Software Publishing 46 3 49 40 3 43 87.0 100.0 87.8 IncreasingMotion Picture and Sound Recording Activities, nfd 0 0 0 0 0 0 0.0 0.0 0.0 na
Motion Picture and Video Activities 175 24 199 54 4 58 30.9 16.7 29.1 IncreasingSound Recording and Music Publishing 22 0 22 11 0 11 50.0 0.0 50.0 Increasing
Broadcasting (except Internet), nfd 34 3 37 24 0 24 70.6 0.0 64.9 IncreasingRadio Broadcasting 58 0 58 24 0 24 41.4 0.0 41.4 Stable
Television Broadcasting 348 35 383 203 16 219 58.3 45.7 57.2 IncreasingInternet Publishing and Broadcasting 54 13 67 36 9 45 66.7 69.2 67.2 Increasing
Telecommunications Services 5678 586 6264 4297 442 4739 75.7 75.4 75.7 IncreasingInternet Service Providers, Portals and Data Processing Services, nfd 3 0 3 3 0 3 100.0 0.0 100.0 Stable
Internet Service Providers and Web Search Portals 423 62 485 332 37 369 78.5 59.7 76.1 IncreasingData Processing, Web Hosting & Electronic Info Storage Services 98 15 113 59 10 69 60.2 66.7 61.1 Increasing
Library and Other Information Services, nfd 0 0 0 0 0 0 0.0 0.0 0.0 naLibraries and Archives 23 13 36 11 3 14 47.8 23.1 38.9 Falling
Other Information Services 7 3 10 4 0 4 57.1 0.0 40.0 FallingINFORMATION MEDIA & TELECOMMUNICATIONS 7411 843 8254 5274 563 5837 71.2 66.8 70.7 Increasing
Financial and Insurance Services, nfd 142 12 154 45 3 48 31.7 25.0 31.2 IncreasingFinance, nfd 214 28 242 53 9 62 24.8 32.1 25.6 Falling
Central Banking 32 9 41 25 8 33 78.1 88.9 80.5 IncreasingDepository Financial Intermediation 1675 455 2130 934 213 1147 55.8 46.8 53.8 Increasing
Non-Depository Financing 94 25 119 45 14 59 47.9 56.0 49.6 IncreasingFinancial Asset Investing 324 42 366 150 20 170 46.3 47.6 46.4 Falling
Insurance and Superannuation Funds, nfd 3 0 3 3 0 3 100.0 0.0 100.0 StableLife Insurance 56 19 75 26 9 35 46.4 47.4 46.7 Increasing
Health and General Insurance 594 156 750 295 51 346 49.7 32.7 46.1 FallingSuperannuation Funds 132 40 172 75 18 93 56.8 45.0 54.1 Falling
Auxiliary Finance and Insurance Services, nfd 3 0 3 0 0 0 0.0 0.0 0.0 naAuxiliary Finance and Investment Services 1441 244 1685 597 97 694 41.4 39.8 41.2 Falling
Auxiliary Insurance Services 131 25 156 54 7 61 41.2 28.0 39.1 IncreasingFINANCIAL & INSURANCE SERVICES 4841 1055 5896 2302 449 2751 47.6 42.6 46.7 Increasing
Rental, Hiring and Real Estate Services, nfd 3 0 3 0 0 0 0.0 0.0 0.0 StableRental and Hiring Services (except Real Estate), nfd 6 0 6 0 0 0 0.0 0.0 0.0 Falling
Motor Vehicle and Transport Equipment Rental and Hiring 130 12 142 33 0 33 25.4 0.0 23.2 IncreasingFarm Animal and Bloodstock Leasing 0 0 0 0 0 0 0.0 0.0 0.0 na
Other Goods and Equipment Rental and Hiring 330 28 358 145 7 152 43.9 25.0 42.5 IncreasingNon-Financial Intangible Assets (except Copyrights) Leasing 14 0 14 6 0 6 42.9 0.0 42.9 Increasing
Property Operators and Real Estate Services, nfd 66 5 71 11 0 11 16.7 0.0 15.5 FallingProperty Operators 510 56 566 197 16 213 38.6 28.6 37.6 IncreasingReal Estate Services 711 132 843 145 17 162 20.4 12.9 19.2 Increasing
RENTAL, HIRING, & REAL ESTATE SERVICES 1770 233 2003 537 40 577 30.3 17.2 28.8 Increasing
Professional, Scientific and Technical Services, nfd 87 13 100 56 4 60 64.4 30.8 60.0 IncreasingProfessional, Scientific and Technical Services nfd 166 21 187 119 12 131 71.7 57.1 70.1 Increasing
Scientific Research Services 1865 303 2168 1434 193 1627 76.9 63.7 75.0 IncreasingArchitectural, Engineering and Technical Services 34793 4191 38984 31611 3658 35269 90.9 87.3 90.5 Increasing
Legal and Accounting Services 852 271 1123 300 58 358 35.2 21.4 31.9 IncreasingAdvertising Services 241 47 288 93 10 103 38.6 21.3 35.8 Increasing
Market Research and Statistical Services 382 84 466 66 20 86 17.3 23.8 18.5 IncreasingManagement and Related Consulting Services 4102 633 4735 3060 469 3529 74.6 74.1 74.5 Increasing
Veterinary Services 20 10 30 9 0 9 45.0 0.0 30.0 StableOther Professional, Scientific and Technical Services 407 93 500 128 22 150 31.4 23.7 30.0 Increasing
Computer System Design and Related Services 10806 1267 12073 8331 941 9272 77.1 74.3 76.8 IncreasingPROFESSIONAL, SCIENTIFIC & TECHNICAL SERVICES 53721 6933 60654 45207 5387 50594 84.2 77.7 83.4 Increasing

Engineers Australia 76
The Engineering Profession: A Statistical Overview, 2015
Table 8.2 (Continued)
Administrative and Support Services, nfd 5 3 8 0 0 0 0.0 0.0 0.0 StableAdministrative Services, nfd 3 0 3 0 0 0 0.0 0.0 0.0 Stable
Employment Services 1023 202 1225 450 72 522 44.0 35.6 42.6 IncreasingTravel Agency and Tour Arrangement Services 285 74 359 137 18 155 48.1 24.3 43.2 Increasing
Other Administrative Services 1072 164 1236 635 58 693 59.2 35.4 56.1 IncreasingBuilding Cleaning, Pest Control and Other Support Services, nfd 0 0 0 0 0 0 0.0 0.0 0.0 na
Building Cleaning, Pest Control and Gardening Services 1290 260 1550 74 5 79 5.7 1.9 5.1 IncreasingPackaging Services 84 21 105 31 10 41 36.9 47.6 39.0 Increasing
ADMINISTRATIVE & SUPPORT SERVICES 3762 724 4486 1327 163 1490 35.3 22.5 33.2 Increasing
Public Administration and Safety, nfd 36 3 39 20 0 20 55.6 0.0 51.3 IncreasingPublic Administration, nfd 153 36 189 93 21 114 60.8 58.3 60.3 Increasing
Central Government Administration 1572 349 1921 863 168 1031 54.9 48.1 53.7 IncreasingState Government Administration 3694 697 4391 2842 512 3354 76.9 73.5 76.4 FallingLocal Government Administration 3658 566 4224 2946 430 3376 80.5 76.0 79.9 Increasing
Justice 71 19 90 34 5 39 47.9 26.3 43.3 IncreasingGovernment Representation 25 8 33 3 5 8 12.0 62.5 24.2 Increasing
Defence 5034 363 5397 3835 277 4112 76.2 76.3 76.2 IncreasingPublic Order, Safety and Regulatory Services, nfd 4 0 4 4 0 4 100.0 0.0 100.0 Falling
Public Order and Safety Services 2035 138 2173 576 47 623 28.3 34.1 28.7 IncreasingRegulatory Services 419 63 482 302 36 338 72.1 57.1 70.1 Increasing
PUBLIC ADMINISTRATION & SAFETY 16701 2242 18943 11518 1501 13019 69.0 66.9 68.7 Increasing
Education and Training, nfd 183 44 227 74 12 86 40.4 27.3 37.9 FallingPreschool and School Education, nfd 32 9 41 6 0 6 18.8 0.0 14.6 Increasing
Preschool Education 19 19 38 3 3 6 15.8 15.8 15.8 IncreasingSchool Education 1045 429 1474 157 14 171 15.0 3.3 11.6 IncreasingTertiary Education 5827 1110 6937 4239 672 4911 72.7 60.5 70.8 Increasing
Adult, Community and Other Education, nfd 3 0 3 0 0 0 0.0 0.0 0.0 FallingAdult, Community and Other Education 879 189 1068 409 55 464 46.5 29.1 43.4 Increasing
Educational Support Services 22 12 34 6 5 11 27.3 41.7 32.4 IncreasingEDUCATION & TRAINING 8010 1812 9822 4894 761 5655 61.1 42.0 57.6 Increasing
Health Care and Social Assistance, nfd 149 47 196 48 5 53 32.2 10.6 27.0 IncreasingHospitals 1059 338 1397 405 84 489 38.2 24.9 35.0 Increasing
Medical and Other Health Care Services, nfd 91 34 125 45 0 45 49.5 0.0 36.0 FallingMedical Services 286 99 385 140 14 154 49.0 14.1 40.0 Increasing
Pathology and Diagnostic Imaging Services 122 44 166 55 7 62 45.1 15.9 37.3 IncreasingAllied Health Services 262 153 415 35 10 45 13.4 6.5 10.8 Increasing
Other Health Care Services 126 26 152 43 5 48 34.1 19.2 31.6 IncreasingResidential Care Services 467 296 763 53 10 63 11.3 3.4 8.3 Increasing
Social Assistance Services, nfd 119 49 168 25 6 31 21.0 12.2 18.5 FallingChild Care Services 70 168 238 11 4 15 15.7 2.4 6.3 Increasing
Other Social Assistance Services 361 175 536 81 22 103 22.4 12.6 19.2 IncreasingHEALTH CARE & SOCIAL ASSISTANCE 3112 1429 4541 941 167 1108 30.2 11.7 24.4 Increasing
Arts and Recreation Services, nfd 17 0 17 5 0 5 29.4 0.0 29.4 IncreasingHeritage Activities, nfd 0 0 0 0 0 0 0.0 0.0 0.0 na
Museum Operation 60 16 76 26 8 34 43.3 50.0 44.7 IncreasingParks and Gardens Operations 57 15 72 40 8 48 70.2 53.3 66.7 Stable
Creative and Performing Arts Activities 189 48 237 29 7 36 15.3 14.6 15.2 IncreasingSports and Recreation Activities, nfd 8 0 8 0 0 0 0.0 0.0 0.0 Stable
Sports and Physical Recreation Activities 240 42 282 71 6 77 29.6 14.3 27.3 IncreasingHorse and Dog Racing Activities 28 3 31 9 3 12 32.1 100.0 38.7 Stable
Amusement and Other Recreation Activities 91 9 100 24 0 24 26.4 0.0 24.0 IncreasingGambling Activities 398 65 463 118 8 126 29.6 12.3 27.2 Increasing
ARTS & RECREATION SERVICES 1088 198 1286 322 40 362 29.6 20.2 28.1 Increasing
Other Services, nfd 0 0 0 0 0 0 0.0 0.0 0.0 naRepair and Maintenance, nfd 197 3 200 49 0 49 24.9 0.0 24.5 Increasing
Automotive Repair and Maintenance 784 25 809 118 4 122 15.1 16.0 15.1 IncreasingMachinery and Equipment Repair and Maintenance 2209 99 2308 861 41 902 39.0 41.4 39.1 Increasing
Other Repair and Maintenance 87 44 131 3 0 3 3.4 0.0 2.3 IncreasingPersonal and Other Services, nfd 0 0 0 0 0 0 0.0 0.0 0.0 na
Personal Care Services 54 46 100 6 0 6 11.1 0.0 6.0 IncreasingFuneral, Crematorium and Cemetery Services 25 3 28 5 0 5 20.0 0.0 17.9 Stable
Other Personal Services 269 72 341 33 3 36 12.3 4.2 10.6 StableReligious Services 266 35 301 21 3 24 7.9 8.6 8.0 Falling
Civic, Professional and Other Interest Group Services 334 90 424 207 41 248 62.0 45.6 58.5 IncreasingPrivate Households Employing Staff Household Service Production 5 5 10 5 0 5 100.0 0.0 50.0 Increasing
OTHER SERVICES 4230 422 4652 1308 92 1400 30.9 21.8 30.1 Increasing
Inadequately described & not stated 4279 521 4800 2249 202 2451 52.6 38.8 51.1 naALL INDUSTRIES 225323 29192 254515 148000 15912 163912 65.7 54.5 64.4 Increasing
Source: ABS, Population Census 2011; Compiled using TableBuilder Pro
Engineers Australia 77
The Engineering Profession: A Statistical Overview, 2015
Chapter 9 Geographic Location Main Points This Chapter looks at the geographic distribution of the engineering labour force within States and Territories. Statistics have not changed since last year.
The engineering labour force is concentrated within major urban areas in each jurisdiction. The statistics relate to sub-State regions and show a wide range in size of engineering populations. There are also substantial differences in unemployment rates within each jurisdiction.
9.1 The ABS Approach to Geographic Statistics This Chapter presents statistics on the engineering labour force for geographic locations within States and Territories. The statistics follow the ABS Australian Geography Standard (ASGS) which was first introduced in July 2011. This classification system was a fundamental change from earlier geographic classifications used by the ABS. For this reason only statistics from the 2011 census are provided to avoid the complexities associated with mapping earlier statistics into the ASGS formats.
The ASGS is a hierarchical system whose smallest geographic region is the “mesh block”. “Mesh blocks” reflect land use boundaries and wherever possible contain or aggregate to whole suburbs or rural locations. There are 347,000 mesh blocks covering Australia with no gaps or overlaps.
Mesh blocks aggregate to Statistical Areas level 1(SLA1). In turn SLA1s aggregate to Statistical Areas level 2 (SLA2) and these aggregate to Statistical Areas level 3 (SLA3). The statistics in this Chapter are classified according to the next level of aggregation, Statistical Areas level 4 are aggregations of SLA3s and are the largest formal sub-State region in the classification. SLA4s reflect labour markets and are the best sub-State socio-economic breakdown in the ASGS. SLA4s have a minimum population of 100,000 but have much larger populations in metropolitan areas. There are 106 SLA4s covering Australia, including several that cover people in transit at the time of the census.
The ABS has outlined the structure of the ASGS in considerable detail and this is available from its web site33. This publication also contains maps of the SLA structure for each State and Territory should readers require this information.
9.2 New South Wales Table 9.1 sets out statistics on the engineering labour market in 30 SLA4s in New South Wales; 14 SLA4s cover the Sydney metropolitan areas, 14 the balance of the State and there are 2 transitory categories. The statistics provided cover employment, unemployment, the labour force, unemployment rates and the proportion of employment in engineering occupations. Each of these is provided for men, women and the two genders combined. Finally, the share of women in the engineering labour force is given for each region.
Table 9.1 covers an engineering labour force of 86,490; 83,119 were employed and 3,319 were unemployed giving an unemployment rate of 3.9% for the State. The proportion of the State’s engineering labour force employed in engineering occupations was 58.3% and women accounted for 12.4% of the State’s engineers. Features of the regional distribution include:
33 See ABS, Australian Statistical Geography Standard, Cat No 1270.0.55.001, 23 December 2010, www.abs.gov.au/AUSSTATS/abs@nsf/DetailsPage/1270.0.55.001July2011?OpenDocument

Engineers Australia 78
The Engineering Profession: A Statistical Overview, 2015
• The largest regional engineering labour force was in Sydney-Inner west which had 7,726 engineers. The unemployment rate was above the State average at 5.4% and the proportion employed in engineering occupations was comparatively low at 48.1%. Women accounted for 13.7% of the labour force.
• The smallest regional labour force was in Far West and Orana which had 353 engineers. The unemployment rate was well below the State average, just 2.8% and the proportion employed in engineering occupations was slightly higher than the State average at 59.2%. Women accounted for 12.5% of the region’s engineering labour force.
• The highest unemployment rate occurred in Sydney-Eastern Suburbs region with 5.5% and the lowest was in the Hunter Valley excluding Newcastle region with just 1.5%.
• The highest proportion of the engineering labour force employed in engineering occupations was 71.1%, considerably higher than the State average in the Hunter Valley excluding Newcastle region and the lowest proportion was in Sydney South West with just 45.1% employed in engineering occupations.
9.3 Victoria Victorian regional statistics are set out in Table 9.2. This Table covers 8 metropolitan regions, 9 non-metropolitan regions and two transitory categories. In 2011, the Victorian engineering labour force comprised 72,768; 69,872 were employed and 2,896 were unemployed giving an unemployment rate of 4.0%. The proportion of the labour force employed in engineering occupations was 58.3% and women accounted for 12.9% of the labour force. Other features include:
• The largest regional engineering labour force was in Melbourne-Inner with 11,079 engineers. The unemployment rate was above the State average with 4.3%. The proportion of the labour force employed in engineering occupations was also above the State average at 65.4% as was the women’s share of the labour force with 16.8%.
• The smallest engineering labour force was in the North West region with 382 engineers. The unemployment rate, 2.6%, was below the State average but so too was the proportion employed in engineering occupations which was 52.4% and the share of women in the engineering labour force, 10.2%.
• The highest unemployment rate, 5.0%, was in Melbourne West region and the lowest, 1.8%, was in Shepparton.
• The highest proportion of the labour force employed in engineering occupations was in Bendigo region with 67.5% and the lowest was 50.6% in Melbourne West region.
9.4 Queensland Table 9.3 provides statistics for 21 regions in Queensland; 5 cover metropolitan Brisbane, 14 are other Queensland cities and country areas and 2 are transitory categories. The statistics cover a State engineering labour force of 44,810; 43,447 were employed and 1,363 were unemployed. The State unemployment rate was 3.0% and 68.3% of the engineering labour force was employed in engineering occupations. Women accounted for 10.5% of the labour force. Features include:
• The largest engineering labour force was 6,397 in Brisbane Inner City region. Here the unemployment rate was 2.7%, 76.8% of the engineering labour force was employed in engineering occupations and 14.2% of the labour force were women.
• The smallest engineering labour force was 518 in the Darling Downs-Maranoa region. The unemployment rate was 1.4%, 58.1% of the labour force was employed in engineering occupations and women accounted for 7.7% of the labour force.
• The highest unemployment rate was 4.6% in the Gold Coast region and the lowest was 0.5% in Queensland Outback region.
• The highest proportion of the labour force employed in engineering occupations was 76.8% in Brisbane Inner City region and the lowest was 56.4% in Logan-Beaudesert region.

Engineers Australia 79
The Engineering Profession: A Statistical Overview, 2015
9.5 South Australia Table 9.4 gives statistics for 9 regions in South Australia; 4 cover Adelaide, 3 areas of the State outside of Adelaide and there are 2 transitional categories. The Table covers an engineering labour force of 15,000; 12,997 employed and 1,423 unemployed. The State’s unemployment rate was 3.9% and 63.8% of the engineering labour force was employed in engineering occupations. Women accounted for 10.3% of the labour force. Other features include:
• The largest regional labour market was Adelaide Central and Hills with 4,557 engineers. The unemployment rate was 4.1% and 68.2% of the labour force was employed in engineering occupations. Women accounted for 11.0% of the labour force.
• The smallest region was Barossa-Yorke-Mid North which had 307 engineers. The unemployment rate was 1.6% but just 54.4% of the labour force was employed in engineering occupations. Women accounted for 11.1% of the labour force.
• The highest unemployment rate occurred in Adelaide West region with 4.6% and the lowest was 1.2% in South Australia Outback.
• The highest proportion of the labour force employed in engineering occupations was 76.9% in South Australia Outback and the lowest was 54.4% in Barossa-Yorke-Mid North region.
9.6 Western Australia Table 9.5 covers the 11 regions in Western Australia; 5 cover metropolitan Perth, 4 cover other areas of the State and there were 2 transitory categories. The Table covers a labour force of 35,003 engineers; 34,125 employed and 878 unemployed. The State’s unemployment rate was very low at 2.5% and 69.6% of the labour force was employed in engineering occupations, the highest of any jurisdiction. Women accounted for 10.3% of the labour force. Other features include:
• The largest region was Perth-South East with 8,030 engineers. The unemployment rate was 3.4% and 67.3% were employed in engineering occupations. Women accounted for 11.2% of the labour force.
• The smallest region was Western Australia-Wheat Belt with 496 engineers. Unemployment was low at 2.4% but just 47.4% were employed in engineering occupations. There were 9.7% women in the labour force.
• The highest unemployment rate occurred in Mandurah region with 4.1% and the lowest was in Western Australia-Outback region with 1.0%.
• The highest proportion of the labour force employed in engineering occupations was in Perth Inner region with 76.9% and the lowest was 47.4% in Western Australia-Wheat Belt.
9.7 Tasmania Table 9.6 covers 6 regions in Tasmania, 2 of which were transitory categories. Overall the engineering labour force was small with 2,946 engineers; 2,833 employed and 113 unemployed. The unemployment rate was 3.8% and 65.7% of the labour force was employed in engineering occupations. Women accounted for 8.4% of the labour force. Other Features include:
• The largest region was Hobart with 1,620 engineers. The unemployment rate was 4.0% and 67.6% of the labour force was employed in engineering occupations. Women accounted for 9.8% of the labour force.
• The smallest region was South East with 118 engineers. The region had an unemployment rate of 5.1% and 61.9% of the labour force was employed in the engineering occupations. Women accounted for 9.3% of the labour force.
• The highest unemployment rate was 5.1% in South East region and the lowest was 3.1% in Launceston and North East region.
• The highest proportion of the labour force employed in engineering occupations was 67.6% in Hobart and the lowest was 61.9% in South East region; this range was the lowest in any jurisdiction.

Engineers Australia 80
The Engineering Profession: A Statistical Overview, 2015
9.8 The Territories Separate Table were not compiled for the Territories because the numbers involved were too small. Some particulars include:
• There were 4 regions in the Northern Territory, 2 of which were transitory. o Overall the Territory’s engineering labour force numbered 1,876. The unemployment rate
was 1.6% and 62.8% were employed in engineering occupations. Women accounted for 10.6% of the labour force.
o Almost three-quarters of the labour force, 1,355, lived in Darwin and labour market characteristics were almost identical to the Territory as a whole.
o There were 504 engineers in the second region, Northern Territory-Outback. Here unemployment was almost non-existent (0.8%) and other characteristics followed the Territory pattern.
• The Australian Capital Territory is effectively one region with an engineering labour force of 4,958. The unemployment rate was 2.9% and 65.1% of the labour force was employed in engineering occupation. Women accounted for 12.9% of the labour force.
• There were 35 engineers in total in other Australian Territories.
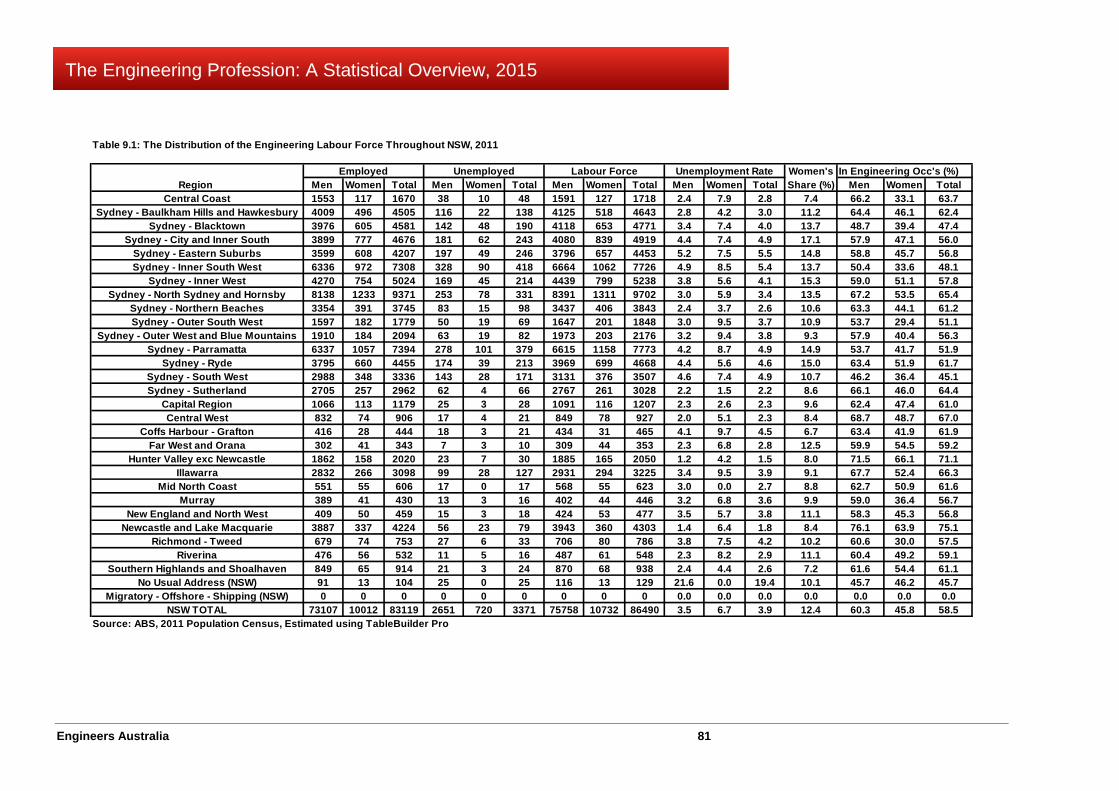
Engineers Australia 81
The Engineering Profession: A Statistical Overview, 2015
Table 9.1: The Distribution of the Engineering Labour Force Throughout NSW, 2011
Women's In Engineering Occ's (%)Region Men Women Total Men Women Total Men Women Total Men Women Total Share (%) Men Women Total
Central Coast 1553 117 1670 38 10 48 1591 127 1718 2.4 7.9 2.8 7.4 66.2 33.1 63.7Sydney - Baulkham Hills and Hawkesbury 4009 496 4505 116 22 138 4125 518 4643 2.8 4.2 3.0 11.2 64.4 46.1 62.4
Sydney - Blacktown 3976 605 4581 142 48 190 4118 653 4771 3.4 7.4 4.0 13.7 48.7 39.4 47.4Sydney - City and Inner South 3899 777 4676 181 62 243 4080 839 4919 4.4 7.4 4.9 17.1 57.9 47.1 56.0
Sydney - Eastern Suburbs 3599 608 4207 197 49 246 3796 657 4453 5.2 7.5 5.5 14.8 58.8 45.7 56.8Sydney - Inner South West 6336 972 7308 328 90 418 6664 1062 7726 4.9 8.5 5.4 13.7 50.4 33.6 48.1
Sydney - Inner West 4270 754 5024 169 45 214 4439 799 5238 3.8 5.6 4.1 15.3 59.0 51.1 57.8Sydney - North Sydney and Hornsby 8138 1233 9371 253 78 331 8391 1311 9702 3.0 5.9 3.4 13.5 67.2 53.5 65.4
Sydney - Northern Beaches 3354 391 3745 83 15 98 3437 406 3843 2.4 3.7 2.6 10.6 63.3 44.1 61.2Sydney - Outer South West 1597 182 1779 50 19 69 1647 201 1848 3.0 9.5 3.7 10.9 53.7 29.4 51.1
Sydney - Outer West and Blue Mountains 1910 184 2094 63 19 82 1973 203 2176 3.2 9.4 3.8 9.3 57.9 40.4 56.3Sydney - Parramatta 6337 1057 7394 278 101 379 6615 1158 7773 4.2 8.7 4.9 14.9 53.7 41.7 51.9
Sydney - Ryde 3795 660 4455 174 39 213 3969 699 4668 4.4 5.6 4.6 15.0 63.4 51.9 61.7Sydney - South West 2988 348 3336 143 28 171 3131 376 3507 4.6 7.4 4.9 10.7 46.2 36.4 45.1Sydney - Sutherland 2705 257 2962 62 4 66 2767 261 3028 2.2 1.5 2.2 8.6 66.1 46.0 64.4
Capital Region 1066 113 1179 25 3 28 1091 116 1207 2.3 2.6 2.3 9.6 62.4 47.4 61.0Central West 832 74 906 17 4 21 849 78 927 2.0 5.1 2.3 8.4 68.7 48.7 67.0
Coffs Harbour - Grafton 416 28 444 18 3 21 434 31 465 4.1 9.7 4.5 6.7 63.4 41.9 61.9Far West and Orana 302 41 343 7 3 10 309 44 353 2.3 6.8 2.8 12.5 59.9 54.5 59.2
Hunter Valley exc Newcastle 1862 158 2020 23 7 30 1885 165 2050 1.2 4.2 1.5 8.0 71.5 66.1 71.1Illawarra 2832 266 3098 99 28 127 2931 294 3225 3.4 9.5 3.9 9.1 67.7 52.4 66.3
Mid North Coast 551 55 606 17 0 17 568 55 623 3.0 0.0 2.7 8.8 62.7 50.9 61.6Murray 389 41 430 13 3 16 402 44 446 3.2 6.8 3.6 9.9 59.0 36.4 56.7
New England and North West 409 50 459 15 3 18 424 53 477 3.5 5.7 3.8 11.1 58.3 45.3 56.8Newcastle and Lake Macquarie 3887 337 4224 56 23 79 3943 360 4303 1.4 6.4 1.8 8.4 76.1 63.9 75.1
Richmond - Tweed 679 74 753 27 6 33 706 80 786 3.8 7.5 4.2 10.2 60.6 30.0 57.5Riverina 476 56 532 11 5 16 487 61 548 2.3 8.2 2.9 11.1 60.4 49.2 59.1
Southern Highlands and Shoalhaven 849 65 914 21 3 24 870 68 938 2.4 4.4 2.6 7.2 61.6 54.4 61.1No Usual Address (NSW) 91 13 104 25 0 25 116 13 129 21.6 0.0 19.4 10.1 45.7 46.2 45.7
Migratory - Offshore - Shipping (NSW) 0 0 0 0 0 0 0 0 0 0.0 0.0 0.0 0.0 0.0 0.0 0.0NSW TOTAL 73107 10012 83119 2651 720 3371 75758 10732 86490 3.5 6.7 3.9 12.4 60.3 45.8 58.5
Source: ABS, 2011 Population Census, Estimated using TableBuilder Pro
Employed Unemployed Labour Force Unemployment Rate

Engineers Australia 82
The Engineering Profession: A Statistical Overview, 2015
Table 9.2: The Distribution of the Engineering Labour Force Throughout Victoria, 2011
Women's In Engineering Occ's (%)Region Men Women Total Men Women Total Men Women Total Men Women Total Share (%) Men Women Total
Melbourne - Inner 8854 1753 10607 360 112 472 9214 1865 11079 3.9 6.0 4.3 16.8 66.8 58.6 65.4Melbourne - Inner East 6877 974 7851 253 50 303 7130 1024 8154 3.5 4.9 3.7 12.6 63.2 48.5 61.4
Melbourne - Inner South 6439 1057 7496 206 55 261 6645 1112 7757 3.1 4.9 3.4 14.3 63.1 47.0 60.8Melbourne - North East 5010 697 5707 192 56 248 5202 753 5955 3.7 7.4 4.2 12.6 58.7 45.0 56.9Melbourne - North West 3008 399 3407 135 28 163 3143 427 3570 4.3 6.6 4.6 12.0 55.5 47.8 54.5Melbourne - Outer East 6114 693 6807 188 21 209 6302 714 7016 3.0 2.9 3.0 10.2 62.9 48.9 61.5Melbourne - South East 8829 1311 10140 404 112 516 9233 1423 10656 4.4 7.9 4.8 13.4 52.8 42.8 51.5
Melbourne - West 7217 1103 8320 348 92 440 7565 1195 8760 4.6 7.7 5.0 13.6 51.6 44.2 50.6Mornington Peninsula 1762 159 1921 60 12 72 1822 171 1993 3.3 7.0 3.6 8.6 56.9 36.8 55.2
Ballarat 768 88 856 23 3 26 791 91 882 2.9 3.3 2.9 10.3 63.2 42.9 61.1Bendigo 725 72 797 22 0 22 747 72 819 2.9 0.0 2.7 8.8 67.9 63.9 67.5Geelong 2045 188 2233 53 6 59 2098 194 2292 2.5 3.1 2.6 8.5 63.3 44.8 61.7
Hume 743 81 824 16 3 19 759 84 843 2.1 3.6 2.3 10.0 59.7 38.1 57.5Latrobe - Gippsland 1412 108 1520 29 10 39 1441 118 1559 2.0 8.5 2.5 7.6 64.1 46.6 62.7
North West 333 39 372 10 0 10 343 39 382 2.9 0.0 2.6 10.2 53.9 38.5 52.4Shepparton 425 66 491 6 3 9 431 69 500 1.4 4.3 1.8 13.8 62.9 56.5 62.0
Warrnambool and South West 396 43 439 9 3 12 405 46 451 2.2 6.5 2.7 10.2 58.8 41.3 57.0No Usual Address (Vic.) 73 11 84 13 3 16 86 14 100 15.1 21.4 16.0 14.0 48.8 57.1 50.0
Migratory - Offshore - Shipping (Vic.) 3 0 3 0 0 0 3 0 3 0.0 0.0 0.0 0.0 0.0 0.0 0.0TOTAL VICTORIA 61030 8842 69872 2327 569 2896 63357 9411 72768 3.7 6.0 4.0 12.9 59.8 48.3 58.3
Source: ABS, 2011 Population Census, Estimated using TableBuilder Pro
Employed Unemployed Labour Force Unemployment Rate
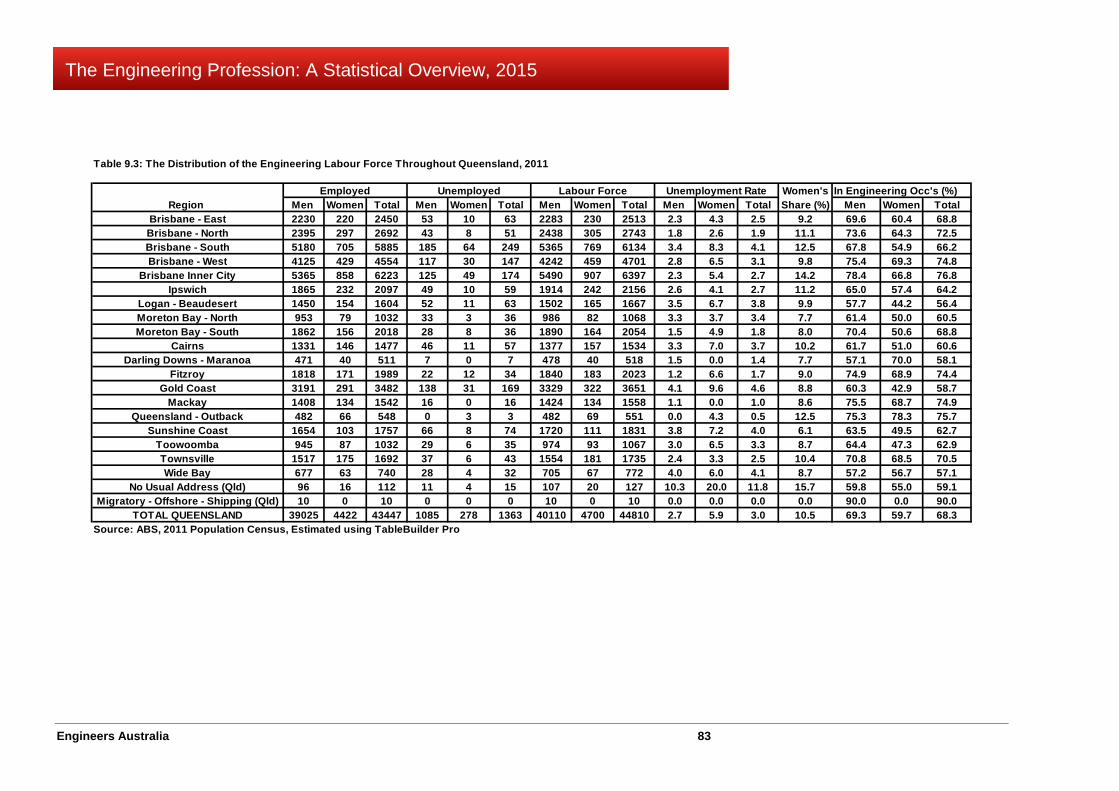
Engineers Australia 83
The Engineering Profession: A Statistical Overview, 2015
Table 9.3: The Distribution of the Engineering Labour Force Throughout Queensland, 2011
Women's In Engineering Occ's (%)Region Men Women Total Men Women Total Men Women Total Men Women Total Share (%) Men Women Total
Brisbane - East 2230 220 2450 53 10 63 2283 230 2513 2.3 4.3 2.5 9.2 69.6 60.4 68.8Brisbane - North 2395 297 2692 43 8 51 2438 305 2743 1.8 2.6 1.9 11.1 73.6 64.3 72.5Brisbane - South 5180 705 5885 185 64 249 5365 769 6134 3.4 8.3 4.1 12.5 67.8 54.9 66.2Brisbane - West 4125 429 4554 117 30 147 4242 459 4701 2.8 6.5 3.1 9.8 75.4 69.3 74.8
Brisbane Inner City 5365 858 6223 125 49 174 5490 907 6397 2.3 5.4 2.7 14.2 78.4 66.8 76.8Ipswich 1865 232 2097 49 10 59 1914 242 2156 2.6 4.1 2.7 11.2 65.0 57.4 64.2
Logan - Beaudesert 1450 154 1604 52 11 63 1502 165 1667 3.5 6.7 3.8 9.9 57.7 44.2 56.4Moreton Bay - North 953 79 1032 33 3 36 986 82 1068 3.3 3.7 3.4 7.7 61.4 50.0 60.5Moreton Bay - South 1862 156 2018 28 8 36 1890 164 2054 1.5 4.9 1.8 8.0 70.4 50.6 68.8
Cairns 1331 146 1477 46 11 57 1377 157 1534 3.3 7.0 3.7 10.2 61.7 51.0 60.6Darling Downs - Maranoa 471 40 511 7 0 7 478 40 518 1.5 0.0 1.4 7.7 57.1 70.0 58.1
Fitzroy 1818 171 1989 22 12 34 1840 183 2023 1.2 6.6 1.7 9.0 74.9 68.9 74.4Gold Coast 3191 291 3482 138 31 169 3329 322 3651 4.1 9.6 4.6 8.8 60.3 42.9 58.7
Mackay 1408 134 1542 16 0 16 1424 134 1558 1.1 0.0 1.0 8.6 75.5 68.7 74.9Queensland - Outback 482 66 548 0 3 3 482 69 551 0.0 4.3 0.5 12.5 75.3 78.3 75.7
Sunshine Coast 1654 103 1757 66 8 74 1720 111 1831 3.8 7.2 4.0 6.1 63.5 49.5 62.7Toowoomba 945 87 1032 29 6 35 974 93 1067 3.0 6.5 3.3 8.7 64.4 47.3 62.9Townsville 1517 175 1692 37 6 43 1554 181 1735 2.4 3.3 2.5 10.4 70.8 68.5 70.5Wide Bay 677 63 740 28 4 32 705 67 772 4.0 6.0 4.1 8.7 57.2 56.7 57.1
No Usual Address (Qld) 96 16 112 11 4 15 107 20 127 10.3 20.0 11.8 15.7 59.8 55.0 59.1Migratory - Offshore - Shipping (Qld) 10 0 10 0 0 0 10 0 10 0.0 0.0 0.0 0.0 90.0 0.0 90.0
TOTAL QUEENSLAND 39025 4422 43447 1085 278 1363 40110 4700 44810 2.7 5.9 3.0 10.5 69.3 59.7 68.3Source: ABS, 2011 Population Census, Estimated using TableBuilder Pro
Employed Unemployed Labour Force Unemployment Rate
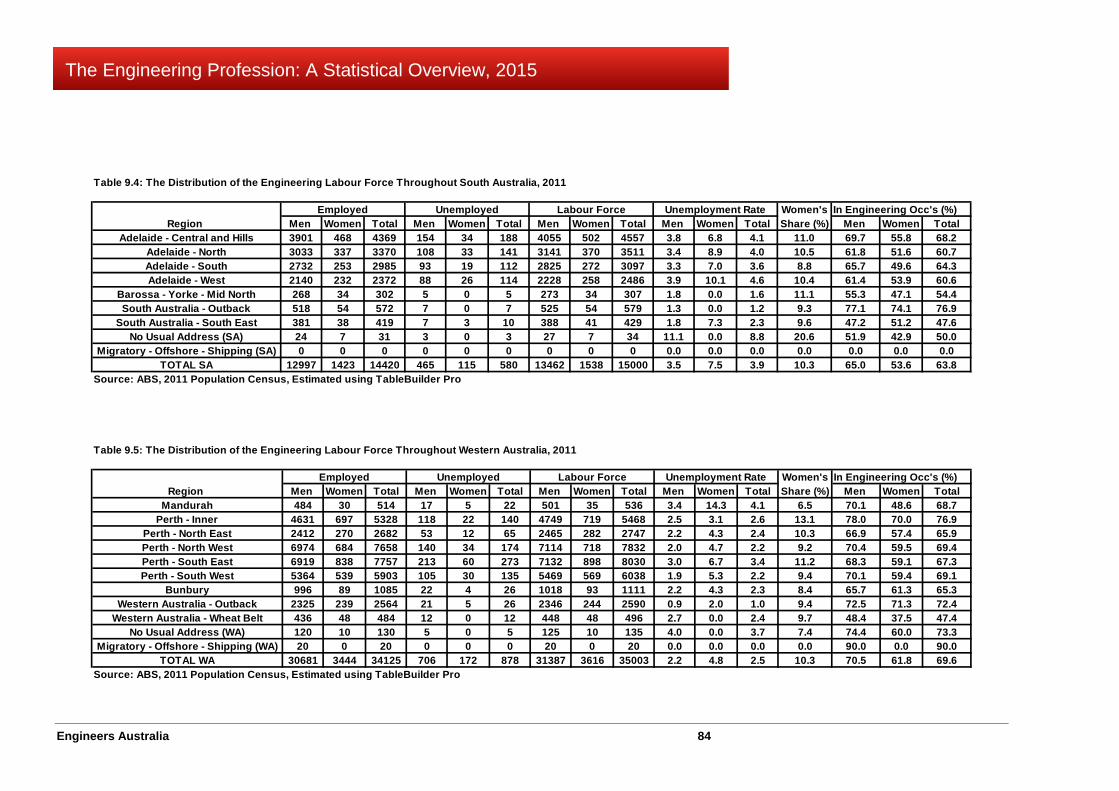
Engineers Australia 84
The Engineering Profession: A Statistical Overview, 2015
Table 9.4: The Distribution of the Engineering Labour Force Throughout South Australia, 2011
Women's In Engineering Occ's (%)Region Men Women Total Men Women Total Men Women Total Men Women Total Share (%) Men Women Total
Adelaide - Central and Hills 3901 468 4369 154 34 188 4055 502 4557 3.8 6.8 4.1 11.0 69.7 55.8 68.2Adelaide - North 3033 337 3370 108 33 141 3141 370 3511 3.4 8.9 4.0 10.5 61.8 51.6 60.7Adelaide - South 2732 253 2985 93 19 112 2825 272 3097 3.3 7.0 3.6 8.8 65.7 49.6 64.3Adelaide - West 2140 232 2372 88 26 114 2228 258 2486 3.9 10.1 4.6 10.4 61.4 53.9 60.6
Barossa - Yorke - Mid North 268 34 302 5 0 5 273 34 307 1.8 0.0 1.6 11.1 55.3 47.1 54.4South Australia - Outback 518 54 572 7 0 7 525 54 579 1.3 0.0 1.2 9.3 77.1 74.1 76.9
South Australia - South East 381 38 419 7 3 10 388 41 429 1.8 7.3 2.3 9.6 47.2 51.2 47.6No Usual Address (SA) 24 7 31 3 0 3 27 7 34 11.1 0.0 8.8 20.6 51.9 42.9 50.0
Migratory - Offshore - Shipping (SA) 0 0 0 0 0 0 0 0 0 0.0 0.0 0.0 0.0 0.0 0.0 0.0TOTAL SA 12997 1423 14420 465 115 580 13462 1538 15000 3.5 7.5 3.9 10.3 65.0 53.6 63.8
Source: ABS, 2011 Population Census, Estimated using TableBuilder Pro
Employed Unemployed Labour Force Unemployment Rate
Table 9.5: The Distribution of the Engineering Labour Force Throughout Western Australia, 2011
Women's In Engineering Occ's (%)Region Men Women Total Men Women Total Men Women Total Men Women Total Share (%) Men Women Total
Mandurah 484 30 514 17 5 22 501 35 536 3.4 14.3 4.1 6.5 70.1 48.6 68.7Perth - Inner 4631 697 5328 118 22 140 4749 719 5468 2.5 3.1 2.6 13.1 78.0 70.0 76.9
Perth - North East 2412 270 2682 53 12 65 2465 282 2747 2.2 4.3 2.4 10.3 66.9 57.4 65.9Perth - North West 6974 684 7658 140 34 174 7114 718 7832 2.0 4.7 2.2 9.2 70.4 59.5 69.4Perth - South East 6919 838 7757 213 60 273 7132 898 8030 3.0 6.7 3.4 11.2 68.3 59.1 67.3Perth - South West 5364 539 5903 105 30 135 5469 569 6038 1.9 5.3 2.2 9.4 70.1 59.4 69.1
Bunbury 996 89 1085 22 4 26 1018 93 1111 2.2 4.3 2.3 8.4 65.7 61.3 65.3Western Australia - Outback 2325 239 2564 21 5 26 2346 244 2590 0.9 2.0 1.0 9.4 72.5 71.3 72.4
Western Australia - Wheat Belt 436 48 484 12 0 12 448 48 496 2.7 0.0 2.4 9.7 48.4 37.5 47.4No Usual Address (WA) 120 10 130 5 0 5 125 10 135 4.0 0.0 3.7 7.4 74.4 60.0 73.3
Migratory - Offshore - Shipping (WA) 20 0 20 0 0 0 20 0 20 0.0 0.0 0.0 0.0 90.0 0.0 90.0TOTAL WA 30681 3444 34125 706 172 878 31387 3616 35003 2.2 4.8 2.5 10.3 70.5 61.8 69.6
Source: ABS, 2011 Population Census, Estimated using TableBuilder Pro
Employed Unemployed Labour Force Unemployment Rate
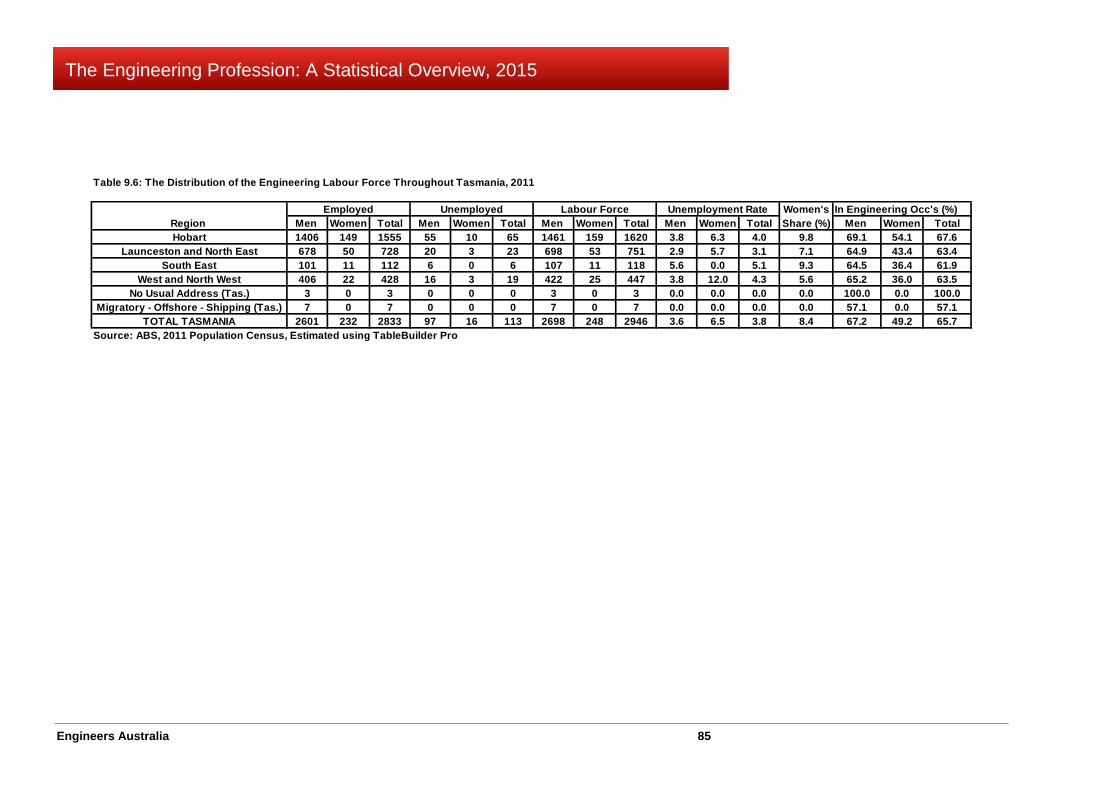
Engineers Australia 85
The Engineering Profession: A Statistical Overview, 2015
Table 9.6: The Distribution of the Engineering Labour Force Throughout Tasmania, 2011
Women's In Engineering Occ's (%)Region Men Women Total Men Women Total Men Women Total Men Women Total Share (%) Men Women TotalHobart 1406 149 1555 55 10 65 1461 159 1620 3.8 6.3 4.0 9.8 69.1 54.1 67.6
Launceston and North East 678 50 728 20 3 23 698 53 751 2.9 5.7 3.1 7.1 64.9 43.4 63.4South East 101 11 112 6 0 6 107 11 118 5.6 0.0 5.1 9.3 64.5 36.4 61.9
West and North West 406 22 428 16 3 19 422 25 447 3.8 12.0 4.3 5.6 65.2 36.0 63.5No Usual Address (Tas.) 3 0 3 0 0 0 3 0 3 0.0 0.0 0.0 0.0 100.0 0.0 100.0
Migratory - Offshore - Shipping (Tas.) 7 0 7 0 0 0 7 0 7 0.0 0.0 0.0 0.0 57.1 0.0 57.1TOTAL TASMANIA 2601 232 2833 97 16 113 2698 248 2946 3.6 6.5 3.8 8.4 67.2 49.2 65.7
Source: ABS, 2011 Population Census, Estimated using TableBuilder Pro
Employed Unemployed Labour Force Unemployment Rate
Engineers Australia 86
The Engineering Profession: A Statistical Overview, 2015
Chapter 10 Engineering Specialisations Main Points Specialisation in engineering begins with the stream of engineering studied in the requisite entry level qualification. Most specialisation occurs on-the-job in the three to four years after graduation. Statistics on the numbers of engineers in different specialist areas are not available. This Chapter provides statistics on numbers in streams of engineering education. Statistics have not changed since last year.
Statistics are provided for 10 broad streams of engineering and 56 detailed streams for the engineering labour force, unemployment and the proportion of the labour force employed in engineering occupations. In all cases the statistics are provided by gender.
The degree of fragmentation of the engineering labour force into unique specialist streams is very high; 22 of the 56 detailed streams listed have 1,000 or more engineers and 26 have more than 500. The number of engineers in streams with less than 500 is 4,274 and in many instances includes substantial numbers employed in engineering occupations.
Aggregation dilutes the comparatively high proportion employed in engineering occupations in several broad streams of engineering In many instances the proportion of the labour force employed in engineering occupations was consistently high across detailed streams, for example in civil engineering. In other instances, including well known ones, the proportion employed in engineering occupations was below the national average in all detailed streams, for example in mechanical and industrial engineering.
With few exceptions, the proportion of women employed in engineering occupations in both broad and detailed streams is substantially less than men. The role this plays in retarding the development of more women engineers warrants further investigation.
Although aggregate unemployment among engineers has been low, there are numerous pockets of high unemployment in specific detailed streams of engineering.
10.1 Engineering Courses and Engineering Specialisation The purpose of this Chapter is to provide an overview of engineering specialisation and some of the important issues involved. In engineering specialisation in a specific area of engineering practice is common and this is widely understood in the community. However, how engineers become specialists in their chosen field is not well understood.
Specialisation begins with the choice of university or TAFE education pathway or stream. Degree or advanced diploma programs are differentiated according to the main field of engineering addressed by courses. Thus, for example, there are programs in mechanical, civil or electrical engineering, sometimes even finer delineation such as distinguishing between civil and construction engineering are offered. The characteristic of formal programs are they are systematic, planned, organised and have formal evaluation mechanisms for achievement in the setting of educational institutions.
All education statistics included in the Statistical Overview are classified according to the ABS Australian Standard Classification of Education (ASCED). ASCED was developed as a framework for collecting statistics relating to formal educational activities like the ones discussed above. The system is structured according to the field of education pursued and the level of educational activity undertaken. To the extent that universities and TAFE colleges stream engineering courses into different pathways, ASCED provides a consistent basis for measuring attendance and completion of courses in these different streams. ASCED is a hierarchical structure which provides greater or less detail depending on the level
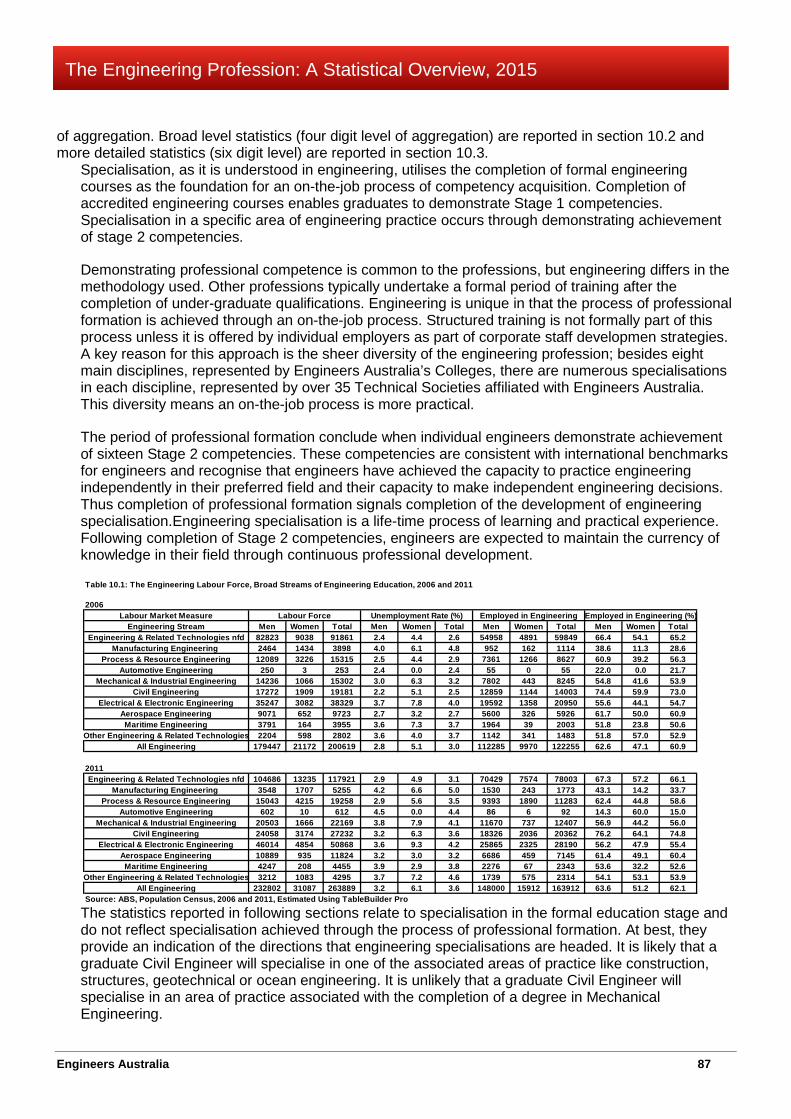
Engineers Australia 87
The Engineering Profession: A Statistical Overview, 2015
of aggregation. Broad level statistics (four digit level of aggregation) are reported in section 10.2 and more detailed statistics (six digit level) are reported in section 10.3.
Specialisation, as it is understood in engineering, utilises the completion of formal engineering courses as the foundation for an on-the-job process of competency acquisition. Completion of accredited engineering courses enables graduates to demonstrate Stage 1 competencies. Specialisation in a specific area of engineering practice occurs through demonstrating achievement of stage 2 competencies.
Demonstrating professional competence is common to the professions, but engineering differs in the methodology used. Other professions typically undertake a formal period of training after the completion of under-graduate qualifications. Engineering is unique in that the process of professional formation is achieved through an on-the-job process. Structured training is not formally part of this process unless it is offered by individual employers as part of corporate staff developmen strategies. A key reason for this approach is the sheer diversity of the engineering profession; besides eight main disciplines, represented by Engineers Australia’s Colleges, there are numerous specialisations in each discipline, represented by over 35 Technical Societies affiliated with Engineers Australia. This diversity means an on-the-job process is more practical.
The period of professional formation conclude when individual engineers demonstrate achievement of sixteen Stage 2 competencies. These competencies are consistent with international benchmarks for engineers and recognise that engineers have achieved the capacity to practice engineering independently in their preferred field and their capacity to make independent engineering decisions. Thus completion of professional formation signals completion of the development of engineering specialisation.Engineering specialisation is a life-time process of learning and practical experience. Following completion of Stage 2 competencies, engineers are expected to maintain the currency of knowledge in their field through continuous professional development.
The statistics reported in following sections relate to specialisation in the formal education stage and do not reflect specialisation achieved through the process of professional formation. At best, they provide an indication of the directions that engineering specialisations are headed. It is likely that a graduate Civil Engineer will specialise in one of the associated areas of practice like construction, structures, geotechnical or ocean engineering. It is unlikely that a graduate Civil Engineer will specialise in an area of practice associated with the completion of a degree in Mechanical Engineering.
Table 10.1: The Engineering Labour Force, Broad Streams of Engineering Education, 2006 and 2011
2006Labour Market Measure
Engineering Stream Men Women Total Men Women Total Men Women Total Men Women TotalEngineering & Related Technologies nfd 82823 9038 91861 2.4 4.4 2.6 54958 4891 59849 66.4 54.1 65.2
Manufacturing Engineering 2464 1434 3898 4.0 6.1 4.8 952 162 1114 38.6 11.3 28.6Process & Resource Engineering 12089 3226 15315 2.5 4.4 2.9 7361 1266 8627 60.9 39.2 56.3
Automotive Engineering 250 3 253 2.4 0.0 2.4 55 0 55 22.0 0.0 21.7Mechanical & Industrial Engineering 14236 1066 15302 3.0 6.3 3.2 7802 443 8245 54.8 41.6 53.9
Civil Engineering 17272 1909 19181 2.2 5.1 2.5 12859 1144 14003 74.4 59.9 73.0Electrical & Electronic Engineering 35247 3082 38329 3.7 7.8 4.0 19592 1358 20950 55.6 44.1 54.7
Aerospace Engineering 9071 652 9723 2.7 3.2 2.7 5600 326 5926 61.7 50.0 60.9Maritime Engineering 3791 164 3955 3.6 7.3 3.7 1964 39 2003 51.8 23.8 50.6
Other Engineering & Related Technologies 2204 598 2802 3.6 4.0 3.7 1142 341 1483 51.8 57.0 52.9All Engineering 179447 21172 200619 2.8 5.1 3.0 112285 9970 122255 62.6 47.1 60.9
2011Engineering & Related Technologies nfd 104686 13235 117921 2.9 4.9 3.1 70429 7574 78003 67.3 57.2 66.1
Manufacturing Engineering 3548 1707 5255 4.2 6.6 5.0 1530 243 1773 43.1 14.2 33.7Process & Resource Engineering 15043 4215 19258 2.9 5.6 3.5 9393 1890 11283 62.4 44.8 58.6
Automotive Engineering 602 10 612 4.5 0.0 4.4 86 6 92 14.3 60.0 15.0Mechanical & Industrial Engineering 20503 1666 22169 3.8 7.9 4.1 11670 737 12407 56.9 44.2 56.0
Civil Engineering 24058 3174 27232 3.2 6.3 3.6 18326 2036 20362 76.2 64.1 74.8Electrical & Electronic Engineering 46014 4854 50868 3.6 9.3 4.2 25865 2325 28190 56.2 47.9 55.4
Aerospace Engineering 10889 935 11824 3.2 3.0 3.2 6686 459 7145 61.4 49.1 60.4Maritime Engineering 4247 208 4455 3.9 2.9 3.8 2276 67 2343 53.6 32.2 52.6
Other Engineering & Related Technologies 3212 1083 4295 3.7 7.2 4.6 1739 575 2314 54.1 53.1 53.9All Engineering 232802 31087 263889 3.2 6.1 3.6 148000 15912 163912 63.6 51.2 62.1
Source: ABS, Population Census, 2006 and 2011, Estimated Using TableBuilder Pro
Employed in EngineeringUnemployment Rate (%)Labour Force Employed in Engineering (%)
Engineers Australia 88
The Engineering Profession: A Statistical Overview, 2015
Official statistics on the number of engineers in specialisations as understood by Engineers Australia are not available. Although Engineers Australia as an organisation is aware of the specialisations of its members, membership is voluntary and there is little point in publishing incomplete statistics. This gap in information is a serious deficiency because shortages of engineers are often shortages of specific specialist engineering skills. When these situations occur, the shotages in question cannot be met through substitution with other engineers or other technical fields and can mean the difference between competent project delivery or not and between technical innovation and productive advance and recreating the past.
10.2 Broad Specialist Areas of Engineering Characteristics of the engineering labour force for broad engineering specialisations are set out in Table 10.1. The Table includes statistics on the size of the labour force, unemployment rates and the number and proportions employed in engineering occupations.
In 2011, 117,921 or 44.6% of the engineering labour force identified themselves as having qualifications in Engineering and Related Technology not further defined. This group had grown by 28.4% since 2006, less than national growth of 31.5% for all engineers. The 2011 unemployment rate for the group was 3.1% and was below the national rate of 3.6%. The proportion employed in engineering occupations in 2011, 66.1%, was the second highest of all education streams.
The largest of the more familiar engineering streams was Electrical and Electronic Engineering which had a labour force of 50,868 in 2011, having grown by 32.7% since 2006, slightly more than the national benchmark for all engineers. Unemployment was above the national rate with 4.2% and the proportion employed in engineering occupations, 55.2%, was less than the national benchmark.
The highest growth between 2006 and 2011 occurred among Mechanical and Industrial engineers whose labour force expanded by 44.9% compared to 31.5% for all engineers. In 2011, this group numbered 22,169 which was 8.4% of the engineering labour force. The 2011 unemployment rate was higher than the national figure and the proportion employed in engineering occupations, 56.0%, was below the national benchmark. The proportion of women Mechanical and Industrial Engineers was 7.5%.
The highest proportion employed in engineering occupations was among Civil Engineers with 74.8% in 2011. This group experienced well above average growth between 2006 and 2011 both in labour force numbers and numbers employed in engineering occupations. Unemployment in 2011 was equal to the national benchmark and the proportion of women was a little above the national figure with 11.7%.
In 2011, women accounted for 11.8% of the engineering labour force. Three streams had much higher proportions and the other eight groups had proportions below the national figure. The highest proportion of women occurred in Manufacturing Engineering where it was 32.5% in 2011. This group numbered 5,255 in 2011 but just 33.7% were employed in engineering occupations. Despite this low proportions, the latter experienced strong growth between census years. Unemployment was well above the national figure for 2011 with 5.0%.
The second highest proportion of women occurred in Other Engineering and Technology, a group which includes Biomedical and Environmental Engineering. In 2011, the proportion of women was 25.2%. This group had above average growth between census years and the 2011 unemployment rate of 4.6% was well above the national benchmark. Unlike Manufacturing Engineering, the proportion employed in engineering occupations was relatively high but at 53.9% was below the national benchmark.
The third group in which the proportion of women was above average was Process and Resource Engineering with 21.9% in 2011. Growth in this group was below the national average but the proportion employed in engineering occupations, 58.6% in 2011 was fairly close to the national benchmark while unemployment was about average.
Engineers Australia 89
The Engineering Profession: A Statistical Overview, 2015
10.3 Detailed Engineering Streams Tables 10.2 and 10.3 disaggregate the broad statistics in Table 10.1 into 56 detailed streams of engineering as set out in the ASCED structure. The information in these Tables helps to understand why engineering is relatively slow to respond to rapid and large increases in demand. Typically, change relates to specific streams of engineering and the Tables show that in many cases the number of engineers in some streams is quite small and that change between censuses has not been large. Some features of the Tables include:
• The degree of fragmentation of the engineering labour force into unique specialist streams is very high; 22 of the 56 detailed streams listed have 1,000 or more engineers and 26 have more than 500.
• The number of engineers in streams with less than 500 is 4,274 and in many instances includes substantial numbers employed in engineering occupations.
• Aggregation dilutes the comparatively high proportion employed in engineering occupations in several broad streams of engineering; in 2011,
o The proportion in broad manufacturing was 33.7% but the detailed manufacturing engineering stream had 56.9% in engineering occupations.
o The proportion in broad process and resource engineering was 58.6% but the detailed stream mining engineering had 72.6%.
o The proportion in the broad other engineering and technology was 53.9% but within it the detailed stream environmental engineering had 66.7% employed in engineering occupations.
• In many instances the proportion of the labour force employed in engineering occupations was consistently high across detailed streams, for example in civil engineering. In other instances, including well known ones, the proportion employed in engineering occupations was below the national average in all detailed streams, for example in mechanical and industrial engineering.
• With few exceptions, the proportion of women employed in engineering occupations in both broad and detailed streams is substantially less than men. The role this plays in retarding the development of more women engineers warrants further investigation.
• In 2006 and in 2011, aggregate unemployment of engineers was low; 3.0% and 3.6%, respectively. This period included one of the most acute shortages of engineers experienced in Australia. Against this background the Tables show that numerous pockets of much higher unemployment occurred, for example in 2011 the unemployment rate for industrial engineers was 6.5%, 6.0% for water and sanitary engineers, 5.4% for communications technologists and 6.2% for biomedical engineers.
This Chapter demonstrates that as well as geographic location and industry of employment, engineering specialist streams are an important source of diversity in the engineering profession. When these three elements are accompanied by employer requirements for certain types and extent of experience it becomes easier to understand why periodic shortages of engineers can occur, particularly in smaller specialist streams.
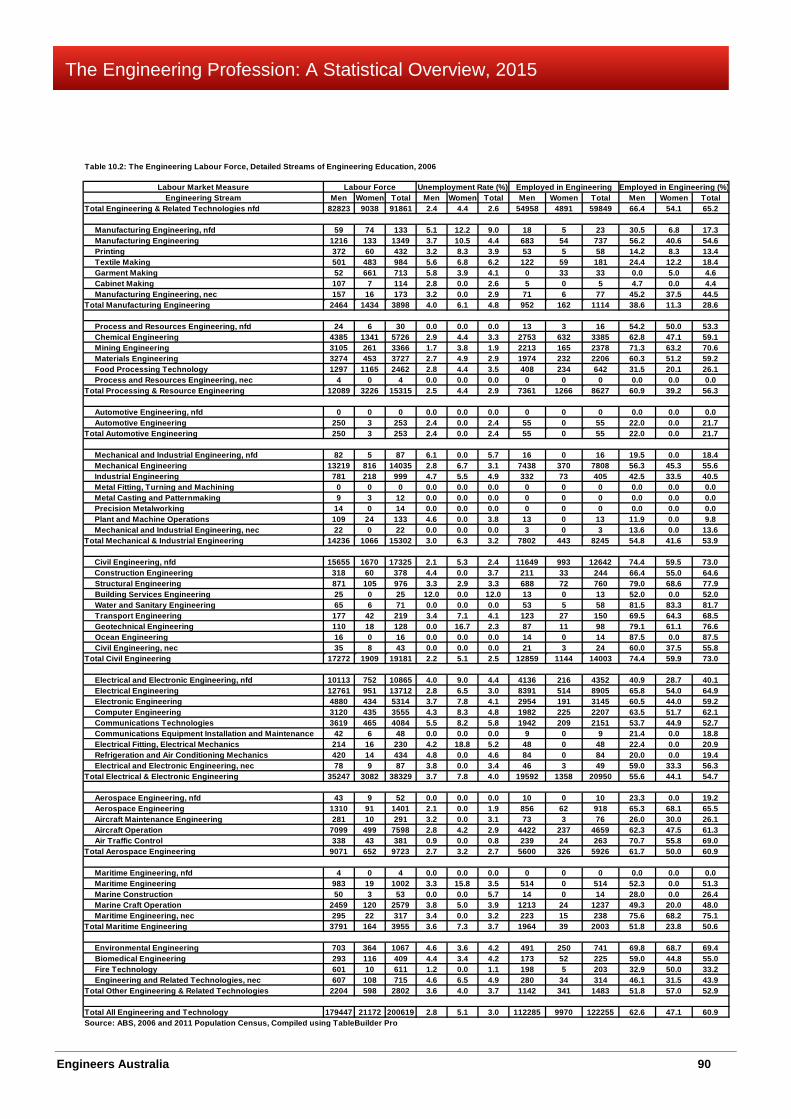
Engineers Australia 90
The Engineering Profession: A Statistical Overview, 2015
Table 10.2: The Engineering Labour Force, Detailed Streams of Engineering Education, 2006
Labour Market MeasureEngineering Stream Men Women Total Men Women Total Men Women Total Men Women Total
Total Engineering & Related Technologies nfd 82823 9038 91861 2.4 4.4 2.6 54958 4891 59849 66.4 54.1 65.2
Manufacturing Engineering, nfd 59 74 133 5.1 12.2 9.0 18 5 23 30.5 6.8 17.3 Manufacturing Engineering 1216 133 1349 3.7 10.5 4.4 683 54 737 56.2 40.6 54.6 Printing 372 60 432 3.2 8.3 3.9 53 5 58 14.2 8.3 13.4 Textile Making 501 483 984 5.6 6.8 6.2 122 59 181 24.4 12.2 18.4 Garment Making 52 661 713 5.8 3.9 4.1 0 33 33 0.0 5.0 4.6 Cabinet Making 107 7 114 2.8 0.0 2.6 5 0 5 4.7 0.0 4.4 Manufacturing Engineering, nec 157 16 173 3.2 0.0 2.9 71 6 77 45.2 37.5 44.5Total Manufacturing Engineering 2464 1434 3898 4.0 6.1 4.8 952 162 1114 38.6 11.3 28.6
Process and Resources Engineering, nfd 24 6 30 0.0 0.0 0.0 13 3 16 54.2 50.0 53.3 Chemical Engineering 4385 1341 5726 2.9 4.4 3.3 2753 632 3385 62.8 47.1 59.1 Mining Engineering 3105 261 3366 1.7 3.8 1.9 2213 165 2378 71.3 63.2 70.6 Materials Engineering 3274 453 3727 2.7 4.9 2.9 1974 232 2206 60.3 51.2 59.2 Food Processing Technology 1297 1165 2462 2.8 4.4 3.5 408 234 642 31.5 20.1 26.1 Process and Resources Engineering, nec 4 0 4 0.0 0.0 0.0 0 0 0 0.0 0.0 0.0Total Processing & Resource Engineering 12089 3226 15315 2.5 4.4 2.9 7361 1266 8627 60.9 39.2 56.3
Automotive Engineering, nfd 0 0 0 0.0 0.0 0.0 0 0 0 0.0 0.0 0.0 Automotive Engineering 250 3 253 2.4 0.0 2.4 55 0 55 22.0 0.0 21.7Total Automotive Engineering 250 3 253 2.4 0.0 2.4 55 0 55 22.0 0.0 21.7
Mechanical and Industrial Engineering, nfd 82 5 87 6.1 0.0 5.7 16 0 16 19.5 0.0 18.4 Mechanical Engineering 13219 816 14035 2.8 6.7 3.1 7438 370 7808 56.3 45.3 55.6 Industrial Engineering 781 218 999 4.7 5.5 4.9 332 73 405 42.5 33.5 40.5 Metal Fitting, Turning and Machining 0 0 0 0.0 0.0 0.0 0 0 0 0.0 0.0 0.0 Metal Casting and Patternmaking 9 3 12 0.0 0.0 0.0 0 0 0 0.0 0.0 0.0 Precision Metalworking 14 0 14 0.0 0.0 0.0 0 0 0 0.0 0.0 0.0 Plant and Machine Operations 109 24 133 4.6 0.0 3.8 13 0 13 11.9 0.0 9.8 Mechanical and Industrial Engineering, nec 22 0 22 0.0 0.0 0.0 3 0 3 13.6 0.0 13.6Total Mechanical & Industrial Engineering 14236 1066 15302 3.0 6.3 3.2 7802 443 8245 54.8 41.6 53.9
Civil Engineering, nfd 15655 1670 17325 2.1 5.3 2.4 11649 993 12642 74.4 59.5 73.0 Construction Engineering 318 60 378 4.4 0.0 3.7 211 33 244 66.4 55.0 64.6 Structural Engineering 871 105 976 3.3 2.9 3.3 688 72 760 79.0 68.6 77.9 Building Services Engineering 25 0 25 12.0 0.0 12.0 13 0 13 52.0 0.0 52.0 Water and Sanitary Engineering 65 6 71 0.0 0.0 0.0 53 5 58 81.5 83.3 81.7 Transport Engineering 177 42 219 3.4 7.1 4.1 123 27 150 69.5 64.3 68.5 Geotechnical Engineering 110 18 128 0.0 16.7 2.3 87 11 98 79.1 61.1 76.6 Ocean Engineering 16 0 16 0.0 0.0 0.0 14 0 14 87.5 0.0 87.5 Civil Engineering, nec 35 8 43 0.0 0.0 0.0 21 3 24 60.0 37.5 55.8Total Civil Engineering 17272 1909 19181 2.2 5.1 2.5 12859 1144 14003 74.4 59.9 73.0
Electrical and Electronic Engineering, nfd 10113 752 10865 4.0 9.0 4.4 4136 216 4352 40.9 28.7 40.1 Electrical Engineering 12761 951 13712 2.8 6.5 3.0 8391 514 8905 65.8 54.0 64.9 Electronic Engineering 4880 434 5314 3.7 7.8 4.1 2954 191 3145 60.5 44.0 59.2 Computer Engineering 3120 435 3555 4.3 8.3 4.8 1982 225 2207 63.5 51.7 62.1 Communications Technologies 3619 465 4084 5.5 8.2 5.8 1942 209 2151 53.7 44.9 52.7 Communications Equipment Installation and Maintenance 42 6 48 0.0 0.0 0.0 9 0 9 21.4 0.0 18.8 Electrical Fitting, Electrical Mechanics 214 16 230 4.2 18.8 5.2 48 0 48 22.4 0.0 20.9 Refrigeration and Air Conditioning Mechanics 420 14 434 4.8 0.0 4.6 84 0 84 20.0 0.0 19.4 Electrical and Electronic Engineering, nec 78 9 87 3.8 0.0 3.4 46 3 49 59.0 33.3 56.3Total Electrical & Electronic Engineering 35247 3082 38329 3.7 7.8 4.0 19592 1358 20950 55.6 44.1 54.7
Aerospace Engineering, nfd 43 9 52 0.0 0.0 0.0 10 0 10 23.3 0.0 19.2 Aerospace Engineering 1310 91 1401 2.1 0.0 1.9 856 62 918 65.3 68.1 65.5 Aircraft Maintenance Engineering 281 10 291 3.2 0.0 3.1 73 3 76 26.0 30.0 26.1 Aircraft Operation 7099 499 7598 2.8 4.2 2.9 4422 237 4659 62.3 47.5 61.3 Air Traffic Control 338 43 381 0.9 0.0 0.8 239 24 263 70.7 55.8 69.0Total Aerospace Engineering 9071 652 9723 2.7 3.2 2.7 5600 326 5926 61.7 50.0 60.9
Maritime Engineering, nfd 4 0 4 0.0 0.0 0.0 0 0 0 0.0 0.0 0.0 Maritime Engineering 983 19 1002 3.3 15.8 3.5 514 0 514 52.3 0.0 51.3 Marine Construction 50 3 53 0.0 0.0 5.7 14 0 14 28.0 0.0 26.4 Marine Craft Operation 2459 120 2579 3.8 5.0 3.9 1213 24 1237 49.3 20.0 48.0 Maritime Engineering, nec 295 22 317 3.4 0.0 3.2 223 15 238 75.6 68.2 75.1Total Maritime Engineering 3791 164 3955 3.6 7.3 3.7 1964 39 2003 51.8 23.8 50.6
Environmental Engineering 703 364 1067 4.6 3.6 4.2 491 250 741 69.8 68.7 69.4 Biomedical Engineering 293 116 409 4.4 3.4 4.2 173 52 225 59.0 44.8 55.0 Fire Technology 601 10 611 1.2 0.0 1.1 198 5 203 32.9 50.0 33.2 Engineering and Related Technologies, nec 607 108 715 4.6 6.5 4.9 280 34 314 46.1 31.5 43.9Total Other Engineering & Related Technologies 2204 598 2802 3.6 4.0 3.7 1142 341 1483 51.8 57.0 52.9
Total All Engineering and Technology 179447 21172 200619 2.8 5.1 3.0 112285 9970 122255 62.6 47.1 60.9Source: ABS, 2006 and 2011 Population Census, Compiled using TableBuilder Pro
Employed in Engineering (%)Labour Force Unemployment Rate (%) Employed in Engineering

Engineers Australia 91
The Engineering Profession: A Statistical Overview, 2015
Table 10.3: The Engineering Labour Force, Detailed Streams of Engineering Education, 2011
Labour Market MeasureEngineering Stream Men Women Total Men Women Total Men Women Total Men Women Total
Total Engineering & Related Technologies nfd 104686 13235 117921 2.9 4.9 3.1 70429 7574 78003 67.3 57.2 66.1
Manufacturing Engineering, nfd 65 93 158 9.2 8.6 8.9 15 3 18 23.1 3.2 11.4 Manufacturing Engineering 2147 272 2419 4.0 8.5 4.5 1256 120 1376 58.5 44.1 56.9 Printing 454 87 541 4.4 3.4 4.3 57 10 67 12.6 11.5 12.4 Textile Making 523 585 1108 4.6 7.7 6.2 113 80 193 21.6 13.7 17.4 Garment Making 71 647 718 5.6 5.3 5.3 3 27 30 4.2 4.2 4.2 Cabinet Making 117 4 121 2.6 0.0 2.5 17 0 17 14.5 0.0 14.0 Manufacturing Engineering, nec 171 19 190 3.5 0.0 3.2 69 3 72 40.4 15.8 37.9Total Manufacturing Engineering 3548 1707 5255 4.2 6.6 5.0 1530 243 1773 43.1 14.2 33.7
Process and Resources Engineering, nfd 37 6 43 0.0 0.0 0.0 22 0 22 59.5 0.0 51.2 Chemical Engineering 5640 1978 7618 3.7 5.4 4.1 3556 1036 4592 63.0 52.4 60.3 Mining Engineering 4553 460 5013 2.4 3.7 2.6 3331 306 3637 73.2 66.5 72.6 Materials Engineering 3506 535 4041 2.6 7.7 3.3 2078 267 2345 59.3 49.9 58.0 Food Processing Technology 1303 1236 2539 2.4 5.6 3.9 406 281 687 31.2 22.7 27.1 Process and Resources Engineering, nec 4 0 4 0.0 0.0 0.0 0 0 0 0.0 0.0 0.0Total Processing & Resource Engineering 15043 4215 19258 2.9 5.6 3.5 9393 1890 11283 62.4 44.8 58.6
Automotive Engineering, nfd 230 0 230 3.9 0.0 3.9 11 0 11 4.8 0.0 4.8 Automotive Engineering 372 10 382 4.8 0.0 4.7 75 6 81 20.2 60.0 21.2Total Automotive Engineering 602 10 612 4.5 0.0 4.4 86 6 92 14.3 60.0 15.0
Mechanical and Industrial Engineering, nfd 156 6 162 0.0 50.0 1.9 41 0 41 26.3 0.0 25.3 Mechanical Engineering 18973 1188 20161 3.7 6.9 3.9 11094 618 11712 58.5 52.0 58.1 Industrial Engineering 1165 439 1604 5.0 10.7 6.5 495 119 614 42.5 27.1 38.3 Metal Fitting, Turning and Machining 8 0 8 0.0 0.0 0.0 3 0 3 37.5 0.0 37.5 Metal Casting and Patternmaking 4 9 13 0.0 0.0 0.0 0 0 0 0.0 0.0 0.0 Precision Metalworking 13 0 13 30.8 0.0 30.8 0 0 0 0.0 0.0 0.0 Plant and Machine Operations 159 15 174 2.5 0.0 2.3 37 0 37 23.3 0.0 21.3 Mechanical and Industrial Engineering, nec 25 9 34 0.0 0.0 0.0 0 0 0 0.0 0.0 0.0Total Mechanical & Industrial Engineering 20503 1666 22169 3.8 7.9 4.1 11670 737 12407 56.9 44.2 56.0
Civil Engineering, nfd 21466 2783 24249 3.2 6.4 3.6 16272 1767 18039 75.8 63.5 74.4 Construction Engineering 445 68 513 3.6 7.4 4.1 311 34 345 69.9 50.0 67.3 Structural Engineering 1465 206 1671 2.9 7.3 3.5 1213 152 1365 82.8 73.8 81.7 Building Services Engineering 35 0 35 0.0 0.0 0.0 21 0 21 60.0 0.0 60.0 Water and Sanitary Engineering 96 20 116 7.3 0.0 6.0 77 14 91 80.2 70.0 78.4 Transport Engineering 236 56 292 3.4 0.0 2.7 174 37 211 73.7 66.1 72.3 Geotechnical Engineering 243 31 274 0.0 0.0 0.0 215 23 238 88.5 74.2 86.9 Ocean Engineering 22 4 26 0.0 0.0 0.0 17 3 20 77.3 75.0 76.9 Civil Engineering, nec 50 6 56 0.0 0.0 0.0 26 6 32 52.0 100.0 57.1Total Civil Engineering 24058 3174 27232 3.2 6.3 3.6 18326 2036 20362 76.2 64.1 74.8
Electrical and Electronic Engineering, nfd 12372 1046 13418 4.0 10.4 4.5 5083 364 5447 41.1 34.8 40.6 Electrical Engineering 16651 1313 17964 3.0 8.5 3.4 11003 741 11744 66.1 56.4 65.4 Electronic Engineering 6049 659 6708 3.5 9.3 4.0 3606 317 3923 59.6 48.1 58.5 Computer Engineering 3936 763 4699 3.7 11.1 4.9 2612 410 3022 66.4 53.7 64.3 Communications Technologies 5708 989 6697 4.8 8.7 5.4 3239 471 3710 56.7 47.6 55.4 Communications Equipment Installation and Maintenance 53 8 61 0.0 0.0 0.0 11 0 11 20.8 0.0 18.0 Electrical Fitting, Electrical Mechanics 406 29 435 2.7 0.0 2.5 87 0 87 21.4 0.0 20.0 Refrigeration and Air Conditioning Mechanics 674 15 689 5.2 0.0 5.1 124 4 128 18.4 26.7 18.6 Electrical and Electronic Engineering, nec 165 32 197 4.2 0.0 3.6 100 18 118 60.6 56.3 59.9Total Electrical & Electronic Engineering 46014 4854 50868 3.6 9.3 4.2 25865 2325 28190 56.2 47.9 55.4
Aerospace Engineering, nfd 58 11 69 0.0 0.0 0.0 19 0 19 32.8 0.0 27.5 Aerospace Engineering 1764 177 1941 3.0 2.3 2.9 1093 106 1199 62.0 59.9 61.8 Aircraft Maintenance Engineering 474 12 486 0.8 0.0 0.8 135 3 138 28.5 25.0 28.4 Aircraft Operation 8323 680 9003 3.5 3.5 3.5 5247 324 5571 63.0 47.6 61.9 Air Traffic Control 270 55 325 1.5 0.0 1.2 192 26 218 71.1 47.3 67.1Total Aerospace Engineering 10889 935 11824 3.2 3.0 3.2 6686 459 7145 61.4 49.1 60.4
Maritime Engineering, nfd 0 0 0 0.0 0.0 0.0 0 0 0 0.0 0.0 0.0 Maritime Engineering 1219 19 1238 3.7 0.0 3.6 681 6 687 55.9 31.6 55.5 Marine Construction 47 0 47 0.0 0.0 0.0 12 0 12 25.5 0.0 25.5 Marine Craft Operation 2682 165 2847 4.4 3.6 4.3 1361 45 1406 50.7 27.3 49.4 Maritime Engineering, nec 299 24 323 1.0 0.0 0.9 222 16 238 74.2 66.7 73.7Total Maritime Engineering 4247 208 4455 3.9 2.9 3.8 2276 67 2343 53.6 32.2 52.6
Environmental Engineering 1039 614 1653 3.8 6.4 4.8 717 386 1103 69.0 62.9 66.7 Biomedical Engineering 529 251 780 5.5 7.6 6.2 288 116 404 54.4 46.2 51.8 Fire Technology 740 21 761 0.5 0.0 0.5 272 15 287 36.8 71.4 37.7 Rail Operations 904 197 1101 5.1 10.2 6.0 462 58 520 51.1 29.4 47.2Total Other Engineering & Related Technologies 3212 1083 4295 3.7 7.2 4.6 1739 575 2314 54.1 53.1 53.9
Total All Engineering and Technology 232802 31087 263889 3.2 6.1 3.6 148000 15912 163912 63.6 51.2 62.1Source: ABS, 2006 and 2011 Population Census, Compiled using TableBuilder Pro
Labour Force Employed in Engineering Employed in Engineering (%)Unemployment Rate (%)
Engineers Australia 92
The Engineering Profession: A Statistical Overview, 2015
Chapter 11 Average Ages and Age Structure Main Points The statistics in this Chapter are from the 2006 and 2011 censuses and are unchanged from last year.
The average age of qualified engineers in the Australian engineering labour force barely increased between 2006, changing from 41.7 years to 41.9 years. This conclusion also applies to engineers employed in engineering occupations for whom the change was from 41.0 years to 41.1 years. In 2006, women qualified engineers were on average 5.8 years younger than men and the difference was slightly less, 5.3 years, in 2011. The gender differentials were 7.7 years and 6.6 years, respectively for engineers employed in engineering occupations. Engineers were on average about two years older than the Australian skilled labour force.
The relative stability in the average age of engineers was the outcome of opposing changes at the extremities of the age range, mainly among men. Growth in several of the youngest age groups was faster than for the labour force as a whole and this also occurred for several of the oldest age groups while age groups in the middle of the range grew slower than the labour force. This pattern was observed for both Australian and overseas born engineers.
There is a risk associated with the concentration of engineers in older age groups because retirement from the labour force is much nearer. About 17.5% of engineers were aged 55 years or more in 2011. These age groups exhibit the fastest rate of contraction as engineers retire. The falls in labour force participation of engineers during the labour market adjustment process of the past three years is related to this point.
The labour force participation of men in the engineering and in other similarly qualified fields is much the same. However, this is not the case for women. In all age groups, the participation of women engineers was below participation in other fields and this factor is most likely one of the reasons why the share of women in engineering remains low.
11.1 Average Age of Engineers Average ages were estimated using census statistics as the weighted average of single age years from 15 to 100 years weighted by the proportion of qualified engineers in the labour force at each age. Table 11.1 shows estimates of the average ages for the engineering labour force, for the segment of the engineering labour force employed in engineering occupations and for the skilled labour force. Here the skilled labour force is defined as in Chapter 8 as the labour force of people who have at least an Advanced Diploma or an Associate Degree in any recognised field.
In 2006, the average age of the skilled labour force was 40.7 years; men were older than women, 41.8 years compared to 39.8 years. The average age of the engineering labour force was older, mainly because male engineers were older. The average age of the engineering labour force was 41.7 years with the average age of men 42.3 years and women on average 5.8 years younger at 36.5 years. The Table shows, however, that retention in engineering occupation leads to a reduction in the average age of engineers much closer to that for the skilled labour force. The average age of men in engineering occupations falls to 41.8 years and the average age of women in these occupations falls to 34.0 years.
By 2011, small changes towards higher ages had occurred for all groups. The skilled labour force increased average age from 40.7 years to 41.1 years, and both genders had similar experiences. The increase in average age for the engineering labour force was much less, increasing from 41.7 years to 41.9 years and there was barely any increase in the segment employed in engineering occupations. As

Engineers Australia 93
The Engineering Profession: A Statistical Overview, 2015
was the case in the skilled labour force, the average age increased for both genders in the two engineering groups.
How these changes came about in the engineering groups is explored in the following section.
11.2 Age Structure and how it has changed Chapter 3 demonstrated the importance of overseas born engineers in the structural composition of the engineering labour force and Chapter 7 highlighted the rapid increase in skilled migration that has occurred, including the period covered by the two census years discussed throughout the Statistical Overview. For these reasons, the distinction between overseas and Australian born qualified engineers is the basis for discussion in this section.
Table 11.2 shows the age structure of the engineering labour force in 2006 and in 2011 by gender and by country of origin. In essence, this Table expands the “labour force” row in Table 3.1 by age groups34.
34 The slight difference between the two Tables is the product of the ABS arrangements to preserve confidentiality.
Table 11.1: The Average Age of the Engineering Labour Force (years)
CensusYear Men Women Total Men Women Total Men Women Total2006 42.3 36.5 41.7 41.7 34.0 41.0 41.8 39.8 40.72011 42.5 37.2 41.9 41.8 35.2 41.1 42.0 40.4 41.1
Source: Estimated from ABS, 2006 and 2011 Population Census using TableBuilder Pro
Labour Force Employed in Engineering Skilled
Table 11.2: The Age Structure of the Engineering Labour Force, 2006 and 2011
2006Age
Group Men Women Total Men Women Total Men Women TotalUnder 20 years 35 10 45 96 8 104 131 18 149
20-24 years 3147 888 4035 5877 1030 6907 9024 1918 1094225-29 years 8671 2084 10755 12498 2284 14782 21169 4368 2553730-34 years 10062 1983 12045 14450 2048 16498 24512 4031 2854335-39 years 10803 1902 12705 12616 1178 13794 23419 3080 2649940-44 years 13437 2273 15710 11646 763 12409 25083 3036 2811945-49 years 12470 1806 14276 10684 529 11213 23154 2335 2548950-54 years 10269 1006 11275 11006 323 11329 21275 1329 2260455-59 years 8500 483 8983 8528 180 8708 17028 663 1769160-64 years 4648 146 4794 4602 91 4693 9250 237 948765-69 years 1707 58 1765 1761 39 1800 3468 97 3565
70 Years & over 779 26 805 1158 31 1189 1937 57 1994Total 84528 12665 97193 94922 8504 103426 179450 21169 200619
2011Under 20 years 26 12 38 79 1 80 105 13 118
20-24 years 3696 1017 4713 6672 1071 7743 10368 2088 1245625-29 years 14285 4019 18304 14616 2274 16890 28901 6293 3519430-34 years 17673 3848 21521 14481 2250 16731 32154 6098 3825235-39 years 16971 2897 19868 15844 2115 17959 32815 5012 3782740-44 years 15866 2586 18452 13687 1193 14880 29553 3779 3333245-49 years 16988 2727 19715 12280 787 13067 29268 3514 3278250-54 years 13979 1895 15874 11083 474 11557 25062 2369 2743155-59 years 10480 938 11418 10508 285 10793 20988 1223 2221160-64 years 7523 370 7893 6999 128 7127 14522 498 1502065-69 years 3125 81 3206 2955 46 3001 6080 127 6207
70 Years & over 1324 36 1360 1662 40 1702 2986 76 3062Total 121936 20426 142362 110866 10664 121530 232802 31090 263892
Source: Estimated from ABS, 2006 and 2011 Population Census using TableBuilder Pro
Overseas Born Australian Born Total

Engineers Australia 94
The Engineering Profession: A Statistical Overview, 2015
Consideration of Table 11.2 is assisted by Figure 11.1. In Figure 11.1, the age structure of the engineering labour force in 2011 is segmented into the base structure that existed in 2006 and the components of change that have occurred since then. The 2011 labour force is the 2006 labour force plus the changes that occurred between 2006 and 2011. For the labour force as a whole, the base components and the changes that occurred are as follows:
• Base labour force in 2006 o Australian born men; 35.97% o Australian born women; 3.22% o Overseas born men; 32.03% o Overseas born women; 4.80%
• Changes from 2006 to 2011 o Australian born men added 6.04% o Australian born women added 0.82% o Overseas born men added 14.18% o Overseas born women added 2.94%
This structure is replicated for each age group in Figure 11.1. Thus, the dark blue bars are the Australian born men in 2006 and the light blue bars are the increases in Australian born men between 2006 and 2011 for each age group. A similar approach is used for overseas born men (green bars), Australian born women (red shades) and overseas born women (purple shades).
Consider for example the largest age group, the 35 to 39 years group. In 2011, this age group accounted for 14.34% of the engineering labour force; 10.04%, or 70.0%, was in place in 2006 and change between 2006 and 2011 added 4.30%, that is, the remaining 30.0%. Similar breakdowns are shown for each age group. There were several other age groups that showed large component changes.
In contrast, some age groups there was little, or no, change in some components between 2006 and 2011. For example;
• In the 30 to 34 years age group, the change for Australian born men was -0.01% and for Australian born women it was 0.08%.
• There was no change in Australian born women in the 25 to 29 years age group. • Australian born men in the 50 to 54 years age group contracted by 0.03%.
By comparing the changes in age group components to the overall change for the group examined, the changes in average ages set out in Table 11.1 can be better understood. The average age of men
14.00 12.00 10.00 8.00 6.00 4.00 2.00 0.00 2.00 4.00
Under 20 years
20-24 years
25-29 years
30-34 years
35-39 years
40-44 years
45-49 years
50-54 years
55-59 years
60-64 years
65-69 years
70 Years & over
% in Age Groups
Age
Gro
ups
Figure 11.1: The Age Structure of the Engineering Labour Force in 2011 and How it has changed since 2006
AUS Men 2006 AUS Men Change to 2011 OS Men 2006 OS Men Change to 2011AUS Women 2006 AUS Women Change to 2011 OS Women 2006 OS Women Change to 2011
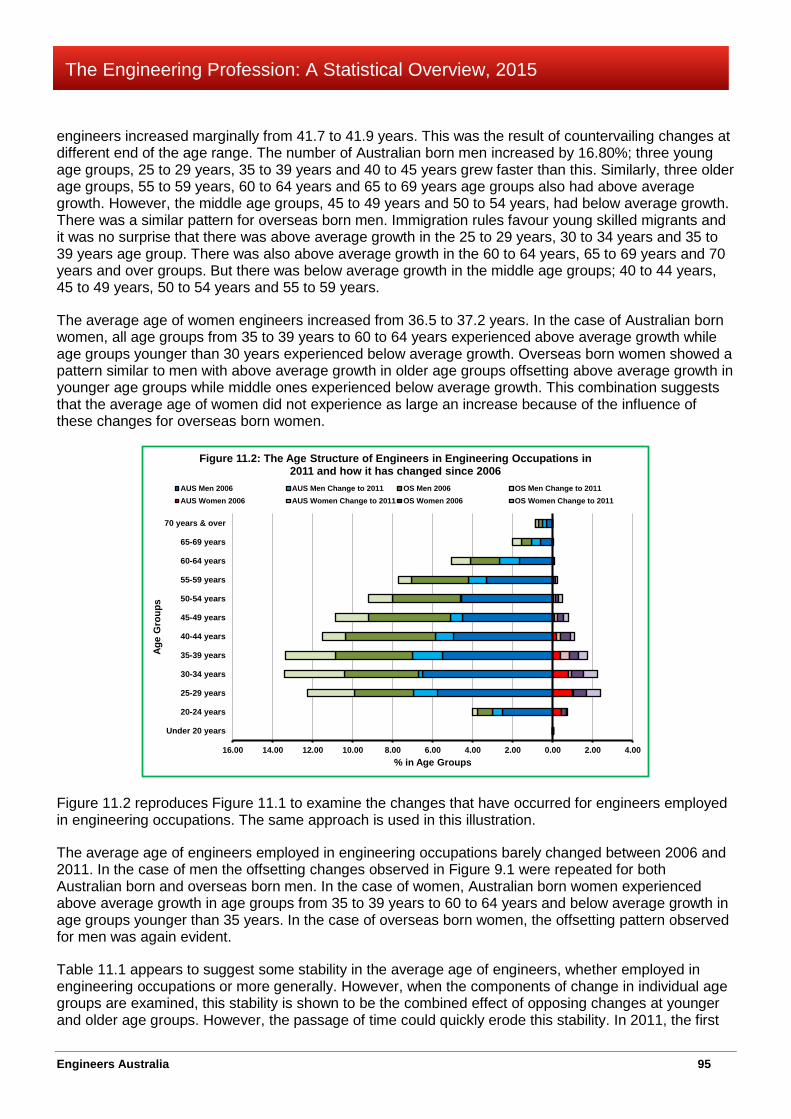
Engineers Australia 95
The Engineering Profession: A Statistical Overview, 2015
engineers increased marginally from 41.7 to 41.9 years. This was the result of countervailing changes at different end of the age range. The number of Australian born men increased by 16.80%; three young age groups, 25 to 29 years, 35 to 39 years and 40 to 45 years grew faster than this. Similarly, three older age groups, 55 to 59 years, 60 to 64 years and 65 to 69 years age groups also had above average growth. However, the middle age groups, 45 to 49 years and 50 to 54 years, had below average growth. There was a similar pattern for overseas born men. Immigration rules favour young skilled migrants and it was no surprise that there was above average growth in the 25 to 29 years, 30 to 34 years and 35 to 39 years age group. There was also above average growth in the 60 to 64 years, 65 to 69 years and 70 years and over groups. But there was below average growth in the middle age groups; 40 to 44 years, 45 to 49 years, 50 to 54 years and 55 to 59 years.
The average age of women engineers increased from 36.5 to 37.2 years. In the case of Australian born women, all age groups from 35 to 39 years to 60 to 64 years experienced above average growth while age groups younger than 30 years experienced below average growth. Overseas born women showed a pattern similar to men with above average growth in older age groups offsetting above average growth in younger age groups while middle ones experienced below average growth. This combination suggests that the average age of women did not experience as large an increase because of the influence of these changes for overseas born women.
Figure 11.2 reproduces Figure 11.1 to examine the changes that have occurred for engineers employed in engineering occupations. The same approach is used in this illustration.
The average age of engineers employed in engineering occupations barely changed between 2006 and 2011. In the case of men the offsetting changes observed in Figure 9.1 were repeated for both Australian born and overseas born men. In the case of women, Australian born women experienced above average growth in age groups from 35 to 39 years to 60 to 64 years and below average growth in age groups younger than 35 years. In the case of overseas born women, the offsetting pattern observed for men was again evident.
Table 11.1 appears to suggest some stability in the average age of engineers, whether employed in engineering occupations or more generally. However, when the components of change in individual age groups are examined, this stability is shown to be the combined effect of opposing changes at younger and older age groups. However, the passage of time could quickly erode this stability. In 2011, the first
16.00 14.00 12.00 10.00 8.00 6.00 4.00 2.00 0.00 2.00 4.00
Under 20 years
20-24 years
25-29 years
30-34 years
35-39 years
40-44 years
45-49 years
50-54 years
55-59 years
60-64 years
65-69 years
70 years & over
% in Age Groups
Age
Gro
ups
Figure 11.2: The Age Structure of Engineers in Engineering Occupations in 2011 and how it has changed since 2006
AUS Men 2006 AUS Men Change to 2011 OS Men 2006 OS Men Change to 2011AUS Women 2006 AUS Women Change to 2011 OS Women 2006 OS Women Change to 2011
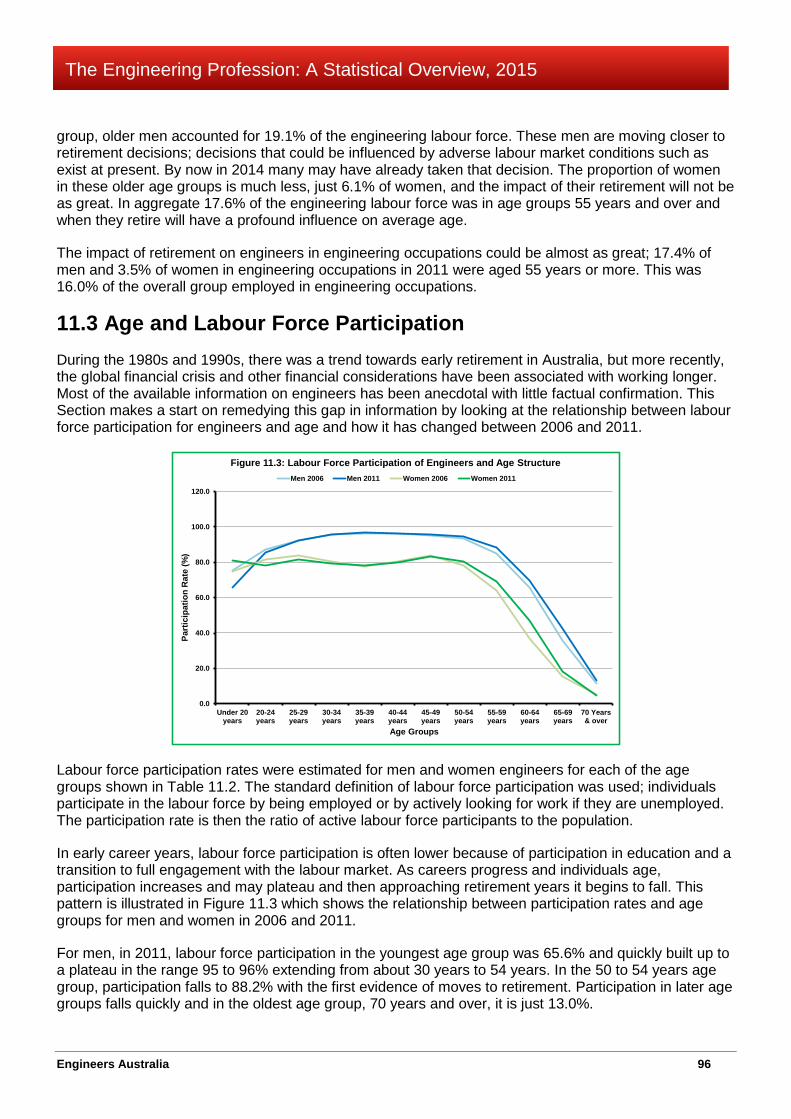
Engineers Australia 96
The Engineering Profession: A Statistical Overview, 2015
group, older men accounted for 19.1% of the engineering labour force. These men are moving closer to retirement decisions; decisions that could be influenced by adverse labour market conditions such as exist at present. By now in 2014 many may have already taken that decision. The proportion of women in these older age groups is much less, just 6.1% of women, and the impact of their retirement will not be as great. In aggregate 17.6% of the engineering labour force was in age groups 55 years and over and when they retire will have a profound influence on average age.
The impact of retirement on engineers in engineering occupations could be almost as great; 17.4% of men and 3.5% of women in engineering occupations in 2011 were aged 55 years or more. This was 16.0% of the overall group employed in engineering occupations.
11.3 Age and Labour Force Participation During the 1980s and 1990s, there was a trend towards early retirement in Australia, but more recently, the global financial crisis and other financial considerations have been associated with working longer. Most of the available information on engineers has been anecdotal with little factual confirmation. This Section makes a start on remedying this gap in information by looking at the relationship between labour force participation for engineers and age and how it has changed between 2006 and 2011.
Labour force participation rates were estimated for men and women engineers for each of the age groups shown in Table 11.2. The standard definition of labour force participation was used; individuals participate in the labour force by being employed or by actively looking for work if they are unemployed. The participation rate is then the ratio of active labour force participants to the population.
In early career years, labour force participation is often lower because of participation in education and a transition to full engagement with the labour market. As careers progress and individuals age, participation increases and may plateau and then approaching retirement years it begins to fall. This pattern is illustrated in Figure 11.3 which shows the relationship between participation rates and age groups for men and women in 2006 and 2011.
For men, in 2011, labour force participation in the youngest age group was 65.6% and quickly built up to a plateau in the range 95 to 96% extending from about 30 years to 54 years. In the 50 to 54 years age group, participation falls to 88.2% with the first evidence of moves to retirement. Participation in later age groups falls quickly and in the oldest age group, 70 years and over, it is just 13.0%.
0.0
20.0
40.0
60.0
80.0
100.0
120.0
Under 20years
20-24years
25-29years
30-34years
35-39years
40-44years
45-49years
50-54years
55-59years
60-64years
65-69years
70 Years& over
Part
icip
atio
n R
ate
(%)
Age Groups
Figure 11.3: Labour Force Participation of Engineers and Age StructureMen 2006 Men 2011 Women 2006 Women 2011

Engineers Australia 97
The Engineering Profession: A Statistical Overview, 2015
The pattern is similar for women but the plateau in participation is lower, between 80 and 83%. There is also a dip in the plateau for women in their mid to late 30s and early 40s coinciding with the main period of family formation. The fall in participation in the 55 to 59 age group to 69.4% is larger than for men and the falls in participation rates in later age groups are also larger than for men. Just 4.9% of women aged 70 years and over remained in the engineering labour force, about one third the rate for men.
The main change between 2006 and 2011 was higher participation among men and women from about age 50 years onwards. This was a period in part characterised by high demand for engineers but also including the trauma of the GFC when many retirement nest eggs may have been adversely affected by share market falls.
The main change in 2011 was that participation in the older age groups increased as qualified engineers worked longer. The initial fall in participation in the 55 to 59 years age group still occurred, but was more moderate, falling to 88.2%. In all subsequent age groups participation was higher than in 2006 with the participation rate in the oldest group increasing to 13.0%.
Women qualified engineers experienced a similar build up in participation in younger age groups as men, but the subsequent plateau was different to men in two respects. First, it was at a much lower level of participation, in the low 80s% and second there is a pronounced dip in participation for the 30 to 34 years, 35 to 39 years and 40 to 44 years age groups. Another difference to men is that the move to retirement starts earlier for women, in the 50 to 54 years age group, and the shift to retirement is faster than men with more rapid reduction in participation in subsequent age groups.
Figure 11.4 compares the labour force participation of engineers in 2011 to the participation of similarly qualified individuals in other skilled areas. This illustration shows that there is barely any distinction between the two groups of men. However, the difference between the two groups of women is pronounced. The structures of women’s participation are similar, but the labour force participation of women engineers is lower in all age groups than for similarly qualified women in other skilled areas. This difference is likely to be a factor contributing to the low proportion of women in the engineering labour force.
0.0
10.0
20.0
30.0
40.0
50.0
60.0
70.0
80.0
90.0
100.0
Under 20years
20-24years
25-29years
30-34years
35-39years
40-44years
45-49years
50-54years
55-59years
60-64years
65-69years
70 Years& over
Part
icip
atio
n R
ate
(%)
Figure 11.4: The Age Profile of Labour Force Participation, Engineering Compared to All Skilled Areas, 2011
Engineering Men Comparison Men Engineering Women Engineering Comparison

Engineers Australia 98
The Engineering Profession: A Statistical Overview, 2015
Chapter 12 Experience, Remuneration and Age Main Points This Chapter examines statistics from a well-known engineering salary survey to examine the average age of engineers, their average experience and average salary packages using a framework that differentiates responsibility levels. The statistics only cover professional engineers and not the full engineering team.
At every responsibility level, from junior to most senior, public sector Professional Engineers had average lengths of experience longer than private sector counterparts. During the past five years, average length of experience for engineer has increased for senior engineers (levels 3 and above) but have either fallen or remained stable for junior engineers (level 1 and 2) in both sectors.
Professional Engineers are on average older than private sector counterparts at all responsibility levels. During the past five years, average ages have increased in the private sector at all levels except for level 1 where they have been stable. In the public sector, average ages has increased for senior engineers (grade 3 and above) and fallen for junior engineers.
In 2015, five of the six responsibility levels secured increases in salary packages in the private sector compared to falls in all six levels in 2014. The weighted average salary increased by more than average adult full time total earnings. In the public sector, salary packages increased in four of the six levels although the overall weighted average increase was small and well below the increase in adult full time total earnings.
12.1 The Framework Used Engineers are often differentiated by the economic sector they work in and by the degree of experience they have. The most common economic sectors are the private and public sectors and this approach is used here. Discussions of experience are often in terms of job titles. This is of limited value because the same title can mean different things to different people. To avoid these problems we use an established framework of engineering responsibility levels which relates to engineering career criteria.
Engineering responsibility levels are defined by the degree of supervisory input, the degree of independent decision making capacity expected from an engineer and their capacity to undertake different roles in the engineering work force. Responsibility levels are embedded in salary arrangements and are often used to characterise engineering positions. There are six engineering responsibility levels defined as follows35.
• Level 1 Professional Engineer; this is the graduate engineer entry level. The engineer undertakes engineering tasks of limited scope and complexity in offices, plants, in the field or in laboratories under the supervision of more senior engineers.
• Level 2 Professional Engineer; this level recognizes the experience and competence gained as a Level 1 Engineer. At this level engineers have greater independence and less supervision, but guidance on unusual features is provided by engineers with more substantial experience.
35 The definitions used by the Association of Professional Engineers, Scientists and Managers, Australia (APESMA) are used. APESMA has conducted surveys of engineering salaries since 1974 in June and December. Each edition, as well as the targeted salary information, contains statistics about the characteristics of survey respondents which provide important insights on the profession. The main limitation of the statistics is that they only cover Professional Engineers. Similar statistics for Engineering Technologists and Associate Engineers are not available. See APESMA, Professional Engineer Remuneration Survey Report, December 2012, pp8-9 for the source of the definitions.
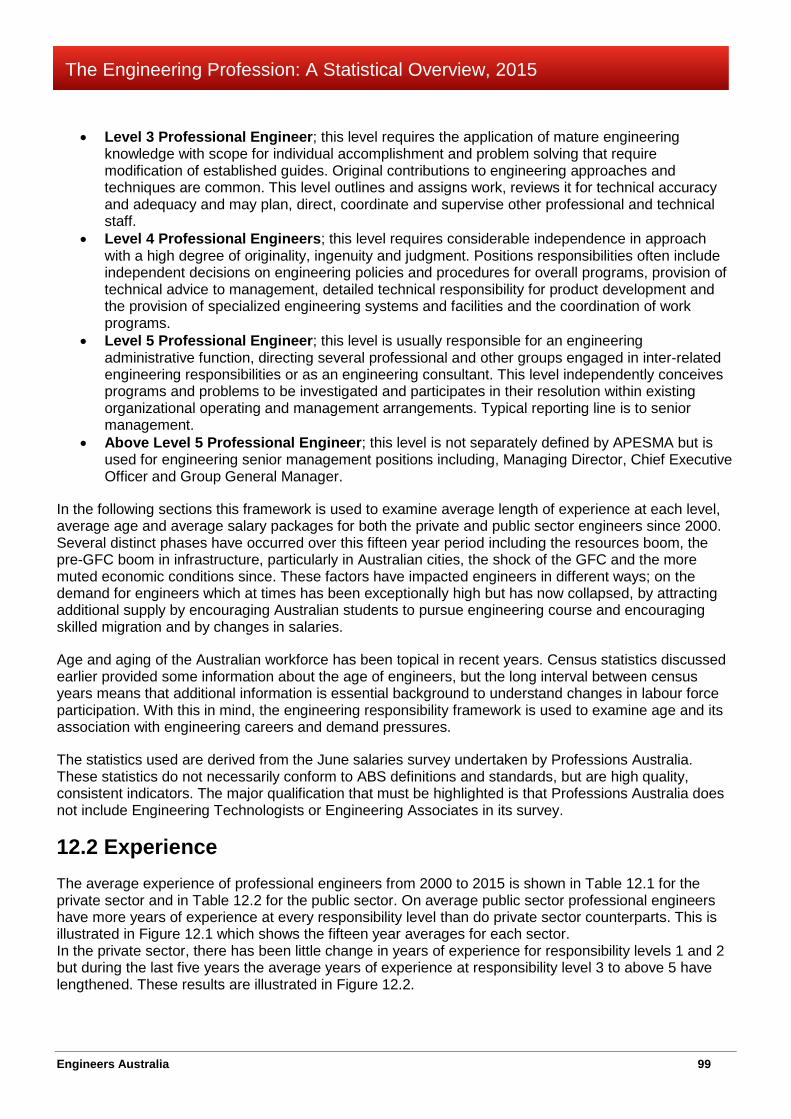
Engineers Australia 99
The Engineering Profession: A Statistical Overview, 2015
• Level 3 Professional Engineer; this level requires the application of mature engineering knowledge with scope for individual accomplishment and problem solving that require modification of established guides. Original contributions to engineering approaches and techniques are common. This level outlines and assigns work, reviews it for technical accuracy and adequacy and may plan, direct, coordinate and supervise other professional and technical staff.
• Level 4 Professional Engineers; this level requires considerable independence in approach with a high degree of originality, ingenuity and judgment. Positions responsibilities often include independent decisions on engineering policies and procedures for overall programs, provision of technical advice to management, detailed technical responsibility for product development and the provision of specialized engineering systems and facilities and the coordination of work programs.
• Level 5 Professional Engineer; this level is usually responsible for an engineering administrative function, directing several professional and other groups engaged in inter-related engineering responsibilities or as an engineering consultant. This level independently conceives programs and problems to be investigated and participates in their resolution within existing organizational operating and management arrangements. Typical reporting line is to senior management.
• Above Level 5 Professional Engineer; this level is not separately defined by APESMA but is used for engineering senior management positions including, Managing Director, Chief Executive Officer and Group General Manager.
In the following sections this framework is used to examine average length of experience at each level, average age and average salary packages for both the private and public sector engineers since 2000. Several distinct phases have occurred over this fifteen year period including the resources boom, the pre-GFC boom in infrastructure, particularly in Australian cities, the shock of the GFC and the more muted economic conditions since. These factors have impacted engineers in different ways; on the demand for engineers which at times has been exceptionally high but has now collapsed, by attracting additional supply by encouraging Australian students to pursue engineering course and encouraging skilled migration and by changes in salaries.
Age and aging of the Australian workforce has been topical in recent years. Census statistics discussed earlier provided some information about the age of engineers, but the long interval between census years means that additional information is essential background to understand changes in labour force participation. With this in mind, the engineering responsibility framework is used to examine age and its association with engineering careers and demand pressures.
The statistics used are derived from the June salaries survey undertaken by Professions Australia. These statistics do not necessarily conform to ABS definitions and standards, but are high quality, consistent indicators. The major qualification that must be highlighted is that Professions Australia does not include Engineering Technologists or Engineering Associates in its survey.
12.2 Experience The average experience of professional engineers from 2000 to 2015 is shown in Table 12.1 for the private sector and in Table 12.2 for the public sector. On average public sector professional engineers have more years of experience at every responsibility level than do private sector counterparts. This is illustrated in Figure 12.1 which shows the fifteen year averages for each sector. In the private sector, there has been little change in years of experience for responsibility levels 1 and 2 but during the last five years the average years of experience at responsibility level 3 to above 5 have lengthened. These results are illustrated in Figure 12.2.
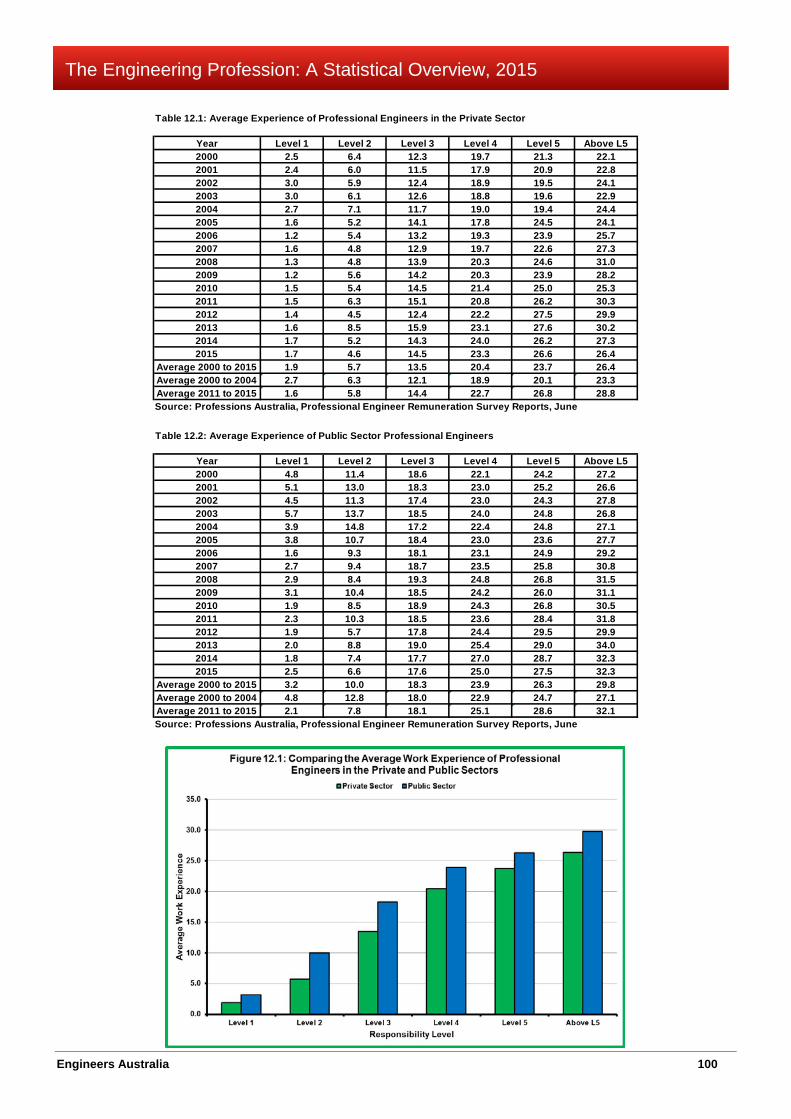
Engineers Australia 100
The Engineering Profession: A Statistical Overview, 2015
Table 12.1: Average Experience of Professional Engineers in the Private Sector
Year Level 1 Level 2 Level 3 Level 4 Level 5 Above L52000 2.5 6.4 12.3 19.7 21.3 22.12001 2.4 6.0 11.5 17.9 20.9 22.82002 3.0 5.9 12.4 18.9 19.5 24.12003 3.0 6.1 12.6 18.8 19.6 22.92004 2.7 7.1 11.7 19.0 19.4 24.42005 1.6 5.2 14.1 17.8 24.5 24.12006 1.2 5.4 13.2 19.3 23.9 25.72007 1.6 4.8 12.9 19.7 22.6 27.32008 1.3 4.8 13.9 20.3 24.6 31.02009 1.2 5.6 14.2 20.3 23.9 28.22010 1.5 5.4 14.5 21.4 25.0 25.32011 1.5 6.3 15.1 20.8 26.2 30.32012 1.4 4.5 12.4 22.2 27.5 29.92013 1.6 8.5 15.9 23.1 27.6 30.22014 1.7 5.2 14.3 24.0 26.2 27.32015 1.7 4.6 14.5 23.3 26.6 26.4
Average 2000 to 2015 1.9 5.7 13.5 20.4 23.7 26.4Average 2000 to 2004 2.7 6.3 12.1 18.9 20.1 23.3Average 2011 to 2015 1.6 5.8 14.4 22.7 26.8 28.8Source: Professions Australia, Professional Engineer Remuneration Survey Reports, June
Table 12.2: Average Experience of Public Sector Professional Engineers
Year Level 1 Level 2 Level 3 Level 4 Level 5 Above L52000 4.8 11.4 18.6 22.1 24.2 27.22001 5.1 13.0 18.3 23.0 25.2 26.62002 4.5 11.3 17.4 23.0 24.3 27.82003 5.7 13.7 18.5 24.0 24.8 26.82004 3.9 14.8 17.2 22.4 24.8 27.12005 3.8 10.7 18.4 23.0 23.6 27.72006 1.6 9.3 18.1 23.1 24.9 29.22007 2.7 9.4 18.7 23.5 25.8 30.82008 2.9 8.4 19.3 24.8 26.8 31.52009 3.1 10.4 18.5 24.2 26.0 31.12010 1.9 8.5 18.9 24.3 26.8 30.52011 2.3 10.3 18.5 23.6 28.4 31.82012 1.9 5.7 17.8 24.4 29.5 29.92013 2.0 8.8 19.0 25.4 29.0 34.02014 1.8 7.4 17.7 27.0 28.7 32.32015 2.5 6.6 17.6 25.0 27.5 32.3
Average 2000 to 2015 3.2 10.0 18.3 23.9 26.3 29.8Average 2000 to 2004 4.8 12.8 18.0 22.9 24.7 27.1Average 2011 to 2015 2.1 7.8 18.1 25.1 28.6 32.1Source: Professions Australia, Professional Engineer Remuneration Survey Reports, June
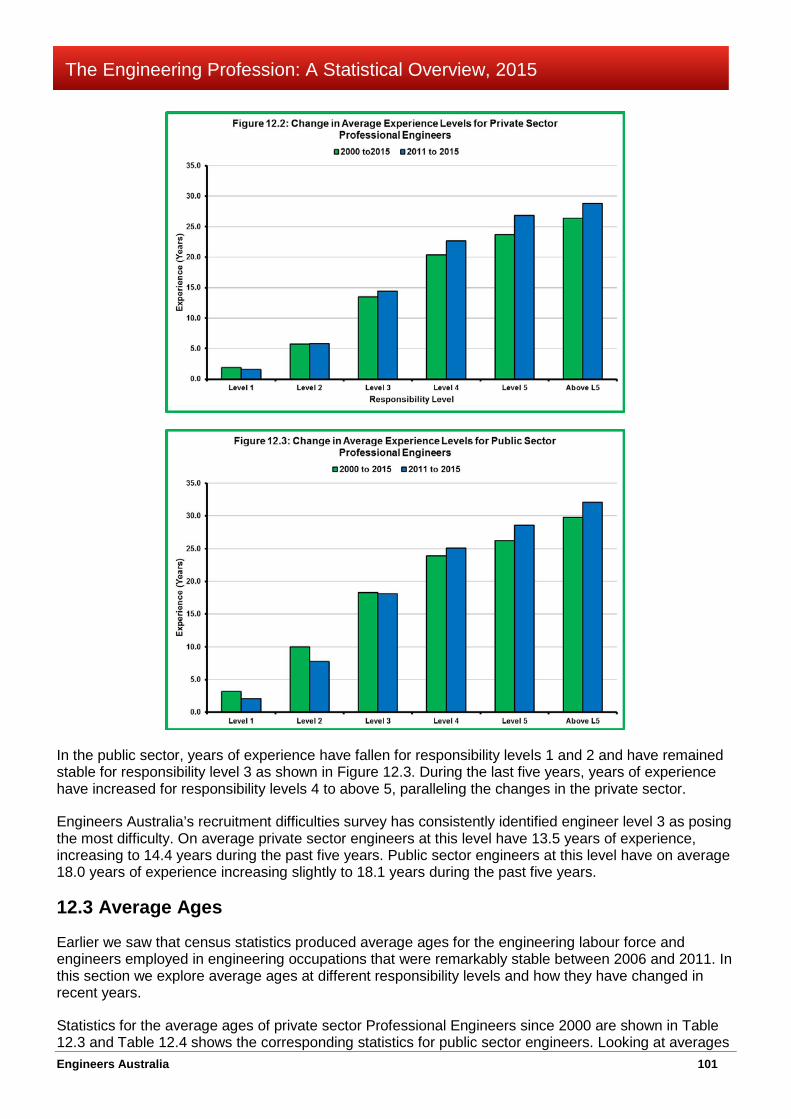
Engineers Australia 101
The Engineering Profession: A Statistical Overview, 2015
In the public sector, years of experience have fallen for responsibility levels 1 and 2 and have remained stable for responsibility level 3 as shown in Figure 12.3. During the last five years, years of experience have increased for responsibility levels 4 to above 5, paralleling the changes in the private sector.
Engineers Australia’s recruitment difficulties survey has consistently identified engineer level 3 as posing the most difficulty. On average private sector engineers at this level have 13.5 years of experience, increasing to 14.4 years during the past five years. Public sector engineers at this level have on average 18.0 years of experience increasing slightly to 18.1 years during the past five years.
12.3 Average Ages
Earlier we saw that census statistics produced average ages for the engineering labour force and engineers employed in engineering occupations that were remarkably stable between 2006 and 2011. In this section we explore average ages at different responsibility levels and how they have changed in recent years.
Statistics for the average ages of private sector Professional Engineers since 2000 are shown in Table 12.3 and Table 12.4 shows the corresponding statistics for public sector engineers. Looking at averages

Engineers Australia 102
The Engineering Profession: A Statistical Overview, 2015
for the full fifteen years, at every responsibility level public sector engineers are older than private sector engineers. This result is illustrated in Figure 12.4.
With the exception of responsibility level 1, the average ages of private sector engineers have increased during the past five years. In the public sector, average ages in responsibility levels 1 and 2 fell during the last five years but increased for responsibility levels 3 to above 5, but not to the same degree as occurred in the private sector.
An important caveat to remember in regard to these statistics is that they relate to employees on salaries. Although, engineers are predominantly in this category, there are also many who practice in independent businesses and these engineers are not covered here.
In past Editions, ages in responsibility levels were weighted by the number of survey respondents to estimate an overall average age. In recent years, changes in survey respondents have resulted in counter-intuitive results. This first became evident in 2014 and was repeated this year. For this reason estimates of an overall average age have been discontinued.
Table 12.3: Average Age of Professional Engineers in the Private Sector
Year Level 1 Level 2 Level 3 Level 4 Level 5 Above L52000 26.0 30.0 36.0 43.0 45.0 45.02001 25.0 29.0 35.0 42.0 44.0 45.02002 26.0 30.0 36.0 43.0 43.0 47.02003 26.0 29.6 36.1 42.3 43.4 45.62004 25.4 30.2 35.6 42.5 42.8 47.12005 25.0 29.0 40.2 43.6 45.5 54.02006 24.4 29.3 37.2 43.2 48.3 49.12007 24.8 28.3 37.0 44.1 46.3 50.82008 25.1 27.9 38.3 44.1 48.7 53.92009 24.2 29.9 37.7 44.4 47.6 51.22010 25.0 29.6 38.5 45.1 48.9 47.92011 24.7 31.3 39.2 44.5 49.6 53.22012 25.3 28.6 37.1 46.2 51.0 53.42013 25.2 33.0 40.8 47.4 50.7 53.52014 25.5 28.8 38.8 48.0 49.5 51.22015 24.9 28.4 38.8 46.8 50.2 49.1
Average 2000 to 2015 25.2 29.6 37.6 44.4 47.2 49.8Average 2000 to 2004 25.7 29.8 35.7 42.6 43.6 45.9Average 2011 to 2015 25.1 30.0 38.9 46.6 50.2 52.1Source: Professions Australia, Professional Engineer Remuneration Survey Reports, June

Engineers Australia 103
The Engineering Profession: A Statistical Overview, 2015
Table 12.4: Average Age of Professional Engineers in the Public Sector
Year Level 1 Level 2 Level 3 Level 4 Level 5 Above L52000 29.0 36.0 42.0 46.0 48.0 50.02001 28.0 37.0 42.0 47.0 49.0 49.02002 28.0 36.0 42.0 47.0 48.0 50.02003 29.3 37.3 42.5 47.7 48.0 50.02004 27.2 39.3 41.0 46.3 48.0 50.12005 27.4 36.7 44.6 51.1 48.8 63.92006 24.5 33.2 42.4 46.8 48.5 52.02007 26.1 32.9 43.6 47.7 49.5 53.72008 25.8 33.9 43.6 48.6 50.5 54.62009 26.2 35.2 43.4 48.3 49.4 54.42010 26.0 36.5 43.5 48.2 51.6 54.22011 28.0 33.7 44.6 48.7 50.1 51.62012 26.5 31.2 43.4 49.5 53.4 52.32013 27.0 33.6 44.6 50.0 52.8 58.02014 25.0 31.0 43.4 51.0 52.5 56.72015 25.1 30.6 42.9 49.5 51.0 54.0
Average 2000 to 2015 26.8 34.6 43.1 48.3 49.9 53.4Average 2000 to 2004 28.3 37.1 41.9 46.8 48.2 49.8Average 2011 to 2015 26.3 32.0 43.8 49.7 52.0 54.5Source: Professions Australia, Professional Engineer Remuneration Survey Reports, June
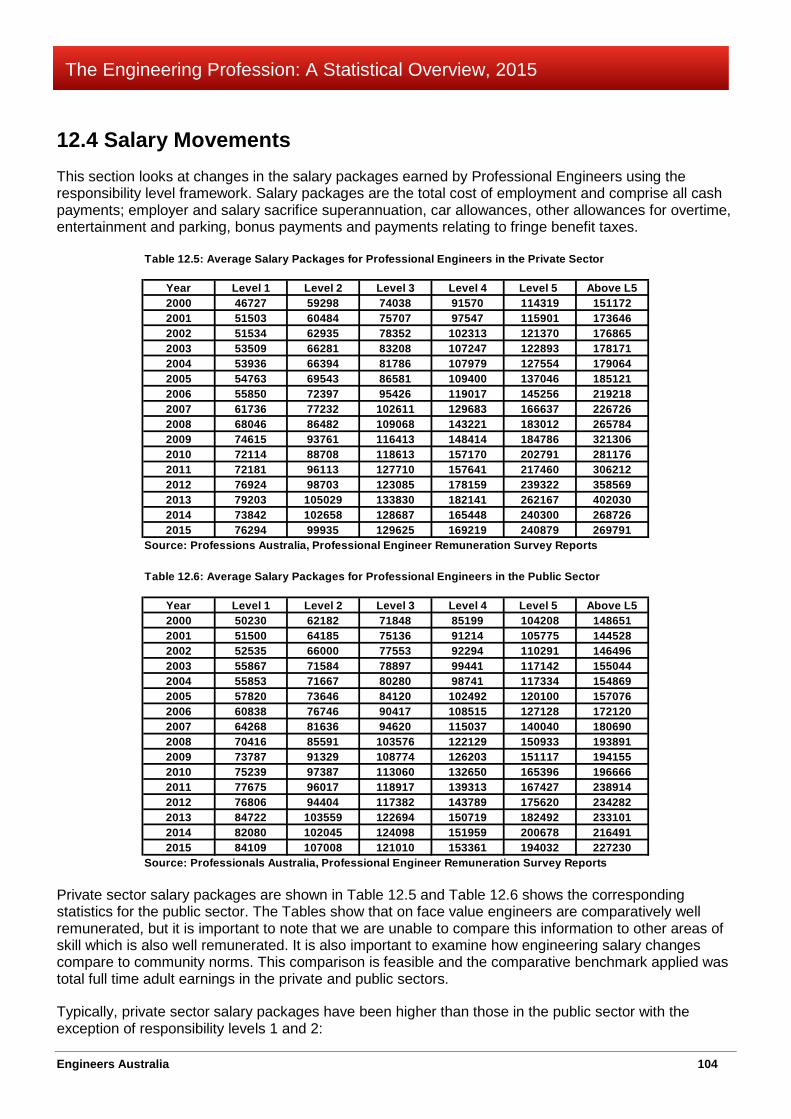
Engineers Australia 104
The Engineering Profession: A Statistical Overview, 2015
12.4 Salary Movements This section looks at changes in the salary packages earned by Professional Engineers using the responsibility level framework. Salary packages are the total cost of employment and comprise all cash payments; employer and salary sacrifice superannuation, car allowances, other allowances for overtime, entertainment and parking, bonus payments and payments relating to fringe benefit taxes.
Private sector salary packages are shown in Table 12.5 and Table 12.6 shows the corresponding statistics for the public sector. The Tables show that on face value engineers are comparatively well remunerated, but it is important to note that we are unable to compare this information to other areas of skill which is also well remunerated. It is also important to examine how engineering salary changes compare to community norms. This comparison is feasible and the comparative benchmark applied was total full time adult earnings in the private and public sectors.
Typically, private sector salary packages have been higher than those in the public sector with the exception of responsibility levels 1 and 2:
Table 12.5: Average Salary Packages for Professional Engineers in the Private Sector
Year Level 1 Level 2 Level 3 Level 4 Level 5 Above L52000 46727 59298 74038 91570 114319 1511722001 51503 60484 75707 97547 115901 1736462002 51534 62935 78352 102313 121370 1768652003 53509 66281 83208 107247 122893 1781712004 53936 66394 81786 107979 127554 1790642005 54763 69543 86581 109400 137046 1851212006 55850 72397 95426 119017 145256 2192182007 61736 77232 102611 129683 166637 2267262008 68046 86482 109068 143221 183012 2657842009 74615 93761 116413 148414 184786 3213062010 72114 88708 118613 157170 202791 2811762011 72181 96113 127710 157641 217460 3062122012 76924 98703 123085 178159 239322 3585692013 79203 105029 133830 182141 262167 4020302014 73842 102658 128687 165448 240300 2687262015 76294 99935 129625 169219 240879 269791
Source: Professions Australia, Professional Engineer Remuneration Survey Reports
Table 12.6: Average Salary Packages for Professional Engineers in the Public Sector
Year Level 1 Level 2 Level 3 Level 4 Level 5 Above L52000 50230 62182 71848 85199 104208 1486512001 51500 64185 75136 91214 105775 1445282002 52535 66000 77553 92294 110291 1464962003 55867 71584 78897 99441 117142 1550442004 55853 71667 80280 98741 117334 1548692005 57820 73646 84120 102492 120100 1570762006 60838 76746 90417 108515 127128 1721202007 64268 81636 94620 115037 140040 1806902008 70416 85591 103576 122129 150933 1938912009 73787 91329 108774 126203 151117 1941552010 75239 97387 113060 132650 165396 1966662011 77675 96017 118917 139313 167427 2389142012 76806 94404 117382 143789 175620 2342822013 84722 103559 122694 150719 182492 2331012014 82080 102045 124098 151959 200678 2164912015 84109 107008 121010 153361 194032 227230
Source: Professionals Australia, Professional Engineer Remuneration Survey Reports

Engineers Australia 105
The Engineering Profession: A Statistical Overview, 2015
• At level 1, public sector packages have been higher than those in the private sector with the exception of occasional years. Recently the gap has widened in favour of the public sector. In 2015, average public sector packages were $84,109 compared to $76,294 in the private sector.
• At level 2, public sector packages exceeded those in the private sector until 2009. Since then the relationship has been more confused changing frequently. In 2015, private sector packages averaged $99,935 and public sector packages averaged $107,008.
• At level 3, private sector packages have been consistently higher than those of the public sector. In 2015, average private sector packages were $129,625 compared to $121,010 in the public sector.
• The private sector also paid consistently more at level 4, but with a larger gap between sectors. In 2014, the average package in the private sector was $169,219 compared to $153,361 in the public sector.
• Private sector packages were also higher at level 5, but with an even larger gap between sectors. In 2015, the average private sector package was $240,879 compared to $194,032 in the public sector.
• The pattern at levels 4 and 5 was repeated for the above level 5 group. During the resources boom period the sector gap was particularly large and, even though package sizes have decreased in the private sector, a substantial gap remains. In 2015, the average private sector package was $269,791 compared to $227,230 in the public sector.
Trends in engineering salaries were analysed in two ways; first by comparing public and private sector trends to movements in full time adult total earnings, and second, by examining salary changes over time. The trends in public and private sector salaries are compared to the corresponding trends in full time adult total earnings using Figure 12.7.
Private sector full time adult total earnings have increased faster than earnings in the public sector over the entire period examined. Until about 2007, public sector engineering packages moved in line with the trend in full time adult total earnings. From then until about 2011, engineering packages moved ahead, but from then onwards, the growth in public sector engineering packages has fallen increasingly behind growth in public sector full time total adult earnings.
An important point to note in Figure 12.7 is that public sector engineering packages consistently grew slower than private sector full time total adult earnings. This makes the comparison between the two engineering trends even starker because private sector engineering salary packages moved well ahead of private sector full time adult total earnings. This relationship came to an end in 2013 when there was an abrupt fall in private sector engineering salaries coinciding with the collapse in the engineering labour
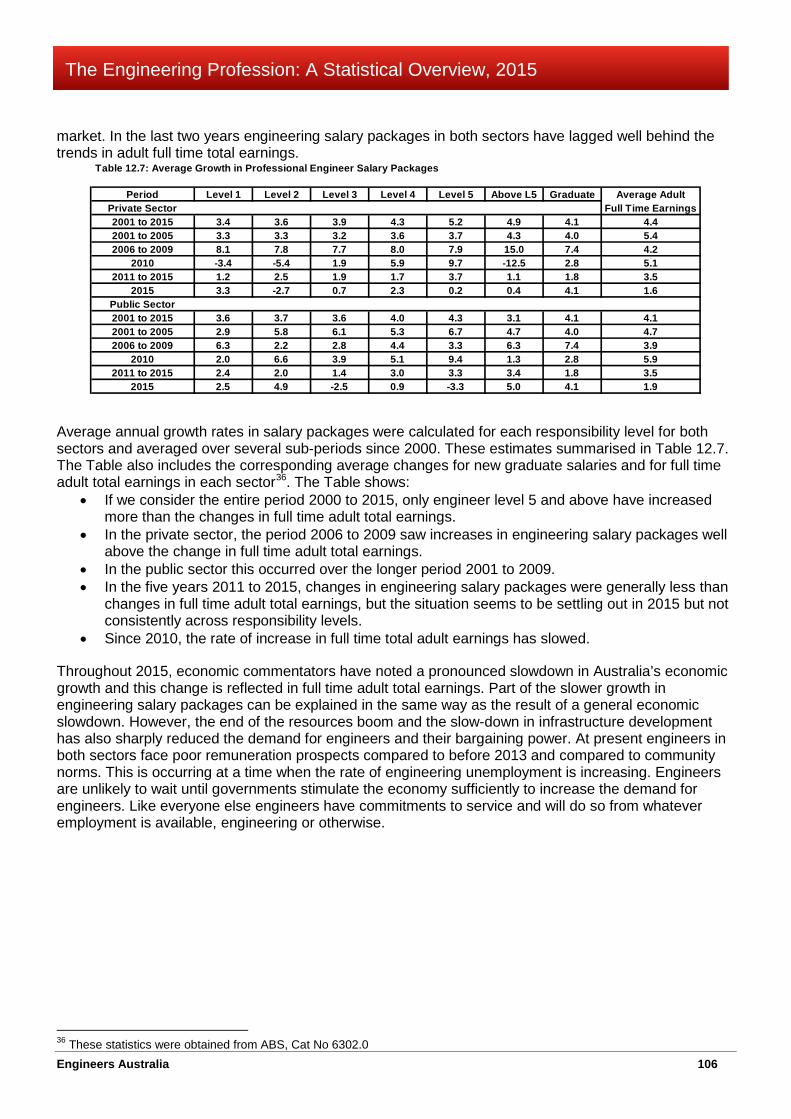
Engineers Australia 106
The Engineering Profession: A Statistical Overview, 2015
market. In the last two years engineering salary packages in both sectors have lagged well behind the trends in adult full time total earnings.
Average annual growth rates in salary packages were calculated for each responsibility level for both sectors and averaged over several sub-periods since 2000. These estimates summarised in Table 12.7. The Table also includes the corresponding average changes for new graduate salaries and for full time adult total earnings in each sector36. The Table shows:
• If we consider the entire period 2000 to 2015, only engineer level 5 and above have increased more than the changes in full time adult total earnings.
• In the private sector, the period 2006 to 2009 saw increases in engineering salary packages well above the change in full time adult total earnings.
• In the public sector this occurred over the longer period 2001 to 2009. • In the five years 2011 to 2015, changes in engineering salary packages were generally less than
changes in full time adult total earnings, but the situation seems to be settling out in 2015 but not consistently across responsibility levels.
• Since 2010, the rate of increase in full time total adult earnings has slowed.
Throughout 2015, economic commentators have noted a pronounced slowdown in Australia’s economic growth and this change is reflected in full time adult total earnings. Part of the slower growth in engineering salary packages can be explained in the same way as the result of a general economic slowdown. However, the end of the resources boom and the slow-down in infrastructure development has also sharply reduced the demand for engineers and their bargaining power. At present engineers in both sectors face poor remuneration prospects compared to before 2013 and compared to community norms. This is occurring at a time when the rate of engineering unemployment is increasing. Engineers are unlikely to wait until governments stimulate the economy sufficiently to increase the demand for engineers. Like everyone else engineers have commitments to service and will do so from whatever employment is available, engineering or otherwise.
36 These statistics were obtained from ABS, Cat No 6302.0
Table 12.7: Average Growth in Professional Engineer Salary Packages
Period Level 1 Level 2 Level 3 Level 4 Level 5 Above L5 Graduate Average AdultPrivate Sector Full Time Earnings2001 to 2015 3.4 3.6 3.9 4.3 5.2 4.9 4.1 4.42001 to 2005 3.3 3.3 3.2 3.6 3.7 4.3 4.0 5.42006 to 2009 8.1 7.8 7.7 8.0 7.9 15.0 7.4 4.2
2010 -3.4 -5.4 1.9 5.9 9.7 -12.5 2.8 5.12011 to 2015 1.2 2.5 1.9 1.7 3.7 1.1 1.8 3.5
2015 3.3 -2.7 0.7 2.3 0.2 0.4 4.1 1.6Public Sector2001 to 2015 3.6 3.7 3.6 4.0 4.3 3.1 4.1 4.12001 to 2005 2.9 5.8 6.1 5.3 6.7 4.7 4.0 4.72006 to 2009 6.3 2.2 2.8 4.4 3.3 6.3 7.4 3.9
2010 2.0 6.6 3.9 5.1 9.4 1.3 2.8 5.92011 to 2015 2.4 2.0 1.4 3.0 3.3 3.4 1.8 3.5
2015 2.5 4.9 -2.5 0.9 -3.3 5.0 4.1 1.9

Engineers Australia 107
The Engineering Profession: A Statistical Overview, 2015
Chapter 13 Indicators for the Engineering Labour Market Main Points This Chapter considers two indicators of change in demand for engineers. Additional indicators are needed because more direct measures are unavailable.
Most public sector engineering construction is infrastructure development. Engineering construction completed has fallen in each of the past three years. Work completed has fallen in seven of nine infrastructure classes, including roads. There is still a large amount of uncompleted work in the system and this will ensure activity remains reasonably high in the next year or so. Without substantial new commencements engineering construction on infrastructure could fall alarmingly. The present trend in new commencements shows falls in each of the past four years. Several governments have announced that infrastructure development is an important priority. This is not evident in these figures.
Private sector engineering construction has also fallen substantially and a key factor here is the ending of the resources sector construction phase. Construction work has fallen in six of nine infrastructure classes and in all five non-infrastructure classes. There remains a very large overhang of uncompleted work in the system, but in the past two years uncompleted work has fallen very rapidly. A risk is that completion of some work depends on the commodity price outlook, specifically, key commodity prices increasing above present levels. New private sector commencements have fallen sharply, back to levels achieved a decade ago. Private sector engineering construction is likely to continue falling; the key questions are for how long and at what rate?
Replacing the construction brought on by the resources boom is often mentioned as a key factor in the economic transition. At its peak private sector engineering construction was $97.1 billion in real terms. Last year this fell to $82.1 billion and this is expected to fall substantially in the next two to three years. Just prior to the GFC it was $42.2 billion and a fall to this level is not out of question. This is an enormous gap to fill.
Vacancies for engineers have collapsed and have been flat for most of the past year. This situation is not confined to resource States but is widespread throughout jurisdictions. In the meantime the supply of labour has increased with record education completions and record permanent skilled migration. There is also a large cohort of skilled migrants employed on temporary 457 visas. Analysing this information using the Beveridge curve points to a higher engineering unemployment rate.
13.1 The Need for Change Indicators There are no straight-forward time series statistics for the supply of and demand for engineers. The objective of the Statistical Overview has been to assemble available statistics to reflect on different facets of the engineering labour market. There are many gaps in our information. We have also been at pains to emphasize that engineering is a profession in which formal educational qualifications are mandatory. The most comprehensive statistics are from the census. Unfortunately, the five year interval between censuses means that these statistics are best suited to analyses of the structure of the engineering labour market.
Benchmark statistics for the supply of engineers are the labour force statistics from the 2006 and 2011 censuses and the labour force statistics from the ABS Survey of Education and Work (SEW). Indicators of changes in supply are statistics on completions of engineering entry level courses and skilled migration statistics. A major gap is retirements from the engineering labour force. SEW statistics on labour force participation give us information on recent changes but only indirectly relate to this issue.
Engineers Australia 108
The Engineering Profession: A Statistical Overview, 2015
Benchmark statistics for the demand for engineers are employment statistics from the census and SEW. Because of the diverse industry employment of engineers additional indicators, particularly ones with up to date statistics, are needed to provide a fully picture of how and where the demand for engineers is changing.
In this chapter two additional indicators of conditions in the engineering labour market are considered. Engineering construction is an indicator of conditions in infrastructure development and in heavy industry and the resources sector. Vacancies for engineers are an accepted indicator of the relative strength of the engineering labour market. Both sets of statistics are available for States and Territories, providing an important geographic dimension.
13.2 Trends in Engineering Construction
Engineering construction is an important indicator of conditions in the engineering labour market because it reflects infrastructure development by both the public and private sectors and because it reflects construction momentum in heavy industries and the resources sector. The best measures of engineering construction are the quarterly statistics produced by the ABS. These statistics do not equate to financial statistics put forward by project proponents because the ABS employs a number of statistical protocols to avoid double counting with other ABS collections and to avoid distortions that can arise by the inclusion of some factors, for example, the price of land that infrastructure assets are built on. What follows below is an overview from a more detailed examination of engineering construction by Engineers Australia37.
Traditionally, Australia’s infrastructure has been provided by the public sector as public goods. The private sector has played an increasingly stronger role over the last two decades, but private sector infrastructure projects often have access restricted to specific activities usually by virtue of their location in close proximity to those activities; for example, a railway built to haul ore from a mine to port is critical to resource exports but less so to urban commuters. The problems this issue gives rise to can be illustrated in several graphs.
The cumulative trends in Australian private and public sector engineering construction on infrastructure are illustrated in Figure 13.1. Infrastructure is defined to be consistent with Infrastructure Australia as roads, bridges, ports, railways, electricity generation and distribution, water supplies, sewerage, pipelines and telecommunications. The statistics are annualised quarterly figures up to 30 June 2015 and have been deflated using 2012-13 prices. These broad trends show that following on from a period of spectacular growth, engineering construction on infrastructure has peaked and is now falling. Beyond this the information content of Figure 1 is limited and needs to be unpacked for a better understanding of changes that have occurred.
Besides the infrastructure assets listed, ABS engineering construction statistics are collected for heavy industry, the resources sector including mines, gas and oil well, recreation facilities and construction that does not fit into specific categories. Figures 13.2 and 13.3 take the two sectoral trends in Figure 13.1 and add to each the non-infrastructure elements of engineering construction.
In the public sector, shown in Figure 13.2, the non-infrastructure elements do not add a great deal to engineering construction. In the public sector, engineering construction is primarily on infrastructure assets as listed above. In the private sector, significant engineering construction is undertaken on non-infrastructure assets. The extraordinary gap between the two trends in years leading up to 2012-13 is mostly due to engineering construction on resource sector assets; mines, gas wells and offshore platforms and oil well.
37 Engineers Australia, Engineers Australia Infrastructure Report 2015, 22 October 2015, www.engineersaustralia.org.au

Engineers Australia 109
The Engineering Profession: A Statistical Overview, 2015
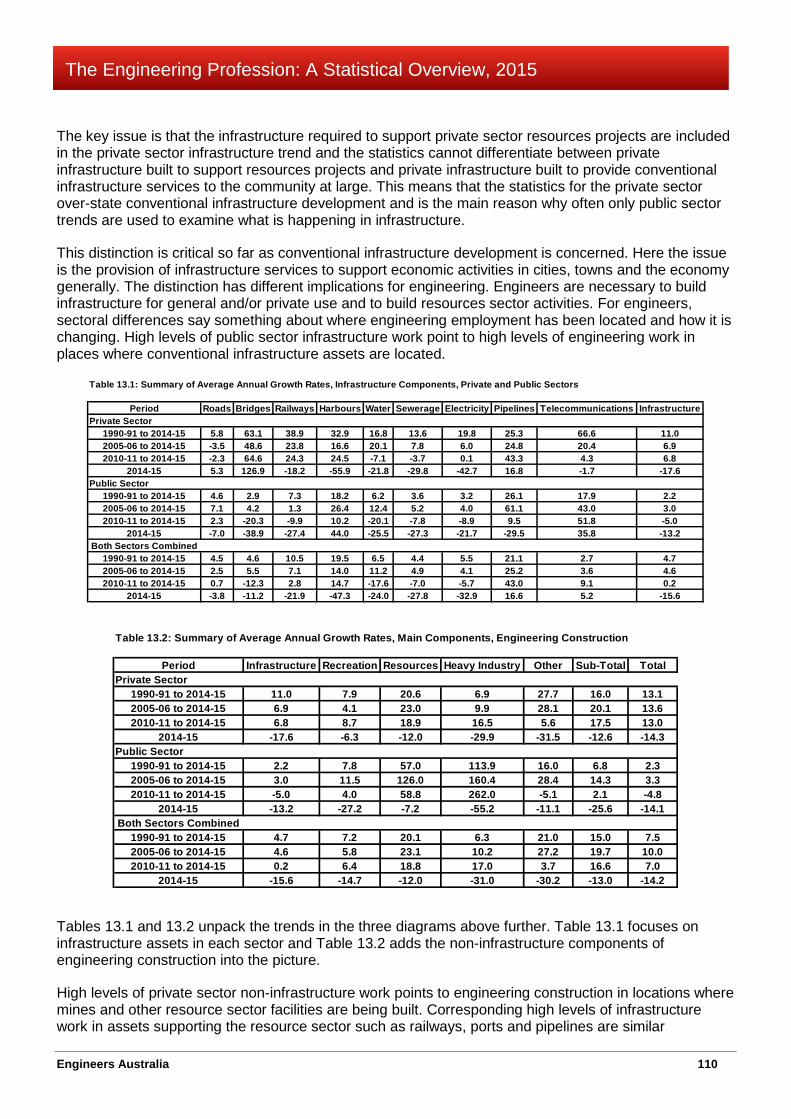
Engineers Australia 110
The Engineering Profession: A Statistical Overview, 2015
The key issue is that the infrastructure required to support private sector resources projects are included in the private sector infrastructure trend and the statistics cannot differentiate between private infrastructure built to support resources projects and private infrastructure built to provide conventional infrastructure services to the community at large. This means that the statistics for the private sector over-state conventional infrastructure development and is the main reason why often only public sector trends are used to examine what is happening in infrastructure.
This distinction is critical so far as conventional infrastructure development is concerned. Here the issue is the provision of infrastructure services to support economic activities in cities, towns and the economy generally. The distinction has different implications for engineering. Engineers are necessary to build infrastructure for general and/or private use and to build resources sector activities. For engineers, sectoral differences say something about where engineering employment has been located and how it is changing. High levels of public sector infrastructure work point to high levels of engineering work in places where conventional infrastructure assets are located.
Tables 13.1 and 13.2 unpack the trends in the three diagrams above further. Table 13.1 focuses on infrastructure assets in each sector and Table 13.2 adds the non-infrastructure components of engineering construction into the picture.
High levels of private sector non-infrastructure work points to engineering construction in locations where mines and other resource sector facilities are being built. Corresponding high levels of infrastructure work in assets supporting the resource sector such as railways, ports and pipelines are similar
Table 13.1: Summary of Average Annual Growth Rates, Infrastructure Components, Private and Public Sectors
Period Roads Bridges Railways Harbours Water Sewerage Electricity Pipelines Telecommunications InfrastructurePrivate Sector
1990-91 to 2014-15 5.8 63.1 38.9 32.9 16.8 13.6 19.8 25.3 66.6 11.02005-06 to 2014-15 -3.5 48.6 23.8 16.6 20.1 7.8 6.0 24.8 20.4 6.92010-11 to 2014-15 -2.3 64.6 24.3 24.5 -7.1 -3.7 0.1 43.3 4.3 6.8
2014-15 5.3 126.9 -18.2 -55.9 -21.8 -29.8 -42.7 16.8 -1.7 -17.6Public Sector
1990-91 to 2014-15 4.6 2.9 7.3 18.2 6.2 3.6 3.2 26.1 17.9 2.22005-06 to 2014-15 7.1 4.2 1.3 26.4 12.4 5.2 4.0 61.1 43.0 3.02010-11 to 2014-15 2.3 -20.3 -9.9 10.2 -20.1 -7.8 -8.9 9.5 51.8 -5.0
2014-15 -7.0 -38.9 -27.4 44.0 -25.5 -27.3 -21.7 -29.5 35.8 -13.2Both Sectors Combined
1990-91 to 2014-15 4.5 4.6 10.5 19.5 6.5 4.4 5.5 21.1 2.7 4.72005-06 to 2014-15 2.5 5.5 7.1 14.0 11.2 4.9 4.1 25.2 3.6 4.62010-11 to 2014-15 0.7 -12.3 2.8 14.7 -17.6 -7.0 -5.7 43.0 9.1 0.2
2014-15 -3.8 -11.2 -21.9 -47.3 -24.0 -27.8 -32.9 16.6 5.2 -15.6
Table 13.2: Summary of Average Annual Growth Rates, Main Components, Engineering Construction
Period Infrastructure Recreation Resources Heavy Industry Other Sub-Total TotalPrivate Sector
1990-91 to 2014-15 11.0 7.9 20.6 6.9 27.7 16.0 13.12005-06 to 2014-15 6.9 4.1 23.0 9.9 28.1 20.1 13.62010-11 to 2014-15 6.8 8.7 18.9 16.5 5.6 17.5 13.0
2014-15 -17.6 -6.3 -12.0 -29.9 -31.5 -12.6 -14.3Public Sector
1990-91 to 2014-15 2.2 7.8 57.0 113.9 16.0 6.8 2.32005-06 to 2014-15 3.0 11.5 126.0 160.4 28.4 14.3 3.32010-11 to 2014-15 -5.0 4.0 58.8 262.0 -5.1 2.1 -4.8
2014-15 -13.2 -27.2 -7.2 -55.2 -11.1 -25.6 -14.1Both Sectors Combined
1990-91 to 2014-15 4.7 7.2 20.1 6.3 21.0 15.0 7.52005-06 to 2014-15 4.6 5.8 23.1 10.2 27.2 19.7 10.02010-11 to 2014-15 0.2 6.4 18.8 17.0 3.7 16.6 7.0
2014-15 -15.6 -14.7 -12.0 -31.0 -30.2 -13.0 -14.2
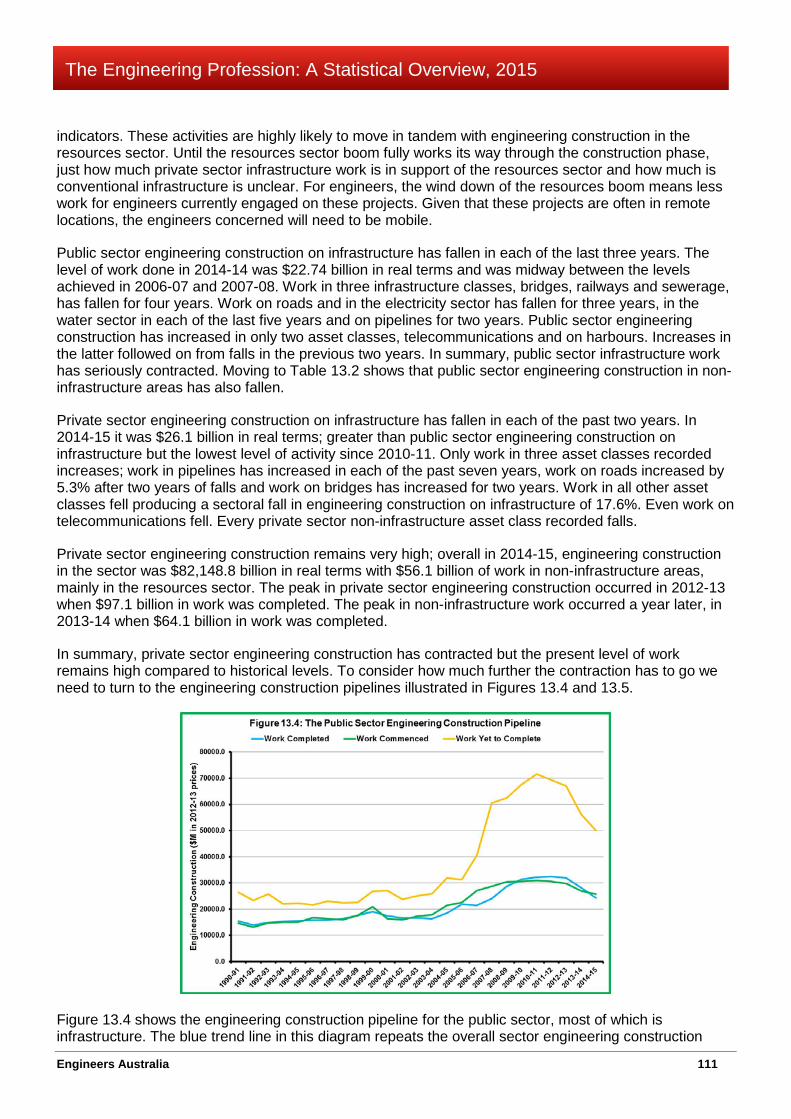
Engineers Australia 111
The Engineering Profession: A Statistical Overview, 2015
indicators. These activities are highly likely to move in tandem with engineering construction in the resources sector. Until the resources sector boom fully works its way through the construction phase, just how much private sector infrastructure work is in support of the resources sector and how much is conventional infrastructure is unclear. For engineers, the wind down of the resources boom means less work for engineers currently engaged on these projects. Given that these projects are often in remote locations, the engineers concerned will need to be mobile.
Public sector engineering construction on infrastructure has fallen in each of the last three years. The level of work done in 2014-14 was $22.74 billion in real terms and was midway between the levels achieved in 2006-07 and 2007-08. Work in three infrastructure classes, bridges, railways and sewerage, has fallen for four years. Work on roads and in the electricity sector has fallen for three years, in the water sector in each of the last five years and on pipelines for two years. Public sector engineering construction has increased in only two asset classes, telecommunications and on harbours. Increases in the latter followed on from falls in the previous two years. In summary, public sector infrastructure work has seriously contracted. Moving to Table 13.2 shows that public sector engineering construction in non-infrastructure areas has also fallen.
Private sector engineering construction on infrastructure has fallen in each of the past two years. In 2014-15 it was $26.1 billion in real terms; greater than public sector engineering construction on infrastructure but the lowest level of activity since 2010-11. Only work in three asset classes recorded increases; work in pipelines has increased in each of the past seven years, work on roads increased by 5.3% after two years of falls and work on bridges has increased for two years. Work in all other asset classes fell producing a sectoral fall in engineering construction on infrastructure of 17.6%. Even work on telecommunications fell. Every private sector non-infrastructure asset class recorded falls.
Private sector engineering construction remains very high; overall in 2014-15, engineering construction in the sector was $82,148.8 billion in real terms with $56.1 billion of work in non-infrastructure areas, mainly in the resources sector. The peak in private sector engineering construction occurred in 2012-13 when $97.1 billion in work was completed. The peak in non-infrastructure work occurred a year later, in 2013-14 when $64.1 billion in work was completed.
In summary, private sector engineering construction has contracted but the present level of work remains high compared to historical levels. To consider how much further the contraction has to go we need to turn to the engineering construction pipelines illustrated in Figures 13.4 and 13.5.
Figure 13.4 shows the engineering construction pipeline for the public sector, most of which is infrastructure. The blue trend line in this diagram repeats the overall sector engineering construction

Engineers Australia 112
The Engineering Profession: A Statistical Overview, 2015
trend of work completed in Figure 13.2 and compares it to the trends in engineering construction work commenced and uncompleted engineering construction in the system.
At the end of 2014-15 there was $50.0 billion in public sector engineering construction yet to be completed. This was about twice the amount of work completed in 2014-15. The peak in outstanding work occurred in 2010-11 and has fallen in every year since. Without a change in commencements the backlog of outstanding work is likely to be completed in the next two to three years.
New public sector engineering construction commencements fell in 2014-15 continuing a trend since 2010-11 when new commencements peaked. The level of new commencements in 2014-15 was midway between the levels achieved in 2005-06 and 2006-07.
In summary, most public sector engineering construction is infrastructure development. Engineering construction completed has fallen in each of the past three years. Although activity levels are bolstered by the large stock of uncompleted work, new commencements have been falling for the past four years. Announced government priority on public sector infrastructure is not evident in these figures which suggest last year’s fall in construction will continue.
Figure 13.5 shows the private sector engineering construction pipeline. As discussed above, private sector engineering construction has been dominated by work in the resources sector but also included significant conventional infrastructure work as well as infrastructure work in support of resources projects.
There is still a large overhang of uncompleted private sector engineering construction. The peak in uncompleted work occurred in 2012-13 when the volume of outstanding work was $551.3 billion in real terms. As the diagram shows, the volume of outstanding work has rapidly concluded and in 2014-14 it was $300.8 billion in real terms. This is still a phenomenal amount of engineering construction and was 3.7 times engineering construction completed in 2014-15. This multiple suggests that completing this work could maintain private sector work completed at high levels for several more years. A critical factor will be the impact of commodity prices, including the prices of LNG and oil, on projects underway. There are already reports that commodity prices are below break-even levels for a number of projects. It is difficult to come to a comprehensive evaluation but the direction is clearly contraction and the main issue is at what rate?
Commencements of private sector engineering construction peaked at $87.3 billion in real terms in 2012-13 and there were large falls in the following two years. In 2014-15, there was $29.8 billion in new

Engineers Australia 113
The Engineering Profession: A Statistical Overview, 2015
commencements, a significant volume but midway the level of commencements in 2003-04 and 2004-05. Commodity prices will again be important for future commencements.
In summary, private sector engineering construction has fallen rapidly and could continue to do so. However, the present level of activity is still very high. Whether this continues depends on how commodity prices impact on the almost four years of work, at the level achieved in 2014-15, still outstanding. New commencements have fallen sharply, back to levels achieved a decade ago. Whether these commencements turn into completions also depends on commodity prices where the outlook is fairly pessimistic. Private sector engineering construction is likely to continue falling; the key questions are for how long and at what rate? The outlook is pessimistic so far as construction is concerned even though completed facilities will contribute to the economy through production.
The indications from engineering construction statistics for the engineering labour market are far from positive. The resources boom construction phase is rapidly winding up and both work outstanding and new commencements are likely to be influenced by a pessimistic outlook for commodity prices. A positive view of the world suggests that engineering construction completed could remain high and gradually fall over three to four years. This assumes work in the system is completed. Alternatively, if project economics are adversely affected by low commodity prices this could rapidly change. Either way, the boom conditions for engineers are long gone.
13.3 Vacancies for Engineers Another useful indicator of conditions in the engineering labour market is vacancies for engineers. The theoretical underpinning is the so-called Beveridge curve which depicts an inverse relationship between the vacancy rate and the unemployment rate38. In this relationship the vacancy rate is the ratio of vacancies to the labour force expressed as a percent and the unemployment rate is the ratio of unemployed persons to the labour force also expressed as a percent. For a given labour force, high vacancy numbers imply a low unemployment rate. Conversely, low vacancy numbers imply that the unemployment rate has increased.
There is insufficient data to enable us to estimate a Beveridge curve for engineers. The time series statistics discussed in chapter 3 provide most of the data needed but what is missing is consistent vacancies data. This section discusses trends in vacancies for engineers using the Department of
38 Jodi Beggs, The Beveridge Curve, http://economics.about.com/od/unemployment-category/ss/The-Beveridge-Curve.htm
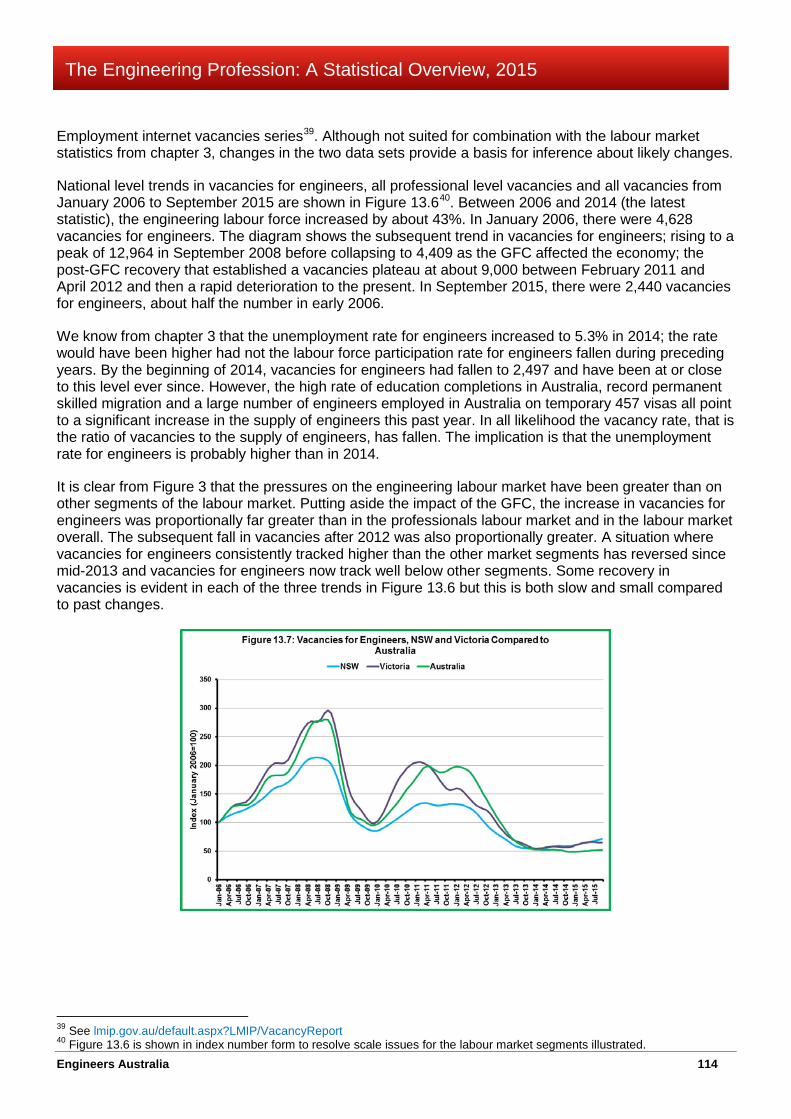
Engineers Australia 114
The Engineering Profession: A Statistical Overview, 2015
Employment internet vacancies series39. Although not suited for combination with the labour market statistics from chapter 3, changes in the two data sets provide a basis for inference about likely changes.
National level trends in vacancies for engineers, all professional level vacancies and all vacancies from January 2006 to September 2015 are shown in Figure 13.640. Between 2006 and 2014 (the latest statistic), the engineering labour force increased by about 43%. In January 2006, there were 4,628 vacancies for engineers. The diagram shows the subsequent trend in vacancies for engineers; rising to a peak of 12,964 in September 2008 before collapsing to 4,409 as the GFC affected the economy; the post-GFC recovery that established a vacancies plateau at about 9,000 between February 2011 and April 2012 and then a rapid deterioration to the present. In September 2015, there were 2,440 vacancies for engineers, about half the number in early 2006.
We know from chapter 3 that the unemployment rate for engineers increased to 5.3% in 2014; the rate would have been higher had not the labour force participation rate for engineers fallen during preceding years. By the beginning of 2014, vacancies for engineers had fallen to 2,497 and have been at or close to this level ever since. However, the high rate of education completions in Australia, record permanent skilled migration and a large number of engineers employed in Australia on temporary 457 visas all point to a significant increase in the supply of engineers this past year. In all likelihood the vacancy rate, that is the ratio of vacancies to the supply of engineers, has fallen. The implication is that the unemployment rate for engineers is probably higher than in 2014.
It is clear from Figure 3 that the pressures on the engineering labour market have been greater than on other segments of the labour market. Putting aside the impact of the GFC, the increase in vacancies for engineers was proportionally far greater than in the professionals labour market and in the labour market overall. The subsequent fall in vacancies after 2012 was also proportionally greater. A situation where vacancies for engineers consistently tracked higher than the other market segments has reversed since mid-2013 and vacancies for engineers now track well below other segments. Some recovery in vacancies is evident in each of the three trends in Figure 13.6 but this is both slow and small compared to past changes.
39 See lmip.gov.au/default.aspx?LMIP/VacancyReport 40 Figure 13.6 is shown in index number form to resolve scale issues for the labour market segments illustrated.

Engineers Australia 115
The Engineering Profession: A Statistical Overview, 2015
The roller-coaster ride for engineering vacancies was present in all jurisdictions as illustrated in Figures 13.7 to 13.9. Although vacancy growth was higher in the resource States of Queensland and Western Australia reflecting skill shortages experienced in the resources sector, vacancy growth was far more widespread across States and Territories than was often reported. Similarly, the post-2013 collapse in vacancies for engineers was also evident in all jurisdictions although not to the same degree.
The present slow recovery in vacancies for engineers has mainly occurred in NSW, Victoria and the two Territories. The latter have comparatively small engineering labour markets and their influence on the national trend is minor. Conversely, trends in the resource States remain quite flat and below the national trend.
These results suggest that the deterioration of the engineering labour market is widespread across Australia. The transition from construction to production in the resources sector is one underlying factor. However, the deterioration in infrastructure development discussed in the previous section has also had serious implications.

Engineers Australia 116
The Engineering Profession: A Statistical Overview, 2015
Chapter 14 The Engineering Labour Market in 2015 Main Points Engineering is a complex profession requiring intensive and extensive education and training over a long period, life-time professional development, numerous areas of specialisation and specialisation is often dependent on engineering practice. These characteristics mean that engineering is not governed by a single labour market for homogeneous “engineering” skills but numerous labour markets conditioned by specific engineering skills and experience levels.
Before the GFC, average annual growth in the supply of engineers was 5.6% per year. Growth slowed after the GFC to average 4.5% per year. In 2014 it was 3.1%. Indicators of supply suggest that growth in 2015 was higher than in 2014.
The demand for engineers grew by a robust 5.9% per year during 2008 to 2013, discounting the impact of the GFC in 2009. In 2014, demand for the engineering team grew by 0.9%, less than demand for all skilled areas. In 2014, demand for engineers in engineering occupations remained relatively high at 4.0%. Indicators of demand suggest than in 2015 demand for engineers probably deteriorated with large falls in engineering construction and flat vacancies.
The combination of these circumstances indicates suggests that the unemployment rate for engineers, already a high 5.3% in 2014, may well have increased in 2015.
14.1 Assessing the Engineering Labour Market This Chapter draws on material in the Statistical Overview to assess the present status of the engineering labour market. At the macroeconomic level this task is usually carried out by reviewing well known indicators such as GDP, the budget deficit, the balance of trade and employment and unemployment. Such an approach cannot be undertaken for the engineering labour market because there are large gaps in the information and because some available information suffers from fairly long data lags.
Our assessment is for the engineering labour market as a whole, a common enough approach widely used in these situations. Unlike other skilled areas, however, engineering is characterised by features that can compromise broad judgements in specific circumstances. Some of these features are:
• Engineers undertake extensive formal education and post graduate on-the-job professional formation. This means adjustment to shortages and over capacity is difficult with serious consequences.
• Engineers practice in many different fields and competence in most fields is mainly acquired on the-job. This means adequate numbers at broad level can disguise shortages in specific areas. It also means limited substitutability between fields of engineering. Stop-start employment opportunities can mean that new graduates cannot find the jobs necessary to develop competence in their area of engineering.
• Engineers have unique skills in engineering, skills that are not available from non-engineers. Conversely, engineers have analytical and problem solving skills highly valued beyond engineering. This means when employment opportunities in engineering dry up, engineers have little difficulty finding employment outside engineering. The longer engineers are away from engineering, the less likely they are to return and social investment in the high costs of engineering education and training is wasted.
Our statistics distinguish between people with engineering qualifications and those of this group who are employed in engineering occupations. This important distinction is critical to understanding change in the
Engineers Australia 117
The Engineering Profession: A Statistical Overview, 2015
engineering labour market. The latter is a statistical estimate of the number of competent practicing engineers. Although far from perfect, this measure demonstrates that the number of competent practicing engineers in Australia is much less than analysts believe.
14.2 The Supply of Engineers The supply of engineers increases when new graduates complete engineering qualifications and join the labour market and when skilled migrants join the labour. Supply decreases when existing engineers retire from the labour market or emigrate from Australia. Our statistics on increases in supply are quite robust. Chapters 5 and 6 are an analysis of engineering education and the subsequent flows to the supply of engineers. Chapter 7 is an analysis of skilled migration.
The number of new “home grown” engineers is at present a record high. Table 6.6 shows that in 2014 over 9,600 students completed engineering qualifications compared to 6,772 in 2002. However, Figure 4.6 alerted us to danger signs. For the first time in many years interest in university courses from year 12 students has fallen. It will take several years for the fall in student numbers to work its way to course completions and in the immediate future, 2015 and two or three years beyond, the trend of increasing engineering course completions can be expected to continue.
As important as increased engineering education completions are, they were swamped by the number of new skilled migrants coming to Australia. In 2014-15, permanent migration of engineers was a record high of 11,556, an increase of over 22% on the previous year. For the first time statistics on the number of temporary 456 migrant engineers working in Australia have become available as well as new visa approvals. These statistics showed that at 31 March 2015, 8,928 temporary migrant engineers were working in Australia. New temporary visa approvals were consistent with last year on a full year basis. In total, 20,484 migrant engineers joined the engineering labour market, twice as many as from course completions.
These statistics show that the influences of education completion and skilled migration on the supply of engineers have grown over time and that both factors are contributing greater numbers to supply than ever before.
Statistics on factors reducing the supply of engineers are less useful. Statistics on the number of permanent departures from Australia suggest the numbers are low and not particularly consistent with estimates of the Australian diaspora. The most likely explanation is that departing Australians do so initially on a short term basis and extend stays while overseas. This process is not satisfactorily captured in the statistics. Direct statistics on retirement from the engineering labour force are not available.
However, chapter 3 considered indirect statistics in the form of changes in the engineering participation rate. These statistics suggested that falls in labour force participation played a major role in the adjustment of the engineering labour market in 2012 and 2014. A possible explanation for the falls is that older engineers remained in the labour force longer than planned because of the GFC and when the labour market deterioration began in 2012 decided it was time to leave. Without the falls in participation, unemployment of engineers would have been much higher. Even with the falls in participation, the unemployment rate for the engineering team in 2014 increased to 5.3%.
The statistics in chapter 3 suggested that following the GFC average annual growth in the supply of engineers was 4.5% and in 2014 it increased by 3.1%. These figures are lower than average annual growth before the GFC of 5.6% per year. Given the education and skilled migration outcome, particularly the large numbers of engineers working on temporary visas, these figures are consistent with the view that relatively high levels of retirements have continued. However, both education completions and skilled migration increased substantially between 2013-14 and 2014-15 and there is a strong possibility that the 2015 increase in supply was higher than last year.
Engineers Australia 118
The Engineering Profession: A Statistical Overview, 2015
14.3 The Demand for Engineers The demand for engineers between the last two census years grew by an average 5.5% per year. A more contemporary picture was summarised in Table 3.1. This Table showed a marked slowdown in demand for the engineering team in absolute terms and relative to other skills. In 2014, demand for the engineering team grew by 0.9% compared to an average of 5.9% per year for the period 2008 to 2013, excluding the GFC impact in 2009. In comparison, the demand for all skilled areas grew by 1.5% in 2014 and by an average 7.5% per year over the period cited.
An important point made in Table 3.1 is that the demand for engineers in engineering occupations increased by 4.0% in 2014. This was robust growth in the circumstances and emphasizes the weakness of skilled migration policies which are based on evaluation of engineering qualifications. Recently, the migration points test has included some consideration of work experience but this is well short of Engineers Australia’s view of what is required of competent practicing engineers.
Chapter 13 considered two indicators of change in the demand for engineers in 2015. The first was change in engineering construction up to 30 June 2015. Most public sector engineering construction is infrastructure development and activity levels have fallen in real terms in each of the past three years. The construction outcome in 2014-15 was midway between the levels achieved in 2006-07 and 2007-08. Engineering construction increased in only two asset classes, telecommunications and harbours. At the end of 2014-15 there was about two years’ worth of uncompleted work (at the 2014-15 level) in the system and this volume had been falling rapidly over the previous two years. New public sector commencements fell in 2014-15 to a level midway 2005-06 and 2006-07, continuing a trend of falling commencements since 2010-11.
Private sector engineering construction is spread between conventional infrastructure and construction in the resources and heavy industry and the infrastructure necessary to support projects in these areas. It is difficult to disentangle the two.
Private sector engineering construction has fallen in the past two years with only three asset classes showing increases, pipelines, roads and bridges. There is a very high level of uncompleted work in the system and as this works its way through absolute levels of construction completed will still be high but falling. An important risk factor is commodity prices with many press reports suggesting that some projects are not economic at present commodity prices. Commencements have been falling and in 2014-15 were back to levels last achieved in 2005-06 to 2006-07.
Very high levels of engineering construction in both public and private sectors were important factors sustaining high demand for engineers in past years. Construction outcomes are now much lower and in the next few years will heavily depend on the completion of work already in the system. Commencements of new work have been falling and are unlikely to match the run down in uncompleted work. The indicators suggest that the current level of engineering construction and likely outcome next year are consistent with a lower demand for engineers.
The second indicator of the demand for engineers considered was the trend in vacancies for engineers. The theoretical economics underpinning for this evaluation is the Beveridge curve which postulates an inverse relationship between the vacancy rate and the unemployment rate; the vacancy rate is the ratio of vacancies to the labour force and the unemployment rate is the ratio of unemployment to the labour force, both expressed as percents.
Vacancies for engineers have been an amazing roller coaster ride this past decade. Until about 2012, relative growth in vacancies for engineers was stronger than growth in vacancies for professionals and overall vacancies in the Australian labour market. Towards the end of 2012, vacancies for engineers collapsed. This was part of a more general fall in vacancies in Australia but the impact on engineers was

Engineers Australia 119
The Engineering Profession: A Statistical Overview, 2015
stronger than on other segments of the labour market. The fall was evident in all States and Territories and has been particularly strong in the resource States.
Data limitations prevent estimation of the Beveridge curve for engineers. However, we know from chapter that the there has been strong growth in the engineering labour force. In combination with almost no growth in vacancies, this suggests that the vacancy rate for engineers has fallen. From chapter 3 we also know that the unemployment rate for the engineering team in 2014 had increased to 5.3%. The implication from the Beveridge curve is that unemployment has increased.
