the energy sector in malta - transport.gov.mt · the energy sector in malta malta resources...
TRANSCRIPT

The Energy Sector in Malta
Malta Resources Authority
21st February 2013
Inġ. Rachelle Riolo

1
Malta - Setting the context
Population: 417,608 inhabitants (2011) Tourists 1.3million – average 8 nights
Urban Area: 20%Agricultural Area: 43%
Climate:
Air temperature has increased
Precipitation has decreased.
Rainfall concentrated in smaller
periods
Higher peak temps in summer
Energy:
Electricity consumption almost
doubled over last twenty years
Elect. Carbon Footprint decreasing
Still one of highest in Europe
Land Area: 316km2
Population Density: 1321 persons/km2
EU Average 113.6 person/km2

2
Energy Sector Status : Electricity (1)
Electricity sector Generation, distribution & supply of electricity: Enemalta
Nominal generation capacity: 571MW (Marsa - 267 MW, Delimara -
304 MW) Base load - 160MW Peak - 425MW (Summer time)
Overall efficiency : 26% and 32%
2011Fuel mix : HFO/Gasoil (84%/16%)
Electricity Consumption by Sector 201128.1%
2.7%
5.8%48.9%
0.4%14.1%
Domestic Government Water Production
Industrial/commercial Others Unbilled units

3
Energy Sector Status : Electricity (2)
Constraints Lack of diversification of energy sources: high dependence on oil
No interconnections: limits integration of intermittent RES
Aging and inefficient generation plant (summer derating)
40% of the generation plant (MPS Steam) shutdown by 2014
Demand profile with large difference between peak and low.
Annual Electricity Generation Electricity Generation in TWh
2.00
2.05
2.10
2.15
2.20
2.25
2.30
2.35
2002 2003 2004 2005 2006 2007 2008 2009 2010 2011Year
TWh

4
Energy Sector Status : Electricity (3)
Winter / Summer Peak Load
050
100150200250300350400450500
1985
1987
1989
1991
1993
1995
1997
1999
2001
2003
2005
2007
2009
2011
2013
2015
2017
2019
Year
MW
Mw WinterMW Summer

5
Energy sector status : Petroleum (1)
Petroleum internal market
Malta depends 100% on petroleum imports for energy
Fuel internal market liberalised as from 2007
Commercialisation and competition in LPG market
Introduction of biofuels substitution obligation in transport fuel in 2011
On going commercialisation of the Petroleum Enemalta primary storage
facilities
Petrol stations upgrade and agreement with GRTU
Code of practice for the petroleum downstream market
Establishment of competent person
Fuel quality control
Issues The need for upgrade of primary storage facilities – safety, capacity, adequate sites
Limited competition in retail sector

6
ENERGY POLICY
Reduction of Emissions Energy Efficiency Stability in Energy Supply
Reducing reliance on fossil fuels
Ensuring an efficient and effective Energy Market Enabling the Energy Sector
Policy areas of the Energy Policy for Malta

7
Energy efficiency: in electricity generation and distribution and in end use, including in transport; Investment in new generation capacity
Implementation demand side management
Coordinated initiatives within a regularly updated, holistic NEEAP: schemes to promote penetration of SWH, P.V. installations, and
purchases of white goods, water use efficiency improvement in road networks, promote e-working and tele-working,
smart traffic management, encourage car sharing and car pooling green procurement Education campaigns Energy efficiency in government buildings Covenant of Mayors; Sustainable Action Plans
Note: The NEEAP 2011 aims at 22% savings on primary energy.
Policy Area 1: Energy efficiency

8
Renewable Energy Data – 2010/2011
Description of Energy sector GWh GWh2010 2011
RES-ePV 1.73 8.43Micro-Wind 0.00 0.00Waste to energy elect (CHP) 0.00 1.55RES-hSWH 28.69 31.44WSM biogas to RTO 1.80 3.08Biomass imports 7.14 6.61bio-diesel in industry 0.94 0.88WSM heat from CHP 0.00 1.39RES-tbio-diesel (from waste or 2ndGeneration) 6.26 7.90

9
Policy Area 2: Reducing reliance on imported fuels (1)
Renewable Energy RES share in total energy consumption 2011: 1.26%
Electricity (PV and CHP) : 0.18% RES heat: 0.80% RES transport: 0.28%
RES share in road transport 2011: 1.38%
Incentives: feed in tariff for PV Electricity from Photovoltaic systems: (2011:8.43GWh
&2020:42GWh)o FIT Regulations LN 422 of 2010o Grants (MRA and ME)
Solar thermal systems:(2011:31.44GWh)

10
PV Installation uptake trend
Up take trend from Malta Energy Policy
0.0
2.0
4.0
6.0
8.0
10.0
12.0
14.0
16.0
18.0
2007 2008 2009 2010 2011 2012
Year
MW
p
Total PV Capacity
Policy Area 2: Reducing reliance on imported fuels (2)

11
Policy Area 2: Reducing reliance on imported fuels (3)
The photovoltaic installations registered with the MRA until December 2012 amount to 18MWpThis would generate approximately 26GWh/ year Upcoming projects: PV on 67000 m2 public roof tops with the capacity of 4.5 MWp generating
about 7.5 GWh/year. C 500kWp at il Qortin Dumpsite Gozo mitigating about 700tonnes of CO2
annually
Up take of PV Installations
50.0%
17.1%
30.6%
2.1%
0.3%
Domestic Industrial Commercial Public Other

12
PV
Offshore Wind
Onshore Wind
Waste to Energy Electricity
Policy Area 2: Reducing reliance on imported fuels (5)
EU RES target 20% by 2020 Malta 10% share of RE in the gross consumption of Energy by 2020
(with a separate target of 10% RE in transport)
RES Percentage share in gross energy contribution
7%
34%
6%21%
3%5%
24%Waste to Energy Heat
Solar Water Heaters
Biofuels
2011 2015 2020•PV 0.15 0.72 0.69
•Offshore Wind 0.00 0.00 3.48•Onshore Wind 0.00 0.30 0.61
•Waste to Energy Electricity 0.03 2.18 2.45•Waste to Energy Heat 0.08 0.45 0.32•Solar Water Heaters 0.58 0.56 0.52
•Biofuels 0.16 1.03 2.40Total 10.20

13
Projected technology share shift 2009 2020
RES Technology Share 2009 PV
Wind
Solar Thermal
Biomass Electric
Biomass Thermal
Bio-fuelsRES Technology Share 2020

14
Wind Onshore wind
o Micro wind (2010:8kW & 2020:127kWp)o Large scale: (Bahrija, Hal-Far: 14.4MWp)
Offshore wind o (Sikka il-Bajda:2016-2020: 72-100MWp)o NER 300 – floating 52MWp wind farm (proposal)
Policy Area 2: Reducing reliance on imported fuels (7)

15
Policy Area 2: Reducing reliance on imported fuels (8)
Biomass and Waste Recover energy from waste (Solid Waste Strategy)
o Electricity or heat from Landfill Gas
o Electricity & heat MBT’s: St Antnin 1.55 MWp (2011),
o Two other bigger MBT plants (one in Malta and other one in Gozo) - 2014
o Energy from RDF-2016
Electricity from WSC’s Sewage Treatment Plants
Biomass projects : Digester in Siggiewi farm capacity; other private farms - 2016
Promote manufacture of biofuels from indigenous sources – from spent edible oil, other organic material;
Explore marine algae cultivation to produce biomass for further processing into energy products.
Geothermal (ground source heat pumps and sea water) - survey

16
Renewable Energy – Challenges and Risks
Risk assessments of large scale
windEnvironmental issues Permitting of wind farm 90MW at Sikka
l-Bajda.Financing of projects Relatively high cost technology
Spatial limitations Geophysical realitiesEconomies of scalePublic awareness and acceptance
Policy Area 2: Reducing reliance on imported fuels (9)

17
Policy Area 2: Reducing reliance on imported fuels (10)
Evaluate alternative schemes and mechanisms, including but not limited to feed-in-tariffs,
Consider providing a share in PV solar parks investment, in assigned public areas,
No policy/legislation that protects individual solar rightsSpatial policy on PV farms (areas of containment, ODZs)Plan B?- If wind projects fail to PV (area limitations) Plan C?- Joint Project in MS (ex Helios Project in Greece)Plan D?-Third Countries (ex Tunisia)
Renewable Energy – Challenges and Risks

18
Stability in energy supply: diversification, interconnection & alternative sources Energy infrastructure:
Electricity Interconnection : HVAC 200MW cable with Sicily:in 2014
Natural gas infrastructure under consideration
Policy Area 3: Stability in Energy Supply

19
Sustainability of the national carbon footprint
Energy Sector : c 90% of CO2 equivalent
Power Stations : 71.3% of energy sectors emissions (ETS)Transport : 21.7 % of CO2 of the energy sector (ESD)Other fuel consumption : c 7%(ESD)
Policy Area 4: Reducing the sector’s environmental impact (1)
-500.00
0.00
500.00
1000.00
1500.00
2000.00
2500.00
3000.00
3500.00
1990 1991 1992 1993 1994 1995 1996 1997 1998 1999 2000 2001 2002 2003 2004 2005 2006 2007 2008 2009 2010
Gg
CO2 eq
LULUCF Energy Industrial Processes Solvent and Other Product UseAgriculture Waste
89.4%
6.7%
3.3%
2.6%
-2.0%

20
Policy Area 4: Reducing the sector’s environmental impact (2)
Main Measures to reduce GHG emissions:‘National Strategy for Policy and Abatement Measures Relating to the Reduction of Greenhouse Gas Emissions’ (2009): 96 recommendations
New plant at Delimara 2012
Interconnection with the European grid end 2014
Use of cleaner fuels at power stations, transport and secondary storages (Control of fuel quality-MRA)

21
New Electricity Generation Plant at Delimara Power Station
Combined Cycle design use of energy in the exhaust stream Plant consists of 8 Wartsila medium gensets.
Most efficient generating plant in MaltaHigh part load efficiency due to modular design
Plant able to operate on Heavy Fuel Oil and GasoilNom. Electric. Power 149MW Net Power Output 144MWNet Electric Efficiency 46.7%
Plant CO2 emissions at maximum continuous rating 0.576 kg/kWh
Policy Area 4: Reducing the sector’s environmental impact (3)
0
500000
1000000
1500000
2000000
2500000
1990199119921993199419951996199719981999200020012002200320042005200620072008200920102011 Year
Elec
tric
ity G
ener
ated
(MW
h)
0
0.2
0.4
0.6
0.8
1
1.2
1.4
tCO
2 /MW
h
Electricity Generated (MWh) tC02/MWh

22
Policy Area 5: Delivering energy efficiently and effectively
Competition in energy market Promotion of competition within the constraints of our small energy
market, complemented by robust regulation, protecting consumers
Continue the opening fuel sector for competition and effective monitoring
Establish satisfactory design and operating standards in fuel & gas market
Code of practices
Authorisations
Continue the commercialisation of Enemalta’s petroleum assets
23
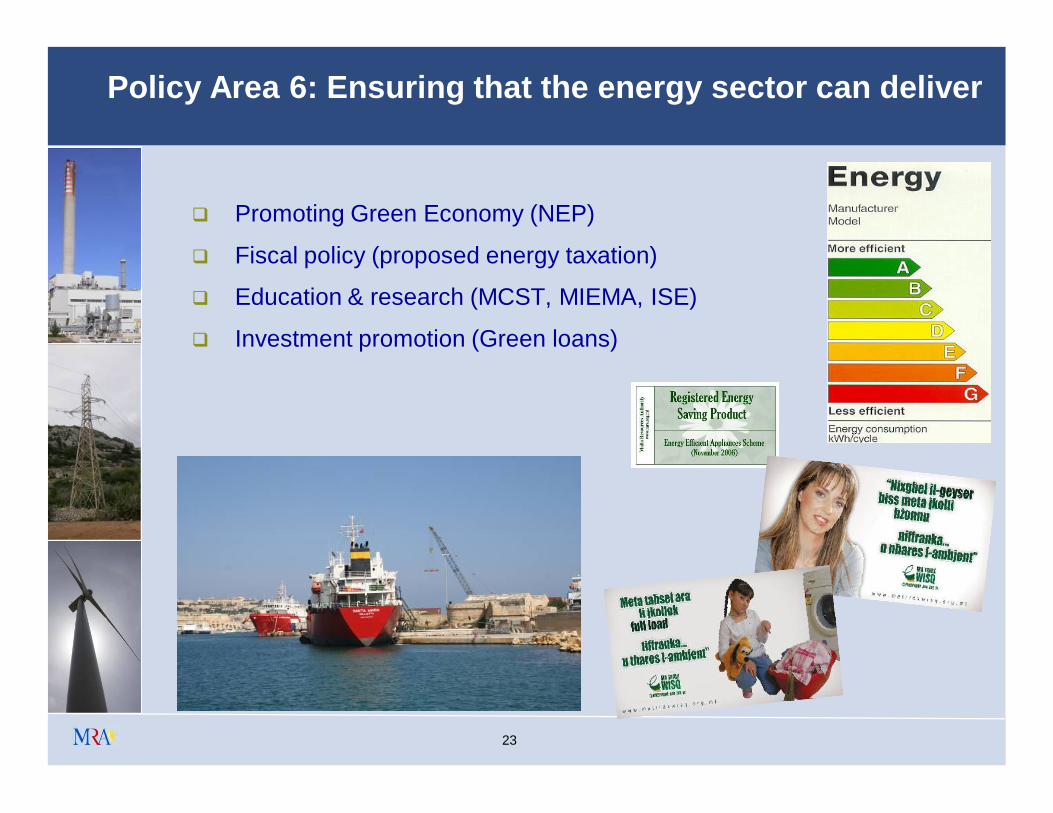
Policy Area 6: Ensuring that the energy sector can deliver
Promoting Green Economy (NEP)
Fiscal policy (proposed energy taxation)
Education & research (MCST, MIEMA, ISE)
Investment promotion (Green loans)

24
Sustainability vs development and spatial complaints?
Landscape impact of urbanisation vs. uptake of RES in dwellings
BRO, MEPA, ME policies!
main challenges: buildings and transport
Need for Planning Guidance to direct offshore RES development
Local organisations, end consumers – Achieve targets in RE,EE and CC
24/02/09
Are we living beyond our means?Change of culture?

25
Thank you!
Inġ. Rachelle Riolo,Malta Resources Authority