the energy expenditure of cattle and buffaloes walking and … · 2016-08-02 · energy expended on...
TRANSCRIPT

Journal of Agricullural Science, Cambridge (1997), 128,95-103. @ 1997 Cambridge Universil;' Press
The energy expenditure of cattle and buffaloes walkingand working in different soil conditions
;c ,.
J. T. DIJKMAN* AND P. R. LA WRENCEt
Centre .for Tropical Veterinary Medicine, Easter Bush, Roslin, Midlothian, EH25 9RG, UK
(Revised MS reci,'ved 20 March 1996)
SUMMARY
At the Centre for Tropical Veterinary Medicine, Scotland, during the summer months of 1987, twoadult water buffaloes, two Brahman cattle and two Brahman x Friesian steers walked round acircular track on concrete or through 300 mm deep mud. Average walking speed (m/s) whenunloaded. or average walking speed (m/s) when pulling 324 N, energy for walking (J /m/kg) and netmechanical efficiency (%) were 1.05 and 0.81 (P < 0.01), 1.03 and 0.80 (P < 0.001), 1.49 and 3.34(P < 0.001) and 31.0 and 31.8 for concrete and mud respectively. Energy values were calculated fromgaseous exchange measured with an open circuit system.
In Central Nigeria, from September 1991 to May 1992, the energy expenditure of eight Bunaji(White Fulani) bulls was monitored using portable oxygen measuring equipment (modified' Oxylog ')when walking. ploughing and harrowing on six soil surfaces ranging from hard, smooth earth toploughed. \vaterlogged clay. Average walking speeds (m/s), pulling speeds (m/s) and energy cost ofwalking (J/m/kg) varied from 0,97 to 0.65, 0.55 to 0,47 and 1.47 to 8,58 respectively. Net mechanicalefficiency averaged 31.4 % and was unaffected by ground surface.
The energy cost of walking for the Bos indicus cattle on smooth ground (1.47 J /m/kg) in this trialwas less than that previously reported for Bos (aurus (1.80 J /m/kg) and the reported average valuefor cattle (80S indicus and Bos (aurus) on treadmills (2,09 J/m/kg). The implications for practicalagriculture of the higher levels of energy expenditure for walking in muddy conditions are discussed.
INTRODUCTIONThe energy cost of walking and working in cattle andbuffaloes has been extensively researched (Hall &Brody 1934: Ribeiro el al. 1977; Lawrence & Richards1980; Thomas & Pearson 1986; Lawrence & Stibbards1990). Knowledge of the energy expenditure andquantification of the nutrient requirements of suchanimals, under as wide a range of conditions aspossible, is necessary to develop more efficient waysof employing draught animals and of making the bestuse of feed resources available. The majority of thesemeasurements were carried out while animals werewalking and working on level, hard, dry surfaces of atreadmill or circular race. Values obtained underthese conditions have subsequently been used in a
factorial method to estimate the energy expenditureand the ensuing nutritional requirements of animalsworking in the field (Lawrence 1985, 1987; Mathers1984; Graham 1985; Mathers et al. 1985). Animalsworking on farms. however, seldom operate underthese conditions.
White & Yousef(I978) first reported on the extraenergy expended on different terrain as the energyexpenditure for walking in reindeer increased sig-nificantly (240/0) in the change from dry to ~'ettundra. Energy consumption connected with walkingcan account for 40--(,0% of the total energy ex-penditure when draught animals are working on hardsurfaces. An increase in the energy cost of walkingunder adverse conditions means that animals haveless energy available to do useful work. In addition, itis likely that the use of the laboratory-based values ina factorial method can cause significant errors in theestimation of draught animal energy expenditure inthe field.
This paper presents the results of two experimentsset up to investigate the increase in energy expenditurefor the various tasks that animals perform in the fieldassociated with varying conditions underfoot. Initial
.Present address: Food and Agriculture Organization ofthe United Nations (FAO), Anima! Production and HealthDivision. Room C-561. Viale delle Terme di Caracalla.00100. Roma. Italy. To whom correspondence should beaddressed.
t Present address: Institute for Animal Production.Hohenheim University (480). D-70593 Stuttgart. Germany.

96 J. T. DIJKMAN AND P. R. LAWRENCE
investigations were carried out at the Centre forTropical Veterinary Medicine (CTVM), Edinburgh,United Kingdom, during the summer months of 1987,where animals walked and worked in 300 mm deepmud in a circular track and these results werecompared with the results obtained while the animalsperformed the same tasks when the track was notcovered in mud. Additional experiments were doneduring the work of the International LivestockResearch Institute (ILRI) on the introduction ofanimal traction into inland valleys in Kaduna,Nigeria, from September 1991 to May 1992. Season-ally inundated low-lying valleys or fadamas, whichmake up c. 7 % of the total cultivable area of Africa,-are an important feature of agriculture in the sub-humid zone of Africa (ILCA 1990). The valleybottoms are formed by the accumulation of fine soilparticles. They are flat with a high clay or very finesand content and inclined to be waterlogged. Incontrast, the surrounding soil (known as the uplands),from which the fine particles are washed. is coarse andgritty. although still fairly fertile. In Nigeria. the valleybottoms are used almost exclusively by small-scalefarmers for rice production and by peripatetic Fulaniherdsmen as a source of winter grazing for theircattle. The uplands are used principally for theproduction of food crops such as maize and sorghum.Until recently. animal traction had been restricted tothe Northern Sahelian zone of Nigeria, but with thedecline of the tsetse challenge, ILRI commenced workon the introduction of animal traction into the sub-humid zone. During this work it became apparentthat the consistency of the soil had a profound effecton the energy consumption of working animals.Hence the ILRI project-site offered an excellent placeto investigate the issue.
The paper draws some general conclusions whichshould enable a more efficient and rational use ofdraught animals. provide basic information on foodrequirements and assist in the design of animal-drawnimplements.
MATERIALS AND METHODS
E.rperiment J
single animal was in a circular race which consisted ortwo circular and concentric brick walls 610 mm highhaving radii or 3 and 5 m. When working. the animalspulled on a radial arm made of galvanized steel tubeor 100 mm diameter and 4,5 m long. Where the armpassed over the inner wall. it was attached to a trolleymade of angle iron which ran along the top of the wallon castors and included the hydraulic brakingmechanism and a seat for the person in charge of theanimals. At the centre of the race. the radial arm wasattached via two pillow block bearings to a verticalspindle made of 75 mm diameter mild steel.
The gaseous exchange of the animals was measuredusing an open circuit gas analysis system (Lawrence etat. 1991). The animals under investigation wore aloose fitting face mask through which air was drawnat a constant rate chosen so that the maximum CO2concentration in the air leaving the mask approachedbut never exceeded 1.0 %. Samples of inspired andmixed expired air were analysed for CO2 incrementand 0., decrement and the results logged continuouslyinto a modified personal computer. Energy con-sumption during any period was calculated usingfactors drawn up by Brouwer (1965) as:
°z consumption (I at standard temperature andpressure (STP» x (16.l6+CO2 consumption(I at STP» x 5,09
No corrections were made to this formula to allow formethane production or the excretion of urinarynitrogen. as these factors are of little quantitativeimportance (Lawrence & Pearson 1985)
Air was drawn through the mask via a 5 cmdiameter hose by a multistage centrifugal pumpdriven by an induction motor (Air Control Products.Chard, Somerset). The air flow rate was measured bya rotameter. Both pump and rotameter were attachedto a horizontal wooden platform in the centre of therace which revolved with the main radial arm. Aspecially designed swivel was made to enable theelectricity supply to reach the pump when the animalswere walking round the race without tangling thecables. Another part of the same device allowedcontinuous removal of a sample or mixed expired airto the gas analysers. which were housed in a nearbylaboratory .
While in the circular race. animals either stood still,walked round at a steady speed without a load. orwalked at a steady speed while pulling against ahydraulically activated loading system. During thelatter operation. the work done by the animals wasmeasured using an ergometer (Lawrence & Pearson1985). which also measured the distance travelled.The force required to move the trolley against theresistance produced by the hydraulic braking systemvaried little between trials. The average value for alltrials (324 i ION) was used in all subseq uent calcu-lations of work and power outputs.
Animals and feeding
Six animals were used, two water buffaloes (Dubalusbubalis), two Brahman cattle (Dos indicus) and twoBrahman x Friesian steers (Table I). All animals hadbeen trained from I year old and were familiar withthe experimental procedures. During the experimentalperiod they were fed a diet of medium quality haycalculated to provide maintenance energy require-ments in two equal meals at 08.00 and 16.00 h daily.
E.rperimental procedureEnergy expenditure measurements were made while a

Draught ruminant energy e.\"penditure 97
Table 2. Species, ages and "'eight.\" of animal pairs usedin Expl 2
--
Liveweight rangeSpecies/Breed Age (years) (kg) Pair
80S indicus 7 37S--440 A80S indicus 7 38S--44080S indicus 5{ 310-360 B80S indicus 5- 380..43080S indicus 44 350-395 C80S indicus 4 305-35580S indicus 6 385-43080S indicus 6 335-380 0*
* Animals only used for' walking upland'.
~
complicated because the animals walked at differentspeeds when walking unloaded and pulling.Net efficiency ('!oj =
(Lawrence & Stibbards 1990).
Statistical analysis of the results consisted of ananalysis of variance using GENSTAT 5 (Genstat 5Committee 1987). which compared walking speeds(loaded and unloaded). energy cost of walking andmechanical efficiency between individual animals.type of animal (buffalo. Brahman or Brahman cross)and surface (initial concrete. mud or final concrete).There were four replicates for each combination ofanimal and surface. giving a total of 72 sets of results.
Experiment 2
When walking without a load, the animals wereencouraged with verbal commands by someonewalking inside the inner wall of the circular raceslightly behind and to the left of the animal. When theanimals pulled a load, the person was in approximatelythe same position relative to the animal but wasseated on the trolley which contained the hydraulicbraking system. The animals were thus continuallyencouraged to walk but were never beaten or goaded.
The respiratory exchange of each animal wasmeasured for 20 min for each of the three types ofactivity and the results from the final 10 min used forsubsequent calculations of energy expenditure. In-spection ot- the continuous records of gaseous ex-change produced by the data-logging system showedthat animals always reached a steady rate of energyexpenditure after the first 10 min of a 20 min periodwhen they were walking or pulling loads.
In any particular measuring session, an animalwould stand, walk. pull and stand. The two standingvalues of energy consumption were averaged. Eachanimal was first tested for four sessions while walkingon concrete. The circular race was then filled withmud to a depth of 300 mm for a further four sessionsper animal. Finally the mud was removed and thefour sessions on concrete were repeated.
No animal was used for more than two sessions inone day. The complete series of measurements wascarried out over a period of 9 weeks.
Measurements were taken during the last 10 min ofeach part of each session as described above and thefollowing data recorded: distance \\'alked withoutload (m), distance walked with load (m) and theenergy expended when standing still, walking andpulling (J). From these data were derived the energycost of walking and the net mechanical efficiency ofthe animal defined as:Energy cost of walking (E~') (J/m/kg liveweight) =
(energy used While)- (energy used While)walking (J) standing still (J)
Animals and feedingA total of eight Bunaji bulls (Bos indicus) were used inthe initial upland walking trials of the Nigerianexperiments. Subsequent measurements were carriedout using six animals only, because one pair of bullswas not completely trained for cultivation work. Allexperimental determinations were made at Kufanavillage, 80 km south east of Kaduna in the sub-humidzone of Nigeria, from September 1991 to May 1992.The animals in Kufana were used throughout the yearfor cultivation, weeding and transportation for theILRI project and had been in constant use over thepast 3 years. The ages, weights and pairing of theanimals are sho\\n in Table 2.
The animals were fed 3 kg of concentrates each at06.00 h (one hour before the start of the experiments)to ensure that they were mainly metabolizing carbo-hydrates during the experimental periods. Hence, thevalue of the respiratory quotient (RQ) probably
---distance walked without load (m) x liveweight (kg)
(1)The calculation of net efficiency was rather more
:11
ill

98 J. T. DIJKMAN AND P. R. LAWRENCE
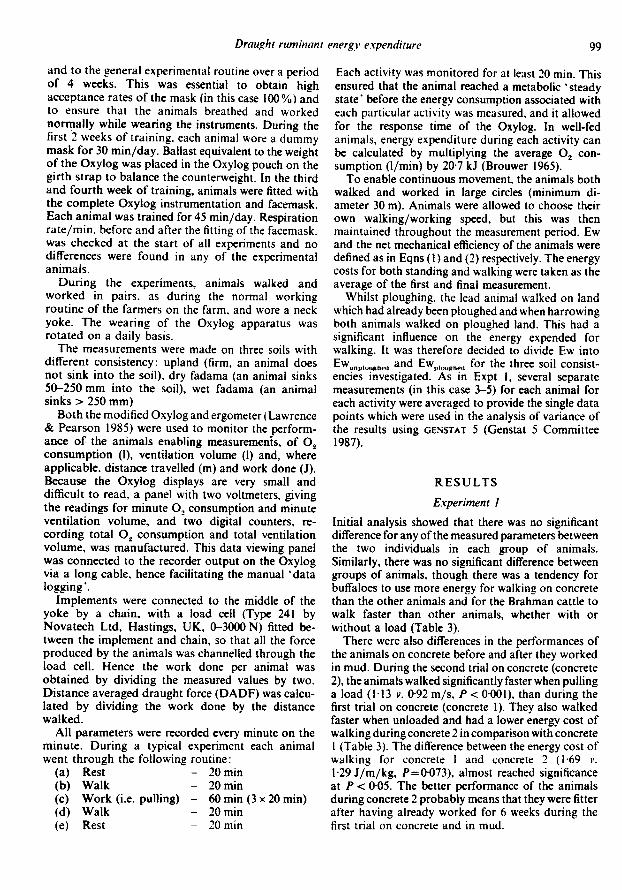
Fig. I. Bunaji (White Fulani) bulls in Nigeria. showing an animal wearing the complete Oxylog instrumentation.
varied between 0.8 and 1.0 during the experimentalperiod. The animals had continuous access to naturalpasture, water and a salt lick. Ambient temperaturesthroughout the experimental period ranged between22 and 31°C with the relative humidity rangingbetween 0.30 and 0.85.
E_~perimental methodsRecent adaptation and validation of the Oxylog.which was originally designed for use with humanbeings (Humphrey & Wolff 1977), for use with draughtanimals (Lawrence et al. 1991; Dijkman 1993) hasmade it possible to measure accurately the O2consumption of animals working in the field. TheOxylog (PK Morgan Ltd, Kent, UK) uses a turbineflow meter mounted on the inlet side of the face mask.After each breath a small reciprocating pump takessamples of air entering and leaving the mask. Thesamples are passed into separate reservoirs containinga solid desiccant which give 'running average' O2concentrations which are measured using two polaro-graphic 0.. electrodes linked differentially. The elec-tronic system calculates and displays total O2 con-sumption and total volume of inspired air at STPafter making corrections for atmospheric temperature,pressure and humidity. Other functions allow thedisplay of 0. partial pressure difference between the
inlet and outlet, and minute volumes of O2 con-sumption and airflow.
Several adaptations were necessary in order to usethe Oxylog for oxen. Firstly a mask was made to fitoxen which incorporated a saliva trap and allowedthe animal to be guided either by a halter or by a nosering. The seal consists of an annular cuff of I mmthick natural rubber which seals perfectly at a pointjust behind the animal's nose when the mask ispushed onto the lace. The basic frame of the mask ismade from 10 mm plywood and is of a geometricallysimple shape. This means that new masks to fitanimals of different sizes can be made quickly, easilyand cheaply.
Secondly, larger versions of the turbine flow meterwere made. It was found possible to make scaled upversions of this type of flow meter which gave goodlinear responses when calibrated using a reciprocatingpump operated at different speeds to give a range offlow rates. The capacity of the inlet and outlet valveswas increased simply by increasing their number fromone to three and nesting them in a larger tube. Finally.the tube connecting the mask to the Oxylog was fittedwith a bypass so that only a fraction of the air passedthe sampling point (Fig. 1).
The animals were trained to wear the facemask. tocarry the analysing and recording unit of the Oxylog
Draught ruminant energy e.ypenditure 99
Each activity was monitored for at least ~O min. Thisensured that the animal reached a metabolic' steadystate' before the energy consumption associated witheach particular activity was measured. and it allowedfor the response time of the Oxylog. In well-fedanimals. energy expenditure during each activity canbe calculated by multiplying the average °2 con-sumption (I/min) by 20.7 kJ (Brouwer 1965).
To enable continuous movement. the animals bothwalked and worked in large circles (minimum di-ameter 30 m). Animals were allowed to choose theirown walking/working speed. but this was thenmaintained throughout the measurement period. Ewand the net mechanical efficiency of the animals weredefined as in Eqns (I) and (2) respectively. The energycosts for both standing and walking were taken as thea verage of the first and final measurement.
Whilst ploughing. the lead animal walked on landwhich had already been ploughed and when harrowingboth animals walked on ploughed land. This had asignificant influence on the energy expended forwalking. It was therefore decided to divide Ew intoEwUnPIUUghed and EWpIOU.h.d for the three soil consist-encies investigated. As in Expt I. several separatemeasurements (in this case 3-5) for each animal foreach activity were averaged to provide the single datapoints which were used in the analysis of variance ofthe results using GE~STAT 5 (Genstat 5 Committee1987).
RESULTSE.\"periment 1
Initial analysis showed that there was no significantdifference for any of the measured parameters betweenthe two individuals in each group of animals.Similarly, there was no significant difference betweengroups of animals, though there was a tendency forbuffaloes to use more energy for walking on concretethan the other animals and for the Brahman cattle towalk faster than other animals, whether with orwithout a load (Table 3).
There were also differences in the performances ofthe animals on concrete before and after they workedin mud. During the second trial on concrete (concrete2), the animals walked significantly faster when pullinga load (1'13 v. 0'92 mis, P < 0.001), than during thefirst trial on concrete (concrete I). They also walkedfaster when unloaded and had a lower energy cost ofwalking during concrete 2 in comparison with concreteI (Table 3). The difference between the energy cost ofwalking for concrete I and concrete 2 (1.69 1'.1.29 Jlmlkg, P=0'073), almost reached significanceat P < 0,05. The better performance of the animalsduring concrete 2 probably means that they were fitterafter having already worked for 6 weeks during thefirst trial on concrete and in mud.
and to the general experimental routine over a periodof 4 weeks. This was essential to obtain highacceptance rates of the mask (in this case 100%) andto ensure that the animals breathed and workednormally while wearing the instruments. During thefirst 2 weeks of training, each animal wore a dummymask for 30 min/day. Ballast equivalent to the weightof the Oxylog was placed in the Oxylog pouch on thegirth strap to balance the counterweight. In the thirdand fourth week of training, animals were fitted withthe complete Oxylog instrumentation and facemask.Each animal was trained for 45 mini day. Respirationrate/min. before and after the fitting of the facemask.was checked at the start of all experiments and nodifferences were found in any of the experimentalanimals.
During the experiments, animals walked andworked in pairs. as during the normal workingroutine of the farmers on the farm. and wore a neckyoke. The wearing of the Oxylog apparatus wasrotated on a daily basis.
The measurements were made on three soils withdifferent consistency: upland (firm, an animal doesnot sink into the soil). dry fadama (an animal sinks50-250 mm into the soil), wet fadama (an animalsinks> 250 mm)
Both the modified Oxylog and ergometer (Lawrence& Pearson 1985) were used to monitor the perform-ance of the animals enabling measurements, of O2consumption (I), ventilation volume (I) and, whereapplicable, distance travelled (m) and work done (J).Because the Oxylog displays are very small anddifficult to read, a panel with two voltmeters, givingthe readings for minute O2 consumption and minuteventilation volume, and two digital counters, re-cording total O2 consumption and total ventilationvolume, was manufactured. This data viewing panelwas connected to the recorder output on the Oxylogvia a long cable, hence facilitating the manual' datalogging'.
Implements were connected to the middle of theyoke by a chain. with a load cell (Type 241 byNovatech Ltd. Hastings, UK, 0-3000 N) fitted be-tween the implement and chain, so that all the forceproduced by the animals was channelled through theload cell. Hence the work done per animal wasobtained by dividing the measured values by two.Distance averaged draught force (DADF) was calcu-lated by dividing the work done by the distancewalked.
All parameters were recorded every minute on theminute. During a typical experiment each animalwent through the following routine:
(a) Rest -20 min(b) Walk -20 min(c) Work (i.e. pulling) -60 min (3 x 20 min)(d) Walk -20 min(e) Rest -20 min
I~'II'r;

100 I. T. DIIKMAN AND P. R. LAWRENCE
---~- -~-
Mechanicalefficiency (%
Table 3. Walking speed Il'hen unloaded, Il'alking .\'peed II.hen plilling an average load of 324 N, energy co,\'t ofwalking and mechanical efficiency of draught animals on two different surfaces during Expt J
Walking speed Pulling speed
Anim~ -~~ -(mfs) --Buffalo 0.9()Brahman 1.13Brahman x 0.94Buffalo 0.78Brahman 0.95Brahman x 0.69Buffalo 1.01Brahman 1.23Brahman x 1-06
0.07All animals 0.99All animals 0.81All animals 1.10
0.05~ -
Energy forwalking (J/m/kg)
-Surface
0'831.040,900,770.920.721.061.261.060.070.920,801.130,05
1-85I-571-653-562-893-57I-56\-271-05
0-191-693-341-290-12
31'026,031,936,129,130'128,135'533,7
2'829,631,832,4
1,7-
Concrete
Mud
Concrete 2
S.E. (9 D.F.)Concrete IMudConcrete 2S.E. {15 D.F.:
~
Table 4. The energy cost ami speed of ,,'alking of Bunaji bull.\" on ploughed or unploughed soils <?f different
consistency in the sub-humid zone of Nlfgeria during Expt 2--~
Walking speed(m/s)
Energy forwalking (J/m/kg)
\,472.87\.763.763.308'58
0,220,26
Soil n
866666
Un ploughed uplandPloughed uplandUnploughed dry fadamaPloughed dry fadamaUnploughed wet fadamaPloughed wet fadamaS.E., n = 8 (32 D.F.)S.E., n = 6 (32 D.F.)
0,970'830.870.740.800.65
0'070.06
Combination of the results for concrete I and 2 forall animals gives values of 1'05 and 1'03 for averagewalking and pulling speed (m/s), 1.49 for the energycost of walking (J /m/kg) and 31'0 for the netmechanical efficiency (%). 300 mm deep mud sig-nificantly lowered walking (P < 0'01) and pullingspeed (P < 0.001). in comparison to walking andpulling speed on concrete. In addition, the energy costof walking in 300 mm deep mud showed a significantincrease of 220 % (P < 0'00 I) from the energy cost ofwalking on concrete. The net mechanical efficiency atc. 30% was not affected.
E.~periment :!
Pair A and B of the experimental animals (Table 2)were ready for experimental observations after 2weeks of training. Pair C and 0 of the experimentalanimals, however, took substantially more time andpatience to train. Nevertheless. at the end of the 4-week training period all experimental animals were
fully accustomed and at ease with the experimentalprocedures and the wearing of the facemask.
Analysis showed that there was no significantdifference for any of the measured parameters betweenthe two individuals in each pairing. Similarly therewas no significant difference between pairs, althoughpair C walked significantly faster during work on allsoil consistencies (P < 0'05).
There was a general tendency for Ew to increasesignificantly (P < 0'001) in the change from un-ploughed to ploughed conditions underfoot.EWplOughPd upland' which averaged 2'87 J/m/kg, meantan increase of 195 % from EwUnPIOUghod upland' Similarly.EWplou.hPd dr,- 'adorna' which averaged 3,76 J /m/kg,showed an increaseof214 °/'0 from EWunPI,?u.hPd dr, 'adam,,-In the case of EWplOUghPd wet 'adama' whIch averaged8.58 J /m/kg, the situation was even more extreme asthis meant an increase of 260 % in the change fromunploughed to ploughed conditions (Table 4).
In conjunction with the general increase in the

Draught ruminant energy e.\'penditure 101
Table 5. U"alking spt't'd ~'ht'n pulling, mt','hani,al t'ffi,'it'ncy and DADF of Bunaji bulls ploughing and harrolvingon soils of different consistency in the sub-humid zone of Nigeria during Expt 2 (mean values for 6 animals)
~ ~--- -~~
Pulling speed(m/s)
Mechanicalefficiency (%jActivity DADF (N)
658779
1130125012651450
63
~~ IPloughing uplandHarrowing uplandPloughing dry fadamaHarrowing dry fadamaPloughing wet fadamaHarrowing wet fadamaS.E. (30 DF.)
0-550-66
0-530-510-460-470-04
31-832-730-232-330-531-\
\.4-DADF = distance average draught force.
energy expended for walking, walking speed showeda general decline with a reduction of the consistencyof the soil. Walking speed decreased significantly (P< 0.0 I) in the change from unploughed to ploughedconditions on all soils investigated. The most sig-nificant decrease (P < 0.00 I) was observed on the wetfadama. where walking speed reduced by nearly 19 %(Table 4).
The net mechanical efficiency for ploughing andharrowing was not significantly affected by theconditions underfoot and varied between 30.2 and32.7% (Table 5). The DADF was significantly loweron all sajIs (P < 0.001 for upland and wet fadama; P< 0.01 for dry fadama) while animals were harrowing.Pulling speed. however, was Qnly significantly affected(P> 0.01) on the upland (Table 5).
i
1
ii,i.'
II
example, an average liveweight of 387 kg for theanimals in Expt 2, gives values of 3,3 J /m/kg and1.0 J/m/kg respectively. As pointed out by Lawrence& Stibbards (1990), the measurements on whichTucker (1969) based his formula included the restingmetabolic rate. This in conjunction with the fact thatanimals have, on average. a standing metabolic ratewhich is 26 % higher on working days than on non-working days (Lawrence et al. 1989), lends moresupport to Tucker's (1969) higher estimate. King(1981) proposed a general formula for the energyexpenditure of walking in Zebu cattle of 200 kg. fed atmaintenance. He based his formula for the energyexpenditure on the walking speed. Substitution of theaverage walking speed on unploughed upland(0'97 m/s) in Expt 2 gave a value of 1.15 J /m/kg.which was probably the best prediction of the threeformulae considered.
The higher values obtained for Ew by Lawrence &Stibbards (1990) in the laboratory setting can beexplained by the fact that during these types ofexperiment animals are forced to walk at a certainspeed on a moving treadmill surface and probablyspent energy balancing and slipping. In the presentexperiments. animals were allowed to choose theirown walking speed. which was then maintainedthroughout the measurement period.
In recently published work. using a collection bagportable' breath by breath' analyser, average walkingvalues for German Simmental and Niger Zebu wererespectively 1.84 J/m/kg and 1.03 J/m/kg (Clar 1991)and 1.75 J/m/kg and 1.45 J/m/kg (Rometsch 1995).Whereas the values obtained for Niger Zebu are inrelative agreement with the current study. the averagecost of locomotion observed in the German Sim-mentals was substantially higher. The Simmentals inthe former studies were led at 1.5 maintenance andwere fat, whereas the Zebus were fed at maintenanceand were thin. It is hypothesised that herein lies apossible explanation for the observed differences. Theenergy cost of carrying applied loads is greater thanthe energy costs of walking. especially when the load
DISCUSSION
The differences in animal performance between thetwo trials on concrete in Expt I, although notsignificantly different, emphasise the fact that it isessential in experiments of this kind to use animalswhich are well-trained not only in the sense of beingeasy to handle and tractable. but which have alsoattained a high and consistent level of physical fitness.In this study it was not possible to apply the usualstatistical remedy to problems of this kind by applyingthe treatments at random. because filling the circularrace required an estimated 20 tonnes of semi-liquidmud which could not be taken in and out easily.
The average energy cost of walking on concrete inExpt I (1.49 J /m/kg liveweight) was lower than thevalue obtained by Lawrence & Stibbards (1990).using the same measuring system. for animals walkingon treadmills (2-09 J /m/kg for Brahman cattle andbuffaloes) and slightly higher than the value for' free'animals walking on beaten earth in Expt 2(1'47 J /m/kg liveweight).
Comparison of these results with general formulaeproposed by Tucker (1969) and Taylor e( al. (1970) topredict the energy cost of locomotion. using, for
illill

102 J. T. DIJKMA~ A~D P. R. LAWRENCE
soils in Costa Rica, was likely to be caused by anincrease in Ew. Overall, the mechanical efficienciesmeasured were in the same range as the valuesreported for Brahman cattle, although substantiallylower than the mechanical efficiency of buffaloes(Lawrence & Stibbards 1990). Mechanical efficiencyreported by Agricultural Research Council (ARC1980) and Thomas & Pearson (1986) were also 3-4 %higher.
During ILRrs work, pilot trials have shown that itwas possible to plough and harrow a large proportionof the fadama area in Kufana during the dry seasonusing ox-drawn implements, whereas in all but a fewplaces the soil was too hard for manual cultivationuntil the onset of the rains. Ox-drawn cultivation inthe dry season had several advantages. Time was nota constraint and cultivation could be done morethoroughly. Working conditions were less stressfulbecause it was dry and cool. The exposure of the soilto the winter sunshine killed many of the pests andweeds. Most important of all, the rice crop could besown in the fadama as soon as sufficient rain hadfallen and the farmers could devote all their time andenergy to the cultivation of their upland food crops.The present results further demonstrate that itwould make sense to cultivate the fadama soils in thedry season from an animal point of view. Not only arethe animals likely to be in a better condition at thattime of the year (Smith 1981), but also the soil is nottoo wet and. hence, Ew will be lower, which wouldleave more energy for doing useful work. Not onlyEw increased as soils got further inundated withwater, but also the DADF rose quite substantially. Asa result more time. effort and energy was needed tocultivate a unit area. Although a system of dry seasoncultivation can be appropriate and more efficientfrom a scientific point of view, the implications of theactual implementation of such an idea will needcareful consideration. For a start. fadamas constituteone of the main dry season grazing reservoirs for th.:cattle of the peripatetic Fulani herdsmen and thecultivation of these inland valleys during the dryperiod would restrict their use for grazing.
Our sincere thanks are due to I. Campbell andR. Archibald for their technical support at the Centrefor Tropical Veterinary Medicine. Financial supportfrom the International Livestock Research Instituteduring the work in Nigeria and the use of their facilitiesis gratefully acknowledged. Personal thanks aredeserved by H. Fitzhugh and D. Little and all theILRI Kaduna field staff.
is placed on the middle of the back (Lawrence &Stibbards 1990). This would help explain the differencebet\veen fat and thin animals and also the apparentdifference between Bos indicus and Bo.\' laurus. Bosindicus carries its fat (when it has any) efficiently overits shoulders whereas Bos laurus carries it around thegut, which places strain on the spine and tends toimpede its gait.
A crucial observation in Expt 2 was that the Ew onploughed land doubled or more than doubled. Theseobservations have nutritional implications for draughtanimals working on soils of differing consistencies.When animals were ploughing with a mouldboardplough, the lead animal walked on land which hadalready been ploughed and as a result spent between20 and 25 % more energy than its partner while doingthe same job. Moreover, the walking speed wentdown as the energy expenditure for walking went up.These results were consistent with the results fromExpt I, where we observed a 124 % increase in energyexpenditure for walking when animals changed from~'alking on concrete to walking in 300 mm mud.
In the walking experiments, a decrease in soilconsistency was linked to a decrease in walking speedand an increase in the energy expenditure for walking,but the situation when animals are ploughing orharrowing is slightly more complicated. Whereas thesame trend of animals slowing down on the wettersoils can be observed, other factors which have animpact on the walking speed during work are the typeof implement and the draught force needed for thespecific cultivation.
Although animals will expend approximately thesame amount of energy during a full working day(Lawrence 1985), whether they are doing 'light' or.heavy' work, the energy expenditure per unit areaand the actual cultivation time needed will be muchhigher. When animals are employed for part of theday only, the extra energy expenditure of the leadanimal while ploughing has to be taken into account.When animals are harrowing, both animals will spendmore energy for walking, and as a result less energywill be available during the working day for doinguseful work.
The efficiency of doing work in Expt 2 was notinfluenced by the consistency of the soil. These resultswere again consistent with results in Expt I. This,however, was expected as to obtain the efficiency ofdoing work the real energy cost for walking wassubtracted from the extra energy expended duringwork. The fall in efficiency observed by Lawrence &Smith (1988), when animals were working on muddy
REFERENCESAGRICULTURAL Rl::SEARCH COUNCIL (1980). The Nutrient BROUWER. E. (1965). Report of the sub-committee on
Requiremellt,~ of Ri/lninallt Livestock, Farnham Royal constants and factors, In Proceedings i!f the ThirdSlough: Commonwealth Agricultural Bureaux. S.I'mposium 011 the Ellerg,1" Metabolism of Farm ,4nimal.,.

Draught ruminant energy e.\"penditure 103
Brahman cattle and swamp buffalo. Animal ProductionSO, 29-39.
LAWRE~CE, P. R.. SosA, R. & CAMPBELL. I. (1989). Theunderlying. resting. energy consumption of oxen duringwork. Proceedings of the Nutrition Society 48, 154A.
LAWRENCE. P. R.. PEARSON. R.A. & DI1KMAN. J. T. (1991).Techniques for measuring whole body energy expenditureof working animals: a critical review. In Isotope andRelated Techniques in Animal Production and Health. pp.21 ]-232. Vienna: International Atomic Energy Agency.
MATHERS. J.C. (1984). Nutrition of draught animals. InAnimal Energy in Agriculture in Africa and Asia, pp.60-66. FAO Expert Consultation on Appropiate Use ofAnimal Energy in Agriculture in Africa and Asia. 15-19Nov. 1982. FAO Animal Production and Health Paper42. Rome: FAO.
MATHERS. J. C.. PEARSON, R. A.. SNEDDON. J. C.. MATTHEW-MAN, R. W. & SMITH. A.J. (1985). The use of draughtcows in agricultural systems with particular reference totheir nutritional needs. In JWilk Production in Del'elopillgCountries (Ed. A.J. Smith). pp. 476--496. Edinburgh:Edinburgh University Press.
RIBEIRO. J. M. DE C. R.. BROCKWAY. J. M. & WEBSTER.A. J. F. (1977). A note on the energy cost of walking incattle. Animal Production 25. 107-110.
ROMETSCH. M. (1995). Energieumsat: und her:frequen: von:ugochsen. PhD thesis, University of Hohenheim.
SMITH. A.J. (1981). Role of draught animals in agriculturalsystems in developing countries. In Vegetable Productivit}.,'the Role of v'egetuhles ill Feemng People ulld Livestock(Ed. C. R. W. Spedding), pp. 247-262. London: Mac-millan.
TAYLOR, C. R., ScHMIDT-NIELSEN, K. & RAAB. J. L. (1970).Scaling of energetic cost of running to body size inmammals. American Journal ofPhysiolog.v 219. 1104-1107.
THOMAS. C. K. & PEARSON, R. A. (1986). Effects of ambienttemperature and of head cooling on energy expenditure.food intake and heat tolerance of Brahman andBrahman x Friesian cattle working on treadmills. AnimalProduction 43. 83-90.
TUCKER, V. A. (1969). Energetic cost of locomotion inanimals. Comparative Biochemistry and Physiology 34,841-846.
WHITE. R.G. & YOVSEF. M.K. (1978). Energy expenditurein reindeer walking on roads and on tundra. CalladiullJournal of Zoolog.v 56. 215-223.
£.4.4 P Puhlication No. II (Ed. K. L. Blaxter). pp. 441--443.London: Academic Press.
CLAR. U. (1991). £ntlncklung einer feldmethode :ur messungdes energie umsat:es bei :ugtieren. PhD thesis. Universityof Hohenheim.
DUKMAN. J. T (1993). The mea.\"urement Qf draught ruminantenergy e.Tp.'nditure in the field. PhD thesis. Centre forTropical Veterinary Medicine, University of Edinburgh.
GENSTAT 5 COMMITTEE (1987). Genstat 5 Reference Manual.Oxford: Clarendon Press.
GRAHAM. N. McC. (1985). Relevance of the British metab-olisable energy system in the feeding of draught animals.In Draught Animal Power for Production (Ed. J. W.Copland). pp. 96-98. An International Workshop onDraught Power for Production. Townsville, Australia.ACIAR Proceedings Series 10.
HALL. W.C. & BRODY. S. (1934). The energy cost ofhorizontal walking in cattle and horses of various agesand body weights. University of Missouri AgriculturalExperiment Station. Research Bulle/in 208.
HUMPHREY. S. J. E. & WOLFF. H.S. (1977). The Oxylog.Journall!f Ph.I'siology 267, 12P.
INTERNATIONAL LIVESTOCK CENTRE FOR AFRICA (1990).Annual Report and Programme Highlights. Addis Ababa.Ethiopia: ILCA.
KING. J. M. (1981). Ungulate Water Turnol'er in TropicalAfrica. Monograph No.6. Addis Ababa. Ethiopia: ILCA.
LAWRENCE. P. R. (1985). A review of the nutrient require-ments of draught oxen. In Draught Animal PolI'er forProduction (Ed. J.W. Copland), pp. 59-63. An Inter-national Workshop on Draught Power for Production.Townsville. Australia. ACIAR Proceedings ~ries 10.
LAWRENCE. P. R. (1987). Nutrient requirements of workingruminants. In An Introduction to Working Animals (Ed. J.L. Falvey). pp. 61-79. Melbourne: MPW Australia.
LAWRENCE. P. R. & PEARSON. R. A. (1985). Factors affectingthe measurements of draught force. work output andpower of oxen. Journal of Agricultural Science. CambridgeIOS. 703-714.
LAWRENCE. P. R. & RICHARDS. J.I. (1980). The energy costof walking in some tropical draught animals. AnimalProduction 30. 455.
LAWRENCE. P. R. & SMITH. A.J. (1988). A better beast ofburden. Nell" Scientist 1609. 49-53.
LAWRENCE. P. R. & STIBBARDS. R. J. (1990). The energy costsof walking. carrying and pulling loads on flat surfaces by