the end of coal: how shoudl the next government respond? · cover image: mulga country at ......
TRANSCRIPT

MULGA BILLS won’t settle our climate accountsAn analysis of the Emissions Reductions Fund
Margaret Blakers and Margaret Considine
MULGA BILLS WON’T SETTLE OUR CLIMATE ACCOUNTS: AN ANALYSIS OF THE EMISSIONS REDUCTION FUND
Contents
Summary i
Aim of our analysis 1
Emissions Reduction Fund overview 2
Our method of analysis 5
Results 10
ERF outcomes to date 18
A foundation for climate action? 21
Attachments 24
Glossary 27
References 31
Mulga bills won’t settle our climate accounts: An analysis of the Emissions Reduction Fund
Published in November 2016 by: The Green Insitute.
www.greeninstitute.org.au
This work is available for public use and distribution with appropriate attribution, under the Creative Commons (CC) BY Attribution 3.0 Australia licence.
ISBN: 978-0-9580066-4-4
Design: Sharon France, Looking Glass Press.
Cover image: Mulga country at Charleville CC by attribution—Flickr, denisbin

MULGA BILLS WON’T SETTLE OUR CLIMATE ACCOUNTS: AN ANALYSIS OF THE EMISSIONS REDUCTION FUND
TABLES
Table 1: ERF vegetation methods 7
Table 2: ERF sectors and methods aligned with UNFCCC sectors 9
Table 3: Australia’s 2014 net emissions compared with ERF abatement up to 31 August 2016 11
Table 4: Forest abatement and projected emissions 12
Table 5a: Sector and location of registered projects 13
Table 5b: Sector, location and value of contracted projects 13
Table 6: ERF vegetation methods compared by projects, contracts, permanence and abatement 16
Table 7: Vegetation contracts by participant and contractor 17
MAPS
Map 1: Vegetation projects and Australia’s bioregions 14
Map 2: Registered projects and contracted projects in and around the Mulga Lands and Cobar Peneplain 15
Authors
Margaret Blakers is the previous Director of the Green Institute Margaret Considine has a background in environmental policy and research
Acknowledgements
We thank Paul Burke, Mary-Lou Considine, Megan Evans, Tim Hollo and Heather Kenway for helpful comments on earlier drafts of this paper. Responsibility for its contents remains with us.
Margaret Blakers, Margaret Considine

MULGA BILLS WON’T SETTLE OUR CLIMATE ACCOUNTS: AN ANALYSIS OF THE EMISSIONS REDUCTION FUND
Globally, climate change politics and action are moving faster than ever before.
At the tail end of a year when yet more climate records have been smashed, fires, floods and storms have devastated communities across the globe, and the Great Barrier Reef suffered catastrophic bleaching, the Paris Climate Agreement is about to come into force.
Coal companies are filing for bankruptcy (financial as well as moral), walking away from mines and power plants that are being outcompeted by a rampant solar industry.
All this is in the context of an ever-growing, increasingly vocal, powerful and radical social movement for change. First Nations people, unions, artists and citizens of all stripes are coming together to demand action. They are divesting, organising, voting, blockading. And they are beginning to win.
The world is not yet doing what it will take to tackle this immense challenge, but it does seem like the ship is finally turning.
Meanwhile, in Australia, the more things change, the more they stay the same.
Our movement here is strong, and getting stronger. But our governments fail to act, safe within a political conversation which has moved nowhere since the 1990s. That the Federal Government could now be pulling the same bait-and-switch trick with land use emissions that they played at Kyoto 20 years ago beggars belief. And yet that is what they are doing. And getting away with it.
And analysts and commentators from across the spectrum, instead of looking around the world for real solutions, are seeking some kind of political compromise which would somehow make the Abbott/Turnbull ‘Direct Action’ into a viable alternative.

MULGA BILLS WON’T SETTLE OUR CLIMATE ACCOUNTS: AN ANALYSIS OF THE EMISSIONS REDUCTION FUND
The Green Institute’s goal is “to change what is politically possible”. Sometimes that involves taking a clear-eyed view that what is currently “possible” is simply not good enough. That is the case here.
Margarets Blakers and Considine show, with this (extraordinarily) first ever analysis of the Emissions Reduction Fund auctions, that Direct Action not only fails its own test of delivering ‘real and additional’ emissions reductions, but also that it cannot serve as the foundation for more serious action without very substantial changes to its architecture. Instead of fiddling around the edges while Rome burns, we should design a better model from the outset.
Treating ‘Direct Action’ as fixable only limits political debate, keeping it as the only “possible” alternative. That is not the reality. Our task should be to make what is necessary possible.
Tim Hollo, Executive Director, The Green Institute

i
Mulga bills won’t settle our climate accounts: An analysis of the Emissions Reduction Fund
Summary
Australia has flagged its intention to ratify the Paris Agreement, which aims to keep global warming to no more than 2 degrees Celsius above pre-industrial levels and pursue efforts to stay below 1.5 degrees Celsius. To have any chance of achieving such targets, we need to reduce emissions from both the industry and land sectors.
The centrepiece of the Commonwealth Government’s climate policies is the Emissions Reduction Fund (ERF). Various commentators and policy analysts have proposed transforming this into a baseline-and-credit scheme, a type of emissions trading scheme. These proposals, however, have been made in the absence of rigorous analysis of how the ERF has been operating.
This first-ever detailed analysis attempts to help fill that gap, with a particular focus on the land sector, which accounts for most abatement purchased by the ERF.
Key findings
1. The ERF abatement profile is at odds with Australia’s emissions profile. Over 80% of our emissions are from industry, but 80% of ERF abatement is from the land sector. Only 4% is from the Energy and Industrial Processes sectors, which produce most of Australia’s emissions.
2. Large sums of money (around $1.2 billion) have been poured into protecting land sector carbon while the Commonwealth Government’s policy vacuum on safeguarding existing landscape carbon stocks has allowed emissions from clearing and logging elsewhere to continue unabated, assisted by the progressive roll-back of clearing controls by state governments.
3. ERF contracts for avoided clearing (25 Mt CO2-e) account for less than 5% of projected net emissions from land clearing between 2016 and 2030 (750 Mt CO2-e). The entirety of the abatement purchased by the ERF so far (143 Mt CO2-e) at a cost of $1.73 billion accounts for less than 20% of projected emissions from land-clearing until 2030.
4. Over half of all abatement comes from just two mulga-dominated bioregions in south-west Queensland and western NSW. The value of ERF contracts in and around these regions is about $1 billion. With carbon payments estimated to average $195 per hectare, this represents many times the per-hectare value of land in the region.

ii
Summary and conclusions
Mulga bills won’t settle our climate accounts: An analysis of the Emissions Reduction Fund
5. Much of the scheme’s expenditure has either been wasted or is at risk due to doubtful additionality and lack of permanence. Twenty-five per cent of ERF abatement has a ‘permanence’ period of only 25 years, after which time landholders regain ‘full land-use flexibility’. As well, the concentration of abatement in the semi-arid mulga regions carries its own risks such as from drought and climate change itself.
6. The scheme allows large players to aggregate contracts giving them the potential to influence the price, performance and emphasis of the ERF through their superior access to information and efficiencies of scale. One company is responsible for over half of all ERF abatement that uses ‘vegetation’ methods and is managing contracts, with an estimated value of $640 million.
The ERF is not meeting its own objective of making a ‘real and additional’ contribution to reducing Australia’s greenhouse gas emissions. Nor could it form the basis for proposed trading schemes without substantial changes. This is because the ERF would allow Australia’s high-polluting, fossil-fuel-driven industrial sector access to largely unregulated and uncapped ‘abatement’ from the land sector. Simply put, linking a capped market with limited supply to an uncapped market with far greater supply cannot form the basis for an effective policy mechanism.
Most landscape carbon resides in natural ecosystems. If well-managed, these will be resilient and are likely to persist and accumulate large carbon stocks in soils and plants over decades and centuries. Natural ecosysytem management requires coherent, continental-scale policies and funding for the long term which the ERF does not provide.
The ERF is failing the climate, failing the land sector and failing the budget. To be credible, Australia’s climate policies must address the land sector in its own right and must stem the loss of carbon from the landscape caused by clearing, logging and other forms of degradation.
Summer storms at Thunda Creek
The ERF is failing the climate, failing the land sector and failing the budget
““
Photo credit: Thunda Creek from Bushcare: A Citizen’s Audit by Des Hoban
1
MULGA BILLS … won’t settle our climate accounts: An analysis of the Emissions Reduction Fund
1
Aim of our analysis
The Emissions Reduction Fund (ERF) is the centrepiece of the Commonwealth government’s policies to address climate change. In 2014 the government abolished carbon pricing and committed $2.55 billion to buy emission reductions or avoided emissions that make ‘a real and additional contribution to reducing Australia’s greenhouse gas emissions’ (emphasis added) (http://www.environment.gov.au/climate-change/emissions-reduction-fund/publications/white-paper). This abatement is contracted from individual projects in any sector of the economy provided a suitable method is available.
Various commentators and policy analysts have proposed building upon the ERF to create a more effective policy tool, essentially by transforming it into a baseline and credit scheme, a form of emissions trading. These proposals, however, have been made in the absence of rigorous analysis of the actual operation of the ERF, especially the interaction between emissions in the industrial sector, abatement in the land sector, and the complete policy vacuum surrounding landscape carbon management across Australia.
The land sector has provided the bulk of abatement contracted so far, particularly through projects relating to the protection or regeneration of native forests. However consolidated summaries of important land-related information such as the size of the project area, its location and methods used are lacking. Nor is there a systematic assessment of ERF abatement by sector against Australia’s greenhouse gas emissions reports.
Our aim was to analyse ERF projects, especially in the land sector, to establish how effective the policy has been so far in meeting its objectives and to assess whether it is a sound basis to build on. We have a particular interest in ensuring that policies and funding used to secure native vegetation at the continental scale are not only effective and efficient at combating climate change but also at protecting biodiversity as these are complementary objectives (e.g. Ajani et al 2013).

2
Mulga bills won’t settle our climate accounts: An analysis of the Emissions Reduction Fund
2
Emissions Reduction Fund overview
What is it?
The ERF is a legislated scheme for subsidising emissions reductions. It has three elements (Climate Change Authority 2016):
• crediting—businesses and other organisations undertake projects to reduce or avoid greenhouse gas emissions or to sequester carbon in the landscape in accordance with an approved method. They receive ‘carbon credits’ (Australian Carbon Credit Units, ACCUs)1 for the reductions.
• purchasing—the credits can be sold either to the government or privately through secondary markets. The government purchases credits at lowest cost through a competitive auction process. It has budgeted $2.55 billion initially with further funding to be considered in the future.
• a regulatory ‘safeguard mechanism’—intended to ensure that credits created through the ERF are not nullified by significant increases in emissions above ‘business as usual’ elsewhere. Importantly the ‘safeguard mechanism’ does not apply to the land sector.
The Clean Energy Regulator (the Regulator) manages the ERF including the registration of projects, conduct of auctions to buy credits on behalf of the government and managing the registry of credits.
The Emissions Reduction Fund (ERF) will be reviewed by the Climate Change Authority in 2017.
How does the ERF work?
The basis of the ERF is a ‘project’ registered by the Clean Energy Regulator (Clean Energy Regulator). A project can be registered if:
• it uses an approved ‘method’ for carrying out an abatement activity and measuring or estimating the quantity of carbon credits that can be created as a result;
• it has not begun to be implemented before it is registered (the ‘newness’ requirement);
• it is not required to be carried out under an existing law (see below); and
• it is not likely to be carried out under another government program.
1 An ACCU is 1 tonne of CO2-e; here we use the term ‘carbon credit’
3
Mulga bills won’t settle our climate accounts: An analysis of the Emissions Reduction Fund
Overview of the Emissions Reduction Fund
3
Methods are approved by the Minister on the advice of the Emissions Reduction Assurance Committee (Department of the Environment and Energy). Additionality (the expectation that projects would not happen anyway) is to be assured by applying integrity standards when methods are approved, specifically that the carbon abatement is ‘unlikely to occur in the ordinary course of events’. At the project registration stage, the Regulator checks for compliance with the method and legislated tests (Parliament of Australia 2016).
Registered projects create carbon credits in line with their adopted method. Importantly:
• credits can only be created during the project’s ‘crediting period’, usually 7 years from the date of registration but 15 or 25 years for land sector methods;
• the crediting period begins on the date the project is registered or within 18 months;
• a project has set ‘reporting periods’ within its crediting period; carbon credits are created after each report is received and assessed;
• there is a risk-based approach to auditing project reports;
• vegetation projects must nominate a ‘permanence period’ of either 25 years or 100 years during which sequestered carbon must be retained (in case of losses caused by fire or other risks, a 5% reduction in the number of carbon credits they can claim applies; 25-year projects have an additional 20% penalty for non-permanence). At the end of the permanence period landholders regain ‘full land-use flexibility’.
A project or contract can include multiple sites or businesses aggregated by a project developer.
Periodically the Regulator holds auctions to buy credits from registered projects. Successful bidders enter contracts to deliver a stipulated quantity of credits at the price bid at auction in line with a delivery schedule. The contract period is up to 10 years. A project without a contract or that creates more credits than its contract requires can sell excess credits to other buyers within Australia. Contractors unable to deliver sufficient credits can meet their contract obligations by buying credits on the secondary market.
The methods currently available can broadly be grouped into:
• Industry: energy efficiency; fugitives (fugitive emissions from coal mines, and oil and gas extraction and processing); landfill and alternative waste treatment; and transport;
• Land sector: agriculture (reducing methane and sequestering carbon in soil); savanna burning (reducing methane and nitrous oxide by early dry season fire management); and vegetation (avoided clearing of native forest, regeneration of native forest from seed or rootstock, tree planting).
No new proposed methods are open for consultation at present but a number are listed as ‘under development’ (Department of the Environment and Energy).
4
Mulga bills won’t settle our climate accounts: An analysis of the Emissions Reduction Fund
Overview of the Emissions Reduction Fund
4
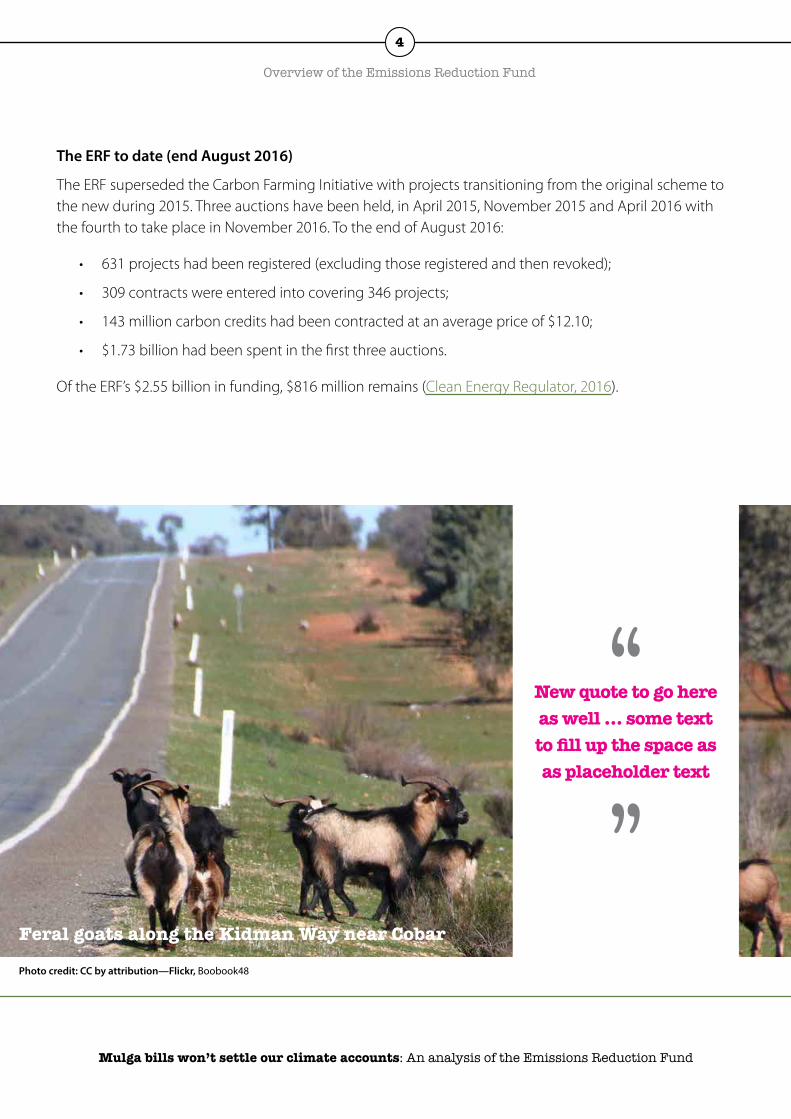
The ERF to date (end August 2016)
The ERF superseded the Carbon Farming Initiative with projects transitioning from the original scheme to the new during 2015. Three auctions have been held, in April 2015, November 2015 and April 2016 with the fourth to take place in November 2016. To the end of August 2016:
• 631 projects had been registered (excluding those registered and then revoked);
• 309 contracts were entered into covering 346 projects;
• 143 million carbon credits had been contracted at an average price of $12.10;
• $1.73 billion had been spent in the first three auctions.
Of the ERF’s $2.55 billion in funding, $816 million remains (Clean Energy Regulator, 2016).
Feral goats along the Kidman Way near Cobar
New quote to go here as well … some text to fill up the space as as placeholder text
““
Photo credit: CC by attribution—Flickr, Boobook48

5
Mulga bills won’t settle our climate accounts: An analysis of the Emissions Reduction Fund
5
Our method of analysis
Data and mapping
The Regulator publishes the following data sets for the ERF:
• Project Register—a list of registered projects with extensive data including a project ID, participant name, project name, method, permanence period, contract ID (if any) and carbon credits issued;
• Contract Register—a list of contracts; can be cross-referenced to the Project Register using the project ID;
• Mapping files—GIS shape files for vegetation and savanna burning projects grouped by state. These can only be cross-referenced to the Project or Contract Register via the project name;
• Interactive map—locates most registered projects by postcode (suppressed data and multi-state and national projects may not be displayed); and
• Media resources—summaries of selected data including auction results.
We combined data from the Project Register, the Contract Register and the Mapping Files to create spreadsheets and GIS maps of vegetation projects and contracts. Our analysis covers the period to the end of August 2016. From the maps we could estimate the areas of registered and contracted projects and compare locations, methods and other parameters by state and bioregion. Mapping and other inconsistencies meant some area estimates had to be adjusted. Details of our analysis are in Attachment 1.
Vegetation methods
Twelve vegetation methods have been approved of which six remain open to be used for new projects. In each method a management change results either in avoidance of emissions that might otherwise have occurred or carbon being sequestered in growing vegetation that otherwise would not have been. Generally grazing and some other land uses can continue; the requirement is that the specified quantity of carbon remains present.

6
Mulga bills won’t settle our climate accounts: An analysis of the Emissions Reduction Fund
Our method of analysis
6
We classified the 12 vegetation methods into three types for analysis and allocated each an index number (Table 1). The types are:
• Avoided clearing (methods A1 to A4): protecting existing native forest by not clearing, deferring re-clearing or converting private native forest from logging to protection;
• Regeneration (methods R1, R2): regenerating or re-growing native forest from in situ seedstock, lignotubers etc (not re-planting); and
• Planting (methods P1 to P6): planting permanent native forest, permanent forest of any species or permanent mallee on land with no forest for the previous five years.
All the methods apply to ‘forest’ which is defined as woody vegetation more than 2 m high with greater than 20% canopy cover.2
The vegetation methods are patchy with respect to coverage. No methods are available at present for non-forest native vegetation or existing native forests on public land. Native forests on private land protected by legislation or covenant do not qualify because they are required by law to be protected. The ‘avoided clearing’ methods are tightly constrained to those with a clearing consent issued before 1 July 2010.
2 In accordance with Australia’s UNFCCC reporting framework, “forest’ is land with tree height greater than 2 m, crown canopy cover greater than 20% and minimum patch size of 0.2 ha; and land with woody biomass vegetation structure that could potentially meet the thresholds. (Commonwealth of Australia 2016).
Caption to go here
a quote to go here … sorry I could not
seem to find one and it would be nice to space this section
out a bit
“
“
Photo credit: Sustainable land use from Bushcare: A Citizen’s Audit by Des Hoban

7
Mulga bills won’t settle our climate accounts: An analysis of the Emissions Reduction Fund
Our method of analysis
7
Table 1: ERF vegetation methods. Index numbers added. ‘Closed’ = superseded/no longer available
No. Method* Decription Crediting period
R1 Carbon Credits (Carbon Farming Initiative) (Human-Induced Regeneration of a Permanent Even-Aged Native Forest—1.1) Methodology Determination 2013
Regeneration of previously cleared land
Must be non-forest for 10 years before application; changed management allows natural regeneration from rootstock etc
25 years
R2 Carbon Credits (Carbon Farming Initiative) (Native Forest from Managed Regrowth) Methodology Determination 2013
Regrowth on previously cleared land
Must be non forest (but not necessarily zero carbon) before project begins; changed management must include cessation of mechanical or chemical regrowth suppression
25 years
A1 Carbon Credits (Carbon Farming Initiative) (Avoided Deforestation) Methodology Determination 2013
Avoided clearing—closed
Must have clearing consent issued before 1 July 2010 for permanent conversion to crop or pasture
20 years
A2 Carbon Credits (Carbon Farming Initiative—Avoided Deforestation 1.1) Methodology Determination 2015
Avoided clearing
Must have clearing consent issued before 1 July 2010 for permanent conversion to crop or pasture
15 years
A3 Carbon Credits (Carbon Farming Initiative—Avoided Clearing of Native Regrowth) Methodology Determination 2015
Deferred re-clearing
Clearing permitted and carried out at least twice previously
25 years
A4 Carbon Credits (Carbon Farming Initiative—Designated Verified Carbon Standard Projects) Methodology Determination 2015
Conversion from logged to protected forest—closed
No longer available (only applies to four projects)
25 years
P1 Carbon Farming (Quantifying Carbon Sequestration by Permanent Environmental Plantings of Native Species using the CFI Reforestation Modelling Tool) Methodology Determination 2012
Planting permanent native forest—closed
Land non-forest for five years before planting
25 years
P2 Carbon Credits (Carbon Farming Initiative) (Reforestation and Afforestation) Methodology Determination 2013
Planting permanent forest (any species)—closed
Land non-forest for five years before planting
25 years
P3 Carbon Credits (Carbon Farming Initiative) (Reforestation and Afforestation—1.2) Methodology Determination 2013
Planting permanent forest (any species)—closed
Land non-forest for five years before planting
25 years

8
Mulga bills won’t settle our climate accounts: An analysis of the Emissions Reduction Fund
Our method of analysis
8
No. Method* Decription Crediting period
P6 Carbon Credits (Carbon Farming Initiative—Reforestation and Afforestation 2.0) Methodology Determination 2015
Planting permanent forest (any species)
Land non-forest for five years before planting
25 years
P4 Carbon Credits (Carbon Farming Initiative) (Quantifying Carbon Sequestration by Permanent Mallee Plantings using the Reforestation Modelling Tool) Methodology Determination 2013
Permanent mallee planting—closed
On land <600 mm rainfall
Land non-forest for five years before planting
25 years
P5 Carbon Credits (Carbon Farming Initiative) (Reforestation by Environmental or Mallee Plantings—FullCAM) Methodology Determination 2014
Permanent mallee planting
On land <600 mm rainfall
Land non-forest for five years before planting
25 years
*Source. Department of the Environment and Energy
Greenhouse gas accounts
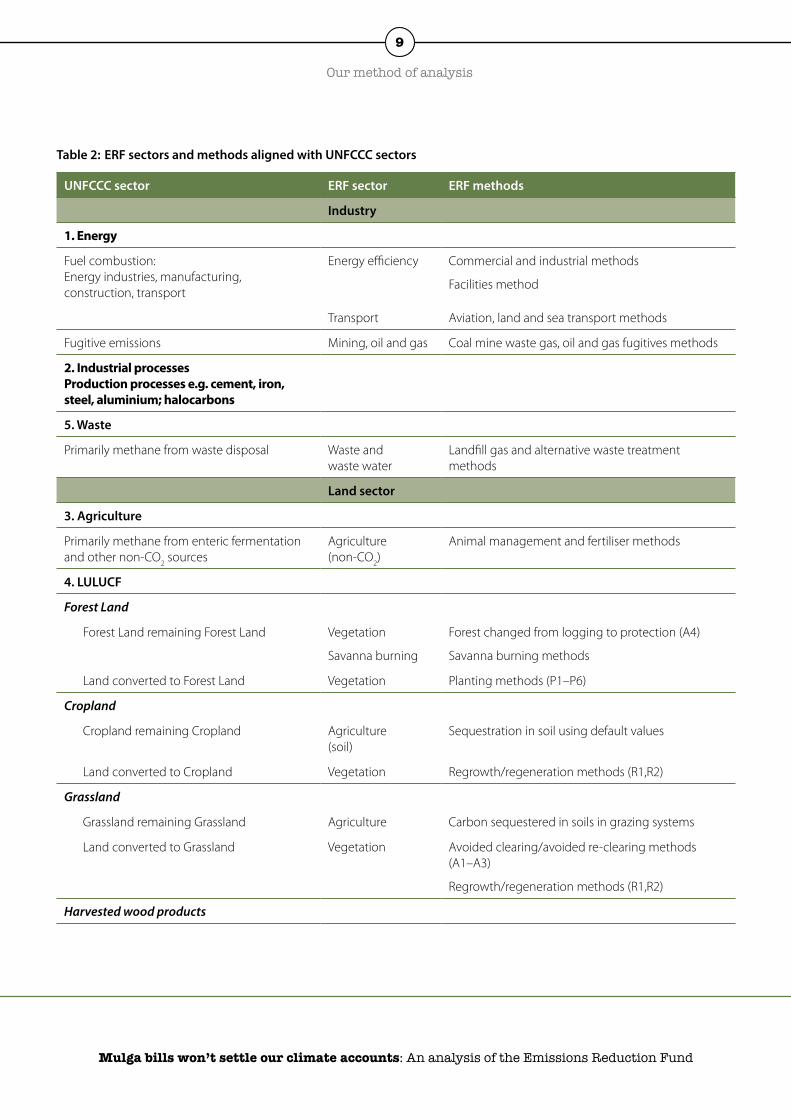
Each year Australia prepares a National Inventory Report of greenhouse gas emissions in accordance with the UNFCCC accounting framework (http://environment.gov.au/climate-change/greenhouse-gas-measurement/publications/national-inventory-report-2014-revised). By aligning ERF methods with the sectors used in the UNFCCC accounts we can compare ERF abatement with current and projected emissions (Table 2). This is relatively straightforward for ERF Industry methods.
In the Land sector, ERF Agriculture methods are split into two groups: methods for reducing methane and other non-CO2
emissions which are assigned to the UNFCCC Agriculture sector; and soil carbon sequestration which comes under the UNFCCC Land Use, Land-Use Change and Forestry (LULUCF) sector. LULUCF and ERF vegetation methods use the same definition of ‘forest’, making them broadly comparable. However Australia’s UNFCCC inventories report net emissions while the ERF provides disaggregated data because its methods separately cover either avoided emissions or removals (of greenhouse gases from the atmosphere), not both.
The most recent UNFCCC National Inventory Report covers calendar year 2014. The government has also prepared estimates of projected net emissions for Australia to 2035; these include land sector projections in accordance with the UNFCCC accounting framework (Commonwealth of Australia 2015).
9
Mulga bills won’t settle our climate accounts: An analysis of the Emissions Reduction Fund
Our method of analysis
9
Table 2: ERF sectors and methods aligned with UNFCCC sectors
UNFCCC sector ERF sector ERF methods
Industry
1. Energy
Fuel combustion: Energy industries, manufacturing, construction, transport
Energy efficiency Commercial and industrial methods
Facilities method
Transport Aviation, land and sea transport methods
Fugitive emissions Mining, oil and gas Coal mine waste gas, oil and gas fugitives methods
2. Industrial processes Production processes e.g. cement, iron, steel, aluminium; halocarbons
5. Waste
Primarily methane from waste disposal Waste and waste water
Landfill gas and alternative waste treatment methods
Land sector
3. Agriculture
Primarily methane from enteric fermentation and other non-CO2 sources
Agriculture (non-CO2)
Animal management and fertiliser methods
4. LULUCF
Forest Land
Forest Land remaining Forest Land Vegetation
Savanna burning
Forest changed from logging to protection (A4)
Savanna burning methods
Land converted to Forest Land Vegetation Planting methods (P1–P6)
Cropland
Cropland remaining Cropland Agriculture (soil)
Sequestration in soil using default values
Land converted to Cropland Vegetation Regrowth/regeneration methods (R1,R2)
Grassland
Grassland remaining Grassland Agriculture Carbon sequestered in soils in grazing systems
Land converted to Grassland Vegetation Avoided clearing/avoided re-clearing methods (A1–A3)
Regrowth/regeneration methods (R1,R2)
Harvested wood products

10
Mulga bills won’t settle our climate accounts: An analysis of the Emissions Reduction Fund
10
Results
ERF compared with Australia’s emissions
The profile of abatement bought through the ERF is totally different from that of Australia’s greenhouse gas emissions (Table 3). In 2014 (the most recent data), more than 80% of Australia’s emissions came from industry, primarily from burning fossil fuels, with the land sector making up the balance. The ERF is exactly the reverse—80% of abatement has been contracted from the land sector and only 20% from industry.
If Waste emissions are excluded, the mismatch is even greater—Energy and Industrial Processes accounted for 84% of Australia’s 2014 emissions but only 4% of ERF abatement.
Mulga Acacia aneura near Hughenden, Queensland
The profile of abatement bought
through the ERF is totally different from
that of Australia’s greenhouse gas
emissions
“
“
Photo credit: CC by attribution—Flickr, djpmapleferryman

11
Mulga bills won’t settle our climate accounts: An analysis of the Emissions Reduction Fund
Results
11
Table 3: Australia’s 2014 net emissions compared with ERF abatement contracted up to 31 August 2016. Positive numbers are emissions, negative numbers are removals of greenhouse gases from the atmosphere
UNFCCC sector Net emissions 2014*
(Mt CO2-e)
ERF sector Abatement
(Mt CO2-e)**
Industry
1. Energy
Fuel combustion 367.5 Energy efficiency -4.2
Transport -1.2
Fugitive emissions 38.1 Mining, oil and gas -0.8
2. Industrial processes 32.4
5. Waste 12.0 Waste and waste water -21.8
Total industry 450.0 -28.0
Land sector
3. Agriculture 72.4 Agriculture (non CO2)
-0.9
4. LULUCF
Forest Land
Forest land remaining Forest Land -16.80 Savanna burning
Vegetation ( method A4)
-7.9
-1.0
Land converted to Forest Land -7.30 Vegetation (methods P1–P6) -5.9
Cropland
Cropland remaining Cropland -1.4 Agriculture (soil) 0
Land converted to Cropland 5.8 Vegetation
Grassland
Grassland remaining Grassland -7.7 Agriculture (soil) -7.8
Land converted to Grassland 31.0 Vegetation (methods A1–A3)
Vegetation (methods R1, R2)
-25.1
-66.4
Harvested wood products -2.9
Total LULUCF (net) 0.7 Total land sector -114.1
Total Agriculture LULUCF 73.1 -115.0
Total emissions 523.1 Total abatement 143.3
*Source AGEIS
**Contracted for delivery over periods of 3 to 10 years from 2015 and 2016
12
Mulga bills won’t settle our climate accounts: An analysis of the Emissions Reduction Fund
Results
12
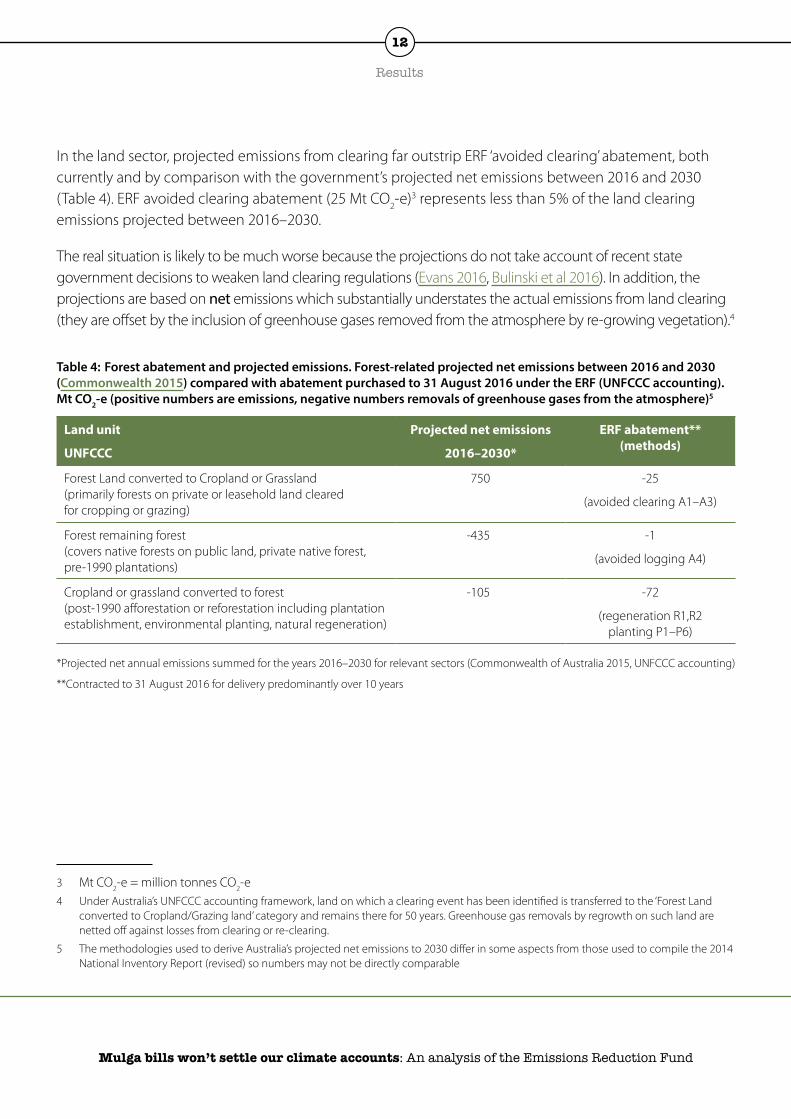
In the land sector, projected emissions from clearing far outstrip ERF ‘avoided clearing’ abatement, both currently and by comparison with the government’s projected net emissions between 2016 and 2030 (Table 4). ERF avoided clearing abatement (25 Mt CO2-e)3 represents less than 5% of the land clearing emissions projected between 2016–2030.
The real situation is likely to be much worse because the projections do not take account of recent state government decisions to weaken land clearing regulations (Evans 2016, Bulinski et al 2016). In addition, the projections are based on net emissions which substantially understates the actual emissions from land clearing (they are offset by the inclusion of greenhouse gases removed from the atmosphere by re-growing vegetation).4
Table 4: Forest abatement and projected emissions. Forest-related projected net emissions between 2016 and 2030 (Commonwealth 2015) compared with abatement purchased to 31 August 2016 under the ERF (UNFCCC accounting). Mt CO2-e (positive numbers are emissions, negative numbers removals of greenhouse gases from the atmosphere)5
Land unit
UNFCCC
Projected net emissions
2016–2030*
ERF abatement** (methods)
Forest Land converted to Cropland or Grassland (primarily forests on private or leasehold land cleared for cropping or grazing)
750 -25
(avoided clearing A1–A3)
Forest remaining forest (covers native forests on public land, private native forest, pre-1990 plantations)
-435 -1
(avoided logging A4)
Cropland or grassland converted to forest (post-1990 afforestation or reforestation including plantation establishment, environmental planting, natural regeneration)
-105 -72
(regeneration R1,R2 planting P1–P6)
*Projected net annual emissions summed for the years 2016–2030 for relevant sectors (Commonwealth of Australia 2015, UNFCCC accounting)
**Contracted to 31 August 2016 for delivery predominantly over 10 years
3 Mt CO2-e = million tonnes CO2-e4 Under Australia’s UNFCCC accounting framework, land on which a clearing event has been identified is transferred to the ‘Forest Land
converted to Cropland/Grazing land’ category and remains there for 50 years. Greenhouse gas removals by regrowth on such land are netted off against losses from clearing or re-clearing.
5 The methodologies used to derive Australia’s projected net emissions to 2030 differ in some aspects from those used to compile the 2014 National Inventory Report (revised) so numbers may not be directly comparable

13
Mulga bills won’t settle our climate accounts: An analysis of the Emissions Reduction Fund
Results
13
Vegetation by numbers
Sector and location
Vegetation projects account for 69% of all carbon credits purchased by the government. More than 75% of these (over half of total ERF contracted abatement) have been supplied by just two bioregions6 in south-western Queensland and western NSW—the Mulga Lands and the Cobar Peneplain (Table 5a, b; Maps1, 2). These dry inland plains are dominated by mulga,7 a long-lived shrub or small tree native to arid zones across Australia.
Most other contracted projects are also in Queensland and NSW close to the Mulga Lands and Cobar Peneplain bioregions. Victoria has three contracted projects all covering the same land parcel, and there is one contracted project in Tasmania, one in SA and a handful in WA.
The value of contracted vegetation projects is over $1.2 billion of which $1 billion is committed to projects in and around the mulga bioregions.8 On a per hectare basis, we estimated the average cost for all contracted vegetation projects to be $225 per hectare compared with $195 in the mulga bioregions.
Table 5a: Sector and location of registered projects
Vegetation methods
All sectors Land sector AustraliaMulga/Cobar
Peneplain
Registered projects 631 445 343 224
Project area (Million ha) 6.9 5.7
Table 5b. Sector, location and value of contracted projects
Vegetation methods
All sectors Land sector AustraliaMulga/Cobar
Peneplain
Registered projects 348 248 185 159
Project Area (Million ha) 5.3 4.6
Contracted carbon credits (Mt CO2-e) 143.0 114.8 98.5 74.5
Contract value ($billion) $1.7 $1.4 $1.2 $0.9
$/ha (average) $225 $195
6 Bioregions are broad landscape scale biogeographical classifications of the land surface. There are 89 bioregions covering Australia (IBRA 7). For a description of the Mulga Lands and Cobar Peneplain bioregions see Attachment 2
7 Acacia aneura
8 Cost estimates throughout are based on the average price of abatement in the three auctions conducted in April 2015, November 2015 and April 2016 by the Regulator—$12.10 per Mt CO2-e

14
Mulga bills won’t settle our climate accounts: An analysis of the Emissions Reduction Fund
Results
14
Map 1: Vegetation projects and Australia’s bioregions

15
Mulga bills won’t settle our climate accounts: An analysis of the Emissions Reduction Fund
Results
15
Map 2: Registered projects (purple) and contracted projects (yellow) in and around the Mulga Lands and Cobar Peneplain

16
Mulga bills won’t settle our climate accounts: An analysis of the Emissions Reduction Fund
Results
16
Methods, permanence and abatement
The number of projects and the proportion with contracts varies markedly by method. The largest number of projects are for native forest regeneration but the most successful at obtaining a contract are avoided clearing projects—92% of avoided clearing, 63% of regeneration but only 13% of planting projects have been contracted (Table 6). Of the 98 million contracted vegetation carbon credits, 66 million are for regeneration methods, 26 million for avoided clearing and 6 million for planting (4 million of these relate to the WA Goldfields Renewal Forest Regeneration Project ERF103442).
Nearly all contracted projects for avoided clearing opted for a 100 year permanence period. More than 40% of contracted regeneration projects are for 25 years only (48 out of 115), as are 64% of planting projects (7 out of 11). The latter includes one very large WA project (Goldfields Renewal).
In terms of contracted abatement, as opposed to numbers of projects, 35% of vegetation abatement (close to 25% of all abatement) has a ‘permanence’ period of only 25 years.
Most contracts are quite small (average around 0.5 Mt CO2-e usually delivered over 10 years).
Table 6: ERF vegetation methods compared by projects, contracts, permanence and abatement
Vegetation Methods Permanence
Registered projects Contracted projects
Number* NumberCarbon credits
(Mt CO2-e)Estimated area
(‘000 ha)Abatement (t CO2-e/ha)
Avoided clearing A1–4
25 years 4 3 1.3 53
100 years 56 52 24.6 844
Total 60 55 25.9 898 28.8
Regeneration R2, R2
25 years 79 48 27.8 1775
100 years 103 67 38.7 2111
Total 182 115 66.4 3,886 17.1
Planting P1–6
25 years 17 7 5.7 530
100 years 70 4 0.2 10
Total 87 11 5.9 541 10.9
ALL
25 years 100 58 34.7 2359
100 years 229 123 63.5 2966
TOTAL 329 181 98.2 5,325 18.4
* in April 2015, November 2015 and April 2016

17
Mulga bills won’t settle our climate accounts: An analysis of the Emissions Reduction Fund
Results
17
Contractors
A small group of contractors account for over half of all vegetation contracts, over half the area of projects under contract and 80% of contracted vegetation abatement. One company—Terra Carbon—is responsible for 40% of vegetation contracts, 30% of the area under contract and 54% of all vegetation abatement. No other contractor comes close: Corporate Carbon Solutions manages 13% of vegetation abatement, and three other companies have 4–5 % each.
Applying the average auction price ($12.10 per carbon credit) Terra Carbon is managing contracts with an estimated value of around $640 million (one-quarter of the $2.55 billion ERF fund).
Table 7: Vegetation contracts by participant and contractor
Company Participant Contractor Contracts
Registered projects*
Contracted projects
Area ‘000 ha
Abatement Mt CO2-e
% total veg abatement
Corporate Carbon Solutions Pty Ltd 8 11 2544 12.3 13
Devine Agribusiness Carbon Pty Ltd 17 17 204 3.7 4
Goldfields Carbon Group Pty Ltd 1 1 488 4.0 4
Paniri Ventures Pty Ltd 2 2 249 4.7 5
Terra Carbon Pty Ltd 47 71 1,660 52.8 54
Sub-total (these contractors) 75 102 2,855 77.5 80
Total (vegetation projects) 329 181 5,325 98.2
* Excludes 12 projects with location suppressed, 2 with maps not available
We note these facts not with a view to criticising any of the companies involved, but rather to draw attention to the risk inherent in such concentration of ownership and responsibility.
18
Mulga bills won’t settle our climate accounts: An analysis of the Emissions Reduction Fund
18
ERF outcomes to date
The ERF was intended to purchase ‘genuine emission reductions’ at least cost and make a ‘real and additional’ contribution to reducing Australia’s greenhouse gas emissions, including helping to meet Australia’s 2020 emissions reduction target (Commonwealth of Australia 2014).
Effort mis-directed
Clearly the ERF is failing the test of making a ‘real and additional’ contribution to reducing Australia’s emissions. It has made no significant contribution to reducing fossil fuel emissions that make up the bulk of Australia’s emissions because the great majority of its funding has been directed to the land sector and waste landfill projects.9 Nor, despite expenditure of over $300 million on ‘avoided clearing’, has it made any effective contribution to reducing emissions from land clearing which continues apace. The additionality and permanence of many contracted projects is also questionable. For example, landfill projects which account for over $250 million in carbon credits are a carry-over from the original Carbon Farming Initiative and many have a private incentive to operate regardless of ERF funding (Burke 2016).
One-quarter of all contracted abatement is by definition not ‘permanent’, with participants having opted for a 25-year permanence period. In the Mulga Lands, where mulga is used for fodder and often re-cleared every 15 years to maintain pasture (Fensham et al 2012), 25 year ‘permanence’ may represent little more than the deferral of one clearing cycle. Carbon credits generated by these projects will represent shorter and shorter sequestration periods as projects approach their end dates, but will still be treated as equivalent to genuinely permanent abatement from other sectors.
Projects with a nominated 100-year permanence period face high risks of failure. Unlike industry projects where a switch from fossil fuels to a cleaner alternative is usually permanent, forests and their associated carbon stocks need ongoing management to assure their permanence. Management is the responsibility of the ERF participant, or of new landholders if the land changes hands, but all the income is front-loaded. Contracted abatement is paid out over a maximum of 10 years and carbon credits can be created only in the project’s early years during the crediting period, usually 25 years. There does not appear to be any provision for long-term auditing or for assuring the quality of management, for example to check whether the forest is regenerating and will still exist in 100 years.
9 In October the Regulator began ‘market sounding’ aimed at attracting abatement from large industrial facilities outside the auction process

19
Mulga bills won’t settle our climate accounts: An analysis of the Emissions Reduction Fund
ERF outcomes to date
19
The relatively new industry that has sprung up around the ERF carries its own risks. Intermediary companies recruit landholders into aggregated projects or manage contracts on behalf of individual landholders (see Table 7). There is potential for market monopolisation, management failure, fraud and exploitation of landholders. Concentration of funds to a single provider for 25–100 year delivery carries risks of failure if their methods are not successful or the company dissolves.
Projects themselves need not be permanent. They can be voluntarily revoked by relinquishing as many carbon credits as have been issued; the compensatory carbon credits need not come from the land sector.
Registration of a project or receipt of a contract carries no obligations beyond the project area. Participants can clear other land without restriction and ERF payments could facilitate landholders acquiring and clearing other land.
A mulga bonanza
The singular focus on buying the cheapest abatement coupled with the inherent complexity of the ERF has produced a bonanza for the mulga. Individual landholders face barriers to entry because of the resources and technical expertise required to participate in the scheme. One company has overcome these barriers by systematically aggregating projects and contracts across the region to such an extent that they have secured nearly 40% of all abatement. Their role has been crucial in mediating the way the ERF has evolved. Vegetation projects are cheap but on a per hectare basis the prices being paid for carbon credits are extraordinary compared with land values.
Idalia National Park, Queensland Mulga Lands
The ERF … has made no significant
contribution to reducing fossil fuel emissions
that make up the bulk of Australia’s
emissions …
“
“
Photo credit: Idalia National Park from Bushcare: A Citizen’s Audit by Des Hoban

20
Mulga bills won’t settle our climate accounts: An analysis of the Emissions Reduction Fund
ERF outcomes to date
20
We estimate that avoided deforestation contracts are creating nearly 30 carbon credits per hectare and regeneration contracts 17 carbon credits per hectare which translates to over $360 per hectare for avoided deforestation and $205 per hectare for regeneration. For comparison, median farmland values in 2015 based on sales in the mulga regions were $78 per hectare (Cobar Shire), $58 per hectare (Paroo Shire) (Rural Bank 2016). In 2002 they were as low as $4.31 per hectare (average Cobar Peneplain Bioregion) (ACRIS 2007). Two conclusions can be drawn—the government has probably paid more than it need have for the carbon credits; and there is room for their price to fall further.
Two other consequences flow from the design of the ERF. First, in climate terms, the quality of the mulga abatement is low. Mulga-dominated ecosystems grow on drier land with inherently low carbon carrying capacity and slow growth rates compared with wetter forests (e.g. Fensham et al 2012, Peeters and Butler 2014). Even after 100 years, carbon stocks in these ecosystems will be quite low on a per hectare basis.
Secondly, the abatement carries high cumulative risks because it is concentrated in a region prone to drought and vulnerable to other risks (including from climate change itself ) while simultaneously adding the risk from placing millions of dollars with a limited number of providers in an emerging industry.
The same amount of money spent in a more strategic way could have achieved much more for the climate and nature.
Not helping much towards 2020 targets
The government projects a contribution of 92 Mt CO2-e from the ERF towards meeting its 2020 target (Department of the Environment 2016). On a pro rata basis, carbon credits from non-vegetation projects might deliver 32 Mt CO2-e by 2020 (assuming credits are delivered equally during the first five years of the seven-year contracts that apply to most). The balance would have to come from vegetation projects.
It is extremely doubtful that ERF vegetation projects will deliver 60 Mt CO2-e of additional abatement by 2020. Many avoided clearing projects may not be additional. For regeneration projects, it is likely that much of the contracted abatement is on land managed on a 15 year clearing cycle because the methods require regeneration to come from in situ rootstocks and the like. Regrowth on this land would become additional only 15 years after the last clearing (post-2020 in most cases).
Conclusion
In terms of tackling climate change, a large proportion of the expenditure on vegetation projects has been wasted because the abatement is not additional or permanent and funds contracted have been greatly in excess of land values. The concentration of projects in the mulga regions and the high proportion of contracts awarded to a single provider carry high risks.
21
Mulga bills won’t settle our climate accounts: An analysis of the Emissions Reduction Fund
21
A foundation for climate action?
The Climate Change Authority has recommended that the ERF should be extended and expanded with both additional government funding and access to industry funding via stronger safeguards and trading (Climate Change Authority 2016). We evaluate this proposition.
Land sector—no ‘safeguard’
Clearing is regulated by the states/territories and the Commonwealth has not asserted a role beyond its specific legislative responsibilities under the Environment Protection and Biodiversity Conservation Act 1999 for matters of national environmental significance. There is neither a comprehensive national policy framework for landscape carbon nor a legislated ‘safeguard’ equivalent to that which applies to industry where large emitters are required to keep emissions within baseline levels.
Extending and expanding the ERF would be expensive, would not lead to systemic change, and without Commonwealth intervention the states could subvert the effort by loosening clearing controls or expanding native forest logging (e.g. Bulinski et al 2016, Evans 2016). The potential supply of landscape credits in natural and semi-natural ecosystems is large (Ajani and Comisari 2014), limited primarily by the availability of approved ERF methods. If the ERF is re-financed, new methods are likely to be drawn forward enlarging the pool of cheap potential credits.
If the government continues to purchase ERF abatement through auctions, the contribution to meeting Australia’s greenhouse targets is likely to be small. If the ERF is opened up to trading by tightening safeguards on industry emissions but leaving access to offsets in the land sector more or less unlimited, the land sector will turn into a credit-generating tool for companies choosing to buy credits rather than reduce pollution, while little or nothing is done to benefit the climate.
As energy emissions reduce in the coming decade, the relative importance of land sector emissions will increase (Hamilton and Karoly 2016). Experience with the ERF to date shows that in the absence of harmonised Commonwealth and state policies and regulation to protect existing carbon stocks (and other values) of native vegetation, much ERF land sector funding is wasted and the outcomes less than optimal for either climate change or biodiversity.

22
Mulga bills won’t settle our climate accounts: An analysis of the Emissions Reduction Fund
A foundation for climate action?
22
Accounts conceptually flawed
The ERF treats landscape carbon stocks as no different from fossil carbon stocks. This is conceptually wrong. Fossil carbon stocks are essentially inert until mined and burnt while landscape carbon cycles actively between the land and the atmosphere in an environmentally regulated balance. While losses of some landscape carbon stocks can be reversed over time by allowing vegetation to re-grow, this cannot compensate for ongoing, effectively permanent, loss of fossil carbon stocks (Ajani et al 2013, Steffan et al 2016).
Carbon credits created by protecting or regenerating native forests require ongoing management to sustain the associated carbon stocks, but the ERF only funds projects in their early years. Compared with industry-based projects the risk of loss is higher. In addition, estimates of land sector emissions have much higher uncertainty than fossil fuel emissions, not least because facility-specific measurements are now available for large emitters while land sector estimates are modelled (http://environment.gov.au/climate-change/greenhouse-gas-measurement/publications/national-inventory-report-2014-revised).
Integrating biodiversity and climate policies
Conserving both biodiversity and carbon stocks in the landscape on a continental scale are mutually reinforcing objectives. Both depend on long-term management of biodiverse natural ecosystems so they are resilient and more likely to persist and accumulate large carbon stocks in soils and plants (Ajani et al 2013). The accumulation of large carbon stocks over time is particularly important; the stock of carbon in a mature forest ecosystem is multiples of that in young re-growing vegetation.
The ERF is narrowly focused on carbon outcomes and its structure and rules to a large degree eliminate the potential for designing in co-benefits:
• biodiversity is not part of the methods or the contracts (except insofar as the methods apply specifically to native forest);
• the ‘newness’ requirement prevents land already managed for conservation voluntarily or under covenant from being eligible. This includes most public land;
• the ‘additionality’ requirement means land that cannot legally be cleared is ineligible; and
• the crediting period of 25 years and the contract period of 10 years restricts income-earning capacity to the early stages of a 100-year permanence period while the management obligations remain for the duration.
This is not to say that biodiversity does not benefit from the ERF; rather that Australia needs policies designed to protect and fund both biodiversity and climate protection for the long term on a continental scale.

23
Mulga bills won’t settle our climate accounts: An analysis of the Emissions Reduction Fund
A foundation for climate action?
23
Conclusion
The ERF is not a sound basis for an effective climate policy. Not only is it prohibitively expensive, it is ineffectual because it is operating in a policy vacuum with respect to landscape carbon. The land sector lacks both a ‘safeguard’ mechanism and the means to ensure genuine additionality and permanence.
The Paris Agreement, which Australia has signed, commits to keeping average global temperature rise from pre-industrial times below 2°C and to pursue efforts to limit it to 1.5°C. We will not achieve targets commensurate with the Agreement unless there is concerted national action in the land sector, both to prevent losses from clearing and logging and to rebuild carbon stocks across the continent.
Mulga woodlands
The ERF is not a sound basis for an effective climate policy. Not only
is it prohibitively expensive, it is
ineffectual because it is operating in a
policy vacuum with respect to landscape
carbon.
“
“
Photo credit: Acacia woodlands from Bushcare: A Citizen’s Audit by Des Hoban

24
Mulga bills won’t settle our climate accounts: An analysis of the Emissions Reduction Fund
24
Attachments
Attachment 1. Analysis details
Data from the ERF Project Register, Contract Register and Mapping files were downloaded, combined then analysed. The steps were to:
1. download the ERF project mapping files, named according to the project title, to QGIS (a free and open source geographic information system);
2. apply a common Coordinate Reference System (CRS) GDA94, EPSG:4283;
3. add the project ID to the attribute table for each project map;
4. using QGIS, convert the mapping files to GDA94/Australian Albers (EPSG:3577) and measure the area for each project;
5. check the area measurements (see below);
6. download the Project Register, remove non-vegetation projects and simplify the data by replacing words with abbreviations;
7. categorise the vegetation methods into three groups (Table 1);
8. download the Contract Register, remove non-vegetation projects and simplify the data by replacing words with abbreviations;
9. using QGIS, combine selected data from the Project Register, Contract Register and maps using the project ID as the common reference;
10. download the attribute table as an excel file for analysis and checking; and
11. compare the project and contract maps with bio-regional maps.
We encountered some data inconsistencies including:
• mapping files use varying CRS;
• some maps are filed in the wrong state list;
• a number of projects, including apparently unrelated projects, occupy the same or partially overlapping areas; and
• shape files are structured in different ways which affects the results returned for area measurements.
25
Mulga bills won’t settle our climate accounts: An analysis of the Emissions Reduction Fund
Attachments
25
Area estimates—data issues
The ERF has defined two types of areas within projects: carbon estimation areas and exclusion zones (see Glossary). For the purposes of this analysis, we assume the provided shape files reflect the project and its carbon estimation areas. However, it is not clear whether a project occupies the entire mapped area or is simply contained within the mapped outline.
While calculating areas was straightforward for most projects, some shapefiles were structured in ways that caused areas to be double-counted in whole or in part in QGIS. For example, Sunset Ranch (EOP100278) has two mapped features which are duplicated causing the project area to be double-counted. QGIS generated area measurements were checked against earlier area estimates made for contracted projects (using arcGIS explorer). Where areas appeared incorrect, a corrected estimate was substituted for the QGIS measurement. In other cases, the QGIS generated area result was compared with a hand-estimate to check if the number was of the right order of magnitude; if not, a corrected area was estimated and substituted for the QGIS measurement. Where more than one project is mapped at the same location they have been treated as if they were separate locations (e.g. Yaloak Estate has five projects in the same project area (EOP101118–EOP101122).
Project areas should be regarded as estimates rather than precise measurements as should calculations based on these areas. The fact that some projects occupy the same or overlapping areas means that the total area actually occupied by projects is less than we estimate.
Other data checks
The number of projects and contracts were checked against the Regulator’s figures and interactive map, suppressed projects identified, and project names updated where they had changed. One map appears to be missing (Granville Forest Regeneration Project ERF103118); one could not be downloaded (Western Farm Trees EOP101162).
26
Mulga bills won’t settle our climate accounts: An analysis of the Emissions Reduction Fund
Attachments
26
Attachment 2. Bioregions
Mulga Lands
The Mulga Lands occupy the northern Murray Darling Basin in NSW and south-west Queensland. They are characterised by flat to undulating plains with strips of low hills. The dominant vegetation types are mulga and eucalypt woodlands. The alluvial floodplains of the Warrego River run through the middle in a widening north-to-south wedge. Tenure is a mix of leasehold and freehold land grazed by sheep and cattle (The Mulga Lands).
Cobar Peneplain
The Cobar Peneplain, situated in central NSW, has dominant native vegetation types of poplar box, mulga and white cypress pine woodlands on rolling downs and plains. A large area is rangeland, where land tenure is predominantly leasehold, and land use is largely sheep and goat grazing with some cattle production, though dryland cropping is also important on its eastern margins. The eastern part of the bioregion has freehold title and has largely been cleared for cereal cropping (Cobar Peneplain Bioregion).
27
Mulga bills won’t settle our climate accounts: An analysis of the Emissions Reduction Fund
27
Glossary
We have described some key terms here, but relevant public sector glossaries include:
http://www.cleanenergyregulator.gov.au/About/Pages/Glossary.aspx
http://www.climatechangeauthority.gov.au/glossary-0
https://www.environment.gov.au/system/files/resources/19669cb8-3dfa-4cb3-ab83-82a1f6d6f9a5/files/cfi-mapping-guidelines.pdf (pages 3–4)
Australian Carbon Credit Unit (ACCU): represents one tonne of carbon dioxide equivalent (t CO2-e) stored or avoided by a project. It is issued by the Clean Energy Regulator and registered in the Australian National Registry of Emissions Units.
Additionality: the assurance that emission reductions would not have occurred in the absence of the policy. In the ERF, methods must meet integrity standards including that the abatement ‘is unlikely to occur in the ordinary course of events’. Projects must be new (‘newness requirement’) and not be required to be undertaken under other laws (‘regulatory additionality’).
Aggregation: bringing multiple sources of carbon abatement together either by aggregating projects that use the same method or bundling contracts into a single bid at auction (can include projects using different methods).
Australian National Registry of Emissions Units (ANREU or the Register): The registry in which ACCU transactions take place. A seller must have an ANREU account to participate in the ERF.
Audit reports: required for registered projects. The Regulator uses a risk-based approach to determine how often they are needed and what they will include. They must be arranged, and paid for, by the proponent and undertaken by a registered greenhouse and energy auditor.
Baseline and credit scheme: a trading scheme that sets an emissions baseline for companies; they receive credits when emissions are less than the baseline and pay when they exceed the baseline.
Carbon Estimation Area (CEA): refers to an area within the project area on which carbon is stored, the project mechanism is undertaken and for which abatement(ACCUs) are calculated. It may consist of multiple parts.

28
Mulga bills won’t settle our climate accounts: An analysis of the Emissions Reduction Fund
Glossary
28
Carbon Farming Initiative (CFI): emissions offset scheme preceding the ERF that credited emissions reductions from sources that were not covered by the carbon pricing mechanism in 2011. CFI projects and methods have been transitioned to the ERF.
Carbon maintenance obligation: a requirement for landowners (including subsequent owners) to maintain carbon stocks at or above a benchmark level unless a required number of carbon credits are relinquished.
Clearing consent: an approval issued by a government or regulatory authority that permits the clearing of forest that would otherwise be protected.
Clean Energy Regulator (Regulator): The agency responsible for the administration of the ERF, including registers, auctions and contracts.
Contract, contract period: standardised sale and purchase agreement that obligates the seller to deliver a quantity of ACCUs to the Commonwealth who will purchase those ACCUs at the contracted price over a set delivery schedule for the contract’s duration. It is not an agreement for the delivery of a project or for delivering ACCUs derived from a specific project; obligations to deliver ACCUs under the contract may be met from any source. Most contracts are standard (7–10 years) or short-term (less than 7 years). ACCUs issued for a project after the maximum contract duration has passed, may be sold on the secondary market. For details see Carbon Abatement Contracts.
Crediting period: the defined period of time over which a project can create ACCUs. A project can have only one. Generally, for emissions reduction projects it is seven years and for carbon storage projects, 25 years; avoided deforestation, method A2 is for 15 years. If a project’s crediting period is longer than the contract, ACCUs can continue to be created until the crediting period ends.
Delivery period/Schedule: part of the contract specifying the schedule for delivery of ACCUs; frequency and timing of reporting will be governed by this schedule.
Delivery terms: the total quantity of ACCUs to be delivered under the contract; the contract period; the dates that ACCUs are to be delivered; and the quantity of ACCUs to be delivered by those dates.
Eligible land/Baseline period: are terms used within different ERF methods. See individual methods for details.
Exclusion zones: areas of land within the project area that do not contribute to abatement, e.g. around dams or along roads.
Expiry date: the end of the Delivery Period.

29
Mulga bills won’t settle our climate accounts: An analysis of the Emissions Reduction Fund
Glossary
29
Fugitive emissions: intentional or unintentional release of greenhouse gases that occurs during the extraction, processing and delivery of fossil fuels to the point of final use.
FullCam: Full Carbon Accounting Model used to construct Australia’s national greenhouse gas accounts for the land sector. It is available as an online tool.
Mt CO2-e: mega-tonne (a million metric tonnes) of carbon-dioxide equivalent.
Native forest: native vegetation, that is not a plantation, and is dominated by trees that are located within their natural range. It reasonably likely to provide a crown cover of at least 20% and reasonably likely to reach a height of at least 2 metres.
Native vegetation: a mix of trees, shrubs, and understorey species that reflects the structure and composition of the vegetation that is expected to occur naturally in an area. The mix will be related to the location and characteristics of the area (e.g. soil type, topography, land-use history).
Permanence period: the length of time a registered sequestration project must maintain carbon stores, either 25 or 100 years. For sequestration projects selecting 25 years, the number of carbon credits is reduced by 20% to cover potential government costs of replacing carbon stores after the project ends (in addition to the 5% risk of reversal buffer—see below).
If stored carbon declines due to fire or other unexpected disturbances, regrowth must be managed to allow the carbon stock to return to previously reported values. Alternatively, the relevant number of credits can be relinquished. At the end of the permanence period, owners of carbon storage projects regain full land-use flexibility. Anyone buying land can check the Project Register to see whether it is covered by a 25 year or 100 year permanence obligation. More information: Clean Energy Regulator.
Project: an activity or set of activities that meets the eligibility criteria of the Carbon Credits (Carbon Farming Initiative) Act 2011 and achieves emissions reductions consistent with an approved method.
Reforestation Modelling Tool (RMT): estimates carbon sequestration within the tree and debris carbon pools for individual CEAs.
Regeneration: means regrowth of trees from the germination of in situ seed, or the growth of in situ seedlings, rootstock or lignotubers.
Relinquish: in certain circumstances a participant can be required to relinquish ACCUs, that is, return the to the Commonwealth.

30
Mulga bills won’t settle our climate accounts: An analysis of the Emissions Reduction Fund
Glossary
30
Reporting/Reporting period: dates, generally at intervals between 6 months and 5 years, when registered projects are required to report, regardless of whether the Commonwealth is purchasing the carbon credits. For projects with auction contracts, the delivery schedule will govern frequency and timing of reporting.
Risk of reversal buffer: an inbuilt insurance scheme for temporary losses of carbon stores from natural disturbance (e.g. bushfire) and conduct by a third party outside control of participant (e.g. vandalism). Also insures against losses resulting from participant wrongdoing that cannot be remedied. It applies to all sequestration projects and reduces the carbon credits due by 5%.
Safeguard mechanism: ERF provision to ensure that emissions reductions purchased by the government are not offset by significant increases in emissions above business-as-usual levels elsewhere in the economy. It requires large industry emitters to keep emissions within baseline levels.
Scheme participant: the person or persons responsible for carrying out a project.
United Nations Framework Convention on Climate Change (UNFCCC): an international treaty that commits signatory countries (Parties) to stabilise greenhouse gas concentrations in the atmosphere at a level that would prevent dangerous human-induced interference with the climate system. The Paris Agreement negotiated under the Convention came into force on 4 November 2016. UNFCCC.

31
Mulga bills won’t settle our climate accounts: An analysis of the Emissions Reduction Fund
31
References
AGEIS (Australian Greenhouse Emissions Information System). Available from http://ageis.climatechange.gov.au/UNFCCC.aspx
Ajani JI, Comisari, P, 2014 Towards a comprehensive and fully integrated stock and flow framework for carbon accounting in Australia, a Discussion Paper ANU, Canberra, Australia Available from https://coombs-forum.crawford.anu.edu.au/publication/hc-coombs-policy-forum/4708/carbon-accounting-australia
Ajani JI, Keith H, Blakers M, Mackey BG, King HP, 2013 Comprehensive carbon stock and flow accounting: A national framework to support climate change mitigation policy. Ecological Economics 89:61–72 http://dx.doi.org/10.1016/j.ecolecon.2013.01.010
ACRIS, 2007 Australian Collaborative Rangeland Information System, Reporting Change in the Rangelands—2007. NSW Information for the National Report. Available from https://www.environment.gov.au/resource/nsw-reporting-change-rangelands
Bulinski, J, Enright, R and Tomsett, N, 2016 Tree clearing in Australia: it’s contribution to climate change. Report by CO2 Australia for The Wilderness Society Inc. Available from https://www.wilderness.org.au/dozers-need-stop
Burke, PJ, 2016 Undermined by adverse selection: Australia’s direct action abatement subsidies. Economic Papers 35(3): 216–229 http://onlinelibrary.wiley.com/doi/10.1111/1759-3441.12138/full
Clean Energy Regulator, 2016 Auctions Results. Available from http://www.cleanenergyregulator.gov.au/ERF/Auctions-results
Climate Change Authority, 2016 Towards a climate policy toolkit: Special Review on Australia’s Climate Goals and Policies. Available from http://climatechangeauthority.gov.au/reviews/special-review/towards-climate-policy-toolkit-special-review-australias-climate-goals-and
Commonwealth of Australia, 2014 Emissions Reduction Fund White Paper. Available from http://environment.gov.au/climate-change/emissions-reduction-fund/publications/white-paper
Commonwealth of Australia, 2015 Australian Land Use, Land Use-Change and Forestry emissions projections. Available from http://environment.gov.au/climate-change/publications/emissions-projections-2014-15

32
Mulga bills won’t settle our climate accounts: An analysis of the Emissions Reduction Fund
References
32
Commonwealth of Australia, 2016. National Inventory Report 2014 (revised) Volume 1–3. Available from http://environment.gov.au/climate-change/greenhouse-gas-measurement/publications#national
Department of the Environment, 2016 Tracking to 2020—April 2016 Update. Available from http://environment.gov.au/climate-change/publications/factsheet-tracking-to-2020-april-2016-update
Evans, MC, 2016 Deforestation in Australia: drivers, trends and policy responses. Pacific Conservation Biology 22,130–150 http://dx.doi.org/10.1071/PC15052
Fensham, RJ, Fairfax, RJ and Dwyer, JM, 2012 Potential aboveground biomass in drought-prone forest used for rangeland pastoralism. Ecological Applications 22(3), 894–908 http://onlinelibrary.wiley.com/doi/10.1890/11-1123.1/full
Hamilton, C and Karoly, D, 2016. The Climate Change Authority’s special review on Australia’s climate goals and policies: towards a climate policy toolkit. Climate Council. Available from https://www.climatecouncil.org.au/cca-minority-report
Parliament of Australia, Environment and Communications Legislation Committee, 2016. Clean Energy Regulator, Hansard 17 October 2016, pp106–115. Available from http://www.aph.gov.au/Parliamentary_Business/Hansard/Estimates_Transcript_Schedule
Peeters, PJ and Butler, DW, 2014 Mulga: regrowth benefits management guideline. Department of Science, Information Technology, Innovation and the Arts, Brisbane. Available from https://www.qld.gov.au/environment/plants-animals/regrowth-guides/mulga-description/
Rural Bank, 2016 Australian Farmland Values 2015. Vol 1 May 2016 Available from https://www.ruralbank.com.au/news/view/australian-farmland-values-2015
Steffan, W, Fenwick, J and Rice, M, 2016 Land carbon: No substitute for action on fossil fuels. Climate Council of Australia. Available from https://www.climatecouncil.org.au/land-carbon-report
