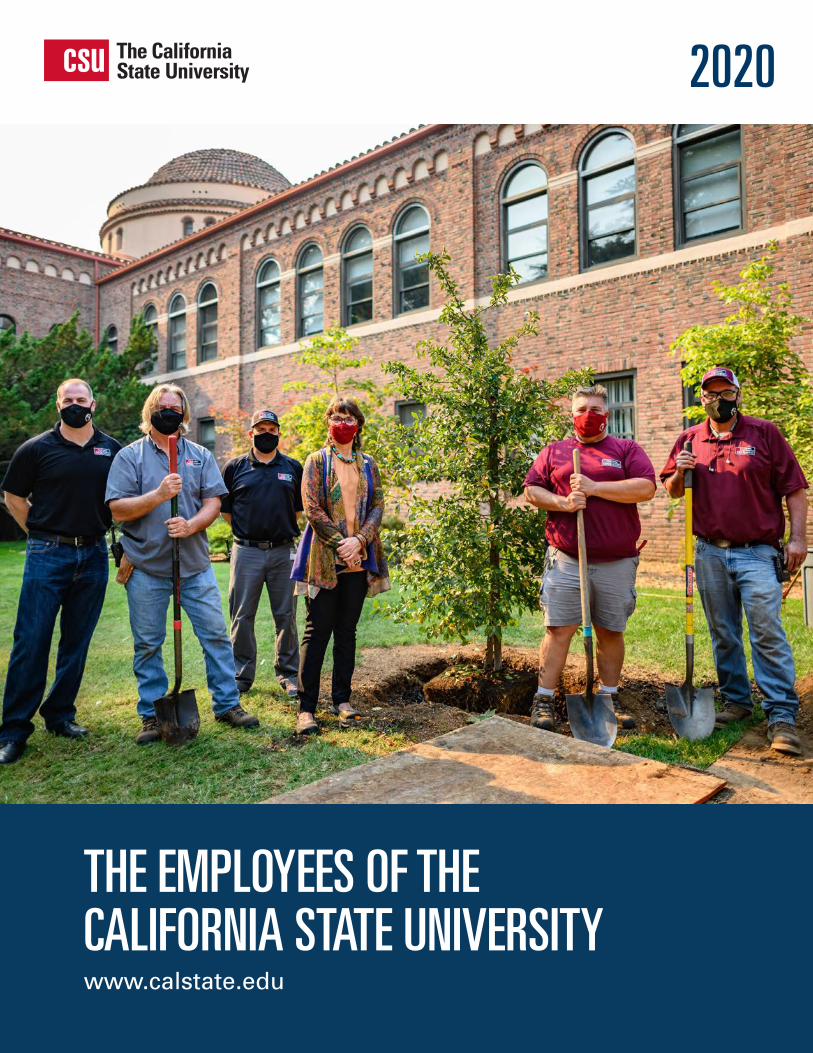
the employees of the california state university
TRANSCRIPT

Dear Friends of the California State University,
The CSU is committed to employing a diverse workforce because our faculty and staff have a vital role in making the mission of the California State University a reality—educating students and preparing them to become leaders in California and beyond. Student success is at the heart of our mission and it is the CSU’s utmost priority to have our students see themselves in our faculty and staff. Our faculty and staff are committed to focusing on initiatives providing students a clearer path to graduation, while also eliminating the achievement gap among underrepresented minority students.
The data reflected in this publication reflects the CSU’s commitment to a diverse workforce. Our faculty and staff diverse and extensive backgrounds and experiences provides our students the opportunity to encounter new perspectives and to succeed in an increasingly connected, global work environment. The value of a CSU education remains strong. As a university, we are well positioned for continued success due largely to the dedication and contributions of employees at all 23 campuses and the Chancellor’s Office.
As in years past, this publication includes notable recent achievements by staff, faculty and student employees. My hope is that in reading the 2020 Employee Profile, you will gain a greater understanding of the people who make the CSU such a special place to work and learn.
Evelyn Nazario Vice Chancellor, Human Resources
THE CALIFORNIA STATE UNIVERSITY.People with purpose... who teach, inspire, discover and do. As the nation’s leading university system, we’ve pushed the boundaries of higher education for 60 years. And through the unprecedented challenges of this past year, the resiliency and unwavering dedication of our workforce remained focused on our mission to serving students, communities and the State of California.
We have the power of purpose, courage and perseverance. The CSU’s workforce is committed and more inspired than ever to uphold our traditions of educational excellence and personal transformation. We celebrate the diversity within the CSU. By consistently fostering greater inclusion and understanding, together we create and provide greater opportunities for our students and valued employees.
Sustaining excellence, today and tomorrow.The spirit of the CSU endures. The university’s continuing commitment to employees and their accomplishments allows us to prepare record numbers of students for their success — for a life of purpose and positive impact on their communities and the world.
32

THE EMPLOYEES OF THECALIFORNIA STATE UNIVERSITYTABLE OF CONTENTSFall 2020
CSU WORKFORCEEMPLOYEES BY EMPLOYEE GROUP AND CAMPUS11 Employee Head Count by Employee
Group, Fall 2020
11 Employee Head Count and Distribution by Employee Group and Time Base, Fall 2018 to Fall 2020
12 Employee Salary Distribution by Employee Group, Fall 2018 to Fall 2020
12 Employee Salary and Head Count Distribution by Collective Bargaining Unit, Fall 2020
13 Employee Head Count and FTE by Campus and Time Base, Fall 2020
13 Employee Head Count by Campus, Employee Group and Time Base, Fall 2020
EMPLOYEES BY GENDER AND RACE/ETHNICITY15 Employee Distribution by Race
Ethnicity and Time Base, Fall 2020
15 Employee Distribution and Head Count by Race/Ethnicity and Time Base, Fall 2020
16 Employee Distribution by Gender and Time Base, Fall 2020
16 Employee Distribution and Head Count by Gender and Time Base, Fall 2020
17 Employee Head Count by Race/Ethnicity, Fall 2016 to Fall 2020
17 Employee Distribution by Race/Ethnicity, Fall 2016 to Fall 2020
17 Employee Head Count by Gender, Fall 2016 to Fall 2020
17 Employee Distribution by Gender, Fall 2016 to Fall 2020
18 Employee Distribution by Race/Ethnicity Within Employee Group, Fall 2020
18 Employee Distribution by Employee Group Within Race/Ethnicity, Fall 2020
19 Employee Distribution by Gender Within Employee Group, Fall 2020
19 Employee Distribution by Employee Group Within Gender, Fall 2020
20 Employee Distribution by Employee Group, Gender, and Race/Ethnicity, Fall 2020
21 Employee Head Count by Employee Group and Race/Ethnicity, Fall 2020 and Fall 2015
AGE DISTRIBUTION OF CSU EMPLOYEES22 Employee Distribution by Employee
Group and Age, Fall 2020
22 Employee Head Count and Distribution by Employee Group and Age, Fall 2020
22 Employee Distribution by Race/Ethnicity and Age, Fall 2020
23 Employee Head Count and Distribution by Race/Ethnicity and Age, Fall 2020
23 Employee Distribution by Gender and Age, Fall 2020
23 Employee Head Count and Distribution by Gender and Age, Fall 2020
CSU FACULTYGENDER AND RACE/ETHNICITY29 Non-Instructional Faculty
Distribution by Race/Ethnicity, Fall 2020
29 Non-Instructional Faculty Distribution by Gender, Fall 2020
30 Non-Instructional Faculty Distribution by Category, Gender, and Race/Ethnicity Fall 2020
30 Instructional Faculty Head Count by Rank and Race/Ethnicity, Fall 2020 and Fall 2015
31 Instructional Faculty Head Count by Rank and Gender, Fall 2020 and Fall 2015
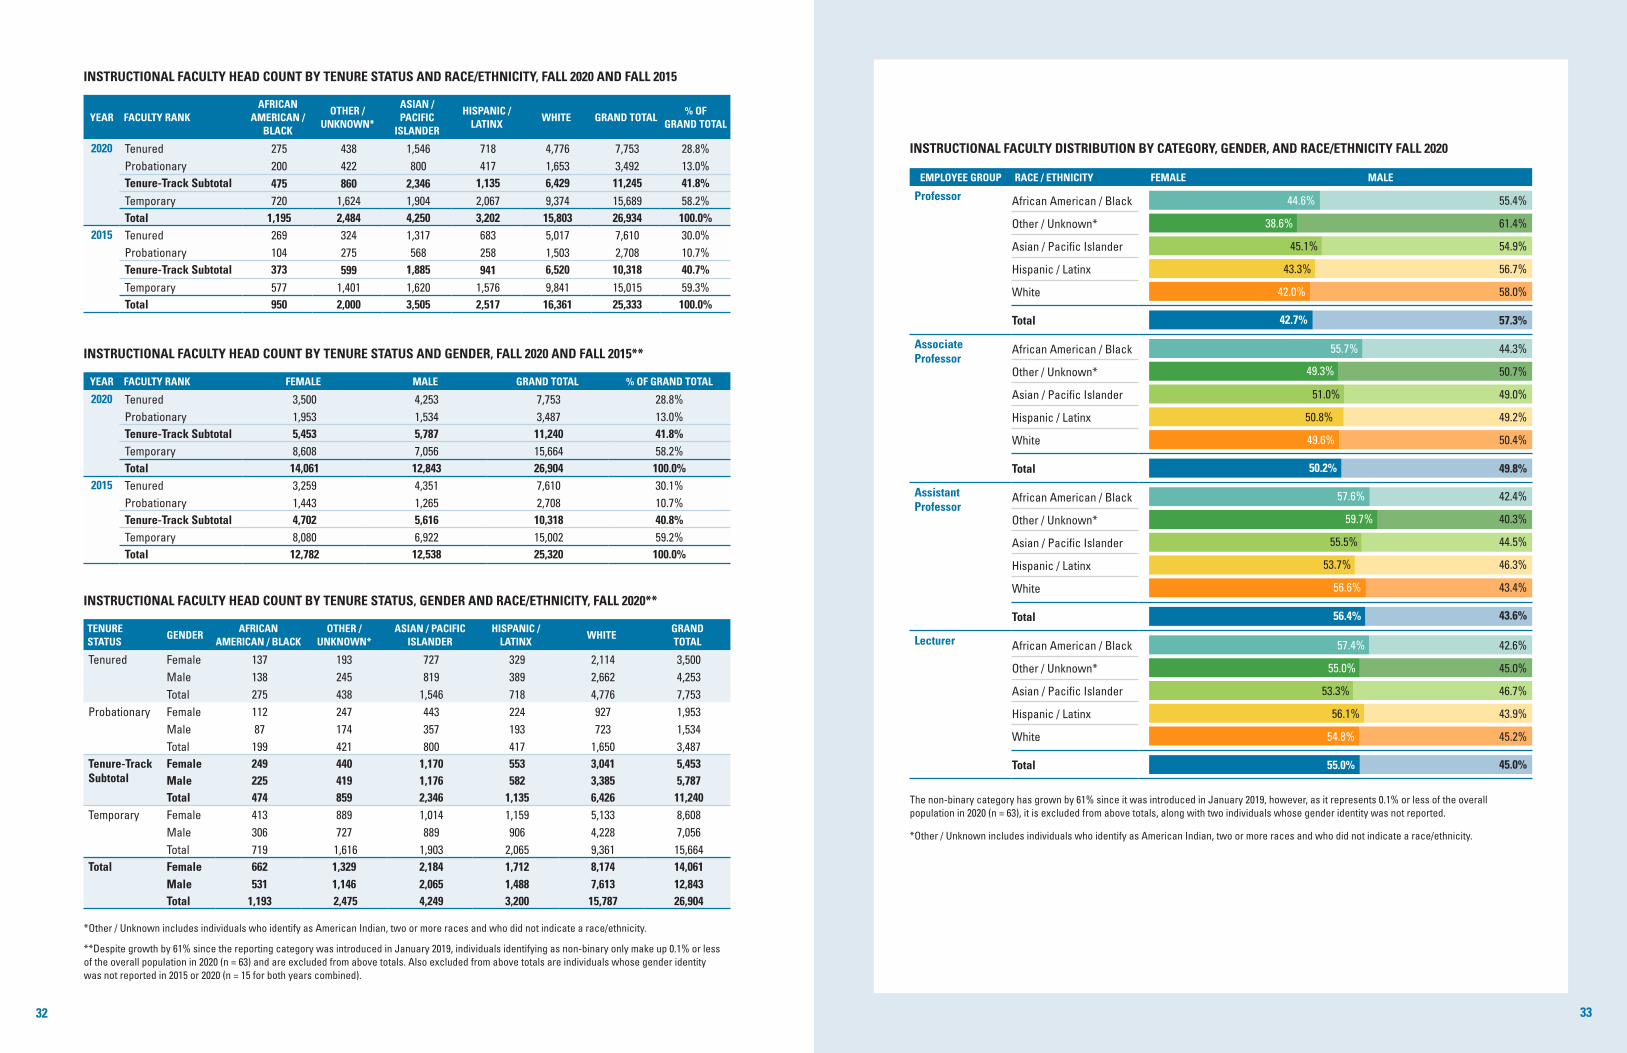
32 Instructional Faculty Head Count by Tenure Status and Race/Ethnicity, Fall 2020 and Fall 2015
32 Instructional Faculty Head Count by Tenure Status and Gender, Fall 2020 and Fall 2015
32 Instructional Faculty Head Count by Tenure Status, Gender and Race/Ethnicity, Fall 2020
33 Instructional Faculty Distribution by Category, Gender, and Race/Ethnicity Fall 2020
TENURE STATUS34 Tenure-Track Instructional Faculty
Head Count by Rank, Fall 2020
34 Instructional Faculty With Doctorate Head Count by Rank, Fall 2020
34 Instructional Faculty Head Count by Tenure Status and Race/Ethnicity, Fall 2020 and Fall 2015
34 Instructional Faculty Head Count by Tenure Status and Gender, Fall 2020 and Fall 2015
NEW FACULTY35 New Full-Time, Tenure-Track Faculty,
Fall 2016 to Fall 2020
PROMOTIONS AND TENURE35 Faculty Promotions, Fall 2016 to
Fall 2020
35 Faculty Granted Tenure, Fall 2016 to Fall 2020
SEPARATIONS35 Separations Among Full-Time
Faculty by Cause and Appointment Status, 2019-20 and 2018-19
SALARY36 Instructional Faculty Head Count
and Average Salary by Rank and Appointment Type, Fall 2020
CAMPUS36 Instructional Faculty Head Count by
Campus and Rank, Fall 2020
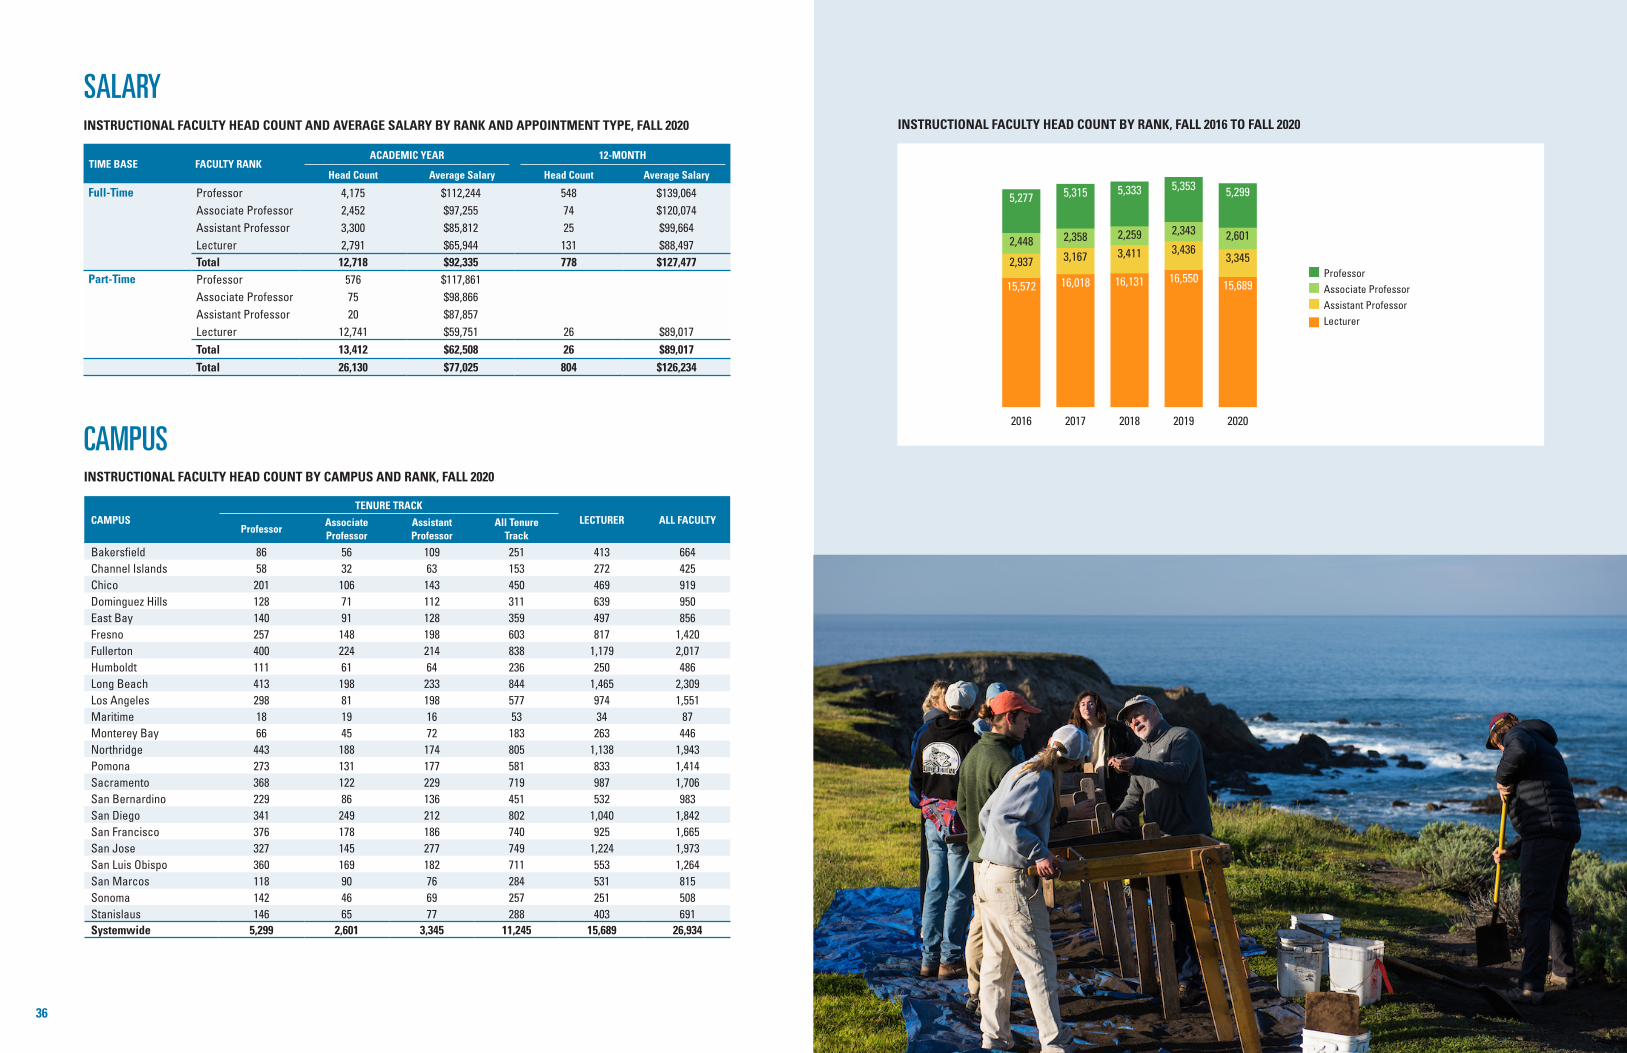
37 Instructional Faculty Head Count by Rank, Fall 2016 to Fall 2020
CSU STUDENTEMPLOYEESREPRESENTED STUDENT EMPLOYEE41 Represented Student Employee
Head Count by Campus and Race/Ethnicity, Fall 2020
42 Represented Student Employee Head Count by Campus and Gender, Fall 2020
NON-REPRESENTED STUDENT EMPLOYEES42 Non-Represented Student Employee
Head Count by Campus and Race/Ethnicity, Fall 2020
43 Non-Represented Student Employee Head Count by Campus and Gender, Fall 2020
TECHNICAL NOTES AND GLOSSARY47 Technical Notes
47 Glossary
TABLE OF CONTENTSFall 2020
5
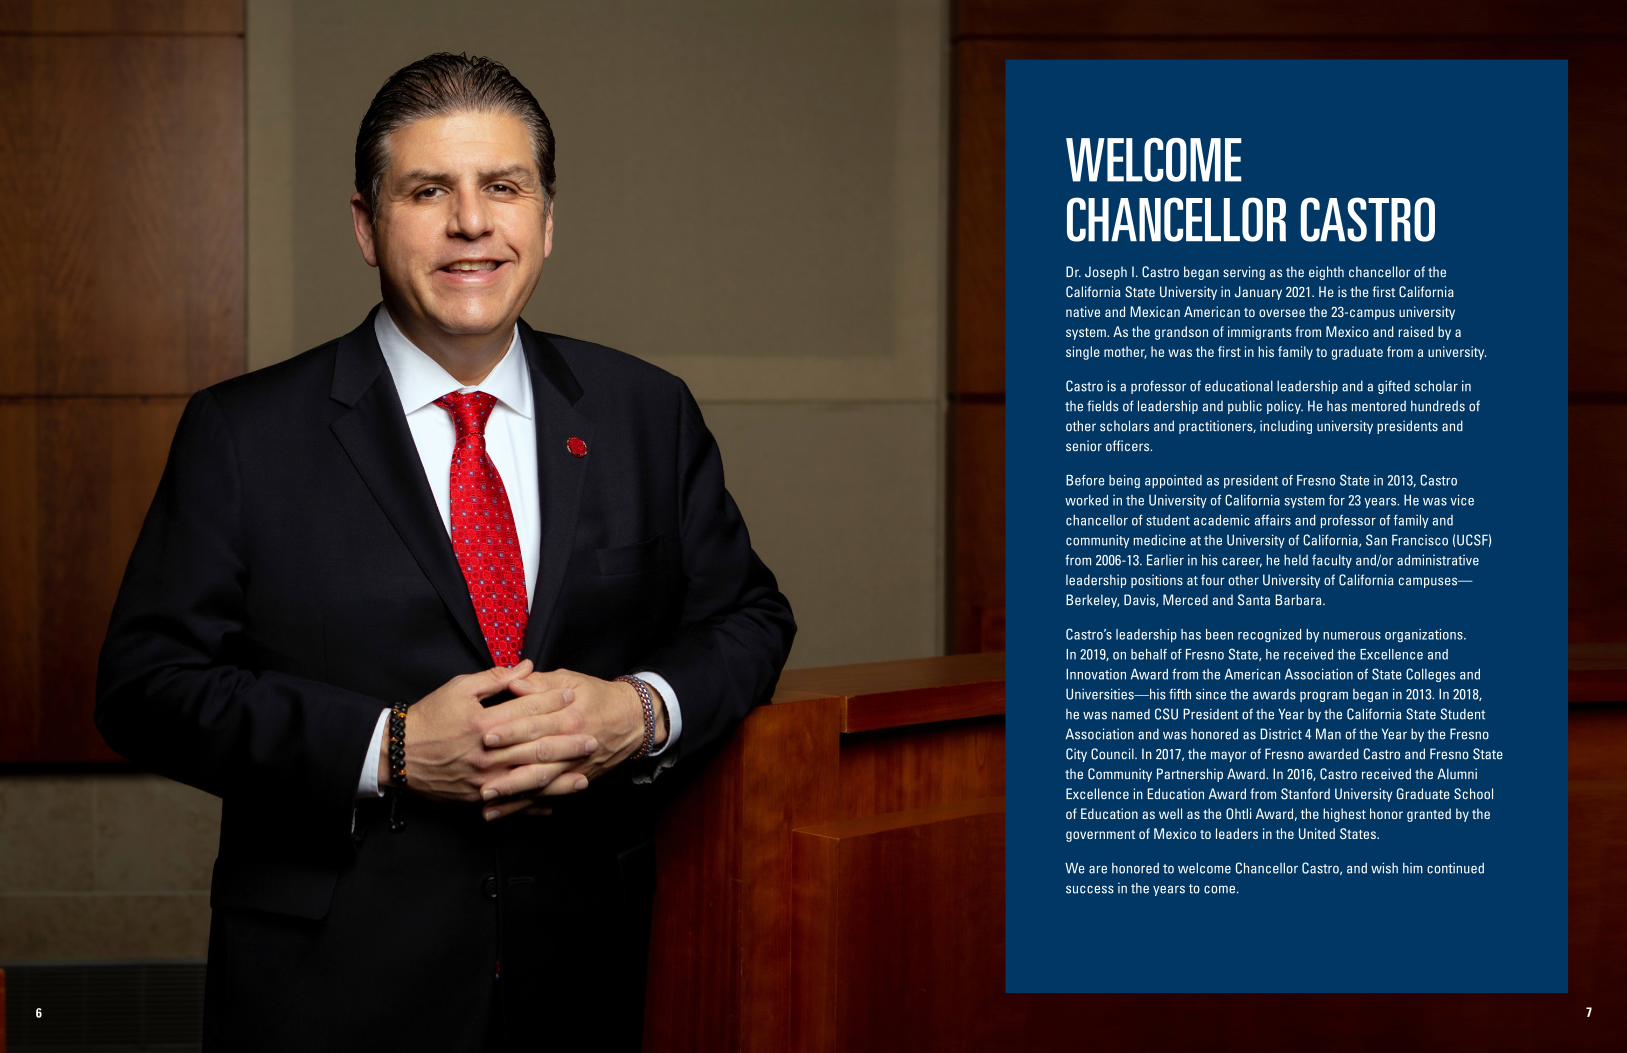
WELCOME CHANCELLOR CASTRODr. Joseph I. Castro began serving as the eighth chancellor of the California State University in January 2021. He is the first California native and Mexican American to oversee the 23-campus university system. As the grandson of immigrants from Mexico and raised by a single mother, he was the first in his family to graduate from a university.
Castro is a professor of educational leadership and a gifted scholar in the fields of leadership and public policy. He has mentored hundreds of other scholars and practitioners, including university presidents and senior officers.
Before being appointed as president of Fresno State in 2013, Castro worked in the University of California system for 23 years. He was vice chancellor of student academic affairs and professor of family and community medicine at the University of California, San Francisco (UCSF) from 2006-13. Earlier in his career, he held faculty and/or administrative leadership positions at four other University of California campuses—Berkeley, Davis, Merced and Santa Barbara.
Castro’s leadership has been recognized by numerous organizations. In 2019, on behalf of Fresno State, he received the Excellence and Innovation Award from the American Association of State Colleges and Universities—his fifth since the awards program began in 2013. In 2018, he was named CSU President of the Year by the California State Student Association and was honored as District 4 Man of the Year by the Fresno City Council. In 2017, the mayor of Fresno awarded Castro and Fresno State the Community Partnership Award. In 2016, Castro received the Alumni Excellence in Education Award from Stanford University Graduate School of Education as well as the Ohtli Award, the highest honor granted by the government of Mexico to leaders in the United States.
We are honored to welcome Chancellor Castro, and wish him continued success in the years to come.
76

UNIVERSITY COUNSELING SERVICES (UCS) CALIFORNIA STATE UNIVERSITY, NORTHRIDGE
UCS is committed to caring for CSUN students, particularly in these unprecedented times. The UCS counselors are highly trained mental health professionals who support the student and campus community in times of crises. They are committed to assisting students in reaching their academic, career and life goals—and their staff’s diversity and compassion helps meet the specific needs and situations of each student. During the pandemic, services have pivoted to virtual delivery through telemental health, new virtual community spaces and individualized workshops. Newer virtual forums have included conversations and Zoom discussion “rooms”, which allow students, faculty and staff to talk about social issues, and support the students and employees impacted by them. Many conversations have centered on issues in the Black community, but have also included those affecting Dreamers, Latinx and international students.
ELAINE K. IKEDA EXECUTIVE DIRECTOR, CALIFORNIA CAMPUS COMPACT CALIFORNIA STATE UNIVERSITY, EAST BAY
Elaine Ikeda has been the executive director of California Campus Compact for 20 years. This coalition of California’s leading colleges and universities cultivates and advances civic and community engagement—work of vital importance in today’s society. It also provides support and resources to all of the 23 CSU campuses, which comprise half of the compact’s membership. Ikeda leads the presidential membership organization and assigns Community Engagement Student
Fellows to several CSU campuses. The compact offers service-learning, community engagement grant funding and training and professional development to CSU campus members. In 2020, California Campus Compact celebrated its 30th anniversary. Ikeda holds a bachelor of science degree in health science and a master’s degree in public health from California State University, Long Beach and a doctorate in higher education & organizational change from the University of California, Los Angeles.
SUE MADDOX ADMINISTRATIVE ANALYST/SPECIALIST CALIFORNIA STATE UNIVERSITY, FULLERTON
Sue Maddox has worked at Fullerton since her high school days and was recently recognized for 40 years of service. She joined the campus during a summer break, and worked alongside her mother who needed temporary help with registration in the university’s personnel office. After this initial assignment, Sue worked in the library, school and college relations, alumni relations, and academic affairs. She now works in the Psychology Department, where she has provided invaluable
support since 1989. Following in her mom’s footsteps, Sue’s daughter worked in Sue’s department as a student assistant before she graduated this year. Although there have been many changes at the university in the past 40 years, what Sue still enjoys the most is helping students and working with great colleagues.
LAWRENCE FAN ASSOCIATE ATHLETICS DIRECTOR FOR FOOTBALL COMMUNICATIONS AND SPECIAL PROJECTS SAN JOSÉ STATE UNIVERSITY
Local, state and national media know whom to contact for their athletics information. As a mentor, spokesman and champion of the San José State Athletics Department for more than 40 years, Lawrence Fan puts Spartan student-athletes before himself. He serves the Bay Area media in many capacities, such as arranging interviews for athletes—including the 1987 Heisman Trophy campaign for former
quarterback Mike Perez. Fan’s numerous awards from the College Sports Information Directors of America (CoSIDA) include: the 2017 President’s Award, 2013 Trailblazer Award, and the prestigious Arch Ward Award and induction into the CoSIDA Hall of Fame in 2012. Fan is a founder of the Job Seekers Committee and served as chair from 1994-2017. He also helped organize and manage job fair activities at the annual convention, initiated and now manages the CoSIDA Career Center email blast program.
998CSU WORKFORCE: PURPOSE HAPPENS HERE
9
CONGRATULATIONS TO THE 2021 WANG FAMILY EXCELLENCE AWARD WINNERS GERALD L. JONES, J.D. Outstanding Staff Performance Award, Sonoma State
JUDITH E. CANNER, PH.D. Outstanding Faculty Teaching Award, CSU Monterey Bay
CYNTHIA A. CRAWFORD, PH.D. Outstanding Faculty Innovator for Student Success, CSU San Bernardino
HALA MADANAT, PH.D. Outstanding Faculty Scholarship Award, San Diego State
AYDIN NAZMI, PH.D Outstanding Faculty Service Award, Cal Poly San Luis Obispo
THE EMPLOYEES OF THECALIFORNIA STATE UNIVERSITYTABLE OF CONTENTSFall 2020
CSU WORKFORCEFall 2020
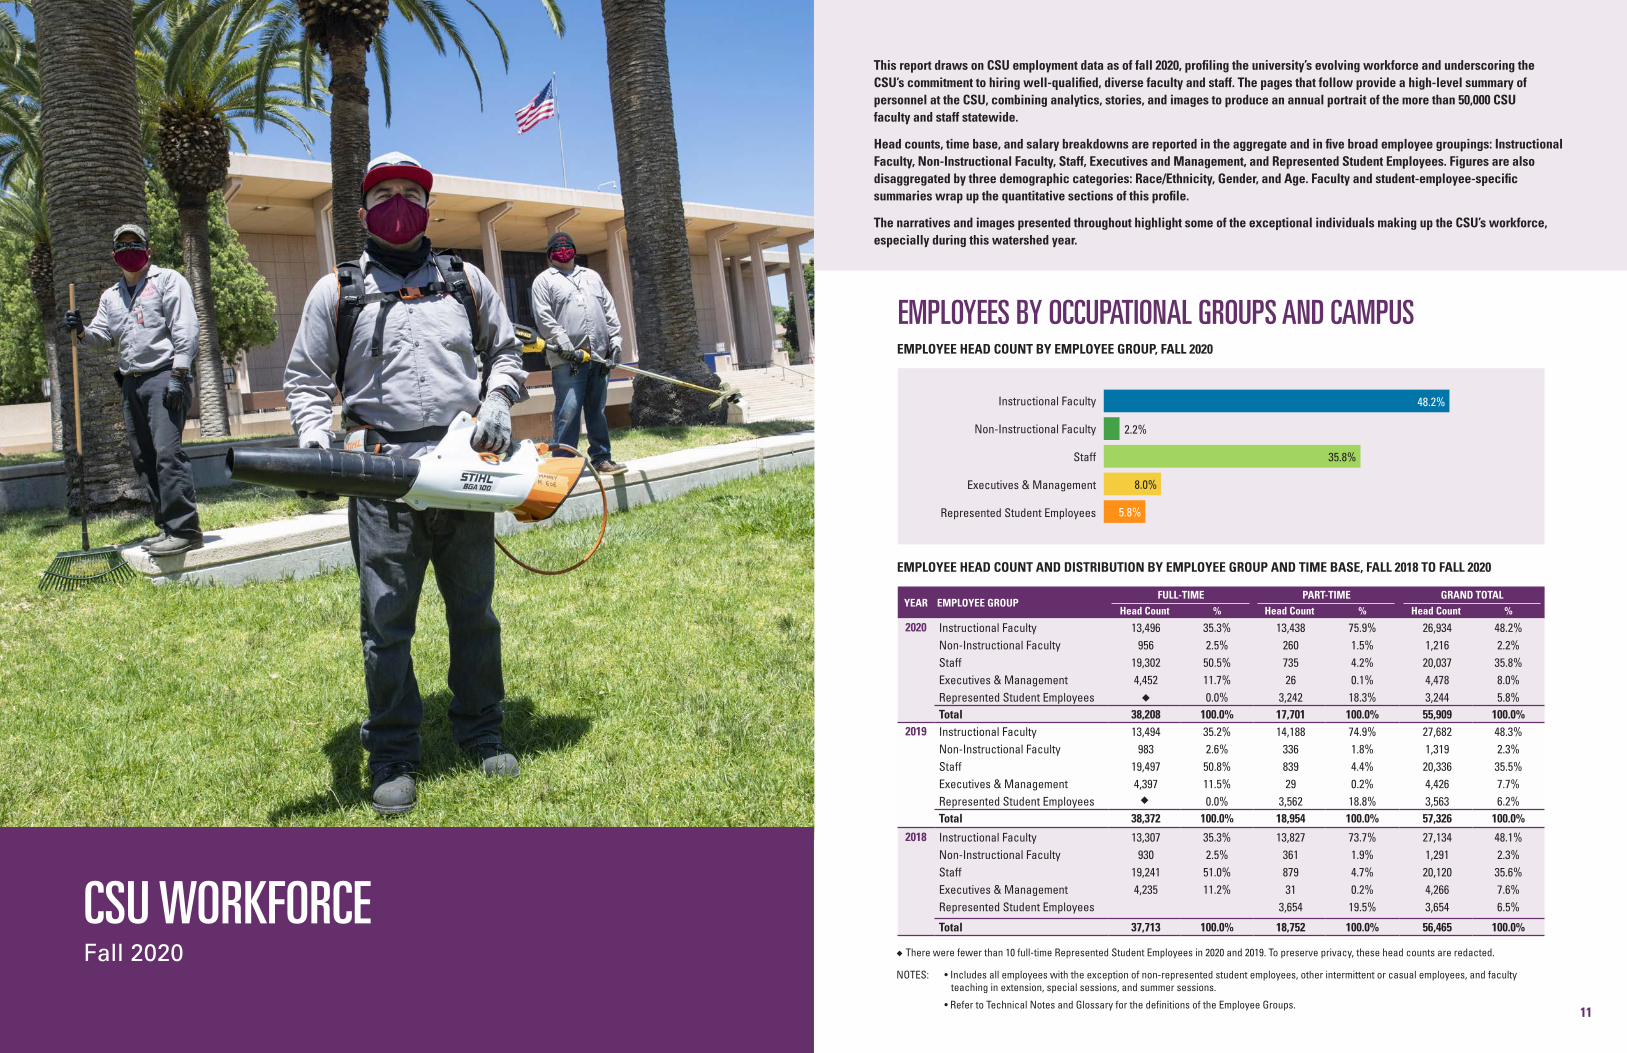
This report draws on CSU employment data as of fall 2020, profiling the university’s evolving workforce and underscoring the CSU’s commitment to hiring well-qualified, diverse faculty and staff. The pages that follow provide a high-level summary of personnel at the CSU, combining analytics, stories, and images to produce an annual portrait of the more than 50,000 CSU faculty and staff statewide.
Head counts, time base, and salary breakdowns are reported in the aggregate and in five broad employee groupings: Instructional Faculty, Non-Instructional Faculty, Staff, Executives and Management, and Represented Student Employees. Figures are also disaggregated by three demographic categories: Race/Ethnicity, Gender, and Age. Faculty and student-employee-specific summaries wrap up the quantitative sections of this profile.
The narratives and images presented throughout highlight some of the exceptional individuals making up the CSU’s workforce, especially during this watershed year.
EMPLOYEE HEAD COUNT AND DISTRIBUTION BY EMPLOYEE GROUP AND TIME BASE, FALL 2018 TO FALL 2020
YEAR EMPLOYEE GROUPFULL-TIME PART-TIME GRAND TOTAL
Head Count % Head Count % Head Count %
2020 Instructional Faculty 13,496 35.3% 13,438 75.9% 26,934 48.2%Non-Instructional Faculty 956 2.5% 260 1.5% 1,216 2.2%Staff 19,302 50.5% 735 4.2% 20,037 35.8%Executives & Management 4,452 11.7% 26 0.1% 4,478 8.0%Represented Student Employees u 0.0% 3,242 18.3% 3,244 5.8%Total 38,208 100.0% 17,701 100.0% 55,909 100.0%
2019 Instructional Faculty 13,494 35.2% 14,188 74.9% 27,682 48.3%Non-Instructional Faculty 983 2.6% 336 1.8% 1,319 2.3%Staff 19,497 50.8% 839 4.4% 20,336 35.5%Executives & Management 4,397 11.5% 29 0.2% 4,426 7.7%Represented Student Employees u 0.0% 3,562 18.8% 3,563 6.2%Total 38,372 100.0% 18,954 100.0% 57,326 100.0%
2018 Instructional Faculty 13,307 35.3% 13,827 73.7% 27,134 48.1%Non-Instructional Faculty 930 2.5% 361 1.9% 1,291 2.3%Staff 19,241 51.0% 879 4.7% 20,120 35.6%Executives & Management 4,235 11.2% 31 0.2% 4,266 7.6%Represented Student Employees 3,654 19.5% 3,654 6.5%
Total 37,713 100.0% 18,752 100.0% 56,465 100.0%
EMPLOYEE HEAD COUNT BY EMPLOYEE GROUP, FALL 2020
48.2%Instructional Faculty
Non-Instructional Faculty
Staff
Executives & Management
Represented Student Employees
2.2%
35.8%
8.0%
5.8%
EMPLOYEES BY OCCUPATIONAL GROUPS AND CAMPUS
11
u There were fewer than 10 full-time Represented Student Employees in 2020 and 2019. To preserve privacy, these head counts are redacted.
NOTES: • Includes all employees with the exception of non-represented student employees, other intermittent or casual employees, and faculty teaching in extension, special sessions, and summer sessions.
• Refer to Technical Notes and Glossary for the definitions of the Employee Groups.

CAMPUSFULL-TIME PART-TIME GRAND TOTAL
Head Count FTE Head Count FTE Head Count FTE
Bakersfield 939 946.7 375 150.6 1,314 1,097.3Chancellor's Office 669 669 2 1.1 671 670.1Channel Islands 731 735.3 220 109.8 951 845.1Chico 1,454 1,459.6 527 252.5 1,981 1,712.1Dominguez Hills 1,180 1,186 567 240.5 1,747 1,426.5East Bay 1,226 1,229.7 574 248.8 1,800 1,478.5Fresno 1,843 1,843.9 803 327.9 2,646 2,171.8Fullerton 2,582 2,596.2 1,232 521.8 3,814 3,117.9Humboldt 863 866.5 289 115.7 1,152 982.2Long Beach 2,742 2,749.9 1,723 710.8 4,465 3,460.7Los Angeles 1,765 1,770.1 1,046 443.9 2,811 2,214Maritime 280 281.2 32 15.5 312 296.8Monterey Bay 748 752.3 268 131.9 1,016 884.1Northridge 2,582 2,594.4 1,351 571 3,933 3,165.3Pomona 1,843 1,845.8 894 420.1 2,737 2,265.9Sacramento 2,243 2,244.5 1,036 441.7 3,279 2,686.2San Bernardino 1,572 1,575.9 674 281.7 2,246 1,857.5San Diego 2,752 2,755.8 1,670 677.3 4,422 3,433.1San Francisco 2,289 2,291.9 1,244 478.3 3,533 2,770.2San José 2,428 2,435.4 1,413 605.9 3,841 3,041.3San Luis Obispo 2,386 2,391.9 538 243.8 2,924 2,635.7San Marcos 1,199 1,211.7 525 218.5 1,724 1,430.2Sonoma 958 961.7 327 133.4 1,285 1,095.1Stanislaus 934 936.9 371 141 1,305 1,077.9Grand Total 38,208 38,332.4 17,701 7,483.4 55,909 45,815.7
EMPLOYEE HEAD COUNT AND FTE BY CAMPUS AND TIME BASE, FALL 2020
CAMPUSFULL-TIME PART-TIME GRAND
TOTALFaculty Staff Students Total Faculty Staff Students Total
Bakersfield 378 561 939 334 22 19 375 1,314Chancellor's Office 669 669 2 2 671Channel Islands 237 494 731 205 10 5 220 951Chico 541 913 1,454 419 40 68 527 1,981Dominguez Hills 454 726 1,180 544 15 8 567 1,747East Bay 403 823 1,226 493 38 43 574 1,800Fresno 849 993 1 1,843 628 18 157 803 2,646Fullerton 1,085 1,497 2,582 1,004 33 195 1,232 3,814Humboldt 316 547 863 208 22 59 289 1,152Long Beach 1,130 1,612 2,742 1,249 60 414 1,723 4,465Los Angeles 731 1,034 1,765 865 14 167 1,046 2,811Maritime 68 212 280 28 4 32 312Monterey Bay 239 509 748 238 20 10 268 1,016Northridge 968 1,614 2,582 1,055 71 225 1,351 3,933Pomona 704 1,139 1,843 759 20 115 894 2,737Sacramento 883 1,360 2,243 907 20 109 1,036 3,279San Bernardino 532 1,040 1,572 500 16 158 674 2,246San Diego 1,050 1,701 1 2,752 899 69 702 1,670 4,422San Francisco 880 1,409 2,289 831 127 286 1,244 3,533San José 967 1,461 2,428 1,106 52 255 1,413 3,841San Luis Obispo 939 1,447 2,386 400 28 110 538 2,924San Marcos 431 768 1,199 423 25 77 525 1,724Sonoma 282 676 958 260 23 44 327 1,285Stanislaus 385 549 934 343 12 16 371 1,305Grand Total 14,452 23,754 2 38,208 13,698 761 3,242 17,701 55,909
EMPLOYEE HEAD COUNT BY CAMPUS, EMPLOYEE GROUP AND TIME BASE, FALL 2020
EMPLOYEE SALARY DISTRIBUTION BY EMPLOYEE GROUP, FALL 2018 TO FALL 2020
2018
2020 47.0% 16.0%
2019 47.0% 15.6%
Instructional Faculty Non-Instructional Faculty Staff
Executives & Management Represented Student Employees
2.6%
2.7%
2.6%
47.3%
33.4%
1.0%
33.6%
33.8% 15.2%
1.2%
1.1%
1312
Union % OF TOTAL SALARY % OF EMPLOYEES
California Faculty Association 49.59% 50.35%California State University Employees Union 23.74% 26.41%Executives & Management Personnel Plan 15.96% 8.01%Academic Professionals of California 5.31% 5.80%Teamsters 2010 2.23% 1.93%Academic Student Employees 1.03% 5.80%Confidential Classes 0.86% 0.78%Statewide University Police Association 0.80% 0.62%Union of American Physicians and Dentists 0.34% 0.13%Excluded Classes 0.10% 0.14%
International Union of Operating Engineers 0.03% 0.03%
Total 100% 100%
EMPLOYEE SALARY AND HEAD COUNT DISTRIBUTION BY COLLECTIVE BARGAINING UNIT, FALL 2020
NOTES: Salary expenditures (Annual Base Salary * FTE) as of October 30, 2020.

Widely recognized for its inclusive policies and outreach, the CSU is home to a diverse student and staff population across its 23 campuses and the Chancellor’s Office.
The CSU’s workforce is 55 percent female. This transcends to its executive and management workforce, which is 55.4 percent female. In fact, 12 of the CSU’s 23 presidents are women. Nearly 60 percent of all Latinx and Black employees are women, with the staff population surpassing the 60 percent mark for those two groups.
The median age of the CSU workforce in 2020 is 46.4. Latinas have the youngest median age, 39.7, while white males hold the oldest median age, 50.4. The youngest employee grouping by far consists of represented student employees, with 26.5 being the median age. Non-instructional faculty, such as coaches, counselors, and librarians make up the next youngest group: 40.4 is their median age. The oldest employee group is executives and management, with a median age of 50.
Smaller populations are not highlighted in this report, to protect their identity when total figures are fewer than 100 and to maximize report and graphics legibility. There are 331 Native American, 162 Pacific Islander, and 1,141 mixed race employees in 2020, and 3,105 declined to state their race/ethnicity.
Our fastest growing population is the non-binary population, which became an official reporting category for gender effective January 2019. Since then, the population has grown by 62 percent, from 39 to 63 individuals university-wide. Unfortunately, given the size of the population, non-binary totals are excluded from the summaries that follow.
EMPLOYEE DISTRIBUTION BY RACE/ETHNICITY AND TIME BASE, FALL 2020
RACE / ETHNICITYFULL -TIME PART-TIME GRAND TOTAL
Head Count % Head Count % Head Count %
African American / Black 2,439 6.4% 791 4.5% 3,230 5.8%
Other / Unknown* 2,797 7.3% 1,780 10.1% 4,577 8.2%
Asian / Pacific Islander 6,468 16.9% 2,427 13.7% 8,895 15.9%
Hispanic / Latinx 8,416 22.0% 2,890 16.3% 11,306 20.2%
White 18,088 47.3% 9,813 55.4% 27,901 49.9%
Total 38,208 100.0% 17,701 100.0% 55,909 100.0%
EMPLOYEE DISTRIBUTION AND HEAD COUNT BY RACE/ETHNICITY AND TIME BASE, FALL 2020
Full-Time
Part-Time
Grand Total
6.4% 7.3% 16.9% 22.0% 47.3%
4.5% 10.1% 13.7% 16.3% 55.4%
5.8% 8.2% 15.9% 20.2% 49.9%
African American / Black Other / Unknown* Asian / Pacific Islander Hispanic / Latinx White
*Other / Unknown includes individuals who identify as American Indian, two or more races and who did not indicate a race/ethnicity.
EMPLOYEE DEMOGRAPHICS
151514

EMPLOYEE DISTRIBUTION BY GENDER AND TIME BASE, FALL 2020
Full-Time
Part-Time
Grand Total
55.4% 44.6%
55.2% 44.8%
55.3% 44.7%
Female Male
The non-binary category has grown by 61% since it was introduced in January 2019, however, as it represents 0.1% or less of the overall population in 2020 (n = 63), it is excluded from above totals, along with two individuals whose gender identity was not reported.
EMPLOYEE HEAD COUNT BY RACE/ETHNICITY, FALL 2016 TO FALL 2020
African American / Black Other / Unknown* Asian / Pacific Islander Hispanic / Latinx White
29,735
9,446
8,142
4,1603,096
29,720
10,159
8,419
4,3813,159
29,402
10,701
8,621
4,5313,210
29,254
11,213
8,900
4,6893,270
27,901
11,306
8,895
4,5773,230
2016 2017 2018 2019 2020
EMPLOYEE HEAD COUNT BY GENDER, FALL 2016 TO FALL 2020
2016 2017 2018 2019 2020
24,960 25,321 25,551 25,860 24,967
29,584 30,513 30,910 31,417 30,877
Female Male
The non-binary category has grown by 61% since it was introduced in January 2019, however, as it represents 0.1% or less of the overall population in 2020 (n = 63), it is excluded from above totals. Also excluded from above totals are individuals whose gender identity was not reported between 2016 and 2020 (n = 55 for all five years combined).
EMPLOYEE DISTRIBUTION BY RACE/ETHNICITY, FALL 2016 TO FALL 2020 (%)
2016 2017 2018 2019 2020
5.7 5.7 5.7 5.7 5.8
7.6 7.8 8.0 8.2 8.214.9 15.1 15.3 15.5 15.9
17.3 18.2 19.0 19.6 20.2
54.5 53.2 52.1 51.0 49.9
2016 2017 2018 2019 2020
FULL -TIME PART-TIME GRAND TOTAL
RACE / ETHNICITY Head Count % Head Count % Head Count %
Female 21,140 55.4% 9,737 55.2% 30,877 55.3%
Male 17,050 44.6% 7,917 44.8% 24,967 44.7%
Total 38,190 100.0% 17,654 100.0% 55,844 100.0%
EMPLOYEE DISTRIBUTION AND HEAD COUNT BY RACE/ETHNICITY AND TIME BASE, FALL 2020
16 17
*Other / Unknown includes individuals who identify as American Indian, two or more races and who did not indicate a race/ethnicity.
EMPLOYEE DISTRIBUTION BY GENDER, FALL 2016 TO FALL 2020 (%)
2016 2017 2018 2019 2020
45.8 45.4 45.3 45.1 44.7
54.2 54.6 54.7 54.9 55.3
2016 2017 2018 2019 2020

EMPLOYEE DISTRIBUTION BY RACE/ETHNICITY WITHIN EMPLOYEE GROUP, FALL 2020
African American / Black
Other / Unknown*
Asian / Pacific Islander
Hispanic / Latinx
White
58.7%
11.9%
9.2%
4.4%
15.8%
Instructional Faculty Non-Instructional Faculty Staff
Executives & Management Represented Student Employees
54.8%
15.5%
10.8%
9.5%
9.5% 38.0%
31.4%
6.8%
7.1%
16.7%
41.5%
28.7%
9.0%2.8%
18.1%55.1%
15.7%
7.0%
9.0%
13.3%
EMPLOYEE DISTRIBUTION BY GENDER WITHIN EMPLOYEE GROUP, FALL 2020
Female
Male
52.3% 47.7%
Instructional Faculty Non-Instructional Faculty Staff
Executives & Management Represented Student Employees
54.8% 45.2% 59.4% 40.6%
55.1% 44.9%55.4% 44.6%
1918
EMPLOYEE DISTRIBUTION BY EMPLOYEE GROUP WITHIN GENDER, FALL 2020
Instructional Faculty
Non-Instructional Faculty
Staff
Executives & Management
Represented Student Employees
Female Male
32.6%
2.2%
8.0%5.8%
51.4%
The non-binary category has grown by 61% since it was introduced in January 2019, however, as it represents 0.1% or less of the overall population in 2020 (n = 63), it is excluded from above totals, along with two individuals whose gender identity was not reported.
38.5%
2.2%
8.0%5.8%
45.5%
EMPLOYEE DISTRIBUTION BY EMPLOYEE GROUP WITHIN RACE/ETHNICITY, FALL 2020
Instructional Faculty
Non-Instructional Faculty
Staff
Executives & Management
Represented Student Employees
44.1%
3.6%
37.0%
2.8%
12.5%
African American / Black Other / Unknown* Asian / Pacific Islander
Hispanic / Latinx White
29.7%
2.9%
6.8%6.4%
54.3%37.7%
1.3%
6.6%6.7%
47.8%
27.3%
2.4%
8.8%4.8%
56.6%
55.6%1.7%
6.2%8.2%
28.3%
*Other / Unknown includes individuals who identify as American Indian, two or more races and who did not indicate a race/ethnicity.

YEAR EMPLOYEE GROUPAFRICAN
AMERICAN / BLACK
OTHER / UNKNOWN*
ASIAN / PACIFIC
ISLANDER
HISPANIC / LATINX
WHITEGRAND TOTAL
2020 Instructional Faculty 1,195 2,484 4,250 3,202 15,803 26,934Non-Instructional Faculty 116 131 115 188 666 1,216Staff 1,426 1,359 3,349 6,285 7,618 20,037Executives & Management 403 312 594 701 2,468 4,478Represented Student Employees 90 291 587 930 1,346 3,244Total 3,230 4,577 8,895 11,306 27,901 55,909
2015 Instructional Faculty 950 2,000 3,505 2,517 16,361 25,333Non-Instructional Faculty 91 119 111 137 779 1,237Staff 1,440 1,252 3,018 4,848 8,261 18,819Executives & Management 301 249 446 507 2,402 3,905Represented Student Employees 115 343 712 805 1,755 3,730Total 2,897 3,963 7,792 8,814 29,558 53,024
EMPLOYEE HEAD COUNT BY EMPLOYEE GROUP AND RACE/ETHNICITY, FALL 2020 AND FALL 2015
20
The non-binary category has grown by 61% since it was introduced in January 2019, however, as it represents 0.1% or less of the overall population in 2020 (n = 63), it is excluded from above totals, along with two individuals whose gender identity was not reported.
*Other / Unknown includes individuals who identify as American Indian, two or more races and who did not indicate a race/ethnicity.
EMPLOYEE DISTRIBUTION BY EMPLOYEE GROUP, GENDER, AND RACE/ETHNICITY, FALL 2020
EMPLOYEE GROUP RACE / ETHNICITY FEMALE MALE
Instructional Faculty
African American / Black
Other / Unknown*
Asian / Pacific Islander
Hispanic / Latinx
White
Total
Non-Instructional Faculty
African American / Black
Other / Unknown*
Asian / Pacific Islander
Hispanic / Latinx
White
Total
Staff African American / Black
Other / Unknown*
Asian / Pacific Islander
Hispanic / Latinx
White
Total
Executives & Management
African American / Black
Other / Unknown*
Asian / Pacific Islander
Hispanic / Latinx
White
Total
Represented Student Employees
African American / Black
Other / Unknown*
Asian / Pacific Islander
Hispanic / Latinx
White
Total
44.5%
46.3%
48.6%
46.5%
48.2%
47.7%
60.3%
46.6%
20.9%
40.4%
47.9%
45.2%
38.3%
42.8%
41.3%
38.5%
42.1%
40.6%
43.9%
49.7%
44.1%
39.5%
45.5%
44.6%
41.1%
41.6%
49.5%
42.7%
45.3%
44.9%
55.5%
53.7%
51.4%
53.5%
51.8%
52.3%
39.7%
53.4%
79.1%
59.6%
52.1%
54.8%
61.7%
57.2%
58.7%
61.5%
57.9%
59.4%
56.1%
50.3%
55.9%
60.5%
54.5%
55.4%
58.9%
58.4%
50.5%
57.3%
54.7%
55.1%
*Other / Unknown includes individuals who identify as American Indian, two or more races and who did not indicate a race/ethnicity.

EMPLOYEE HEAD COUNT AND DISTRIBUTION BY RACE/ETHNICITY AND AGE, FALL 2020
AGE GROUP
AFRICAN AMERICAN
OTHER / UNKNOWN*
ASIAN / PACIFIC ISLANDER
HISPANIC / LATINX WHITE GRAND TOTAL
Head Count
%Head Count
%Head Count
%Head Count
%Head Count
%Head Count
%
Under 30 258 8.0% 509 11.1% 999 11.2% 2,276 20.1% 2,074 7.4% 6,116 10.9%30-39 692 21.4% 1,261 27.6% 2,164 24.3% 3,198 28.3% 5,722 20.5% 13,037 23.3%40-49 793 24.6% 1,246 27.2% 2,520 28.3% 2,724 24.1% 6,473 23.2% 13,756 24.6%50-59 859 26.6% 946 20.7% 2,006 22.6% 2,045 18.1% 7,219 25.9% 13,075 23.4%60+ 628 19.4% 615 13.4% 1,206 13.6% 1,063 9.4% 6,413 23.0% 9,925 17.8%Grand Total 3,230 100.0% 4,577 100.0% 8,895 100.0% 11,306 100.0% 27,901 100.0% 55,909 100.0%
Under 30 30-39 40-49 50-59 60+
AGE GROUP
INSTRUCTIONAL FACULTY
NON-INSTRUCTIONAL FACULTY
STAFFEXECUTIVES & MANAGEMENT
REPRESENTED STUDENT EMPLOYEES
GRAND TOTAL
Head Count
%Head Count
%Head Count
%Head Count
%Head Count
%Head Count
%
Under 30 749 2.8% 144 11.8% 2,753 13.7% 83 1.9% 2,387 73.6% 6,116 10.9%30-39 5,873 21.8% 452 37.2% 5,282 26.4% 778 17.4% 652 20.1% 13,037 23.3%40-49 7,237 26.9% 292 24.0% 4,714 23.5% 1,378 30.8% 135 4.2% 13,756 24.6%50-59 6,579 24.4% 205 16.9% 4,726 23.6% 1,514 33.8% 51 1.6% 13,075 23.4%60+ 6,496 24.1% 123 10.1% 2,562 12.8% 725 16.2% 19 0.6% 9,925 17.8%Grand Total 26,934 100.0% 1,216 100.0% 20,037 100.0% 4,478 100.0% 3,244 100.0% 55,909 100.0%
EMPLOYEE HEAD COUNT AND DISTRIBUTION BY EMPLOYEE GROUP AND AGE, FALL 2020
AGE DISTRIBUTION OF CSU EMPLOYEES
EMPLOYEE DISTRIBUTION BY EMPLOYEE GROUP AND AGE, FALL 2020
Instructional Faculty
Non- Instructional
Faculty
Staff Executives&
Management
Represented Student
Employees
24.1%
24.4%
26.9%
21.8%
2.8%
10.1%
16.9%
24.0%
37.2%
11.8%
12.8%
23.6%
23.5%
26.4%
13.7%
16.2%
33.8%
30.8%
17.4%
1.9%
0.6%1.6%
4.2%
20.1%
73.6%
Other / Unknown*
WhiteAsian / Pacific
Islander
Hispanic / Latinx
African American /
Black
EMPLOYEE DISTRIBUTION BY RACE/ETHNICITY AND AGE, FALL 2020
19.4%
26.6%
24.6%
21.4%
8.0%
13.4%
20.7%
27.2%
27.6%
11.1%
13.6%
22.6%
28.3%
24.3%
11.2%
9.4%
18.1%
24.1%
28.3%
20.1%
23.0%
25.9%
23.2%
20.5%
7.4%
EMPLOYEE DISTRIBUTION BY GENDER AND AGE, FALL 2020
FEMALE
Under 30 30-39 40-49 50-59 60+
MALE
12.0%
24.5% 24.8%22.6%
16.0%
9.5%
21.8%
24.4% 24.4%
19.9%
EMPLOYEE HEAD COUNT AND DISTRIBUTION BY GENDER AND AGE, FALL 2020
AGE GROUP
FEMALE MALE GRAND TOTAL
Head Count % Head Count % Head Count %
Under 30 3,713 12.0% 2,379 9.5% 6,092 10.9%30-39 7,573 24.5% 5,442 21.8% 13,015 23.3%40-49 7,663 24.8% 6,083 24.4% 13,746 24.6%50-59 6,985 22.6% 6,084 24.4% 13,069 23.4%60+ 4,943 16.0% 4,979 19.9% 9,922 17.8%Grand Total 30,877 100.0% 24,967 100.0% 55,844 100.0%
The non-binary category has grown by 61% since it was introduced in January 2019, however, as it represents 0.1% or less of the overall population in 2020 (n = 63), it is excluded from above totals, along with two individuals whose gender identity was not reported.
2322
*Other / Unknown includes individuals who identify as American Indian, two or more races and who did not indicate a race/ethnicity.
*Other / Unknown includes individuals who identify as American Indian, two or more races and who did not indicate a race/ethnicity.

50 MOST TRANSFORMATIVE COLLEGES
California State University campuses are consistently lauded for academic excellence, value, impact and opportunity. This is possible because of the CSU’s
quality faculty and staff—and our steadfast commitment to student success.
BEST VALUE1
Seventeen CSU campuses are TOP U.S. INSTITUTIONS FOR
“ BEST BANG FOR THE BUCK”2
All 23 campuses named
BASED ON CONTRIBUTIONS TO THE PUBLIC GOOD IN SOCIAL MOBILITY, RESEARCH AND PROMOTING
PUBLIC SERVICE2
“TOP MASTER’S INSTITUTION” Twenty CSU campuses ranked as a
of California’s bachelor’s degrees
are awarded by the CSU8
NEARLY HALF
NATION’S LARGEST 4-year public
university system8
VERSUS NATIONAL AVERAGE OF FEMALE LEADERSHIP
AMONG HIGHER EDUCATION INSTITUTIONS OF 30%
MORE THAN HALF of the CSU’s 23 campuses are
LED BY WOMEN 8
FINANCIAL SUCCESS CSU CAMPUSES DOMINATE RANKINGS WITH TWENTY-TWO IN TOP 16% AND
TWO-THIRDS IN TOP 20%6
Among the TOP 16% of universities in the nation helping low-income students reach
is a CSU graduate8
employees in California ONE IN TEN
TOP REGIONAL UNIVERSITIES IN THE WEST4
Twenty CSU campuses are
FOR EXCEPTIONAL LEADERSHIP DURING A TOUGH PERIOD5
The California State University System named
“COLLEGE OF THE YEAR”
50 MOST TRANSFORMATIVE COLLEGES FOR GRADUATION RATES, EARNINGS AND
STUDENT OUTCOMES3
More than half of the CSU’s named among
CSU campuses are top performers on
TWELVE CSU CAMPUSES IN TOP 20 AMONG WESTERN REGIONAL UNIVERSITIES4
SOCIAL MOBILITY
“BEST COLLEGES IN AMERICA” Twenty-two CSU campuses rank among the
FOR QUALITY, AFFORDABILITY AND FUTURE CAREER EARNINGS3
FOR SOCIAL MOBILITY, RESEARCH & PROMOTING PUBLIC SERVICE
GRADUATION RATES for first-time and transfer CSU students reach
ALL-TIME HIGHS7
1 Forbes’ “America’s Best Value Colleges” (April 2019) 2 Washington Monthly’s 2020 College Rankings (August 2020) 3 Money’s “Best Colleges in America” (August 2020) 4 U.S. News & World Report’s 2021 “Best Colleges” (September 2020) 5 The Higher Ed Dive Awards 2020 (December 2020)
6 Payscale CollegeNET’s “Social Mobility Index” (November 2020) 7 Graduation Initiative 2025 Annual Symposium (October 2020) 8 9
CSU Office of the Chancellor’s Department of Institutional Research & Analyses 2020 Employee Profile (March 2021)
NEARLY
56,000 FACULTY
AND STAFF
are employed by the CSU9
2524

TERRY JONES PROFESSOR OF ANTHROPOLOGY CALIFORNIA POLYTECHNIC STATE UNIVERSITY, SAN LUIS OBISPO
Dr. Terry Jones joined the campus 22 years ago, and has 35 years of field research experience. Since 2004, his students “learn by doing” in archaeological field classes. Their work at important cultural sites provides students authentic exposure to archaeology and the realities of fieldwork. And this work has been recognized for preserving the historic California coastline, salvaging scientific information that otherwise be lost to erosion. A close collaboration with PG&E, and the yak tityu
yak tiłhini Northern Chumash Tribe of San Luis Obispo County, has resulted in the discovery of a historically significant Chumash village. This alliance was recognized with the Governor’s Historic Preservation Award in 2018. Dr. Jones also received the David A. Fredrickson Lifetime Achievement Award from the Society for California Archeology in 2018, the society’s most prestigious award.
DR. FRANCISCA BEER PROFESSOR OF FINANCE & DIRECTOR JACK H. BROWN COLLEGE (JHBC) OFFICE OF ACADEMIC EQUITY CALIFORNIA STATE UNIVERSITY, SAN BERNARDINO
Dr. Beer has published more than 50 articles in books, monographs and refereed journals, has received several awards for superior research, and is a JHBC Distinguished Research Fellow. The Office of Student Research (OSR) she created has been instrumental at facilitating the engagement of students in scholarly and creative activities by providing resources supporting both student scholars and
faculty mentors. Her dedication to student success is also exemplified by her activities with the Mellon Mays Fellowship, the National Science Foundation S-STEM grant and the Chancellor Student Success Initiative Grant. Dr. Beer’s many awards and honors include: President’s Staff Award, “Faculty Mentor Award”, “Faculty Advisor of the Year”, “Award for Excellence in Teaching”, “Dean’s Outstanding Teaching Award”, and “Outstanding Professional Achievement, Beta Gamma Sigma Honor Society” for the AACSB Accredited Business Programs.
FRITZ YAMBRACH DIRECTOR AND PROFESSOR OF PACKAGING SAN JOSÉ STATE UNIVERSITY
Fritz Yambrach began rebuilding the packaging program when he arrived in 2006. SJSU now has 10 courses, an internship program and is one of only five schools nationwide to offer a bachelor’s degree in packaging. In 2005, he applied his experience to give back—and invented a flexible, reusable, hermetically sealed water pouch to transport water in developing countries. Water procurement remains a gendered activity in some developing countries. As such, the wearable
pouch eases the load many women and girls endure daily. In 2017, his Fritz Water Vest was awarded the DuPont Diamond Award for Packaging Innovation. He hopes this award inspires his students to give back through packaging solutions. Yambrach was inducted to the Association for Packaging and Processing Technologies Hall of Fame in 2020.
JOANNA PEREZ ASSISTANT PROFESSOR, SOCIOLOGY CALIFORNIA STATE UNIVERSITY, DOMINGUEZ HILLS
Joanna Perez is an assistant professor and an avid mentor for CSUDH students. For more than a decade she has examined the experiences of Latinx undocuactivists, whom she defines as “undocumented immigrant activists who fight for immigrant rights by challenging structural inequality and oppressive social relations.” Her groundbreaking research on young Latinx activists, earned her the prestigious Woodrow Wilson National Foundation Fellowship. Perez was the first CSUDH faculty
member to be selected for this honor, and was one of 32 fellows selected nationwide. She was also one of 10 junior faculty members who received yearlong fellowships in support of eradicating racial disparities in the arts and humanities. And she plans to publish her research in hopes of creating social change.
SHADNAZ ASGARI ASSOCIATE PROFESSOR OF BIOMEDICAL ENGINEERING CALIFORNIA STATE UNIVERSITY, LONG BEACH
Dr. Shadnaz Asgari received a 2020-21 CSU Faculty Innovation and Leadership Award for significantly increasing female representation in the fields of engineering and computer science. Under her leadership, the newly-created Biomedical Engineering (BME) Department has more than doubled its enrollment, with women making up 50 percent of BME majors—remarkable for a field that typically averages less than 25 percent female students. Dr. Asgari is dedicated to making the field of
BME more accessible for women and other underrepresented groups in STEM. As co-director of the NIH BUILD program, Asgari develops courses aimed at preparing underrepresented students for doctoral programs and biomedical research careers. In addition, she works with a team of CSULB faculty to recruit and retain female students in collaboration with the National Center for Women & Information Technology.
SARAH DAHLEN ASSOCIATE LIBRARIAN CALIFORNIA STATE UNIVERSITY, MONTEREY BAY
Sarah Dahlen’s efforts to advance students’ information literacy and critical thinking skills through research, assessments and innovative services earned her a 2020-21 Faculty Innovation and Leadership Award. Dahlen led the development of CSUMB’s Information Literacy Assignment Guide, Rubric and Rubric Guide, which campus faculty have used to assess literacy skills and develop data-driven responses toimprove student learning. These tools have been presented at regional and
national conferences, such as the Association of American Colleges and Universities, and have been incorporated into the curriculum of the Western Association of Schools and Colleges (WASC) Assessment Leadership Academy. Dahlen also collaborates extensively with CSUMB’s Cooperative Learning Center, providing support to professional and student tutors to help them improve student achievement in information literacy.
2726CSU FACULTY: INSPIRATION HAPPENS HERE
27

THE EMPLOYEES OF THECALIFORNIA STATE UNIVERSITYTABLE OF CONTENTSFall 2020
CSU FACULTYFall 2020
The CSU’s distinguished faculty members continue to play a critical role in equipping future leaders with the skills and knowledge needed to thrive in the workforce, drive California’s economy and give back to their communities.
The CSU employs 26,934 instructional faculty members and 1,216 non-instructional faculty members, which represents the majority of CSU employees. Of the 13,496 full-time faculty, 78.3 percent are tenured or tenure-track. Of the full-time faculty 4,723 are full professors.
The increasingly diverse CSU faculty mirrors the student body and California’s population. Together with comprehensive community partnerships, expanded programs, internships and workforce opportunities, the CSU’s faculty members ensure graduates are well-prepared for a lifetime of career advancement as productive and engaged citizens.
NON-INSTRUCTIONAL FACULTY DISTRIBUTION BY RACE/ETHNICITY, FALL 2020
Counselor 11.4% 10.5% 14.4% 21.2% 42.5%
Librarian 3.9% 9.6% 12.9% 13.2% 60.4%
Grand Total 9.5% 10.8% 9.5% 15.5% 54.8%
African American / Black Other / Unknown* Asian / Pacific Islander Hispanic / Latinx White
Coach 12.1% 11.7% 4.5% 13.7% 57.9%
NON-INSTRUCTIONAL FACULTY DISTRIBUTION BY GENDER, FALL 2020
Counselor 75.2%
Librarian 73.6%
Grand Total 54.8%
Female Male
Coach 31.4%
24.8%
26.4%
45.2%
68.6%
The nonbinary category has grown by 61% since it was introduced in January 2019, however, as it represents 0.1% or less of the overall population in 2020 (n = 63), it is excluded from above totals, along with two individuals whose gender identity was not reported.
GENDER AND RACE/ETHNICITY
29
*Other / Unknown includes individuals who identify as American Indian, two or more races and who did not indicate a race/ethnicity.

YEAR FACULTY RANK FEMALE MALE GRAND TOTAL
2020 Professor 2,261 3,038 5,299Associate Professor 1,307 1,294 2,601Assistant Professor 1,885 1,455 3,340Tenure-Track Subtotal 5,453 5,787 11,240Lecturer 8,608 7,056 15,664Total 14,061 12,843 26,904
2015 Professor 2,043 3,158 5,201Associate Professor 1,331 1,318 2,649Assistant Professor 1,328 1,140 2,468Tenure-Track Subtotal 4,702 5,616 10,318Lecturer 8,080 6,922 15,002Total 12,782 12,538 25,320
INSTRUCTIONAL FACULTY HEAD COUNT BY RANK AND GENDER, FALL 2020 AND FALL 2015
The non-binary category has grown by 61% since it was introduced in January 2019, however, as it represents 0.1% or less of the overall population in 2020 (n = 63), it is excluded from above totals. Also excluded from above totals are individuals whose gender identity was not reported in 2015 or 2020 (n = 15 for both years combined).
NON-INSTRUCTIONAL FACULTY DISTRIBUTION BY CATEGORY, GENDER, AND RACE/ETHNICITY FALL 2020
EMPLOYEE GROUP RACE / ETHNICITY FEMALE MALE
Coach African American / Black
Other / Unknown*
Asian / Pacific Islander
Hispanic / Latinx
White
Total
Counselor African American / Black
Other / Unknown*
Asian / Pacific Islander
Hispanic / Latinx
White
Total
Librarian African American / Black
Other / Unknown*
Asian / Pacific Islander
Hispanic / Latinx
White
Total
25.4%
32.3%
56.0%
36.8%
29.3%
31.4%
54.3%
78.1%
84.1%
73.8%
77.7%
75.2%
71.4%
70.6%
87.0%
76.6%
70.7%
73.6%
The nonbinary category has grown by 61% since it was introduced in January 2019, however, as it represents 0.1% or less of the overall population in 2020 (n = 63), it is excluded from above totals, along with two individuals whose gender identity was not reported.
74.6%
67.7%
44.0%
63.2%
70.7%
68.6%
45.7%
21.9%
15.9%
26.2%
22.3%
24.8%
28.6%
29.4%
13.0%
23.4%
29.3%
26.4%
3130
YEAR FACULTY RANKAFRICAN
AMERICAN / BLACK
OTHER / UNKNOWN*
ASIAN / PACIFIC
ISLANDER
HISPANIC / LATINX
WHITEGRAND TOTAL
2020 Professor 168 246 1,041 467 3,377 5,299Associate Professor 115 201 535 266 1,484 2,601Assistant Professor 192 413 770 402 1,568 3,345Tenure-Track Subtotal 475 860 2,346 1,135 6,429 11,245Lecturer 720 1,624 1,904 2,067 9,374 15,689Total 1,195 2,484 4,250 3,202 15,803 26,934
2015 Professor 157 198 831 455 3,560 5,201Associate Professor 122 149 545 245 1,588 2,649Assistant Professor 94 252 509 241 1,372 2,468Tenure-Track Subtotal 373 599 1,885 941 6,520 10,318Lecturer 577 1,401 1,620 1,576 9,841 15,015Total 950 2,000 3,505 2,517 16,361 25,333
INSTRUCTIONAL FACULTY HEAD COUNT BY RANK AND RACE/ETHNICITY, FALL 2020 AND FALL 2015
*Other / Unknown includes individuals who identify as American Indian, two or more races and who did not indicate a race/ethnicity.
INSTRUCTIONAL FACULTY DISTRIBUTION BY CATEGORY, GENDER, AND RACE/ETHNICITY FALL 2020
EMPLOYEE GROUP RACE / ETHNICITY FEMALE MALE
Professor African American / Black
Other / Unknown*
Asian / Pacific Islander
Hispanic / Latinx
White
Total
Associate Professor
African American / Black
Other / Unknown*
Asian / Pacific Islander
Hispanic / Latinx
White
Total
Assistant Professor
African American / Black
Other / Unknown*
Asian / Pacific Islander
Hispanic / Latinx
White
Total
Lecturer African American / Black
Other / Unknown*
Asian / Pacific Islander
Hispanic / Latinx
White
Total
55.4%
61.4%
54.9%
56.7%
58.0%
57.3%
44.3%
50.7%
49.0%
49.2%
50.4%
49.8%
42.4%
40.3%
44.5%
46.3%
43.4%
43.6%
42.6%
45.0%
46.7%
43.9%
45.2%
45.0%
44.6%
38.6%
45.1%
43.3%
42.0%
42.7%
55.7%
49.3%
51.0%
50.8%
49.6%
50.2%
57.6%
59.7%
55.5%
53.7%
56.6%
56.4%
57.4%
55.0%
53.3%
56.1%
54.8%
55.0%
3332
The non-binary category has grown by 61% since it was introduced in January 2019, however, as it represents 0.1% or less of the overall population in 2020 (n = 63), it is excluded from above totals, along with two individuals whose gender identity was not reported.
*Other / Unknown includes individuals who identify as American Indian, two or more races and who did not indicate a race/ethnicity.
YEAR FACULTY RANKAFRICAN
AMERICAN / BLACK
OTHER / UNKNOWN*
ASIAN / PACIFIC
ISLANDER
HISPANIC / LATINX
WHITE GRAND TOTAL% OF
GRAND TOTAL
2020 Tenured 275 438 1,546 718 4,776 7,753 28.8%Probationary 200 422 800 417 1,653 3,492 13.0%Tenure-Track Subtotal 475 860 2,346 1,135 6,429 11,245 41.8%
Temporary 720 1,624 1,904 2,067 9,374 15,689 58.2%Total 1,195 2,484 4,250 3,202 15,803 26,934 100.0%
2015 Tenured 269 324 1,317 683 5,017 7,610 30.0%Probationary 104 275 568 258 1,503 2,708 10.7%Tenure-Track Subtotal 373 599 1,885 941 6,520 10,318 40.7%
Temporary 577 1,401 1,620 1,576 9,841 15,015 59.3%Total 950 2,000 3,505 2,517 16,361 25,333 100.0%
INSTRUCTIONAL FACULTY HEAD COUNT BY TENURE STATUS AND RACE/ETHNICITY, FALL 2020 AND FALL 2015
*Other / Unknown includes individuals who identify as American Indian, two or more races and who did not indicate a race/ethnicity.
YEAR FACULTY RANK FEMALE MALE GRAND TOTAL % OF GRAND TOTAL
2020 Tenured 3,500 4,253 7,753 28.8%Probationary 1,953 1,534 3,487 13.0%Tenure-Track Subtotal 5,453 5,787 11,240 41.8%Temporary 8,608 7,056 15,664 58.2%Total 14,061 12,843 26,904 100.0%
2015 Tenured 3,259 4,351 7,610 30.1%Probationary 1,443 1,265 2,708 10.7%Tenure-Track Subtotal 4,702 5,616 10,318 40.8%Temporary 8,080 6,922 15,002 59.2%Total 12,782 12,538 25,320 100.0%
INSTRUCTIONAL FACULTY HEAD COUNT BY TENURE STATUS AND GENDER, FALL 2020 AND FALL 2015**
TENURE STATUS
GENDERAFRICAN
AMERICAN / BLACKOTHER /
UNKNOWN*ASIAN / PACIFIC
ISLANDERHISPANIC /
LATINXWHITE
GRAND TOTAL
Tenured Female 137 193 727 329 2,114 3,500 Male 138 245 819 389 2,662 4,253 Total 275 438 1,546 718 4,776 7,753
Probationary Female 112 247 443 224 927 1,953 Male 87 174 357 193 723 1,534 Total 199 421 800 417 1,650 3,487
Tenure-Track Subtotal
Female 249 440 1,170 553 3,041 5,453 Male 225 419 1,176 582 3,385 5,787 Total 474 859 2,346 1,135 6,426 11,240
Temporary Female 413 889 1,014 1,159 5,133 8,608 Male 306 727 889 906 4,228 7,056 Total 719 1,616 1,903 2,065 9,361 15,664
Total Female 662 1,329 2,184 1,712 8,174 14,061 Male 531 1,146 2,065 1,488 7,613 12,843 Total 1,193 2,475 4,249 3,200 15,787 26,904
INSTRUCTIONAL FACULTY HEAD COUNT BY TENURE STATUS, GENDER AND RACE/ETHNICITY, FALL 2020**
**Despite growth by 61% since the reporting category was introduced in January 2019, individuals identifying as non-binary only make up 0.1% or less of the overall population in 2020 (n = 63) and are excluded from above totals. Also excluded from above totals are individuals whose gender identity was not reported in 2015 or 2020 (n = 15 for both years combined).

FACULTY RANK ALL FACULTY TENURED HEAD COUNT % OF TENURED IN RANK
Professor 5,299 5,278 99.6%Associate Professor 2,601 2,450 94.2%Assistant Professor 3,345 25 0.7%Total 11,245 7,753 68.9%
TENURE-TRACK INSTRUCTIONAL FACULTY HEAD COUNT BY RANK, FALL 2020
FACULTY RANK ALL FACULTY DOCTORATE HEAD COUNT % DOCTORATE IN RANK
Professor 5,299 4,834 91.2%Associate Professor 2,601 2,371 91.2%Assistant Professor 3,345 2,994 89.5%Tenure-Track Subtotal 11,245 10,199 90.7%Lecturer 15,689 4,513 28.8%Total 26,934 14,712 54.6%
INSTRUCTIONAL FACULTY WITH DOCTORATE HEAD COUNT BY RANK, FALL 2020
2016 2017 2018 2019 2020
Searches 999 838 866 789 886Appointments 854 719 734 665 675Success Rate 85% 86% 85% 84% 76%
NEW FULL-TIME, TENURE-TRACK INSTRUCTIONAL FACULTY FALL 2016 TO FALL 2020
NOTES: Instructional faculty members appointed to tenure-track positions and scheduled to begin service during the 2019-20 academic year, as reported by campuses in the annual CSU Faculty Recruitment Survey. Includes all employees newly appointed to tenure-track positions at the reporting campus, including those who previously held tenure-track appointments elsewhere in the CSU or temporary appointments at the reporting campus or other CSU campuses. Does not include employees appointed as tenure-track librarians or counselors.
TENURE STATUS NEW FACULTY
RANK FALL 2016 FALL 2017 FALL 2018 FALL 2019 FALL 2020
Professor 379 379 395 354 291Associate Professor 203 332 327 469 575Total 582 711 722 823 866
FACULTY PROMOTIONS, FALL 2016 TO FALL 2020
FALL 2016 FALL 2017 FALL 2018 FALL 2019 FALL 2020
Total 249 380 373 488 607
FACULTY GRANTED TENURE, FALL 2016 TO FALL 2020
PROMOTIONS & TENURE
SEPARATIONS AMONG FULL-TIME FACULTY BY CAUSE AND APPOINTMENT STATUS, 2019-20 AND 2018-19
YEARTENURE STATUS
FULL-TIME HEAD COUNT
(FALL 2019)
DEATH NOT REHIRED RESIGNATION RETIREMENTTOTAL
SEPARATIONS
Count % Count % Count % Count % Count %
2019-20 Tenured 6,944 7 0.1% 2 0.0% 53 0.8% 380 5.5% 442 6.4%Probationary 3,584 0 0.0% 8 0.2% 114 3.2% 4 0.1% 126 3.5%Temporary 2,966 6 0.2% 72 2.4% 30 1.0% 94 3.2% 202 6.8%Total 13,494 13 0.1% 82 0.6% 197 1.5% 478 3.5% 770 5.7%
YEARTENURE STATUS
FULL-TIME HEAD COUNT
(FALL 2018)
DEATH NOT REHIRED RESIGNATION RETIREMENTTOTAL
SEPARATIONS
Count % Count % Count % Count % Count %
2018-19 Tenured 6,849 10 0.1% 1 0.0% 43 0.6% 347 5.1% 401 5.9%Probationary 3,585 2 0.1% 8 0.2% 102 2.8% 13 0.4% 125 3.5%Temporary 2,873 3 0.1% 47 1.6% 23 0.8% 76 2.6% 149 5.2%Total 13,307 15 0.1% 56 0.4% 168 1.3% 436 3.3% 675 5.1%
SEPARATIONS
3534
YEAR TENURE STATUSAFRICAN
AMERICAN / BLACK
OTHER / UNKNOWN*
ASIAN / PACIFIC
ISLANDER
HISPANIC / LATINX
WHITE GRAND TOTAL
2020 Tenured 275 438 1,546 718 4,776 7,753Probationary 200 422 800 417 1,653 3,492Temporary 720 1,624 1,904 2,067 9,374 15,689Total 1,195 2,484 4,250 3,202 15,803 26,934
2015 Tenured 269 324 1,317 683 5,017 7,610Probationary 104 275 568 258 1,503 2,708Temporary 577 1,401 1,620 1,576 9,841 15,015Total 950 2,000 3,505 2,517 16,361 25,333
INSTRUCTIONAL FACULTY HEAD COUNT BY TENURE STATUS AND RACE/ETHNICITY, FALL 2020 AND FALL 2015
*Other / Unknown includes individuals who identify as American Indian, two or more races and who did not indicate a race/ethnicity.
YEAR TENURE STATUS FEMALE MALE GRAND TOTAL
2020 Tenured 3,500 4,253 7,753Probationary 1,953 1,534 3,487Temporary 8,608 7,056 15,664Total 14,061 12,843 26,904
2015 Tenured 3,259 4,351 7,610Probationary 1,443 1,265 2,708Temporary 8,080 6,922 15,002Total 12,782 12,538 25,320
INSTRUCTIONAL FACULTY HEAD COUNT BY TENURE STATUS AND GENDER, FALL 2020 AND FALL 2015
The nonbinary category has grown by 61% since it was introduced in January 2019, however, as it represents 0.1% or less of the overall population in 2020 (n = 63), it is excluded from above totals. Also excluded from above totals are individuals whose gender identity was not reported in 2015 or 2020 (n = 15 for both years combined).
TIME BASE FACULTY RANKACADEMIC YEAR 12-MONTH
Head Count Average Salary Head Count Average Salary
Full-Time Professor 4,175 $112,244 548 $139,064Associate Professor 2,452 $97,255 74 $120,074Assistant Professor 3,300 $85,812 25 $99,664Lecturer 2,791 $65,944 131 $88,497Total 12,718 $92,335 778 $127,477
Part-Time Professor 576 $117,861Associate Professor 75 $98,866Assistant Professor 20 $87,857Lecturer 12,741 $59,751 26 $89,017Total 13,412 $62,508 26 $89,017Total 26,130 $77,025 804 $126,234
INSTRUCTIONAL FACULTY HEAD COUNT AND AVERAGE SALARY BY RANK AND APPOINTMENT TYPE, FALL 2020
CAMPUSTENURE TRACK
LECTURER ALL FACULTYProfessor
Associate Professor
Assistant Professor
All Tenure Track
Bakersfield 86 56 109 251 413 664Channel Islands 58 32 63 153 272 425Chico 201 106 143 450 469 919Dominguez Hills 128 71 112 311 639 950East Bay 140 91 128 359 497 856Fresno 257 148 198 603 817 1,420Fullerton 400 224 214 838 1,179 2,017Humboldt 111 61 64 236 250 486Long Beach 413 198 233 844 1,465 2,309Los Angeles 298 81 198 577 974 1,551Maritime 18 19 16 53 34 87Monterey Bay 66 45 72 183 263 446Northridge 443 188 174 805 1,138 1,943Pomona 273 131 177 581 833 1,414Sacramento 368 122 229 719 987 1,706San Bernardino 229 86 136 451 532 983San Diego 341 249 212 802 1,040 1,842San Francisco 376 178 186 740 925 1,665San Jose 327 145 277 749 1,224 1,973San Luis Obispo 360 169 182 711 553 1,264San Marcos 118 90 76 284 531 815Sonoma 142 46 69 257 251 508Stanislaus 146 65 77 288 403 691Systemwide 5,299 2,601 3,345 11,245 15,689 26,934
INSTRUCTIONAL FACULTY HEAD COUNT BY CAMPUS AND RANK, FALL 2020
SALARY
CAMPUS
INSTRUCTIONAL FACULTY HEAD COUNT BY RANK, FALL 2016 TO FALL 2020
Professor
Associate Professor Assistant Professor Lecturer
2016
5,277
2,448
2,937
15,572
5,315
2,358
3,167
16,018
5,333
2,259
3,411
16,131
5,353
2,343
3,436
16,550
5,299
2,601
3,345
15,689
2017 2018 2019 2020
36

MONICA PIGNOTTI DIGITAL MEDIA AND BRANDING COORDINATOR CALIFORNIA STATE UNIVERSITY, FULLERTON
Monica Pignotti isn’t the first in her family to go to college, but she’s the first to earn a degree. Though her parents were supportive, she worked to pay for college or earned scholarships in order to join one of the best communications programs in the state. She credits CSUF campus organizations such as PRSSA and the Latino Communications Institute for her positive transfer experience from community college. During her senior year, Pignotti worked as a student assistant for online and social engagement in the Strategic Communications department. “The support
and mentorship I had as a student employee taught me the invaluable lesson of collaborating with others and getting to know the campus through different perspectives. What I love about the CSU the most is no matter the department, we all share the same mission—to foster student success one way or another,” Pignotti said. Since graduating in 2019, she worked at Cal Poly Pomona and recently rejoined her alma mater as their digital media and branding coordinator for the GEAR UP program.
KINSEY MANGAN STUDENT, PROJECT MANAGER/UGS CALIFORNIA POLYTECHNIC STATE UNIVERSITY, SAN LUIS OBISPO
Kinsey Mangan is a project manager and one of many students working at University Graphic Systems (UGS), the Graphic Communication department’s student-run printing and design operation. Impacted this year by the pandemic, the UGS team anticipated there would be challenges. So when the campus facilities group decided to utilize COVID-19 signage on campus, UGS answered the call. The project illustrated firsthand to students the need to adapt a business to serve customers during unexpected conditions. With the help of advisers and staff,
UGC responded with the creation of a digital storefront, where customers could place orders online. And the students completed training on various machinery in the shop, supporting expanded capabilities and services. One new solution included a welcome kit for new students, designed to foster a connection to campus during remote learning. “Working at UGS is definitely a privilege,” Mangan said. “These are the kinds of things it seems like employers want to know about and I think we have a team that really takes that seriously.”
VANESSA POBLANO ASSISTANT TO THE ASSOCIATE VICE PRESIDENT FOR FACULTY AFFAIRS SONOMA STATE UNIVERSITY
Vanessa Poblano began her journey at Sonoma State University as a first-generation college student. During her second year in college she received the opportunity to work as a student assistant in the Human Resources department. At the time, she had no idea this job opportunity would be the start of her career at the university. Once she declared her major as criminal justice, she became the first intern of the Title IX department on campus. Poblano found it to be one of the most rewarding experiences as a student. Shortly after her graduation from the
university, she began working in Faculty Affairs, where she still works today. “Sonoma State University has been home for me for the last nine years. I am extremely grateful for all of the growth and the opportunities the university has provided me,” Poblano said.
MARIA ANGELICA GARCIA STUDENT HUMBOLDT STATE UNIVERSITY
Maria Angelica Garcia described her first days of being an engineering major at Humboldt State, 700 miles away from home as “a complete and total culture shock.” However, HSU’s Place-Based Learning Communities (PBLC)—a program that puts first-year science majors together in the same courses, housing blocks and introductory seminars enabled Garcia to quickly adapt to life among the redwoods. The PBLC program is just one of many CSU programs supporting Graduation Initiative 2025, which helps students belong and assimilate into campus
life, resulting in greater student success. As a STEM major, Garcia was introduced to her peer and faculty group through Klamath Connection in her first year. She then transitioned to the Retention through Academic Mentoring Program (RAMP), where she became a mentor and then a lead mentor. This provided two years of continuous connection with her peers. Now on track to graduate, Garcia plans to pursue her passion through grad school and a career in renewable energy.
3938CSU STUDENT WORKERS: OPPORTUNITY HAPPENS HERE
39

THE EMPLOYEES OF THECALIFORNIA STATE UNIVERSITYTABLE OF CONTENTSFall 2020
CSU STUDENT EMPLOYEESEMPLOYEESFall 2020
Represented by UAW (United Auto Workers), student employees make up 6 percent of the CSU’s workforce and include teaching associates (TA), graduate assistants (GA), and instructional student assistants (ISA). The Employee Profile began in 2019 to include represented student employees.
The CSU also employs more than 10,000 non-represented student employees, which include various types of hourly student assistants. Non-represented student workers have intermittent appointments and are not reported elsewhere in the profile. This is the first year these student workers are being reported, in recognition of their contribution to the CSU.
The pages that follow provide a campus-level summary of the populations of these student workers include breakdowns by race/ethnicity and gender.
REPRESENTED STUDENT EMPLOYEE HEAD COUNT BY CAMPUS AND RACE/ETHNICITY, FALL 2020
22.0% 47.3%
47.3%
CAMPUSAFRICAN
AMERICAN / BLACK
OTHER / UNKNOWN*
ASIAN / PACIFIC
ISLANDER
HISPANIC / LATINX
WHITEGRAND TOTAL
Bakersfield 0 1 2 4 12 19Channel Islands 0 0 0 0 5 5Chico 0 7 5 15 41 68Dominguez Hills 1 2 1 4 0 8East Bay 1 3 23 3 13 43Fresno 3 16 25 64 50 158Fullerton 5 23 32 54 81 195Humboldt 1 3 2 10 43 59Long Beach 13 24 84 134 159 414Los Angeles 6 10 29 89 33 167Maritime 0 0 0 0 0 0Monterey Bay 0 0 0 4 6 10Northridge 3 38 34 56 94 225Pomona 2 10 25 42 36 115Sacramento 3 12 13 16 65 109San Bernardino 11 12 20 77 38 158San Diego 23 36 129 172 343 703San Francisco 13 21 70 59 123 286San José 3 52 67 63 70 255San Luis Obispo 1 9 15 17 68 110San Marcos 0 5 11 33 28 77Sonoma 1 6 0 10 27 44Stanislaus 0 1 0 4 11 16Systemwide 90 291 587 930 1,346 3,244
REPRESENTED STUDENT EMPLOYEES
41
*Other / Unknown includes individuals who identify as American Indian, two or more races and who did not indicate a race/ethnicity.
REPRESENTED STUDENT EMPLOYEE HEAD COUNT BY CAMPUS AND GENDER, FALL 2020
CAMPUS FEMALE MALE GRAND TOTAL
Bakersfield 17 2 19Channel Islands 1 4 5Chico 40 28 68Dominguez Hills 7 1 8East Bay 27 16 43Fresno 85 73 158Fullerton 117 74 191Humboldt 37 22 59Long Beach 213 200 413Los Angeles 98 69 167Maritime 0 0 0Monterey Bay 6 4 10Northridge 108 114 222Pomona 62 53 115Sacramento 56 52 108San Bernardino 93 65 158San Diego 397 302 699San Francisco 140 140 280San José 136 117 253San Luis Obispo 56 54 110San Marcos 38 39 77Sonoma 32 12 44Stanislaus 11 5 16Systemwide 1,777 1,446 3,223
NON-REPRESENTED STUDENT EMPLOYEE HEAD COUNT BY CAMPUS AND RACE/ETHNICITY, FALL 2020
CAMPUSAFRICAN
AMERICAN / BLACK
OTHER / UNKNOWN*
ASIAN / PACIFIC ISLANDER
HISPANIC / LATINX
WHITEGRAND TOTAL
Bakersfield 20 18 23 152 35 248Chancellor's Office 2 3 6 2 13Channel Islands 6 12 11 116 27 172Chico 26 56 39 249 215 585Dominguez Hills 17 14 17 120 4 172East Bay 37 48 98 135 50 368Fresno 13 40 74 213 112 452Fullerton 35 43 154 329 79 640Humboldt 23 67 12 230 201 533Long Beach 59 70 185 411 112 837Los Angeles 13 6 34 190 12 255Maritime 12 15 18 35 80Monterey Bay 12 16 6 54 25 113Northridge 37 62 95 279 118 591Pomona 37 33 92 165 45 372Sacramento 65 107 190 316 157 835San Bernardino 19 31 29 220 34 331San Diego 116 127 153 391 283 1,068San Francisco 34 56 160 188 76 514San José 27 57 289 188 76 637San Luis Obispo 6 130 152 197 537 1,022San Marcos 16 20 22 115 32 205Sonoma 1 13 1 75 26 116Stanislaus 9 23 14 145 53 243Systemwide 628 1,063 1,868 4,502 2,346 10,402
NON-REPRESENTED STUDENT EMPLOYEE HEAD COUNT BY CAMPUS AND GENDER, FALL 2020
CAMPUS FEMALE MALE GRAND TOTAL
Bakersfield 157 91 248Chancellor's Office 7 6 13Channel Islands 128 43 171Chico 362 221 583Dominguez Hills 113 58 171East Bay 257 92 349Fresno 274 176 450Fullerton 409 226 635Humboldt 394 138 532Long Beach 568 260 828Los Angeles 164 90 254Maritime 28 52 80Monterey Bay 91 22 113Northridge 358 226 584Pomona 230 141 371Sacramento 510 309 819San Bernardino 217 113 330San Diego 725 333 1,058San Francisco 346 165 511San José 391 230 621San Luis Obispo 687 330 1,017San Marcos 143 61 204Sonoma 92 23 115Stanislaus 181 59 240Systemwide 6,832 3,465 10,297
Despite growth by 61% since the reporting category was introduced in January 2019, individuals identifying as non-binary only make up 0.1% of the overall population (n = 63) and are excluded from above totals, along with two individuals whose gender identity was not reported.
*Other / Unknown includes individuals who identify as American Indian, two or more races and who did not indicate a race/ethnicity.
NON-REPRESENTED STUDENT EMPLOYEES
42
There were a total of 5 non-represented student employees identifying as non-binary and 100 individuals whose gender identity was not reported in 2020; these 105 individuals are not reported in the above summary.

ACKNOWLEDGEMENTSOur thanks to the campus human resource teams and photographers who supported this annual Employee Profile, which showcases employment data analytics and notable employee accomplishments. While not all of the assets were utilized in this issue— we greatly appreciated your time, effort and contributions which helped reflect campus life at the CSU, and the valued work of our employees across the system.
CHANCELLOR’S OFFICECHICO STATE | Cover, Page 4, 14CSU EAST BAY | Page 8FRESNO STATE | Page 45CAL STATE FULLERTON | Page 8, 16HUMBOLDT STATE | Page 44CSU LONG BEACH | Page 31, 44CAL STATE LACSUN | Page 8, 9CSU MONTEREY BAYCAL POLY POMONA | Page 44SACRAMENTO STATE | Page 2, 24, 25SAN DIEGO STATESAN JOSE STATE | Page 8, 21CAL POLY SAN LUIS OBISPO | Page 27, 37, 38, 43, 46SONOMA STATE | Page 28, 44STANISLAUS STATE | Page 40, 43, 44
45
THE EMPLOYEES OF THECALIFORNIA STATE UNIVERSITYTABLE OF CONTENTSFall 2020
TECHNICAL NOTES AND GLOSSARYFall 2020
TECHNICAL NOTES• This reference booklet contains fall 2020 snapshot information on employees at all 23 campuses and the Chancellor’s Office.
• All tables and charts in the Employee Profile exclude student employees (unless otherwise noted), other intermittent or casual employees, and faculty teaching in extension, special sessions and summer sessions.
• Employees are included regardless of how their salaries are funded.
• Beginning this year, Employee Group replaces Bureau of Labor Statistics (BLS) Standard Occupational Classification (SOC) because it aligns with the CSU’s reporting practices. As a result, data for these groups cannot be compared to previous Employee Profiles.
• Data presented in this report were obtained from the annual university-wide Integrated Postsecondary Education Data System Human Resources Survey (IPEDS-HR) extract, from the CSU’s Campus Information Retrieval System (CIRS), and from the annual Faculty Recruitment and Retention Survey.
• Percentages referenced throughout the report may not add up to 100 because of rounding.
GLOSSARY
Academic Student EmployeeEmployees whose primary appointment is as a teaching associate, graduate assistant or instructional student assistant.
Instructional FacultyAll regular instructional faculty, including department chairs and lecturers. Excludes librarians, coaches, and counselors. Also excludes extension or summer session faculty.
Non-Instructional Faculty Librarians, coaches, and counselors.
StaffEmployees with a primary appointment other than faculty or student employee. Excludes executives and management.
Executives and ManagementChancellor's Office executives, campus presidents, and all Management Personnel Plan (MPP) employees.
Represented Student EmployeesTeaching associates (TA), graduate assistants (GA) and instructional student assistants (ISA) who are represented by UAW.
Non-Represented Student Employees
Student employees not represented by a labor union.
Full-Time Individuals employed “100 percent of time”, includes full-time employees on leave with pay.
Lecturer Includes all instructional faculty with temporary appointments (non-tenure track).
Part-TimeIncludes employees whose assignments at a given campus are less than 100 percent of time. Individuals employed simultaneously at two campuses are counted as two employees.
Probationary FacultyTenure-track faculty who have not been awarded tenure. Also includes individuals who may have been denied tenure and are serving their terminal year.
Tenured Faculty Tenure-track faculty who have been awarded tenure.
464646
Questions about the data in the Employee Profile should be directed to: [email protected]
47

127,
000+
DEG
REES
23 CAMPUSES1 UNIVERSITY
NEARLY 56,000 FACULTY & STAFF
3.9 MILLION ALUMNI482,000
401 Golden Shore, Long Beach, CA 90802-4210calstate.edu
March 2021 | Prepared By SWHR Data Analysis