the efficiency of smallholder agriculture in...
TRANSCRIPT
AFJARE Vol 3 No 2 September 2009 Hardwick Tchale
101
The efficiency of smallholder agriculture in Malawi
HARDWICK TCHALE
World Bank, Lilongwe, Malawi
Abstract
This paper analyses Malawi’s smallholder agricultural efficiency, using a nationally representative sample survey of rural households undertaken by the National Statistical Office in 2004/2005. It aims to inform agricultural policy about the level and key determinants of inefficiency in the smallholder farming system that need to be addressed to raise productivity. The study found that the factors that improve efficiency are higher output prices relative to input costs, favorable commodity and input markets, farmers’ organizations, extension, productive assets, and the quantity and productivity of household labor. The wide range of inefficient practices suggests there is considerable scope for improving efficiency in the smallholder sub-sector. The paper concludes with policy implications that highlight ways to achieve this goal.
Keywords: smallholder agriculture; efficiency; Malawi
Cet article analyse l’efficacité agricole des petits fermiers du Malawi au moyen d’une étude, entreprise en 2004/2005 par l’Office National des Statistiques, d’un échantillon représentatif de l’ensemble du pays des exploitants agricoles des zones rurales. Celle-ci a pour but de présenter la politique agricole concernant le niveau et les déterminants clés de l’inefficacité des systèmes d’exploitation des petits fermiers devant être abordés pour en accroire la productivité. L’étude a révélé que les facteurs capables d’améliorer l’efficacité sont les suivants : des prix de rendement plus élevés par rapport aux prix des entrées, produits et marchés des entrées favorables, organisations des fermiers, vulgarisation et outils de production des fermiers, ainsi que la productivité et le travail des exploitants. Le large éventail des pratiques inefficaces suggère qu’il existe une marge considérable quant à l’amélioration de l’efficacité dans le sous-secteur des petits fermiers. L’article se termine sur les implications de la politique qui mettent l’accent sur les différentes façons de réaliser cet objectif.
Mots-clés : agriculture des petits fermiers ; efficacité ; Malawi
Correspondence: [email protected]
AFJARE Vol 3 No 2 September 2009 Hardwick Tchale
102
1. Introduction
Since independence, 45 years ago, agriculture has continued to play a central role in defining Malawian rural livelihoods. It employs over 85% of the rural population, normally accounts for 35–40% of Gross Domestic Product (GDP), and contributes over 90% to total export earnings (GoM, 2007b). Tobacco is the major export earner and contributes approximately 65% of the country’s export earnings, followed by tea at 8% and sugar at 6%. Maize is the major food crop, cultivated on over 60% of the arable area.
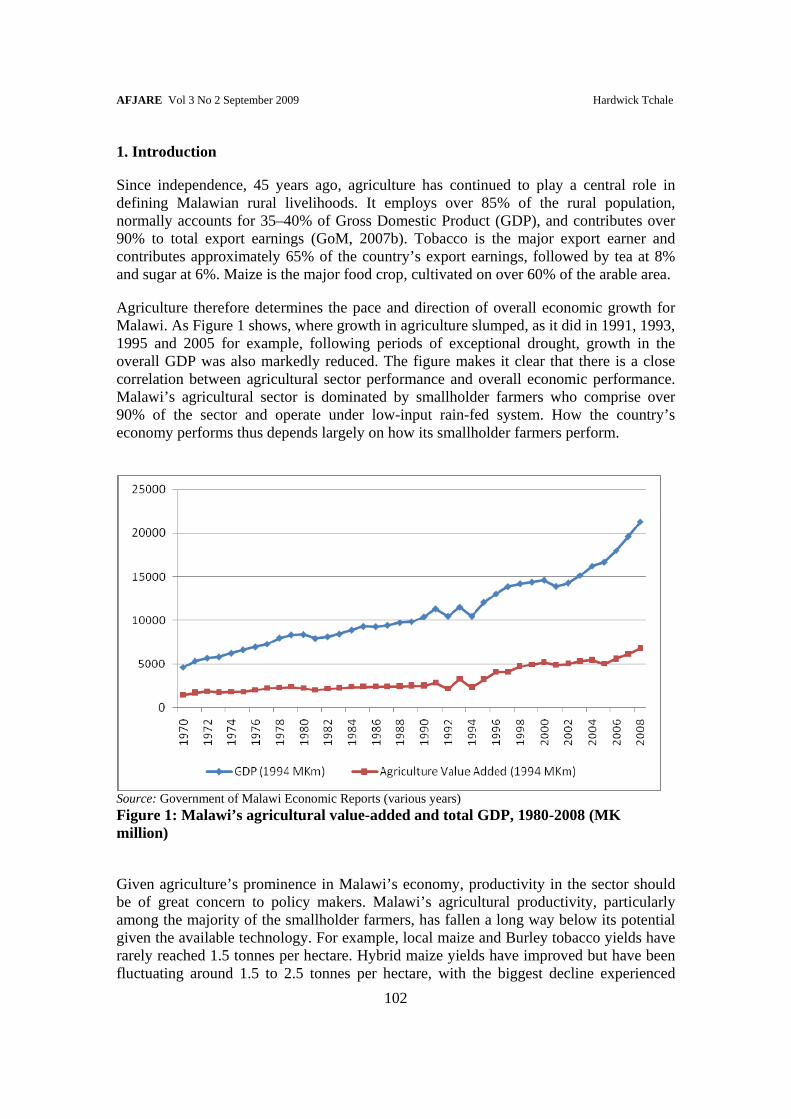
Agriculture therefore determines the pace and direction of overall economic growth for Malawi. As Figure 1 shows, where growth in agriculture slumped, as it did in 1991, 1993, 1995 and 2005 for example, following periods of exceptional drought, growth in the overall GDP was also markedly reduced. The figure makes it clear that there is a close correlation between agricultural sector performance and overall economic performance. Malawi’s agricultural sector is dominated by smallholder farmers who comprise over 90% of the sector and operate under low-input rain-fed system. How the country’s economy performs thus depends largely on how its smallholder farmers perform.
Source: Government of Malawi Economic Reports (various years) Figure 1: Malawi’s agricultural value-added and total GDP, 1980-2008 (MK million)
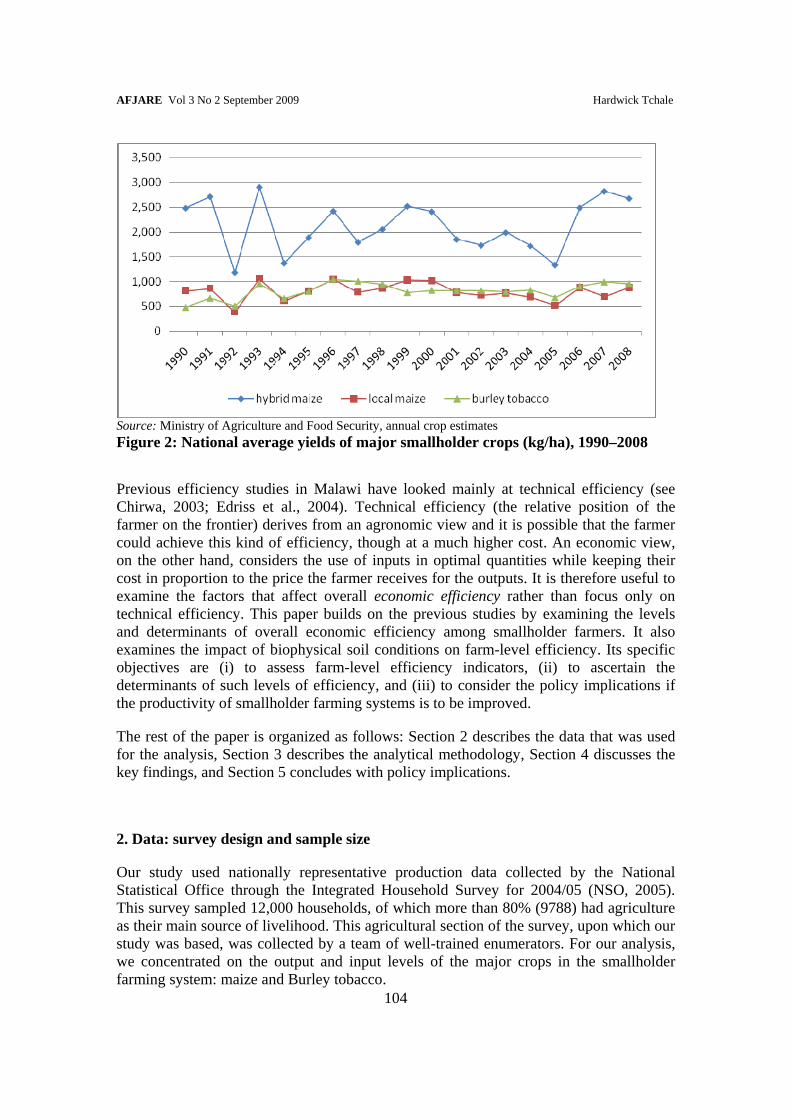
Given agriculture’s prominence in Malawi’s economy, productivity in the sector should be of great concern to policy makers. Malawi’s agricultural productivity, particularly among the majority of the smallholder farmers, has fallen a long way below its potential given the available technology. For example, local maize and Burley tobacco yields have rarely reached 1.5 tonnes per hectare. Hybrid maize yields have improved but have been fluctuating around 1.5 to 2.5 tonnes per hectare, with the biggest decline experienced

AFJARE Vol 3 No 2 September 2009 Hardwick Tchale
103
between 1999 and 2005. The average hybrid maize yield has, however, been increasing consistently since 2006, mainly as a result of the input subsidy program and the heavier and better distributed rains.
The yield stagnation and fluctuations of the first half of the 1990s can be attributed to factors such as low adoption and less intensive use of productive agricultural technologies, unreliable rainfall, production inefficiencies and poor soils – like other countries in sub-Saharan Africa, Malawi’s soils have been depleted of essential nutrients as a result of increased pressure on land and insufficient inputs. A study conducted by Smaling in 1998 indicated that Malawi’s soils lose on average 40.0, 6.6 and 32.2 kg per hectare per year of nitrogen (N), phosphorus (P) and potassium (K), respectively. Apart from declining soil fertility, Malawi’s land holding sizes, especially in the smallholder sector, are also declining. According to the Malawi Poverty and Vulnerability Assessment report (GoM, 2007a), over 90% of the total agricultural value-added comes from about 1.8 million smallholders who own on average less than 1.0 ha of land. Land pressure is particularly intense in the southern region of Malawi where the per capita average landholding size can be as low as 0.1 ha, whereas the average per capita landholding size in the other regions is 0.2 ha and more.
Malawi’s agricultural productivity is therefore under threat. The 2008 Population Census estimated the country’s population at 13.1 million and growing at 2.8% per annum, possibly doubling by 2025. This puts enormous pressure on agriculture to grow at levels sufficient to feed the growing population. Given the declining land holding sizes, the only plausible way to improve agricultural productivity is to enhance efficiency.
To maintain high productivity in the face of declining land holding sizes, there is a particular need to improve the efficiency of the smallholder sub-sector, which is by far the largest, with nearly three million farm families cultivating on over 70% of Malawi’s arable land held under customary tenure. There is a wide gap between yields observed in on-farm and experimental trials and the actual yields obtained by farmers. For example, while potential yields for hybrid maize range from 5 to 8 tons per hectare, the average actual yields range from 1.5 to 2.5 tons and rarely exceed this. Evidence from past studies suggests that levels of efficiency among the majority of Malawian smallholders are low to moderate (see for instance Chirwa, 2003). This gap between potential and actual average farm crop yields suggests abundant scope for improvements in productivity.
AFJARE Vol 3 No 2 September 2009 Hardwick Tchale
104
Source: Ministry of Agriculture and Food Security, annual crop estimates Figure 2: National average yields of major smallholder crops (kg/ha), 1990–2008
Previous efficiency studies in Malawi have looked mainly at technical efficiency (see Chirwa, 2003; Edriss et al., 2004). Technical efficiency (the relative position of the farmer on the frontier) derives from an agronomic view and it is possible that the farmer could achieve this kind of efficiency, though at a much higher cost. An economic view, on the other hand, considers the use of inputs in optimal quantities while keeping their cost in proportion to the price the farmer receives for the outputs. It is therefore useful to examine the factors that affect overall economic efficiency rather than focus only on technical efficiency. This paper builds on the previous studies by examining the levels and determinants of overall economic efficiency among smallholder farmers. It also examines the impact of biophysical soil conditions on farm-level efficiency. Its specific objectives are (i) to assess farm-level efficiency indicators, (ii) to ascertain the determinants of such levels of efficiency, and (iii) to consider the policy implications if the productivity of smallholder farming systems is to be improved.
The rest of the paper is organized as follows: Section 2 describes the data that was used for the analysis, Section 3 describes the analytical methodology, Section 4 discusses the key findings, and Section 5 concludes with policy implications.
2. Data: survey design and sample size
Our study used nationally representative production data collected by the National Statistical Office through the Integrated Household Survey for 2004/05 (NSO, 2005). This survey sampled 12,000 households, of which more than 80% (9788) had agriculture as their main source of livelihood. This agricultural section of the survey, upon which our study was based, was collected by a team of well-trained enumerators. For our analysis, we concentrated on the output and input levels of the major crops in the smallholder farming system: maize and Burley tobacco.

AFJARE Vol 3 No 2 September 2009 Hardwick Tchale
105
The crop technology is characterized by the total value of crops grown at the farm household level. Although the survey collected plot level data for each household, it was problematic to use this data to analyze efficiency given that productive resources are non-divisible, especially at the household level. The analysis of efficiency in this paper is therefore done at the household level. By ‘household’ we mean a unitary decision-making entity, usually husband, wife and children – the typical composition of rural households in Malawi. The key inputs at this level are (i) land, (ii) labor (family as well as hired), (iii) fertilizer and (iv) seed, where applicable. Land was measured in hectares and each plot area was verified by data collectors using tape measures. Labor was measured in hours devoted to agricultural activities per week based on farmers’ recall. Fertilizer was measured in kilograms and included both the basal and top-dressing applications. Seed was measured in monetary values rather than physical units because different types of seed were planted and it was easier for farmers to recall what they had paid than how much they had planted.
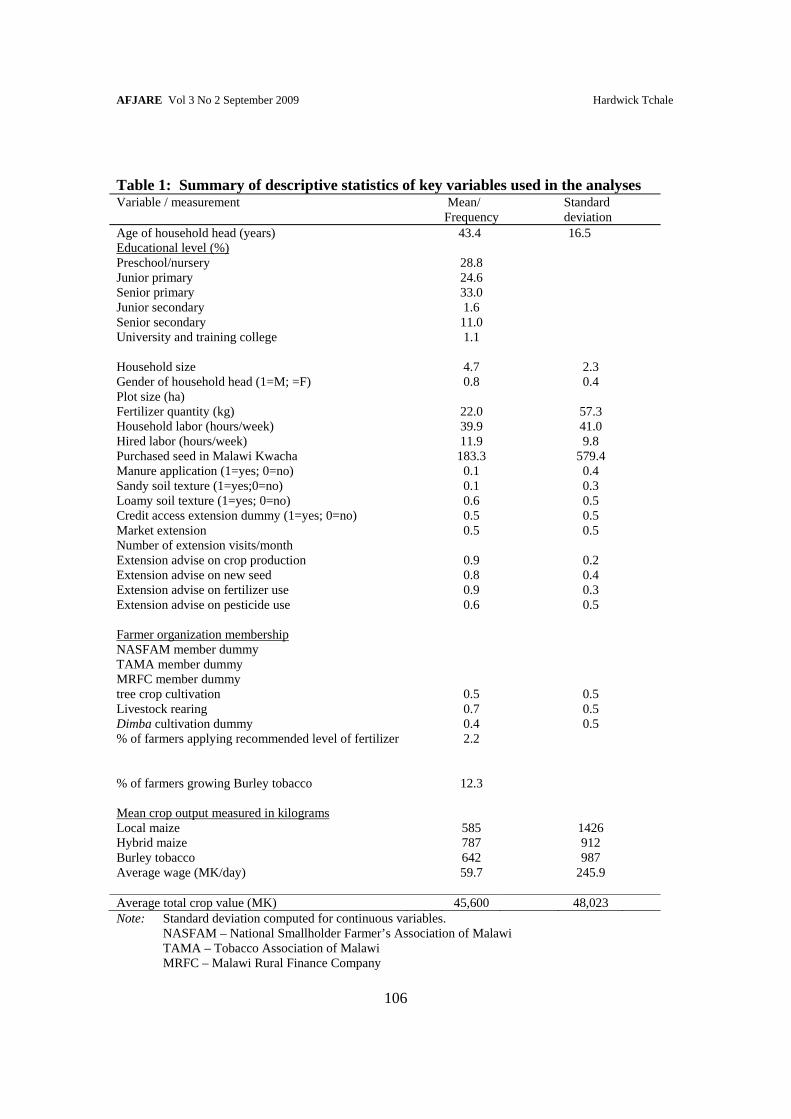
Other variables apart from the crop output value and input levels and costs were the household socioeconomic factors such as household size, and the age, gender and educational level of the household head. Other control variables were the policy and institutional issues such as access to agricultural markets, extension services and membership of farmers’ organizations. We included specific proxy variables to control for area specific biophysical characteristics that affect productivity such as soil texture classes, cation exchange capacity1 and water requirement index. These variables were constructed from national GIS data collected by the Ministry of Agriculture’s Land Resources Conservation Department, courtesy of the National Spatial Data Centre. Other control variables include asset endowments, particularly in livestock, the availability of other non-traditional crops such as tree crops, and dimba cultivation.2 The descriptive statistics for all the outputs and inputs are summarized in Table 1, and Table 2 shows the aggregate household level productivity measures and factor endowments.
1 A cation is an ion with more protons than electrons, and cation exchange capacity is the capacity of a soil for exchange of cations between the soil and the soil solution. 2 Dimbas are areas that have residual moisture and are used for growing crops under small-scale irrigation.
AFJARE Vol 3 No 2 September 2009 Hardwick Tchale
106
Table 1: Summary of descriptive statistics of key variables used in the analyses Variable / measurement Mean/
Frequency Standard deviation
Age of household head (years) 43.4 16.5 Educational level (%) Preschool/nursery 28.8 Junior primary 24.6 Senior primary 33.0 Junior secondary 1.6 Senior secondary 11.0 University and training college 1.1 Household size 4.7 2.3 Gender of household head (1=M; =F) 0.8 0.4 Plot size (ha) Fertilizer quantity (kg) 22.0 57.3 Household labor (hours/week) 39.9 41.0 Hired labor (hours/week) 11.9 9.8 Purchased seed in Malawi Kwacha 183.3 579.4 Manure application (1=yes; 0=no) 0.1 0.4 Sandy soil texture (1=yes;0=no) 0.1 0.3 Loamy soil texture (1=yes; 0=no) 0.6 0.5 Credit access extension dummy (1=yes; 0=no) 0.5 0.5 Market extension 0.5 0.5 Number of extension visits/month Extension advise on crop production 0.9 0.2 Extension advise on new seed 0.8 0.4 Extension advise on fertilizer use 0.9 0.3 Extension advise on pesticide use 0.6 0.5 Farmer organization membership NASFAM member dummy
TAMA member dummy MRFC member dummy tree crop cultivation 0.5 0.5 Livestock rearing 0.7 0.5 Dimba cultivation dummy 0.4 0.5 % of farmers applying recommended level of fertilizer 2.2
% of farmers growing Burley tobacco 12.3 Mean crop output measured in kilograms Local maize Hybrid maize Burley tobacco
585 787 642
1426 912 987
Average wage (MK/day) 59.7 245.9 Average total crop value (MK) 45,600 48,023 Note: Standard deviation computed for continuous variables. NASFAM – National Smallholder Farmer’s Association of Malawi TAMA – Tobacco Association of Malawi MRFC – Malawi Rural Finance Company

AFJARE Vol 3 No 2 September 2009 Hardwick Tchale
107
Table 2: Aggregate productivity measures and factor endowment Productivity and factor endowment measures
Hybrid maize
(n= 5751)
Local/composite maize
(n= 4027 )
Burley tobacco
(n= 1403)
Total (n= 9788)
Crop yield (kg/ha) 787.3(912.4)
585.2(636.8)
942.3 (968.9)
-
Crop value (MK/ha) 13,893(16,078)
10,305(11,286)
21,749 (48,140)
45,600(48,023)
Family labor intensity (hours/ week) 39.6(76.2)
33.2(84.8)
91.4 (154.9)
92. 6(19.8)
Hired labor intensity in (man-days/ season)
4.8(15.1)
2.9 (11.2)
4.2 (9.9)
11.9(9.8)
Fertilizer intensity (kg/ha) 44.5(31.9)
22.0(57.3)
67.1 (136.2)
125.0(176.0)
Family labor productivity (MK/ ha) 524(174.2)
343(964.6)
1,648 (856)
3,500(2,853)
Seed cost (MK) 524(941)
212(729)
- 940(854)
Total land (ha) 0.98
(0.92)0.86
(0.79)0.62
(0.41) 1.24
(1.17)Note: Figures in parentheses are standard deviations. Malawi Kwacha (MK) is the local currency (1US$ = MK122.00 as of January 2006)
3. Analytical methodology
A number of alternative approaches are used to measure productive efficiency. The original approaches are based on what are called frontiers, as proposed by Farrell (1957). A frontier defines the maximum feasible output in an environment characterized by a given set of random factors. The ratio of the observed output to the frontier is taken as a conventional measure of its relative efficiency. Two types of frontiers have been used in empirical estimations: parametric and non-parametric frontiers. The former use econometric approaches to make assumptions about the error terms in the data generation process and also impose functional forms on the production functions, while the latter neither impose any functional form nor make assumptions about the error terms. The parametric approach essentially implies that structural restrictions are imposed and the effects of misspecification of the functional form might be confounded with the inefficiency. The non-parametric approaches (e.g. data envelopment analysis – DEA) are free from misspecification but they do not account for the effect of other factors that are normally not under the control of the farmer and thus are not good for studying efficiency at the smallholder farmer level where conditions are highly heterogeneous.
We chose to use the parametric frontier approach because of the many variations that underlie smallholder production in developing countries. The stochastic frontier attributes part of the deviation to random errors (reflecting measurement errors and statistical noise) and farm specific inefficiency (Forsund et al., 1980; Battese & Coelli, 1995; Coelli et al.,
AFJARE Vol 3 No 2 September 2009 Hardwick Tchale
108
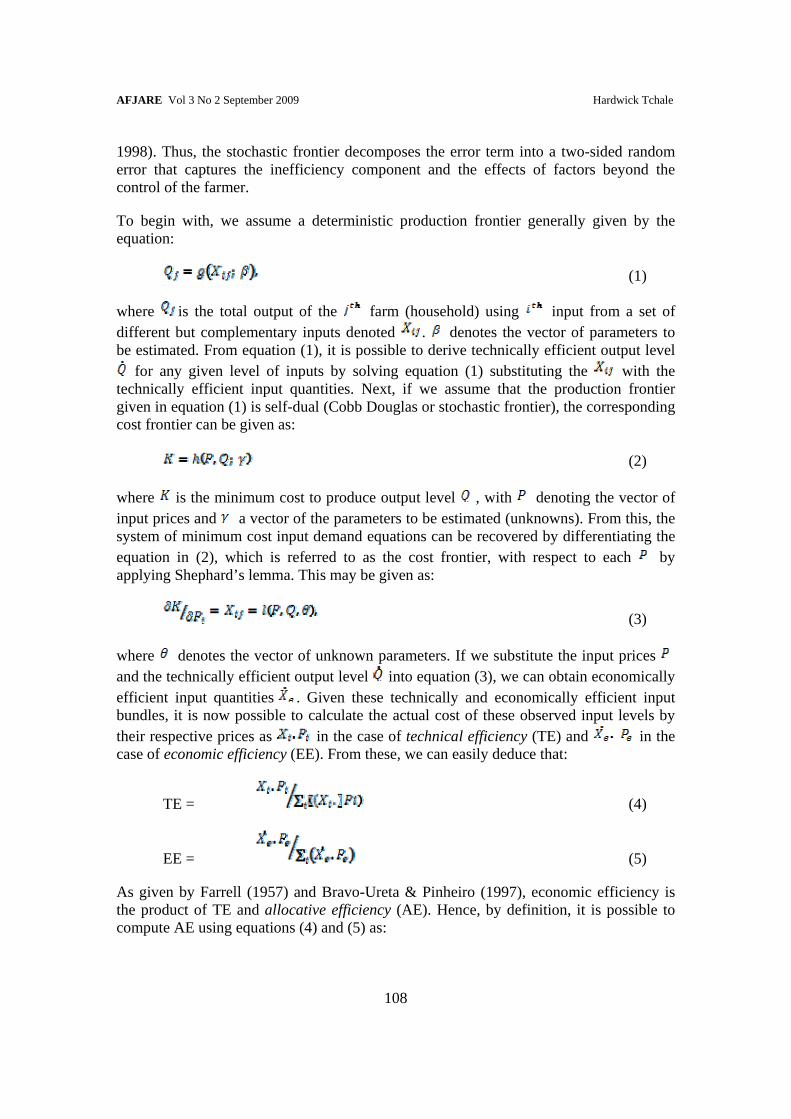
1998). Thus, the stochastic frontier decomposes the error term into a two-sided random error that captures the inefficiency component and the effects of factors beyond the control of the farmer.
To begin with, we assume a deterministic production frontier generally given by the equation:
(1)
where is the total output of the farm (household) using input from a set of different but complementary inputs denoted . denotes the vector of parameters to be estimated. From equation (1), it is possible to derive technically efficient output level
for any given level of inputs by solving equation (1) substituting the with the technically efficient input quantities. Next, if we assume that the production frontier given in equation (1) is self-dual (Cobb Douglas or stochastic frontier), the corresponding cost frontier can be given as:
(2)
where is the minimum cost to produce output level , with denoting the vector of input prices and a vector of the parameters to be estimated (unknowns). From this, the system of minimum cost input demand equations can be recovered by differentiating the equation in (2), which is referred to as the cost frontier, with respect to each by applying Shephard’s lemma. This may be given as:
(3)
where denotes the vector of unknown parameters. If we substitute the input prices and the technically efficient output level into equation (3), we can obtain economically efficient input quantities . Given these technically and economically efficient input bundles, it is now possible to calculate the actual cost of these observed input levels by their respective prices as in the case of technical efficiency (TE) and in the case of economic efficiency (EE). From these, we can easily deduce that:
TE = (4)
EE = (5)
As given by Farrell (1957) and Bravo-Ureta & Pinheiro (1997), economic efficiency is the product of TE and allocative efficiency (AE). Hence, by definition, it is possible to compute AE using equations (4) and (5) as:

AFJARE Vol 3 No 2 September 2009 Hardwick Tchale
109
AE = (6)
Technical efficiency is the ability of the firm or farm to maximize output for a given set of resource inputs. Allocative efficiency is its ability to use the inputs at its disposal in optimal proportions given their respective prices and the available production technology. Thus, TE is the farmer’s ability to produce on the maximum possible frontier, AE is the farmer’s ability to produce a given level of output using the cost minimizing input ratios, and EE is the farmer’s ability to produce a predetermined quantity of output at minimum cost given the available technology.3
To obtain the parametric measure of efficiency, a functional form for the stochastic production frontier is chosen. Ideally, the functional form should be flexible and computationally straightforward. To satisfy these properties, most empirical studies use the translog function. Following Battesse & Coelli (1995), the translog specification is mathematically expressed as:
0
1 1 1
1ln( ) ln( ) ln( ) ln( )
2
n n n
j i ij ij i j j ji i j i
q x x x v u
(7)
where jq is the total crop output value obtained by the farm household per given season,
ijx are the inputs, 0.... ij are the parameters to be estimated, vj is a two-sided random
error and is assumed to be identically and independently distributed with zero mean and constant variance and is independent of the one-sided error, uj. Furthermore, to obtain estimates for the cost frontier, we estimate a stochastic cost frontier where the natural log of total cost is regressed against the natural log of specific input prices/wages (fertilizer, hired labor and seed). We then specify the one-sided technical efficiency effect as being related to the exogenous factors that influence crop production:
ju f z (8)
where z is a vector of determinants of technical efficiency and is the error assumed to be iid (independent and identically distributed). The determinants are specified as household socioeconomic characteristics and some selected policy and institutional variables that are known to influence farm-level efficiency. Some variables that have been given prominence in the literature are farmer’s education, access to extension, organizational skills, farmer’s access to improved technologies through the market or public policy interventions and land holding size. Most studies find that household variables such as household size, gender and education positively influence farm-level efficiency mainly through availability of labor and its productivity, although in some
3 In the analysis, we estimated the technical and allocative efficiency levels, and economic efficiency was taken as a residual since EE = TE * AE.

AFJARE Vol 3 No 2 September 2009 Hardwick Tchale
110
cases these relationships are not supported by other empirical studies (e.g. Mochobelele & Winter-Nelson, 2000, in the case of Lesotho). Extension and access to markets are important policy and institutional variables that positively influence efficiency, because on the one hand they provide the incentive and means for farmers to access improved crop technology and on the other they improve farmers’ liquidity and the affordability of the inputs required for production. While the relationship between most of these household level, policy and institutional variables and farm-level efficiency is straightforward, that between farm size and efficiency has not been very explicit. Some studies have reported a positive relationship between farm size and efficiency, while others have found an inverse or weakly positive relationship (Heshmati & Mulugeta, 1996; Townsend et al., 1998). In this analysis we have also examined this relationship because we believe it is important for agricultural policy to cater for the specific needs of farmers according to their scale, especially in Malawi where most farm households have very small landholdings.
Other studies have extended the specification of variables affecting efficiency to include environmental and ecological variables because they argue that not to do so results in omitted variable bias, which leads to overestimation of technical inefficiency (see for example Sherlund et al., 2002; Okike et al., 2004). This is particularly important because in most farming systems in sub-Saharan Africa there are significant variations in terms of plot-level biophysical and soil chemical characteristics, so in estimating production functions we have controlled for soil conditions so as to take care of this concern.
In estimating the SF production functions, we have imposed some key economic regularity conditions, such as monotonicity and diminishing marginal productivity of all inputs, to ensure that the results conform to these conditions. The estimation for the efficiency model is conducted in STATA.4
4. Discussion of the key results
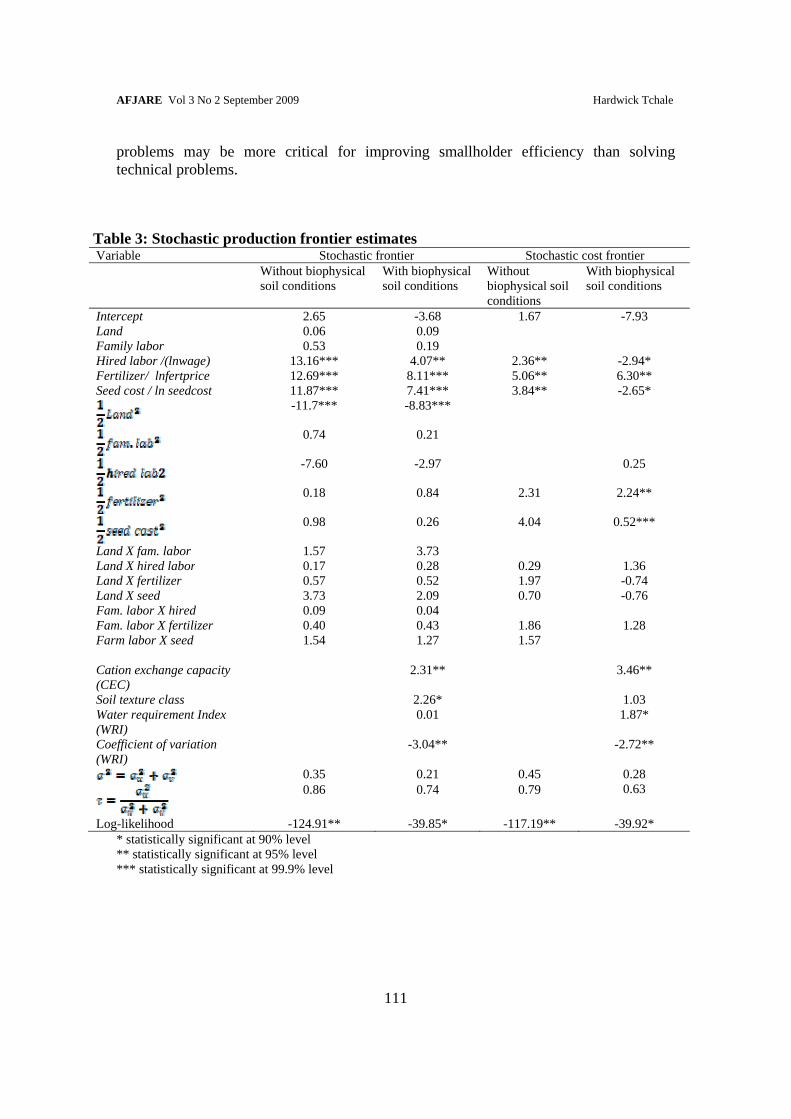
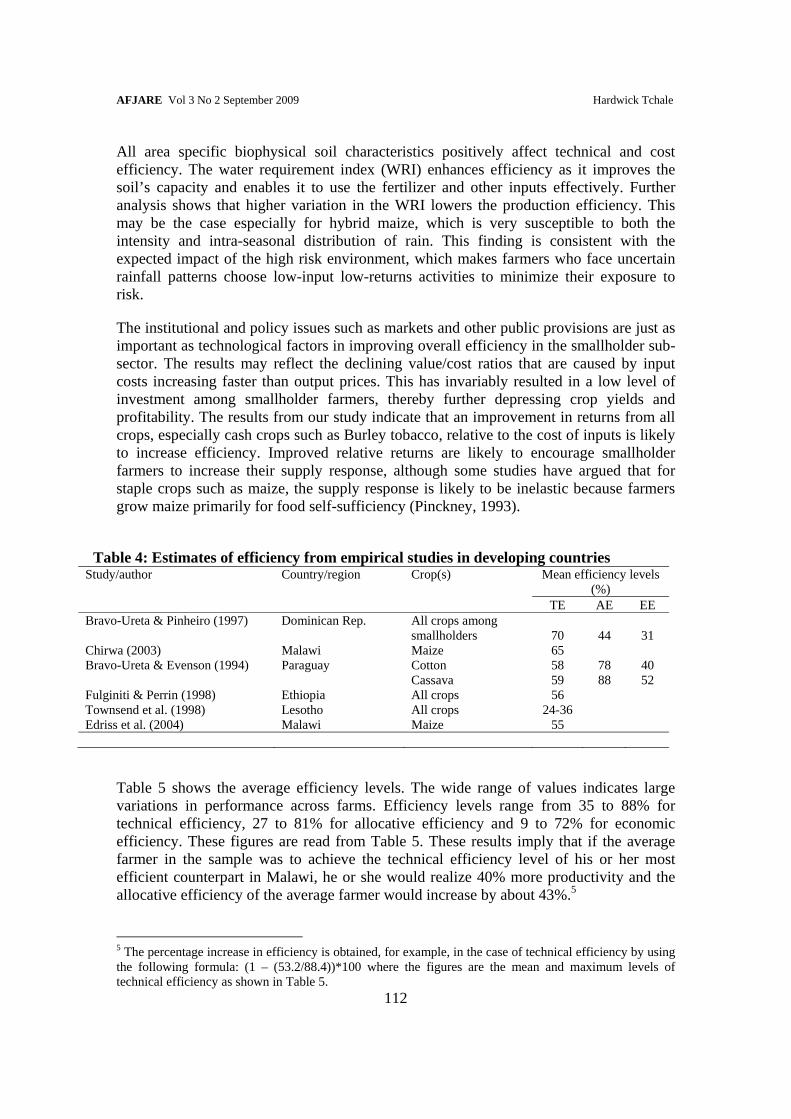
As Table 3 shows, all the estimated equations are significant (given the log-likelihood ratios) and a number of estimated parameters have the expected signs. The efficiency estimates have been predicted on the basis of these equations. In general our analysis indicates that fertilizer and land are the key factors in the production of the major crops grown by the majority of smallholder farmers. Labor is also a key variable, especially among farmers who grow labor intensive crops within the maize-based smallholder farming system. The average level of technical, allocative and economic efficiency is estimated at 53%, 46% and 38%, respectively. These efficiency levels are fairly comparable with findings from studies conducted in other developing countries (Table 4). The results generally highlight the relative inefficiency that characterizes smallholder agriculture in Malawi. The results further indicate that allocative inefficiency is worse than technical inefficiency, which implies that the low level of overall economic efficiency is the result of higher cost inefficiency. This suggests that solving allocation
4 Data analysis and statistical software package developed in 1985 by Statacorp.
AFJARE Vol 3 No 2 September 2009 Hardwick Tchale
111
problems may be more critical for improving smallholder efficiency than solving technical problems.
Table 3: Stochastic production frontier estimates Variable Stochastic frontier Stochastic cost frontier Without biophysical
soil conditions With biophysical soil conditions
Without biophysical soil conditions
With biophysical soil conditions
Intercept 2.65 -3.68 1.67 -7.93 Land 0.06 0.09 Family labor 0.53 0.19 Hired labor /(lnwage) 13.16*** 4.07** 2.36** -2.94* Fertilizer/ lnfertprice 12.69*** 8.11*** 5.06** 6.30** Seed cost / ln seedcost 11.87*** 7.41*** 3.84** -2.65*
-11.7*** -8.83***
0.74 0.21
-7.60 -2.97 0.25
0.18 0.84 2.31 2.24**
0.98 0.26 4.04 0.52***
Land X fam. labor 1.57 3.73 Land X hired labor 0.17 0.28 0.29 1.36 Land X fertilizer 0.57 0.52 1.97 -0.74 Land X seed 3.73 2.09 0.70 -0.76 Fam. labor X hired 0.09 0.04 Fam. labor X fertilizer 0.40 0.43 1.86 1.28 Farm labor X seed 1.54 1.27 1.57 Cation exchange capacity (CEC)
2.31** 3.46**
Soil texture class 2.26* 1.03 Water requirement Index (WRI)
0.01 1.87*
Coefficient of variation (WRI)
-3.04** -2.72**
0.35 0.21 0.45 0.28 0.63
0.86 0.74 0.79
Log-likelihood -124.91** -39.85* -117.19** -39.92* * statistically significant at 90% level ** statistically significant at 95% level *** statistically significant at 99.9% level
AFJARE Vol 3 No 2 September 2009 Hardwick Tchale
112
All area specific biophysical soil characteristics positively affect technical and cost efficiency. The water requirement index (WRI) enhances efficiency as it improves the soil’s capacity and enables it to use the fertilizer and other inputs effectively. Further analysis shows that higher variation in the WRI lowers the production efficiency. This may be the case especially for hybrid maize, which is very susceptible to both the intensity and intra-seasonal distribution of rain. This finding is consistent with the expected impact of the high risk environment, which makes farmers who face uncertain rainfall patterns choose low-input low-returns activities to minimize their exposure to risk.
The institutional and policy issues such as markets and other public provisions are just as important as technological factors in improving overall efficiency in the smallholder sub-sector. The results may reflect the declining value/cost ratios that are caused by input costs increasing faster than output prices. This has invariably resulted in a low level of investment among smallholder farmers, thereby further depressing crop yields and profitability. The results from our study indicate that an improvement in returns from all crops, especially cash crops such as Burley tobacco, relative to the cost of inputs is likely to increase efficiency. Improved relative returns are likely to encourage smallholder farmers to increase their supply response, although some studies have argued that for staple crops such as maize, the supply response is likely to be inelastic because farmers grow maize primarily for food self-sufficiency (Pinckney, 1993).
Table 4: Estimates of efficiency from empirical studies in developing countries
Study/author Country/region Crop(s) Mean efficiency levels (%)
TE AE EE Bravo-Ureta & Pinheiro (1997) Dominican Rep. All crops among
smallholders
70
44
31 Chirwa (2003) Malawi Maize 65 Bravo-Ureta & Evenson (1994) Paraguay Cotton
Cassava 58 59
78 88
40 52
Fulginiti & Perrin (1998) Ethiopia All crops 56 Townsend et al. (1998) Lesotho All crops 24-36 Edriss et al. (2004) Malawi Maize 55
Table 5 shows the average efficiency levels. The wide range of values indicates large variations in performance across farms. Efficiency levels range from 35 to 88% for technical efficiency, 27 to 81% for allocative efficiency and 9 to 72% for economic efficiency. These figures are read from Table 5. These results imply that if the average farmer in the sample was to achieve the technical efficiency level of his or her most efficient counterpart in Malawi, he or she would realize 40% more productivity and the allocative efficiency of the average farmer would increase by about 43%.5
5 The percentage increase in efficiency is obtained, for example, in the case of technical efficiency by using the following formula: (1 – (53.2/88.4))*100 where the figures are the mean and maximum levels of technical efficiency as shown in Table 5.

AFJARE Vol 3 No 2 September 2009 Hardwick Tchale
113
Table 5: Average technical, allocative and economic efficiency of Malawian smallholder farmers
Average efficiency (%) Min Max
Total farm-level TE 53 35 88 AE 46 27 81 EE 38 9 72
Source: Author’s calculations (predictions from the estimated stochastic frontier)
0
20
40
60
80
100
<30% 30-50% 51-70% 71-80% >80%
% o
f far
mer
s
TE AE EE
Figure 3: Average efficiency in smallholder farming in Malawi
The distribution of efficiency estimates in Figure 3 suggests that the scope for efficiency gains is fairly large. Technical efficiency in smallholder farming systems could be increased by up to 40% on average, using the current production technology. By simple analogy, this implies that smallholder productivity could nearly double using current production technology, if key factors that currently constrain overall efficiency are adequately addressed.
On a national scale, therefore, the effect of a marginal increase in both technical and allocative efficiency could be substantial. Typical profit margins for smallholder agriculture are estimated at between 5 and 20% depending on the crop (see Keyser & Lungu, 1997). Hence, even a 20% improvement in agricultural productivity would correspond to at least a doubling of returns to the household from agricultural activity. Such an increase in household incomes would lead to rapid poverty reduction. Improving the productivity of smallholder agriculture, therefore, should play a key role in a broad-based economic growth strategy for Malawi.
AFJARE Vol 3 No 2 September 2009 Hardwick Tchale
114
4.1 Factors that determine the levels of smallholder production efficiency
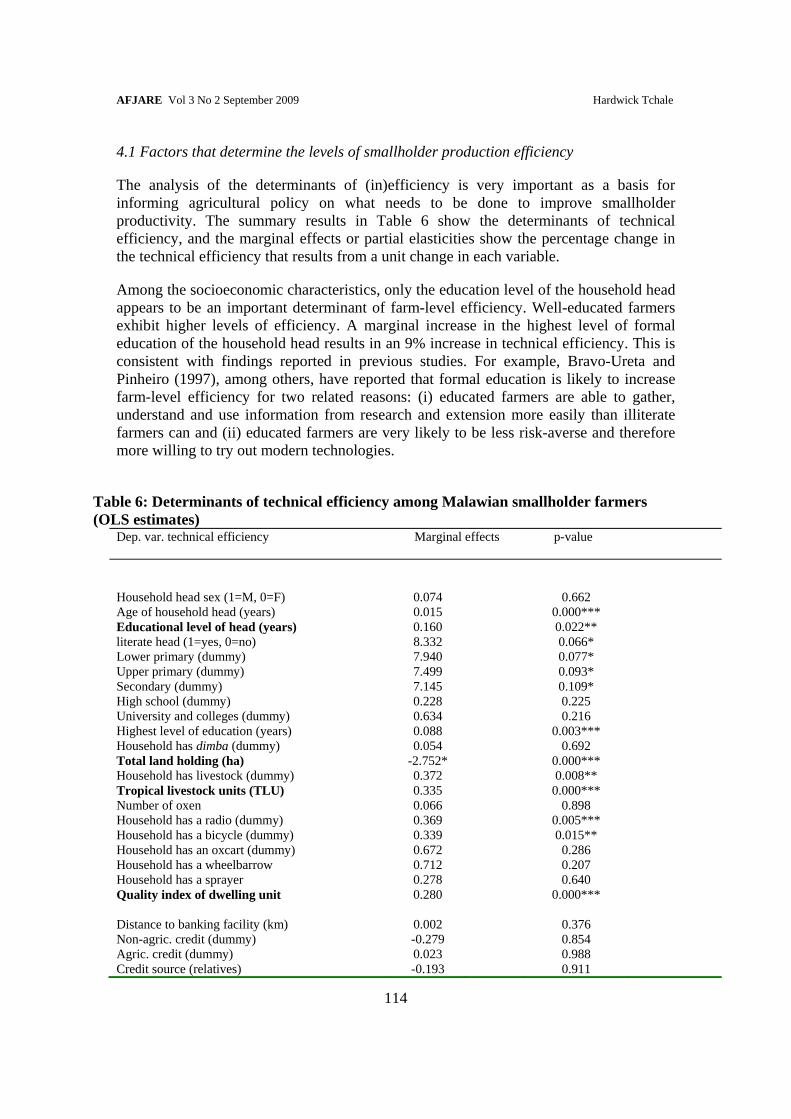
The analysis of the determinants of (in)efficiency is very important as a basis for informing agricultural policy on what needs to be done to improve smallholder productivity. The summary results in Table 6 show the determinants of technical efficiency, and the marginal effects or partial elasticities show the percentage change in the technical efficiency that results from a unit change in each variable.
Among the socioeconomic characteristics, only the education level of the household head appears to be an important determinant of farm-level efficiency. Well-educated farmers exhibit higher levels of efficiency. A marginal increase in the highest level of formal education of the household head results in an 9% increase in technical efficiency. This is consistent with findings reported in previous studies. For example, Bravo-Ureta and Pinheiro (1997), among others, have reported that formal education is likely to increase farm-level efficiency for two related reasons: (i) educated farmers are able to gather, understand and use information from research and extension more easily than illiterate farmers can and (ii) educated farmers are very likely to be less risk-averse and therefore more willing to try out modern technologies.
Table 6: Determinants of technical efficiency among Malawian smallholder farmers (OLS estimates)
Dep. var. technical efficiency Marginal effects
p-value
Household head sex (1=M, 0=F) 0.074 0.662 Age of household head (years) 0.015 0.000*** Educational level of head (years) 0.160 0.022** literate head (1=yes, 0=no) 8.332 0.066* Lower primary (dummy) 7.940 0.077* Upper primary (dummy) 7.499 0.093* Secondary (dummy) 7.145 0.109* High school (dummy) 0.228 0.225 University and colleges (dummy) 0.634 0.216 Highest level of education (years) 0.088 0.003*** Household has dimba (dummy) 0.054 0.692 Total land holding (ha) -2.752* 0.000*** Household has livestock (dummy) 0.372 0.008** Tropical livestock units (TLU) 0.335 0.000*** Number of oxen 0.066 0.898 Household has a radio (dummy) 0.369 0.005*** Household has a bicycle (dummy) 0.339 0.015** Household has an oxcart (dummy) 0.672 0.286 Household has a wheelbarrow 0.712 0.207 Household has a sprayer 0.278 0.640 Quality index of dwelling unit 0.280 0.000*** Distance to banking facility (km) 0.002 0.376 Non-agric. credit (dummy) -0.279 0.854 Agric. credit (dummy) 0.023 0.988 Credit source (relatives) -0.193 0.911

AFJARE Vol 3 No 2 September 2009 Hardwick Tchale
115
Credit sources (private money lenders) 1.629 0.361 Credit source (Finance inst.) 0.710 0.679 Farmer /credit club membership 1.758 0.000*** No. of extension worker visits/month 0.157 0.067* Extension worker resident in community 0.181 0.213 Extension message useful 0.574 0.136 Cumulative hybrid maize adopters in community (%)
0.002 0.224
Cumulative Burley tobacco adopters in community (%)
0.005 0.016**
Household size 0.397 0.000*** Number of dependants -0.307 0.002*** Dependency ratio -0.068 0.436 Does the household hire labor 1.106 0.000*** Amount of hired labor (man-days/season) 0.009 0.116 Distance to the Boma (km) -0.004 0.032** Availability of daily market 0.655 0.000*** Availability of weekly market 0.372 0.011** Distance to daily market (km) -0.031 0.004*** Distance to weekly market (km) -0.023 0.107 Distance to ADMARC market (km) -0.038 0.002*** Access indicator (time) -0.005 0.074* Road type (1=tarmac; 0=others) 0.614 0.002*** Distance to main road (km) -0.003 0.086* Did household use purchased seed? 0.827 0.000*** Did household apply manure? -0.211 0.224 Land tenure: customary 1.677 0.000*** Land tenure: leasehold 1.145 0.062* Land tenure: renting and share cropping 0.396 0.182 Does the household irrigate? 0.003 0.623 Availability of irrigation scheme 0.143 0.531 Availability of farmers’ cooperative 0.681 0.004*** Relative output/input price ratio 1.831 0.008*** Did the household receive free fertilizer and seed? 0.490 0.000*** Historical rainfall variation 0.011 0.000*** Did the household experience an agricultural shock in the last 5 years?
-0.611 0.000***
Model statistics No. of observations: Adjusted R2 value: F-statistic
9788
0.574
63.910***
Note: * P<0.10; ** P<0.005; *** P<0.001
The relationship between the size of land holding and efficiency is significantly inverse. This shows that technical efficiency decreases with increasing land holding such that a one hectare increase in land holding lowers efficiency by about 3%. This finding suggests the existence of an inverse relationship between efficiency and land size. Because this has important policy implications, this relationship is investigated further below.

AFJARE Vol 3 No 2 September 2009 Hardwick Tchale
116
The use of purchased seed (which is most likely comprised of first generation hybrids) significantly improves technical efficiency, such that farmers who plant purchased seed gain on average 9% higher efficiency than those who do not.
Availability of extension services and information about technical aspects of crop technologies plays an important role in increasing farm-level efficiency. The availability of an extension worker in the community and the usefulness of the extension messages (as perceived by the respondents) are significant determinants of technical efficiency. Further, farmers who are members of extension/market/credit related organizations exhibit higher levels of efficiency. For instance, farmer/credit club members have on average 2% higher efficiency than non-members. Informal sources of learning and information sharing also increase efficiency, as is demonstrated by the positive and significant relationship between technical efficiency and the cumulative percentage of farmers who adopt various crop technologies within the farming community. An increase in the number of farmers who adopt improved technology directly lowers the transaction costs associated with improved technology adoption, and thus has a positive effect in attracting more farmers to adopt the technology, and so improves their productivity.
Other assets are positively related to efficiency through improving farmers’ liquidity position, thereby ensuring that farmers are able to respond rapidly to demands for cash to buy inputs and other factors. For example, the impact of an increase in livestock units (as measured by Tropical Livestock Units, TLUs) indicates that a marginal increase in TLUs results in a 3.4% higher technical efficiency.6
Access to a dimba plot also enhances farm-level efficiency. This may be because most winter cropping in dimbas produces high-value crops such as green maize and vegetables that are sold on the market, and the income is used to supplement the cash for purchasing inputs for upland crops. These results are consistent with the findings of other studies which indicate that complementary income from other sources on and off the farm is likely to result in high on-farm productivity, as farmers use income from other sources to invest in farm operations (see for instance Dorward et al., 2004). Our findings further indicate that technical efficiency increases with an increase in non-farm income.
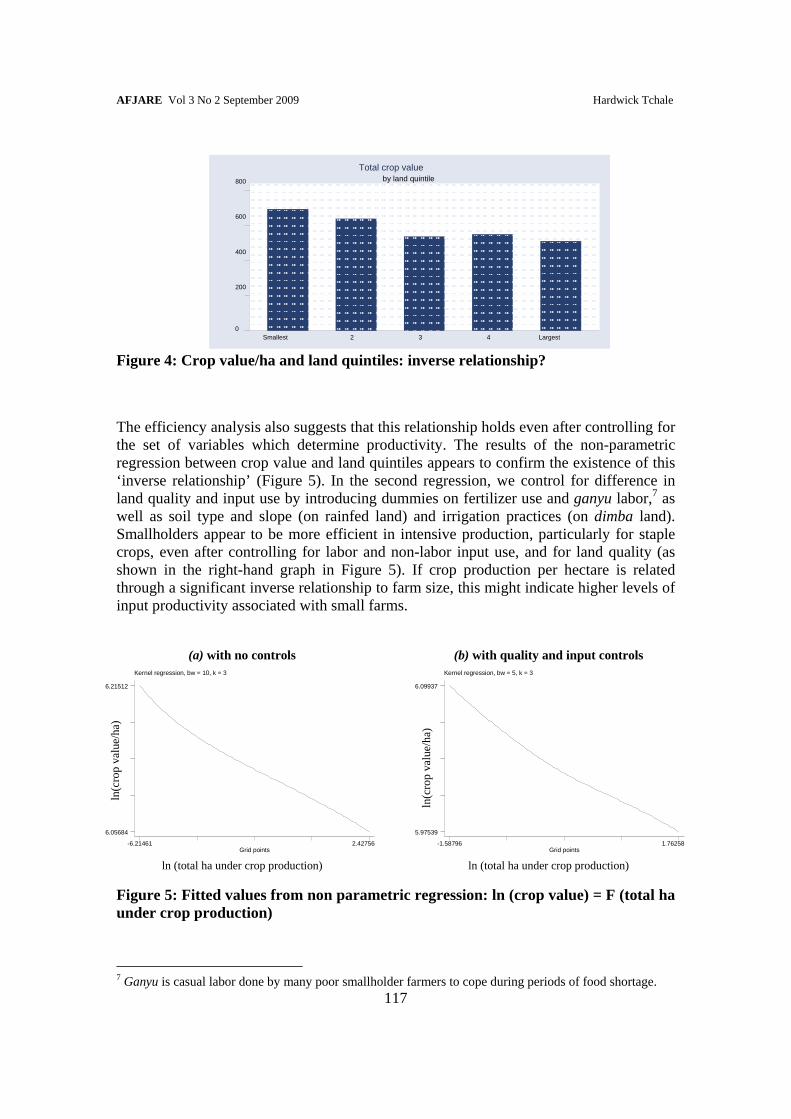
4.2 The relationship between farm size and land productivity
The analysis has highlighted the existence of an inverse relationship between land size and land productivity. At a basic level this implies that the highest crop output per unit of area is obtained on the smallest farms. Figure 3 plots crop value in US$ per hectare against landholding quintiles.
6 A Tropical Livestock Unit (TLU) is a live-weight based measure that is used to convert different livestock classes into a common unit. In general 1 TLU = 250 kg live-weight. The conversion factors are adjusted for the local tropical breeds.
AFJARE Vol 3 No 2 September 2009 Hardwick Tchale
117
Figure 4: Crop value/ha and land quintiles: inverse relationship?
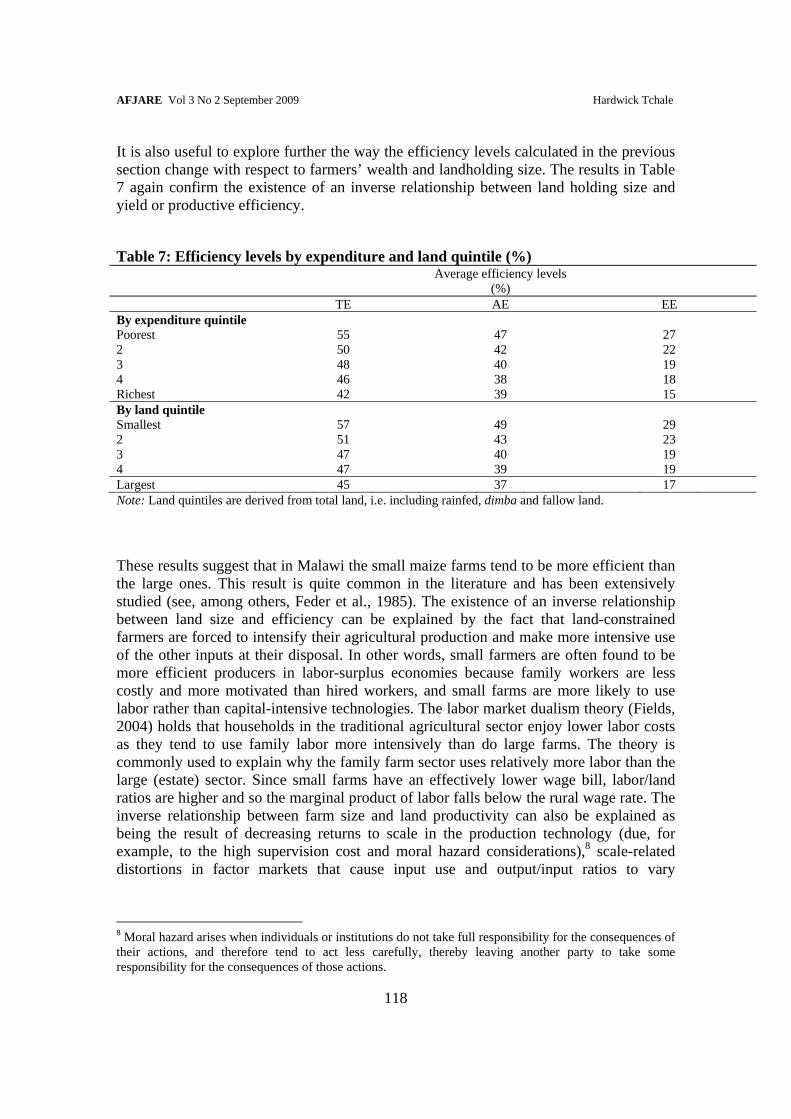
The efficiency analysis also suggests that this relationship holds even after controlling for the set of variables which determine productivity. The results of the non-parametric regression between crop value and land quintiles appears to confirm the existence of this ‘inverse relationship’ (Figure 5). In the second regression, we control for difference in land quality and input use by introducing dummies on fertilizer use and ganyu labor,7 as well as soil type and slope (on rainfed land) and irrigation practices (on dimba land). Smallholders appear to be more efficient in intensive production, particularly for staple crops, even after controlling for labor and non-labor input use, and for land quality (as shown in the right-hand graph in Figure 5). If crop production per hectare is related through a significant inverse relationship to farm size, this might indicate higher levels of input productivity associated with small farms.
(a) with no controls (b) with quality and input controls
Kernel regression, bw = 10, k = 3
Grid points-6.21461 2.42756
6.05684
6.21512
ln (total ha under crop production)
Kernel regression, bw = 5, k = 3
Grid points-1.58796 1.76258
5.97539
6.09937
ln (total ha under crop production)
Figure 5: Fitted values from non parametric regression: ln (crop value) = F (total ha under crop production)
7 Ganyu is casual labor done by many poor smallholder farmers to cope during periods of food shortage.
0
200
400
600
800
Smallest 2 3 4 Largest
by land quintileTotal crop value
ln(c
rop
valu
e/ha
)
ln(c
rop
valu
e/ha
)
AFJARE Vol 3 No 2 September 2009 Hardwick Tchale
118
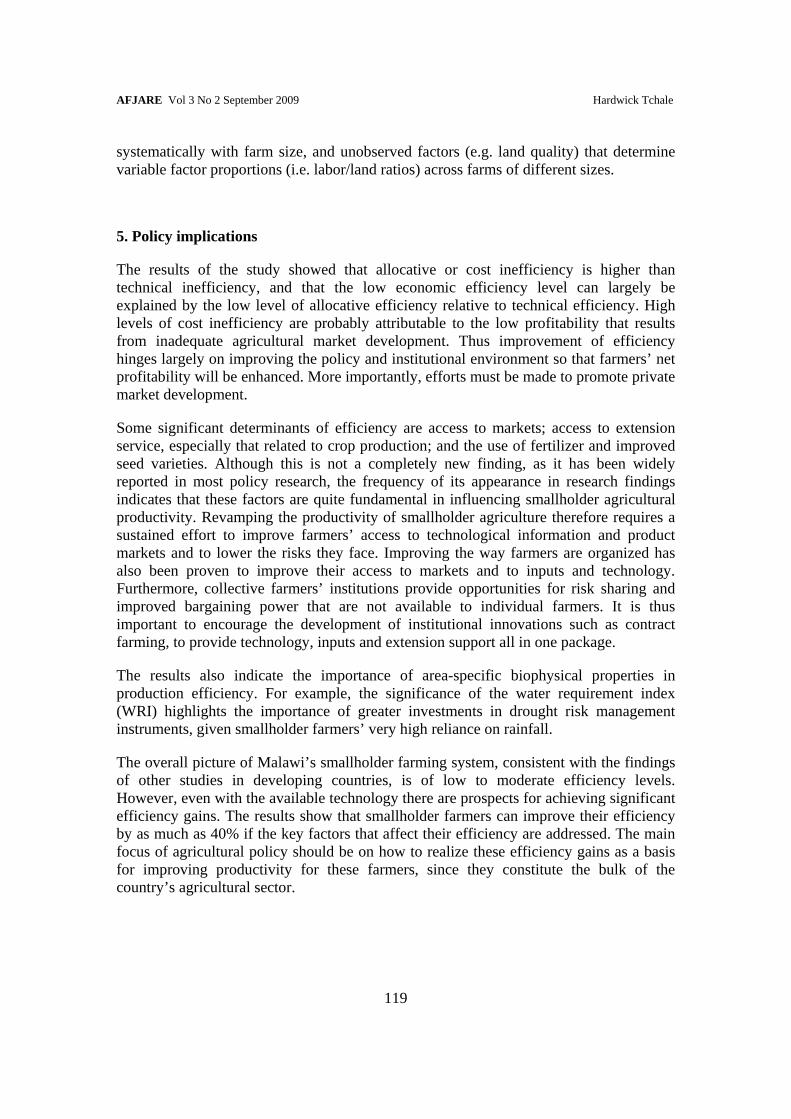
It is also useful to explore further the way the efficiency levels calculated in the previous section change with respect to farmers’ wealth and landholding size. The results in Table 7 again confirm the existence of an inverse relationship between land holding size and yield or productive efficiency.
Table 7: Efficiency levels by expenditure and land quintile (%) Average efficiency levels
(%)
TE AE EE By expenditure quintile Poorest 55 47 27 2 50 42 22 3 48 40 19 4 46 38 18 Richest 42 39 15 By land quintile Smallest 57 49 29 2 51 43 23 3 47 40 19 4 47 39 19 Largest 45 37 17 Note: Land quintiles are derived from total land, i.e. including rainfed, dimba and fallow land.
These results suggest that in Malawi the small maize farms tend to be more efficient than the large ones. This result is quite common in the literature and has been extensively studied (see, among others, Feder et al., 1985). The existence of an inverse relationship between land size and efficiency can be explained by the fact that land-constrained farmers are forced to intensify their agricultural production and make more intensive use of the other inputs at their disposal. In other words, small farmers are often found to be more efficient producers in labor-surplus economies because family workers are less costly and more motivated than hired workers, and small farms are more likely to use labor rather than capital-intensive technologies. The labor market dualism theory (Fields, 2004) holds that households in the traditional agricultural sector enjoy lower labor costs as they tend to use family labor more intensively than do large farms. The theory is commonly used to explain why the family farm sector uses relatively more labor than the large (estate) sector. Since small farms have an effectively lower wage bill, labor/land ratios are higher and so the marginal product of labor falls below the rural wage rate. The inverse relationship between farm size and land productivity can also be explained as being the result of decreasing returns to scale in the production technology (due, for example, to the high supervision cost and moral hazard considerations),8 scale-related distortions in factor markets that cause input use and output/input ratios to vary
8 Moral hazard arises when individuals or institutions do not take full responsibility for the consequences of their actions, and therefore tend to act less carefully, thereby leaving another party to take some responsibility for the consequences of those actions.
AFJARE Vol 3 No 2 September 2009 Hardwick Tchale
119
systematically with farm size, and unobserved factors (e.g. land quality) that determine variable factor proportions (i.e. labor/land ratios) across farms of different sizes.
5. Policy implications
The results of the study showed that allocative or cost inefficiency is higher than technical inefficiency, and that the low economic efficiency level can largely be explained by the low level of allocative efficiency relative to technical efficiency. High levels of cost inefficiency are probably attributable to the low profitability that results from inadequate agricultural market development. Thus improvement of efficiency hinges largely on improving the policy and institutional environment so that farmers’ net profitability will be enhanced. More importantly, efforts must be made to promote private market development.
Some significant determinants of efficiency are access to markets; access to extension service, especially that related to crop production; and the use of fertilizer and improved seed varieties. Although this is not a completely new finding, as it has been widely reported in most policy research, the frequency of its appearance in research findings indicates that these factors are quite fundamental in influencing smallholder agricultural productivity. Revamping the productivity of smallholder agriculture therefore requires a sustained effort to improve farmers’ access to technological information and product markets and to lower the risks they face. Improving the way farmers are organized has also been proven to improve their access to markets and to inputs and technology. Furthermore, collective farmers’ institutions provide opportunities for risk sharing and improved bargaining power that are not available to individual farmers. It is thus important to encourage the development of institutional innovations such as contract farming, to provide technology, inputs and extension support all in one package.
The results also indicate the importance of area-specific biophysical properties in production efficiency. For example, the significance of the water requirement index (WRI) highlights the importance of greater investments in drought risk management instruments, given smallholder farmers’ very high reliance on rainfall.
The overall picture of Malawi’s smallholder farming system, consistent with the findings of other studies in developing countries, is of low to moderate efficiency levels. However, even with the available technology there are prospects for achieving significant efficiency gains. The results show that smallholder farmers can improve their efficiency by as much as 40% if the key factors that affect their efficiency are addressed. The main focus of agricultural policy should be on how to realize these efficiency gains as a basis for improving productivity for these farmers, since they constitute the bulk of the country’s agricultural sector.

AFJARE Vol 3 No 2 September 2009 Hardwick Tchale
120
Acknowledgements
The author wishes to thank the Malawi National Statistical Office for permission to use the nationally representative 2004/05 data on which this paper is based, and also the referees who commented on drafts of the paper. Any errors are the sole responsibility of the author.
References
Battese, GE & Coelli, TJ, 1995. A model of technical inefficiency effects in a stochastic production function for panel data. Empirical Economics 20, 325–332.
Bravo-Ureta, BE & Evenson, RE, 1994. Efficiency in agricultural production: The case of peasant farmers in eastern Paraguay. Agricultural Economics 10(1), 27-37.
Bravo-Ureta, BE & Pinheiro, AE, 1997. Technical, economic and allocative efficiency in peasant farming: Evidence from the Dominican Republic. The Developing Economies, 35(1), 48–67.
Chirwa, EW, 2003. Sources of technical efficiency among smallholder maize farmers in southern Malawi. Working paper, Department of Economics, Chancellor College, Zomba, Malawi.
Coelli, TR, Prasada, Rao DS & N, Battese, N, 1998. An Introduction to Efficiency and Productivity Analysis. Kluwer Academic, Boston.
Dorward, A, Kydd, J, Morrison, J & Cadisch, G, 2004. Agricultural development and pro-poor economic growth in sub-Saharan Africa: Potential and policy. Oxford Development Studies 32(1), 37–57.
Edriss, AH, Tchale, H & Wobst, P, 2004. The impact of labour market liberalization on maize productivity and rural poverty in Malawi. Working paper, Policy Analysis for Sustainable Agricultural Development (PASAD). Center for Development Research, University of Bonn, Germany.
Farrell, MJ, 1957. The measurement of productive efficiency. Journal of the Royal Statistical Society, Series A, 120(3), 253–90.
Feder, G, Just, RE & Zilberman, G, 1985. Adoption of agricultural innovations in developing countries: A survey. Economic Development and Cultural Change 33, 255–97.
Fields, GS, 2004. Dualism in the Labor Market: A Perspective on the Lewis Model after Half a Century. Manchester School 72(6), 724–35.
Forsund, FR, Lovell, CAK & Schmidt, P, 1980. A survey of frontier production functions and of their relationship to efficiency measurement. Journal of Econometrics 13, 5–25.
Fulginiti, LE & Perrin, RK, 1998. Agricultural productivity in developing countries. Agricultural Economics 19(1–2), 45–51.
GoM (Government of Malawi), 2007a. Malawi: Poverty and vulnerability assessment – Investing in our future. GoM/World Bank, Lilongwe, Malawi.
GoM (Government of Malawi), 2007b. Economic Report. Ministry of Economic Planning and Development, Lilongwe, Malawi.

AFJARE Vol 3 No 2 September 2009 Hardwick Tchale
121
GoM (Government of Malawi), (various years, 1970–2008). Economic Report. Ministry of Economic Planning and Development, Lilongwe, Malawi.
Heshmati, A & Mulugeta, Y, 1996. Technical efficiency of the Ugandan matoke farms. Applied Economic Letters (3), 491–4.
Keyser, J & Lungu, V, 1997. Malawi: Agricultural Comparative Advantage. Paper prepared for the World Bank, Washington, DC.
Mochobelele, MT & Winter-Nelson, A, 2000. Migrant labor and farm technical efficiency in Lesotho. World Development 28(1), 143–53.
NSO (National Statistical Office), 2005. Malawi Integrated Household Survey Report. NSO, Lilongwe, Malawi.
Okike, M, Jabbar, A, Manyong, VM, Smith, JW & Ehui, SK, 2004. Factors affecting farm-specific production efficiency in the savanna zones of West Africa. Journal of African Economies, 13(1), 134–65.
Pinckney C, 1993. Is market liberalization compatible with food security? Food Policy, 18(4), 325–33.
Sherlund, MS, Barrett, CB & Adesina, AA, 2002. Smallholder technical efficiency controlling for environmental production conditions. Journal of Development Economics 69 (2002), 85–101.
Smaling, EMA, 1998. Nutrient flows and balances as indicators of productivity and sustainability in sub-Saharan Africa agroecosystems. Agriculture, Ecosystems and Environment, 71, 13–46.
Townsend, RF, Kirsten, J & Vink, N, 1998. Farm size, productivity and returns to scale in agriculture revisited: A case study of wine producers in South Africa. Agricultural Economics 19, 175–80.