the efficacy of cognitive intervention in mild …...review the efficacy of cognitive intervention...
TRANSCRIPT
REVIEW
The Efficacy of Cognitive Intervention in Mild CognitiveImpairment (MCI): a Meta-Analysis of Outcomeson Neuropsychological Measures
Dale S. Sherman1,2& Justin Mauser3 & Miriam Nuno4 & Dean Sherzai5
Received: 20 March 2017 /Accepted: 5 November 2017 /Published online: 27 December 2017# The Author(s) 2017. This article is an open access publication
Abstract Cognitive training in MCI may stimulate pre-existing neural reserves or recruit neural circuitry asBcompensatory scaffolding^ prompting neuroplastic reorgani-zation to meet task demands (Reuter-Lorenz & Park, 2014).However, existing systematic reviews and meta-analytic stud-ies exploring the benefits of cognitive interventions in MCIhave been mixed. An updated examination regarding the effi-cacy of cognitive intervention in MCI is needed given im-provements in adherence to MCI diagnostic criteria in subjectselection, better defined interventions and strategies applied,
increased use of neuropsychological measures pre- and post-intervention, as well as identification of moderator variableswhich may influence treatment. As such, this meta-analyticreview was conducted to examine the efficacy of cognitiveintervention in individuals diagnosed with mild cognitive im-pairment (MCI) versusMCI controls based on performance ofneuropsychological outcome measures in randomized con-trolled trials (RCT). RCT studies published from January1995 to June 2017 were obtained through source databasesof MEDLINE-R, PubMed, Healthstar, Global Health,PSYCH-INFO, and Health and Psychological Instrumentsusing search parameters for MCI diagnostic category (mildcognitive impairment, MCI, pre-Alzheimer’s disease, earlycognitive decline, early onset Alzheimer’s disease, and pre-clinical Alzheimer’s disease) and the intervention or trainingconducted (intervention, training, stimulation, rehabilitation,or treatment). Other inclusion and exclusion criteria includedsubject selection based on established MCI criteria, RCT de-sign in an outpatient setting, MCI controls (active or passive),and outcomes based on objective neuropsychological mea-sures. From the 1199 abstracts identified, 26 articles met in-clusion criteria for the meta-analyses completed across eleven(11) countries; 92.31% of which have been published withinthe past 7 years. A series of meta-analyses were performed toexamine the effects of cognitive intervention by cognitive do-main, type of training, and intervention content (cognitivedomain targeted). We found significant, moderate effects formulticomponent training (Hedges’ g observed = 0.398; CI[0.164, 0.631]; Z = 3.337; p = 0.001; Q = 55.511; df = 15;p = 0.000; I2 = 72.978%; τ2 = 0.146) as well as multidomain-focused strategies (Hedges’ g = 0.230; 95% CI [0.108, 0.352];Z = 3.692; p < 0.001; Q = 12.713; df = 12; p = 0.390; I2 =5.612; τ2 = 0.003). The effects for other interventions exploredby cognitive domain, training type, or intervention contentwere indeterminate due to concerns for heterogeneity, bias,
Statistical analysis:Dale S. Sherman, Ph.D.
Electronic supplementary material The online version of this article(https://doi.org/10.1007/s11065-017-9363-3) contains supplementarymaterial, which is available to authorized users.
* Dale S. [email protected]; [email protected]
Justin [email protected]
Miriam [email protected]
Dean [email protected]
1 Cedars-Sinai Medical Center, 444 S. San Vicente Blvd, Suite 103,Los Angeles, CA 90048, USA
2 University of Southern California, Los Angeles, CA, USA3 Virginia Commonwealth University School of Medicine,
Richmond, VA, USA4 University of California, Davis, Davis, CA, USA5 Loma Linda University Health, 11370 Anderson Street B100, Loma
Linda, CA 92354, USA
Neuropsychol Rev (2017) 27:440–484https://doi.org/10.1007/s11065-017-9363-3
and small cell sizes. In addition, subgroup and meta-regression analyses were conducted with the moderators ofMCI category, mode of intervention, training type, interven-tion content, program duration (total hours), type of controlgroup (active or passive), post-intervention follow-up assess-ment period, and control for repeat administration. We foundsignificant overall effects for intervention content with mem-ory focused interventions appearing to be more effective thanmultidomain approaches. There was no evidence of an influ-ence on outcomes for the other covariates examined. Overall,these findings suggest individuals with MCI who receivedmulticomponent training or interventions targeting multipledomains (including lifestyle changes) were apt to display animprovement on outcome measures of cognition post-inter-vention. As such, multicomponent and multidomain formsof intervention may prompt recruitment of alternate neuralprocesses as well as support primary networks to meet taskdemands simultaneously. In addition, interventions withmemory and multidomain forms of content appear to be par-ticularly helpful, with memory-based approaches possibly be-ing more effective than multidomain methods. Other factors,such as program duration, appear to have less of an influenceon intervention outcomes. Given this, although the creation ofnew primary network paths appears strained in MCI, interven-tions with memory-based or multidomain forms of contentmay facilitate partial activation of compensatory scaffoldingand neuroplastic reorganization. The positive benefit ofmemory-based strategies may also reflect transfer effects in-dicative of compensatory network activation and the multiple-pathways involved in memory processes. Limitations of thisreview are similar to other meta-analysis in MCI, including amodest number studies, small sample sizes, multiple forms ofinterventions and types of training applied (some overlap-ping), and, while greatly improved in our view, a large diver-sity of instruments used to measure outcome. This is aptto have contributed to the presence of heterogeneity andpublication bias precluding a more definitive determinationof the outcomes observed.
Keywords Mild cognitive impairment (MCI): Cognitiveinterventions . Cognitive training . Cognitive strategies .
Cognitive rehabilitation . Treatment efficacy .
Neuropsychological outcomes .Meta-analysis
The cognitive deficits observed in mild cognitive impairment(MCI) signal abnormal changes in neural structure and func-tion representative of possible prodromal markers ofAlzheimer’s disease (AD) or other significant neurodegener-ative disorder (Albert et al. 2011; Petersen et al. 2001, 2009;Saunders and Summers 2011). These deficits exceed the age-related changes in cognitive efficiency, attention, memory,and executive functions anticipated at the fifth to sixth decade
of life and may progressively accelerate into more significantcognitive declines by the seventh to eighth decades (Cabezaet al. 2017; Rog and Fink 2013; Salthouse 1996, 2011; Schaieand Willis 2010). As there are no effective medical or phar-macological intervention for the treatment of MCI or AD,other interventions such as compensatory cognitive strategies,Bbrain-games^, and other lifestyle changes (i.e. nutrition, ex-ercise, etc.) are aggressively being sought to mitigate or slowillness progression (Cai and Abrahamson 2016; Curlikand Shors 2013; Kivipelto et al. 2013; Lehert et al. 2015;Simons et al. 2016; Smith et al. 2010). This may be especiallyimportant as cognitive training in MCI has been associatedwith increased activation in the hippocampus (Hampsteadet al. 2012b; Rosen et al. 2011), right inferior parietal lobe(Belleville et al. 2011), frontoparietal network (Hampsteadet al. 2011), occipito-temporal areas (Onur et al. 2016), andimplicated in other processes (Barban et al. 2017; Ciarmielloet al. 2015; Maffei et al. 2017). As such, identifying the cog-nitive interventions effective in MCI may, in turn, aid intargeting the neural networks with greater specificity at pro-dromal stages to alter illness trajectory away from more seri-ous cognitive decline (Kim and Kim 2014; Shatenstein andBargerger-Gateau 2015; Sitzer et al. 2006).
In an effort to distill the mechanisms associated with age-related changes and pathognomonic processes across thelifespan, The Scaffolding Theory of Aging and Cognition –Revised (STAC-r) suggests cognitive training may activatecompensatory neural processes or Bscaffolding^ to providecomputational support to primary networks or newlyestablished task networks when new skills are acquired(Reuter-Lorenz and Lustig 2017; Reuter-Lorenz and Park2014). It has also been suggested that training may activatepre-existing cognitive reserves (Stern 2012; Wirth et al. 2014)or prompt hemispheric recruitment to meet processing de-mands (Hemispheric Asymmetry Reduction in Older Age[HAROLD], Cabeza 2002). Themanner in which neural mech-anisms are utilized may shift across the lifespan as older adultsdemonstrate age-related decreases in occipito-temporal activitycoupled with increases in prefrontal cortex processing(Posterior-Anterior-Shift with Aging [PASA], Davis et al.2008). Compensatory mechanisms may, however, reach a ceil-ing and become ineffective under high load or high demandcircumstances (Compensation Related Utilization of NeuralCircuits Hypothesis [CRUNCH]; Reuter-Lorenz and Cappel2008) or become compromised by neuropathological process-es. Cognitive training may stimulate pre-existing neural re-serves or recruit neural circuitry as Bcompensatory scaffolding^prompting neuroplastic reorganization to meet task demands,in the context of adaptive factors and divergent trajectories ofdecline (Hong et al. 2015; van Paasschen et al. 2009).
To this end, multiple types of interventions havebeen employed in MCI including restorative training,compensatory-based strategies (Bahar-Fuchs et al. 2013;
Neuropsychol Rev (2017) 27:440–484 441
Gates and Valenzuela 2010; Kinsella et al. 2009; Martin et al.2011; Simon et al. 2012), cognitive stimulation and multicom-ponent or multimodal forms of intervention. Please seeTable S1 in the supplementary material for additional infor-mation regarding terms and definitions. However, existingreviews and prior meta-analyses have reported varying find-ings concerning the benefits of cognitive training. Severalreviews report there to be a benefit from cognitive strategies(Coyle et al. 2015; Faucounau et al. 2010; Hill et al. 2017;Jean et al. 2010b; Li et al. 2011; Reijnders et al. 2013; Simonet al. 2012) and other analyses have found little or no advan-tage (Belleville 2008; Gates et al. 2011; Huckans et al. 2013;Kurz et al. 2011; Martin et al. 2011; Stott and Spector 2011;Vidovich and Almeida 2011; Zehnder et al. 2009).
While we acknowledge and appreciate these prior reviewshave been conducted, to the best of our knowledge there havebeen no meta-analyses which examined cognitive interven-tions in randomized clinical trials (RCT) across neuropsycho-logical domains exclusively in the MCI population. An up-dated examination of cognitive interventions is needed givenimprovements in the interventions and strategies applied, in-creased use of neuropsychological measures pre- and post-intervention, as well as identification of moderating variableswhich may influence intervention outcomes (e.g. MCI diag-nosis, duration of training, etc.). There has been an increaseduse of cognitive interventions, generally (Craik et al. 2007;Mahncke et al. 2006; Purath et al. 2014; Stuss et al. 2007;Tardif and Simard 2011; Uchida and Kawashima 2008;Willis and Caskie 2013), as well as proliferation of evidenceconnecting training to neural substrates and neuroplastic pro-cesses (Cabeza et al. 2017; Park and Festini 2017; Reuter-Lorenz and Lustig 2017; Toepper 2017). Of particular signif-icance has been the refinement of diagnostic criteria used todefine MCI to recruit subjects and delineate treatment groups(Albert et al. 2011; Petersen et al. 2001, 2009; Winbald et al.2004). This refinement has resulted in a better selection pro-cess and, secondarily, led to an increase in the quality of out-comes observed. However, it has taken time for these changesto find their way into published clinical trials.
A review of current works is also needed due to broadeneduse of neuropsychological instruments to obtain pre-intervention baseline scores and post-treatment outcomes.Improved technical precision through the use of more robustneuropsychological outcome measures has improved our un-derstanding of the effectiveness of interventions applied (Elliset al. 2009, 2010; Ibanez et al. 2014; Mitchell 2009) and aidedwith control of potential confounds due to test-retest and repeat-ed measure experimental design. In addition, while multipleneural centers may be involved when completing test instru-ments (Matias-Guiu et al. 2017), objective neuropsychologicalmeasures have been shown to be sensitive to different stages ofillness in neurodegenerative disorder increasing their potentialrole and discriminability in study execution (Han et al. 2017).
Given these changes and advancements, the presentmeta-analysis was conducted to examine the efficacy ofcognitive interventions on neuropsychological test per-formance in individuals diagnosed with MCI versusMCI controls conducted in RCTs. We explored the strat-egies used, in both general intervention approaches andspecific forms of cognitive training, in an effort to dis-till the cognitive tasks effective in MCI. We sought todetermine (i) what were the changes in cognition frombaseline to outcome after the intervention was applied(ii) what were the common characteristics of interven-tions found to be effective across studies, (iii) what arespecific interventions that may be of benefit to individ-uals diagnosed with MCI in the clinical setting, (iv) whatare the key structural factors needed to set-up an effec-tive MCI intervention program (e.g. duration, frequency,homework, etc.), and (v) what inferences may be maderegarding interventions applied and the neural processesinvolved in MCI?
Provisionally, based on STAC-r and neurocognitivemodels, we anticipated three possible data-patterns asso-ciated with cognitive training could emerge (i) primarynetwork engagement, (ii) compensatory scaffolding acti-vation, or (iii) loss of measurable response. More specif-ically, evidence of primary network engagement would besuggested by moderate – large effect sizes on domain-specific outcomes after domain-targeted training (directeffects). In this scenario, training would facilitate primarynetwork engagement by creating new primary networkpaths (scaffolding) to meet task demands withoutrecruiting alternate networks. We would expect interven-tions which are challenging, novel, and deeply engagingto result in a more ‘youthful’ performance due to greaterefficiency and less reliance on compensatory processes(Reuter-Lorenz and Park 2014; Vermeij et al. 2017).Restorative strategies which target specific cognitivefunctions may facilitate this process as restorative inter-ventions aim to return deficits to premorbid levels (i.e.errorless learning), although other forms of training mayalso improve efficiency to a lesser degree (i.e. compensa-tory strategies).
Primary network engagement would also be suggested bymoderate to large effect sizes with multicomponent ormultidomain interventions. In this instance, training may acton primary networks and complementary processes simulta-neously requiring integration of complex skillsets, includinglifestyle changes, mitigating structural and functional declinesby enhancing processing in specific centers and decreasing theneural burden on other areas (Barban et al. 2017; Hosseiniet al. 2014; Suo et al. 2016). Multidomain approaches mayalso target multiple neural regions for a more enriched andcomplex neural challenge (Ballesteros et al. 2015; Li et al.2017). Moreover, multidomain approaches may offer greater
442 Neuropsychol Rev (2017) 27:440–484
utility as most cognitive skills are not unitary, single-domainprocesses but involve interrelated cognitive functions acrossseveral areas which, after training, prompt inclusion of addi-tional networks (Belleville et al. 2011). As such, small tomoderate effects may also be demonstrated in non-targeteddomains (transfer effects). In addition, cognitively stimulatingactivities may aid in engaging cognitive reserves to slow de-cline or reduce the risk of greater pathology (Ciarmiello et al.2015; De Marco et al. 2016; Herholz et al. 2013; Stern 2012).There may be protective factors or moderator effects on out-come measures such as level of education, occupation, andintelligence as well (Hall et al. 2009).
A second data-pattern, compensatory activation, would besuggested by small effects sizes associated with training intargeted domains, no effects on non-targeted domains (ab-sence of transfer effects), and small to moderate effectsizes associated with multicomponent or multidomainforms of intervention. In this instance, training wouldrecruit alternate networks to meet task demands.However, smaller effect sizes would be anticipated asprimary networks would be unable to manage the loaddue to loss of functionality, decreased efficiency, and anincrease in dedifferentiation (decrease in specialization).As such, multimodal forms of intervention may be moreefficacious as several strategies can support primary net-works and recruited networks simultaneously.
Finally, as a third data-pattern, the absence of any trainingeffect would suggest individuals withMCI have lost sufficientneurocognitive plasticity to engage primary networks and areunable to recruit alternate compensatory mechanisms to meettask demands.
Methods
The search process and meta-analyses performed follow-ed guidelines outlined by the Preferred Reporting Itemsfor Systematic Reviews and Meta-Analysis (PRISMA;Moher et al. 2009) using a PICOS approach (Participants,Interventions, Control Outcomes, and Study Design).Pursuant to the recommendation by Gates and March(2016), the PRISMA checklist items are addressed in the sec-tions below. Please see Table S2 in the supplemental materialsfor the PRIMSA items cross-referenced by page.
Protocol Registration
The research methodology and protocol for this meta-analysiswas not registered prior to conducting the review. All methodsand procedures regarding the search and analysis are de-scribed in the paper with additional information provided inthe supplemental materials.
Study Eligibility – Inclusion & Exclusion Criteria
This review focused on studies published from January1995 to June 2017 which (i) selected subjects based onestablished-MCI criteria (Albert et al. 2011; Petersenet al. 2009; Winbald et al. 2004), (ii) performed a RCT inan outpatient setting, (iii) compared cognitive training ver-sus controls (active or passive), and (iv) reported outcomesbased on objective neuropsychological measures. The startdate of January 1995 was chosen as beginning point as acursory search for studies prior to this time resulted in norelevant works and it was believed studies published priorto 1995 would not have recruited subjects according tocurrent diagnostic criteria. The definition used for cogni-tive intervention was any strategy or skill which sought toimprove mental processes of attention and concentration,speed of information processing, memory, or executivefunctions, similar to the guidelines offered by Gates andValenzuela (2010). We did not define cognitive interven-tion solely in classical forms such as restorative, compen-satory, etcetera, in an effort to obtain a broadly inclusivedataset, although we also recorded the strategy type usedaccording to cognitive training categorization suggested bySimon et al. (2012) to examine specific methods of train-ing. For the purposes of this review, we have adopted thefollowing terminology (i) intervention as a broad-basedidiom to refer, generally, to any effort employed, (ii) cog-nitive stimulation to mean nonspecific and leisure forms ofactivities, (iii) cognitive training to denote either compen-satory or restorative forms of training, and, (iv) multicom-ponent forms of intervention to mean the combination ofseveral approaches used together. Please see Table S1 foradditional information regarding terms and definitions. Inaddition, we selected only those studies which were RCTswith a clearly defined patient sample population accordingto MCI criteria (Albert et al. 2011; Petersen et al. 2001;Petersen 2004, Petersen et al. 2009; Winbald et al. 2004) oranalogous definition using an algorithm of 1.5 standarddeviations below the mean (Vidovich et al. 2015) onestablished neuropsychological instruments, that is,Consortium of Established Registry for Alzheimer’sDisease (CERAD; Fillenbaum et al. 2008). Studies per-formed in a day-treatment, institutional, or group-residential setting were not considered due to concernsregarding the influence of non-controlled effects and otherpotential confounds.
Information Sources – Databases Searched
Our review was conducted through the OVID-MEDLINEsearch engine using a collective of the source databasesMEDLINE-R, PubMed, Healthstar, Global Health, PSYCH-INFO, and Health and Psychological Instruments. There were
Neuropsychol Rev (2017) 27:440–484 443
no other data sources, information used from informal contact,or data obtained through other methods of communication(e.g., email, conference, etc.).
Literature Search Parameters
The primary search parameters included (i) terms representa-tive of the MCI diagnostic category (mild cognitive impair-ment, MCI, pre-Alzheimer’s disease, early cognitive decline,early onset Alzheimer’s disease, and preclinical Alzheimer’sdisease), (ii) a descriptor of the intervention or training con-ducted (intervention, training, stimulation, rehabilitation, ortreatment), (iii) RCT, (iv) limit to B1995-Current^, and (v) lim-it to human. The specific Boolean search strategy statementsand result counts are provided in the supplemental materials asTable S3.
Study Screening & Selection
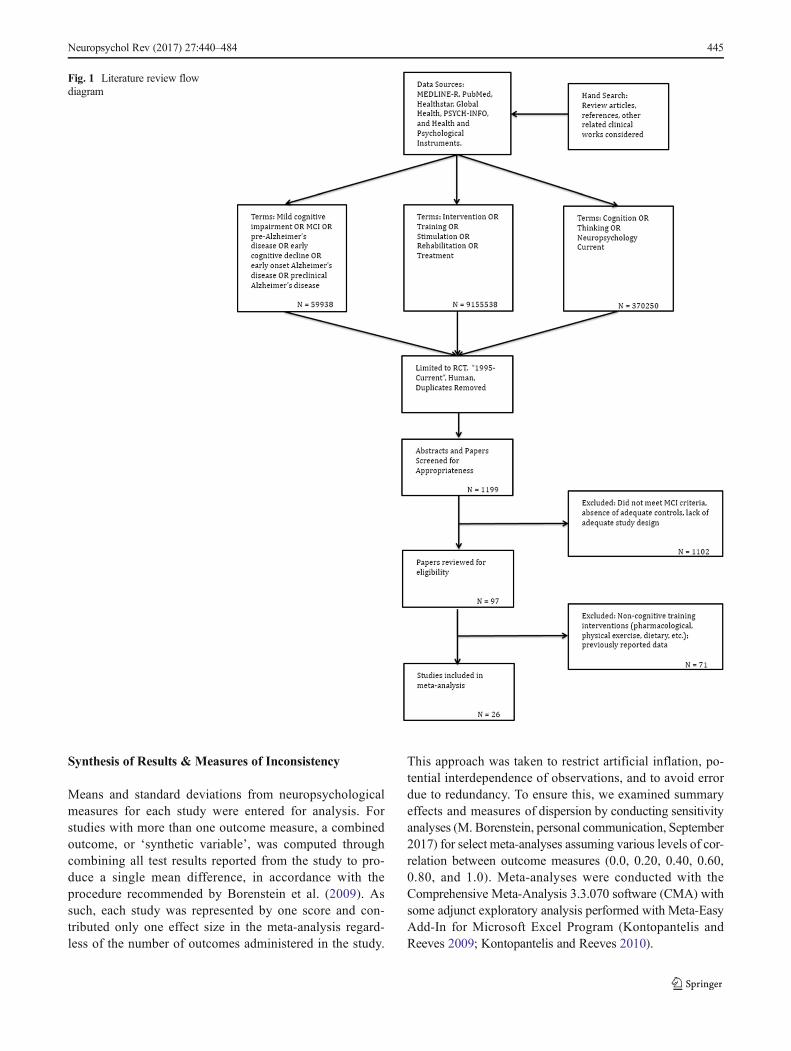
The process by which studies were identified, screened, con-sidered for eligibility and included is illustrated in Fig. 1. Thefirst two authors (DSS & JM) conducted the literature searchand screened potential studies following the search criteriadescribed above. This was done independently in two searchwaves with periodic confirmation of the eligibility criteria andprogress made in study selection.
Data Collection Process and Data Items
The effects of training were evaluated through subjects’ per-formance on outcomemeasures, defined as scores obtained onneuropsychological test instruments. Cognitive domains weredelineated into generally accepted pre-established categoriesof mental status and general cognition, working memory or at-tention, speed of information processing, language, visual-spatial ability, memory (verbal and non-verbal), and executivefunctions. Multiple test instruments and test versions wereadministered specific to study location sensitive to languageand culture of origin. We defined mental status and generalcognition in broad terms and adopted scores from abbreviatedmeasures as well as summary scores from larger instruments.Measures assessing learning and memory were grouped into(i) general memory overall, then further subdivided into (ii)verbal and (iii) non-verbal categories. Verbal memory wasfurther split into (i) list learning and (ii) story recall, whilenon-verbal memory measures were not subdivided. A sum-mary of neuropsychological instruments listed by cognitivedomain are presented in the supplemental materials asTable S5. Variables of IQ, age, education, and treatment du-ration (hours) were extracted and coded as continuous vari-ables. In addition, mode of training, type of training, domaintargeted (intervention content), type of control, MCI type,period to follow-up assessment, and control for repeat
administration were delineated as categorical variables anddummy coded.
Risk of Bias – Individual Studies
The risk of bias in individual studies and quality of each studywas independently weighted by two of the authors (DSS &JM) using the NIH Quality of Assessment of ControlledIntervention Studies Scale (2017). The NIH instrument is a14-item scale with which publish works may be rated in termsof randomization, blinded status of the participants, drop-outrates, etc. (NIH; www.nhlbi.nih.gov). Studies were notexplored for determination of bias secondary to fundingsources or other form of bias such as institution or affiliation.
Summary Measures
To quantify the possible benefit of training, we sought to de-termine the difference in post-training scores between MCIintervention groups versus MCI controls (waitlisted, non-trained or active control subjects). As such, means and stan-dard deviations from test instruments were extracted fromeach study as primary summary measures to calculate sum-mary statistics, effect sizes (weighted and un-weighted), and95% confidence intervals (CI). When means and standarddeviations were not reported directly, p-values, t-values,F-values, or confidence interval data were extracted tocalculate the mean and standard deviation statistics forintervention and control groups. Data from outcomemeasures were extracted from the time-point closest tothe conclusion of training, if more than one wave ofdata collection was conducted post-training. Differencesbetween means were calculated according to Hedges’ gmetric. The overall summary effect size, forest plots aswell as individual effect sizes within specific cognitivedomains were examined. The values used to interpreteffect size were in keeping with established guidelinessuch that a small effect size was defined as 0.20 orsmall (range 0–0.20); moderate = 0.50 (range 0.30–0.70); and large = 0.80 (range > = 0.80; Cohen 1988;Durlack 2009). Given the likely heterogeneity resultingfrom variability of training approaches, range of out-come measures, and differing methodological proceduresacross studies, a random-effects model was assumed forall analyses (DerSimonian and Laird 1986). A predic-tion interval was calculated at 95% confidence to ap-proximate the range of effect which might be anticipat-ed under similar intervention conditions with the sameoutcome measure(s) reported based on the procedurerecommended by Borenstein et al. (2016) and performedwith a Microsoft excel spreadsheet graciously providedby the authors.
444 Neuropsychol Rev (2017) 27:440–484
Synthesis of Results & Measures of Inconsistency
Means and standard deviations from neuropsychologicalmeasures for each study were entered for analysis. Forstudies with more than one outcome measure, a combinedoutcome, or ‘synthetic variable’, was computed throughcombining all test results reported from the study to pro-duce a single mean difference, in accordance with theprocedure recommended by Borenstein et al. (2009). Assuch, each study was represented by one score and con-tributed only one effect size in the meta-analysis regard-less of the number of outcomes administered in the study.
This approach was taken to restrict artificial inflation, po-tential interdependence of observations, and to avoid errordue to redundancy. To ensure this, we examined summaryeffects and measures of dispersion by conducting sensitivityanalyses (M. Borenstein, personal communication, September2017) for select meta-analyses assuming various levels of cor-relation between outcome measures (0.0, 0.20, 0.40, 0.60,0.80, and 1.0). Meta-analyses were conducted with theComprehensive Meta-Analysis 3.3.070 software (CMA) withsome adjunct exploratory analysis performed with Meta-EasyAdd-In for Microsoft Excel Program (Kontopantelis andReeves 2009; Kontopantelis and Reeves 2010).
Fig. 1 Literature review flowdiagram
Neuropsychol Rev (2017) 27:440–484 445
Meta-analyses were also run by cognitive domain asthis was viewed to be more consistent with the con-struct validity and scope of outcome instruments admin-istered (Demakis, 2006). As such, we examined summa-ry effects by (i) cognitive domain (irrespective of inter-vention type), (ii) type of cognitive training, as well as(iii) the focus of interventions on specific outcomes as-sociated with the targeted domain (i.e. effects of mem-ory training specifically on memory measures). A min-imum of five studies was used as criterion for analysisdue to concerns for over-interpretation. While a mini-mum of two studies may be used as inclusion criteriaand may be appropriate for some meta-analyses, partic-ularly when outcome data is homogeneous or very spe-cific (Valentine et al. 2010), we limited our meta-analysis to five studies given the range of outcomemeasures administered and due to cautions performingmeta-analyses with less than five studies (Borensteinet al. 2009). We also tested significance and calculatedconfidence intervals for Hedges’ g overall effect formeta-analytic trials of twenty or less (<= 20) using theHartung-Knapp-Sidik-Jonkman (HKSJ) method as thishas been demonstrated to yield more adequate errorrates, especially when the number of studies is small(IntHout et al. 2014).
With respect to verbal and non-verbal memory, we limiteddata to the delay aspect of outcome measures omittinglearning trials, trial totals, immediate recall indices, andmeasures associated with prospective memory. Becauseseveral studies reported data for verbal and non-verbalrecall as indices or composite scores, we ran meta-analyses for (i) all memory measures combined, as wellas (ii) verbal memory and (iii) non-verbal memorysubdomains separately. Regarding verbal memory inparticular, scores from list recall and story recall mea-sures were examined together to maximize data analysis.With respect to mental status and general cognition, weexamined the effect of interventions on summary mea-sures as subjects and patients are routinely evaluatedwith these screening-tests and general instruments (i.e.MMSE, MOCA, DRS, ADAS-Cog, RBANS total, etc.).When examining the effects of interventions directed ata specific domain, we categorized studies based on theintervention and content described and limited the meta-analysis to outcomes associated with that domain.
Risk of Bias - Publication Bias
To examine the potential for publication bias, we per-formed several analyses including (i) visual inspectionof funnel plot symmetry, plotting the standard differencein means to standard error (Rosenthal 1979; Sterneet al. 2000, 2011), (ii) calculation of Egger’s regression
intercept (Egger et al. 1997), and (iii) Duval andTweedie’s trim-and-fill method for imputed estimatesand adjusted values (Duval and Tweedie 2000). The testfor heterogeneity was based on Cochran’s Q and τ2
statistic. The I2 value was also calculated, although thiswas reported for descriptive purposes only as this wouldnot be regarded to be an adequate measure of inconsis-tency and has limited generalizability (Borenstein et al.2016). Values of I2 were characterized as small whenI2 = 25% (<= 25%), moderate for I2 = 50% (26–74%),and large as I2 = 75% (> = 75%; Higgins et al. 2003).No study was removed when examining potential con-tributions to heterogeneity nor did we exclude and re-run a meta-analysis as this was regarded as altering thestudy eligibility criteria previously established for oursearch (Higgins 2008).
Additional Analyses – Moderator Variables& Meta-Regression
A subgroup meta-analysis and hierarchical meta-regression were conducted to examine the possible in-fluence of moderator variables on outcome measures aswell as contributions to heterogeneity (Borenstein et al.2009; Borenstein and Higgins 2013; Rutter and Gatsonis2001; Sedgewick 2013; Thompson and Higgins 2002).This was performed with MCI diagnosis, type of train-ing, mode of treatment (group, individual, computer),primary focus of the intervention (memory, multicompo-nent, etc.), type of control group (passive or active),time of post-intervention follow-up assessment, and ad-justment for repeat administration. These were evaluatedusing categorical variables dummy coded in the manneroutlined above. All studies and outcome measures wereincluded in the analysis, with the exception of outcomeswhich would have introduced duplicate data (i.e.MOCA – List Recall, MMSE – List Recall, MOCA –Clock Drawing, etc.).
A hierarchical (incremental) meta-regression was alsoused to explore the incremental contribution of modera-tors in a systematic manner. Given concerns regardingsmall number of studies in meta-regression, we limitedthe number of moderators used to a ratio of one covariatefor every ten studies (Borenstein et al. 2009). With thiscriterion, the number of covariates was limited to two andentered in the order of duration of training and type ofcognitive training. We also conducted an additional posthoc meta-regression in accordance with the recommenda-tion of Fu et al. (2010) in which six to ten studies forcontinuous variables and four studies for categorical var-iables may be acceptable when effect sizes are moderateor large.
446 Neuropsychol Rev (2017) 27:440–484
Results
Studies Selected
The inclusion and exclusion criteria, search strategy, and pa-per selection process we followed resulted in a set of 1199studies for consideration. From this, 1102 were removed forvarious reasons, including, not meeting MCI criteria, contain-ing mixed diagnostic categories (i.e. MCI and mild AD), notan RCT, lacking adequate controls, improper design or did nothave the requisite study arms, did not contain data ornot reporting data in a format suitable for extraction, not de-scribing the key elements necessary for consideration in suf-ficiently clear manner for inclusion (i.e. did not explicitly stateMCI definition for subject selection), or similar complication.An additional 71 studies were excluded as the interventionsused would not be considered to be cognitive in nature (i.e.pharmaceutical, physical exercise, dietary, etc.). Please seeFig. 1 for a flow diagram of the paper selection process andTable S3 for the Boolean search strategy, terms and results ofeach step taken.
Study Characteristics
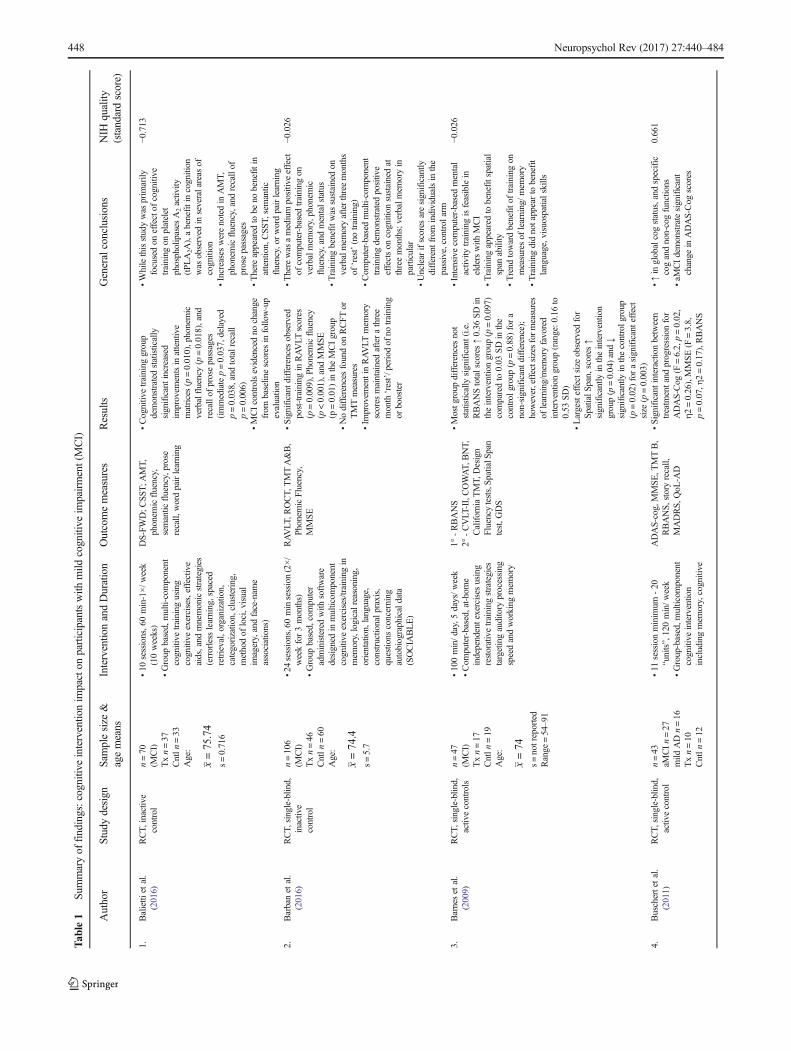
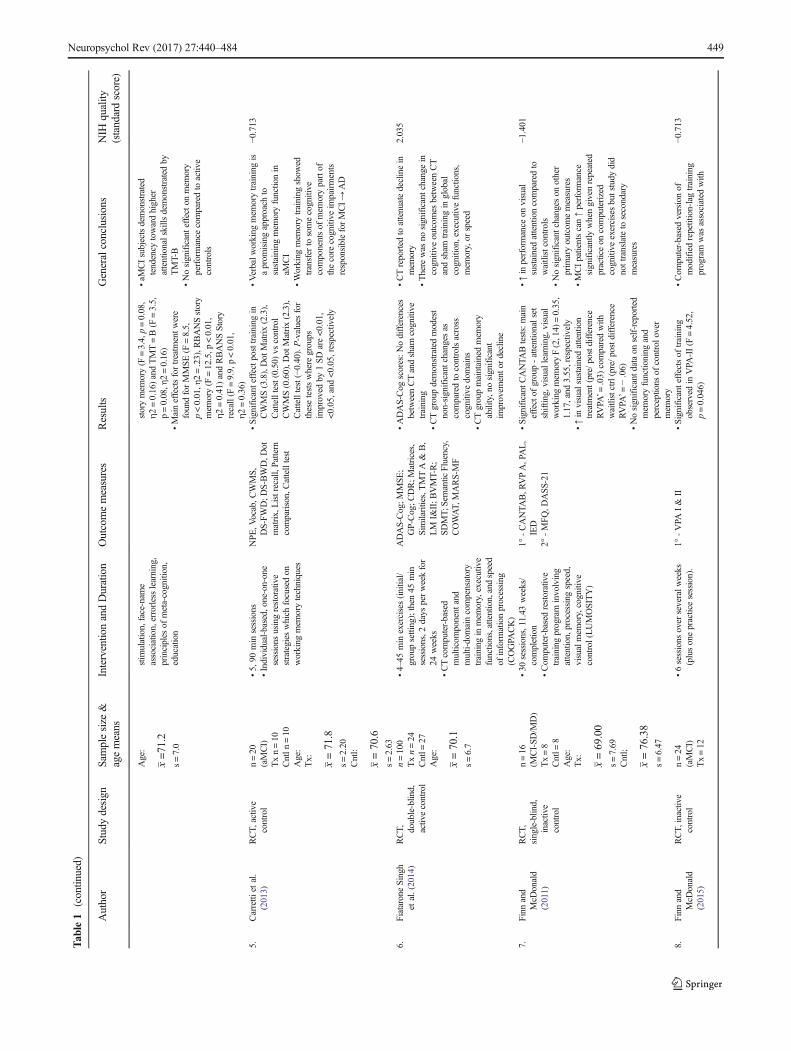
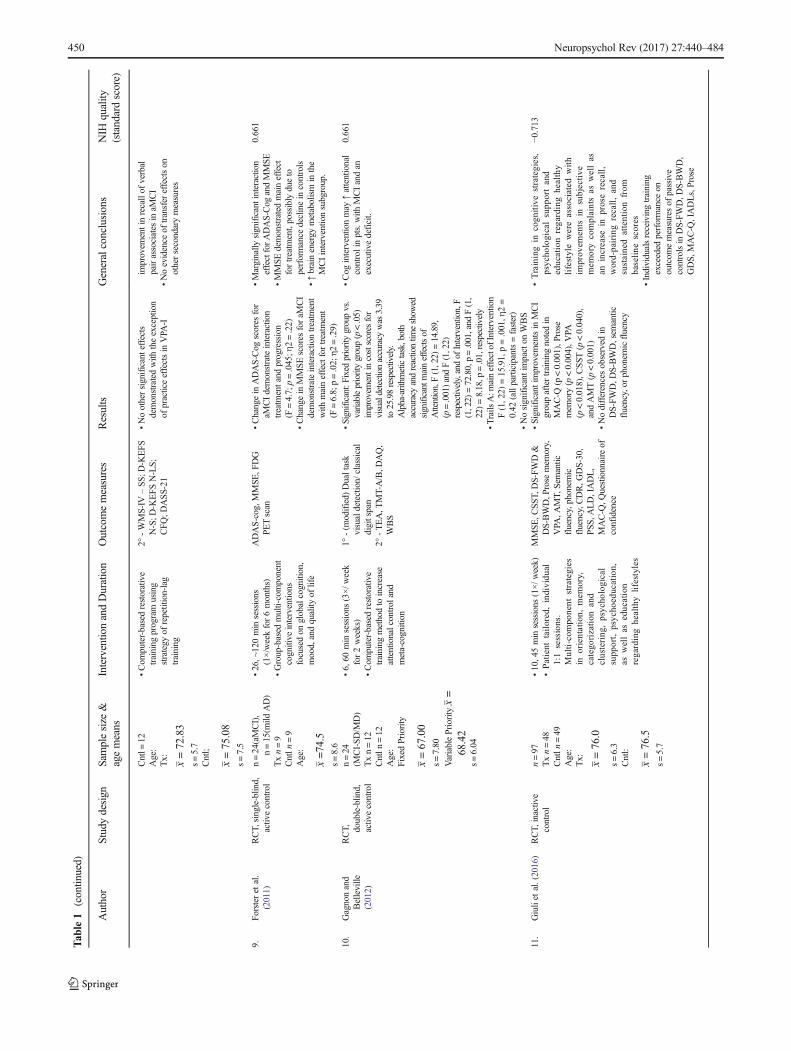
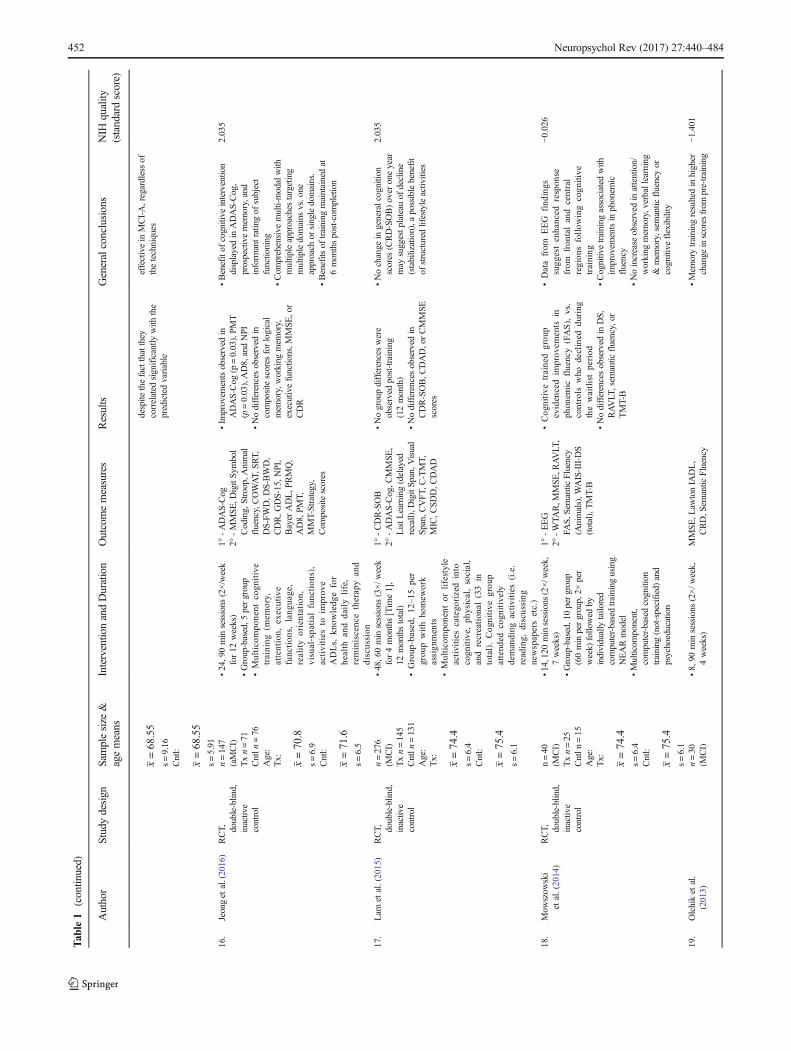
In all, a total of 26 articles met inclusion criteria for meta-analyses. Please see Table 1 for a detailed overview of allstudies examined. The total number of studies meeting criteriawas considered acceptable and sufficient to proceed (k = 26)as this was well above the median number of six studies permeta-analysis reported in a well-known repository ofmetanalytic reviews, the Cochrane Database of SystematicReviews, and exceeded 90% of the analyses (k = 10) conduct-ed in the mental health and behavioral condition category(Davey et al. 2011). The majority of studies included in ourcohort were published recently. 92% of the studies included(24/26) were published within the past 7 years (2010–2017)and 8% of the studies (2/26) were published prior to 2010. Thetotal number of participants who received training was 876(pooled) with a mean of 33.69 subjects per study (SD =35.07; Range 6–145). The diagnosis of study participantswas comprised of amnestic MCI – single domain (19.23%),amnestic –multiple domain MCI (26.92%) as well as all MCIsubtypes combined (53.85%). Samples were drawn from onemulticenter group of nations (Italy, Greece, Norway, & Spain)and eleven individual countries, Argentina (n = 1), Australia(n = 5), Brazil (n = 1), Canada (n = 2), France (n = 1),Germany (n = 2), Greece (n = 1), Hong Kong (n = 1), Italy(n = 4), Korea (n = 1), and the United States (n = 6). Asummary of the age, education, mental status, numberof participants, treatment duration, and span of involvement ispresented in Table S6.
In general terms, the types of interventions employed weremultidomain including lifestyle elements such as exercise and
social support (7/26; 26.92%), general cognitive interventions(7/26; 26.92%), specific mnemonic memory techniques (3/26;11.54%), computer-based interventions (7/26; 26.92%), andhighly developed specialized tasks (2/26; 7.69%).Categorizing interventions with more structured definitionsfound studies employed cognitive stimulation = 0/26 (0%), re-storative training = 8/26 (30.77%), compensatory training = 3/26 (11.54%), and multicomponent approaches = 15/26(57.69%). The primary content of interventions or domainstargeted by treatment generally focused on working memory(7.69%), speed of information processing (7.69%), memory(34.62%), and multidomain training (including componentsassociated with lifestyle and socialization, 50.00%), althoughthere was some overlap in intervention content, strategies ap-plied, and targeted domains (i.e. Jeong et al. 2016). Themodesof training conducted were in group format (46.15%), individ-ual plus dyad training (15.38%), and computer based pro-grams (38.46%). The majority of studies completed post-training evaluations within two weeks or less (80.77%; 21/26). Five studies performed follow-up assessments rangingfrom four to twenty-six weeks (Jean et al. 2010a; Hampsteadet al. 2012a; Valdes et al. 2012; Rojas et al. 2013, and Tsolakiet al. 2011, respectively). Treatment duration was roughlydivided evenly at either short (8 weeks or less, 46.15%) orlong duration (greater than 8 weeks, 53.85%). The majorityof control groups were passive (received no training),waitlisted, or provided standard of care (57.69%) while theremaining engaged in an active, non-trained program(42.31%). Thirty-one percent (30.77%; 8/26) attempted tocontrol for potential confound of practice effects through theuse alternate or parallel versions of test instruments. The re-maining studies (69.23%; 18/26) did not appear to account forpractice effects or did not report this in their study. Othervariables such as IQ, time since diagnoses, date of onset, etc.could not be considered for extraction due to lack of dataacross studies.
Risk of Bias – Individual Studies
While point estimate effect sizes were ultimately used to de-termine training effect, an NIH derived total score and stan-dard score (z) were calculated for each study. This is presentedin Table 1.
Synthesis of Results
A series of meta-analyses were conducted to investigate theeffects of training overall (all measures combined) as well asby cognitive domain, training type, and domain targeted (in-tervention content). Please see Table 2 for an overview ofpoint estimates and summary statistics for each element ofinterventions examined. Meta-regression and post hoc
Neuropsychol Rev (2017) 27:440–484 447
Tab
le1
Summaryof
findings:cognitiv
einterventio
nim
pacton
participantswith
mild
cognitive
impairment(MCI)
Author
Studydesign
Samplesize
&agemeans
Interventio
nandDuration
Outcomemeasures
Results
Generalconclusions
NIH
quality
(standardscore)
1.Balietti
etal.
(2016)
RCT,
inactiv
econtrol
n=70
(MCI)
Txn=37
Cntln
=33
Age:
x=75.74
s=0.716
•10
sessions,6
0min-1×/w
eek
(10weeks)
•Group
based,multi-component
cognitive
training
using
cognitive
exercises,effective
aids,and
mnemonicstrategies
(errorless
learning,spaced
retrieval,organization,
categorization,clustering,
methodof
loci,visual
imagery,andface-nam
eassociations)
DS-FW
D;C
SST;A
MT,
phonem
icfluency,
semantic
fluency,prose
recall,
wordpairlearning
•Cognitivetraining
group
demonstratedstatistically
significantincreased
improvem
entsin
attentive
matrices(p
=0.010),phonemic
verbalfluency(p=0.018),and
recallof
prosepassages
(immediatep=0.037,delayed
p=0.038,andtotalrecall
p=0.006)
•MCIcontrolsevidencedno
change
from
baselinescores
infollo
w-up
evaluation
•Whilethisstudywas
prim
arily
focusedon
effectof
cognitive
training
onplatelet
phospholipases
A2activity
(tPLA2A
),abenefitincognition
was
observed
inseveralareas
ofcognition
•Increaseswerenotedin
AMT,
phonem
icfluency,andrecallof
prosepassages
•There
appeared
tobe
nobenefitin
attention,CSS
T,semantic
fluency,or
wordpairlearning
−0.713
2.Barbanet
al.
(2016)
RCT,
single-blin
d,inactive
control
n=106
(MCI)
Txn=46
Cntln
=60
Age:
x=74.4
s=5.7
•24sessions,60minsession(2×/
weekfor3months)
•Group
based,computer
administeredwith
software
designed
inmulticom
ponent
cognitive
exercises/training
inmem
ory,logicalreasoning,
orientation,language,
constructionalp
raxis,
questions
concerning
autobiographicaldata
(SOCIA
BLE)
RAVLT
,ROCT,
TMTA&B,
Phonem
icFluency,
MMSE
•Significant
differencesobserved
post-trainingin
RAVLT
scores
(p=0.009),P
honemicfluency
(p<0.001),and
MMSE
(p=0.01)in
theMCIgroup
•Nodifferencesfoundon
RCFT
orTMTmeasures
•Im
provem
entinRAVLT
mem
ory
scores
maintainedafterathree
month‘rest’/periodof
notraining
orbooster
•Therewas
amediumpositiv
eeffect
ofcomputer-basedtraining
onverbalmem
ory,phonem
icfluency,andmentalstatus
•Trainingbenefitw
assustainedon
verbalmem
oryafterthreemonths
of‘rest’(notraining)
•Com
puter-basedmulti-component
training
demonstratedpositive
effectson
cognition
sustainedat
threemonths;verbalmem
oryin
particular
•Unclear
ifscores
aresignificantly
differentfrom
individualsin
the
passive,controlarm
−0.026
3.Barneset
al.
(2009)
RCT,
single-blin
d,activecontrols
n=47
(MCI)
Txn=17
Cntln
=19
Age:
x=74
s=notreported
Range
=54–91
•100min/d
ay,5
days/w
eek
•Com
puter-based,at-hom
eindependentexercises
using
restorativetraining
strategies
targetingauditory
processing
speedandworking
mem
ory
1°-RBANS
2°-CVLT
-II,COWAT,
BNT,
CaliforniaTMT,
Design
Fluencytests,Sp
atialSpan
test,G
DS
•Mostg
roup
differencesnot
statistically
significant(i.e.
RBANStotalscores↑0.36
SDin
theinterventiongroup(p
=0.097)
comparedto
0.03
SDin
the
controlg
roup
(p=0.88)fora
non-significantd
ifference);
however,effectsizes
form
easures
oflearning/m
emoryfavored
interventio
ngroup(range:0
.16to
0.53
SD)
•Largesteffectsize
observed
for
SpatialS
pan,scores
↑significantly
intheintervention
group(p=0.04)and↓
significantly
inthecontrolg
roup
(p=0.02)forasignificanteffect
size
(p=0.003)
•Intensivecomputer-basedmental
activ
itytraining
isfeasiblein
elderswith
MCI
•Trainingappeared
tobenefitspatial
span
ability
•Trend
towardbenefito
ftraining
onmeasuresof
learning/m
emory
•Trainingdidnotappearto
benefit
language,visuospatialskills
−0.026
4.Buschertetal.
(2011)
RCT,
single-blin
d,activ
econtrol
n=43
aMCIn=27
mild
ADn=16
Txn=10
Cntln
=12
•11
sessionminim
um-20
“units”,120min/w
eek
•Group-based,m
ulticom
ponent
cognitive
intervention
includingmem
ory,cognitive
ADAS-cog,MMSE,T
MTB,
RBANS,
storyrecall,
MADRS,
QoL
-AD
•Significant
interactionbetween
treatm
entand
progressionfor
ADAS-Cog
(F=6.2,p=0.02,
η2=0.26),MMSE(F
=3.8,
p=0.07,η
2=0.17),RBANS
•↑in
globalcogstatus,and
specific
cogandnon-cogfunctions
•aM
CIdemonstratesignificant
change
inADAS-Cog
scores
0.661
448 Neuropsychol Rev (2017) 27:440–484
Tab
le1
(contin
ued)
Author
Studydesign
Samplesize
&agemeans
Interventio
nandDuration
Outcomemeasures
Results
Generalconclusions
NIH
quality
(standardscore)
Age:
x=71.2
s=7.0
stim
ulation,face-nam
eassociation,errorlesslearning,
principles
ofmeta-cognition,
education
storymem
ory(F
=3.4,p=0.08,
η2=0.16)andTMT=B(F
=3.5,
p=0.08,η
2=0.16)
•Maineffectsfortreatm
entw
ere
foundforMMSE
(F=8.5,
p<0.01,η
2=.23),R
BANSstory
mem
ory(F
=12.5,p
<0.01,
η2=0.41)andRBANSStory
recall(F
=9.9,p<0.01,
η2=0.36)
•aM
CIsubjectsdemonstrated
tendency
towardhigher
attentionalskills
demonstratedby
TMT-B
•Nosignificanteffecto
nmem
ory
performance
comparedto
active
controls
5.Carretti
etal.
(2013)
RCT,
active
control
n=20
(aMCI)
Txn=10
Cntln
=10
Age:
Tx: x=71.8
s=2.20
Cntl:
x=70.6
s=2.63
•5,90
min
sessions
•Individual-based,one-on-one
sessions
usingrestorative
strategies
which
focusedon
working
mem
orytechniques
NPE
,Vocab,C
WMS,
DS-FW
D;D
S-BWD,D
otmatrix,Listrecall,Pattern
comparison,Cattelltest
•Significant
effectposttraining
inCWMS(3.8),Dot
Matrix(2.3),
Cattelltest(0.50)
vscontrol
CWMS(0.60),D
otMatrix(2.3),
Cattelltest(−0.40).P-valuesfor
thesetestswhere
groups
improved
by1SD
are<0.01,
<0.05,and
<0.05,respectively
•Verbalw
orking
mem
orytraining
isaprom
isingapproach
tosustaining
mem
oryfunctionin
aMCI
•Working
mem
orytraining
show
edtransfer
tosomecognitive
componentsof
mem
orypartof
thecore
cognitive
impairments
responsibleforMCI→
AD
−0.713
6.FiataroneSingh
etal.(2014)
RCT, double-blind,
activ
econtrol
n=100
Txn=24
Cntl=
27Age:
x=70.1
s=6.7
•4–45
min
exercises(initial/
groupsetting);then
45min
sessions,2
days
perweekfor
24weeks
•CTcomputer-based
multicom
ponent
and
multi-domaincompensatory
training
inmem
ory,executive
functions,attention,andspeed
ofinform
ationprocessing
(COGPA
CK)
ADAS-Cog;M
MSE
;GP-Cog;C
DR;M
atrices,
Similarities,TMTA&
B,
LM
I&II;B
VMT-R;
SDMT;
Semantic
Fluency,
COWAT,
MARS-M
F
•ADAS-Cog
scores:N
odifferences
betweenCTandsham
cognitive
training
•CTgroupdemonstratedmodest
non-significantchanges
ascomparedto
controlsacross
cognitive
domains
•CTgroupmaintainedmem
ory
ability,nosignificant
improvem
ento
rdecline
•CTreported
toattenuatedeclinein
mem
ory
•There
was
nosignificantchangein
cognitive
outcom
esbetweenCT
andsham
training
inglobal
cognition,executivefunctions,
mem
ory,or
speed
2.035
7.Finn
and
McD
onald
(2011)
RCT,
single-blind,
inactive
control
n=16
(MCI-SD
/MD)
Tx=8
Cntl=
8Age:
Tx: x=69.00
s=7.69
Cntl;
x=76.38
s=6.47
•30
sessions,11.43
weeks/
completion
•Com
puter-basedrestorative
training
program
involving
attention,processing
speed,
visualmem
ory,cognitive
control(LUMOSITY)
1°-CANTA
B,R
VPA,PAL,
IED
2°-MFQ,D
ASS-21
•Significant
CANTA
Btests:main
effectof
group-attentionalset
shifting,visuallearning,visual
working
mem
oryF(2,14)
=0.35,
1.17,and
3.55,respectively
•↑in
visualsustainedattention
treatm
ent(pre/postdifference
RVPA
’=.03)
comparedwith
waitlistctrl(pre/p
ostd
ifference
RVPA
’=−.06)
•Nosignificantd
ataon
self-reported
mem
oryfunctioning
and
perceptions
ofcontrolo
ver
mem
ory
•↑in
performance
onvisual
sustainedattentioncomparedto
waitlistcontrols
•Nosignificantchanges
onother
prim
aryoutcom
emeasures
•MCIpatientscan↑performance
significantly
whengivenrepeated
practiceon
computerized
cognitive
exercisesbutstudy
did
nottranslateto
secondary
measures
−1.401
8.Finn
and
McD
onald
(2015)
RCT,
inactiv
econtrol
n=24
(aMCI)
Tx=12
•6sessions
over
severalw
eeks
(plusonepracticesession).
1°-VPA
I&
II•Significant
effectsof
training
observed
inVPA
-II(F
=4.52,
p=0.046)
•Com
puter-basedversionof
modifiedrepetition-lagtraining
program
was
associated
with
−0.713
Neuropsychol Rev (2017) 27:440–484 449
Tab
le1
(contin
ued)
Author
Studydesign
Samplesize
&agemeans
Interventio
nandDuration
Outcomemeasures
Results
Generalconclusions
NIH
quality
(standardscore)
Cntl=
12Age:
Tx: x=72.83
s=5.7
Cntl;
x=75.08
s=7.5
•Com
puter-basedrestorative
training
program
using
strategy
ofrepetition-lag
training
2°-WMS-IV
–SS
;D-K
EFS
N-S;D
-KEFS
N-LS;
CFQ
;DASS-21
•Noothersignificanteffects
demonstratedwith
theexception
ofpracticeeffectsin
VPA
-I
improvem
entinrecallof
verbal
pairassociates
inaM
CI
•Noevidence
oftransfer
effectson
othersecondarymeasures
9.Fo
rsteret
al.
(2011)
RCT,
single-blind,
activ
econtrol
n=24(aMCI),
n=15(m
ildAD)
Txn=9
Cntln
=9
Age:
x=74.5
s=8.6
•26,~
120min
sessions
(1×/weekfor6months)
•Group-based
multi-component
cognitive
interventions
focusedon
globalcognition,
mood,andquality
oflife
ADAS-cog,MMSE
,FDG
PETscan
•Changein
ADAS-Cog
scores
for
aMCIdemonstrateinteraction
treatm
entand
progression
(F=4.7;
p=.045;η
2=.22)
•Changein
MMSE
scores
foraM
CI
demonstrateinteractiontreatm
ent
with
maineffectfortreatm
ent
(F=6.8;
p=.02;
η2=.29)
•Marginally
significantinteraction
effectforADAS-Cog
andMMSE
•MMSE
demonstratedmaineffect
fortreatm
ent,possibly
dueto
performance
declinein
controls
•↑brainenergy
metabolism
inthe
MCIinterventionsubgroup.
0.661
10.
Gagnonand
Belleville
(2012)
RCT, double-blind,
activ
econtrol
n=24
(MCI-SD/M
D)
Txn=12
Cntln
=12
Age:
FixedPriority
x=67.00
s=7.80
VariablePriority
x=
68.42
s=6.04
•6,60
min
sessions
(3×/w
eek
for2weeks)
•Com
puter-basedrestorative
training
methodto
increase
attentionalcontrol
and
meta-cognition
1°-(m
odified)
Dualtask
visualdetection/
classical
digitspan
2°-TEA,T
MT-A/B,D
AQ,
WBS
•Significant:F
ixed
prioritygroupvs.
variableprioritygroup(p<.05)
improvem
entincostscores
for
visualdetectionaccuracy
was
3.39
to25.98respectively.
Alpha-arithm
etictask,both
accuracy
andreactiontim
eshow
edsignificantmaineffectsof
Attention,F(1,22)
=14.89,
(p=.001)andF(1,22)
respectively,andof
Intervention,F
(1,22)
=72.80,p=.001,and
F(1,
22)=8.18,p
=.01,respectively
•Trails
A:m
aineffectof
Interventio
nF(1,22)
=15.91,p=.001,η
2=
0.42
(allparticipants=faster)
•Nosignificantimpacton
WBS
•Cog
interventio
nmay
↑attentional
controlinpts.with
MCIandan
executivedeficit.
0.661
11.
Giuliet
al.(2016)
RCT,
inactive
control
n=97
Txn=48
Cntln
=49
Age:
Tx: x=76.0
s=6.3
Cntl:
x=76.5
s=5.7
•10,45min
sessions
(1×/w
eek)
•Patient
tailored,individu
al1:1sessions.
Multi-com
ponent
strategies
inorientation,
mem
ory,
catego
rization
and
clustering
,psycho
logical
supp
ort,
psycho
education,
aswellas
education
regardinghealthylifestyles
MMSE
,CSS
T,DS-FW
D&
DS-BWD,P
rose
mem
ory,
VPA
,AMT,
Sem
antic
fluency,phonem
icfluency,CDR,G
DS-30,
PSS
,ALD,IADL,
MAC-Q
,Questionnaire
ofconfidence
•Significantimprovem
entsin
MCI
groupaftertraining
notedin
MAC-Q
(p<0.001),P
rose
mem
ory(p<0.004),V
PA(p<0.018),C
SST
(p<0.040),
andAMT(p<0.001)
•Nodifferencesobserved
inDS-FW
D,D
S-BWD,sem
antic
fluency,or
phonem
icfluency
•Trainingin
cogn
itivestrategies,
psycho
logicalsupp
ortand
educationregardinghealthy
lifestylewereassociated
with
improv
ements
insubjective
mem
orycomplaintsas
wellas
anincrease
inproserecall,
word-pairingrecall,and
sustainedattentionfrom
baseline
scores
•Individualsreceivingtraining
exceeded
performance
onoutcom
emeasuresof
passive
controlsin
DS-FW
D,D
S-BWD,
GDS,
MAC-Q
,IADLs,Prose
−0.713
450 Neuropsychol Rev (2017) 27:440–484

Tab
le1
(contin
ued)
Author
Studydesign
Samplesize
&agemeans
Interventio
nandDuration
Outcomemeasures
Results
Generalconclusions
NIH
quality
(standardscore)
mem
ory,wordpairing,CSS
T,and
AMT.
12.
Greenaw
ayet
al.
(2012)
RCT,
inactive
control
n=40
(aMCI-SD
)Txn=20
Cntln
=20
Age:
Tx: x=72.7
s=6.9
Cntl:
x=72.3
s=7.9
•12,60min
sessions
(2×/w
eek
for6weeks)
•Dyad-based(participantand
partner)receiving
compensatorytraining
mem
orystrategies
(Mem
ory
SupportS
ystem)
DRS-II,M
MSE
,WMS-R/III,
CERADWordList,
WMS-R/IIIVR,E
Cog,
QoL
-AD,C
BQ,C
hronic
Disease
Self-Efficacy
Scale,A
dherence
Assessm
ent
•Nosignificanteffectsof
treatm
ent
invs.controlinDRS-IIor
MMSE
•TreatmentE
cogsignificantat8
wk
[t(17)
=2.4,p<0.05]butn
otat
6months
•MCIsenseof
mem
oryself-efficacy
attheend,t(15)=−3
.1(p<0.01)
vs.controls,t(33)=
2.4(p=0.02)
•↑Fu
nctionalabilityandsenseof
self-efficacycomparedwith
controlsoutto8-weekfollow-up
•↑in
ADLsand↑ECog
scores
−1.401
13.
Ham
pstead
etal.
(2012a)
RCT,
single-blind,
inactiv
econtrol
n=49
Tx=11
Cntl=
10Age:
aMCImnemonic:
x=73.5
s=10.1
aMCIexposure:
x=70.5
s=5.8
•3,60–90min
sessions,over
2weeks
•Individual-based,one-on-one
compensatorytraining
inobject-locationbuilt
onface-nam
eassociationand
mnemonicstrategies
MMSE
,RBANS,
TMT,
GDS,
FAQ,ILV
,F-N
Accuracy,fM
RIim
aging
Correlation(Spearman’sRho)results:
•SignificantR
BANSDMI:aM
CI
mnemonicgroup=.67(p=.009),
healthy+MCImnemonic
group=.68(p<.001),and
healthy+MCIexposure=.68
(p<.001)
•Significant
Trails:aMCImnemonic
group=.57(p=.03)
•Significant
ILV:h
ealth
y+MCI
mnemonicgroup=−.75
(p=<.001)andaM
CImnemonic
group=−.81
(p=.001)
•Significantamygdala:healthy+MCI
mnemonicgroup=.54(p=.01)
•Mnemonicstrategies
↑mem
oryfor
specificcontentfor
atleast
1month
−0.0.26
14.
Herrera
etal.
(2012)
RCT,
single-blind,
activ
econtrol
n=22
(aMCI-MD)
Txn=11
Cntln
=11
Age:
Tx: x=75.09
s=1.97
Cntl
x=78.18
s=1.44
•24,60min
sessions
(2×/w
eek
for12
weeks)
•Com
puter-basedrestorative
training
inmem
ory&
attention
DS-FWD,D
S-BWD,
DMS4
8,12-w
ordrecall
(BEM-144),16-FR/CR
test,M
MSE,D
oors/
Peoplemem
ory
Significantcognitiveoutcom
es:
•Trained
groupim
mediately
atend
oftraining
-DoorsA
(9.64±0.53),DoorsB
(6.36±0.66),DMS48
(96.91
±0.58),forw
arddigitspan
(4.91±0.21),BEM-144
(7.28±0.26),16-FR/CRtest
(42.91
±0.76),andMMSE
(2.09±0.22)
•Trained
group6monthsafter
training
-DoorsA(8.55±0.39),
forw
arddigitspan(4.92±0.23),
BEM-144
(6.86±0.52)
•Cog
training
associated
with
↑episodicrecallandrecognition
post-trainingwhich
was
also
sustainedat6months
post-training
−0.026
15.
Jean
etal.(2010a)
RCT,
single-blind,
activ
econtrols
n=22
(aMCI)
Txn=11
Cntln
=11
Age:
Tx:
•6,45
minsessions
(2×/weekfor
3weeks)
•Individual-session
restorative
focusedtraining
inface-nam
eassociations
usingerrorless
learning
andspaced
retrieval
1°-Trainingmeasure(free
recallandcued
recall)
2°-CVLT
-II,DRS-2,F-N
Recall,MMSE,R
BMT,
MMQ,S
ES
•To
talprofilescoreRBMTim
proved
significantly
(t=7.687,p<.001)
whileage,MMSEtotalscore,
DRS-2
totalscore,D
RS-2
mem
orysubscalescoreand
CVLT
-IIdelayedfree
recalldid
notsignificantly
improvemodel
•↑explicitresidualmem
ory
importantfactorleadsto
↑outcom
ewhenusingerrorless
learning
orerrorful
learning
tolearnface–nam
eassociations.
•Structured
cogtraining,focusingon
mem
oryissues,w
/pt.support,is
−0.026
Neuropsychol Rev (2017) 27:440–484 451
Tab
le1
(contin
ued)
Author
Studydesign
Samplesize
&agemeans
Interventio
nandDuration
Outcomemeasures
Results
Generalconclusions
NIH
quality
(standardscore)
x=68.55
s=9.16
Cntl:
x=68.55
s=5.91
despite
thefactthatthey
correlated
significantly
with
the
predictedvariable
effectivein
MCI-A,regardlessof
thetechniques
16.
Jeonget
al.(2016)
RCT, double-blind,
inactiv
econtrol
n=147
(aMCI)
Txn=71
Cntln
=76
Age:
Tx: x=70.8
s=6.9
Cntl:
x=71.6
s=6.5
•24,90min
sessions
(2×/week
for12
weeks)
•Group-based,5
pergroup
•Multicompo
nent
cogn
itive
training
(mem
ory,
attention,
executive
function
s,lang
uage,
realityorientation,
visual-spatial
function
s),
activities
toim
prov
eADLs,
know
ledg
efor
health
anddailylife,
reminiscencetherapyand
discussion
1°-ADAS-Cog
2°-MMSE,D
igitSy
mbol
Coding,Stroop,A
nimal
fluency,COWAT,
SRT,
DS-FWD,D
S-BWD,
CDR,G
DS-15,N
PI,
Bayer
ADL,P
RMQ,
AD8,PM
T,MMT-Strategy,
Com
positescores
•Im
provem
entsobserved
inADAS-Cog
(p=0.03),PM
T(p=0.03),AD8,andNPI
•Nodifferencesobserved
incompositescores
forlogical
mem
ory,working
mem
ory,
executivefunctions,M
MSE
,or
CDR
•Benefitof
cognitive
intervention
displayedin
ADAS-Cog,
prospectivemem
ory,and
inform
antratingof
subject
functioning
•Com
prehensive
multi-modalwith
multip
leapproaches
targeting
multipledomains
vs.one
approach
orsingledomains.
•Benefits
oftraining
maintainedat
6monthspost-com
pletion
2.035
17.
Lam
etal.(2015)
RCT, double-blind,
inactiv
econtrol
n=276
(MCI)
Txn=145
Cntln
=131
Age:
Tx: x=74.4
s=6.4
Cntl:
x=75.4
s=6.1
•48,60min
sessions
(3×/w
eek
for4months[Tim
e1],
12monthstotal)
•Group
-based,12
–15per
grou
pwithho
mew
ork
assign
ments
•Multicompo
nent
orlifestyle
activities
catego
rizedinto
cogn
itive,
physical,social,
andrecreation
al(33in
total).Cog
nitive
grou
pattend
edcogn
itively
demanding
activities
(i.e.
reading,
discussing
newspapersetc.)
1°-CDR-SOB
2°-ADAS-Cog,C
MMSE
,ListL
earning(delayed
recall),D
igitSp
an,V
isual
Span,CVFT
,C-TMT,
MIC,C
SDD,C
DAD
•Nogroupdifferenceswere
observed
post-training
(12month)
•Nodifferencesobserved
inCDR-SOB,C
DAD,orCMMSE
scores
•Nochange
ingeneralcognition
scores
(CRD-SOB)over
oneyear
may
suggestp
lateau
ofdecline
(stabilization),a
possiblebenefit
ofstructured
lifestyleactiv
ities
2.035
18.
Mow
szow
ski
etal.(2014)
RCT, double-blind,
inactiv
econtrol
n=40
(MCI)
Txn=25
Cntln
=15
Age:
Tx: x=74.4
s=6.4
Cntl:
x=75.4
s=6.1
•14,120minsessions
(2×/w
eek,
7weeks)
•Group-based,10pergroup
(60min
pergroup,2×
per
week)
follo
wed
byindividually
tailored
computer-basedtraining
using
NEARmodel
•Multicom
ponent,
computer-basedcognition
training
(not-specified)and
psychoeducation
1°-EEG
2°-W
TAR,M
MSE,R
AVLT
,FA
S,S
emantic
Fluency
(Animals),W
AIS-III-D
S(total),TMT-B
•Cog
nitive
trainedgrou
pevidencedim
prov
ements
inph
onem
icfluency(FAS),
vs.
controls
who
declined
during
thewaitlistperiod
•Nodifferencesobserved
inDS,
RAVLT
,sem
antic
fluency,or
TMT-B
•Datafrom
EEG
find
ings
sugg
estenhanced
respon
sefrom
fron
talandcentral
region
sfollow
ingcogn
itive
training
•Cognitivetraining
associated
with
improvem
entsin
phonem
icfluency
•Noincrease
observed
inattention/
working
mem
ory,verballearning
&mem
ory,semantic
fluencyor
cognitive
flexibility
−0.026
19.
Olchiket
al.
(2013)
n=30
(MCI)
•8,90
min
sessions
(2×/w
eek,
4weeks)
MMSE
,Law
tonIA
DL,
CRD,S
emantic
Fluency
•Mem
orytraining
resultedin
higher
change
inscores
from
pre-training
−1.401
452 Neuropsychol Rev (2017) 27:440–484
Tab
le1
(contin
ued)
Author
Studydesign
Samplesize
&agemeans
Interventio
nandDuration
Outcomemeasures
Results
Generalconclusions
NIH
quality
(standardscore)
RCT,
single-blind,
inactiv
econtrol
Txn=16
Cntln
=14
Age:
Tx: x=70.3
s=4.3
Cntl:
x=70.2
s=5.7
•Group-based,10pergroup,
comprised
ofboth
MCIand
norm
alcontrols
•Group
sessions
multicom
ponent
training
focusedon
mem
ory
with
each
sessionbeginning
with
explanatory/
education
followed
bytraining
ina
mem
orizationtargettask/
strategy
(activeattention,
categorization,association,or
visualim
agery),and
exercises
topracticethestrategy.
(Animals),C
OWAT
(FAS),RAVLT
,RBMT
•Therewereno
statisticallysignificant
effectsformem
orytrainingacross
groups
post-training
•Mem
orytraining
was
associated
with
greaterim
provem
entinFA
SandRAVLT
scores
(com
paredto
othergroups
exam
ined)
•MCIparticipantsdemonstrated
moresignificantincreaseinscores
than
norm
alcontrolsin
RAVLT
(immediate&
delay)
andRBMT
(screening)
values,beyondeducationtrained
orinactivecontrols
•MCIindividualsappeared
tobenefit
morefrom
training
than
norm
alcontrols,supportingthe
compensationhypothesis
•Mem
orytraining
wasnotassociated
with
improvem
entsin
cognitive
outcom
esof
fluency(sem
antic
orphonem
ic),verballistlearning&
recall,
orgeneralm
emory
performance
20.
Politoet
al.
(2015)
RCT,
single-blind,
inactiv
econtrol
n=44
(MCI)
Txn=22
Cntln
=22
Age:
Tx: x=74.0
s=1.4
Cntl:
x=74.3
s=1.7
•10,100minsessions
(2×/w
eek,
5weeks)
•Group-based,7–8
pergroup
•Group
sessions
with
multicompo
nent
training
usingbo
dyaw
akening,
realityorientation,
and
multiplecompensatory
cogn
itiveexercises.
Exercises
weredesign
edto
stim
ulateattention
(aud
itoryandvisual),
executivereason
ing,
lang
uage
(fluency),
semanticmem
ory,
visual
perception
,encoding
,inform
ationstorage,
nonv
erballearning
and
executiveprob
lem
solving.
MMSE
,MOCA,and
CSS
T•Participantsreceivingeither
cognitive
training
orsham
treatm
entb
othdemonstrateda
significantimprovem
entin
MMSE
andMOCAscores
•Im
provem
entsfrom
baselinescores
wereobserved
intheMCItrained
grouppost-training,although
this
didnotreach
significance
forany
outcom
emeasure(M
MSE
,MOCA,&
CSST
)
•Cognitivetraining
was
not
associated
with
anincrease
incognitive
performance
onoutcom
emeasures
•Anincrease
inperformance
observed
inthesham
training
group(inactivecontrols)may
beattributed
toaplaceboeffector,
possibly,representpracticeeffects
0.661
21.
Rappet
al.(2002)
RCT,
single-blind,
inactiv
econtrol
n=19
(MCI)
Txn=9
Cntln
=10
Age:
Tx: x=73.33
s=6.61
Cntl:
x=75.10
s=7.03
•6,120min
sessions
(1×/week
for6weeks)
•Group-based,m
ulticom
ponent
training
usingeducation,
relaxationtraining,m
emory
skillstraining,and
cognitive-restructuring
CERADneuropsychological
battery,M
MSE
,Face-Nam
e,MFQ
,Mem
oryControllability
Inventory,PO
MS
•Meanvalues
notedforword
list
delayof
trainedgrou
p.The
data
forpre-test,po
st-test,
andfollow
-upwas
[3.56;
SD=2.92
],[8.44;
SD=4.22
],and[6.71;
SD=3.99
].Follow-upwas
sign
ificant
(p<0.07
)•Pt’sratedtheirmem
oryability
higher
than
controls(i.e.
MCI-PresentA
bilityscale,
p=0.008)
•Trainingledto
↑expectations
for
future
improvem
ent(i.e.
MCI-Po
tentialImprovem
ent:
p=0.005)
and↓expectations
for
cognitive
declineMCIInevitable
decline:p=0.06)
•Nochange
inobjectivelaboratory
mem
orytasksfollowingtraining
•Cognitiv
e/behavioralgroup
interventiontargetingmem
ory
performance
andmem
ory
appraisalscanbe
effectiveat
changing
perceptions
ofmem
ory
abilityinahigh-riskpopulationof
olderadultswith
MCI
•Older
adultswith
MCImay
need
moreskillstraining
toachieveand
maintainperformance
improvem
ents.
−0.713
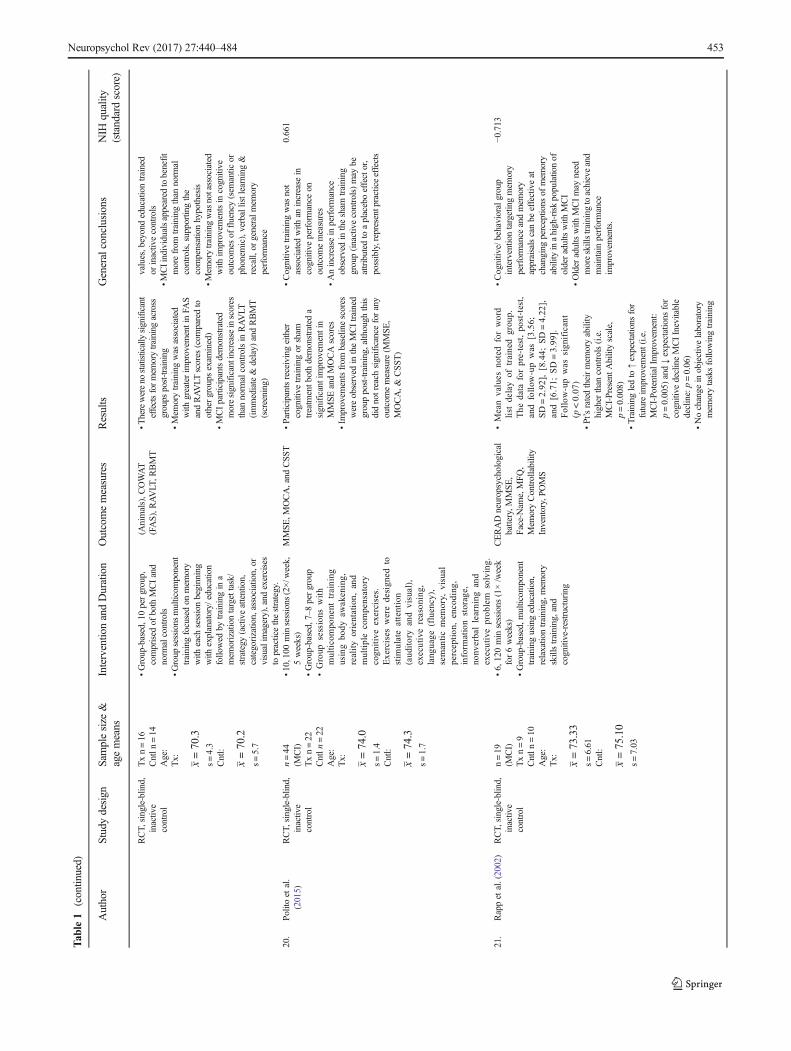
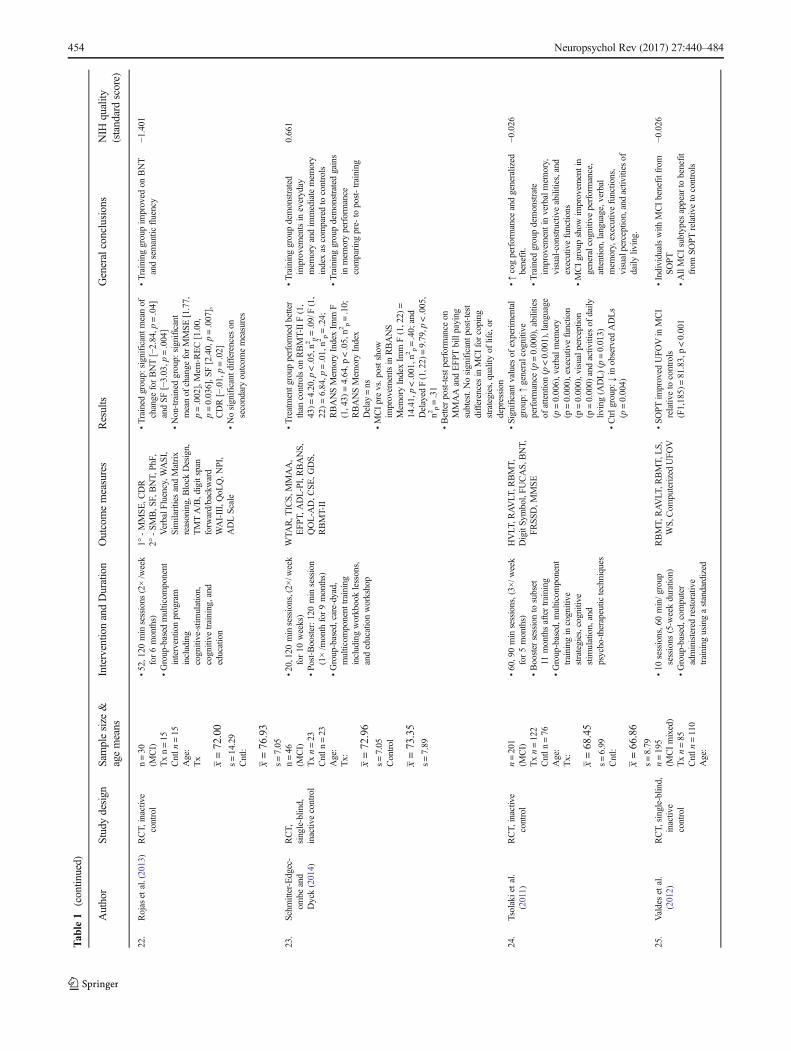
Neuropsychol Rev (2017) 27:440–484 453
Tab
le1
(contin
ued)
Author
Studydesign
Samplesize
&agemeans
Interventio
nandDuration
Outcomemeasures
Results
Generalconclusions
NIH
quality
(standardscore)
22.
Rojas
etal.(2013)
RCT,
inactive
control
n=30
(MCI)
Txn=15
Cntln
=15
Age:
Tx x=72.00
s=14.29
Cntl:
x=76.93
s=7.05
•52,120
minsessions
(2×/week
for6months)
•Group-based
multicom
ponent
interventionprogram
including
cognitive-stim
ulation,
cognitive
training,and
education
1°-MMSE,C
DR
2°-SM
B,S
F,BNT,
PhF,
VerbalF
luency,W
ASI,
Sim
ilaritiesandMatrix
reasoning,Block
Design,
TMTA/B,digitspan
forw
ard/backward
WAI-III,QoL
Q,N
PI,
ADLScale
•Trained
group:
significantm
eanof
change
forBNT[−2.84,p
=.04]
andSF
[−3.03,p
=.004]
•Non-trained
group:
significant
meanof
change
forMMSE
[1.77,
p=.002],Mem
-REC[1.00,
p=0.036],S
F[2.40,p=.007],
CDR[−.01,p=.02]
•Nosignificantd
ifferences
onsecondaryoutcom
emeasures
•Traininggroupim
proved
onBNT
andsemantic
fluency
−1.401
23.
Schm
itter-Edgec-
ombe
and
Dyck(2014)
RCT,
single-blin
d,inactiv
econtrol
n=46
(MCI)
Txn=23
Cntln
=23
Age:
Tx: x=72.96
s=7.05
Control
x=73.35
s=7.89
•20,120minsessions,(2×
/week
for10
weeks)
•Po
st-Booster:1
20min
session
(1×/m
onth
for9months)
•Group-based,care-dyad,
multicom
ponent
training
includingworkbooklessons,
andeducationworkshop
WTA
R,T
ICS,M
MAA,
EFP
T,ADL-PI,RBANS,
QOL-A
D,C
SE,G
DS,
RBMT-II
•Treatmentg
roup
performed
better
than
controlson
RBMT-IIF(1,
43)=
4.20,p
<.05,n2
p=.09/F(1,
22)=6.84,p
=.01,n2
p=.24;
RBANSMem
oryIndexIm
mF
(1,43)
=4.64,p
<.05,n2
p=.10;
RBANSMem
oryIndex
Delay
=ns
•MCIprevs.postshow
improvem
entsin
RBANS
Mem
oryIndexIm
mF(1,22)
=14.41,p<.001,n
2 p=.40;
and
Delayed
F(1,22)=9.79,p
<.005,
n2p=.31
•Betterpost-testp
erform
ance
onMMAAandEFPT
billpaying
subtest.Nosignificantp
ost-test
differencesin
MCIforcoping
strategies,qualityof
life,or
depression
•Traininggroupdemonstrated
improvem
entsin
everyday
mem
oryandim
mediatemem
ory
indexas
comparedto
controls
•Traininggroupdemonstratedgains
inmem
oryperformance
comparing
pre-
topost-training
0.661
24.
Tsolakietal.
(2011)
RCT,
inactive
control
n=201
(MCI)
Txn=122
Cntln
=76
Age:
Tx: x=68.45
s=6.99
Cntl:
x=66.86
s=8.79
•60,9
0min
sessions,(3×
/week
for5months)
•Booster
sessionto
subset
11monthsaftertraining
•Group-based,m
ulticom
ponent
training
incognitive
strategies,cognitive
stim
ulation,and
psycho-therapeutictechniques
HVLT
,RAVLT
,RBMT,
DigitSy
mbol,FU
CAS,
BNT,
FRSS
D,M
MSE
•Significantv
aluesof
experimental
group:
↑generalcognitive
performance
(p=0.000),abilities
ofattention(p<0.001),language
(p=0.006),verbalm
emory
(p=0.000),executivefunction
(p=0.000),visualp
erception
(p=0.000)
andactivities
ofdaily
living(A
DL)(p=0.013)
•Ctrlg
roup:↓
inobserved
ADLs
(p=0.004)
•↑cogperformance
andgeneralized
benefit.
•Trained
groupdemonstrate
improvem
entinverbalmem
ory,
visual-constructiveabilities,and
executivefunctions
•MCIgroupshow
improvem
entin
generalcognitiveperformance,
attention,language,verbal
mem
ory,executivefunctions,
visualperceptio
n,andactivities
ofdaily
living.
−0.026
25.
Valdeset
al.
(2012)
RCT,
single-blind,
inactiv
econtrol
n=195
(MCImixed)
Txn=85
Cntln
=110
Age:
•10
sessions,60min/g
roup
sessions
(5-w
eekduratio
n)•Group-based,com
puter
administeredrestorative
training
usingastandardized
RBMT,
RAVLT
,RBMT,
LS,
WS,Com
puterizedUFO
V•SO
PTim
proved
UFO
Vin
MCI
relativeto
controls
(F1,185)=81.83,p<0.001
•Individualswith
MCIbenefitfrom
SOPT
•AllMCIsubtypes
appearto
benefit
from
SOPT
relativ
eto
controls
−0.026
454 Neuropsychol Rev (2017) 27:440–484
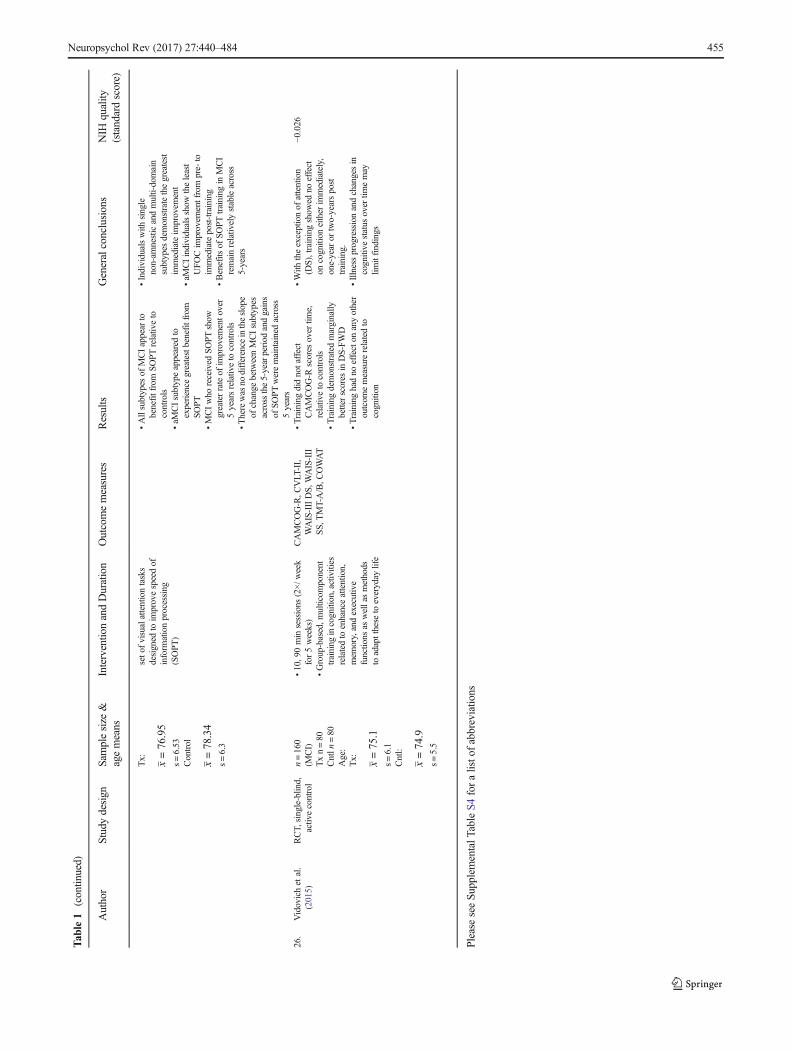
Tab
le1
(contin
ued)
Author
Studydesign
Samplesize
&agemeans
Interventio
nandDuration
Outcomemeasures
Results
Generalconclusions
NIH
quality
(standardscore)
Tx: x=76.95
s=6.53
Control
x=78.34
s=6.3
seto
fvisualattentiontasks
designed
toim
provespeedof
inform
ationprocessing
(SOPT
)
•Allsubtypes
ofMCIappear
tobenefitfrom
SOPT
relativ
eto
controls
•aM
CIsubtypeappeared
toexperience
greatestbenefitfrom
SOPT
•MCIwho
received
SOPT
show
greaterrateof
improvem
ento
ver
5yearsrelativeto
controls
•Therewas
nodifference
intheslope
ofchange
betweenMCIsubtypes
acrossthe5-yearperiod
andgains
ofSO
PTweremaintainedacross
5years
•Individualswith
single
non-am
nesticandmulti-domain
subtypes
demonstratethegreatest
immediateim
provem
ent
•aM
CIindividualsshow
theleast
UFO
Cim
provem
entfrom
pre-
toim
mediatepost-training
•Benefits
ofSO
PTtraining
inMCI
remainrelativelystableacross
5-years
26.
Vidovichet
al.
(2015)
RCT,
single-blind,
activ
econtrol
n=160
(MCI)
Txn=80
Cntln
=80
Age:
Tx: x=75.1
s=6.1
Cntl:
x=74.9
s=5.5
•10,90min
sessions
(2×/w
eek
for5weeks)
•Group-based,m
ulticom
ponent
training
incognition,activities
relatedto
enhanceattention,
mem
ory,andexecutive
functions
aswellasmethods
toadaptthese
toeveryday
life
CAMCOG-R,C
VLT
-II,
WAIS-IIIDS,
WAIS-III
SS,
TMT-A/B,C
OWAT
•Trainingdidnotaffect
CAMCOG-R
scores
over
time,
relativeto
controls
•Trainingdemonstratedmarginally
betterscores
inDS-FWD
•Traininghadno
effecton
anyother
outcom
emeasure
relatedto
cognition
•With
theexceptionof
attention
(DS),trainingshow
edno
effect
oncognition
either
immediately,
one-year
ortwo-yearspost
training.
•Illnessprogressionandchangesin
cognitive
status
over
timemay
limitfindings
−0.026
PleaseseeSu
pplementalT
ableS4foralisto
fabbreviatio
ns
Neuropsychol Rev (2017) 27:440–484 455
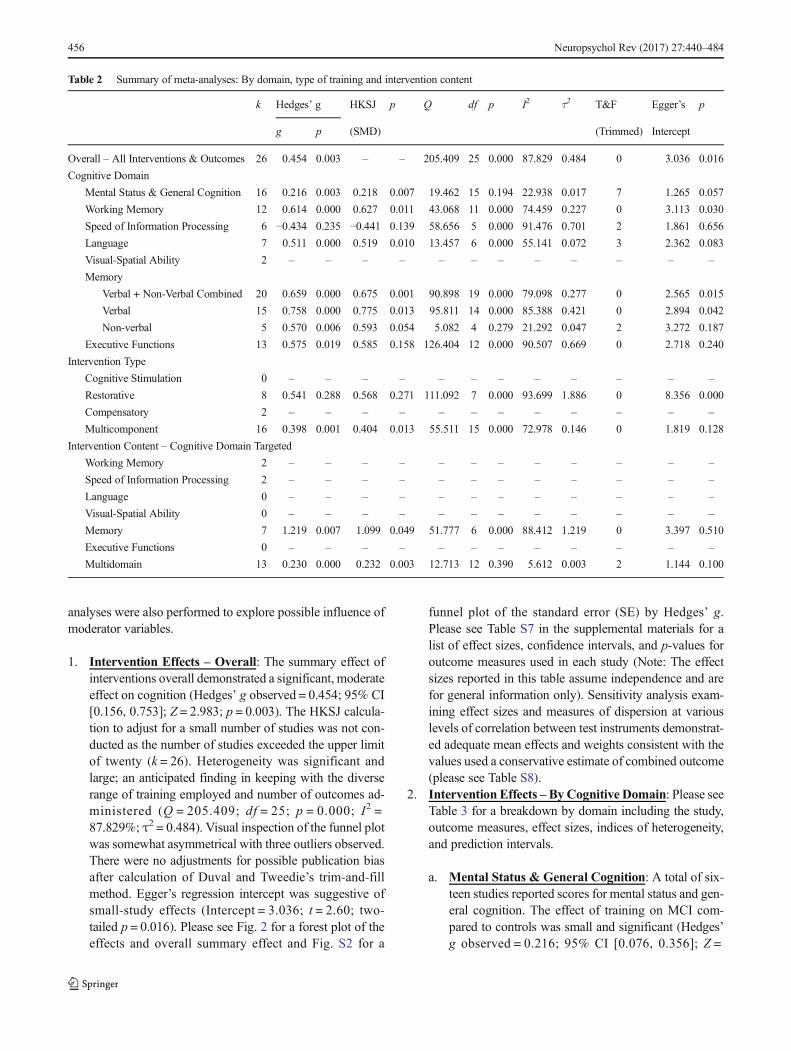
analyses were also performed to explore possible influence ofmoderator variables.
1. Intervention Effects – Overall: The summary effect ofinterventions overall demonstrated a significant, moderateeffect on cognition (Hedges’ g observed = 0.454; 95% CI[0.156, 0.753]; Z = 2.983; p = 0.003). The HKSJ calcula-tion to adjust for a small number of studies was not con-ducted as the number of studies exceeded the upper limitof twenty (k = 26). Heterogeneity was significant andlarge; an anticipated finding in keeping with the diverserange of training employed and number of outcomes ad-ministered (Q = 205.409; df = 25; p = 0.000; I2 =87.829%; τ2 = 0.484). Visual inspection of the funnel plotwas somewhat asymmetrical with three outliers observed.There were no adjustments for possible publication biasafter calculation of Duval and Tweedie’s trim-and-fillmethod. Egger’s regression intercept was suggestive ofsmall-study effects (Intercept = 3.036; t = 2.60; two-tailed p = 0.016). Please see Fig. 2 for a forest plot of theeffects and overall summary effect and Fig. S2 for a
funnel plot of the standard error (SE) by Hedges’ g.Please see Table S7 in the supplemental materials for alist of effect sizes, confidence intervals, and p-values foroutcome measures used in each study (Note: The effectsizes reported in this table assume independence and arefor general information only). Sensitivity analysis exam-ining effect sizes and measures of dispersion at variouslevels of correlation between test instruments demonstrat-ed adequate mean effects and weights consistent with thevalues used a conservative estimate of combined outcome(please see Table S8).
2. Intervention Effects –ByCognitive Domain: Please seeTable 3 for a breakdown by domain including the study,outcome measures, effect sizes, indices of heterogeneity,and prediction intervals.
a. Mental Status & General Cognition: A total of six-teen studies reported scores for mental status and gen-eral cognition. The effect of training on MCI com-pared to controls was small and significant (Hedges’g observed = 0.216; 95% CI [0.076, 0.356]; Z =
Table 2 Summary of meta-analyses: By domain, type of training and intervention content
k Hedges’ g HKSJ p Q df p I2 τ2 T&F Egger’s p
g p (SMD) (Trimmed) Intercept
Overall – All Interventions & Outcomes 26 0.454 0.003 – – 205.409 25 0.000 87.829 0.484 0 3.036 0.016
Cognitive Domain
Mental Status & General Cognition 16 0.216 0.003 0.218 0.007 19.462 15 0.194 22.938 0.017 7 1.265 0.057
Working Memory 12 0.614 0.000 0.627 0.011 43.068 11 0.000 74.459 0.227 0 3.113 0.030
Speed of Information Processing 6 −0.434 0.235 −0.441 0.139 58.656 5 0.000 91.476 0.701 2 1.861 0.656
Language 7 0.511 0.000 0.519 0.010 13.457 6 0.000 55.141 0.072 3 2.362 0.083
Visual-Spatial Ability 2 – – – – – – – – – – – –
Memory
Verbal + Non-Verbal Combined 20 0.659 0.000 0.675 0.001 90.898 19 0.000 79.098 0.277 0 2.565 0.015
Verbal 15 0.758 0.000 0.775 0.013 95.811 14 0.000 85.388 0.421 0 2.894 0.042
Non-verbal 5 0.570 0.006 0.593 0.054 5.082 4 0.279 21.292 0.047 2 3.272 0.187
Executive Functions 13 0.575 0.019 0.585 0.158 126.404 12 0.000 90.507 0.669 0 2.718 0.240
Intervention Type
Cognitive Stimulation 0 – – – – – – – – – – – –
Restorative 8 0.541 0.288 0.568 0.271 111.092 7 0.000 93.699 1.886 0 8.356 0.000
Compensatory 2 – – – – – – – – – – – –
Multicomponent 16 0.398 0.001 0.404 0.013 55.511 15 0.000 72.978 0.146 0 1.819 0.128
Intervention Content – Cognitive Domain Targeted
Working Memory 2 – – – – – – – – – – – –
Speed of Information Processing 2 – – – – – – – – – – – –
Language 0 – – – – – – – – – – – –
Visual-Spatial Ability 0 – – – – – – – – – – – –
Memory 7 1.219 0.007 1.099 0.049 51.777 6 0.000 88.412 1.219 0 3.397 0.510
Executive Functions 0 – – – – – – – – – – – –
Multidomain 13 0.230 0.000 0.232 0.003 12.713 12 0.390 5.612 0.003 2 1.144 0.100
456 Neuropsychol Rev (2017) 27:440–484
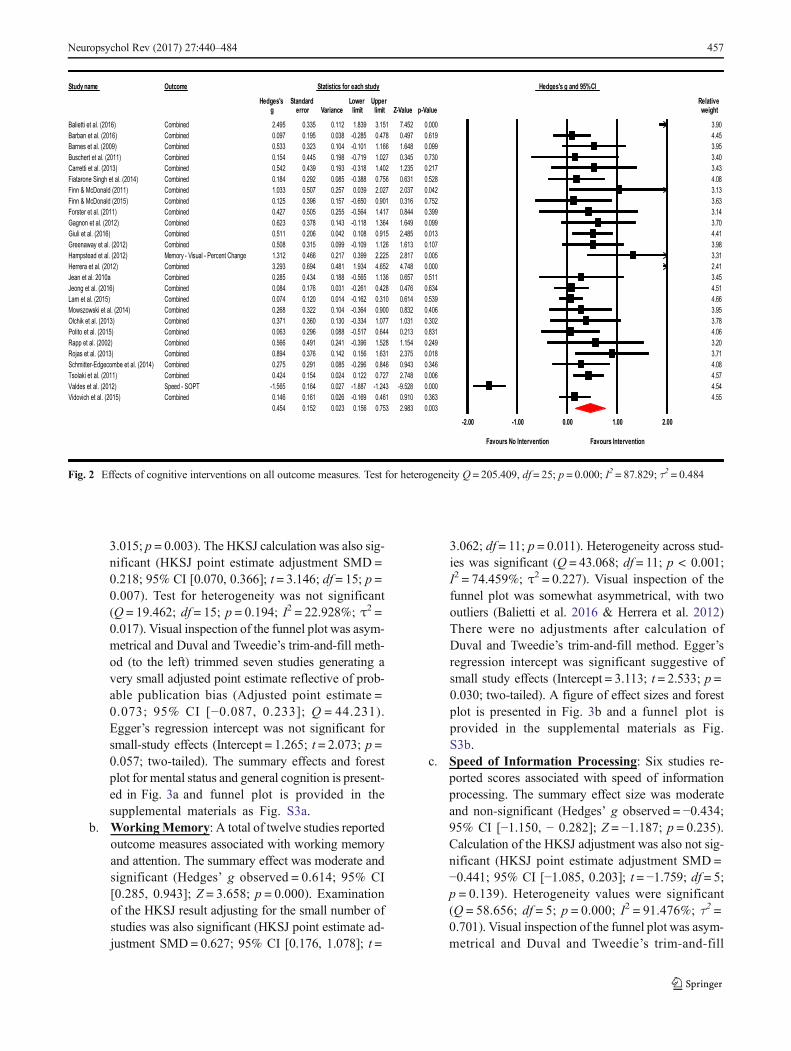
3.015; p = 0.003). The HKSJ calculation was also sig-nificant (HKSJ point estimate adjustment SMD =0.218; 95% CI [0.070, 0.366]; t = 3.146; df = 15; p =0.007). Test for heterogeneity was not significant(Q = 19.462; df = 15; p = 0.194; I2 = 22.928%; τ2 =0.017). Visual inspection of the funnel plot was asym-metrical and Duval and Tweedie’s trim-and-fill meth-od (to the left) trimmed seven studies generating avery small adjusted point estimate reflective of prob-able publication bias (Adjusted point estimate =0.073; 95% CI [−0.087, 0.233]; Q = 44.231).Egger’s regression intercept was not significant forsmall-study effects (Intercept = 1.265; t = 2.073; p =0.057; two-tailed). The summary effects and forestplot for mental status and general cognition is present-ed in Fig. 3a and funnel plot is provided in thesupplemental materials as Fig. S3a.
b. WorkingMemory: A total of twelve studies reportedoutcome measures associated with working memoryand attention. The summary effect was moderate andsignificant (Hedges’ g observed = 0.614; 95% CI[0.285, 0.943]; Z = 3.658; p = 0.000). Examinationof the HKSJ result adjusting for the small number ofstudies was also significant (HKSJ point estimate ad-justment SMD = 0.627; 95% CI [0.176, 1.078]; t =
3.062; df = 11; p = 0.011). Heterogeneity across stud-ies was significant (Q = 43.068; df = 11; p < 0.001;I2 = 74.459%; τ2 = 0.227). Visual inspection of thefunnel plot was somewhat asymmetrical, with twooutliers (Balietti et al. 2016 & Herrera et al. 2012)There were no adjustments after calculation ofDuval and Tweedie’s trim-and-fill method. Egger’sregression intercept was significant suggestive ofsmall study effects (Intercept = 3.113; t = 2.533; p =0.030; two-tailed). A figure of effect sizes and forestplot is presented in Fig. 3b and a funnel plot isprovided in the supplemental materials as Fig.S3b.
c. Speed of Information Processing: Six studies re-ported scores associated with speed of informationprocessing. The summary effect size was moderateand non-significant (Hedges’ g observed = −0.434;95% CI [−1.150, − 0.282]; Z = −1.187; p = 0.235).Calculation of the HKSJ adjustment was also not sig-nificant (HKSJ point estimate adjustment SMD =−0.441; 95% CI [−1.085, 0.203]; t = −1.759; df = 5;p = 0.139). Heterogeneity values were significant(Q = 58.656; df = 5; p = 0.000; I2 = 91.476%; τ2 =0.701). Visual inspection of the funnel plot was asym-metrical and Duval and Tweedie’s trim-and-fill
Study name Outcome Statistics for each study Hedges's g and 95% CI
Hedges's Standard Lower Upper Relative g error Variance limit limit Z-Value p-Value weight
000.0254.7151.3938.1211.0533.0594.2denibmoCBalietti et al. (2016) 3.90916.0794.0874.0582.0-830.0591.0790.0denibmoCBarban et al. (2016) 4.45990.0846.1661.1101.0-401.0323.0335.0denibmoCBarnes et al. (2009) 3.95037.0543.0720.1917.0-891.0544.0451.0denibmoCBuschert et al. (2011) 3.40712.0532.1204.1813.0-391.0934.0245.0denibmoCCarretti et al. (2013) 3.43
.0136.0657.0883.0-580.0292.0481.0denibmoCFiatarone Singh et al. (2014) 528 4.080.0730.2720.2930.0752.0705.0330.1denibmoCFinn & McDonald (2011) 42 3.13.0613.0109.0056.0-751.0693.0521.0denibmoCFinn & McDonald (2015) 752 3.63
993.0448.0714.1465.0-552.0505.0724.0denibmoCForster et al. (2011) 3.14990.0946.1463.1811.0-341.0873.0326.0denibmoCGagnon et al. (2012) 3.70310.0584.2519.0801.0240.0602.0115.0denibmoCGiuli et al. (2016) 4.41701.0316.1621.1901.0-990.0513.0805.0denibmoCGreenaway et al. (2012) 3.98
Hampstead et al. (2012) Memory - Visual - Percent Change 1.312 0.466 0.217 0.399 2.225 2.817 0.005 3.31000.0847.4256.4439.1184.0496.0392.3denibmoCHerrera et al. (2012) 2.41115.0756.0631.1565.0-881.0434.0582.0denibmoCJean et al. 2010a 3.45436.0674.0824.0162.0-130.0671.0480.0denibmoCJeong et al. (2016) 4.51935.0416.0013.0261.0-410.0021.0470.0denibmoCLam et al. (2015) 4.66604.0238.0009.0463.0-401.0223.0862.0denibmoCMowszowski et al. (2014) 3.95203.0130.1770.1433.0-031.0063.0173.0denibmoCOlchik et al. (2013) 3.78138.0312.0446.0715.0-880.0692.0360.0denibmoCPolito et al. (2015) 4.06942.0451.1825.1693.0-142.0194.0665.0denibmoCRapp et al. (2002) 3.20810.0573.2136.1651.0241.0673.0498.0denibmoCRojas et al. (2013) 3.71
9.0648.0692.0-580.0192.0572.0denibmoCSchmitter-Edgecombe et al. (2014) 43 0.346 4.08600.0847.2727.0221.0420.0451.0424.0denibmoCTsolaki et al. (2011) 4.57
00.0825.9-342.1-788.1-720.0461.0565.1-TPOS-deepSValdes et al. (2012) 0 4.54363.0019.0164.0961.0-620.0161.0641.0denibmoCVidovich et al. (2015) 4.55
0.454 0.152 0.023 0.156 0.753 2.983 0.003-2.00 -1.00 0.00 1.00 2.00
Favours No Intervention Favours Intervention
Fig. 2 Effects of cognitive interventions on all outcome measures. Test for heterogeneity Q = 205.409, df = 25; p = 0.000; I2 = 87.829; τ2 = 0.484
Neuropsychol Rev (2017) 27:440–484 457
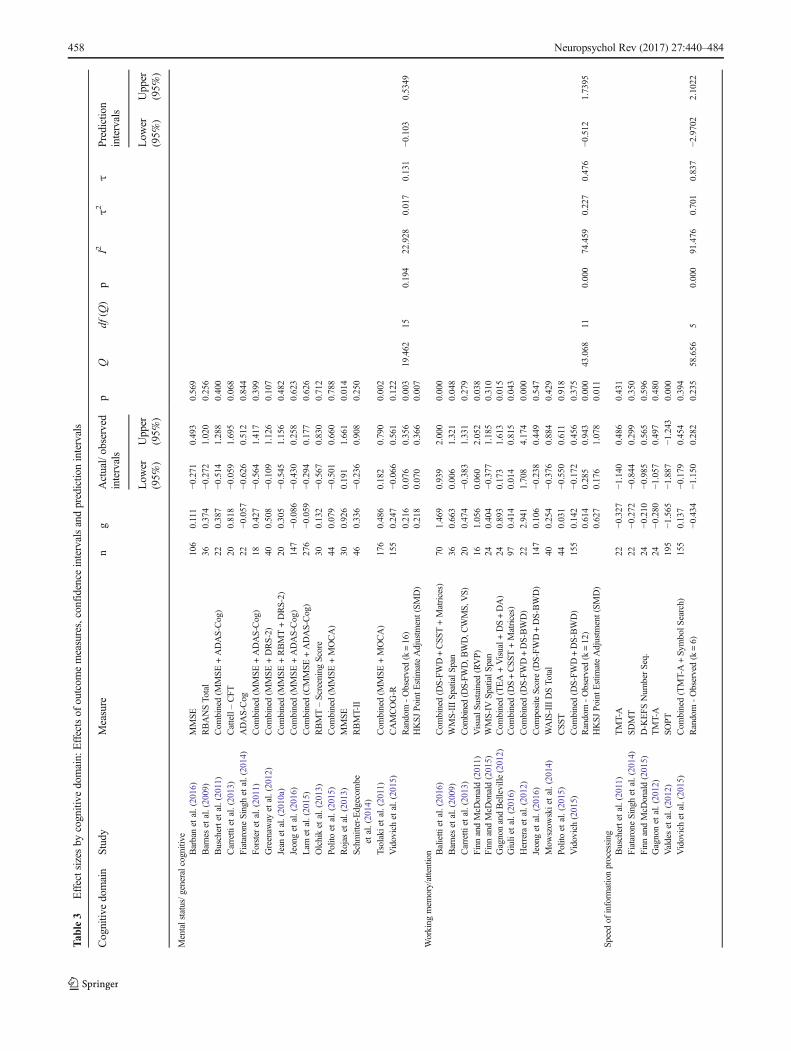
Tab
le3
Effectsizes
bycognitive
domain:
Effectsof
outcom
emeasures,confidence
intervalsandpredictio
nintervals
Cognitiv
edomain
Study
Measure
ng
Actual/observed
intervals
pQ
df(Q
)p
I2τ2
τPrediction
intervals
Low
er(95%
)Upper
(95%
)Low
er(95%
)Upper
(95%
)
Mentalstatus/generalcognitive
Barbanet
al.(2016)
MMSE
106
0.111
−0.271
0.493
0.569
Barneset
al.(2009)
RBANSTo
tal
360.374
−0.272
1.020
0.256
Buschertetal.(2011)
Com
bined(M
MSE
+ADAS-Cog)
220.387
−0.514
1.288
0.400
Carretti
etal.(2013)
Cattell–CFT
200.818
−0.059
1.695
0.068
FiataroneSinghet
al.(2014)
ADAS-Cog
22−0
.057
−0.626
0.512
0.844
Forsteret
al.(2011)
Com
bined(M
MSE
+ADAS-Cog)
180.427
−0.564
1.417
0.399
Greenaw
ayet
al.(2012)
Com
bined(M
MSE
+DRS-2)
400.508
−0.109
1.126
0.107
Jean
etal.(2010a)
Com
bined(M
MSE
+RBMT+DRS-2)
200.305
−0.545
1.156
0.482
Jeonget
al.(2016)
Com
bined(M
MSE
+ADAS-Cog)
147
−0.086
−0.430
0.258
0.623
Lam
etal.(2015)
Com
bined(CMMSE
+ADAS-Cog)
276
−0.059
−0.294
0.177
0.626
Olchiket
al.(2013)
RBMT–ScreeningScore
300.132
−0.567
0.830
0.712
Politoet
al.(2015)
Com
bined(M
MSE
+MOCA)
440.079
−0.501
0.660
0.788
Rojas
etal.(2013)
MMSE
300.926
0.191
1.661
0.014
Schm
itter-Edgecom
beet
al.(2014)
RBMT-II
460.336
−0.236
0.908
0.250
Tsolakietal.(2011)
Com
bined(M
MSE
+MOCA)
176
0.486
0.182
0.790
0.002
Vidovichet
al.(2015)
CAMCOG-R
155
0.247
−0.066
0.561
0.122
Random
-Observed(k=16)
0.216
0.076
0.356
0.003
19.462
150.194
22.928
0.017
0.131
−0.103
0.5349
HKSJ
Point
Estim
ateAdjustm
ent(SM
D)
0.218
0.070
0.366
0.007
Working
mem
ory/attention Balietti
etal.(2016)
Com
bined(D
S-FWD+CSS
T+Matrices)
701.469
0.939
2.000
0.000
Barneset
al.(2009)
WMS-IIISp
atialS
pan
360.663
0.006
1.321
0.048
Carretti
etal.(2013)
Com
bined(DS-FW
D,B
WD,C
WMS,VS)
200.474
−0.383
1.331
0.279
Finn
andMcD
onald(2011)
VisualS
ustained
(RVP)
161.056
0.060
2.052
0.038
Finn
andMcD
onald(2015)
WMS-IV
SpatialS
pan
240.404
−0.377
1.185
0.310
GagnonandBelleville
(2012)
Com
bined(TEA+Visual+
DS+DA)
240.893
0.173
1.613
0.015
Giuliet
al.(2016)
Com
bined(D
S+CSST
+Matrices)
970.414
0.014
0.815
0.043
Herreraet
al.(2012)
Com
bined(D
S-FWD+DS-BWD)
222.941
1.708
4.174
0.000
Jeonget
al.(2016)
Com
positeScore(D
S-FWD+DS-BWD)
147
0.106
−0.238
0.449
0.547
Mow
szow
skietal.(2014)
WAIS-IIIDSTo
tal
400.254
−0.376
0.884
0.429
Politoet
al.(2015)
CSS
T44
0.031
−0.550
0.611
0.918
Vidovich(2015)
Com
bined(D
S-FWD+DS-BWD)
155
0.142
−0.172
0.456
0.375
Random
-Observed(k=12)
0.614
0.285
0.943
0.000
43.068
110.000
74.459
0.227
0.476
−0.512
1.7395
HKSJ
Point
Estim
ateAdjustm
ent(SM
D)
0.627
0.176
1.078
0.011
Speedof
inform
ationprocessing
Buschertetal.(2011)
TMT-A
22−0
.327
−1.140
0.486
0.431
FiataroneSinghet
al.(2014)
SDMT
22−0
.272
−0.844
0.299
0.350
Finn
andMcD
onald(2015)
D-K
EFS
Num
berSeq.
24−0
.210
−0.985
0.565
0.596
Gagnonet
al.(2012)
TMT-A
24−0
.280
−1.057
0.497
0.480
Valdeset
al.(2012)
SOPT
195
−1.565
−1.887
−1.243
0.000
Vidovichet
al.(2015)
Com
bined(TMT-A+Sy
mbolS
earch)
155
0.137
−0.179
0.454
0.394
Random
-Observed(k=6)
−0.434
−1.150
0.282
0.235
58.656
50.000
91.476
0.701
0.837
−2.9702
2.1022
458 Neuropsychol Rev (2017) 27:440–484
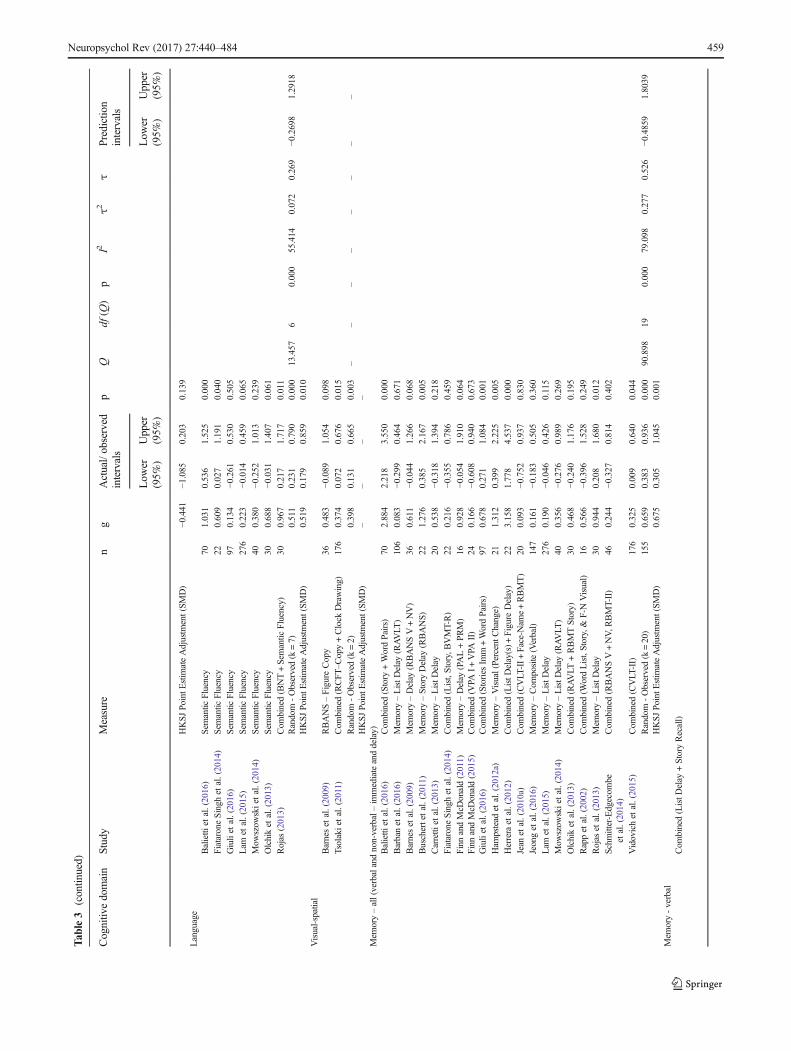
Tab
le3
(contin
ued)
Cognitiv
edomain
Study
Measure
ng
Actual/observed
intervals
pQ
df(Q
)p
I2τ2
τPrediction
intervals
Low
er(95%
)Upper
(95%
)Low
er(95%
)Upper
(95%
)
HKSJ
PointE
stim
ateAdjustm
ent(SM
D)
−0.441
−1.085
0.203
0.139
Language
Balietti
etal.(2016)
Sem
antic
Fluency
701.031
0.536
1.525
0.000
FiataroneSingh
etal.(2014)
Sem
antic
Fluency
220.609
0.027
1.191
0.040
Giuliet
al.(2016)
Sem
antic
Fluency
970.134
−0.261
0.530
0.505
Lam
etal.(2015)
Sem
antic
Fluency
276
0.223
−0.014
0.459
0.065
Mow
szow
skietal.(2014)
Sem
antic
Fluency
400.380
−0.252
1.013
0.239
Olchiket
al.(2013)
Sem
antic
Fluency
300.688
−0.031
1.407
0.061
Rojas
(2013)
Com
bined(BNT+Semantic
Fluency)
300.967
0.217
1.717
0.011
Random
-Observed(k=7)
0.511
0.231
0.790
0.000
13.457
60.000
55.414
0.072
0.269
−0.2698
1.2918
HKSJ
PointE
stim
ateAdjustm
ent(SM
D)
0.519
0.179
0.859
0.010
Visual-spatial
Barneset
al.(2009)
RBANS–FigureCopy
360.483
−0.089
1.054
0.098
Tsolakietal.(2011)
Com
bined(RCFT
–Copy+Clock
Drawing)
176
0.374
0.072
0.676
0.015
Random
-Observed(k=2)
0.398
0.131
0.665
0.003
––
––
––
––
HKSJ
PointE
stim
ateAdjustm
ent(SM
D)
––
––
Mem
ory–all(verbalandnon-verbal–im
mediateanddelay)
Balietti
etal.(2016)
Com
bined(Story
+WordPairs)
702.884
2.218
3.550
0.000
Barbanet
al.(2016)
Mem
ory–ListD
elay
(RAVLT
)106
0.083
−0.299
0.464
0.671
Barneset
al.(2009)
Mem
ory–Delay
(RBANSV+NV)
360.611
−0.044
1.266
0.068
Buschertetal.(2011)
Mem
ory–StoryDelay
(RBANS)
221.276
0.385
2.167
0.005
Carretti
etal.(2013)
Mem
ory–ListD
elay
200.538
−0.318
1.394
0.218
FiataroneSingh
etal.(2014)
Com
bined(List,Story,B
VMT-R)
220.216
−0.355
0.786
0.459
Finn
andMcD
onald(2011)
Mem
ory–Delay
(PAL+PRM)
160.928
−0.054
1.910
0.064
Finn
andMcD
onald(2015)
Com
bined(V
PAI+
VPA
II)
240.166
−0.608
0.940
0.673
Giuliet
al.(2016)
Com
bined(Stories
Imm+WordPairs)
970.678
0.271
1.084
0.001
Ham
pstead
etal.(2012a)
Mem
ory–Visual(PercentC
hange)
211.312
0.399
2.225
0.005
Herreraet
al.(2012)
Com
bined(ListD
elay(s)+
Figure
Delay)
223.158
1.778
4.537
0.000
Jean
etal.(2010a)
Com
bined(CVLT
-II+
Face-N
ame+RBMT)
200.093
−0.752
0.937
0.830
Jeonget
al.(2016)
Mem
ory–Com
posite(Verbal)
147
0.161
−0.183
0.505
0.360
Lam
etal.(2015)
Mem
ory–ListD
elay
276
0.190
−0.046
0.426
0.115
Mow
szow
skietal.(2014)
Mem
ory–ListD
elay
(RAVLT
)40
0.356
−0.276
0.989
0.269
Olchiket
al.(2013)
Com
bined(RAVLT
+RBMTStory)
300.468
−0.240
1.176
0.195
Rappet
al.(2002)
Com
bined(W
ordList,Story,&
F-NVisual)
160.566
−0.396
1.528
0.249
Rojas
etal.(2013)
Mem
ory–ListD
elay
300.944
0.208
1.680
0.012
Schm
itter-Edgecom
beet
al.(2014)
Com
bined(RBANSV+NV,R
BMT-II)
460.244
−0.327
0.814
0.402
Vidovichet
al.(2015)
Com
bined(CVLT
-II)
176
0.325
0.009
0.640
0.044
Random
-Observed(k=20)
155
0.659
0.383
0.936
0.000
90.898
190.000
79.098
0.277
0.526
−0.4859
1.8039
HKSJ
PointE
stim
ateAdjustm
ent(SM
D)
0.675
0.305
1.045
0.001
Mem
ory-verbal
Com
bined(ListD
elay
+StoryRecall)
Neuropsychol Rev (2017) 27:440–484 459
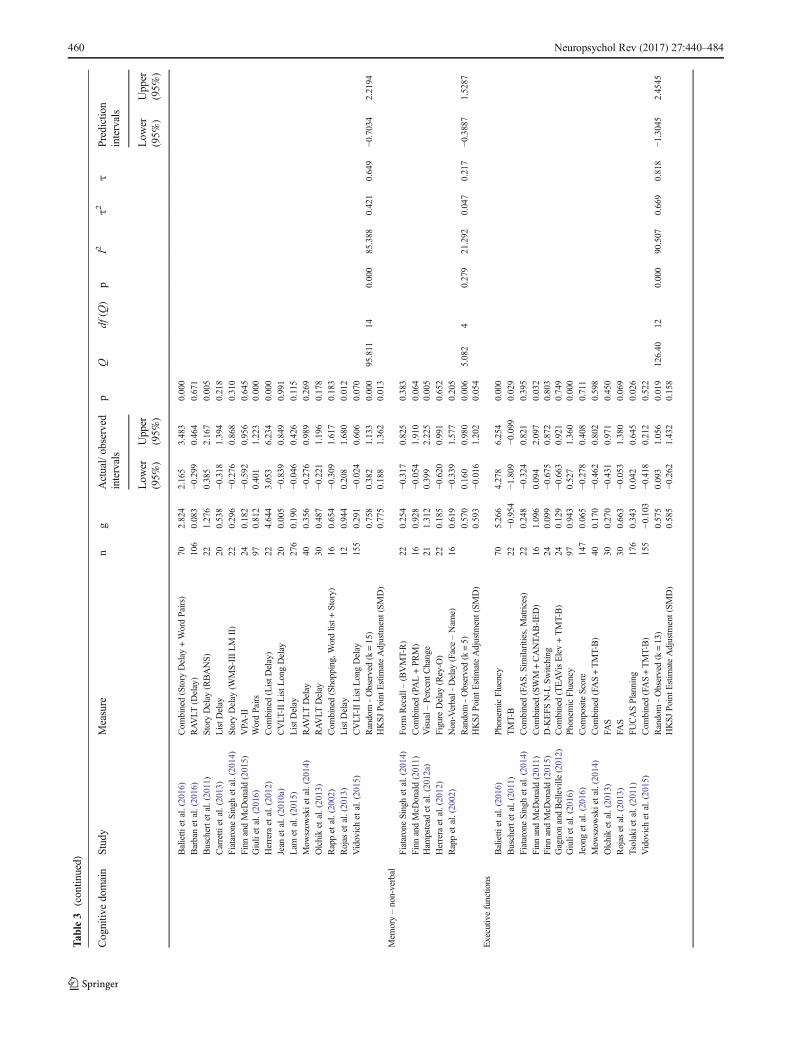
Tab
le3
(contin
ued)
Cognitiv
edomain
Study
Measure
ng
Actual/observed
intervals
pQ
df(Q
)p
I2τ2
τPrediction
intervals
Low
er(95%
)Upper
(95%
)Low
er(95%
)Upper
(95%
)
Balietti
etal.(2016)
Com
bined(Story
Delay
+WordPairs)
702.824
2.165
3.483
0.000
Barbanet
al.(2016)
RAVLT
(Delay)
106
0.083
−0.299
0.464
0.671
Buschertetal.(2011)
StoryDelay
(RBANS)
221.276
0.385
2.167
0.005
Carretti
etal.(2013)
ListD
elay
200.538
−0.318
1.394
0.218
FiataroneSinghet
al.(2014)
StoryDelay
(WMS-IIILM
II)
220.296
−0.276
0.868
0.310
Finn
andMcD
onald(2015)
VPA
-II
240.182
−0.592
0.956
0.645
Giuliet
al.(2016)
WordPairs
970.812
0.401
1.223
0.000
Herreraet
al.(2012)
Com
bined(ListD
elay)
224.644
3.053
6.234
0.000
Jean
etal.(2010a)
CVLT
-IIListL
ongDelay
200.005
−0.839
0.849
0.991
Lam
etal.(2015)
ListD
elay
276
0.190
−0.046
0.426
0.115
Mow
szow
skietal.(2014)
RAVLT
Delay
400.356
−0.276
0.989
0.269
Olchiket
al.(2013)
RAVLT
Delay
300.487
−0.221
1.196
0.178
Rappet
al.(2002)
Com
bined(Shopping,Wordlist+
Story)
160.654
−0.309
1.617
0.183
Rojas
etal.(2013)
ListD
elay
120.944
0.208
1.680
0.012
Vidovichet
al.(2015)
CVLT
-IIListL
ongDelay
155
0.291
−0.024
0.606
0.070
Random
-Observed(k=15)
0.758
0.382
1.133
0.000
95.811
140.000
85.388
0.421
0.649
−0.7034
2.2194
HKSJ
Point
Estim
ateAdjustm
ent(SM
D)
0.775
0.188
1.362
0.013
Mem
ory–non-verbal
FiataroneSinghet
al.(2014)
Form
Recall–
(BVMT-R)
220.254
−0.317
0.825
0.383
Finn
andMcD
onald(2011)
Com
bined(PAL+PR
M)
160.928
−0.054
1.910
0.064
Ham
pstead
etal.(2012a)
Visual–
PercentC
hange
211.312
0.399
2.225
0.005
Herreraet
al.(2012)
Figure
Delay
(Rey-O
)22
0.185
−0.620
0.991
0.652
Rappet
al.(2002)
Non-Verbal-
Delay
(Face–Nam
e)16
0.619
−0.339
1.577
0.205
Random
-Observed(k=5)
0.570
0.160
0.980
0.006
5.082
40.279
21.292
0.047
0.217
−0.3887
1.5287
HKSJ
Point
Estim
ateAdjustm
ent(SM
D)
0.593
−0.016
1.202
0.054
Executiv
efunctions
Balietti
etal.(2016)
Phonem
icFluency
705.266
4.278
6.254
0.000
Buschertetal.(2011)
TMT-B
22−0
.954
−1.809
−0.099
0.029
FiataroneSinghet
al.(2014)
Com
bined(FAS,
Similarities,Matrices)
220.248
−0.324
0.821
0.395
Finn
andMcD
onald(2011)
Com
bined(SWM
+CANTA
B-IED)
161.096
0.094
2.097
0.032
Finn
andMcD
onald(2015)
D-K
EFS
N-L
Switching
240.099
−0.675
0.872
0.803
GagnonandBelleville
(2012)
Com
bined(TEAVisElev+TMT-B)
240.129
−0.663
0.921
0.749
Giuliet
al.(2016)
Phonem
icFluency
970.943
0.527
1.360
0.000
Jeonget
al.(2016)
Com
positeScore
147
0.065
−0.278
0.408
0.711
Mow
szow
skietal.(2014)
Com
bined(FAS+TMT-B)
400.170
−0.462
0.802
0.598
Olchiket
al.(2013)
FAS
300.270
−0.431
0.971
0.450
Rojas
etal.(2013)
FAS
300.663
−0.053
1.380
0.069
Tsolakietal.(2011)
FUCASPlanning
176
0.343
0.042
0.645
0.026
Vidovichet
al.(2015)
Com
bined(FAS+TMT-B)
155
−0.103
−0.418
0.212
0.522
Random
-Observed(k=13)
0.575
0.093
1.056
0.019
126.40
120.000
90.507
0.669
0.818
−1.3045
2.4545
HKSJ
Point
Estim
ateAdjustm
ent(SM
D)
0.585
−0.262
1.432
0.158
460 Neuropsychol Rev (2017) 27:440–484
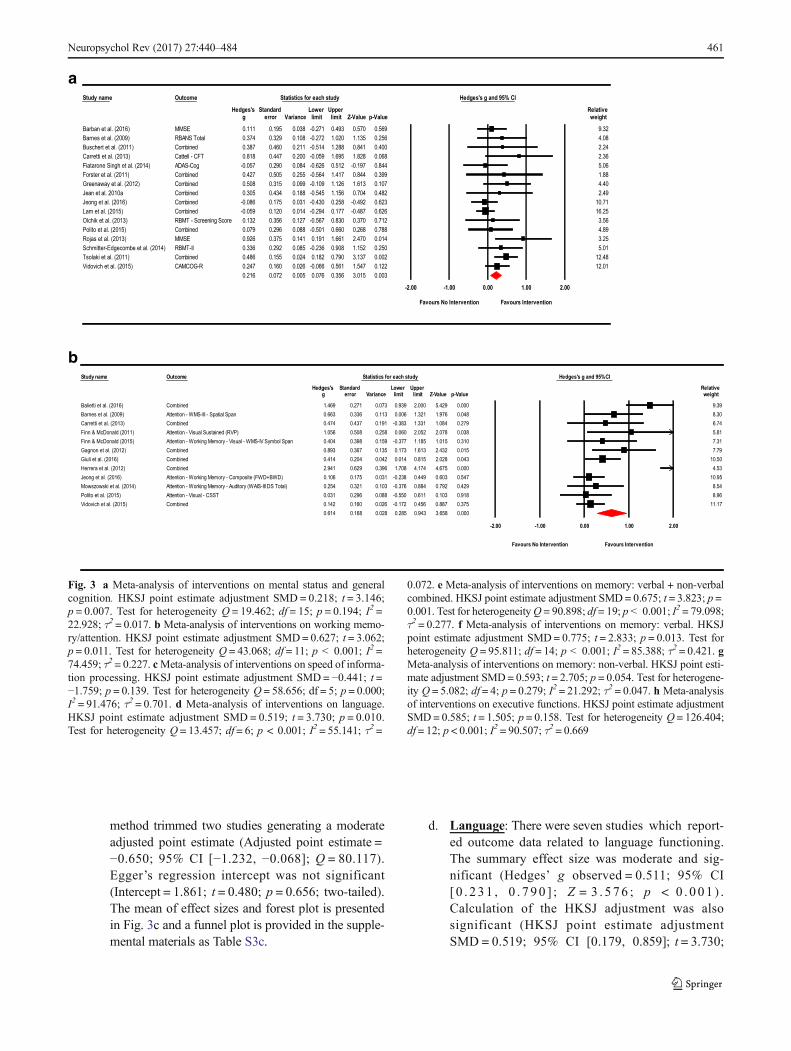
method trimmed two studies generating a moderateadjusted point estimate (Adjusted point estimate =−0.650; 95% CI [−1.232, −0.068]; Q = 80.117).Egger’s regression intercept was not significant(Intercept = 1.861; t = 0.480; p = 0.656; two-tailed).The mean of effect sizes and forest plot is presentedin Fig. 3c and a funnel plot is provided in the supple-mental materials as Table S3c.
d. Language: There were seven studies which report-ed outcome data related to language functioning.The summary effect size was moderate and sig-nificant (Hedges’ g observed = 0.511; 95% CI[0 . 231 , 0 . 790 ] ; Z = 3 . 576 ; p < 0 .001 ) .Calculation of the HKSJ adjustment was alsosignificant (HKSJ point estimate adjustmentSMD = 0.519; 95% CI [0.179, 0.859]; t = 3.730;
Study name Outcome Statistics for each study Hedges's g and 95% CI
Hedges's Standard Lower Upper Relativeg error Variance limit limit Z-Value p-Value weight
000.0924.5000.2939.0370.0172.0964.1 9.390311.0633.0366.0 .006 1.321 1.976 0.048 8.30
972.0480.1133.1383.0-191.0734.0474.0 6.74.0650.1 508 0.258 0.060 2.052 2.078 0.038 5.81
0.404 0.398 0.159 -0.377 1.185 1.015 0.310 7.31510.0234.2316.1371.0531.0763.0398.0 7.79
02.0414.0 4 0.042 0.014 0.815 2.028 0.043 10.5026.0149.2 9 0.396 1.708 4.174 4.675 0.000 4.53
.106 0.175 0.031 -0.238 0.449 0.603 0.547 10.950.254 0.321 0.103 -0.376 0.884 0.792 0.429 8.54
16.0055.0-880.0692.0130.0 1 0.103 0.918 8.96573.0788.0654.0271.0-620.0061.0241.0 11.17
0.614 0.168 0.028 0.285 0.943 3.658 0.000
-2.00 -1.00 0.00 1.00 2.00
Favours No Intervention Favours Intervention
a
b
Study name Outcome Statistics for each study Hedges's g and 95% CI
Hedges's Standard Lower Upper Relativeg error Variance limit limit Z-Value p-Value weight
0.111 0.195 0.038 -0.271 0.493 0.570 0.569 9.32.374 0.329 0.108 -0.272 1.020 1.135 0.256 4.08
0.387 0.460 0.211 -0.514 1.288 0.841 0.400 2.24.818 0.447 0.200 -0.059 1.695 1.828 0.068 2.36
-0.057 0.290 0.084 -0.626 0.512 -0.197 0.844 5.060.427 0.505 0.255 -0.564 1.417 0.844 0.399 1.880.508 0.315 0.099 -0.109 1.126 1.613 0.107 4.400.305 0.434 0.188 -0.545 1.156 0.704 0.482 2.49
-0.086 0.175 0.031 -0.430 0.258 -0.492 0.623 10.71-0.059 0.120 0.014 -0.294 0.177 -0.487 0.626 16.25
e 0.132 0.356 0.127 -0.567 0.830 0.370 0.712 3.560.079 0.296 0.088 -0.501 0.660 0.268 0.788 4.89.926 0.375 0.141 0.191 1.661 2.470 0.014 3.25.336 0.292 0.085 -0.236 0.908 1.152 0.250 5.01
0.486 0.155 0.024 0.182 0.790 3.137 0.002 12.48.247 0.160 0.026 -0.066 0.561 1.547 0.122 12.01
0.216 0.072 0.005 0.076 0.356 3.015 0.003
-2.00 -1.00 0.00 1.00 2.00
Favours No Intervention Favours Intervention
denibmoCBalietti et al. (2016)napSlaitapS-III-SMW-noitnettABarnes et al. (2009)
denibmoCCarretti et al. (2013))PVR(deniatsuSlausiV-noitnettAFinn & McDonald (2011)
Finn & McDonald (2015) Attention - Working Memory - Visual - WMS-IV Symbol SpandenibmoCGagnon et al. (2012)denibmoCGiuli et al. (2016)denibmoCHerrera et al. (2012)
Jeong et al. (2016) Attention - Working Memory - Composite (FWD+BWD) 0Mowszowski et al. (2014) Attention - Working Memory - Auditory (WAIS-III DS Total)
TSSC-lausiV-noitnettAPolito et al. (2015)denibmoCVidovich et al. (2015)
Barban et al. (2016) MMSEBarnes et al. (2009) RBANS Total 0Buschert et al. (2011) CombinedCarretti et al. (2013) Cattell - CFT 0Fiatarone Singh et al. (2014) ADAS-CogForster et al. (2011) CombinedGreenaway et al. (2012) CombinedJean et al. 2010a CombinedJeong et al. (2016) CombinedLam et al. (2015) CombinedOlchik et al. (2013) RBMT - Screening ScorPolito et al. (2015) CombinedRojas et al. (2013) MMSE 0Schmitter-Edgecombe et al. (2014) RBMT-II 0Tsolaki et al. (2011) CombinedVidovich et al. (2015) CAMCOG-R 0
Fig. 3 a Meta-analysis of interventions on mental status and generalcognition. HKSJ point estimate adjustment SMD = 0.218; t = 3.146;p = 0.007. Test for heterogeneity Q = 19.462; df = 15; p = 0.194; I2 =22.928; τ2 = 0.017. b Meta-analysis of interventions on working memo-ry/attention. HKSJ point estimate adjustment SMD= 0.627; t = 3.062;p = 0.011. Test for heterogeneity Q = 43.068; df = 11; p < 0.001; I2 =74.459; τ2 = 0.227. cMeta-analysis of interventions on speed of informa-tion processing. HKSJ point estimate adjustment SMD = −0.441; t =−1.759; p = 0.139. Test for heterogeneity Q = 58.656; df = 5; p = 0.000;I2 = 91.476; τ2 = 0.701. d Meta-analysis of interventions on language.HKSJ point estimate adjustment SMD = 0.519; t = 3.730; p = 0.010.Test for heterogeneity Q = 13.457; df = 6; p < 0.001; I2 = 55.141; τ2 =
0.072. e Meta-analysis of interventions on memory: verbal + non-verbalcombined. HKSJ point estimate adjustment SMD= 0.675; t = 3.823; p =0.001. Test for heterogeneityQ = 90.898; df = 19; p < 0.001; I2 = 79.098;τ2 = 0.277. f Meta-analysis of interventions on memory: verbal. HKSJpoint estimate adjustment SMD= 0.775; t = 2.833; p = 0.013. Test forheterogeneity Q = 95.811; df = 14; p < 0.001; I2 = 85.388; τ2 = 0.421. gMeta-analysis of interventions on memory: non-verbal. HKSJ point esti-mate adjustment SMD= 0.593; t = 2.705; p = 0.054. Test for heterogene-ity Q = 5.082; df = 4; p = 0.279; I2 = 21.292; τ2 = 0.047. h Meta-analysisof interventions on executive functions. HKSJ point estimate adjustmentSMD= 0.585; t = 1.505; p = 0.158. Test for heterogeneity Q = 126.404;df = 12; p < 0.001; I2 = 90.507; τ2 = 0.669
Neuropsychol Rev (2017) 27:440–484 461
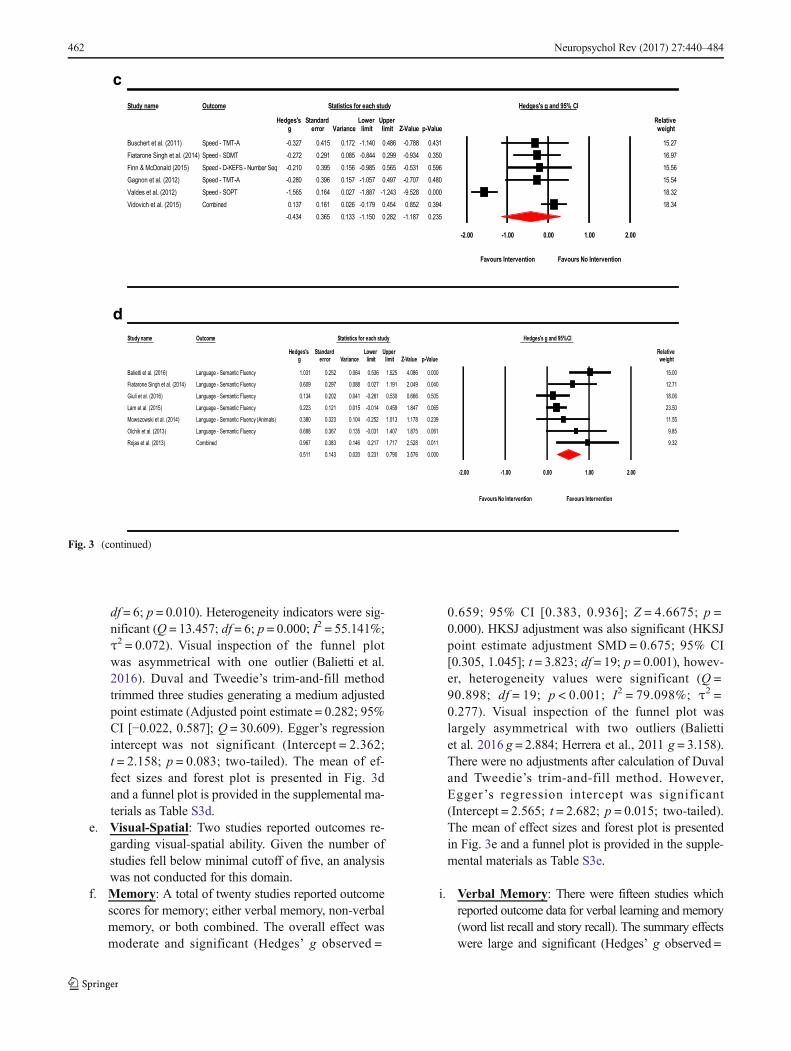
df = 6; p = 0.010). Heterogeneity indicators were sig-nificant (Q = 13.457; df = 6; p = 0.000; I2 = 55.141%;τ2 = 0.072). Visual inspection of the funnel plotwas asymmetrical with one outlier (Balietti et al.2016). Duval and Tweedie’s trim-and-fill methodtrimmed three studies generating a medium adjustedpoint estimate (Adjusted point estimate = 0.282; 95%CI [−0.022, 0.587]; Q = 30.609). Egger’s regressionintercept was not significant (Intercept = 2.362;t = 2.158; p = 0.083; two-tailed). The mean of ef-fect sizes and forest plot is presented in Fig. 3dand a funnel plot is provided in the supplemental ma-terials as Table S3d.
e. Visual-Spatial: Two studies reported outcomes re-garding visual-spatial ability. Given the number ofstudies fell below minimal cutoff of five, an analysiswas not conducted for this domain.
f. Memory: A total of twenty studies reported outcomescores for memory; either verbal memory, non-verbalmemory, or both combined. The overall effect wasmoderate and significant (Hedges’ g observed =
0.659; 95% CI [0.383, 0.936]; Z = 4.6675; p =0.000). HKSJ adjustment was also significant (HKSJpoint estimate adjustment SMD = 0.675; 95% CI[0.305, 1.045]; t = 3.823; df = 19; p = 0.001), howev-er, heterogeneity values were significant (Q =90.898; df = 19; p < 0.001; I2 = 79.098%; τ2 =0.277). Visual inspection of the funnel plot waslargely asymmetrical with two outliers (Baliettiet al. 2016 g = 2.884; Herrera et al., 2011 g = 3.158).There were no adjustments after calculation of Duvaland Tweedie’s trim-and-fill method. However,Egger ’s regression intercept was significant(Intercept = 2.565; t = 2.682; p = 0.015; two-tailed).The mean of effect sizes and forest plot is presentedin Fig. 3e and a funnel plot is provided in the supple-mental materials as Table S3e.
i. Verbal Memory: There were fifteen studies whichreported outcome data for verbal learning and memory(word list recall and story recall). The summary effectswere large and significant (Hedges’ g observed =
Study name Outcome Statistics for each study Hedges's g and 95% CI
Hedges's Standard Lower Upper Relativeg error Variance limit limit Z-Value p-Value weight
0.327 0.415 0.172 -1.140 0.486 -0.788 0.431 15.27-0.272 0.291 0.085 -0.844 0.299 -0.934 0.350 16.970.210 0.395 0.156 -0.985 0.565 -0.531 0.596 15.560.280 0.396 0.157 -1.057 0.497 -0.707 0.480 15.54
-1.565 0.164 0.027 -1.887 -1.243 -9.528 0.000 18.32493.0258.0454.0971.0-620.0161.0731.0 18.34
-0.434 0.365 0.133 -1.150 0.282 -1.187 0.235
-2.00 -1.00 0.00 1.00 2.00
Favours Intervention Favours No Intervention
Study name Outcome Statistics for each study Hedges's g and 95% CI
Hedges's Standard Lower Upper Relativeg error Variance limit limit Z-Value p-Value weight
1.031 0.252 0.064 0.536 1.525 4.086 0.000 15.00
0.609 0.297 0.088 0.027 1.191 2.049 0.040 12.71
.134 0.202 0.041 -0.261 0.530 0.666 0.505 18.06
0.223 0.121 0.015 -0.014 0.459 1.847 0.065 23.50
.380 0.323 0.104 -0.252 1.013 1.178 0.239 11.55
0.688 0.367 0.135 -0.031 1.407 1.875 0.061 9.85
110.0825.2717.1712.0641.0383.0769.0
Buschert et al. (2011) Speed - TMT-A -Fiatarone Singh et al. (2014) Speed - SDMTFinn & McDonald (2015) Speed - D-KEFS - Number Seq -Gagnon et al. (2012) Speed - TMT-A -Valdes et al. (2012) Speed - SOPT
denibmoCVidovich et al. (2015)
Balietti et al. (2016) Language - Semantic Fluency
Fiatarone Singh et al. (2014) Language - Semantic Fluency
Giuli et al. (2016) Language - Semantic Fluency 0
Lam et al. (2015) Language - Semantic Fluency
Mowszowski et al. (2014) Language - Semantic Fluency (Animals) 0
Olchik et al. (2013) Language - Semantic Fluency
denibmoCRojas et al. (2013) 9.32
0.511 0.143 0.020 0.231 0.790 3.576 0.000
-2.00 -1.00 0.00 1.00 2.00
Favours No Intervention Favours Intervention
c
d
Fig. 3 (continued)
462 Neuropsychol Rev (2017) 27:440–484
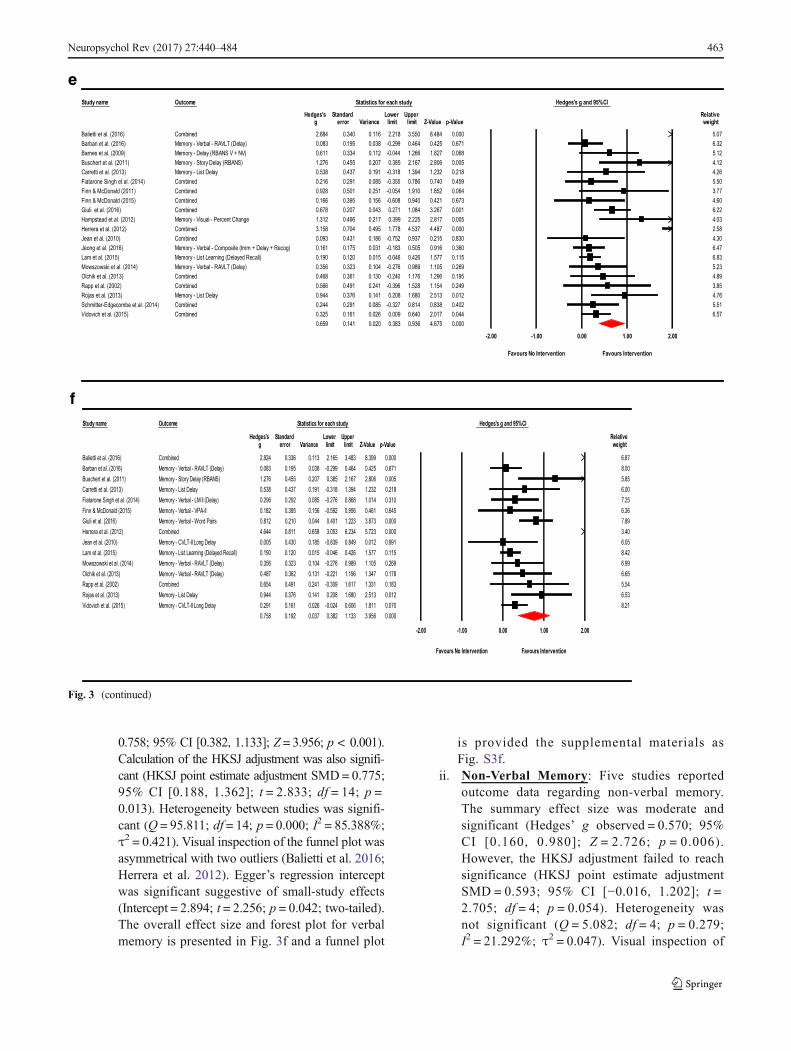
0.758; 95% CI [0.382, 1.133]; Z= 3.956; p < 0.001).Calculation of the HKSJ adjustment was also signifi-cant (HKSJ point estimate adjustment SMD= 0.775;95% CI [0.188, 1.362]; t = 2.833; df = 14; p =0.013). Heterogeneity between studies was signifi-cant (Q = 95.811; df = 14; p = 0.000; I2 = 85.388%;τ2 = 0.421). Visual inspection of the funnel plot wasasymmetrical with two outliers (Balietti et al. 2016;Herrera et al. 2012). Egger’s regression interceptwas significant suggestive of small-study effects(Intercept = 2.894; t = 2.256; p = 0.042; two-tailed).The overall effect size and forest plot for verbalmemory is presented in Fig. 3f and a funnel plot
is provided the supplemental materials asFig. S3f.
ii. Non-Verbal Memory: Five studies reportedoutcome data regarding non-verbal memory.The summary effect size was moderate andsignificant (Hedges’ g observed = 0.570; 95%CI [0.160, 0.980]; Z = 2.726; p = 0.006).However, the HKSJ adjustment failed to reachsignificance (HKSJ point estimate adjustmentSMD = 0.593; 95% CI [−0.016, 1.202]; t =2.705; df = 4; p = 0.054). Heterogeneity wasnot significant (Q = 5.082; df = 4; p = 0.279;I2 = 21.292%; τ2 = 0.047). Visual inspection of
e
f
Study name Outcome Statistics for each study Hedges's g and 95% CI
Hedges's Standard Lower Upper Relative g error Variance limit limit Z-Value p-Value weight
000.0484.8055.3812.2611.0043.0488.2denibmoC 5.07
2.0-830.0591.0380.0)yaleD(TLVAR-labreV-yromeM 99 0.464 0.425 0.671 6.32
440.0-211.0433.0116.0)VN+VSNABR(yaleD-yromeM 1.266 1.827 0.068 5.12
583.0702.0554.0672.1)SNABR(yaleDyrotS-yromeM 2.167 2.806 0.005 4.12
2.1493.1813.0-191.0734.0835.0yaleDtsiL-yromeM 32 0.218 4.26
.0047.0687.0553.0-580.0192.0612.0denibmoC 459 5.50
.0258.1019.1450.0-152.0105.0829.0denibmoC 064 3.77
.0124.0049.0806.0-651.0593.0661.0denibmoC 673 4.60
100.0762.3480.1172.0340.0702.0876.0denibmoC 6.22
712.0664.0213.1egnahCtnecreP-lausiV-yromeM 0.399 2.225 2.817 0.005 4.03
000.0784.4735.4877.1594.0407.0851.3denibmoC 2.58
038.0512.0739.0257.0-681.0134.0390.0denibmoC 4.30
161 0.175 0.031 -0.183 0.505 0.916 0.360 6.47
10.0021.0091.0)llaceRdeyaleD(gninraeLtsiL-yromeM 5 -0.046 0.426 1.577 0.115 6.83
401.0323.0653.0)yaleD(TLVAR-labreV-yromeM -0.276 0.989 1.105 0.269 5.23
591.0692.1671.1042.0-031.0163.0864.0denibmoC 4.89
942.0451.1825.1693.0-142.0194.0665.0denibmoC 3.85
.0315.2086.1802.0141.0673.0449.0yaleDtsiL-yromeM 012 4.76
8.0418.0723.0-580.0192.0442.0denibmoC 38 0.402 5.51
440.0710.2046.0900.0620.0161.0523.0denibmoC 6.57
0.659 0.141 0.020 0.383 0.936 4.675 0.000
-2.00 -1.00 0.00 1.00 2.00
Favours No Intervention Favours Intervention
Study name Outcome Statistics for each study Hedges's g and 95% CI
Hedges's Standard Lower Upper Relative g error Variance limit limit Z-Value p-Value weight
000.0993.8384.3561.2311.0633.0428.2denibmoC 6.87
99 0.464 0.425 0.671 8.00
2.167 2.806 0.005 5.85
2.1493.1813.0-191.0734.0835.0yaleDtsiL-yromeM 32 0.218 6.00
0.085 -0.276 0.868 1.014 0.310 7.25
0-651.0593.0281.0II-APV-labreV-yromeM .592 0.956 0.461 0.645 6.36
23 3.873 0.000 7.89
000.0327.5432.6350.3856.0118.0446.4denibmoC 3.40
9 0.012 0.991 6.05
5 -0.046 0.426 1.577 0.115 8.42
-0.276 0.989 1.105 0.269 6.99
21 1.196 1.347 0.178 6.65
381.0133.1716.1903.0-142.0194.0456.0denibmoC 5.54
.0315.2086.1802.0141.0673.0449.0yaleDtsiL-yromeM 012 6.53
0.606 1.811 0.070 8.21
0.758 0.192 0.037 0.382 1.133 3.956 0.000
-2.00 -1.00 0.00 1.00 2.00
Favours No Intervention Favours Intervention
Balietti et al. (2016)
Barban et al. (2016)
Barnes et al. (2009)
Buschert et al. (2011)
Carretti et al. (2013)
Fiatarone Singh et al. (2014)
Finn & McDonald (2011)
Finn & McDonald (2015)
Giuli et al. (2016)
Hampstead et al. (2012)
Herrera et al. (2012)
Jean et al. (2010)
Jeong et al. (2016) Memory - Verbal - Composite (Imm + Delay + Recog) 0.
Lam et al. (2015)
Mowszowski et al. (2014)
Olchik et al. (2013)
Rapp et al. (2002)
Rojas et al. (2013)
Schmitter-Edgecombe et al. (2014)
Vidovich et al. (2015)
Balietti et al. (2016)
Barban et al. (2016) Memory - Verbal - RAVLT (Delay) 0.083 0.195 0.038 -0.2
Buschert et al. (2011) Memory - Story Delay (RBANS) 1.276 0.455 0.207 0.385
Carretti et al. (2013)
Fiatarone Singh et al. (2014) Memory - Verbal - LM II (Delay) 0.296 0.292
Finn & McDonald (2015)
Giuli et al. (2016) Memory - Verbal - Word Pairs 0.812 0.210 0.044 0.401 1.2
Herrera et al. (2012)
Jean et al. (2010) Memory - CVLT-II Long Delay 0.005 0.430 0.185 -0.839 0.84
Lam et al. (2015) Memory - List Learning (Delayed Recall) 0.190 0.120 0.01
Mowszowski et al. (2014) Memory - Verbal - RAVLT (Delay) 0.356 0.323 0.104
Olchik et al. (2013) Memory - Verbal - RAVLT (Delay) 0.487 0.362 0.131 -0.2
Rapp et al. (2002)
Rojas et al. (2013)
Vidovich et al. (2015) Memory - CVLT-II Long Delay 0.291 0.161 0.026 -0.024
Fig. 3 (continued)
Neuropsychol Rev (2017) 27:440–484 463
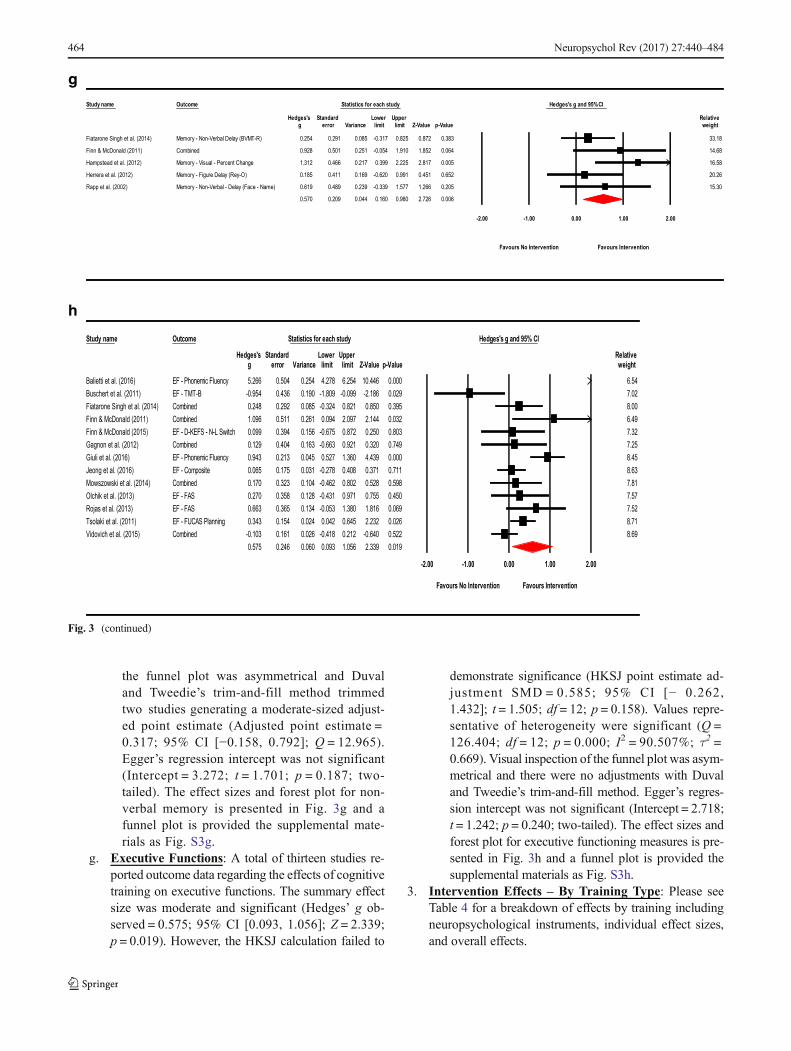
the funnel plot was asymmetrical and Duvaland Tweedie’s trim-and-fill method trimmedtwo studies generating a moderate-sized adjust-ed point estimate (Adjusted point estimate =0.317; 95% CI [−0.158, 0.792]; Q = 12.965).Egger’s regression intercept was not significant(Intercept = 3.272; t = 1.701; p = 0.187; two-tailed). The effect sizes and forest plot for non-verbal memory is presented in Fig. 3g and afunnel plot is provided the supplemental mate-rials as Fig. S3g.
g. Executive Functions: A total of thirteen studies re-ported outcome data regarding the effects of cognitivetraining on executive functions. The summary effectsize was moderate and significant (Hedges’ g ob-served = 0.575; 95% CI [0.093, 1.056]; Z = 2.339;p = 0.019). However, the HKSJ calculation failed to
demonstrate significance (HKSJ point estimate ad-justment SMD = 0.585; 95% CI [− 0.262,1.432]; t = 1.505; df = 12; p = 0.158). Values repre-sentative of heterogeneity were significant (Q =126.404; df = 12; p = 0.000; I2 = 90.507%; τ2 =0.669). Visual inspection of the funnel plot was asym-metrical and there were no adjustments with Duvaland Tweedie’s trim-and-fill method. Egger’s regres-sion intercept was not significant (Intercept = 2.718;t = 1.242; p = 0.240; two-tailed). The effect sizes andforest plot for executive functioning measures is pre-sented in Fig. 3h and a funnel plot is provided thesupplemental materials as Fig. S3h.
3. Intervention Effects – By Training Type: Please seeTable 4 for a breakdown of effects by training includingneuropsychological instruments, individual effect sizes,and overall effects.
g
h
Study name Outcome Statistics for each study Hedges's g and 95% CI
Hedges's Standard Lower Upper Relativeg error Variance limit limit Z-Value p-Value weight
emory - Non-Verbal Delay (BVMT-R) 0.254 0.291 0.085 -0.317 0.825 0.872 0.383 33.18
Combined 0.928 0.501 0.251 -0.054 1.910 1.852 0.064 14.68
Memory - Visual - Percent Change 1.312 0.466 0.217 0.399 2.225 2.817 0.005 16.58
emory - Figure Delay (Rey-O) 0.185 0.411 0.169 -0.620 0.991 0.451 0.652 20.26
emory - Non-Verbal - Delay (Face - Name) 0.619 0.489 0.239 -0.339 1.577 1.266 0.205 15.30
0.570 0.209 0.044 0.160 0.980 2.726 0.006
-2.00 -1.00 0.00 1.00 2.00
Favours No Intervention Favours Intervention
Study name Outcome Statistics for each study Hedges's g and 95% CI
Hedges's Standard Lower Upper Relativeg error Variance limit limit Z-Value p-Value weight
F - Phonemic Fluency 5.266 0.504 0.254 4.278 6.254 10.446 0.000 6.54F - TMT-B -0.954 0.436 0.190 -1.809 -0.099 -2.186 0.029 7.02
Combined 0.248 0.292 0.085 -0.324 0.821 0.850 0.395 8.00Combined 1.096 0.511 0.261 0.094 2.097 2.144 0.032 6.49EF - D-KEFS - N-L Switch 0.099 0.394 0.156 -0.675 0.872 0.250 0.803 7.32Combined 0.129 0.404 0.163 -0.663 0.921 0.320 0.749 7.25
F - Phonemic Fluency 0.943 0.213 0.045 0.527 1.360 4.439 0.000 8.45EF - Composite 0.065 0.175 0.031 -0.278 0.408 0.371 0.711 8.63Combined 0.170 0.323 0.104 -0.462 0.802 0.528 0.598 7.81EF - FAS 0.270 0.358 0.128 -0.431 0.971 0.755 0.450 7.57EF - FAS 0.663 0.365 0.134 -0.053 1.380 1.816 0.069 7.52
F - FUCAS Planning 0.343 0.154 0.024 0.042 0.645 2.232 0.026 8.71Combined -0.103 0.161 0.026 -0.418 0.212 -0.640 0.522 8.69
0.575 0.246 0.060 0.093 1.056 2.339 0.019
-2.00 -1.00 0.00 1.00 2.00
Favours No Intervention Favours Intervention
Fiatarone Singh et al. (2014) M
Finn & McDonald (2011)
Hampstead et al. (2012)
Herrera et al. (2012) M
Rapp et al. (2002) M
Balietti et al. (2016) EBuschert et al. (2011) EFiatarone Singh et al. (2014)Finn & McDonald (2011)Finn & McDonald (2015)Gagnon et al. (2012)Giuli et al. (2016) EJeong et al. (2016)Mowszowski et al. (2014)Olchik et al. (2013)Rojas et al. (2013)Tsolaki et al. (2011) EVidovich et al. (2015)
Fig. 3 (continued)
464 Neuropsychol Rev (2017) 27:440–484
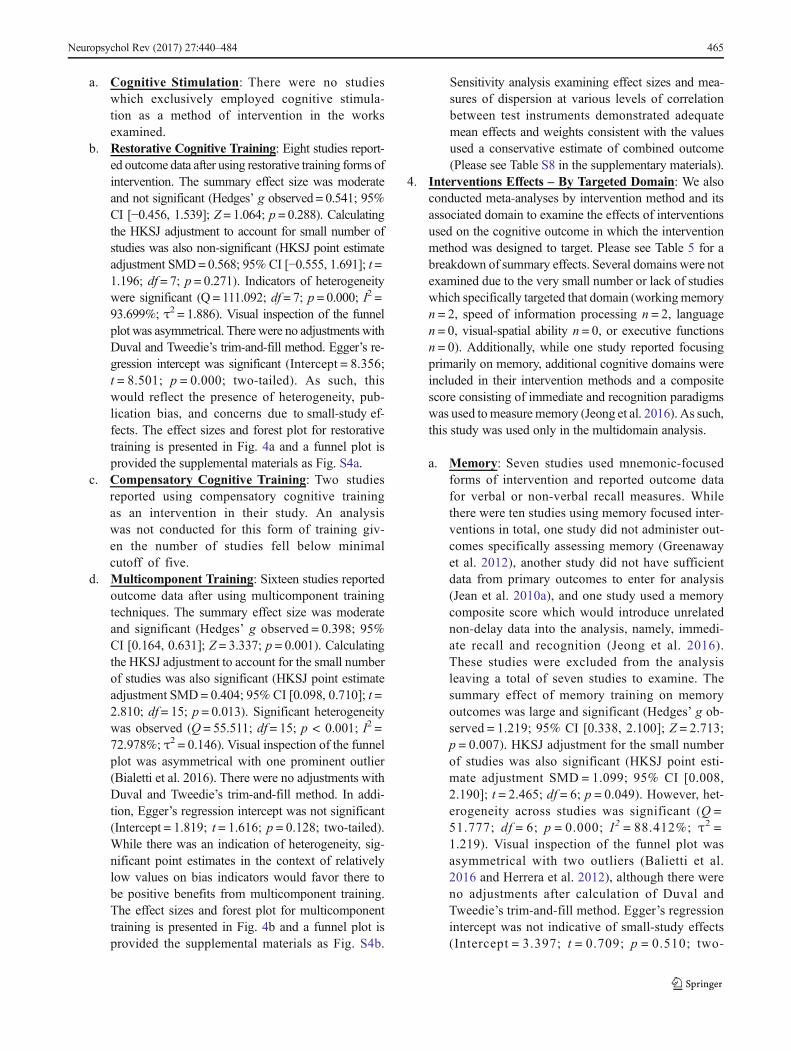
a. Cognitive Stimulation: There were no studieswhich exclusively employed cognitive stimula-tion as a method of intervention in the worksexamined.
b. Restorative Cognitive Training: Eight studies report-ed outcome data after using restorative training forms ofintervention. The summary effect size was moderateand not significant (Hedges’ g observed = 0.541; 95%CI [−0.456, 1.539]; Z = 1.064; p = 0.288). Calculatingthe HKSJ adjustment to account for small number ofstudies was also non-significant (HKSJ point estimateadjustment SMD= 0.568; 95% CI [−0.555, 1.691]; t =1.196; df = 7; p = 0.271). Indicators of heterogeneitywere significant (Q = 111.092; df = 7; p = 0.000; I2 =93.699%; τ2 = 1.886). Visual inspection of the funnelplot was asymmetrical. There were no adjustments withDuval and Tweedie’s trim-and-fill method. Egger’s re-gression intercept was significant (Intercept = 8.356;t = 8.501; p = 0.000; two-tailed). As such, thiswould reflect the presence of heterogeneity, pub-lication bias, and concerns due to small-study ef-fects. The effect sizes and forest plot for restorativetraining is presented in Fig. 4a and a funnel plot isprovided the supplemental materials as Fig. S4a.
c. Compensatory Cognitive Training: Two studiesreported using compensatory cognitive trainingas an intervention in their study. An analysiswas not conducted for this form of training giv-en the number of studies fell below minimalcutoff of five.
d. Multicomponent Training: Sixteen studies reportedoutcome data after using multicomponent trainingtechniques. The summary effect size was moderateand significant (Hedges’ g observed = 0.398; 95%CI [0.164, 0.631]; Z = 3.337; p = 0.001). Calculatingthe HKSJ adjustment to account for the small numberof studies was also significant (HKSJ point estimateadjustment SMD= 0.404; 95% CI [0.098, 0.710]; t =2.810; df = 15; p = 0.013). Significant heterogeneitywas observed (Q = 55.511; df = 15; p < 0.001; I2 =72.978%; τ2 = 0.146). Visual inspection of the funnelplot was asymmetrical with one prominent outlier(Bialetti et al. 2016). There were no adjustments withDuval and Tweedie’s trim-and-fill method. In addi-tion, Egger’s regression intercept was not significant(Intercept = 1.819; t = 1.616; p = 0.128; two-tailed).While there was an indication of heterogeneity, sig-nificant point estimates in the context of relativelylow values on bias indicators would favor there tobe positive benefits from multicomponent training.The effect sizes and forest plot for multicomponenttraining is presented in Fig. 4b and a funnel plot isprovided the supplemental materials as Fig. S4b.
Sensitivity analysis examining effect sizes and mea-sures of dispersion at various levels of correlationbetween test instruments demonstrated adequatemean effects and weights consistent with the valuesused a conservative estimate of combined outcome(Please see Table S8 in the supplementary materials).
4. Interventions Effects – By Targeted Domain: We alsoconducted meta-analyses by intervention method and itsassociated domain to examine the effects of interventionsused on the cognitive outcome in which the interventionmethod was designed to target. Please see Table 5 for abreakdown of summary effects. Several domains were notexamined due to the very small number or lack of studieswhich specifically targeted that domain (workingmemoryn = 2, speed of information processing n = 2, languagen = 0, visual-spatial ability n = 0, or executive functionsn = 0). Additionally, while one study reported focusingprimarily on memory, additional cognitive domains wereincluded in their intervention methods and a compositescore consisting of immediate and recognition paradigmswas used tomeasure memory (Jeong et al. 2016). As such,this study was used only in the multidomain analysis.
a. Memory: Seven studies used mnemonic-focusedforms of intervention and reported outcome datafor verbal or non-verbal recall measures. Whilethere were ten studies using memory focused inter-ventions in total, one study did not administer out-comes specifically assessing memory (Greenawayet al. 2012), another study did not have sufficientdata from primary outcomes to enter for analysis(Jean et al. 2010a), and one study used a memorycomposite score which would introduce unrelatednon-delay data into the analysis, namely, immedi-ate recall and recognition (Jeong et al. 2016).These studies were excluded from the analysisleaving a total of seven studies to examine. Thesummary effect of memory training on memoryoutcomes was large and significant (Hedges’ g ob-served = 1.219; 95% CI [0.338, 2.100]; Z = 2.713;p = 0.007). HKSJ adjustment for the small numberof studies was also significant (HKSJ point esti-mate adjustment SMD = 1.099; 95% CI [0.008,2.190]; t = 2.465; df = 6; p = 0.049). However, het-erogeneity across studies was significant (Q =51.777; df = 6; p = 0.000; I2 = 88.412%; τ2 =1.219). Visual inspection of the funnel plot wasasymmetrical with two outliers (Balietti et al.2016 and Herrera et al. 2012), although there wereno adjustments after calculation of Duval andTweedie’s trim-and-fill method. Egger’s regressionintercept was not indicative of small-study effects(Intercept = 3.397; t = 0.709; p = 0.510; two-
Neuropsychol Rev (2017) 27:440–484 465
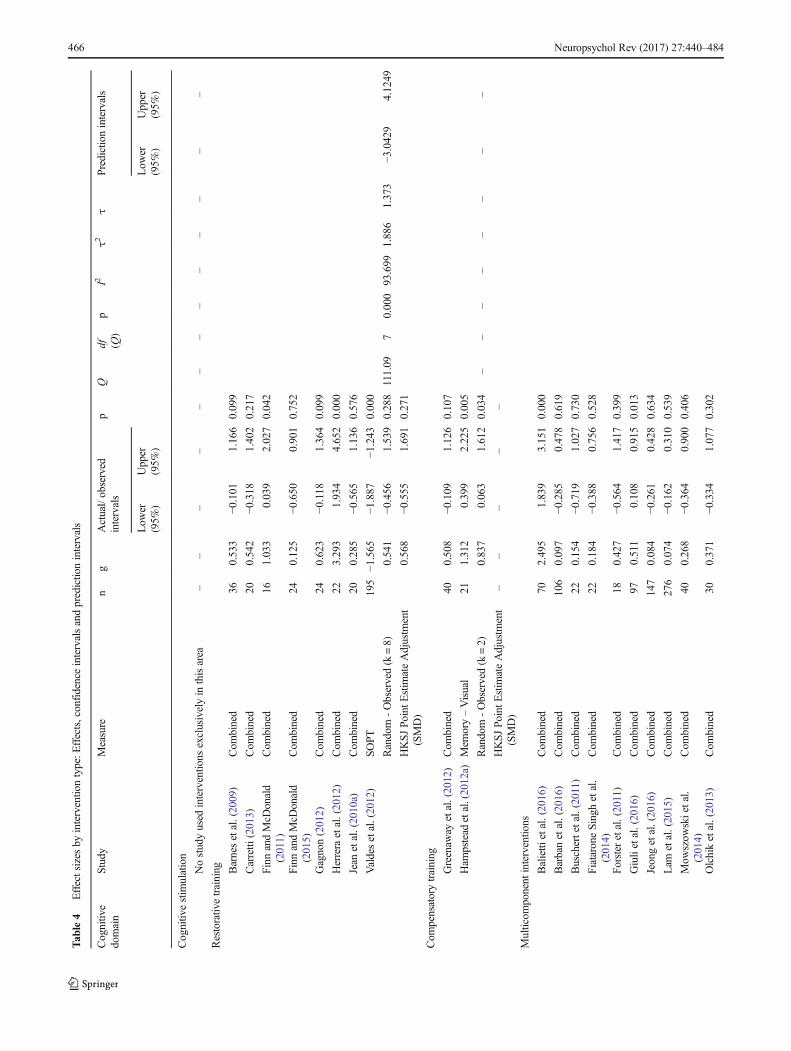
Tab
le4
Effectsizes
byinterventio
ntype:E
ffects,confidenceintervalsandpredictio
nintervals
Cognitiv
edomain
Study
Measure
ng
Actual/observed
intervals
pQ
df (Q)
pI2
τ2τ
Predictionintervals
Low
er(95%
)Upper
(95%
)Low
er(95%
)Upper
(95%
)
Cognitiv
estim
ulation
Nostudyused
interventio
nsexclusivelyin
thisarea
––
––
––
––
––
––
–
Restorativ
etraining Barnesetal.(2009)
Com
bined
360.533
−0.101
1.166
0.099
Carretti
(2013)
Com
bined
200.542
−0.318
1.402
0.217
Finn
andMcD
onald
(2011)
Com
bined
161.033
0.039
2.027
0.042
Finn
andMcD
onald
(2015)
Com
bined
240.125
−0.650
0.901
0.752
Gagnon(2012)
Com
bined
240.623
−0.118
1.364
0.099
Herrera
etal.(2012)
Com
bined
223.293
1.934
4.652
0.000
Jean
etal.(2010a)
Com
bined
200.285
−0.565
1.136
0.576
Valdesetal.(2012)
SOPT
195
−1.565
−1.887
−1.243
0.000
Random
-Observed(k=8)
0.541
−0.456
1.539
0.288
111.09
70.000
93.699
1.886
1.373
−3.0429
4.1249
HKSJPoint
Estim
ateAdjustm
ent
(SMD)
0.568
−0.555
1.691
0.271
Com
pensatorytraining
Greenaw
ayetal.(2012)
Com
bined
400.508
−0.109
1.126
0.107
Ham
pstead
etal.(2012a)
Mem
ory–Visual
211.312
0.399
2.225
0.005
Random
-Observed(k=2)
0.837
0.063
1.612
0.034
––
––
––
––
HKSJPoint
Estim
ateAdjustm
ent
(SMD)
––
––
–
Multicom
ponent
interventio
ns
Balietti
etal.(2016)
Com
bined
702.495
1.839
3.151
0.000
Barbanetal.(2016)
Com
bined
106
0.097
−0.285
0.478
0.619
Buschertetal.(2011)
Com
bined
220.154
−0.719
1.027
0.730
FiataroneSinghetal.
( 2014)
Com
bined
220.184
−0.388
0.756
0.528
Forster
etal.(2011)
Com
bined
180.427
−0.564
1.417
0.399
Giulietal.(2016)
Com
bined
970.511
0.108
0.915
0.013
Jeongetal.(2016)
Com
bined
147
0.084
−0.261
0.428
0.634
Lam
etal.(2015)
Com
bined
276
0.074
−0.162
0.310
0.539
Mow
szow
skietal.
(2014)
Com
bined
400.268
−0.364
0.900
0.406
Olchiketal.(2013)
Com
bined
300.371
−0.334
1.077
0.302
466 Neuropsychol Rev (2017) 27:440–484
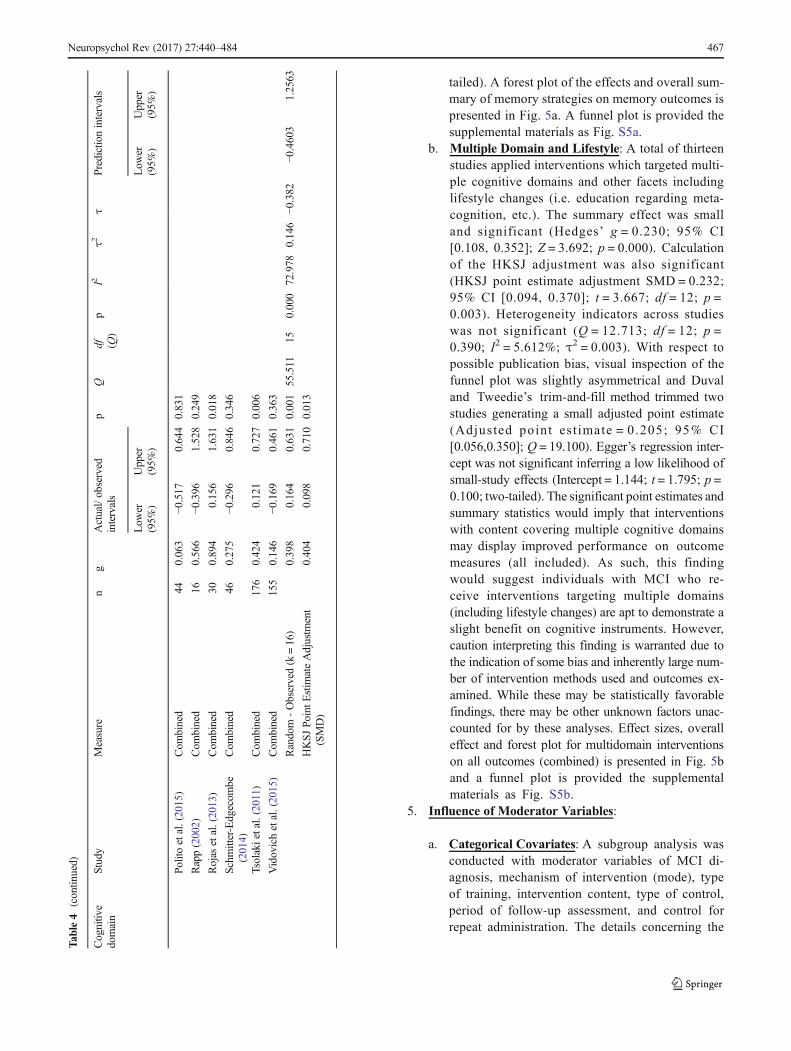
tailed). A forest plot of the effects and overall sum-mary of memory strategies on memory outcomes ispresented in Fig. 5a. A funnel plot is provided thesupplemental materials as Fig. S5a.
b. Multiple Domain and Lifestyle: A total of thirteenstudies applied interventions which targeted multi-ple cognitive domains and other facets includinglifestyle changes (i.e. education regarding meta-cognition, etc.). The summary effect was smalland significant (Hedges’ g = 0.230; 95% CI[0.108, 0.352]; Z = 3.692; p = 0.000). Calculationof the HKSJ adjustment was also significant(HKSJ point estimate adjustment SMD = 0.232;95% CI [0.094, 0.370]; t = 3.667; df = 12; p =0.003). Heterogeneity indicators across studieswas not significant (Q = 12.713; df = 12; p =0.390; I2 = 5.612%; τ2 = 0.003). With respect topossible publication bias, visual inspection of thefunnel plot was slightly asymmetrical and Duvaland Tweedie’s trim-and-fill method trimmed twostudies generating a small adjusted point estimate(Adjusted point est imate = 0.205; 95% CI[0.056,0.350]; Q = 19.100). Egger’s regression inter-cept was not significant inferring a low likelihood ofsmall-study effects (Intercept = 1.144; t = 1.795; p =0.100; two-tailed). The significant point estimates andsummary statistics would imply that interventionswith content covering multiple cognitive domainsmay display improved performance on outcomemeasures (all included). As such, this findingwould suggest individuals with MCI who re-ceive interventions targeting multiple domains(including lifestyle changes) are apt to demonstrate aslight benefit on cognitive instruments. However,caution interpreting this finding is warranted due tothe indication of some bias and inherently large num-ber of intervention methods used and outcomes ex-amined. While these may be statistically favorablefindings, there may be other unknown factors unac-counted for by these analyses. Effect sizes, overalleffect and forest plot for multidomain interventionson all outcomes (combined) is presented in Fig. 5band a funnel plot is provided the supplementalmaterials as Fig. S5b.
5. Influence of Moderator Variables:
a. Categorical Covariates: A subgroup analysis wasconducted with moderator variables of MCI di-agnosis, mechanism of intervention (mode), typeof training, intervention content, type of control,period of follow-up assessment, and control forrepeat administration. The details concerning the
Tab
le4
(contin
ued)
Cognitiv
edomain
Study
Measure
ng
Actual/observed
intervals
pQ
df (Q)
pI2
τ2τ
Predictionintervals
Low
er(95%
)Upper
(95%
)Low
er(95%
)Upper
(95%
)
Polito
etal.(2015)
Com
bined
440.063
−0.517
0.644
0.831
Rapp(2002)
Com
bined
160.566
−0.396
1.528
0.249
Rojas
etal.(2013)
Com
bined
300.894
0.156
1.631
0.018
Schm
itter-Edgecom
be(2014)
Com
bined
460.275
−0.296
0.846
0.346
Tsolakietal.(2011)
Com
bined
176
0.424
0.121
0.727
0.006
Vidovichetal.(2015)
Com
bined
155
0.146
−0.169
0.461
0.363
Random
-Observed(k=16)
0.398
0.164
0.631
0.001
55.511
150.000
72.978
0.146
−0.382
−0.4603
1.2563
HKSJPoint
Estim
ateAdjustm
ent
(SMD)
0.404
0.098
0.710
0.013
Neuropsychol Rev (2017) 27:440–484 467
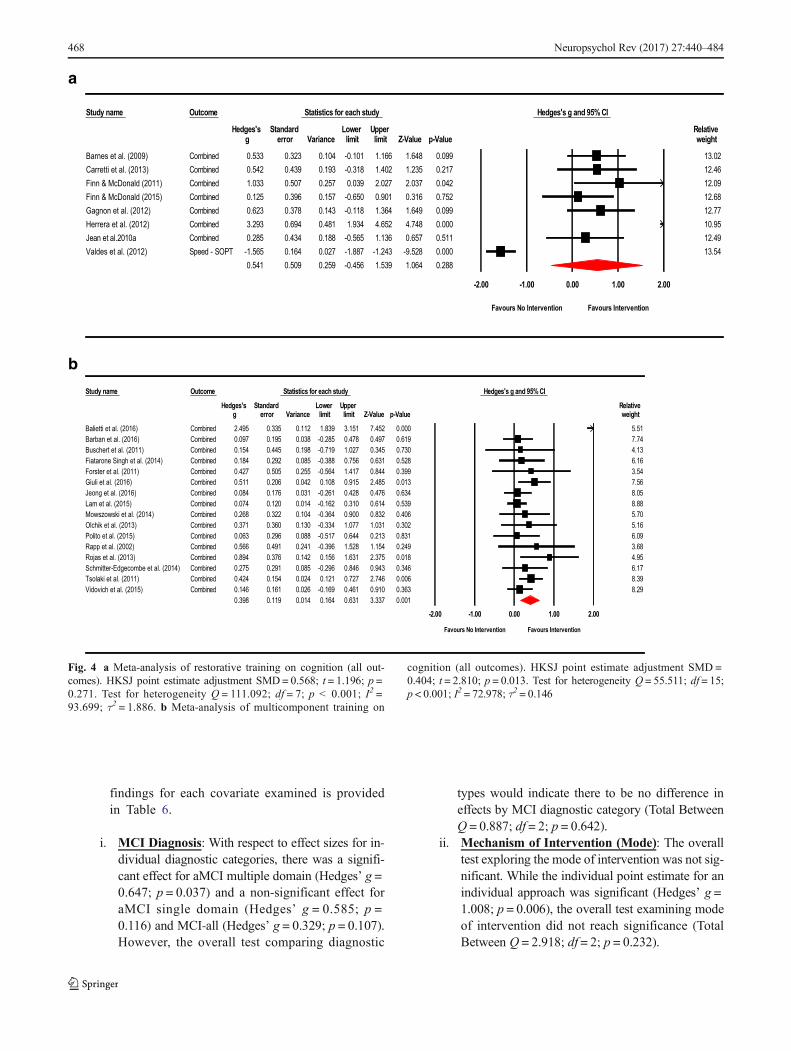
findings for each covariate examined is providedin Table 6.
i. MCI Diagnosis: With respect to effect sizes for in-dividual diagnostic categories, there was a signifi-cant effect for aMCI multiple domain (Hedges’ g =0.647; p = 0.037) and a non-significant effect foraMCI single domain (Hedges’ g = 0.585; p =0.116) and MCI-all (Hedges’ g = 0.329; p = 0.107).However, the overall test comparing diagnostic
types would indicate there to be no difference ineffects by MCI diagnostic category (Total BetweenQ = 0.887; df = 2; p = 0.642).
ii. Mechanism of Intervention (Mode): The overalltest exploring the mode of intervention was not sig-nificant. While the individual point estimate for anindividual approach was significant (Hedges’ g =1.008; p = 0.006), the overall test examining modeof intervention did not reach significance (TotalBetween Q = 2.918; df = 2; p = 0.232).
a
b
Hedges's g and 95% CI
Relativeweight
13.0212.4612.0912.6812.7710.9512.4913.54
-2.00 -1.00 0.00 1.00 2.00
Favours No Intervention Favours Intervention
Hedges's g and 95% CI
Relativeweight
5.517.744.136.163.547.568.058.885.705.166.093.684.956.178.398.29
-2.00 -1.00 0.00 1.00 2.00
Favours No Intervention Favours Intervention
Study name Outcome Statistics for each study
Hedges's Standard Lower Upperg error Variance limit limit Z-Value p-Value
Barnes et al. (2009) Combined 0.533 0.323 0.104 -0.101 1.166 1.648 0.099Carretti et al. (2013) Combined 0.542 0.439 0.193 -0.318 1.402 1.235 0.217Finn & McDonald (2011) Combined 1.033 0.507 0.257 0.039 2.027 2.037 0.042Finn & McDonald (2015) Combined 0.125 0.396 0.157 -0.650 0.901 0.316 0.752Gagnon et al. (2012) Combined 0.623 0.378 0.143 -0.118 1.364 1.649 0.099Herrera et al. (2012) Combined 3.293 0.694 0.481 1.934 4.652 4.748 0.000
Combined 0.285 0.434 0.188 -0.565 1.136 0.657 0.511Valdes et al. (2012) Speed - SOPT -1.565 0.164 0.027 -1.887 -1.243 -9.528 0.000
0.541 0.509 0.259 -0.456 1.539 1.064 0.288
Study name Outcome Statistics for each study
Hedges's Standard Lower Upperg error Variance limit limit Z-Value p-Value
Balietti et al. (2016) Combined 2.495 0.335 0.112 1.839 3.151 7.452 0.000Barban et al. (2016) Combined 0.097 0.195 0.038 -0.285 0.478 0.497 0.619Buschert et al. (2011) Combined 0.154 0.445 0.198 -0.719 1.027 0.345 0.730Fiatarone Singh et al. (2014) Combined 0.184 0.292 0.085 -0.388 0.756 0.631 0.528Forster et al. (2011) Combined 0.427 0.505 0.255 -0.564 1.417 0.844 0.399Giuli et al. (2016) Combined 0.511 0.206 0.042 0.108 0.915 2.485 0.013Jeong et al. (2016) Combined 0.084 0.176 0.031 -0.261 0.428 0.476 0.634Lam et al. (2015) Combined 0.074 0.120 0.014 -0.162 0.310 0.614 0.539Mowszowski et al. (2014) Combined 0.268 0.322 0.104 -0.364 0.900 0.832 0.406Olchik et al. (2013) Combined 0.371 0.360 0.130 -0.334 1.077 1.031 0.302Polito et al. (2015) Combined 0.063 0.296 0.088 -0.517 0.644 0.213 0.831Rapp et al. (2002) Combined 0.566 0.491 0.241 -0.396 1.528 1.154 0.249Rojas et al. (2013) Combined 0.894 0.376 0.142 0.156 1.631 2.375 0.018Schmitter-Edgecombe et al. (2014) Combined 0.275 0.291 0.085 -0.296 0.846 0.943 0.346Tsolaki et al. (2011) Combined 0.424 0.154 0.024 0.121 0.727 2.746 0.006Vidovich et al. (2015) Combined 0.146 0.161 0.026 -0.169 0.461 0.910 0.363
0.398 0.119 0.014 0.164 0.631 3.337 0.001
Jean et al.2010a
Fig. 4 a Meta-analysis of restorative training on cognition (all out-comes). HKSJ point estimate adjustment SMD= 0.568; t = 1.196; p =0.271. Test for heterogeneity Q = 111.092; df = 7; p < 0.001; I2 =93.699; τ2 = 1.886. b Meta-analysis of multicomponent training on
cognition (all outcomes). HKSJ point estimate adjustment SMD =0.404; t = 2.810; p = 0.013. Test for heterogeneity Q = 55.511; df = 15;p < 0.001; I2 = 72.978; τ2 = 0.146
468 Neuropsychol Rev (2017) 27:440–484
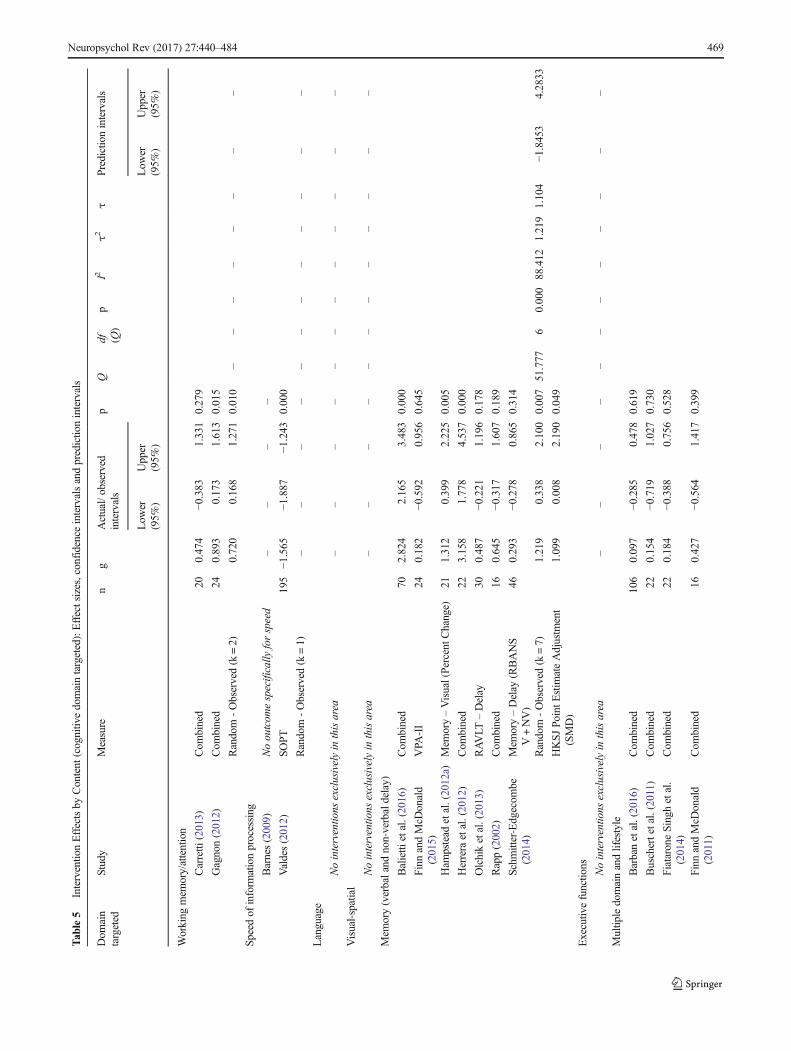
Tab
le5
Interventio
nEffectsby
Content
(cognitiv
edomaintargeted):Effectsizes,confidenceintervalsandpredictio
nintervals
Dom
ain
targeted
Study
Measure
ng
Actual/observed
intervals
pQ
df (Q)
pI2
τ2τ
Predictionintervals
Low
er(95%
)Upper
(95%
)Low
er(95%
)Upper
(95%
)
Working
mem
ory/attention
Carretti
(2013)
Com
bined
200.474
−0.383
1.331
0.279
Gagnon(2012)
Com
bined
240.893
0.173
1.613
0.015
Random
-Observed(k=2)
0.720
0.168
1.271
0.010
––
––
––
––
Speedof
inform
ationprocessing
Barnes(2009)
Nooutcom
especifically
forspeed
––
––
Valdes(2012)
SOPT
195
−1.565
−1.887
−1.243
0.000
Random
-Observed(k=1)
––
––
––
––
––
––
Language
Nointerventio
nsexclusivelyin
thisarea
––
––
––
––
––
––
Visual-spatial
Nointerventio
nsexclusivelyin
thisarea
––
––
––
––
––
––
Mem
ory(verbaland
non-verbaldelay)
Balietti
etal.(2016)
Com
bined
702.824
2.165
3.483
0.000
Finn
andMcD
onald
(2015)
VPA
-II
240.182
−0.592
0.956
0.645
Ham
pstead
etal.(2012a)
Mem
ory–Visual(PercentC
hange)
211.312
0.399
2.225
0.005
Herrera
etal.(2012)
Com
bined
223.158
1.778
4.537
0.000
Olchiketal.(2013)
RAVLT
–Delay
300.487
−0.221
1.196
0.178
Rapp(2002)
Com
bined
160.645
−0.317
1.607
0.189
Schm
itter-Edgecom
be(2014)
Mem
ory–Delay
(RBANS
V+NV)
460.293
−0.278
0.865
0.314
Random
-Observed(k=7)
1.219
0.338
2.100
0.007
51.777
60.000
88.412
1.219
1.104
−1.8453
4.2833
HKSJPo
intE
stim
ateAdjustm
ent
(SMD)
1.099
0.008
2.190
0.049
Executiv
efunctio
ns Nointerventio
nsexclusivelyin
thisarea
––
––
––
––
––
––
Multip
ledomainandlifestyle
Barbanetal.(2016)
Com
bined
106
0.097
− 0.285
0.478
0.619
Buschertetal.(2011)
Com
bined
220.154
−0.719
1.027
0.730
FiataroneSinghetal.
(2014)
Com
bined
220.184
−0.388
0.756
0.528
Finn
andMcD
onald
(2011)
Com
bined
160.427
−0.564
1.417
0.399
Neuropsychol Rev (2017) 27:440–484 469
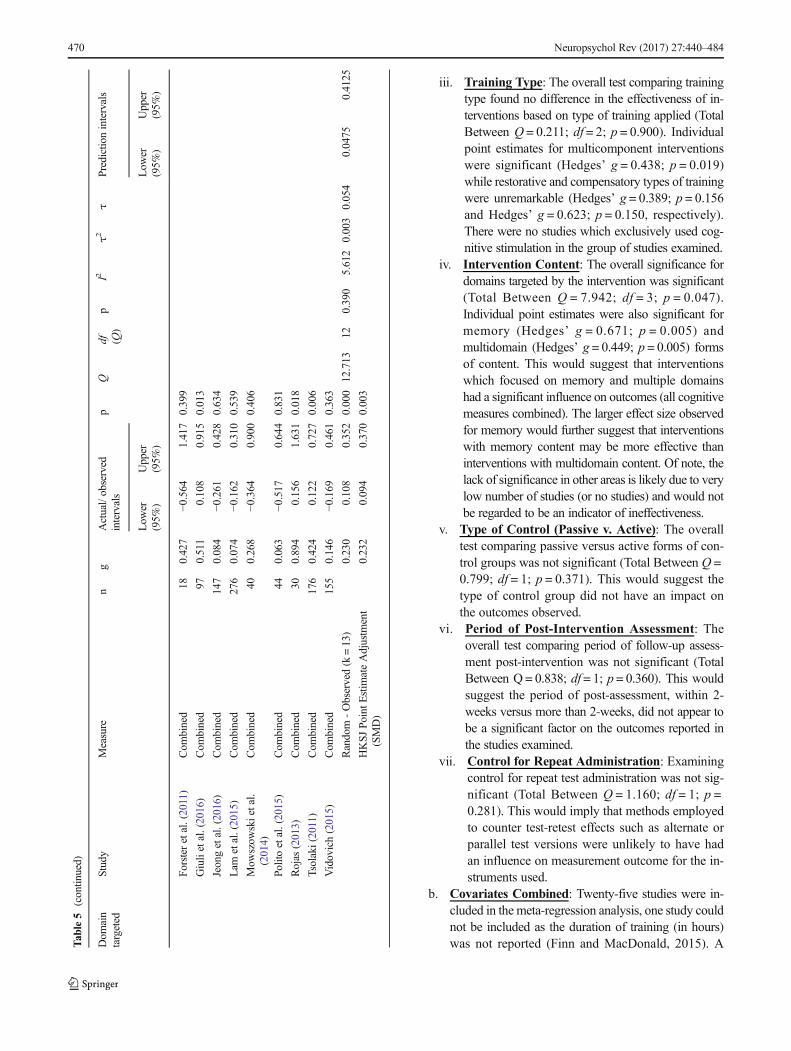
iii. Training Type: The overall test comparing trainingtype found no difference in the effectiveness of in-terventions based on type of training applied (TotalBetween Q = 0.211; df = 2; p = 0.900). Individualpoint estimates for multicomponent interventionswere significant (Hedges’ g = 0.438; p = 0.019)while restorative and compensatory types of trainingwere unremarkable (Hedges’ g = 0.389; p = 0.156and Hedges’ g = 0.623; p = 0.150, respectively).There were no studies which exclusively used cog-nitive stimulation in the group of studies examined.
iv. Intervention Content: The overall significance fordomains targeted by the intervention was significant(Total Between Q = 7.942; df = 3; p = 0.047).Individual point estimates were also significant formemory (Hedges’ g = 0.671; p = 0.005) andmultidomain (Hedges’ g = 0.449; p = 0.005) formsof content. This would suggest that interventionswhich focused on memory and multiple domainshad a significant influence on outcomes (all cognitivemeasures combined). The larger effect size observedfor memory would further suggest that interventionswith memory content may be more effective thaninterventions with multidomain content. Of note, thelack of significance in other areas is likely due to verylow number of studies (or no studies) and would notbe regarded to be an indicator of ineffectiveness.
v. Type of Control (Passive v. Active): The overalltest comparing passive versus active forms of con-trol groups was not significant (Total Between Q =0.799; df = 1; p = 0.371). This would suggest thetype of control group did not have an impact onthe outcomes observed.
vi. Period of Post-Intervention Assessment: Theoverall test comparing period of follow-up assess-ment post-intervention was not significant (TotalBetween Q = 0.838; df = 1; p = 0.360). This wouldsuggest the period of post-assessment, within 2-weeks versus more than 2-weeks, did not appear tobe a significant factor on the outcomes reported inthe studies examined.
vii. Control for Repeat Administration: Examiningcontrol for repeat test administration was not sig-nificant (Total Between Q = 1.160; df = 1; p =0.281). This would imply that methods employedto counter test-retest effects such as alternate orparallel test versions were unlikely to have hadan influence on measurement outcome for the in-struments used.
b. Covariates Combined: Twenty-five studies were in-cluded in the meta-regression analysis, one study couldnot be included as the duration of training (in hours)was not reported (Finn and MacDonald, 2015). AT
able5
(contin
ued)
Dom
ain
targeted
Study
Measure
ng
Actual/observed
intervals
pQ
df (Q)
pI2
τ2τ
Predictionintervals
Low
er(95%
)Upper
(95%
)Low
er(95%
)Upper
(95%
)
Forsteretal.(2011)
Com
bined
180.427
−0.564
1.417
0.399
Giulietal.(2016)
Com
bined
970.511
0.108
0.915
0.013
Jeongetal.(2016)
Com
bined
147
0.084
−0.261
0.428
0.634
Lam
etal.(2015)
Com
bined
276
0.074
−0.162
0.310
0.539
Mow
szow
skietal.
(2014)
Com
bined
400.268
−0.364
0.900
0.406
Politoetal.(2015)
Com
bined
440.063
−0.517
0.644
0.831
Rojas
(2013)
Com
bined
300.894
0.156
1.631
0.018
Tsolaki(2011)
Com
bined
176
0.424
0.122
0.727
0.006
Vidovich(2015)
Com
bined
155
0.146
−0.169
0.461
0.363
Random
-Observed(k=13)
0.230
0.108
0.352
0.000
12.713
120.390
5.612
0.003
0.054
0.0475
0.4125
HKSJ
PointE
stim
ateAdjustm
ent
(SMD)
0.232
0.094
0.370
0.003
470 Neuropsychol Rev (2017) 27:440–484
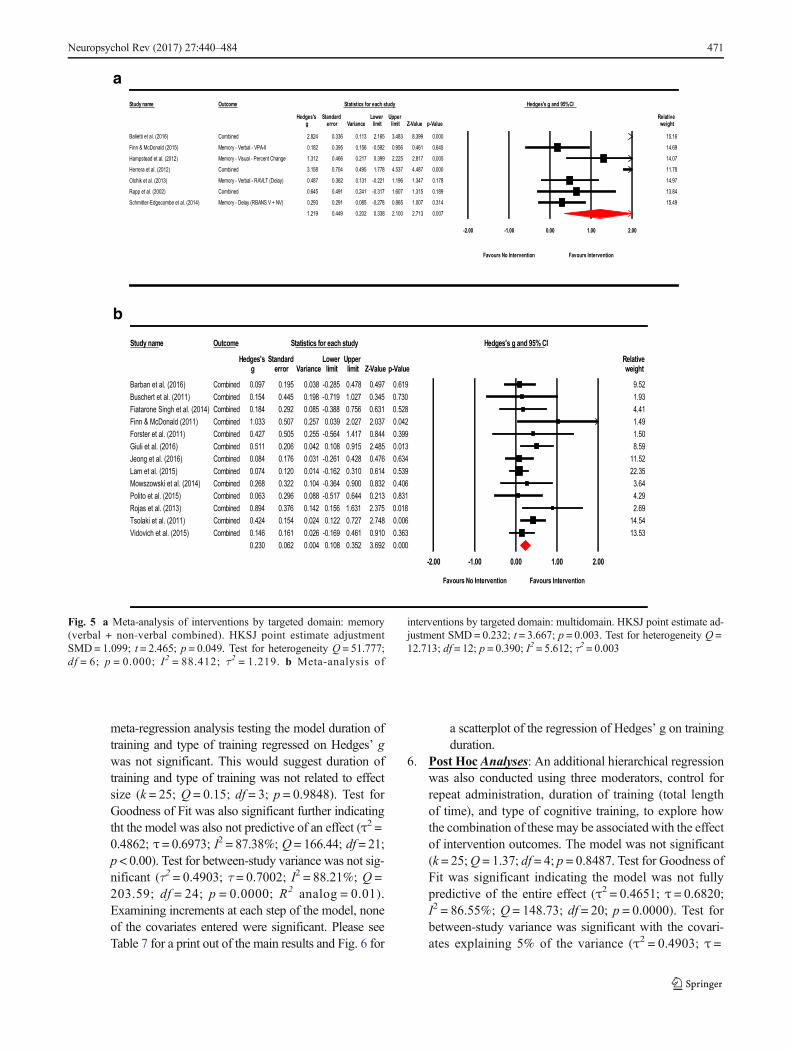
meta-regression analysis testing the model duration oftraining and type of training regressed on Hedges’ gwas not significant. This would suggest duration oftraining and type of training was not related to effectsize (k = 25; Q = 0.15; df = 3; p = 0.9848). Test forGoodness of Fit was also significant further indicatingtht the model was also not predictive of an effect (τ2 =0.4862; τ = 0.6973; I2 = 87.38%; Q = 166.44; df = 21;p < 0.00). Test for between-study variance was not sig-nificant (τ2 = 0.4903; τ = 0.7002; I2 = 88.21%; Q =203.59; df = 24; p = 0.0000; R2 analog = 0.01).Examining increments at each step of the model, noneof the covariates entered were significant. Please seeTable 7 for a print out of the main results and Fig. 6 for
a scatterplot of the regression of Hedges’ g on trainingduration.
6. Post Hoc Analyses: An additional hierarchical regressionwas also conducted using three moderators, control forrepeat administration, duration of training (total lengthof time), and type of cognitive training, to explore howthe combination of these may be associated with the effectof intervention outcomes. The model was not significant(k = 25;Q = 1.37; df = 4; p = 0.8487. Test for Goodness ofFit was significant indicating the model was not fullypredictive of the entire effect (τ2 = 0.4651; τ = 0.6820;I2 = 86.55%; Q = 148.73; df = 20; p = 0.0000). Test forbetween-study variance was significant with the covari-ates explaining 5% of the variance (τ2 = 0.4903; τ =
a
b
Study name Outcome Statistics for each study Hedges's g and 95%CI
Hedges's Standard Lower Upper Relativeg error Variance limit limit Z-Value p-Value weight
000.0993.8384.3561.2311.0633.0428.2Balietti et al. (2016)
Barban et al. (2016)Buschert et al. (2011)Fiatarone Singh et al. (2014)
Forster et al. (2011)Giuli et al. (2016)Jeong et al. (2016)Lam et al. (2015)Mowszowski et al. (2014)Polito et al. (2015)Rojas et al. (2013)Tsolaki et al. (2011)Vidovich et al. (2015)
Hampstead et al. (2012)
Herrera et al. (2012)
Olchik et al. (2013)
Rapp et al. (2002)
Schmitter-Edgecombe et al. (2014)
15.16
Finn & McDonald (2015) 0.182 0.395 0.156 -0.592 0.956 0.461 0.645 14.69
.312 0.466 0.217 0.399 2.225 2.817 0.005 14.07
000.0784.4735.4877.1594.0407.0851.3 11.78
.487 0.362 0.131 -0.221 1.196 1.347 0.178 14.97
981.0513.1706.1713.0-142.0194.0546.0 13.84
denibmoC
Memory - Verbal - VPA-II
Memory - Visual - Percent Change 1
denibmoC
Memory - Verbal - RAVLT (Delay) 0
denibmoC
Memory - Delay (RBANS V + NV) 0.293 0.291 0.085 -0.278 0.865 1.007 0.314 15.49
1.219 0.449 0.202 0.338 2.100 2.713 0.007
-2.00 -1.00 0.00 1.00 2.00
Favours No Intervention Favours Intervention
Study name Outcome Statistics for each study Hedges's g and 95% CI
Hedges's Standard Lower Upper Relativeweight
9.521.934.411.491.508.59
11.5222.353.644.292.69
14.5413.53
g error Variance limit limit Z-Value p-Value
Combined 0.097 0.195 0.038 -0.285 0.478 0.497 0.619Combined 0.154 0.445 0.198 -0.719 1.027 0.345 0.730Combined 0.184 0.292 0.085 -0.388 0.756 0.631 0.528
Finn & McDonald (2011) Combined 1.033 0.507 0.257 0.039 2.027 2.037 0.042Combined 0.427 0.505 0.255 -0.564 1.417 0.844 0.399Combined 0.511 0.206 0.042 0.108 0.915 2.485 0.013Combined 0.084 0.176 0.031 -0.261 0.428 0.476 0.634Combined 0.074 0.120 0.014 -0.162 0.310 0.614 0.539Combined 0.268 0.322 0.104 -0.364 0.900 0.832 0.406Combined 0.063 0.296 0.088 -0.517 0.644 0.213 0.831Combined 0.894 0.376 0.142 0.156 1.631 2.375 0.018Combined 0.424 0.154 0.024 0.122 0.727 2.748 0.006Combined 0.146 0.161 0.026 -0.169 0.461 0.910 0.363
0.230 0.062 0.004 0.108 0.352 3.692 0.000
-2.00 -1.00 0.00 1.00 2.00
Favours No Intervention Favours Intervention
Fig. 5 a Meta-analysis of interventions by targeted domain: memory(verbal + non-verbal combined). HKSJ point estimate adjustmentSMD= 1.099; t = 2.465; p = 0.049. Test for heterogeneity Q = 51.777;df = 6; p = 0.000; I2 = 88.412; τ2 = 1.219. b Meta-analysis of
interventions by targeted domain: multidomain. HKSJ point estimate ad-justment SMD= 0.232; t = 3.667; p = 0.003. Test for heterogeneity Q =12.713; df = 12; p = 0.390; I2 = 5.612; τ2 = 0.003
Neuropsychol Rev (2017) 27:440–484 471
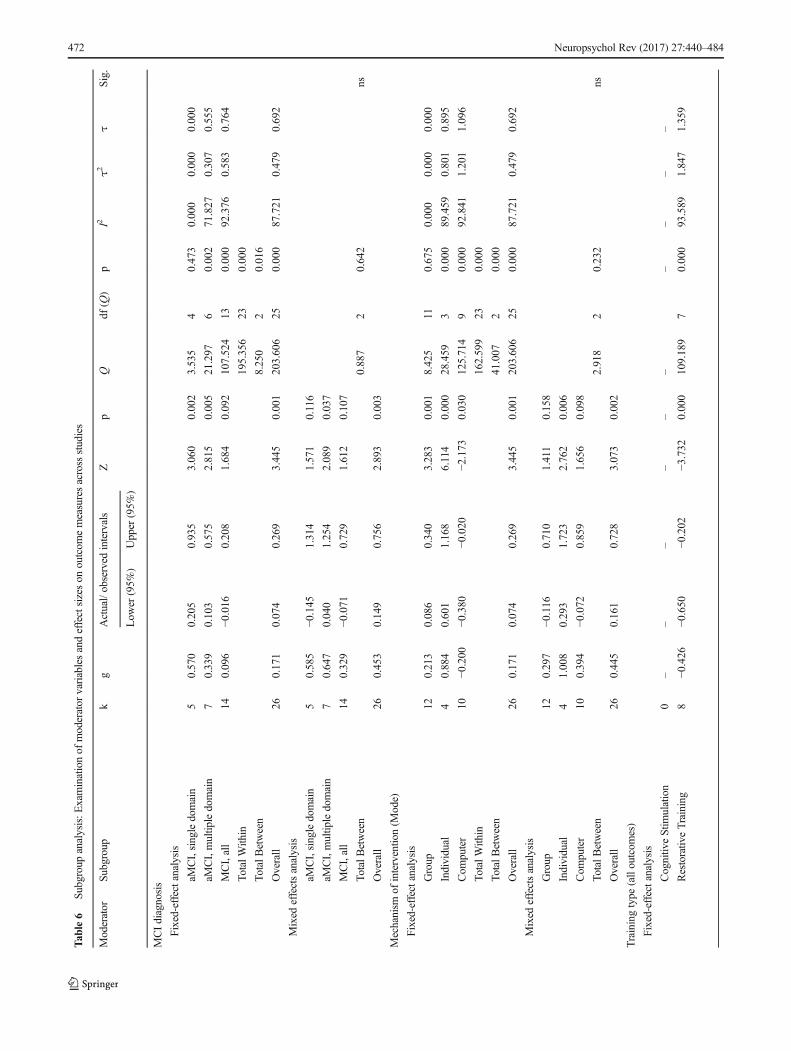
Tab
le6
Subgroup
analysis:E
xaminationof
moderator
variablesandeffectsizeson
outcom
emeasuresacross
studies
Moderator
Subgroup
kg
Actual/observed
intervals
Zp
Qdf
(Q)
pI2
τ2τ
Sig.
Low
er(95%
)Upper
(95%
)
MCIdiagnosis
Fixed-effectanalysis
aMCI,singledomain
50.570
0.205
0.935
3.060
0.002
3.535
40.473
0.000
0.000
0.000
aMCI,multip
ledomain
70.339
0.103
0.575
2.815
0.005
21.297
60.002
71.827
0.307
0.555
MCI,all
140.096
−0.016
0.208
1.684
0.092
107.524
130.000
92.376
0.583
0.764
TotalW
ithin
195.356
230.000
TotalB
etween
8.250
20.016
Overall
260.171
0.074
0.269
3.445
0.001
203.606
250.000
87.721
0.479
0.692
Mixed
effectsanalysis
aMCI,singledomain
50.585
−0.145
1.314
1.571
0.116
aMCI,multip
ledomain
70.647
0.040
1.254
2.089
0.037
MCI,all
140.329
−0.071
0.729
1.612
0.107
TotalB
etween
0.887
20.642
ns
Overall
260.453
0.149
0.756
2.893
0.003
Mechanism
ofinterventio
n(M
ode)
Fixed-effectanalysis
Group
120.213
0.086
0.340
3.283
0.001
8.425
110.675
0.000
0.000
0.000
Individual
40.884
0.601
1.168
6.114
0.000
28.459
30.000
89.459
0.801
0.895
Com
puter
10−0
.200
−0.380
−0.020
−2.173
0.030
125.714
90.000
92.841
1.201
1.096
TotalW
ithin
162.599
230.000
TotalB
etween
41.007
20.000
Overall
260.171
0.074
0.269
3.445
0.001
203.606
250.000
87.721
0.479
0.692
Mixed
effectsanalysis
Group
120.297
−0.116
0.710
1.411
0.158
Individual
41.008
0.293
1.723
2.762
0.006
Com
puter
100.394
−0.072
0.859
1.656
0.098
TotalB
etween
2.918
20.232
ns
Overall
260.445
0.161
0.728
3.073
0.002
Trainingtype
(alloutcom
es)
Fixed-effectanalysis
Cognitiv
eStim
ulation
0–
––
––
––
––
–
Restorativ
eTraining
8−0
.426
−0.650
−0.202
−3.732
0.000
109.189
70.000
93.589
1.847
1.359
472 Neuropsychol Rev (2017) 27:440–484
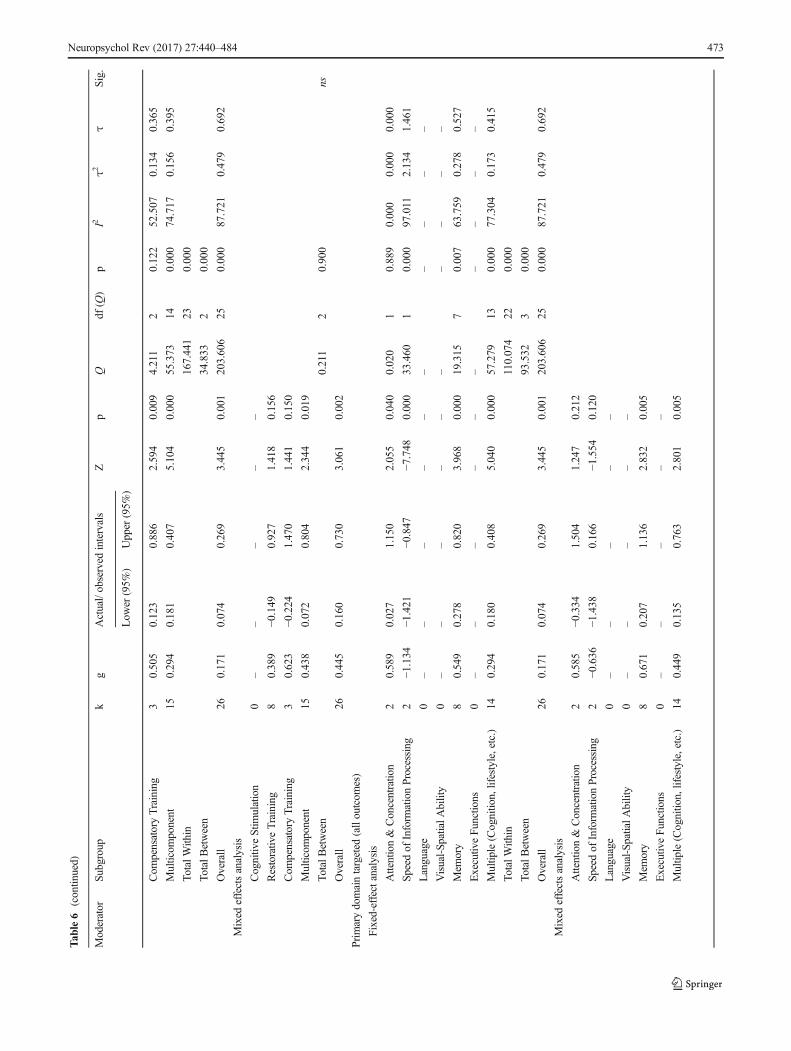
Tab
le6
(contin
ued)
Moderator
Subgroup
kg
Actual/observed
intervals
Zp
Qdf
(Q)
pI2
τ2τ
Sig.
Low
er(95%
)Upper
(95%
)
Com
pensatoryTraining
30.505
0.123
0.886
2.594
0.009
4.211
20.122
52.507
0.134
0.365
Multicom
ponent
150.294
0.181
0.407
5.104
0.000
55.373
140.000
74.717
0.156
0.395
TotalW
ithin
167.441
230.000
TotalB
etween
34.833
20.000
Overall
260.171
0.074
0.269
3.445
0.001
203.606
250.000
87.721
0.479
0.692
Mixed
effectsanalysis
Cognitiv
eStim
ulation
0–
––
––
Restorativ
eTraining
80.389
−0.149
0.927
1.418
0.156
Com
pensatoryTraining
30.623
−0.224
1.470
1.441
0.150
Multicom
ponent
150.438
0.072
0.804
2.344
0.019
TotalB
etween
0.211
20.900
ns
Overall
260.445
0.160
0.730
3.061
0.002
Primarydomaintargeted
(alloutcom
es)
Fixed-effectanalysis
Attention&
Concentratio
n2
0.589
0.027
1.150
2.055
0.040
0.020
10.889
0.000
0.000
0.000
Speedof
Inform
ationProcessing
2−1
.134
−1.421
−0.847
−7.748
0.000
33.460
10.000
97.011
2.134
1.461
Language
0–
––
––
––
––
–
Visual-Sp
atialA
bility
0–
––
––
––
––
–
Mem
ory
80.549
0.278
0.820
3.968
0.000
19.315
70.007
63.759
0.278
0.527
Executiv
eFunctions
0–
––
––
––
––
–
Multip
le(Cognitio
n,lifestyle,etc.)
140.294
0.180
0.408
5.040
0.000
57.279
130.000
77.304
0.173
0.415
TotalW
ithin
110.074
220.000
TotalB
etween
93.532
30.000
Overall
260.171
0.074
0.269
3.445
0.001
203.606
250.000
87.721
0.479
0.692
Mixed
effectsanalysis
Attention&
Concentratio
n2
0.585
−0.334
1.504
1.247
0.212
Speed
ofInform
ationProcessing
2−0
.636
−1.438
0.166
−1.554
0.120
Language
0–
––
––
Visual-Sp
atialA
bility
0–
––
––
Mem
ory
80.671
0.207
1.136
2.832
0.005
Executiv
eFunctions
0–
––
––
Multip
le(Cognitio
n,lifestyle,etc.)
140.449
0.135
0.763
2.801
0.005
Neuropsychol Rev (2017) 27:440–484 473
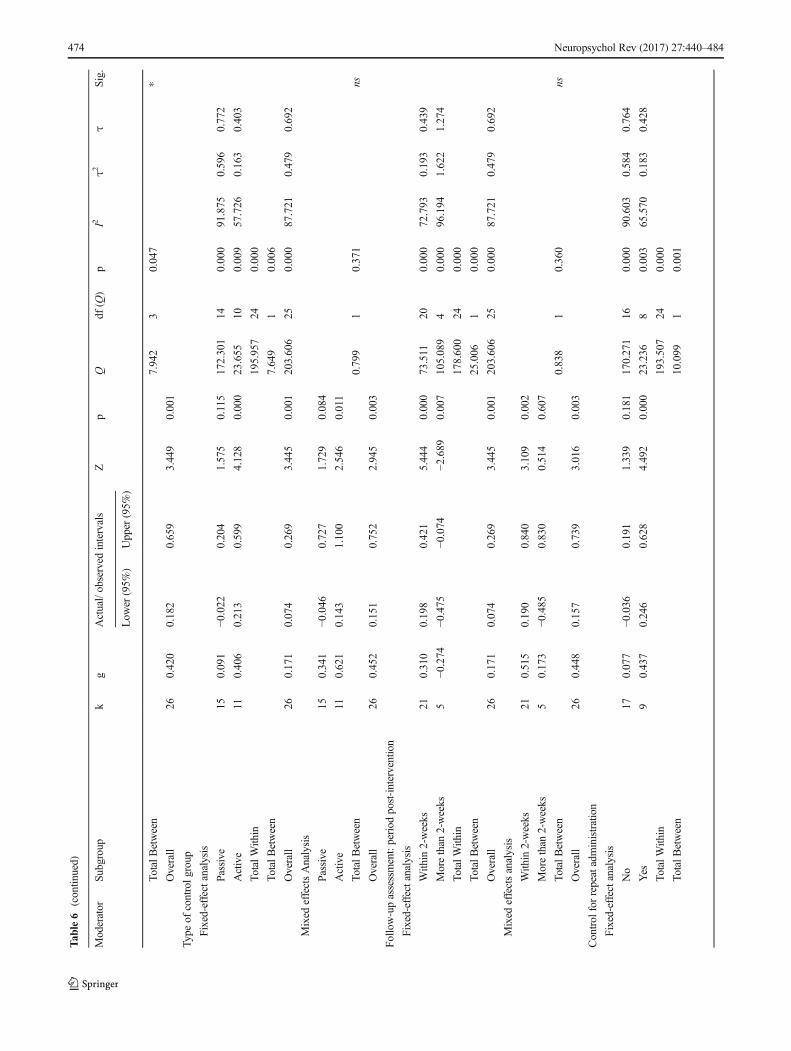
Tab
le6
(contin
ued)
Moderator
Subgroup
kg
Actual/observed
intervals
Zp
Qdf
(Q)
pI2
τ2τ
Sig.
Low
er(95%
)Upper
(95%
)
TotalB
etween
7.942
30.047
*
Overall
260.420
0.182
0.659
3.449
0.001
Type
ofcontrolg
roup
Fixed-effectanalysis
Passive
150.091
−0.022
0.204
1.575
0.115
172.301
140.000
91.875
0.596
0.772
Active
110.406
0.213
0.599
4.128
0.000
23.655
100.009
57.726
0.163
0.403
TotalW
ithin
195.957
240.000
TotalB
etween
7.649
10.006
Overall
260.171
0.074
0.269
3.445
0.001
203.606
250.000
87.721
0.479
0.692
Mixed
effectsAnalysis
Passive
150.341
−0.046
0.727
1.729
0.084
Active
110.621
0.143
1.100
2.546
0.011
TotalB
etween
0.799
10.371
ns
Overall
260.452
0.151
0.752
2.945
0.003
Follo
w-upassessment:period
post-intervention
Fixed-effectanalysis
With
in2-weeks
210.310
0.198
0.421
5.444
0.000
73.511
200.000
72.793
0.193
0.439
Morethan
2-weeks
5−0
.274
−0.475
−0.074
−2.689
0.007
105.089
40.000
96.194
1.622
1.274
TotalW
ithin
178.600
240.000
TotalB
etween
25.006
10.000
Overall
260.171
0.074
0.269
3.445
0.001
203.606
250.000
87.721
0.479
0.692
Mixed
effectsanalysis
With
in2-weeks
210.515
0.190
0.840
3.109
0.002
Morethan
2-weeks
50.173
−0.485
0.830
0.514
0.607
TotalB
etween
0.838
10.360
ns
Overall
260.448
0.157
0.739
3.016
0.003
Control
forrepeatadministration
Fixed-effectanalysis
No
170.077
−0.036
0.191
1.339
0.181
170.271
160.000
90.603
0.584
0.764
Yes
90.437
0.246
0.628
4.492
0.000
23.236
80.003
65.570
0.183
0.428
TotalW
ithin
193.507
240.000
TotalB
etween
10.099
10.001
474 Neuropsychol Rev (2017) 27:440–484
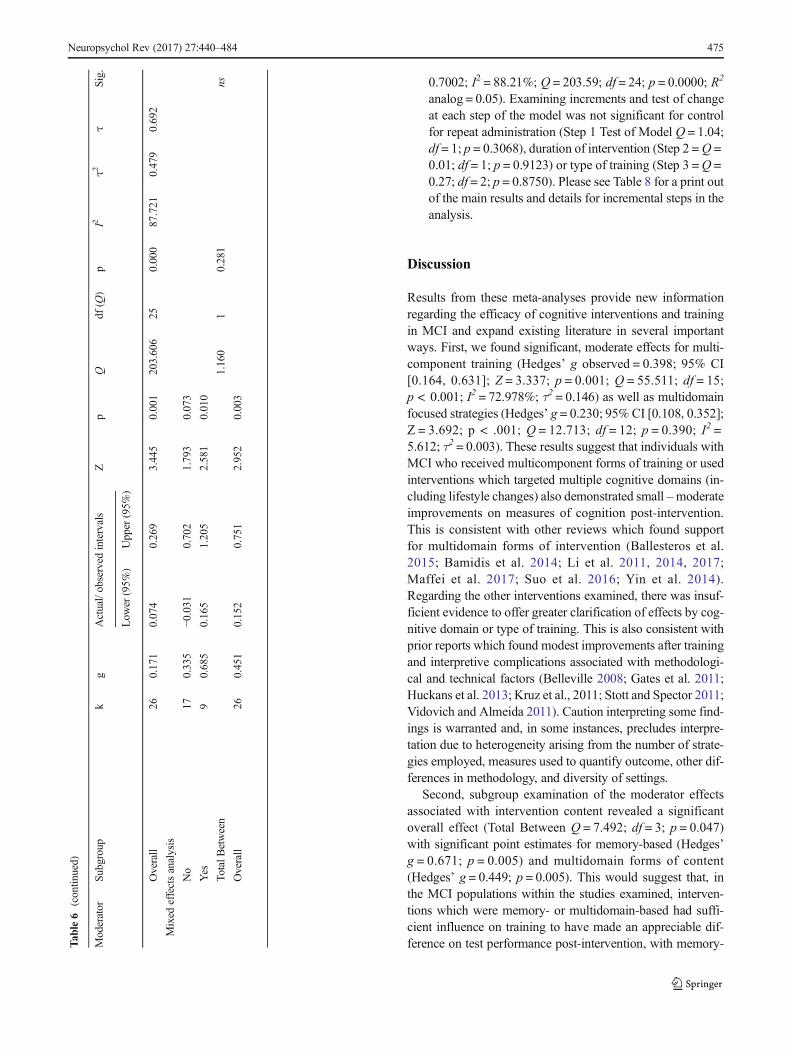
0.7002; I2 = 88.21%; Q = 203.59; df = 24; p = 0.0000; R2
analog = 0.05). Examining increments and test of changeat each step of the model was not significant for controlfor repeat administration (Step 1 Test of Model Q = 1.04;df = 1; p = 0.3068), duration of intervention (Step 2 =Q =0.01; df = 1; p = 0.9123) or type of training (Step 3 =Q =0.27; df = 2; p = 0.8750). Please see Table 8 for a print outof the main results and details for incremental steps in theanalysis.
Discussion
Results from these meta-analyses provide new informationregarding the efficacy of cognitive interventions and trainingin MCI and expand existing literature in several importantways. First, we found significant, moderate effects for multi-component training (Hedges’ g observed = 0.398; 95% CI[0.164, 0.631]; Z = 3.337; p = 0.001; Q = 55.511; df = 15;p < 0.001; I2 = 72.978%; τ2 = 0.146) as well as multidomainfocused strategies (Hedges’ g = 0.230; 95% CI [0.108, 0.352];Z = 3.692; p < .001; Q = 12.713; df = 12; p = 0.390; I2 =5.612; τ2 = 0.003). These results suggest that individuals withMCI who received multicomponent forms of training or usedinterventions which targeted multiple cognitive domains (in-cluding lifestyle changes) also demonstrated small –moderateimprovements on measures of cognition post-intervention.This is consistent with other reviews which found supportfor multidomain forms of intervention (Ballesteros et al.2015; Bamidis et al. 2014; Li et al. 2011, 2014, 2017;Maffei et al. 2017; Suo et al. 2016; Yin et al. 2014).Regarding the other interventions examined, there was insuf-ficient evidence to offer greater clarification of effects by cog-nitive domain or type of training. This is also consistent withprior reports which found modest improvements after trainingand interpretive complications associated with methodologi-cal and technical factors (Belleville 2008; Gates et al. 2011;Huckans et al. 2013; Kruz et al., 2011; Stott and Spector 2011;Vidovich and Almeida 2011). Caution interpreting some find-ings is warranted and, in some instances, precludes interpre-tation due to heterogeneity arising from the number of strate-gies employed, measures used to quantify outcome, other dif-ferences in methodology, and diversity of settings.
Second, subgroup examination of the moderator effectsassociated with intervention content revealed a significantoverall effect (Total Between Q = 7.492; df = 3; p = 0.047)with significant point estimates for memory-based (Hedges’g = 0.671; p = 0.005) and multidomain forms of content(Hedges’ g = 0.449; p = 0.005). This would suggest that, inthe MCI populations within the studies examined, interven-tions which were memory- or multidomain-based had suffi-cient influence on training to have made an appreciable dif-ference on test performance post-intervention, with memory-T
able6
(contin
ued)
Moderator
Subgroup
kg
Actual/observed
intervals
Zp
Qdf
(Q)
pI2
τ2τ
Sig.
Low
er(95%
)Upper
(95%
)
Overall
260.171
0.074
0.269
3.445
0.001
203.606
250.000
87.721
0.479
0.692
Mixed
effectsanalysis
No
170.335
−0.031
0.702
1.793
0.073
Yes
90.685
0.165
1.205
2.581
0.010
TotalB
etween
1.160
10.281
ns
Overall
260.451
0.152
0.751
2.952
0.003
Neuropsychol Rev (2017) 27:440–484 475
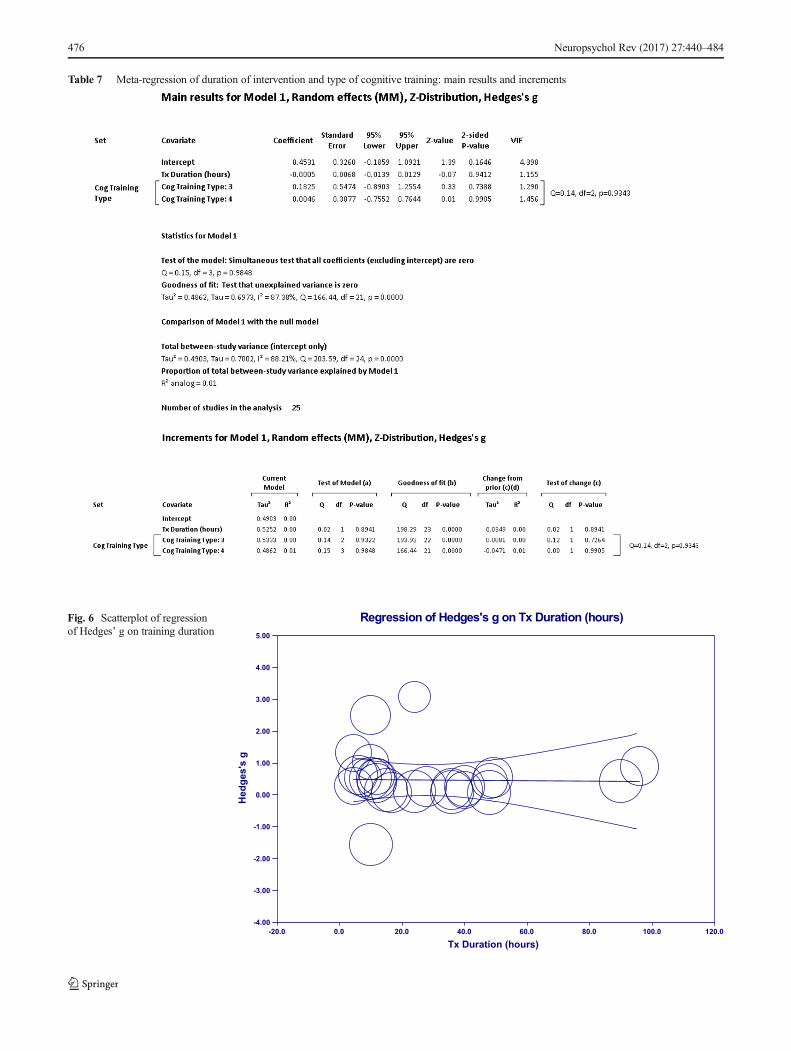
Table 7 Meta-regression of duration of intervention and type of cognitive training: main results and increments
Regression of Hedges's g on Tx Duration (hours)
Tx Duration (hours)-20.0 0.0 20.0 40.0 60.0 80.0 100.0 120.0
Hed
ges'
s g
5.00
4.00
3.00
2.00
1.00
0.00
-1.00
-2.00
-3.00
-4.00
Fig. 6 Scatterplot of regressionof Hedges’ g on training duration
476 Neuropsychol Rev (2017) 27:440–484
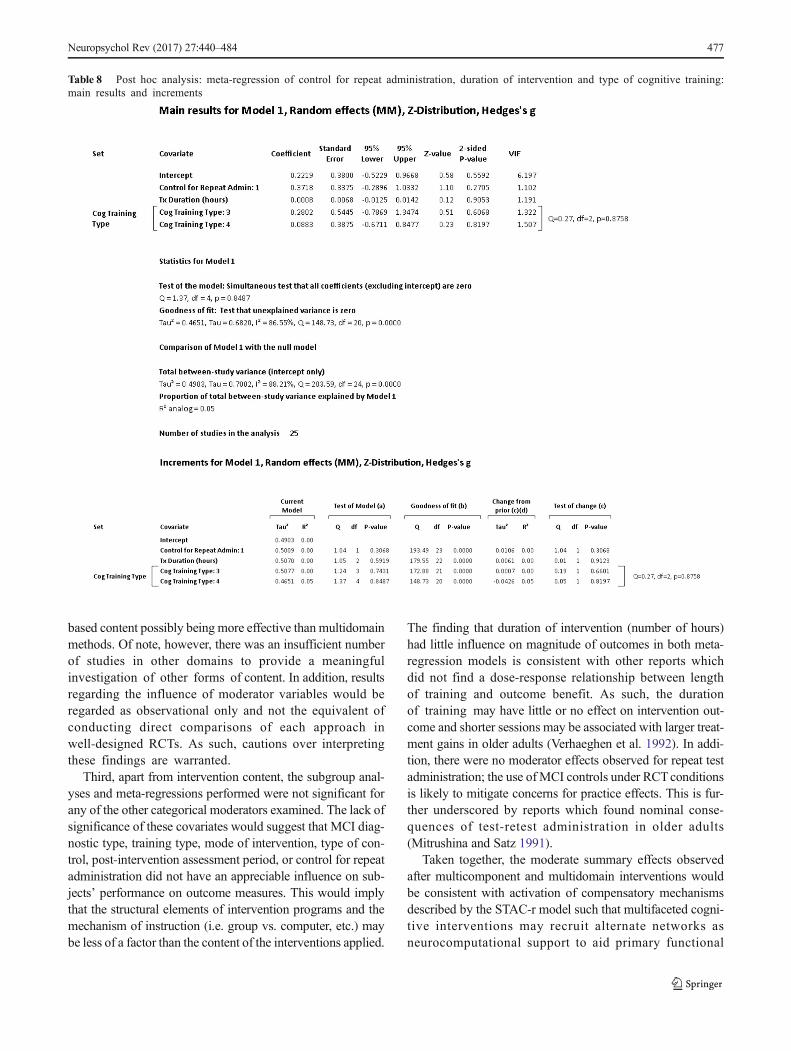
based content possibly being more effective than multidomainmethods. Of note, however, there was an insufficient numberof studies in other domains to provide a meaningfulinvestigation of other forms of content. In addition, resultsregarding the influence of moderator variables would beregarded as observational only and not the equivalent ofconducting direct comparisons of each approach inwell-designed RCTs. As such, cautions over interpretingthese findings are warranted.
Third, apart from intervention content, the subgroup anal-yses and meta-regressions performed were not significant forany of the other categorical moderators examined. The lack ofsignificance of these covariates would suggest that MCI diag-nostic type, training type, mode of intervention, type of con-trol, post-intervention assessment period, or control for repeatadministration did not have an appreciable influence on sub-jects’ performance on outcome measures. This would implythat the structural elements of intervention programs and themechanism of instruction (i.e. group vs. computer, etc.) maybe less of a factor than the content of the interventions applied.
The finding that duration of intervention (number of hours)had little influence on magnitude of outcomes in both meta-regression models is consistent with other reports whichdid not find a dose-response relationship between lengthof training and outcome benefit. As such, the durationof training may have little or no effect on intervention out-come and shorter sessions may be associated with larger treat-ment gains in older adults (Verhaeghen et al. 1992). In addi-tion, there were no moderator effects observed for repeat testadministration; the use ofMCI controls under RCTconditionsis likely to mitigate concerns for practice effects. This is fur-ther underscored by reports which found nominal conse-quences of test-retest administration in older adults(Mitrushina and Satz 1991).
Taken together, the moderate summary effects observedafter multicomponent and multidomain interventions wouldbe consistent with activation of compensatory mechanismsdescribed by the STAC-r model such that multifaceted cogni-tive interventions may recruit alternate networks asneurocomputational support to aid primary functional
Table 8 Post hoc analysis: meta-regression of control for repeat administration, duration of intervention and type of cognitive training:main results and increments
Neuropsychol Rev (2017) 27:440–484 477
networks process load demands (Barban et al. 2017;Ciarmiello et al. 2015; Onur et al. 2016). As such, strategieswhich target both primary functional networks as well as al-ternate pathways simultaneously may be the most efficaciousform of intervention for individuals with MCI. These types ofinterventions may challenge primary and alternate networkstogether, prompting neuroplastic reorganization. However,training results in small to moderate effects due to decreasedfunctionality and efficiency of primary networks and limita-tions of alternate networks to fully compensate processingneeds. The summary effect observed with multicomponentand multidomain forms of intervention may reflect this pro-cess. Individuals with MCI may, by definition, demonstrateless of a benefit from domain-targeted interventions due toloss of neural structure and function and better outcome withmultidomain forms of intervention. While there are a limitednumber of RCT studies which specifically outline theneurocognitive pathways active after cognitive training withneuroimaging tools, this intepretation would be consistentwith increased cerebral blood flow in parahippocampal areasand maintenance of neural efficiency after multicomponenttraining in MCI (Maffei et al. 2017).
Moreover, the positive benefit of strategies with memory-based content may represent some transfer effects to otherdomains. Although the creation of new primary network pathsappears limited in MCI, interventions with memory-basedcontent may facilitate partial activation of neuroplastic reor-ganization and compensatory processes in several areas(Hampstead et al. 2011; Hampstead et al. 2012a; Rosenet al. 2011). The positive benefit of memory-based strategiesmay also be indicative of the complex interrelated pathwaysinvolved in memory (Belleville et al. 2011). While inconclu-sive due to study limitations, the relative absence of significanteffects of training by cognitive domain or domain-specificinterventions in our data may reflect the loss of primary net-work efficiency and limited activation of compensatory mech-anisms. However, this question could not be explored furtherdue to the limited number of studies, the presence of hetero-geneity, and lack of data interpretability regarding other inter-ventions (i.e. restorative training). Similarly, mechanismsreflective of cognitive reserve could not be fully exam-ined due to lack of data (i.e. premorbid IQ, level of educa-tion, etc.). The neurocognitive conclusions drawn from ouranalyses and offered here would be regarded as specu-lative only and require comprehensive examination ofintervention methods with the appropriate neuroimagingtools in well-designed RCTs.
With respect to the specific questions we sought to answer,
1. What were the changes in cognition from baseline to out-come after the intervention was applied? Improvementsin cognition were, generally, observed with multicompo-nent types of training. Benefits were also observed with
multidomain and lifestyle approaches, although this find-ing is qualified due to possibility of bias, inherently largenumber of intervention methods applied, and large num-ber of outcomes examined.
2. What were the common characteristics found to be effec-tive across studies? There was a positive influenceassociated with interventions using memory andmultidomain-lifestyle forms of approaches, as examinedthrough moderator variable and subgroup analyses.
3. What are specific interventions that may be applied toindividuals diagnosed with MCI in the clinical setting?Multicomponent types of cognitive training appear to im-prove performance on cognitive outcomes for individualswith MCI. Significant point estimates in the context ofrelatively low values on bias indicators infer there was apositive benefit from multicomponent training, althoughmoderate heterogeneity due to the range of strategies,number of outcomes and various settings was present.The effects of cognitive stimulation, restorative training,and compensatory training were indeterminate due to het-erogeneity, publication bias and the limited number ofstudies.
4. What are the key structural factors needed to set up aneffective MCI intervention program (e.g. duration, groupformat, etc.)? With the exception of intervention contentnoted above, we found no significant influence for MCIdiagnosis, training type, mode of intervention, type ofcontrol, post-intervention follow-up assessment period,or control for repeat administration on outcome measures.However, these findings should be interpreted with cau-tion and regarded to be observational only as this wouldnot be the equivalent of conducting specific RCT studieswhich directly compare each characteristic of training.
5. What inferences may be made regarding interventionsapplied and the neural processes involved in MCI?Multicomponent and multidomain forms of interventionmay facilitate recruitment of alternate neural processes aswell as supporting primary networks to meet task de-mands simultaneously, resulting in small to moderatetraining effects. Interventions with memory-based ormultidomain forms of content may, specifically, facilitatesome activation of compensatory scaffolding andneuroplastic reorganization, although the creation ofnew primary network paths may be limited due to theneuropathological processes associated with MCI.
Strengths & Limitations
Strengths of this review were to limit study inclusion toRCTs with individuals who met strict MCI diagnosticguidelines and to have measured cognitive performancewith well-established standard neuropsychological
478 Neuropsychol Rev (2017) 27:440–484
instruments. Improvements in establishing clearer diag-nostic criteria for the types of MCI and implementingthis into RCTs has contributed significantly to under-standing effects of cognitive training in MCI. In addi-tion, the increased number of RCTs in MCI conductedover the past several years lends credence to the con-clusions drawn. To our knowledge, this is the largestreview of RCTs in MCI with MCI controls to date(k = 26), 92% of studies examined were published withinthe past seven years. The number of countries represented(n = 11) including a multicenter group of nations was alsoregarded as a strength, although the technical factorsassociated with this level of diversity also represents achallenge.
The limitations of this study are similar to other meta-analyses in MCI. There were generally small sample sizes, arange of interventions employed, diversity of sites, heteroge-neity, publication bias and, while greatly improved in ourview, a diverse number of instruments used to measure out-come. As such, there was insufficient data to conduct a com-plete evaluation of all interventions applied. Of greatest con-cern were the limited number of studies in individual cells,various interventions (some overlapping), types of training,heterogeneous number of outcomes (low precision), and mod-est number of active controls. A substantial amount of hetero-geneity may have occurred secondary to the number of set-tings and variability in measurement precision. The studiesexamined were conducted across multiple countries with in-struments which appeared to be similar, prima facie, but mayhave substantially differed in their psychometric properties.Evidence of this may be seen in effects of interventions onlanguage, some heterogeneity was observed with an almostexclusive use of one measure of semantic fluency acrossstudies.
Other limitations include the small number of studiesin each diagnostic category, absence of measurementof premorbid IQ, unknown date of illness onset or char-acter of course, minimal use of measures of adherence,and design variation between studies (Hampstead et al.2014). The limited number of studies in each diagnosticcategory is problematic as MCI subtypes may demon-strate distinct connectivity patterns (Jacquemont et al.2017). Improved characterization of various factors asso-ciated with baseline status and other covariates would alsohave aided comparability across studies. This has impli-cations for our findings and a potential confound, theshifting deficits across illness and the progressive natureof MCI may require ‘evolving-strategies’which complementand keep pace with patient cognitive decline to demonstrate aclinical benefit. Additionally, the lack of a unified method ofreporting data and clear structure to communicate this infor-mation hinders accessibility to the results provided in pub-lished works.
Neuropsychol Rev (2017) 27:440–484 479
In summary, findings from these meta-analyses suggestindividuals with MCI who received multicomponent formsof training or used interventions which targeted multiple cog-nitive domains (including lifestyle changes) also demonstrat-ed small to moderate improvements in cognition post-inter-vention. As such, multicomponent and multidomain forms ofintervention may prompt recruitment of alternate neural pro-cesses as well as support primary networks to meet task de-mands simultaneously. In addition, interventions with memo-ry and multidomain forms of content appear to be particularlyhelpful, with memory-based approaches possibly being moreeffective than multidomain methods. Otherwise, the effects ofinterventions by cognitive domain, training type, or othertargeted domains (content) did not achieve statistical signifi-cance or were not significant. Given this pattern of results,although the creation of new primary network paths may belimited in MCI, interventions with memory or multidomainforms of content may facilitate partial activation of compensa-tory scaffolding and neuroplastic reorganization. The positivebenefit of memory-based strategies may also reflect transfereffects indicative of compensatory network activation and themultiple-pathways involved in memory processes. Cautionsinterpreting these findings is warranted, however, due to het-erogeneity, probability of publication bias, and small number ofstudies across cognitive domains. Significant amounts of vari-ability and bias were present precluding more a definitive in-terpretation of the outcomes observed.
Funding No funding was provided for this meta-analysis. This reviewwas conducted independently by the authors.
Compliance with Ethical Standards
Disclosures None
Open Access This article is distributed under the terms of the CreativeCommons At t r ibut ion 4 .0 In te rna t ional License (h t tp : / /creativecommons.org/licenses/by/4.0/), which permits unrestricted use,distribution, and reproduction in any medium, provided you giveappropriate credit to the original author(s) and the source, provide a linkto the Creative Commons license, and indicate if changes were made.
References
Albert, M. S., Dekosky, S. T., Dickson, D., Dubois, B., Feldman, H. H.,Fox, N. C., et al. (2011). The diagnosis of mild cognitive impairmentdue to Alzheimer’s disease: Recommendations from the nationalinstitute on aging-alzheimer’s association workgroups on diagnosticguidelines of Alzheimer’s disease. Alzheimers & Dementia., 7(3),270–279. https://doi.org/10.1016/j.jalz.2011.03.008.
Bahar-Fuchs, A, Clare, L., & Woods, B. (2013). Cognitive training andcognitive rehabilitation for mild to moderate Alzheimer’s diseaseand vascular dementia. Cochrane Database of Systematic Reviews,Issue 6. Art. No.: CD003260. https://doi.org/10.1002/14651858.CD003260.pub2
Balietti, M., Giuli, C., Fattoretti, P., Fabbietti, P., Postacchini, D., &Conti, F. (2016). Cognitive stimulation modulated platelet totalphospholipases A2 activity in subjects with mild cognitive
480 Neuropsychol Rev (2017) 27:440–484
impairment. Journal of Alzheimer’s Disease, 50(4), 957–962.https://doi.org/10.3233/JAD-150714.
Ballesteros, S., Kraft, E., Santana, S., & Tziraki, C. (2015). Maintainingolder brain functionality: A targeted review. Neuroscience andBehavioral Reviews, 55, 452–477.
Bamidis, P. D., Vivas, A. B., Styiadid, C., Frantzidis, C., Klados, M.,Schlee, W., et al. (2014). A review of physical and cognitive inter-ventions in aging. Neuroscience and Biobehavioral Reviews, 44,206–220. https://doi.org/10.1016/j.neubiorev.2014.03.019.
Barban, R., Annicchiarico, R., Pantelopoulos, S., Federici, A.,Perri, R., Fadda, L., et al. (2016). Protecting cognition fromaging and Alzheimer’s disease: A computerized cognitivetraining combined with reminiscence therapy. InternationalJournal of Geriatric Psychiatry, 31(4), 340–348. https://doi.org/10.1002/gps.4328.
Barban, F., Mancini, M., Cercignani, M., Adriano, F., Perri, R.,Annicchiarico, R., et al. (2017). A pilot study on brain plas-ticity of functional connectivity modulated by cognitive train-ing in mild Alzheimer’s disease and mild cognitive impair-ment. Brain Sciences, 7(5), 50. https://doi.org/10.3390/brainsci7050050.
Barnes, D. E., Yaffe, K., Belfor, N., Jagust, W. J., DeCarli, C., Reed, B.R., et al. (2009). Computer-based cognitive training for mild cogni-tive impairment: Results form a pilot randomized, controlled trial.Alzheimer’s Disease & Associated Disorders, 23(3), 205–210.https://doi.org/10.1097/WAD.0b013e31819c6137.
Belleville, S. (2008). Cognitive training for persons with mildcognitive impairment. International Psychogeriatrics, 20(1),57–66. https://doi.org/10.1017/S104161020700631X.
Belleville, S., Clement, F., Mellah, S., Gilbert, B., Fontaine, F., &Gauthier, S. (2011). Training-related brain plasticity in subjects atrisk of developing Alzhiemer’s disease. Brain, 134(6), 1623–1634.https://doi.org/10.1093/brain/awr037.
Borenstein, M., & Higgins, J. P. (2013). Meta-analysis and subgroups.Prevention Science, 14(2), 134–143. https://doi.org/10.1007/s11121-013-0377-7.
Borenstein, M., Hedges, L. V., Higgins, J. P. T., & Rothstein, H. R.(2009). Introduction to meta-analysis. West Sussex: John Wiley &Sons. https://doi.org/10.1002/9780470743386.
Borenstein, M., Higgins, J. P. T., Hedges, L. V., & Rothstein, H.R. (2016). Basics of meta-analysis: I2 is not an absolutemeasure of heterogeneity. Research Synthesis Methods.,8(1), 5–18. https://doi.org/10.1002/jrsm.1230.
Buschert, V. C., Friese, E., Teipel, S. J., Schneider, P., Merensky, W.,Rujescu, D., et al. (2011). Effects of a newly developed cognitiveintervention in amnestic mild cognitive impairment and mildAlzheimer’s disease: A pilot study. Journal of Alzheimer’s Disease,25(4), 679–694. https://doi.org/10.3233/JAD-2011-100999.
Cabeza, R. (2002). Hemispheric asymmetry reduction in older adults:The HAROLD model. Psychology and Aging, 17(1), 85–100
Cabeza, R., Nyberg, L., & Park, D.C. (Eds.). (2017). Cognitive neurosci-ence of aging: Linking cognitive and cerebral aging, Second Edition.New York: Oxford University Press.
Cai, Y., & Abrahamson, K. (2016). How exercise influences cognitiveperformance when mild cognitive impairment exists – A literaturereview. Journal of Psychosocial Medicine, 54(1), 25–35.
Carretti, B., Borella, E., Fostinelli, S., & Zavagnin, M. (2013). Benefits oftraining working memory in amnestic mild cognitive impairment:Specific and transfer effects. International Psychogeriatrics, 25(4),617–626. https://doi.org/10.1017/S1041610212002177.
Ciarmiello, A., Gaeta, M. C., Benso, F., & Del Sette, M. (2015). FDG-PETin the evaluation of brain metabolic changes induced by cognitivestimulation in aMCI subjects. Current Radiopharmaceuticals, 8(1),69–75. https://doi.org/10.2174/1874471008666150428122924.
Cohen, J. (1988). Statistical power analysis for the behavioral sciences,Second Edition. New York: Lawrence Earlbaum.
Coyle, H., Traynor, V., & Solowij, N. (2015). Computerized and virtualreality cognitive training for individuals at high risk of cognitive decline:Systematic review of the literature. American Journal of GeriatricPsychiatry, 23(4), 335–359. https://doi.org/10.1016/j.jagp.2014.04.009.
Craik, F. I.M.,Winocur, G., Palmer, H., Binns,M.A., Edwards,M., Bridges,K., et al. (2007). Cognitive rehabilitation in the elderly: Effects onmemory. Journal of the International Neuropsychological Society,13(1), 132–142. https://doi.org/10.1017/S1355617707070166.
Curlik, D. M., & Shors, T. J. (2013). Training your brain: Do mental andphysical (MAP) training enhance cognition through the process ofneurogenesis in the hippocampus? Neuropharmacology, 64, 506–514. https://doi.org/10.1016/j.neuropharm.2012.07.027.
Davey, J., Turner, R. M., Clarke, M. J., & Higgins, J. P. T. (2011).Characteristics of meta-analyses and their component studies in theCochrane database of systematic reviews: A cross-sectional, descrip-tive analysis. BMC Medical Research Methodology, 11(160), 1–11.
Davis, S. W., Dennis, N. A., Daselaar, S. M., Fleck, M. S., & Cabeza, R.(2008). Que PASA? The posterior-anterior shift in aging. CerebralCortex, 18(5), 1201–1209. https://doi.org/10.1093/cercor/bhm155.
De Marco, M., Meneghello, F., Duzzi, D., Rigon, J., Pilosio, C., &Venneri, A. (2016). Cognitive stimulation of the default-modenetwork modulates functional connectivity in healthy aging.Brain Research Bulletin, 121, 26–41. https://doi.org/10.1016/j.brainresbull.2015.12.001.
Demakis, G. J. (2006). Meta-analysis in neuropsychology: Basic ap-proaches, findings and applications. The Clinical Neuropsychologist,20(1), 10–26. https://doi.org/10.1080/13854040500203282.
DerSimonian, R., & Laird, N. (1986). Meta-analysis in clinical trials.Controlled Clinical Trials, 7(3), 177–188. https://doi.org/10.1016/0197-2456(86)90046-2.
Durlack, J. A. (2009). How to select, calculate, and interpret effect sizes.Journal of Pediatric Psychology, 34(9), 917–928. https://doi.org/10.1093/jpepsy/jsp004.
Duval, S., & Tweedie, R. (2000). Trim and fill: A simple funnel-plot-based method of testing and adjusting for publication bias in meta-analysis. Biometrics, 56(2), 455–463. https://doi.org/10.1111/j.0006-341X.2000.00455.x.
Egger, M., Smith, G. D., Schneider, M., &Minder, C. (1997). Bias in meta-analysis detected by a simple, graphical test. British Medical Journal,315(7109), 629–634. https://doi.org/10.1136/bmj.315.7109.629.
Ellis, K. A., Bush, A. I., Darby, D., DeFazio, D., Foster, J., Hudson, P.,et al. (2009). The Australian imaging, biomarkers and lifestyle(AIBL) study of aging: Methodology and baseline characteristicsof 1112 individuals recruited for a longitudinal study ofAlzheimer’s disease. International Psychogeriatrics, 21(4), 672–687. https://doi.org/10.1017/S1041610209009405.
Ellis, K. A., Rowe, C. C., Villemagne, V. L., Martins, R. N., Masters, C.L., Salvado, O., & Ames, D. (2010). Addressing population agingand Alzheimer’s disease through the Australian imaging biomarkersand lifestyle study: Collaboration with the Alzheimer’s DiseaseNeuroimaging Initiative. Alzheimer’s & Dementia, 6(3), 291–296.https://doi.org/10.1016/j.jalz.2010.03.009.
Faucounau, V., Wu, Y.-H., Boulay, M., DeRotrou, J., & Rigaud, A. S.(2010). Cognitive intervention programs on patients affected bymild cognitive impairment: Promising intervention tool forMCI? The Journal of Nutrition, Health & Aging, 14(1),31–35. https://doi.org/10.1007/s12603-010-0006-0.
Fiatarone Singh, M. A., Gates, N., Saigal, N., Wilson, G. C., Meiklejohn,J., Brodaty, H., et al. (2014). The study of mental and resistancetraining (SMART) study – Resistance training and/ or cognitivetraining in mild cognitive impairment: A randomized, double-blind,double-sham controlled trial. Journal of the American MedicalDirectors (JAMDA), 15(12), 873–880. https://doi.org/10.1016/j.jamda.2014.09.010.
Fillenbaum, G. G., van Belle, G., Morris, J. C., Mohs, R. C., Mirra, S. S.,Davis, P. D., et al. (2008). CERAD (consortium to establish a
Neuropsychol Rev (2017) 27:440–484 481
registry for Alzheimer’s disease): The first 20 years. Alzheimer’s &Dementia, 4(2), 96–109. https://doi.org/10.1016/j.jalz.2007.08.005.
Finn, M., & McDonald, S. (2011). Computerised cognitive training forolder persons with mild cognitive impairment: A pilot study using arandomized controlled trial design. Brain Impairment, 12(3), 187–199. https://doi.org/10.1375/brim.12.3.187.
Finn, M., & McDonald, S. (2015). Repetition-lag training to im-prove recollection memory in older people with amnesticmild cognitive impairment. A randomized controlled trial.Aging, Neuropsychology, and Cognition, 22(2), 244–258.https://doi.org/10.1080/13825585.2014.915918.
Forster, S., Buschert, V. C., Teipel, S. J., Friese, U., & Bucholz,H. G. (2011). Effects of a 6-month cognitive intervention onbrain metabolism in patients with amnestic MCI and mildAlzheimer’s disease. Journal of Alzheimer’s Disease, 26,337–348. https://doi.org/10.3233/JAD-2011-0025.
Fu, R., Gartlehner, G., Grant, M., Shamliyan, T., Sedrakyan, A.,Wilt, TJ.,... Trikalinos, T.A. (2010). Conducting quantitative synthesis whencomparing medical interventions: AHRQ and the effectivehealth care program. Agency for Healthcare Research andQuality. Methods Guide for Comparative EffectivenessReviews [posted October 2010]. Rockville, MD. Availableat: http://effectivehealthcare.ahrq.gov/.
Gagnon, J. G., & Belleville, S. (2012). Training of attentional control inmild cognitive impairment with executive deficits: Results from adouble-blind randomized controlled study. NeuropsychologicalRehabilitation, 22(6), 809–835. https://doi.org/10.1080/09602011.2012.691044.
Gates, N., & March, E. G. (2016). A neuropsychologist’s guide to under-taking a systematic review for publication: Making the most of thePRISMA guidelines. Neuropsychology Review, 26(2), 109–120.https://doi.org/10.1007/s11065-016-9318-0.
Gates, N., & Valenzuela, M. (2010). Cognitive exercise and its role incognitive function in older adults. Current Psychiatry Reports,12(1), 20–27. https://doi.org/10.1007/s11920-009-0085-y.
Gates, N. J., Sachdev, P. S., Singh, M. A. F., & Valenzuela, M. (2011).Cognitive and memory training in adults at risk of dementia:A systematic review. Biomedcentral Geriatrics, 11(1), 55.https://doi.org/10.1186/1471-2318-11-55.
Giuli, C., Papa, R., Lattanzio, F., & Postacchini, D. (2016). Theeffects of cognitive training for elderly: Results from MyMind Project. Rejuvenation Research, 19(6), 485–494.https://doi.org/10.1089/rej.2015.1791.
Greenaway, M. C., Duncan, N. L., & Smith, G. E. (2012). The memorysupport system for mild cognitive impairment: Randomized trial of acognitive rehabilitation intervention. Geriatric Psychiatry, 28(4),402–409. https://doi.org/10.1002/gps.3838.
Hall, C. B., Lipton, R. B., Silwinski, M., Katz, M. J., Derby, C. A., &Verghese, J. (2009). Cognitive activities delay onset of memorydecline in persons who develop dementia. Neurology, 73(5), 356–361. https://doi.org/10.1212/WNL.0b013e3181b04ae3.
Hampstead, B. M., Stringer, A. Y., Stilla, R. F., Deshpande, G., Hu, X.,Moore, A. B., & Sathian, K. (2011). Activation of effective connec-tivity changes following explicit-memory training for face-name pairs in patients with mild cognitive impairment: Apilot study. Neurorehabilitation and Neural Repair, 25(3),210–222. https://doi.org/10.1177/1545968310382424.
Hampstead, B. M., Sathian, K., Phillips, P. A., Ameraneni, A., Delaune,W. R., & Stringer, A. Y. (2012a). Mnemonic strategy training im-proves memory for object location associations in both healthy el-derly and patients with amnestic mild cognitive impairment – Arandomized, single blinded study. Neuropsychology, 26(3), 385–399. https://doi.org/10.1037/a0027545.
Hampstead, B. M., Stringer, A. Y., Stilla, R. F., Giddens, M.,& Sathian, K. (2012b). Mnemonic strategy training partial-ly restores hippocampal activity in patients with mild
cognitive impairment. Hippocampus, 22(8), 1652–1658.https://doi.org/10.1002/hipo.22006.
Hampstead, B. M., Gillis, M. M., & Stringer, A. Y. (2014). Cognitiverehabilitation of memory of mild cognitive impairment: A method-ological review and model for future research. Journal of theInternational Neuropsychological Society, 20(02), 135–151.https://doi.org/10.1017/S1355617713001306.
Han, S. D., Nguyen, C. P., Stricker, N. H., & Nation, D. A. (2017).Detectable neuropsychological differences in early preclinicalAlzheimer’s disease – A meta-analysis. Neuropsychology Review.https://doi.org/10.1007/s11065-017-9345-5.
Herholz, S. C., Herholz, R. S., & Herholz, K. (2013). Non-pharmacological interventions and neuroplasticity in early stageAlzheimer’s disease. Expert Reviews Neurotherapeutics, 13(11),1235–1245. https://doi.org/10.1586/14737175.2013.845086.
Herrera, C., Chambon, C., Michel, B. F., Paban, V., & Alescio-Lautier, B.(2012). Positive effects of computer-based cognitive training in adultswith mild cognitive impairment. Neuropsychologia, 50(8), 1871–1881. https://doi.org/10.1016/j.neuropsychologia.2012.04.012.
Higgins, J. P. T. (2008). Commentary: Heterogeneity in meta-analysisshould be expected and appropriately quantified. InternationalJournal of Epidemiology, 37(5), 1158–1160. https://doi.org/10.1093/ije/dyn204.
Higgins, J. P. T., Thomson, S. G., Deeks, J. J., & Altman, D. G. (2003).Measuring inconsistency in meta-analyses. British Medical Journal,327(7414), 557–560. https://doi.org/10.1136/bmj.327.7414.557.
Hill, M. T. M., Mowszowski, L., Naismith, S. L., Chadwick, V. L.,Valenzuela, M., & Lampit, A. (2017). Computerized cognitive train-ing in older adults with mild cognitive impairment or dementia: Asystematic review and meta-analysis. American Journal ofPsychiatry, 174(4), 329–340. https://doi.org/10.1176/appi.ajp.2016.16030360.
Hong, Y. J., Jang, E. H., Hwang, J., Roh, J. H., & Lee, J. H. (2015).The efficacy of cognitive intervention programs for mild cogni-tive impairment. Current Alzheimer Research, 12(6), 527–542.https://doi.org/10.2174/1567205012666150530201636.
Hosseini, S. M. H., Kramer, J. H., & Kesler, S. R. (2014). Neural corre-lates of cognitive intervention in persons at risk of developingAlzheimer’s disease. Frontiers in Aging Neuroscience, 6.https://doi.org/10.3389/fnagi.2014.00231.
Huckans, M., Hutson, L., Twamley, E., Jak, A., Kaye, J., &Storzbach, D. (2013). Efficacy of cognitive rehabilitationtherapies for mild cognitive impairment (MCI) in olderadults: Working toward a theoretical model and evidence-based interventions. Neuropsychology Review, 23(1), 63–80.https://doi.org/10.1007/s11065-013-9230-9.
Ibanez, A., Richly, P., Roca, M., & Manes, F. (2014). Methodologicalconsiderations regarding cognitive interventions in dementia.Frontiers in Aging Neuroscience, 6, 212. https://doi.org/10.3389/fnag.2014.00212.
IntHout, J., Ioannidis, J. P. A., & Born, G. F. (2014). The Hartung-Knapp-Sidik-Jonkman method for random effects meta-analysis is straight-forward and considerably outperforms the standard DerSimonian-Laird method. BMC Medical Research Methodology, 14(1), 25.https://doi.org/10.1186/1471-2288-14-25.
Jacquemont, T., Fallani, F. D. V., Bertrand, A., Epelbaum, S., Routier, A.,Dubois, B., et al. (2017). Amyloidosis and neurodegeneration resultin distinct structural connectivity patterns in mild cognitive impair-ment. Neurobiology of Aging, 55, 177–189. https://doi.org/10.1016/j.neurobiolaging.2017.03.023.
Jean, L., Simard, M., Wiederkehr, S., Bergeron, M. E., Turgeon,Y., Hudon, C., et al. (2010a). Efficacy of a cognitive trainingprogram for mild cognitive impairment: Results of a random-ized controlled study. Neuropsychological Rehabilitation: AnInternational Journal, 20(3), 377–405. https://doi.org/10.1080/09602010903343012.
482 Neuropsychol Rev (2017) 27:440–484
Jean, L., Bergeron,M. E., Thivierge, S., & Simard,M. (2010b). Cognitiveintervention programs for individuals with mild cognitive impair-ment: Systematic review of the literature. American Journal ofGeriatric Psychiatry, 18(4), 281–296. https://doi.org/10.1097/JGP.0b013e3181c37ce9.
Jeong, J. H., Na, H. R., Choi, S. H., Kim, J., Na, D. K., Seo, S. W.,et al. (2016). Group- and home-based cognitive interventionfor patients with mild cognitive impairment: A randomizedcontrolled trial. Psychotherapy and Psychosomatics, 85(4),198–207. https://doi.org/10.1159/000442261.
Kim, E.Y. & Kim, K.W. (2014). A theoretical framework for cognitiveand non-cognitive interventions for older adults: Stimulation versuscompensation. Aging & Mental Health, 18(3), 304–315.
Kinsella, G. J., Mullaly, E., Rand, E., Ong, B., Burton, C., Price, S., et al.(2009). Early intervention for mild cognitive impairment: A random-ized controlled trial. Journal of Neurology, Neurosurgery, andPsychiatry, 80(7), 730–736. https://doi.org/10.1136/jnnp.2008.148346.
Kivipelto, M., Solomon, A., Ahtiluoto, S., Ngandu, T., Lehtisalo, J.,Antikainen, et al. (2013). The finnish geriatric intervention studyto prevent cognitive impairment and disability (FINGER): Studydesign and progress. Alzheimer’s & Dementia, 9(6), 657–665.https://doi.org/10.1016/j.jalz.2012.09.012.
Kontopantelis, E., & Reeves, D. (2009). Meta Easy: Ameta-analysis add-in for Microsoft excel. Journal of Statistical Software, 30(7), 1–25.
Kontopantelis, E., & Reeves, D. (2010). Performance of statisticalmethods for meta-analysis when true study effects are non-normally distributed: A simulation study. Statistical Methods inMedical Research, 21(4), 409–426. https://doi.org/10.1177/0962280210392008.
Kurz, A. F., Leucht, S., & Lautenschlager, N. T. (2011). The clinicalsignificance of cognition-focused interventions for cognitively im-paired older adults: A systematic review of controlled clinical trials.International Psychogeriatrics, 23(9), 1364–1375. https://doi.org/10.1017/S1041610211001001.
Lam, L. C., Chan, W. C., Leung, T., Fung, A., & Leung, E. M. (2015).Would older adults with mild cognitive impairment adhere to anbenefit from a structured lifestyle activity intervention to enhancecognition?: A cluster randomized controlled trial. PLoS One, 10(3),e0118173. https://doi.org/10.1371/journal.
Lehert, P., Villaseca, P., Hogervorst, E., Maki, P. M., & Henderson,V. W. (2015). Individually modifiable risk factors to amelioratecognitive aging: A systematic review and meta-analysis.International Menopausal Society: Climacteric, 18(5), 678–689.https://doi.org/10.3109/13697137.2015.1078106.
Li, H., Li, J., Li, N., Li, B., Wang, P., & Zhou, T. (2011). Cognitiveintervention for persons with mild cognitive impairment: A meta-analysis. Ageing Research Reviews, 10(2), 285–296. https://doi.org/10.1016/j.arr.2010.11.003.
Li, R., Zhu, Z., Yin, S., Niu, Y., Zheung, Z., Huang, X., et al. (2014).Multimodal intervention in older adults improves resting-state func-tional connectivity between the medial prefrontal cortex and medialtemporal lobe. Frontiers in Aging Neuroscience, 6. https://doi.org/10.3389/fnagi.2014.00039.
Li, B. Y., Wang, Y., Tang, H. D., & Chen, S. D. (2017). The role ofcognitive activity in cognition protection: From bedside to bench.Translational Neurodegeneration, 6(1), 7. https://doi.org/10.1186/s40035-017-0078-4.
Maffei, L., Picano, E., Andreassi, M. G., Angelucci, A., Baldacci, F.,Baroncelli, L., et al. (2017). Randomized trial of the effects of acombined physical/cognitive training in aged MCI subjects: Thetrain the brain study. Scientific Reports, 7, 39471. https://doi.org/10.1038/srep39471.
Mahncke, H. W., Connor, B. B., Appelman, J., Ahsanuddin, O. N.,Hardy, J. L., Wood, R. A., et al. (2006). Memory enhancement inhealthy older adults using a brain plasticity-based training program:A randomized, controlled study. Proceedings of the National
Academy of Sciences, 103(33), 12523–12528. https://doi.org/10.1073/pnas.0605194103.
Martin, M., Clare, L. Altgassen, A.M., Cameron, M.H., & Zehnder, F.(2011). Cognition-based interventions for healthy people and peoplewith mild cognitive impairment. Intervention Review. CochraneDatabase of Systematic Reviews, Issue 1, Art. No. CD006220.10.1002.14651858.CD006220.pub2.
Matias-Guiu, J. A., Cabrera-Martin, M. N., Valles-Salgado, M., Perez-Perez, A., Rognoni, T., Moreno-Ramos, R., et al. (2017). Neuralbasis of cognitive assessment in Alzheimer disease, amnesticmild cognitive impairment, and subjective memory com-plaints. American Journal of Geriatric Psychiatry, 25(7),730–740. https://doi.org/10.1016/j.jagp.2017.02.002.
Mitchell, A. J. (2009). A meta-analysis of the accuracy of themini-mental status examination in the detection of dementiaand mild cognitive impairment. Journal of PsychiatricResearch, 43 (4) , 411–431. https:/ /doi.org/10.1016/j .jpsychires.2008.04.014.
Mitrushina, M., & Satz, P. (1991). Effect of repeated administration of aneuropsychological battery in the elderly. Journal of ClinicalPsychology, 47(6), 790–801. https://doi.org/10.1002/1097-4679(199111)47:6<790::AID-JCLP2270470610>3.0.CO;2-C.
Moher, D., Liberati, A., Tetzlaff, J., & Altman, D. G. (2009). Preferredreporting items for systematic reviews and meta-analysis: ThePRISMA statement, the PRISMA GROUP. PLoS Medicine, 6(6),e1000097. https://doi.org/10.1371/journal/pmed 1000097.
Mowszowski, L., Hermens, D. F., Diamond, K., Norrie, L., Cockayne,N., et al. (2014). Cognitive training enhances pre-attentive neuro-physiological responses in older adults ‘at risk’ of dementia. Journalof Alzheimer’s Disease, 41(4), 1095–1108. https://doi.org/10.3233/JAD-131985.
NIH Quality of Assessment of Controlled Intervention Studies Scale(2017). Retreived from https://www.nhlbi.nih.gov/health-pro/guidelines/in-develop/cardiovascular-risk-reduction/tools/rct.
Olchik, M. R., Farina, J., Steibel, N., Teixeira, A. R., & Yassuda, M. S.(2013). Memory training (MT) in mild cognitive impairment (MCI)generates change in cognitive performance. Archives of Geriatrics,56, 442–447.
Onur, O.A., Kukolja, J., Nolfo, N., Schlegel, M., Kaesberg, S.,Kessler, J., ... Kalbe, E., (2016). Cognitive training fosterscompensatory mechanisms in MCI. Alzheimer’s & Dementia,12(7), Supplement, P420.
Park, D.C. & Festini, S.B. (2017). Theories of memory and aging: A lookat the past and a glimpse of the future. Journals of Gerontology:Psychological Sciences, 72(1), 82–90.
Petersen, R. C. (2004). Mild cognitive impairment as a diagnos-tic entity. Journal of Internal Medicine, 256(3), 183–194.https://doi.org/10.1111/j.1365-2796.2004.01388.x.
Petersen, R. C., Stevens, J. C., Ganguli, M., Tangalos, E. G., Cummings,J. L., & DeKosky, S. T. (2001). Practice parameter: Early detectionof dementia: Mild cognitive impairment (an evidence-based re-view). Neurology, 56(9), 1133–1142. https://doi.org/10.1212/WNL.56.9.1133.
Petersen, R. C., Roberts, R. O., Knopman, D. S., Boeve, B. F., Geda, Y.E., Ivnivk, R. J., et al. (2009). Mild cognitive impairment ten yearslater. Neurological Review, 66(12), 1447–1455.
Polito, L., Abbondanza, S., Vaccaro, R., Valle, E., Davin, A.,Degrate, A., et al. (2015). Cognitive stimulation in cogni-tively impaired individuals and cognitively healthy individ-uals with a family history of dementia: Short-term resultsfrom the BAllena-Mente^ randomized controlled trial.International Journal of Geriatric Psychiatry, 30(6), 631–638. https://doi.org/10.1002/gps.4194.
Purath, J., Keck, A., & Fitzgerald, C. E. (2014). Motivationalinterviewing for older adults in primary care: A systematic review.
Neuropsychol Rev (2017) 27:440–484 483
Geriatric Nursing, 35(3), 219–224. https://doi.org/10.1016/j.gerinurse.2014.02.002.
Rapp, S., Brenes, G., & March, A. P. (2002). Memory enhancementtraining for older adults with mild cognitive impairment: A prelim-inary study. Aging & Mental Health, 6(1), 5–11. https://doi.org/10.1080/13607860120101077.
Reijnders, J., van Heugten, C., & van Boxtel, M. (2013). Cognitive in-terventions in healthy older adults and people with mild cognitiveimpairment: A systematic review. Ageing Research Reviews, 12(1),263–275. https://doi.org/10.1016/j.arr.2012.07.003.
Reuter-Lorenz, P.A. & Cappell, K.A. (2008). Neurocognitive aging andthe compensation hypothesis. Current Directions in PsychologicalScience, 17(3), 177–182.
Reuter-Lorenz, P.A. & Park, D.C. (2014). How does it STAC up?Revisiting the scaffolding theory of aging and cognition.Neuropsychology Review, 24, 355–370.
Reuter-Lorenz, P.A. & Lustig, C. (2017).Working memory and executivefunctions in the aging brain. In R. Cabeza, L. Nyberg, D.C. Park(Eds.), Cognitive Neuroscience of Aging: Linking Cognitive andCerebral Aging Second Edition (pp 235–258). New York: OxfordUniversity Press.
Rog, L. A., & Fink, J. W. (2013). Mild cognitive impairment and normalaging. InHandbook on the neuropsychology of aging and dementia(pp. 239–256). New York: Springer. https://doi.org/10.1007/978-1-4614-3106-0_16.
Rojas, G. J., Villar, V., Iturry, M., Harris, P., Serrano, C.M., Herrera, J. A.,et al. (2013). Efficacy of a cognitive intervention program in patientswith mild cognitive impairment. International Psychogeriatrics,25(5), 825–831. https://doi.org/10.1017/S1041610213000045.
Rosen, A. C., Suigiura, L., Kramer, J. H., Whitfield-Cabrieli, S., &Gabrieli, J. D. (2011). Cognitive training changes hippocampalfunction in mild cognitive impairment: A pilot study. Journal ofAlzheimer’s Disease, 26, 349–357. https://doi.org/10.3233/JAD-2011-0009.
Rosenthal, R. (1979). The ‘file drawer problem’ and tolerance for nullresults. Psychological Bulletin, 86(3), 638–641. https://doi.org/10.1037/0033-2909.86.3.638.
Rutter, C. M., & Gatsonis, C. A. (2001). A hierarchical regressionapproach to meta-analysis of diagnostic test accuracy evalu-ations. Statistics in Medicine, 20(19), 2865–2884. https://doi.org/10.1002/sim.942.
Salthouse, T. A. (1996). The processing-speed theory of adult age differ-ences in cognition. Psychological Review, 103(3), 403–428.https://doi.org/10.1037/0033-295X.103.3.403.
Salthouse, T. A. (2011). Neuroanatomical substrates of age-relatedcognitive decline. Psychological Bulletin, 137(5), 753–784.https://doi.org/10.1037/a0023262.
Saunders, N. L. J., & Summers, M. J. (2011). Longitudinal deficits toattention, executive, and working memory in subtypes of mild cog-nitive impairment. Neuropsychology, 25(3), 237–248. https://doi.org/10.1037/a0021134.
Schaie, K.W., &Willis, S. (2010).The Seattle Longitudinal Study of adultcognitive development. ISSBD Bulletin, 57(1), 24–29.
Schmiter-Edgecombe, M., & Dyck, D. G. (2014). Cognitive rehabilita-tion multi-family group intervention for individuals with mild cog-nitive impairment and their care-partners. Journal of theInternational Neuropsychological Society, 20(09), 897–908.https://doi.org/10.1017/S1355617714000782.
Sedgewick, P. (2013). Meta-analysis: Heterogeneity and subgroup anal-ysis. British Medical Journal. https://doi.org/10.1136/bmj.f4040.
Shatenstein, B., & Bargerger-Gateau, P. (2015). Prevention of age-related cognitive decline: Which strategies, when, and forwhom? Journal of Alzheimer ’s disease, 48(1), 35–53.https://doi.org/10.3233/JAD-150256.
Simon, S. S., Yokomizo, J. E., & Bottino, C. M. C. (2012). Cognitiveintervention in amnestic mild cognitive impairment: A systematic
review. Neuroscience and Biobehavioral Reviews, 36(4), 1163–1178. https://doi.org/10.1016/j.neubiorev.2012.01.007.
Simons, D. J., Boot,W. R., Charness, N., Gathercole, S. E., Chabris, C. F.,Hambrick, D. Z., & Stine-Morrow, E. A. L. (2016). Do Bbrain-training^ programs work? Psychological Science in the PublicIn t e re s t , 17 ( 3 ) , 103–186 . h t t p s : / / do i . o rg / 10 . 1177 /1529100616661983.
Sitzer, D. I., Twamley, E. W., & Jeste, D. V. (2006). Cognitive training inAlzheimer’s disease: A meta-analysis of the literature. ActaPsychiatrica Scandinavica, 114(2), 75–90. https://doi.org/10.1111/j.1600-0447.2006.00789.x.
Smith, P. J., Blumenthal, J. A., Hoffman, B. M., Cooper, H., Strauman, T.A., Welsh-Bohmer, K., et al. (2010). Aerobic exercise andneurocognitive performance: A meta-analytic review of random-ized controlled trials. Psychosomatic Medicine, 72(3), 239–252. https://doi.org/10.1097/PSY.0b013e3181d14633.
Stern, Y. (2012). Cognitive reserve in ageing and Alzheimer’s disease.The Lancet Neurology, 11(11), 1006–1012.
Sterne, J. A. C., Gavaghan, D., & Egger, M. (2000). Publication andrelated bias in meta-analysis: Power of statistical tests and preva-lence in the literature. Journal of Clinical Epidemiology, 53(11),1119–1129. https://doi.org/10.1016/S0895-4356(00)00242-0.
Sterne, J. A. C., Sutton, A. J., Ioannidis, J. P. A., Terrin, N., Jones, D. R.,Lau, J., et al. (2011). Recommendations for examining andinterpreting funnel plot asymmetry in meta-analyses of randomisedcontrolled trials. British Medical Journal, 342, d4002.
Stott, J., & Spector, A. (2011). A review of the effectiveness of memoryinterventions in mild cognitive impairment (MCI). InternationalPsychogeriatrics, 23(4), 526–538. https://doi.org/10.1017/S1041610210001973.
Stuss, D. T., Robertson, I. H., Craik, F. I. M., Levine, B., Alexander, M.P., Black, S., et al. (2007). Cognitive rehabilitation in the elderly: Arandomized trial to evaluate a new protocol. Journal of InternationalNeuropsychological Society, 13, 120–131.
Suo, C., Singh, M. F., Gates, N., Wen, W., Sachdev, P., Brodaty,H., et al. (2016). Therapeutically relevant structural and func-tional mechanisms triggered by physical exercise and cogni-tive exercise. Molecular Psychiatry, 21(11), 1633–1642.https://doi.org/10.1038/mp.2016.19.
Tardif, S. & Simard, M. (2011). Cognitive stimulation programs inhealthy elderly: A review. International Journal of Alzheimer’sDisease, Article ID 378934. https://doi.org/10.4061/2011/378934.
Thompson, S. G., &Higgins, J. P. T. (2002). How should meta-regressionanalyses be undertaken and interpreted? Statistics in Medicine,21(11), 1559–1573. https://doi.org/10.1002/sim.1187.
Toepper, M. (2017). Dissociating normal aging from Alzheimer’s dis-ease: A view from cognitive neuroscience. Journal of Alzhiemer’sDisease, 57(2), 331–352. https://doi.org/10.3233/JAD-161099.
Tsolaki, M., Kounti, F., Agogiatou, C., Poptsi, E., Bakoglidou, E.,Zafeiropoulou, M., et al. (2011). Effectiveness of nonpharmacologicalapproaches in patients with mild cognitive impairment.Neurodegenerative Diseases, 8(3), 138–145. https://doi.org/10.1159/000320575.
Uchida, S., & Kawashima, R. (2008). Reading and solving arithmeticproblems improves cognitive functions in normal aged people: Arandomized controlled study. Age, 30(1), 21–29. https://doi.org/10.1007/s11357-007-9044-x.
Valdes, E. G., O’Connor, M. L., & Edwards, J. D. (2012). The effects ofcognitive speed of processing training among older adults withpsychometrically-defined mild cognitive impairment. CurrentAlzheimer’s Research, 9(9), 999–1009. https://doi.org/10.2174/156720512803568984.
Valentine, J. C., Pigott, T. D., & Rothstein, H. R. (2010). How manystudies do you need?: A primer on statistical power for meta-analy-sis. Journal of Educational and Behavioral Statistics, 35(2), 215–247. https://doi.org/10.3102/1076998609346961.
484 Neuropsychol Rev (2017) 27:440–484
van Paasschen, J., Clare, L., Woods, R. T., & Linden, D. E. J. (2009). Canwe change brain functioningwith cognition-focused interventions inAlzheimer’s disease? The role of functional neuroimaging.Restorative Neurology and Neuroscience, 27, 473–491.
Verhaeghen, P., Marcoen, A., & Goossens, J. (1992). Improving memoryperformance in the aged through mnemonic training: A meta-analytic study. Psychology and Aging, 7(2), 242–251. https://doi.org/10.1037/0882-7974.7.2.242.
Vermeij, A., Kessels, R. P. C., Heskamp, L., Simons, E.M. F., Dautzenberg,P. L. J., & Claassen, J. A. H. R. (2017). Prefrontal activation maypredict working-memory training gain in normal aging and mild cog-nitive impairment. Brain Imaging and Behavior, 11(1), 141–154.https://doi.org/10.1007/s11682-016-9508-7.
Vidovich, M., & Almeida, O. P. (2011). Cognition-focused interventionsfor older adults: The state of play. Australasian Psychiatry, 19(4),313–316. https://doi.org/10.3109/10398562.2011.579973.
Vidovich,M., Lautenschlager, N. T., Flicker, L., Clare, L., McCaul, K., &Almeida, O. P. (2015). The PACE study: A randomized clinical trialof cognitive activity strategy training for older people with mildcognitive impairment. American Journal Geriatric Psychiatry,23(4), 360–372. https://doi.org/10.1016/j.jagp.2014.04.002.
Willis, S. J., & Caskie, G. I. L. (2013). Reasoning training in the ACTIVEstudy: How much is needed and who benefits? Journal of Aging andHealth, 25(8S), 43S–64S. https://doi.org/10.1177/0898264313503987.
Winbald, B., Palmer, K., Kivipelto, M., Jelic, V., Fratiglino, L., Wahlund,L. O., et al. (2004). Mild cognitive impairment – Beyond controver-sies, towards a consensus: Report of the international working grouponmild cognitive impairment. Journal of Internal Medicine, 256(3),240–246. https://doi.org/10.1111/j.1365-2796.2004.01380.x.
Wirth, M., Haase, C. M., Villeneuve, S., Vogel, J., & Jagust, W.J. (2014). Neuroprotective pathways: Lifestyle activity, brainpathology, and cognition in cognitively normal older adults.Neurobiology of Aging, 35(8), 1873–1882. https://doi.org/10.1016/j.neurobiolaging.2014.02.015.
Yin, S., Zhu, X., Li, R., Niu, Y., Wang, B., Huang, X., et al. (2014).Intervention-induced enhancement in intrinsic brain activity inhealthy older adults. Scientific Reports, 4(1), 7309. https://doi.org/10.1038/srep07309.
Zehnder, F., Martin, M., Altgassen, M., & Clare, L. (2009). Memorytraining effects in old age as markers of plasticity: A meta-analysis.Restorative Neurology and Neuroscience, 27(5), 507–520.https://doi.org/10.3233/RNN-2009-0491.