the effects of working capital management on the financial
TRANSCRIPT

THE EFFECTS OF WORKING CAPITAL MANAGEMENT ON
THE FINANCIAL PERFORMANCE OF RETAIL
SUPERMARKETS IN NAIROBI COUNTY, KENYA
KINUTHIA JOHN NYOIKE
A RESEARCH PROJECTPRESENTED IN PARTIAL
FULFILMENT OF THE REQUIREMENTS FOR THE AWARD OF
THE DEGREE OF MASTERS OF BUSINESS ADMINISTRATION,
SCHOOL OF BUSINESS, UNIVERSITY OF NAIROBI
NOVEMBER 2015

ii
DECLARATION This research project is my original work and has not been presented for a degree
award in any other University.
Signed; ___________________________ Date; ____________________
John Nyoike Kinuthia
D61/60457/2013
This research project has been submitted for examination with my approval as the
University Supervisor.
Signed; ___________________________ Date_______________________
Dr. Mirie Mwangi
Senior Lecturer,
Department of Finance and Accounting
School of Business, University of Nairobi

iii
ACKNOWLEDGEMENT
I thank the Almighty God, for the grace and strength to carry on with my studies up to
this level. My heartfelt gratitude goes out to my supervisor Dr. Mirie Mwangi for his
professional guidance. Special thanks go to my wife Lucy for her prayers. My friends
and all those who gave encouragements and adviceduring the period of this project
also share my compliments.

iv
DEDICATION
To my beloved parents for their prayersand the gift of education.Special dedications
go to my wife, Lucy and my daughters Maureen, Shirleen, Rehema, Wema and Grace
for their love and support.

v
TABLE OF CONTENTS DECLARATION ..................................................................................................... ii
ACKNOWLEDGEMENT ...................................................................................... iii
DEDICATION ........................................................................................................ iv
TABLE OF CONTENTS ........................................................................................ v
LIST OF TABLES ................................................................................................. vii
LIST OF ABBREVIATIONS ............................................................................... viii
ABSTRACT ............................................................................................................ ix
CHAPTER ONE ...................................................................................................... 1
INTRODUCTION ................................................................................................... 1
1.1 Background of the Study .................................................................................. 1 1.1.1 Working Capital Management ................................................................... 2 1.1.2 Financial Performance ............................................................................... 5 1.1.3 Working Capital Management and Financial Performance ......................... 6 1.1.4 Retail Supermarkets in Nairobi County, Kenya .......................................... 7
1.2 Research Problem............................................................................................. 8
1.3 Objective of the Study .................................................................................... 10
1.4 Value of the Study .......................................................................................... 10
CHAPTER TWO ................................................................................................... 12
LITERATURE REVIEW...................................................................................... 12
2.1 Introduction .................................................................................................... 12
2.2 Theoretical Review ........................................................................................ 12 2.2.1 The Operating Cycle Theory .................................................................... 12 2.2.2 The Cash Conversion Cycle Theory ......................................................... 13 2.2.3The Net Trade Cycle Theory ..................................................................... 13
2.3 Determinants of Financial Performance of Retail Supermarkets in Nairobi County, Kenya ..................................................................................................... 14
2.4 Empirical Studies ........................................................................................... 16
2.5 Summary of Literature Review ....................................................................... 18
CHAPTER THREE ............................................................................................... 20
RESEARCH METHODOLOGY .......................................................................... 20
3.1 Introduction .................................................................................................... 20

vi
3.2 Research Design ............................................................................................. 20
3.3 Population ...................................................................................................... 20
3.4 Data Collection .............................................................................................. 21
3.5 Data Analysis ................................................................................................. 21 3.5.1 Analytical model ...................................................................................... 21 3.5.2 Test of Significance ................................................................................. 22
CHAPTER FOUR ................................................................................................. 23
DATA ANALYSIS, RESULTS AND DISCUSSIONS ......................................... 23
4.1 Introduction .................................................................................................... 23
4.2 Response Rate ................................................................................................ 23
4.3 Descriptive Statistics ...................................................................................... 23
4.4 Correlation Analysis ....................................................................................... 24
4.5 Regression Analysis ....................................................................................... 25 4.5.1 Model Summary ...................................................................................... 25 4.5.2 ANOVA .................................................................................................. 26 4.5.3 Regression Coefficients ........................................................................... 26
4.6 Discussion of Research Findings .................................................................... 27
CHAPTER FIVE ................................................................................................... 29
SUMMARY, CONCLUSIONS AND RECOMMENDATIONS .......................... 29
5.1 Introduction .................................................................................................... 29
5.2 Summary of Findings ..................................................................................... 29
5.3 Conclusion ..................................................................................................... 30
5.4 Recommendations .......................................................................................... 30
5.5 Limitations of the Study ................................................................................. 31
5.6 Suggestions for Further Research ................................................................... 32
APPENDICES ....................................................................................................... 37
Appendix I: Data Collection Form ....................................................................... 37
Appendix II: List of Major Retail Supermarkets in Nairobi County, Kenya as at 31st December 2014 .................................................................................................... 38
Appendix III: Data from the Sampled Supermarkets............................................. 39

vii
LIST OF TABLES Table 4. 1: Summary of Statistics…............................................................... 23
Table 4. 2: Correlation matrix …………............................................................. 24
Table 4. 3: Model Summary................................................................................... 25
Table 4. 4: Analysis of Variance .............................................................................. 26
Table 4.5: Regression Coefficients ..................................... ……………………...26

viii
LIST OF ABBREVIATIONS ACP : Average collection period
ANOVA: Analysis of Variance
AP : Accounts payables
AR : Accounts receivables
ASE : Athens Stock Exchange
CA : Current Assets
CCC : Cash Conversion Cycle
CL : Current Liabilities
DPO : Days of Payables Outstanding
DSI : Day of Sales in Inventory
DSO : Day of Sales Outstanding
EOQ : Economic Order Quantity
FP : Financial Performance
GDP : Gross Domestic product
KNBS : Kenya National Bureau of Statistics
LEV : Leverage
NSE : Nairobi Securities Exchange
ROA : Return on Assets
ROE : Return on Equity
ROS : Return on Sales
SMEs : Small and Medium Enterprises
SPSS : Statistical Package of Social Science
WC : Working Capital
WCM : Working Capital Management

ix
ABSTRACT Working capital management (WCM) refers to the management of current assets and current liabilities. Management and evaluation of WC is aimed at ensuring that the firms’ current assets and Current liabilities are employed in an optimal way to achieve the goal of profit maximization. By doing this, managers need to ensure that a firm is able to continue its operations and has sufficient ability to satisfy both maturing short-term debt and future operational expenses. This study sought to establish the relationship between working capital management and financial performance of retail supermarkets in Nairobi County, Kenya. The study adopted a descriptive survey design.. Data for eight large supermarkets was gathered over a five year period between 2010 and 2014. This period was considered by the researcher to be adequate to establish the existence of any relationship. Secondary data collected from annual audited financial statements of the firms was used for this study. This consisted of data from the income statement and statement of financial position of the companies which was used to compute Return on assets, Days of sales outstanding, Days of sales in inventory, Days of payables outstanding, leverage and size of the firm. Pearson correlation analysis and regression analysis were performed on the variables. The results indicate that DSI had a positive and insignificant relationship with ROA (β = 0.060; p =0.278> 0.05). Further, t-test indicated that DSO had a positive and insignificant relationship with ROA (β = 0.056; p=0.348> 0.05). Regression results further indicated that DPO had a moderate negative significant relationship with ROA (β = -0.071; p=0.061> 0.05). Size of the firm had a strong significant relationship on ROA (β = -0.588; p=0.004<0.05). Management of working capital through increasing DPO without hurting the credit standing has an effect on the financial performance and the value of a firm. The current study results indicate that a longer DPO would lead to higher ROA. Leverage according to study results had an insignificant negative influence on ROA (β = -2.115; t = -0.249; p < 0.05). This indicated that increase in leverage would not have a major impact on ROA for the surveyed supermarkets.The study recommends that retail firms in the Kenyan market should effectively manage their working capital to ensure maximum returns because other forms of financing have limitation

1
CHAPTER ONE
INTRODUCTION
1.1 Background of the Study
Working capital management is a vital issue in financial decision-making since it is a
part of investment in asset and it directly affects the liquidity and profitability of the
company (Sarbapriya, 2012). Appropriate management of working capital is therefore
essential if the firms are to achieve their objective of improved profitability and value
creation for shareholders. Efficient utilization of the firm’s resources, as it relates to
working capital management, means that executives should find effective and
efficient ways to deal with the cash available for the day-to-day operations in order to
achieve the optimum impact. Good working capital management leads to increased
cash flows, and thus leads to lesser need on external financing; therefore, the
probability of default for the firm is reduced (Charitou et al., 2010).
The management of working capital is important to the financial health of business of
all sizes. The amounts invested in working capital are often high in proportion to the
total assets employed and so it is vital that these amounts are used in an efficient way
(Haresh, 2012). A well-designed and effective working capital management has a
significant contribution on profitability and liquidity position of firms.As such, the
going concern ability of an organization is greatly anchored on the continued solvency
of that organization thus working capital management is important for creating wealth
for shareholders (Osundina, 2014). Working capital management requires planning
and controlling current assets and current liabilities in such a way that eradicate the

2
threat of inability to meet short-term liabilities and evade excessive investment in
these assets (Haresh, 2012).
WCM components consist of cash management, accounts receivables management
and inventory management and accounts payables management. In managing these
components of working capital (WC), the main goal is to manage each of them to
achieve a balance between profitability and risk that contributes positively to the
firm’s value.Firms that invest heavily in working capital (inventory and account
receivables) may realize growth in sales but may suffer reduced profitability as more
money is tied into the working capital. As firms make more investment in CA, the
risk is reduced and so is the return. However, a lower investment in CA has higher
solvency risk and also higher returns. It is therefore important for a firm to determine
its optimal investment in the WC. Management of WC has an effect on the returns,
profitability and the value of a firm (Deloof, 2003).
1.1.1 Working Capital Management
Working capital management refers to the management of current assets and current
liabilities. There are two concepts of WCM, that is, gross working capital and net
working capital (Pandey, 2011).Gross working capital refers to the firms’ investment
in the current assets. Net working capital management refers to the difference
between current assets and current liabilities. The gross working capital concept
focuses attention on how to optimize investment in CA and how CA should be
financed. Net working capital is a concept which indicates the liquidity position of the
firm and suggests the extent to which WC needs may be financed by long-term
capital. A weak liquidity position poses a threat to solvency of the firm. Therefore,

3
both gross and net working capital concepts are equally important for efficient
management of WC (Teruel and Solano, 2005).
Efficient and effective WCM involves both setting WC policy and implementing that
policy in day to day operations. WC policy refers to the firm’s policy regarding: target
levels for each category of CA and how CA will be financed (Brigham, 2004). This
policy aims at enhancing the firm’s profitability, liquidity and risk. The purpose of
cash management is to determine and achieve the appropriate level and structure of
cash, and marketable securities, consistent with the nature of the business's operations
and objectives (Brigham et al., 1999;Gitman, 1997). Cash and marketable securities
should be managed so as to achieve a balance between the risk of insufficient liquid
or near liquid resources, and the cost of holding excessively high levels of these
resources.
Accounts payables (AP) refer to the credit, which has been extended to a firm by its
suppliers (Gallinger and Healey, 1987). The objective for firms stretching the
repayment period is to fund the investment in CA from trade creditors and hence
reduce the need for external financing. Management must ensure that in the bid to
stretch AP, all costs are quantified so as to determine the maximum stretching period
consistent with value maximization (Brigham et al., 1999).
Accounts receivable (AR) management results from sales on credit. The purpose of
credit sales is to encourage sales in order to grow the market share (Brigham et al.,
1999). The risks associated with AR include bad debts and debtor delinquency,
because they reduce the returns from the investment in accounts receivable, and if
inadequately monitored can affect severely on the firm’s performance. Inventory

4
management should minimize the costs of inventory handling, carrying and their
financing (Brigham et al., 1999). The way in which inventory is managed affects the
level of raw materials, work in progress and finished goods needed to sustain efficient
operations and sales. Holding an optimal level of inventory maximizes firms’
profitability.
An important concept in WCM is the cash conversion cycle (CCC). This focuses on
the length of time between when the company makes payments and when it receives
cash. The firm’s goal should be to shorten its CCC as much as possible without
hurting operations. This would improve profits, because the longer the CCC, the
greater the need for external financing, and financing has a cost. CCC can be
shortened by: reducing the inventory conversion period by processing and selling
goods more quickly; reducing the receivables collection period by speeding up
collections, or; lengthening the payables deferral period by slowing down the firm’s
own payments. To the extent that these actions can be taken without increasing costs
or depressingsales,they should be carried out (Brigham, 2004.)
It is important for retail supermarkets to have adequate working capital (WC) as it
ensures solvency of the business by providing continuous procurement and
uninterrupted supply of their products. Besides, adequate WC leads to high credit
ratings especially where firms want to finance investments using debt. On the other
hand, little or excess WC affects returns. Excess WC holds up a significant portion of
potential investment funds hence the firm realizes lower returns. A decline in returns
has an effect on the firm’s value, which shall most likely decline as the firm will not
be able to pay dividends consistently and thus not able to attracts potential investors
(Smith, 1980).

5
Management and evaluation of WC is aimed at ensuring that the firms’ CA and CL
are employed in an optimal way to achieve the goal of profit maximization. Analysis
and evaluation of WCM is done using ratios. The important ratios used to measure the
working capital cycle include the average collection period, inventory turnover,
accounts payable turnover ratio and cash conversion cycle. The efficiency with which
assets are employed directly affects the levels of sales, cost of sales and operating
profits. An analysis of current ratios and quick ratios give information on liquidity and
solvency of a firm but fail to address critical oversights such as high levels of AR due
to poor credit policies and slow moving goods which may show favorable financial
analysis and yet the firm is in trouble (Ng’ang’a, 2009).
1.1.2 Financial Performance
Financial performance is the level of performance of a business over a specified
period of time, expressed in terms of overall profits and losses during that time.
Profitability is the rate of return on a firm’s investment and is the measure that has
been used in this study to assess financial performance. Most firms carry out their
business with the main aim of maximizing profits. A firm that is consistently
profitable is more likely to survive compared to others that are either inconsistent or
loss making. On the other hand, liquidity of the firm is also important as it enables
firms to carry out its activities smoothly. While high liquidity safeguards the firm
against challenges such as stock outs, it may adversely affect profitability as lots of
funds are tied in inventory, AR and cash at the expense of investing in short term
financial instruments. It is therefore important to strike a tradeoff between liquidity
and profitability (Smith, 1980).

6
Profitability ratios show the combined effects of liquidity, asset management, and
debt on operating results (Brigham, 2004). A number of profitability ratios may be
used to assess the profitability of a firm. In this study, Return on Total Asset (ROA)
will be used to measure Profitability. ROA is obtained by dividing net income (after
interest and taxes) by the value of the total assets. It measures the efficiency of the
business in using its assets to generate net income.
1.1.3 Working Capital Management and Financial Performance
A number of investment decisions aimed at maximizing profitability have an inverse
relationship with the firms’ liquidity. On the other hand, greater focus on liquidity
undermines profitability. A firm can experience growth in sales because of a generous
credit policy. However, many researchers have shown that the longer the cash
conversion cycle, the lower is the profitability (Deloof, 2003).
According to Bodie and Merton (2000), CCC represents the number of days between
the dates the firm must start to pay cash to its suppliers and the date it began to
receive cash from its customers. CCC is equal to Days of Sales Outstanding (DSO)
plus Days of Sales in inventory (DSI) minus Days of Payables Outstanding (DPO).
The firm’s goal should be to shorten its CCC as much as possible without hurting
operations. This would improve profits.
DSO equals to Accounts receivables (AR) divided by Sales multiplied by 365 days.
The DSO represents the average number of days for which a firm has to wait before
its customers pay up. It is an activity ratio and gives information about the efficiency
of sales collection activities. A shorter average collection period (ACP) ensures the
firm has adequate liquidity. Any excess cash arising from a shorter ACP may then be

7
invested in short term financial instrument to boost profitability The lower the value
of DSO, the more favorable it is, and vice versa (Gitman, 1997).
Days of Sales in Inventory (DSI) measures the speed with which the stock is
converted into sales. DSI equals to Inventory divided by Cost of Goods sold
multiplied by 365 days. Managers strive to ensure inventory moves as fast as possible
while minimizing ordering and holding costs related to inventory. In addition, it is
inevitable for every firm to keep an optimal level of inventory so as to be able to meet
its daily operating requirements of satisfying its customers’ orders with minimal
delays, stock outs and wastages. A lower ratio of DSI is more favorable than higher
ratio. This has a positive impact on profitability of the firm. Days of Payables
Outstanding (DPO) is the average number of days that a firm takes to pay its trade
creditors. DPO equals to Accounts Payables (AP) divided by Cost of Goods Sold
multiplied by 365 days. Firms should analyze DPO to ensure balance between
liquidity and profitability (Gitman, 1997).
1.1.4 Retail Supermarkets inNairobi County, Kenya
According to National economic survey Report, (KNBS, 2015) Kenya’s economy is
estimated to have expanded by 5.3 percent in the year 2014. From the supply side the
major drivers of the economy and their respective contribution to GDP were
Agriculture, forestry and fishing (27.3%); Manufacturing (10%); Transport and
storage (8.3%); Wholesale and retail trade (8.2%); Real estate (7.8%); and Finance
and insurance (6.7%).In the year 2014, wholesale and retail sector was among the
leading sectors in the Kenyan economy as it contributed 8.2% to GDP. In terms of
growth rate, Wholesale and retail sector grew by 6.9%, way above the National

8
average of 5.3%. In spite of this, it is estimated that up to 40% of startup fail by
second year and close to 60% close their doors by the fourth year.
WCM is accredited as one of the causes of their failures (Nyamao, 2012). Retail
supermarkets invest heavily in working capital in order generate more sales but may
suffer reduced profitability as more money is tied into the working capital. As firms
make more investment in CA, the risk is reduced and so is the return. However, a
lower investment in CA has higher solvency risk and also higher returns. It is
therefore important for Retail supermarketsto determine their optimal investments in
the WC. Management of WC has an effect on the returns, profitability and the value
of a firm (Deloof, 2003).This study assesses the effects of WCM on the financial
performance of major Retail supermarketsin Nairobi County, Kenya.
1.2 Research Problem
Effective management of WC is aimed at ensuring that the firms’ current assets and
current liabilities are employed in an optimal way to achieve the objective of profit
maximization. The goal of retail stores management in any firm therefore seeks to
shorten the working capital cycle (Ernest and Young, 2012). WC components are
intertwined and their effective management plays a key role in determining the level
of profitability of firms. Profit maximization is the key goal of any firm, failure to
manage its liquidity may result to its inability to ensure a smooth running of its daily
operations. However, decisions that enhance profitability have shown to have a
negative impact on liquidity; hence, most firms face a tough balancing act between
profitability and liquidity(Haresh, 2012).
Retail supermarkets in Kenya play a significant role in the growth of the Kenyan
economy. As the economy continues to grow, there is need to create more business

9
opportunities by creating new retail stores and expanding the existing ones. Although
their role in the economy is substantial, manyRetail supermarkets Nairobi County
have been facing many obstacles affecting their business performance. For instance,
Uchumi supermarkets one of the oldest retail stores in Kenya has been under statutory
managementin the past due to poor performance.Thus, managers of these firms need
to be informed on the effects of working capital management on the profitability of
their firms and the need strike a balance between how much cash to keep, what level
of inventory to maintain or how much AR and AP to have (Mathai, 2012).
Past studies have been carried out concluded that WCM has an influence on both the
profitability and liquidity of many firms. Internationally, Osundina (2014) studiedthe
relationship between WCM and profitability of food and beverages manufacturing
firms listed on the Nigerian Stock Exchange and established that there is relatively
strong positive and significant relationship between WCM and net operating profit.
Further, Karadagli (2012) examined effects of WCM on the firm performance for a
sample of Turkish listed companies and searched for potential differences between the
profitability effects of working capital management for the SMEs and for the bigger
companies. The study established that an increase in both the CCC and the net trade
cycle improves firm performance in terms of both the operating income and the stock
market return for SMEs whereas for bigger companies, a decrease in CCC and net
trade cycle is associated with enhanced profitability.
The above studies concentrated on listed firms in their locality and SMEs as opposed
to Retail supermarkets. Locally, Hidaya (2014) examined the relationship between
WCM and FP of supermarkets in Nairobi County. The study concluded that FP of
supermarkets in Nairobi County is influenced by the inventory collection period,

10
leverage and fixed turnover ratio. Mathai (2012) examined the relationship between
WCM and retail supermarkets in Kenya. The study found that there exist a
relationship between WCM and profitability of retail supermarket chains in
KenyaHowever, the two studies focused on six supermarkets.
It is notable that minimal studies have been carried out on WCM on this field with
minimal sample sizes.The research will increase the sample size and seeks to answer
the questions: what is the effect of working capital management on the financial
performance of Retail supermarketsin Nairobi County, Kenya? What is the
importance of adequate working capital on the continuity of Retail supermarketsin
Nairobi County, Kenya?
1.3 Objective of the Study
To examine the effect of working capital management on the financial performance of
Retail supermarkets in Nairobi County, Kenya.
1.4 Value of the Study
The findings of this study will be of great benefit to potential investors willing to
venture into retail supermarket business will find this document as a useful guide to
setting appropriate WC policy for their firms.Managers of existing and firmswill find
the study useful in determining the profitability – liquidity trade off to achieve the
targeted level of profitability, hence maximizing shareholders’ wealth.
Retail sector is a key contributor to the country’s GDP. Therefore, the Government of
Kenya may use the study findings to understand the factors that affect the financial
performance of the various retail firms in Kenya. The study will assist the

11
Government in determining the kind of support to give this sector to enhance its
growth.
In addition, financial institutions may use the study findings mostly when advancing
credit to retail supermarkets in Kenya. This is because efficient working capital
management ensures that the firms is efficient managing their current asset and
liabilities and can be able to meet it short and long term obligations. The findings of
this study may be used by scholars to identify other areas in working capital
management that needs further research with the sole aim of improving the
profitability retail firms as measured by return on total assets (ROA).

12
CHAPTER TWO
LITERATURE REVIEW
2.1 Introduction
The chapter focuses on the review of main theories and empirical studies that reflect
on the relationship between WCM and financial performance of firms. A section on
the determinants of profitability of firms also forms part of the chapter. Finally, a
summary of the chapter is presented.
2.2 Theoretical Review
WCM theories describe how working capital should be managed and demonstrates
the benefits in terms of liquidity, solvency, efficiency, profitability, and shareholder
wealth maximization, which accrue to the company from appropriately managing WC
(Brigham, et al. 1999, Gitman, 1997). There is need for a mix of short and long term
financing of CA in firms to achieve maximum returns (Pandey, 2011).
2.2.1 The Operating Cycle Theory
The operating cycle theory was developed by Richards and Laughlin (1980) and it
looks explicitly at one side of WC, that of CA and therefore gives income statement
measures of firms operating activities, that is, about production, distribution and
collection. Receivables, for instance are directly affected by the credit collection
policy of the firm and the frequency of converting these receivables into cash matters
in WCM. By granting the customers more liberal credit policy, the profitability will
be increased but at the same time, liquidity will be sacrificed. The same analysis goes
for other components of CA.

13
However, the operating cycle theory tends to be deceptive in that it suggests that CLis
not important in the course of the firm’s operations. Our understanding of payables as
the source of financing the firm’s activities can be assailed as a result. Given this
inadequacy of the operating cycle theory, it is essential to infuse CL in the picture to
enhance our analysis and understanding. Although the operating cycle considers
financial flows come from receivables and inventory, it ignores the financial flow
coming from AP in this regard. Richards and Laughlin (1980) suggested the CCC,
which considers all relevant cash flows, comes from the operations.
2.2.2 The Cash Conversion Cycle Theory
The theory integrates both sides of working capital. In their seminal paper Richards
and Laughlin (1980) devised this method of WC as part of a broader framework of
analysis known as the working capital cycle. It claims that the method is superior to
other forms of working capital analysis that rely on ratio analysis or a decomposition
of WC as claimed above.
Cash Conversion Cycle is calculated by subtracting the payables deferral period
(365/annual payables turnover), from the sum of the Inventory conversion period
(365/annual inventory turnover and the receivable conversion period (365/annual
receivable turnover. It has been interpreted as a time interval between the cash outlays
that arise during the production of output and the cash inflows that result from the sale
of the output and the collection of the accounts receivables.
2.2.3The Net Trade Cycle Theory
The net trade cycle is as developed by Shin and Soenen (1998) equals to the cash
conversion cycle where the three components of the cash conversion cycle

14
(receivables, inventory and payables) are articulated as a percentage of sales, this
makes the net trading cycle easier to calculate and less complex. Shin and Soenen
(1998) investigated the relationship between the net trade as a measure of working
capital and return on investment in the US firms. The results of chi-square test
indicated a negative relationship between the length of Net Trade Cycle and Return
on Assets. Furthermore, this inverse relationship was found different across industry.
A significant relationship for about half of the industries studied indicated that the
results might vary from industry to industry. An additional study by shin and Soenen
(1998) argued that the net trading cycle is a better working capital efficiency measure
compared to the CCC and the weighted CCC because it indicates the number of days
sales the company has to finance its working capital and the working capital manager
can easily estimate the financial needs of working capital expressed as the function of
expected sales growth. The reason for using net trading cycle is because it can be an
easy device to estimate for additional financing needs with regards to working capital
expressed as a function of the projected sales growth. This relationship can be
examined using correlation and regression analysis by industry should working capital
intensify.
2.3 Determinants of Financial Performance of Retail Supermarkets
in Nairobi County, Kenya
Financial performance is the level of performance of a business over a specified
period of time, expressed in terms of overall profits and losses during that time. Most
firms carry out their business with the main aim of maximizing profits. A firm that is
consistently profitable is more likely to survive compared to others that are either

15
inconsistent or loss making. The factors outlined below have an influence on the
profitability of these firms(Brigham, 2004).
As firms productivity rise, firms become are more profitable. High productivity,
manifested in, for example low average cost of production, higher product quality or
higher output quantities produced with fewer inputs, leads to higher profits (Andreas,
2009).The size of the firm significantly enhances performance. The positive and
significant parameter estimate for firm size illustrates that, in comparison to smaller
firms, larger firms are more profitable. This is due to the fact that larger firms exploit
scale economies and benefit from economies of scope. An alternative interpretation is
that firms can access capital at lower costs than smaller firms (Andreas, 2009).
Customer Satisfaction and Loyalty serve to link processes culminating purchase and
consumption with post purchase phenomena such as attitude change, repeat purchase,
and brand loyalty (Surprenant&Churchil, 1982). Another determinant of firms’
profitability is the financial leverage. Using leverage has both good and bad effects:
higher leverage increases expected earnings per share but it also increases risk. Stock
prices are positively related to expected dividends but negatively related to the
required return on equity. Firms with higher earnings are able to pay higher dividends,
so to the extent that higher debt levels raise expected earnings per share, leverage
works to increase the stock price. However, higher debt levels also increase the firm’s
risk, and that raises the cost of equity and works to reduce the stock price (Brigham,
2004).

16
2.4 Empirical Studies
Many studies have been carried out at global and local level to establish the effect of
WCM on financial performance of firms in various sectors of the world economy.
Whereas some researchers argue that there exist a significant relationship between
WCM and profitability, other researchers have shown either no relationship or
presence of this relationship albeit on statistical insignificancy.
Deloof (2003) tested the relationship between WCM and profitability of Belgian
companies for the duration 1960 to 1992. The study used DSO, CCC and inventories
as indicators of trade credit. CCC was used as key indicator for WCM. The results
established that management can increase profitability through reduction in DSO,
inventories turnover and CCC. The negative relation between accounts payable and
profitability is consistent with the view that less profitable firms wait longer to pay
their bills.
Narware (2004) carried out a study on Indian National Fertilizer limited between the
year 1990 to 1991 and 1999 to 2000. The objective of the study was to assess the
effect of WCM on profitability of firms. The study established that there is a positive
and negative relationship between various working capital components and
profitability. The conclusion was that increase in profitability was less relative to
proportional decrease in working capital.
Teruel and Solano (2005) studied the effects of WCM on profitability of small and
medium sized Spanish firms. Data was collected from a panel of 8,872 SMEs
covering the period 1996 to 2002. The study established that the value of the firm
could be created by reducing the firm’s DSO, DSI and CCC.
17
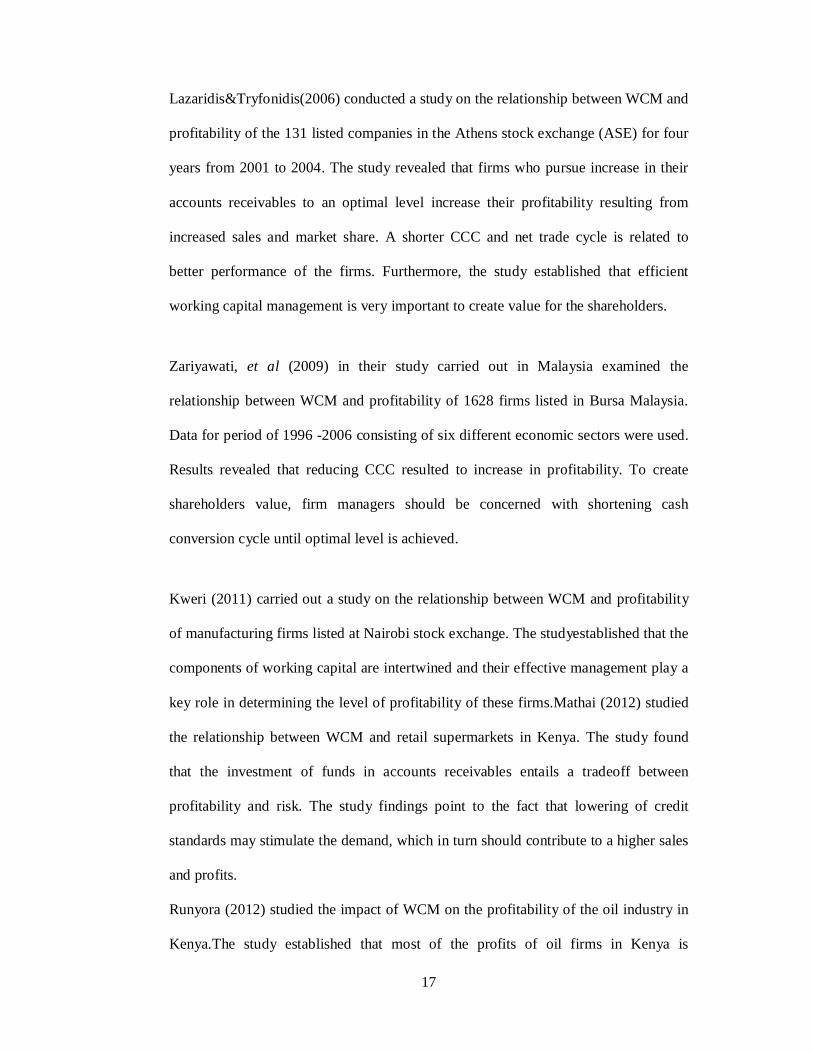
Lazaridis&Tryfonidis(2006) conducted a study on the relationship between WCM and
profitability of the 131 listed companies in the Athens stock exchange (ASE) for four
years from 2001 to 2004. The study revealed that firms who pursue increase in their
accounts receivables to an optimal level increase their profitability resulting from
increased sales and market share. A shorter CCC and net trade cycle is related to
better performance of the firms. Furthermore, the study established that efficient
working capital management is very important to create value for the shareholders.
Zariyawati, et al (2009) in their study carried out in Malaysia examined the
relationship between WCM and profitability of 1628 firms listed in Bursa Malaysia.
Data for period of 1996 -2006 consisting of six different economic sectors were used.
Results revealed that reducing CCC resulted to increase in profitability. To create
shareholders value, firm managers should be concerned with shortening cash
conversion cycle until optimal level is achieved.
Kweri (2011) carried out a study on the relationship between WCM and profitability
of manufacturing firms listed at Nairobi stock exchange. The studyestablished that the
components of working capital are intertwined and their effective management play a
key role in determining the level of profitability of these firms.Mathai (2012) studied
the relationship between WCM and retail supermarkets in Kenya. The study found
that the investment of funds in accounts receivables entails a tradeoff between
profitability and risk. The study findings point to the fact that lowering of credit
standards may stimulate the demand, which in turn should contribute to a higher sales
and profits.
Runyora (2012) studied the impact of WCM on the profitability of the oil industry in
Kenya.The study established that most of the profits of oil firms in Kenya is

18
attributable to WCM. The study concluded that there exists relationship between
WCM and Profitability of oil firms in Kenya; leverage was found to positively
influence the profitability of oil firms in Kenya.The study recommended that for oil
firms in Kenya to remain profitable, they should employ WCM practice that will help
in making decisions about investment mix and policy, matching investments to
objectives, asset allocation for institutions, and balancing risk against profitability.
Murega (2013) investigated the effects of WCM on corporate profitability among
firms listed at NSE. From the analysis,it is evident that DSI has negative relationship
with ROS and ROA.DPO as the variable that influences ROS has a positive
relationship. Theseresults show that managing WC properly is important. Moreover,
managinginventory as well as CCC to an optimum level will yield more profit.
Malombe (2014) studied the relationship between WCM and profitability of
reinsurance companies in East Africa. The study concluded that there exists
relationship between WCM and Profitability of reinsurance companies in East Africa.
Managers can create profits for their companies by managing and keeping each
different component of WC (AR, AP, and inventory) to an optimum level. They
should collect their debts as quick as possible and delay payment as much as possible
taking into consideration not to strain their relations with suppliers.The study
recommends that reinsurance companies should ensure that they have a framework on
managing the working capital since it has direct impact on their profitability.
2.5 Summary of Literature Review
The body of theoretical literature mainly emphasized the effects of WCM on financial
performance of firms. The chapter has highlighted the need for firms to develop sound

19
WCM policies that improve on profitability and ensure shareholders wealth is
maximized. A review of past studies reveals discussions on risk and return tradeoffs
between different WC policies. An aggressive approach to WCM is associated with
higher returns and higher risk while conservative approach is associated with lower
returns and lower risk.
WCM is important because of its effect on the firm’s profitability, risk and
consequently its value (Smith, 1980). Generally, there is no conclusive agreement as
to which WCM policy guarantees a higher profitability. The studies also found out
that CCC is an important measure of liquidity. Studies showed that efficient WCM is
crucial in creating value for shareholders. In Kenya, studies have concentrated on
specific drivers such as cash, AP, AR, Inventory and their impact on profitability of
the firms in various sectors of the economy. However, no mush studies in this area of
retail supermarkets have been done. The two studies focused on six supermarkets. It
is notable that minimal studies have been carried out on WCM on this field with
minimal sample sizes. The research will increase the sample size and seeks to
establish the effects of WCM on the financial performance of Retail supermarkets in
Nairobi County, Kenya.
20
CHAPTER THREE
RESEARCH METHODOLOGY
3.1 Introduction
The chapter discusses the overall research methodology and includes research design,
study population, data collection and data analysis techniques.
3.2 Research Design
A research design is the overall plan for connecting the conceptual research problems
to the pertinent empirical research. In other words, research design is a comprehensive
plan for data collection in an empirical research project (Kothari, 2004). The study
adopted a descriptive survey design. A descriptive research study is concerned with
describing the characteristics of a particular individual or group (Mugenda and
Mugenda, 2003).As such, descriptive research design enables the researcher to
generalize the findings to a larger population. This approach is important because it
allows analysis and relationships of variables.
3.3 Population
A population can be defined as all people or items (unit of analysis) with the
characteristics that one wishes to study. The unit of analysis may be a person, group,
organization, country, object, or any other entity that you wish to draw scientific
inferences about (Kothari, 2004). The population of interest comprised of the thirteen
major retail supermarkets in Nairobi County, Kenya (Kenya Business Directory,
2015).Mugenda and Mugenda (2003) recommended that a sample of 10-30% is
adequate if properly selected. Hence, the study undertook a census of the
thirteenmajor retail supermarkets in Nairobi County, Kenya (See appendix II).
21
3.4 Data Collection
Secondary data will be used for this study. The data will be obtained from the firm’s
annual reports for a period of five years from 2010 - 2014. Financial data from the
statement of comprehensive income and statement of financial position of the retail
supermarkets will be used for the five years. In addition, other forms of secondary
data will be sourced from journals, books and newspapers.
3.5 Data Analysis
The data collected will be analyzed using the Karl Pearson correlation and multiple
linear regression using the statistical package for social studies (SPSS). The Karl
Pearson correlation will be used measure the degree of association between the
different variables under consideration while regression will be used to estimate the
causal relationship.
3.5.1 Analytical model
The regression model will take the following form
푌 = 훽° + 훽 푋 + 훽 푋 + 훽 푋 + 훽 푋 + 훽 푋 + 휀
Where;
푌 = Profitability
푅표퐴 = 푁푒푡푖푛푐표푚푒푇표푡푎푙푎푠푠푒푡푠
푋 = Day of Sales in Inventory (DSI)
퐷푆퐼 =퐴푣푒푟푎푔푒푠푡표푐푘퐶표푠푡표푓푠푎푙푒푠 푥 365

22
푋 = Day of Sales Outstanding (DSO)
퐷푆푂 =퐴푣푒푟푎푔푒퐷푒푏푡표푟푠퐶푟푒푑푖푡푠푎푙푒푠 푥 365
푋 = Days of Payables Outstanding (DPO)
퐷푃푂 =퐴푣푒푟푎푔푒 푃푎푦푎푏푙푒푠퐶푟푒푑푖푡 푝푢푟푐ℎ푎푠푒푠 푥 365
푋 = LEV=Debt ratio (Control variable)
퐷푒푏푡 푅푎푡푖표 = 푇표푡푎푙 푑푒푏푡푇표푡푎푙 푎푠푠푒푡푠
푋 =Firm Size= Natural logarithm of Sales
훽° = Constant
훽 − 훽 = Regression Coefficients
휀 = Error term
3.5.2 Test of Significance
To test the statistical significance the F test and the t test will be used. The F test will
be used the overall significance of the regression model while the t – test will be used
to test the significance of the coefficients at 95% confidence level.

23
CHAPTER FOUR
DATA ANALYSIS, RESULTS AND DISCUSSIONS
4.1 Introduction
This chapter presents analysis and findings of the study as set out in the research
objectives and research methodology. The study examines the effectof working
capital management on thefinancial performance of Retail Supermarkets in Nairobi
County, Kenya. The results are shown in terms of the descriptive analysis, correlation
analysis and regression analysis.
4.2 Response Rate
The study sought secondary data from thirteen Supermarkets operating in Nairobi
County, Kenya from the year 2010 up tothe year ended 2014. Data for eight
supermarkets was available and therefore 61.50% of the data targeted in the study was
available. This was a reliable response rate.
4.3 Descriptive Statistics
Presented herein are the descriptive statistics relating to trends of the variables over
the years, means and standard deviations. Results presented in Table 4.1 indicate the
mean and the standard deviation of all the variables considered in the study.
Table 4.1 Summary of Statistics
N Mean Std. Deviation Return on Assets (%) 40 9.2846 1.68382 Days of sales in Inventory (DSI) 40 34.5098 5.03007 Days of sales outstanding (DSO) 40 12.7752 4.12189 Days of payables outstanding (DPO) 40 29.6934 10.12976 Leverage (LEV) 40 .0789 .04334 Natural logarithms of sales (LN-sales) 40 15.5362 1.36278 Valid N (listwise) 40

24
As shown in Table 4.1, the results show that in total there were 40 observations
obtained from 8 supermarkets over a five year period. The mean ROA was 9.28%with
a standard deviation of 1.68. The mean Days of Sales in Inventory was 34.50 days
with a standard deviation of 5.03 days. The mean Days of sales outstanding was 12.77
days with a standard deviation of 4.12 days. The mean Days of payables outstanding
was 29.69 days with a standard deviation of 10.12 days. The mean cash conversion
cycle was 17.59 with a standard deviation of 9.48.The mean leverage was 0.789 with
a standard deviation of 0.43. The mean natural logarithm of sales was 15.53 with a
standard deviation of 1.36
4.4 Correlation Analysis
Correlation analysis was performed on the variables to test the linear correlationwith
ROA. The results as shown under Table 4.2 below indicate that ROA had a weak
negative correlation with DSI as indicated by a correlation coefficient of -0.110
whereas ROA had a weak positive correlation with DSO as indicated by a correlation
coefficient of 0.047. DPO had moderately significant negative correlationwith ROA (r
= -0.375.; p > 0.05). The correlation was controlled for leverage and size of the firm.
Table 4.2 Correlation Matrix
ROA DSI DSO DPO LEV LN_Sales
ROA 1.000 DSI -.110 1.000 DSO .047 .283 1.000 DPO -.375 .464 .232 1.000 LEV -.173 .345 .206 .733 1.000 LN_Sales -.436 .237 .065 .054 -.214 1.000
Source: Research Findings (2015)

25
4.5 Regression Analysis
A linear regression was performed with independent variables being Days of sales
outstanding (DSO), Days of sales in inventory (DSI)and Days of payables outstanding
(DPO).The controlling variables were leverage and firm’s size. The dependent
variable was return on assets (ROA).
4.5.1 Model Summary
Table 4.3 presents model summary which shows the value of R, R Square, the adjusted R
Square and the standard error of estimate.
Table 4.3 Model Summary
Model R R Square Adjusted R Square
Std. Error of the Estimate
1 .602a .363 .269 1.43965
a. Predictors: (Constant), LN_Sales, DPO, DSO, DSI, DR
b. Dependent Variable: ROA Source: Research Findings (2015)
The results on table 4.3 indicate that the independent variables included in the model
explained 36.3% ofchange in return on assets of the surveyed supermarkets. This
therefore indicates that 63.7% of change in return on assets of supermarkets was
explained by other factors that were not included in the model.
26
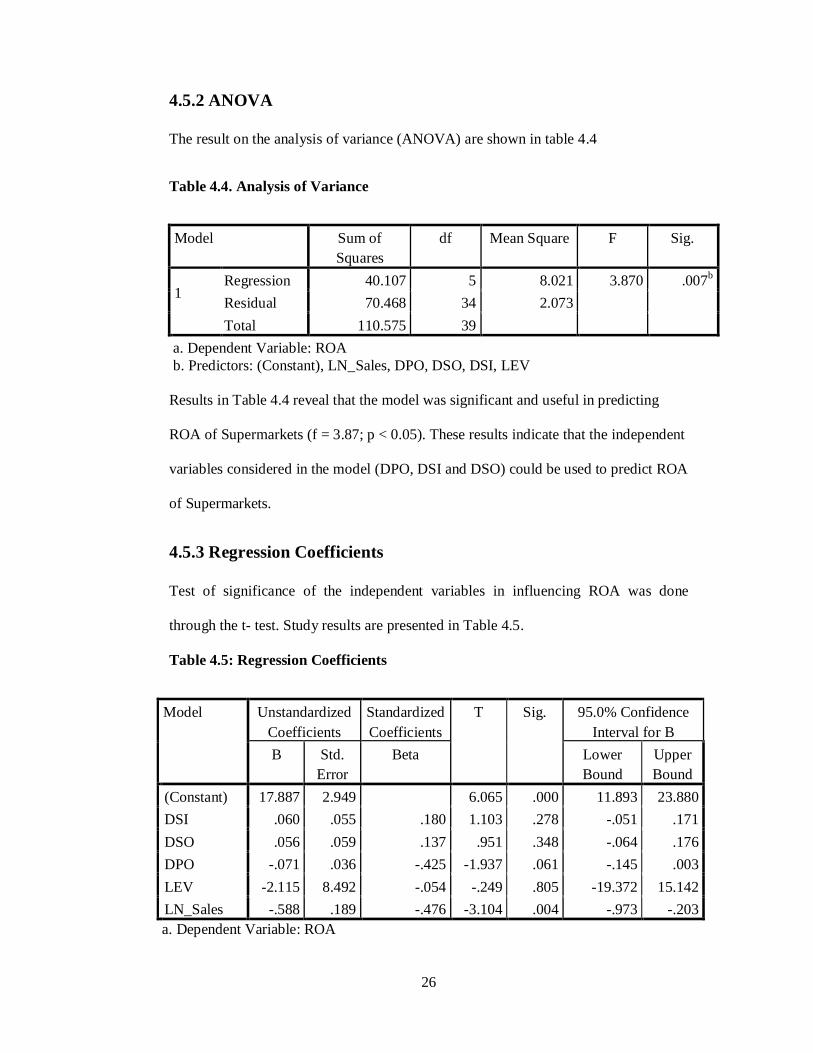
4.5.2 ANOVA
The result on the analysis of variance (ANOVA) are shown in table 4.4
Table 4.4. Analysis of Variance
Model Sum of Squares
df Mean Square F Sig.
1
Regression 40.107 5 8.021 3.870 .007b Residual 70.468 34 2.073
Total 110.575 39
a. Dependent Variable: ROA b. Predictors: (Constant), LN_Sales, DPO, DSO, DSI, LEV
Results in Table 4.4 reveal that the model was significant and useful in predicting
ROA of Supermarkets (f = 3.87; p < 0.05). These results indicate that the independent
variables considered in the model (DPO, DSI and DSO) could be used to predict ROA
of Supermarkets.
4.5.3 Regression Coefficients
Test of significance of the independent variables in influencing ROA was done
through the t- test. Study results are presented in Table 4.5.
Table 4.5: Regression Coefficients
Model Unstandardized Coefficients
Standardized Coefficients
T Sig. 95.0% Confidence Interval for B
B Std. Error
Beta Lower Bound
Upper Bound
(Constant) 17.887 2.949 6.065 .000 11.893 23.880 DSI .060 .055 .180 1.103 .278 -.051 .171 DSO .056 .059 .137 .951 .348 -.064 .176 DPO -.071 .036 -.425 -1.937 .061 -.145 .003 LEV -2.115 8.492 -.054 -.249 .805 -19.372 15.142 LN_Sales -.588 .189 -.476 -3.104 .004 -.973 -.203 a. Dependent Variable: ROA

27
The results indicate that DSIhad a positive and insignificant relationship with ROA (β
= 0.060; p =0.278> 0.05). Further, t-test indicated that DSOhad a positive and
insignificant relationship with ROA (β = 0.056; p=0.348> 0.05). Regression results
further indicated that DPO had a moderate negativesignificant relationship with ROA
(β = -0.071; p=0.061> 0.05). Size of the firm had a strong significant relationship on
ROA (β = -0.588; p=0.004<0.05).
4.6Discussion of ResearchFindings
The results indicate that the independent variables included in the model explained
36.3% of change in return on assets of the surveyed supermarkets. This therefore
indicates that 63.7% of change in return on assets of supermarkets was explained by
other factors that were not included in the model.Further, results reveal that the model
was significant and useful in predicting ROA of Supermarkets (f = 3.87; p < 0.05).
These results indicate that the independent variables considered in the model (DPO,
DSI and DSO) could be used to predict ROA of Supermarkets.
Correlation results indicate that there was a weak negative relationship between ROA
and DSI (r = -0.110; p > 0.05). However, this relationship was not significant at 5%
level. Further results indicate that DSO had an insignificant weak positiverelationship
with ROA (r = 0.047; p > 0.05). DPO had moderate significant negative relationship
with ROA(r = -0.375; p > 0.05). Further, t-test indicated that size of the firm was
significant and a strong predictor of ROA. The effect was shown to be negative (β =.-
0.588; t = -3.104; p < 0.05). Thefindings agree with a study by Deloof (2003) that
indicated that the efficient management of working capital would help a firm
maximize profits which will go a long way in maximizing shareholders wealth.

28
The study findings are similar to those of Malombe (2014) who studied the
relationship between WCM and profitability of reinsurance companies in East Africa.
The study concluded that there exists relationship between WCM and Profitability of
reinsurance companies in East Africa. Management of working capital through
increasing DPO without hurting the credit standing has an effect on thefinancial
performance and the value of a firm. The current study results indicate that a longer
DPO would lead to higher ROA. Leverage according to study results had
aninsignificant negative influence on ROA (β = -2.115; t = -0.249; p < 0.05). This
indicated that increase in leverage would not have a major impact on ROA for the
surveyed supermarkets.

29
CHAPTER FIVE
SUMMARY, CONCLUSIONS AND RECOMMENDATIONS
5.1 Introduction
The chapter presents a summary of the results on the relationship between working
capital management and financial performance of retail supermarkets in Nairobi
County, Kenya. Based on the findings in the previous chapter, the study gives
recommendations on what the supermarkets management can do to improve their
financial performance based on management of working capital. The
recommendations are presented based on the objective of the study after which
recommendations for further studies are drawn.
5.2 Summary of Findings
Correlation and regression analysis was performed to establish the relationship
between working capital management and financial performance of retail
supermarkets in Nairobi County, Kenya. The results indicate that there was a
moderate negative relationship between ROA and DPO (r = -0.375; p > 0.05).
However, this relationship was not significant at 5% level. Further results indicate that
DSI had an insignificant weak negative relationship with ROA (r = -0.110; p > 0.05).
DSO had an insignificant positive relationship with ROA (r = 0.047; p > 0.05).
Regression results indicate that DSI was not a significant predictor of ROA (β = .06; t =
1.103; p > 0.05). Further, t-test indicated that DSO was not a significant predictor of ROA.
The effect was shown to be positive (β = 0.056; t = 0.951; p < 0.05). Study results further
indicated that DPO had moderate significant negative relationship with ROA(r = -
0.375; p > 0.05).

30
5.3 Conclusion
Working capital management is particularly important in the case retail supermarkets.
Most of these companies’ assets are in the form of current assets. Also, current
liabilities are one of their main sources of external finance. In this context, the
objective of the current research has been to provide empirical evidence about the
effects of working capital management on the financial performance of a sample of
supermarkets in Kenya. To this end, a sample of eight firms was used to conduct a
study with data on DPO, DSI and DSO while controlling for firm’s size and leverage.
Though working capital plays an important role in value generation in retail
supermarkets, the study concludes that DSI and DSO did not have a significant
relationship with financial performance of the surveyed supermarkets. However, the
study concludes thatDPO had moderately significant influence on financial
performance of retail supermarkets. Firms should therefore analyze DPO to ensure
balance between liquidity and profitability (Gitman, 1997).This therefore implies that
supermarkets which focus on ensuring that there is consistency and efficiency in the
employment of current assets and current liabilities during their day to day activities
stand a better chance of realizing growth in sales but may suffer reduced profitability
as more money is tied into the working capital. As firms make more investment in
current assets, the risk is reduced and so is the return.
5.4 Recommendations
While working capital management is of importance to all firms and particularly for
those operating in developing and emerging markets like Kenya. Firms in these
markets are mostly constrained with financing options and have limitations
inaccessing long‐term financing.These firms therefore, tend to rely more heavily on

31
personal financing, trade credit and short-term bank loans or overdrafts to finance
their needed investment working capital. Management of retail supermarkets in the
Kenyan market shoulddevelop working capital policies that will effectively and
efficiently manage their working capital to ensure that maximum returns are derived
for their respective firms.
Quite often, success of firm’s management ismeasured by the market value. Therefore
efficient working capital management should maximize shareholderswealth.
Management shouldmanage the link between accounting as well as market
performance and management of the cash conversion cycle. Efficient management of
DSO, DPO and DSI is therefore a top priority.
5.5Limitations of the Study
The main limitation was the data accessibility. A majority of the firms sampled were
private companies who were not willing to share the information contained on their
financial statements and only referred the researcher to their website. However, the
data on the website was limited and scanty forcing the researcher to obtain data from
the Nairobi County Government offices.The secondary data used in the research may
be biased since the primary users of the data, that is, County Government, had wanted
it in their own form to suit their interests e.g. renewal of trading licenses through
reporting financial performance. This may not serve the researcher’s purposes in
analyzing the relationship.

32
5.6Suggestions for Further Research
More studies need to be done in this area with primary focus on increasing sample
size to include other Counties in Kenya, as the focus on Nairobi is narrow and may
not offer the most reliable results that can be inferred to other areas.
Studies should also be conducted on the topic using fairly longer time periods (more
than 5 years) as such studies may be useful in showing the trends as well as the long
terms relationship between working capital management and financial performance.
The study also recommends that further studies explore the relationship between
working capital management and financial performance using a mixed methodology
where both primary and secondary sources of data are used. This way, some of the
issues that cannot be addressed through secondary data can be accurately captured.
There is also need for more studies to examine the determinants of working capital
management in retail organizations. This will be important in providing insights into
how the working capital decisions of a firm can be improved. Future studies can use
an improved model with more firm-specific control variables in the model as such
may improve the accuracy of the financial performance model andtherefore lead to
better and robust results.

33
REFERENCES
Andreas, S. (2009). Determinants of Firm Profitability – The Effect of Productivity
and its Persistence.Melbourne Institute of Applied Economic and Social
Research. The University of Melbourne June 2009
Baumol, W. J. (1952). The Transactions Demand for Cash: An Inventory Theoretic
Approach. Quarterly Journal of Economics, November, 545-556.
Bickman, L. & Rog, D. J. (1998).A Hand Book of Social Research Methods.
(2nded)Sage publishers; Inc.
Bodie, Z. & Merton, R.C. (2000).Finance.(International Ed.), Prentice Hall, New
Jersey.
Brigham, E. F. &Ehrhardt, M. C. (2004).Financial Management: Theory on Practice
(11th Ed.). New York. South-Western College Publishers.
Brigham, E.F., Gapenski, & L.C., Ehrhardt, M.C. (1999). Financial Management:
Theory and Practice. (19th Ed.). Japan. The Dryden Press.
Charitou, M. S., Elfani, M. & Lois, P. (2010). The Effect of Working Capital
Management on Firm’s Profitability: Empirical Evidence from an Emerging
Market. Journal of Business & Economics Research, 8(12), 63-68
Deloof, M. (2003). Does Working Capital Management Affect Profitability of
Belgian firms? Journal of Business Finance & Accounting, 30(4), 573 - 587.
Ernest and Young.(2012). Working capital trends; Working capital management
survey.Ernest and Young Inc.
Gallinger, G.W. & Healey, P.B. (1987).Liquidity Analysis and Management Reading,
Massachusetts: Addison-Wesley Publishing Company.
Gitman, L.J. (1997). Principles of Managerial Finance.(7th Ed.). New York: Harper
Collins College Publishers, 684-710.
Haresh, B. (2012). Working Capital Management and Profitability: Evidence from
India – An Empirical Study. GFJMR, 5, 1-16

34
Hidaya, K. (2014). The relationship between working capital management and
financial performance of supermarkets in Nairobi County.Unpublished
project.University of Nairobi.
Karadagli, E. C. (2012). The Effect of Working Capital Management on the
Profitability of Turkish SMEs.British Journal of Economics, Finance and
Management Sciences, 5 (2), 36-44
Kenya National Bureau of Statistics.(2015). Economic Survey.Nairobi. Kenya
National Bureau of Statistics.
Kothari C. R. (2004). Research Methodology: Methods and Techniques. New Delhi:
New Age International (P) Ltd, Publishers
Kweri, M. (2011). Working capital management and profitability of manufacturing
firms listed at Nairobi stock exchange; Unpublished Project. University of
Nairobi.
Lazaridis, J. &Tryfonidis, D. (2006).Relationship between working capital
management and profitability of listed companies in the Athens stock
exchange.J. Fin. Manage. Anal., 19:26-35
Malombe, N.W (2012). Relationship between Working Capital Management and
profitability of reinsurance companies in East Africa. Unpublished
Project.University of Nairobi.
Mathai, A.N. (2012). Relationship between Working Capital Management and retail
supermarkets in Kenya.Unpublished Project.University of Nairobi.
Mugenda, O.M. &Mugenda, A. G. (2003).Research methods quantitative and
qualitative approaches. Nairobi: Applied Research and Training Services
Press.
Murega, M.T (2013). Effects of Working Capital Management on corporate
profitability among firms listed at Nairobi Securities Exchange. Unpublished
Project.University of Nairobi.

35
Narware, P.C (2004). Working Capital and Profitability: An empirical analysis. The
Management Accountant, 39, (6), 120-127.
Ng’ang’a, S. C. (2009).Relationship between Working Capital and Profitability of
listed companies in NSE.Unpublished Project.University of Nairobi.
Nyamao, N.R. (2012). Effect of working capital management practices on financial
performance: A study of small-scale enterprises in Kisii South District, Kenya.
African Journal of Business Management, 6(18), 7-8.
Omino, B.O. (2014). Effect of working capital management on profitability of retail
stores in Migori County, Kenya.Unpublished Project.University of Nairobi.
Osundina, J.A. (2014). Working Capital Management and Profitability of Selected
Quoted Food and Beverages Manufacturing Firms in Nigeria. European
Journal of Accounting Auditing and Finance Research, 2 (3), 10-21
Pandey, L. (2011). Financial Management (10th Ed.).Vikas Publishing House, New
Delhi.
Raheman, A. & Nasr, M. (2007). Working Capital Management and Profitability:
Case of Pakistan Firms. International Review of Business Research Papers, 3
(2), 276-296.
Richards, V. D. & Laughlin, E. J. (1980).A cash conversion cycle approach to
liquidity analysis.Journal of Financial Management, 9, 32-38
Runyora, E. (2012). The impact of Working Capital Management on the profitability
of the oil industry in Kenya.Unpublished Project.University of Nairobi.
Sarbapriya, R. (2012). Evaluating the Impact of Working Capital Management
Components on Corporate Profitability: Evidence from Indian Manufacturing
Firms.International Journal of Economic Practices and Theories, 2 (3), 127-
136
Smith, K. (1980). Profitability versus Liquidity Trade-Offs in Working Capital
Management in Readings on the Management of Working Capital. New York.
St. Paul West Publishing Company.

36
Soenen, L. A. (1993). Cash Conversion Cycle and Corporate Profitability.Journal of
Cash Management, 13(4), 53-58.
Teruel, A. & Solano, K. (2005).Effects of Working Capital Management on SME
Profitability.Working Papers Series.
Van-Horne, J.C. &Wachowicz, J.M. (2004).Fundamentals of Financial Management
(12th Ed.). New York. Prentice Hall Publishers.
Zariyawati, M. A., Annuar, M. N., Taufiq, H. & Rahim, A. S. A. (2008). Working
capital management and corporate performance: Case of Malaysia. Journal of
Modern Accounting and Auditing, 5 (11), 47-54.

37
APPENDICES
Appendix I: Data Collection Form
Company Name:…………………………………………………………
Variable Year
2014
Year
2013
Year
2012
Year
2011
Year
2010
Annual Sales
Average Inventory
Cost of Sales
Gross profit
Net profit
Cash & Cash Equivalents
Accounts Receivable
Total current Assets
Total Non-current Assets
Total Assets
Accounts payables
Total Current Liabilities
Total Non-Current Liabilities
Total Liabilities
Total Term Debts

38
Appendix II: List of Major Retail Supermarkets in Nairobi County,
Kenya as at 31st December 2014 1. Chandarana Supermarkets
2. Cleanshelf Supermarkets
3. EastmattSupermarkets
4. Ebrahims Wholesalers
5. G – Mart Supermarkets
6. Karrymatt Supermarkets
7. Kassmart Supermarkets
8. Mathai Supermarkets
9. Naivas Supermarkets
10. Nakumatt Supermarkets
11. Tuskys Supermarkets
12. Uchumi Supermarkets
13. Ukwala Supermarkets
Source: Kenya Business directory (2015)

39
Appendix III: Data from the Sampled Supermarkets
Supermarket 1 Year 2014 Year 2013 Year 2012 Year 2011 Year 2010
Variables KShs’000 KShs’000 KShs’000 KShs’000 KShs’000
Total Sales
14,457,687
14,368,643
13,918,530
10,840,728
8,860,736
Average
Inventory
1,259,142
1,126,512
1,011,826
930,689
910,234
Cost of Sales
11,643,604
11,600,148
11,407,227
8,943,513
7,001,301
Gross Profit
2,814,083
2,768,495
2,511,303
1,897,215
1,859,435
Net Profit
384,288
357,010
273,977
390,425
289,130
Cash & Cash
Equivalents
133,583
104,459
132,463
130,632
100,621
Accounts
Receivables
778,697
435,791
388,424
307,503
295,503
Total Current
Assets
2,250,436
1,726,541
1,594,146
1,397,650
1,305,706
Non-Current
Assets
4,634,417
3,848,218
3,347,742
2,607,070
2,195,965
Total Assets
6,884,853
5,574,759
4,941,888
4,004,720
3,501,671
Accounts
Payables
1,876,267
1,845,793
1,631,350
1,140,804
940,818
Total Current
Liabilities
3,350,169
2,449,347
2,203,769
1,542,187
1,232,420
Non-Current
Liabilities
177,370
200,000
80,309
183,368 89,100
Total Debts
1,545,791
773,337
622,752
551,796
348,337

40
Supermarket 2 Year 2014 Year 2013 Year 2012 Year 2011 Year 2010
Variables KShs’000 KShs’000 KShs’000 KShs’000 KShs’000
Total Sales
46,553,752
42,387,497
41,198,849
34,690,329
28,797,392
Average
Inventory
3,437,511
3,330,270
3,126,693
2,951,353
2,798,010
Cost of Sales
37,375,969
34,800,444
32,396,525
28,426,810
23,330,013
Gross Profit
9,177,783
7,587,053
8,802,324
6,263,520
5,467,378
Net Profit
1,634,050
1,272,636
1,392,766
1,190,107
1,023,485
Cash & Cash
Equivalents
885,529
871,450
820,260
660,048
604,800
Accounts
Receivables
1,674,199
1,453,753
982,713
753,382
701,020
Total Current
Assets
6,036,763
5,739,716
5,068,318
4,424,243
4,216,623
Non-Current
Assets
12,481,083
12,449,321
11,950,405
10,788,741
10,074,807
Total Assets
18,517,846
18,189,037
17,018,724
15,212,984
14,291,431
Accounts
Payables
2,042,969
1,944,764
1,870,697
1,863,342
1,783,901
Total Current
Liabilities
2,583,836
2,537,198
2,425,041
2,446,993
2,374,467
Non-Current
Liabilities
213,248
357,120
474,402
551,684
673,012
Total Debts
687,239
850,140
971,792
1,056,572
1,215,312

41
Supermarket 3 Year 2014 Year 2013 Year 2012 Year 2011 Year 2010
Variables KShs’000 KShs’000 KShs’000 KShs’000 KShs’000
Total Sales
28,626,220
28,306,227
27,419,504
23,849,601
19,493,619
Average
Inventory
2,087,861
2,030,170
1,976,743
1,936,420
1,789,801
Cost of Sales
23,287,208
22,040,281
21,673,731
18,781,377
15,402,862
Gross Profit
5,339,012
6,265,946
5,745,773
5,068,224
4,090,757
Net Profit
1,516,607
971,923
1,194,593
1,154,251
847,488
Cash & Cash
Equivalents
487,103
447,268
514,261
511,983
468,020
Accounts
Receivables
1,074,139
832,815
812,213
653,312
709,109
Total Current
Assets
3,738,629
3,291,461
3,389,669
3,075,843
3,149,999
Non-Current
Assets
9,527,997
8,307,460
7,384,927
7,065,752
6,486,892
Total Assets
13,266,626
11,598,921
10,774,596
10,141,595
9,636,891
Accounts
Payables
1,542,969
1,444,764
1,470,697
1,363,342
1,320,199
Total Current
Liabilities
1,870,040
1,718,519
1,740,101
1,667,712
1,610,993
Non-Current
Liabilities
380,800
145,037
366,736
200,095
280,112
Total Debts
646,455
350,803
568,694
433,446
499,885

42
Supermarket 4 Year 2014 Year 2013 Year 2012 Year 2011 Year 2010
Variables KShs’000 KShs’000 KShs’000 KShs’000 KShs’000
Total Sales
10,486,336
10,132,125
9,661,534
8,268,061
6,738,716
Average
Inventory
678,439
632,233
557,687
511,595
501,900
Cost of Sales
8,448,599
8,352,107
7,870,987
6,618,200
5,454,013
Gross Profit
2,105,512
1,849,630
1,871,984
1,729,161
1,368,753
Net Profit
415,336
396,254
313,825
409,889
300,708
Cash & Cash
Equivalents
92,840
67,898
86,101
84,911
65,404
Accounts
Receivables
391,194
383,264
352,476
299,877
290,109
Total Current
Assets
1,174,053
1,122,252
1,036,195
908,473
860,036
Non-Current
Assets
3,219,570
3,099,764
3,151,605
2,999,114
2,879,381
Total Assets
4,393,623
4,222,016
4,187,800
3,907,586
3,739,417
Accounts
Payables
456,064
427,348
530,498
436,647
404,426
Total Current
Liabilities
529,277
517,668
624,016
540,030
489,637
Non-Current
Liabilities
198,001
176,333
126,735
66,834
26,855
Total Debts
253,198
247,012
199,270
145,501
91,837

43
Supermarket 5 Year 2014 Year 2013 Year 2012 Year 2011 Year 2010
Variables KShs’000 KShs’000 KShs’000 KShs’000 KShs’000
Total Sales
4,691,519
4,123,801
4,175,559
3,794,255
3,437,966
Average
Inventory
402,935
338,418
297,705
290,620
285,019
Cost of Sales
3,842,389
3,364,043
3,308,096
3,040,794
2,800,520
Gross Profit
849,130
759,758
867,463
753,460
637,445
Net Profit
235,341
148,299
177,227
165,216
114,402
Cash & Cash
Equivalents
92,840
67,898
86,101
84,911
65,404
Accounts
Receivables
294,674
190,232
181,569
161,501
150,103
Total Current
Assets
796,747
608,096
526,940
489,491
487,078
Non-Current
Assets
1,292,670
1,219,877
1,061,583
963,401
867,457
Total Assets
2,089,418
1,827,972
1,588,523
1,452,892
1,354,535
Accounts
Payables
329,614
309,672
249,652
206,241
200,176
Total Current
Liabilities
408,620
353,299
274,473
232,346
255,018
Non-Current
Liabilities
119,091
109,002
78,012
48,100
15,010
Total Debts
192,364
145,679
94,590
66,955
62,732

44
Supermarket 6 Year 2014 Year 2013 Year 2012 Year 2011 Year 2010
Variables KShs’000 KShs’000 KShs’000 KShs’000 KShs’000
Total Sales
3,469,845
2,873,729
2,922,891
2,872,793
2,348,095
Average
Inventory
293,494
269,963
227,690
202,224
198,018
Cost of Sales
2,841,039
2,354,830
2,395,518
2,325,313
1,890,351
Gross Profit
628,806
518,899
527,374
547,480
457,744
Net Profit
175,567
132,184
126,438
95,320
115,774
Cash & Cash
Equivalents
28,052
20,892
25,168
22,207
17,106
Accounts
Receivables
213,609
154,316
135,948
123,001
104,023
Total Current
Assets
542,674
462,466
415,036
348,326
323,772
Non-Current
Assets
1,166,564
1,005,401
851,206
818,306
772,030
Total Assets
1,709,238
1,467,867
1,266,242
1,166,632
1,095,802
Accounts
Payables
244,624
234,625
202,307
186,272
160,819
Total Current
Liabilities
315,815
254,605
224,230
220,232
209,834
Non-Current
Liabilities
174,841
108,012
35,010
78,100
119,002
Total Debts
227,555
121,646
50,639
105,798
161,868
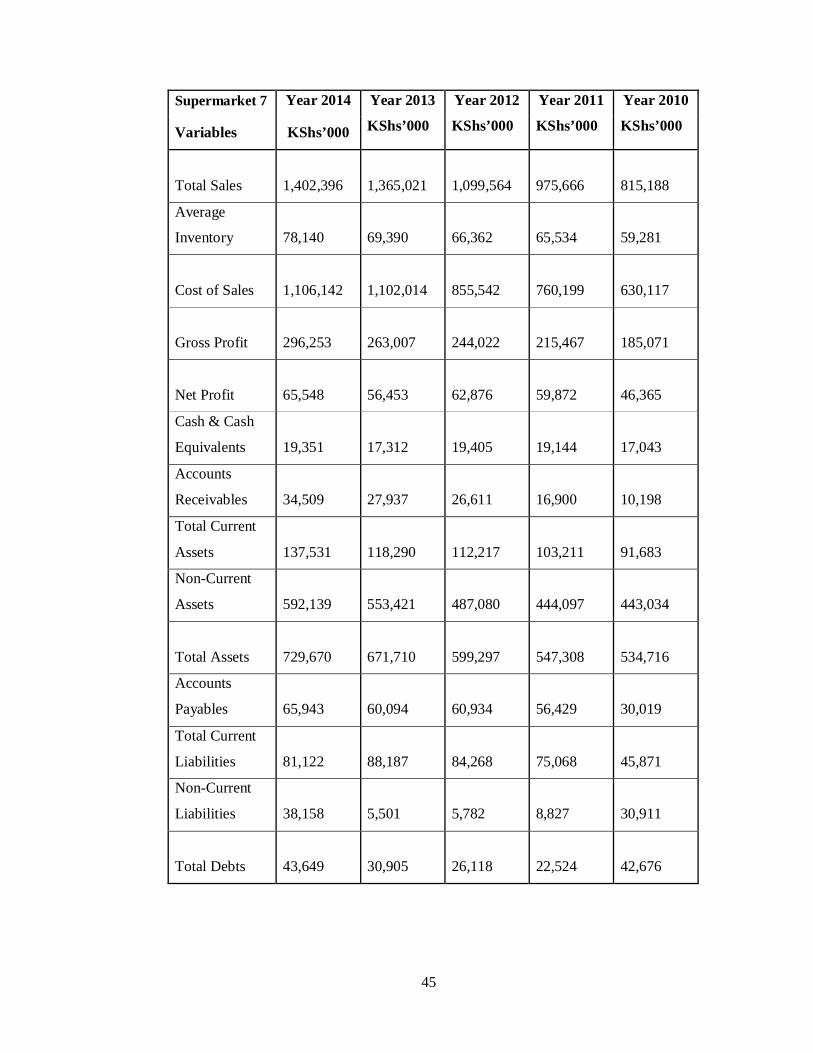
45
Supermarket 7 Year 2014 Year 2013 Year 2012 Year 2011 Year 2010
Variables KShs’000 KShs’000 KShs’000 KShs’000 KShs’000
Total Sales
1,402,396
1,365,021
1,099,564
975,666
815,188
Average
Inventory
78,140
69,390
66,362
65,534
59,281
Cost of Sales
1,106,142
1,102,014
855,542
760,199
630,117
Gross Profit
296,253
263,007
244,022
215,467
185,071
Net Profit
65,548
56,453
62,876
59,872
46,365
Cash & Cash
Equivalents
19,351
17,312
19,405
19,144
17,043
Accounts
Receivables
34,509
27,937
26,611
16,900
10,198
Total Current
Assets
137,531
118,290
112,217
103,211
91,683
Non-Current
Assets
592,139
553,421
487,080
444,097
443,034
Total Assets
729,670
671,710
599,297
547,308
534,716
Accounts
Payables
65,943
60,094
60,934
56,429
30,019
Total Current
Liabilities
81,122
88,187
84,268
75,068
45,871
Non-Current
Liabilities
38,158
5,501
5,782
8,827
30,911
Total Debts
43,649
30,905
26,118
22,524
42,676
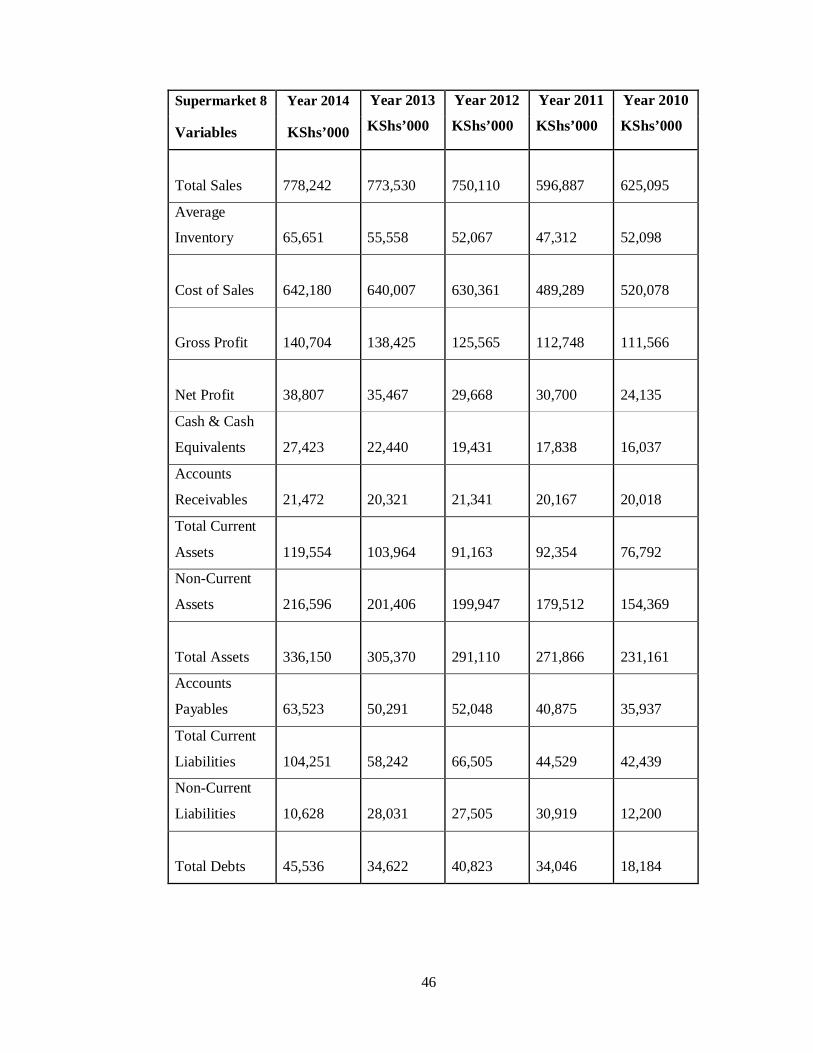
46
Supermarket 8 Year 2014 Year 2013 Year 2012 Year 2011 Year 2010
Variables KShs’000 KShs’000 KShs’000 KShs’000 KShs’000
Total Sales
778,242
773,530
750,110
596,887
625,095
Average
Inventory
65,651
55,558
52,067
47,312
52,098
Cost of Sales
642,180
640,007
630,361
489,289
520,078
Gross Profit
140,704
138,425
125,565
112,748
111,566
Net Profit
38,807
35,467
29,668
30,700
24,135
Cash & Cash
Equivalents
27,423
22,440
19,431
17,838
16,037
Accounts
Receivables
21,472
20,321
21,341
20,167
20,018
Total Current
Assets
119,554
103,964
91,163
92,354
76,792
Non-Current
Assets
216,596
201,406
199,947
179,512
154,369
Total Assets
336,150
305,370
291,110
271,866
231,161
Accounts
Payables
63,523
50,291
52,048
40,875
35,937
Total Current
Liabilities
104,251
58,242
66,505
44,529
42,439
Non-Current
Liabilities
10,628
28,031
27,505
30,919
12,200
Total Debts
45,536
34,622
40,823
34,046
18,184