the effects of volatile fatty acids on the performance of
TRANSCRIPT
Western University Western University
Scholarship@Western Scholarship@Western
Electronic Thesis and Dissertation Repository
8-4-2015 12:00 AM
The Effects of Volatile Fatty Acids on the Performance of The Effects of Volatile Fatty Acids on the Performance of
Microbial Electrolysis Cells Microbial Electrolysis Cells
Nan Yang, The University of Western Ontario
Supervisor: Dr. George Nakhla, The University of Western Ontario
Co-Supervisor: Dr. Hisham Hafez, The University of Western Ontario
A thesis submitted in partial fulfillment of the requirements for the Master of Engineering
Science degree in Civil and Environmental Engineering
© Nan Yang 2015
Follow this and additional works at: https://ir.lib.uwo.ca/etd
Part of the Environmental Engineering Commons
Recommended Citation Recommended Citation Yang, Nan, "The Effects of Volatile Fatty Acids on the Performance of Microbial Electrolysis Cells" (2015). Electronic Thesis and Dissertation Repository. 3145. https://ir.lib.uwo.ca/etd/3145
This Dissertation/Thesis is brought to you for free and open access by Scholarship@Western. It has been accepted for inclusion in Electronic Thesis and Dissertation Repository by an authorized administrator of Scholarship@Western. For more information, please contact [email protected].
The Effects of Volatile Fatty Acids on the Performance of Microbial
Electrolysis Cells
(Thesis format: Integrated Article)
by
Nan Yang
Graduate Program in Civil and Environmental Engineering
A thesis submitted in partial fulfillment
of the requirements for the degree of
Master in Engineering Science
The School of Graduate and Postdoctoral Studies
The University of Western Ontario
London, Ontario, Canada
© Nan Yang 2015

i
Abstract
This study investigated the performance of microbial electrolysis cells (MECs) fed with three
common fermentation products: acetate, butyrate, and propionate. Each substrate was fed to
the reactor for three consecutive-batch cycles. The results showed high current densities for
acetate, but low current densities for butyrate and propionate (maximum values were 6.0 ±
0.28, 2.5 ± 0.06, 1.6 ± 0.14 A/m2, respectively). Acetate also showed a higher coulombic
efficiency of 87 ± 5.7 % compared to 72 ± 2.0 and 51 ± 6.4 % for butyrate and propionate,
respectively. This paper also revealed that acetate could be easily oxidized by anode respiring
bacteria in MEC, while butyrate and propionate could not be oxidized to the same degree. The
utilization rate of the substrates in MEC followed the order: acetate > butyrate > propionate.
The ratio of suspended biomass to attached biomass was approximately 1:4 for all the three
substrates.
Keywords
Microbial electrolysis cell, volatile fatty acids, hydrogen, biomass

ii
Co-Authorship Statement
Dr. George Nakhla and Dr. Hisham Hafez provided supervision and guidance to the research
project.
Chapter 3: Impact of Volatile Fatty Acids on Microbial Electrolysis Cell Performance
Nan Yang, Hisham Hafez, George Nakhla
My contributions are as follows:
Design and execution of the experimental testing program
Analysis and interpretation of the findings
Writing the paper
Subsequent modifications were carried out by Dr. Nakhla and Dr. Hafez.

iii
To my beloved parents for their support,
my boyfriend, Minchao, for his accompany and endless love,
and my nieces, Yunhui and Yunzheng, for their cuteness.

iv
Acknowledgments
I would like to express my deepest appreciation and respect to my advisors’ Dr. George Nakhla
and Dr. Hisham Hafez for their constant guidance and support. I am deeply touched by Dr.
Nakhla’s enthusiasm for student training and his way of encouraging his students to think. Dr.
Nakhla is very well-known for his continuous-flow strive to maintain high standards and
pushing his student to think critically, which was very crucial to develop my potential, and for
which I am deeply indebted. Without his encouragement and pushes, I could not have achieved
the utmost of my potential. Dr. Hisham Hafez also offered me a lot of help throughout my
master studies. I am grateful for his kindness and support.
I would like to express my sincere gratitude to Dr. Elsayed Elbeshbishy and Bipro Dhar for
their help during the start-up of the reactors. I would also like to thank my colleague and good
friends, especially Medhvi Gupta, Noha Nasr, Maritza Gomez-Flores, Chinaza Akobi, Basem
Haroun, Joseph Donohue, Nael Yasri, Zhenqi Wang, Kai Li, Xiaoguang Liu, Mingu Kim,
Manoli Kyriakos. They are always so kind, helpful, and cheerful. I feel very lucky to be one
of this wonderful team. Last but not least, I would like to thank my family, my boyfriend, and
my friends, for their priceless care, inspiration, and endless love.
v
Table of Contents
Abstract ................................................................................................................................ i
Co-Authorship Statement.................................................................................................... ii
Acknowledgments.............................................................................................................. iv
Table of Contents ................................................................................................................ v
List of Tables ................................................................................................................... viii
List of Figures .................................................................................................................... ix
Nomenclature ..................................................................................................................... xi
Chapter 1 ............................................................................................................................. 1
Introduction ......................................................................................................................... 1
1.1 Background .............................................................................................................. 1
1.2 Research Objectives ................................................................................................. 2
1.3 Research Contributions ............................................................................................ 3
1.4 Thesis Organization ................................................................................................. 3
1.5 References ................................................................................................................ 3
Chapter 2 ............................................................................................................................. 5
Literature Review................................................................................................................ 5
2.1 Introduction .............................................................................................................. 5
2.2 Materials ................................................................................................................... 7
2.2.1 Anode ............................................................................................................. 7
2.2.2 Cathode .......................................................................................................... 9
2.2.3 Membrane .................................................................................................... 10
2.3 Microorganisms ..................................................................................................... 18
2.4 Modification of MEC design ................................................................................. 20
2.4.1 Multi-electrode ............................................................................................. 20
3.4.2 Gas-phase Cathodes ..................................................................................... 21
vi
2.4.3 Up-flow continuous-flow system ................................................................. 27
2.4.4 Biocathode ................................................................................................... 29
2.5 Combined process .................................................................................................. 30
2.6 Pilot-scale continuous-flow microbial electrolysis cell ......................................... 31
2.7 Discussion .............................................................................................................. 32
2.7 Reference................................................................................................................ 33
Chapter 3 ........................................................................................................................... 41
Impact of Volatile Fatty Acids on Microbial Electrolysis Cell Performance .................. 41
3.1 Introduction ............................................................................................................ 41
3.2 Materials and methods ........................................................................................... 45
3.2.1 Reactor set-up .............................................................................................. 45
3.2.2 MEC inoculation and operation .......................................................................... 47
3.2.3 Analytical methods ...................................................................................... 48
3.2.4 Calculations.................................................................................................. 49
3.3 Results and discussion ........................................................................................... 51
3.3.1 Effects of substrate on current density and hydrogen production rate ......... 51
3.3.2 Effects of substrate on hydrogen recovery and energy efficiency ............... 54
3.4 Conclusion ............................................................................................................. 63
3.5 References .............................................................................................................. 65
Chapter 4 ........................................................................................................................... 71
Conclusions and Recommendations ................................................................................. 71
4.1 Conclusions ............................................................................................................ 71
4.2 Recommendations .................................................................................................. 73
Appendices ........................................................................................................................ 75
Appendix A .................................................................................................................. 76
A.1 Material summary ................................................................................................. 76
vii
A.2 MEC fabrication .................................................................................................... 77
A.3 Pretreatment method ............................................................................................. 80
A3.1. Carbon fiber pretreatment (3 days in series) ............................................... 80
A3.2. Membrane pre-treatment ............................................................................. 81
A.4 Medium preparation .............................................................................................. 82
Appendix B. Calculation summary .............................................................................. 84
Curriculum Vitae .............................................................................................................. 89
viii
List of Tables
Table 2.1 -- Components and performance of two-chamber MECs in continuous-flow mode
................................................................................................................................................. 15
Table 2.2 -- Components and performance of single chamber MECs in continuous-flow
mode ........................................................................................................................................ 17
Table 2.3 -- Components and performance of MEC with gas-phase cathode in continuous-
flow mode ............................................................................................................................... 24
Table 3. 1 -- Summary of current densities and removal efficiencies by different authors
using acetate, butyrate and propionate .................................................................................... 44
Table 3. 2 -- Comparison of key parameters reported in literatures versus data obtained in this
study ........................................................................................................................................ 57
Table 3.3 -- COD data for each cycle ..................................................................................... 60
Table 3.4 -- COD mass distribution ........................................................................................ 60
Table 3.5 -- Average biomass yield based on the COD removed for each substrate .............. 62
ix
List of Figures
Figure 2.1 –The development of continuous-flow MECs during the past years based on the
number of journal papers being published. The total number of articles is based on “Scopus”
search using “microbial electrolysis cell” as key word in July 2015, while the number of
continuous-flow articles is further limited to “continuous” as refined key word. .................... 7
Figure 2.2 – Proton transfers from anode to cathode by negative charges through AEM (left)
and hydroxide transfers from cathode to anode through AEM (right). .................................. 12
Figure 2.3 – Schematic of three EET mechanisms used by ARB: (a) direct electron transfer,
(b) an electron shuttle, and (c) a solid conductive matrix (Torres et al., 2009) ...................... 18
Figure 2.4 – (A) Schematic (top view) and (B) photograph of the 2.5 L scale-up continuous-
flow microbial electrolysis cell containing 8 half graphite brush anodes and 8 stainless steel
mesh cathodes: (a) gas bag, (b) power sources, (c) fluid pump, and (d) substrate feed tank.
(Rader et al., 2010).................................................................................................................. 20
Figure 2.5 – Diagram of a continuous-flow MEC setup. (Tartakovsky et al., 2009) ............. 21
Figure 2.6 – Design of up-flow biocatalyzed electrolysis reactor (UBER). Left: Schematic
diagram of the system. Right: Laboratory scale reactor for NB reduction (Wang et al., 2012)
................................................................................................................................................. 27
Figure 2.7 – Schematic diagram of the SRB-biocathode MEC. (Luo et al., 2014) ................ 29
Figure 2.8 – The structure of anaerobic baffled reactor combining with microbial electrolysis
cells. (Ran et al., 2014) ........................................................................................................... 30
Figure 3.1 -- a – Schematic illustration of a typical two-chamber MEC with an anion
exchange membrane (AEM); b – Picture of connecting the anode chamber (1), anode
electrode (2), membrane (3), cathode chamber (4), cathode electrode (5), and non-conductive
polyethylene (6) together ........................................................................................................ 46
Figure 3.2 – The changes of current densities with different substrates, including: start-up
cycle (1), acetate-fed cycles (2 to 4), butyrate-fed cycles (5 to 7), propionate-fed cycles (8 to

x
10), and acetate-fed cycle (11). The COD of cycle 1 to 4 are 1600 mg/L, and for cycle 5 to 11
are 800 mg/L. .......................................................................................................................... 52
Figure 3.3 – The average current densities and hydrogen production rates in MEC fed with
different substrates .................................................................................................................. 54
Figure 3.4 – The coulombic efficiencies (CE), cathodic hydrogen recoveries and overall
hydrogen recoveries in MEC fed with different substrates .................................................... 55
Figure 3.5 – The relationship of CD/HPR (current density/hydrogen production rate) and
cathodic hydrogen recoveries in MEC fed with different substrates ...................................... 56
Figure 3.6 – The changes of hydrogen yields (YH2), energy efficiencies with only electric
input (ηE), and energy efficiencies including both electric input and the energy content in
substrate (ηE+S) in MEC fed with different substrates ............................................................ 59
Figure A2.1 -- Anode preparation: materials used for anode (left) and wrapping around the
anode electrode with carbon fiber (right). ............................................................................... 77
Figure A2.2 -- Pretreatment of the anode in the fume hood: a) 1st day with nitric acid (1N); b)
2nd day with acetone (1N); c) 3rd day with ethanol (1N) ......................................................... 77
Figure A2.3 -- (a) Membrane after pretreatment: 24 hours at 40oC in 5% NaCl solution (b)
Cathode (left), membrane (middle) and anode (right) (c) Brushing Vaseline onto rubber to
prevent leaking (d) Connecting the anode chamber, anode electrode, membrane, cathode
electrode and cathode chamber together ................................................................................. 78
Figure A2.4 – (a) Picture of connecting the anode and cathode electrode to the power supply
(b) A resister is connected in series with anode and cathode (c) Set-up picture of the MEC
system ..................................................................................................................................... 79
xi
Nomenclature
ABR Anaerobic baffled reactor
AEM Anion exchange membrane
ARB Anode respiring bacteria
BEAMR Bio-electrochemically assisted microbial reactor
BES Bioelectrochemcial system
CEM Cation exchange membrane
COD Chemical oxygen demand
DPRB Dissimilatory perchlorate reducing bacteria
EET Extracellular electron transfer
HER Hydrogen evolution reaction
HRT Hydraulic retention time
MECs Microbial electrolysis cells
MFCs Microbial fuel cells
PEM Proton exchange membrane
SCOD Soluble chemical oxygen demand
SRB Sulfate reducing bacteria
UASB Up-flow anaerobic sludge bed
UBER Up-flow biocatalyzed electrolysis reactor
VFAs Volatile fatty acids

1
Chapter 1
Introduction
1.1 Background
Hydrogen potentially plays a key role in sustainable energy production. It can be recovered
by dark fermentation of organic material rich in carbohydrates, but a major fraction of organic
matter remains in the form of volatile fatty acids (VFAs) (Liu et al., 2005).
Theoretically, 12 moles of hydrogen can be extracted from 1 mole of glucose, if the
complete conversion reaction to hydrogen is taken into account (Eq. (1)). However, in practice,
only less than 33% of the theoretical hydrogen production can be achieved, since part of the
original substrate remains as acetate (Eq. (2)) and some of the organic matter is used for biomass
synthesis. Moreover, organic intermediates also act as electron scavengers, which lead to the
production of other fermentation products such as propionate, butyrate, lactate, formate and
alcohols. In case the butyrate fermentation pathway is established, the conversion efficiency is
reduced to 2 mol H2/mol glucose (Eq. (3)) (Gioannis et al., 2013). Further utilization of these
volatile fatty acids to produce more hydrogen is very promising.
𝐶6𝐻12𝑂6 + 6𝐻2𝑂 → 12𝐻2 + 6𝐶𝑂2 (1)
𝐶6𝐻12𝑂6 + 2𝐻2𝑂 → 4𝐻2 + 2𝐶𝑂2 + 2𝐶𝐻3𝐶𝑂𝑂𝐻 (2)
𝐶6𝐻12𝑂6 → 2𝐻2 + 2𝐶𝑂2 + 𝐶𝐻3𝐶𝐻2𝐶𝐻2𝑂𝑂𝐻 (3)
To achieve a higher conversion of a substrate to hydrogen, an addition to fermentation to
achieve a higher hydrogen yield is the process of electrohydrogenesis using microbial electrolysis
cells (MECs).

2
Recently, combining dark fermentation with MECs seems to be very promising. Some
researches use dark fermentation effluent as the MEC influent or combine dark fermentation with
MEC/MFC together. As the main end products from dark fermentation, VFAs have a vital impact
on the performance of MECs. Currently, most MECs use acetate as the benchmark substrate
Acetate and butyrate proved to be easily degradable, whereas propionate exhibited pseudo-
recalcitrant behavior in a continuous-flow two-chamber MEC (Escapa et al., 2013).
In this study, a two chamber microbial electrolysis cell (MEC) was used to oxidize acetate,
butyrate and propionate individually, and the effects of different substrates on the performance of
MEC were assessed.
1.2 Research Objectives
The main goal of this study was to further explore the use of dark fermentation effluent
comprising VFA mixtures in MECs. The specific objectives are as follows:
To clear the contradiction in the literature regarding the relative biodegradability of
butyrate and propionate in MECs.
To further explore the use of dark fermentation effluent in MECs.
To assess the impact of VFAs on MEC performance.
To establish the relationship between attached biomass and suspended biomass for
butyrate and propionate in MEC.
To compare the impact of initial concentration of chemical oxygen demand (COD) on
the performance of MECs
3
1.3 Research Contributions
Even though a handful of literature studies investigated the performance of MECs with
different VFAs, there is a contradiction in the literature regarding the relative biodegradability of
butyrate and propionate in MECs. In this research, a comprehensive comparison of the effects of
acetate, butyrate, and propionate on MEC is undertaken. Furthermore, for the first time the
relationship between attached biomass and suspended biomass for butyrate and propionate in MEC
has been established.
1.4 Thesis Organization
This thesis includes four chapters and two appendices, which confirm to the “integrated
article” format as outlined in the Thesis Regulation Guide by the School of Graduate and
Postdoctoral Studies (SGPS) of the University of Western Ontario. The thesis consists of the
following chapters:
Chapter 1 -- presents the general background, research objectives, and research contributions
Chapter 2 – presents a literature review on MEC materials, configurations, and performances
Chapter 3 – discusses the effects of different VFAs on the performance of MEC
Chapter 4 – recommendations for future work based on the literature review and the results of
this study
1.5 References
1. Escapa, A., Lobato, A., García, D., Morán, A. 2013. Hydrogen production and COD elimination
rate in a continuous-flow microbial electrolysis cell: The influence of hydraulic retention time and
applied voltage. Environ. Prog. Sustain. Energy. 32, 263-268.
4
2. Gioannis, G.D., Muntoni, A., Polettini. R.P. 2013. A review of dark fermentative hydrogen
production from biodegradable municipal waste fractions. Waste Management. 33, 1345-1361.
3. Logan, B.E., Call, D., Cheng, S., 2008. Microbial electrolysis cells for high yield hydrogen gas
production from organic matter. Environ. Sci. Technol. 42,23-8631.
4. Liu, H., Cheng, S., Logan, B.E. 2005. Production of electricity from acetate or butyrate using a
single-chamber microbial fuel cell. Environ. Sci. Technol. 39, 658-662.
5
Chapter 2
Literature Review
2.1 Introduction
In recent years, bioelectrocatalysis using microorganisms as catalysts for
bioelectrochemcial system (BES) has become very promising for wastewater treatment and
removal of various contaminants via electrobiochemical reactions (Wang et al., 2012). In a BES,
organic compounds such as acetate, glucose, volatile fatty acids, protein, domestic wastewater,
etc. and inorganic compounds such as sulfide (Rabaey et al., 2006) are oxidized at the anode. At
the cathode, reduction of oxygen or other electron acceptors such as nitrate, nitrobenzene,
perchlorate, sulfate occurs. The bioanode, at which microorganisms convert the chemical energy
in organic matter to electrical energy, forms the basis of most BESs (Sleutels et al., 2013). These
systems are referred to as Microbial Fuel Cells (MFCs) when electricity is produced or Microbial
Electrolysis Cells (MECs) when electrical energy is added to the chamber.
In MFCs, bacteria growing on the anode, oxidize organic matter and release carbon dioxide
and protons into solution and electrons to the anode. The cathode is sparged with air to provide
dissolved oxygen for the reactions of electrons, protons and oxygen at the cathode, with a wire
(and load) to complete the circuit and produce power (Logan, 2008a).
When oxygen is present at the cathode, current can be produced, but without oxygen,
current generation is not spontaneous. However, when applying a voltage (>0.2V in theory) to the
system, hydrogen gas is produced at the cathode through the reduction of protons (Logan et al.,
2008b). In MECs, the anode-respiring bacteria (ARB), such as Geobacter Shewanella,
Pseudomonas, Clostridium, Desulfuromonas, Eseherichia, and Klebisella, are attached to the

6
conductive anode where they oxidize organic compounds and transfer the electrons through an
external electrical circuit to the cathode (Lee et al., 2010). The electrons reach the cathode and
react with water to produce H2. This system has previously been named as bio-electrochemically
assisted microbial reactor (BEAMR) or a biocatalyzed electrolysis cell. Because the standard
potential of the organics (e.g. Eacetate = -0.28 V) is more positive than for H2 (EH2 = -0.41 V), and
also due to energy losses, electric power supply must be added into the reactor. The typical range
of applied voltage is 0.6 V to 1.2 V (Logan, 2008a).
To date, MECs as a new technology to produce bio-fuels and degrade wastewater have
been extensively reviewed. These include a brief overview of recent advances in research on
electrochemically active bacteria, MEC materials and design, as well as a critical review of high
hydrogen yield from various feedstock (Liu et al., 2010), an overview of cathode material and
catalysts suitable for generating hydrogen in microbial electrolysis cell (Kundu et al., 2013), and
a review of the substrates used in microbial electrolysis cells (MECs) for producing sustainable
and clean hydrogen gas (Kadier et al., 2014).
However, a comprehensive review of research on continuous-flow MEC, which is very
important for scaling up, is still lacking. The development of continuous-flow MECs during the
past years based on the number of journal papers being published is shown in Figure 2.1. The
number of continuous-flow papers was very low before the year of 2008. The continuous-flow
studies increased from 19 in 2008 to 48 in 2014. The ratio of continuous-flow to total papers
published on MECs also increased with time, from 33% in 2006 to 52% in 2014. Furthermore the
modification of MECs for continuous-flow wastewater treatment, their advantages and challenges
have been explored.

7
Figure 2.1 –The development of continuous-flow MECs during the past years based on the
number of journal papers being published. The total number of articles is based on “Scopus”
search using “microbial electrolysis cell” as key word in July 2015, while the number of
continuous-flow articles is further limited to “continuous” as refined key word.
2.2 Materials
2.2.1 Anode
Almost all the research in MECs has utilized carbon-based materials for the anode, except
for bio-cathode MECs because the microorganisms are grown on the cathode instead of anode.
The carbon-based anodes are so popular because of their good conductivity, biocompatibility, low
over-potentials and relatively low cost (Logan et al., 2008).
Common materials in laboratory scale MECs operated in continuous-flow mode include
carbon felt (Sleutels et al., 2013; Tartakovsky et al., 2009), carbon mesh (Cusick et al., 2014),
carbon brush (Cui et al., 2012; Wang et al., 2012), carbon fiber (Dhar et al., 2013), graphite felt
0
20
40
60
80
100
1976
1985
1988
1994
1997
1998
1999
2000
2001
2002
2003
2004
2005
2006
2007
2008
2009
2010
2011
2012
2013
2014
2015
Num
ber
of
pap
ers
Year
Total
Continuous-flow
8
(Jeremiasse et al., 2010), graphite granules (Gusseme et al., 2012), graphite powder (Thrash et al.,
2007) and graphite fiber (Lee & Rittmann, 2009).
Ammonium treatment of carbon electrodes have become a widely applicable method for
increasing the performance of both MFCs and MECs by facilitating the attachment of
microorganism and increasing electron transfer to the anode surface area (Cheng & Logan, 2007).
Optimal heat treatment in the laboratory for the brush anodes was reported as 450°C for 30 min
(Wang et al., 2009). The advantages of this treatment are: (1) to a faster start-up, (2) higher current
densities. The aforementioned advantages are attributed to the more favorable adhesion of
microorganisms to the positively charged anode and to improved electron transfer to the
chemically modified surface (Cheng et al., 2007). However, at full-scale, the cost of heat pre-
treatment appears be a challenge.
Wang et al. (2010) have demonstrated that the electricity output and conversion of acetate
to hydrogen were increased with a packed bed of graphite granules as electrodes. A graphite rod
was inserted in the bed as a current collector. Titanium or stainless steel is always served as the
current collector when the carbon materials are in fiber or brush form.
Porous electrodes such as graphite felt also have the potential to generate higher volumetric
current densities due to the high specific surface area. Sleutels et al. (2009) studied the effect of
mass and charge transport on current densities using three thicknesses (1, 3, 6.5 mm) of graphite
felt anode. A spacer material (64% open; PETEX 07-4000/64, Sefar BV, Goor, The Netherlands)
with a total thickness of 4 mm was placed between the anode and the membrane, so that the anolyte
was forced to flow perpendicular to the felt. The aforementioned researchers found that without
the flow force, i.e., when the flow is parallel to the anode, the thicker the graphite, the lower is the

9
current density. This was because in thicker types of felt the substrate was limiting microbial
growth in deeper parts of the felts. With the forced flow, this system reached a high current density
of 16.4 A m-2 and a hydrogen production rate of 5.6 m3 m-3 d-1 at an applied voltage of 1 V with a
50 mM phosphate buffer solution. This research showed that the current densities in porous
electrodes can be improved by the force flow of anolyte through the electrode.
2.2.2 Cathode
Most of the cathode material used in continuous-flow MEC systems are stainless steel mesh
(Dennis et al., 2013; Nam et al., 2014), platinum (Pt) coated with titanium (Sleutels et al., 2013),
nickel (Ni) foam (Jeremiasse et al., 2010), carbon paper or carbon cloth coated with Pt or Ni
(Hrapovic et al., 2010), and graphite granules (Gusseme et al., 2012). When it comes to
biocathodes, carbon materials are always used as the cathode.
Unlike anode materials, plain carbon materials are rarely used as cathode since the
hydrogen evolution reaction (HER) on plain carbon electrodes is very slow, requiring a high
overpotential (-0.42 V at pH 7) to drive hydrogen production (Rozendal et al., 2007; Logan et al.,
2008).
It has been shown in the literature that adding specific chemicals to highly conductive
surfaces can greatly affect electron transfer. Hrapovic et al. (2010) developed a low cost MEC
cathode by Ni electrodeposition onto a porous carbon paper, and evaluated different Ni or Pt
loadings. The aforementioned authors found that at a Ni load of 0.2-0.4 mg cm-2 under acetate
non-limiting conditions, hydrogen production could reach 5.4 L L-1 d-1 with a corresponding
current density of 5.7 A m-2. This hydrogen production rate was significantly greater than the
volumetric rate of 2.0-2.3 L L-1 d-1 reported for a batch-operated MEC quipped with similar anodes

10
and Ni alloy or NiW cathodes (Hu et al., 2009). According to the authors, the improved rate of
hydrogen production was due to an optimized Ni load and the high porosity of the gas diffusion
cathodes, which provided a higher surface area for Ni electrodeposition, compared to the solid
metal sheets used by Selembo et al (2009). Moreover, this study proved that Ni is a better catalyst
than Pt in MECs. Manuel et al. (2010) studied the impact of the catalyst load on hydrogen
production rate, and concluded that the chemical deposition of Ni can be successfully employed
for continuous-flow production of hydrogen in a MEC.
Instead of using Ni as a deposited catalyst onto carbonaceous materials, Jeremiassa et al.
(2010) investigated the nickel as the cathode, because of its low electrical resistivity, availability,
stability in highly alkaline solutions, low price, and reported a hydrogen production as high as 50
m3 m-3 d-1 and a current density of 22.8 ± 0.1 A m-2 with electrical energy input of 2.6 KWh m-3
H2.
Despite its success in fed-batch MEC and MFC studies, stainless steel have not been
studied in continuous-flow studies.
2.2.3 Membrane
A membrane can be used to separate the chamber where microorganisms degrade the
substrate from the one where hydrogen evolves (Logan et al., 2008). The advantages of applying
the membrane are minimization of hydrogen losses by anodic bacteria and in the liquid, and
prevention of hydrogen gas from mixing with carbon dioxide in the anode, while its disadvantages
are the increase in potential losses associated with the membrane, and the reduction of energy
recovery.

11
Cation exchange membranes (CEMs) have been used in several studies with limited
success since cations, such as Na+, K+, NH4+, Ca2+ and Mg2, can be transported more efficiently
than protons through the membrane (Rozendal et al., 2006; Zhao et al., 2006). The reason is that
the pH of the substrate in MEC is close to 7, which means only about 10-4 mM of protons are
present in the anode chamber, orders of magnitude lower than the typical cations concentrations
(Rodendal et al., 2007).
If H+ cannot be effectively transported across a CEM, then the pH cannot be effectively
balanced in an MEC. A possible solution to the pH gradient associated potential losses is the
application of an anion exchange membrane (AEM) instead of a CEM. Rozend et al. (2007)
discovered that the AEM is better capable of preventing the pH gradient across the membrane than
the CEM (CEM ΔpH = 6.4; AEM ΔpH = 4.4). Consequently, the pH gradient associated potential
losses were lower in the AEM configuration (CEM 0.38V; AEM 0.26 V). Sleutels et al. (2013)
also made a comparison between AEM and CEM configurations, as shown in Table 2.1. At steady-
state operation, a current density of 10.2 A m-1 (909 A m-3) at an applied voltage of 1.0 V was
produced in the AEM, compared to 7.2 A m-2 (643 A m-3) for the CEM (Sleutels et al., 2013). The
difference between the current densities was due to the lower resistance for transport of ions
through the membrane for the AEM configuration compared to the CEM configuration (Sleutels
et al., 2013).
There are two theories for the proton transfer mechanism in the literature. Logan et al.
(2008a) found that an AEM can allow proton conduction via negatively charged species such as
phosphate anions that can be added at high concentration. However, on the other hand, Rozendal
et al. (2007) discovered that in an AEM, electroneutrality is achieved by the transport of anions
from the cathode to the anode. For biocatalyzed electrolysis this implies that hydrogen at the

12
cathode is not produced from the reduction of protons, but from the reduction of water that diffuses
through the membrane from the anode to the cathode (Rozendal et al., 2007).The two
aforementioned transfer mechanisms are depicted in Figure 2.2.
In order to study the effect of membrane on MEC performances, Tartakovsky et al. (2009)
constructed two gas-phase cathode MECs operating in continuous-flow mode, one with a proton
exchange membrane (PEM, Nafion 117), and the other without membrane. The absence of PEM
reduced the internal resistance form 27 Ω to 19 Ω. At an acetate loading rate of 4 g LA-1 d-1 (i.e., 4
g per day per liter of anode), hydrogen production rates of 1.0-1.3 LSTP LA-1d-1, and 6.1-6.5 LSTP
LA-1d-1 were obtained in MEC with membrane and MEC without membrane, respectively. These
values are comparable with the hydrogen production rate of 1 L LA-1d-1 observed in a MEC
equipped with a PEM (Rozendal et al., 2007) and a rate of 3 L LA-1d-1 observed in a single chamber
membrane-free MEC (Call & Logan, 2008b). Single-chamber membrane-free MECs were
designed by Hu et al. (2008) and successfully produced hydrogen from organic matter using one
Figure 2.2 – Proton transfers from anode to cathode by negative charges through
AEM (left) and hydroxide transfers from cathode to anode through AEM (right).
13
mixed culture (using local domestic wastewater as the inoculum) and one pure culture (
Shewanella oneidensis MR-1). At an applied voltage of 0.6V, this system with a mixed culture
achieved a hydrogen production rate of 0.53 m3 day-1 m-3 with a current density of 9.3 A m-2 at
neutral pH and 0.69 m3 d-1 m-3 with a current density of 14 A m-2 at pH 5.8 (Hu et al., 2008). The
current hydrogen production rates in the pure culture system were much lower than those with
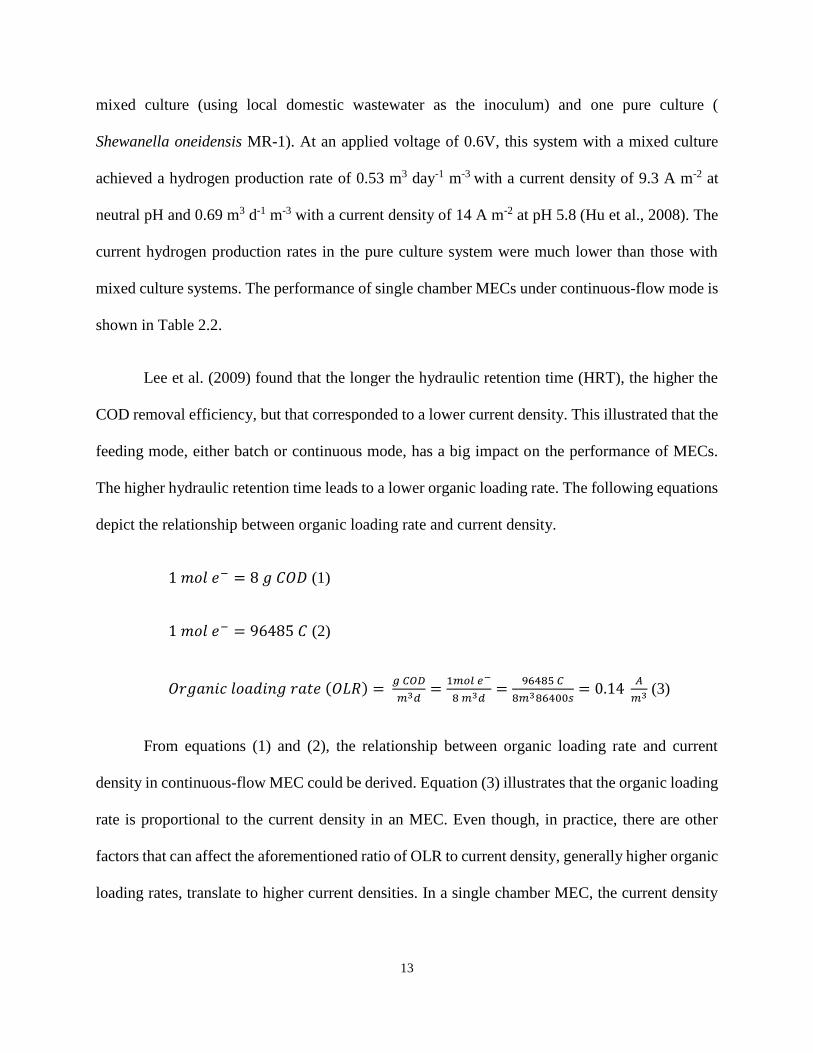
mixed culture systems. The performance of single chamber MECs under continuous-flow mode is
shown in Table 2.2.
Lee et al. (2009) found that the longer the hydraulic retention time (HRT), the higher the
COD removal efficiency, but that corresponded to a lower current density. This illustrated that the
feeding mode, either batch or continuous mode, has a big impact on the performance of MECs.
The higher hydraulic retention time leads to a lower organic loading rate. The following equations
depict the relationship between organic loading rate and current density.
1 𝑚𝑜𝑙 𝑒− = 8 𝑔 𝐶𝑂𝐷 (1)
1 𝑚𝑜𝑙 𝑒− = 96485 𝐶 (2)
𝑂𝑟𝑔𝑎𝑛𝑖𝑐 𝑙𝑜𝑎𝑑𝑖𝑛𝑔 𝑟𝑎𝑡𝑒 (𝑂𝐿𝑅) = 𝑔 𝐶𝑂𝐷
𝑚3𝑑=
1𝑚𝑜𝑙 𝑒−
8 𝑚3𝑑=
96485 𝐶
8𝑚386400𝑠= 0.14
𝐴
𝑚3 (3)
From equations (1) and (2), the relationship between organic loading rate and current
density in continuous-flow MEC could be derived. Equation (3) illustrates that the organic loading
rate is proportional to the current density in an MEC. Even though, in practice, there are other
factors that can affect the aforementioned ratio of OLR to current density, generally higher organic
loading rates, translate to higher current densities. In a single chamber MEC, the current density

14
decreased from 1630 to 1470 A m-3, when the organic loading rate decreased from 16.3 to 4.02 g
COD L-1d-1 (Lee et al., 2009).
Operating MECs in continuous-flow mode has become increasingly popular since 2008,
because it can achieve better performance than batch MECs. For example, hydrogen production
rate was 5.4 L d-1 L-1 under acetate non-limiting conditions in a Ni cathode MEC operating in
continuous-flow mode, compared to 2.3 L d-1 L-1 under batch mode operation (Hrapovic et al.,
2010). Moreover, coulombic efficiency increased from 45% to 86% upon changing the operational
mode from batch to continuous-flow in a dual-chamber H-type MEC (Torres el al., 2007). Villano
et al. (2012) also demonstrated a remarkable increase in current generation from 18 mA to 120
mA when the MEC was switched from batch to continuous-flow mode. The aforementioned
studies suggest that the feeding regime has a big impact on the MEC performance.
In a batch mode MEC, the substrate is added at the beginning of each cycle, and the
MEC is fed when the current density drops significantly. Thus in batch mode, the ARBs are
operating at viable substrate concentrations, which at times could be limiting growth. However in
the continuous-flow mode MEC, the soluble COD fed into the reactor can be controlled by the
hydraulic retention time, or organic loading rate, which lead to a non-substrate limiting condition
and achieve a better performance.

15
Table 2.1 -- Design and performance of two-chamber MECs in continuous-flow mode
Anode
Material
Cathode Material Anolyte Van
(mL)
Vcat
(mL)
Membrane Eap (V)
(unless
otherwise
stated)
Operation IA (A/m3) Ref.
Graphite fiber
brush
Stainless steel mesh
(type 304 SS #60
mesh) coated with
platinum
Synthetic wastewater
(sodium acetate 1.5 g/L)
1.17 g COD/L*
137 137 AEM 0.9 HRT=1 day
OLR = 1.17 g
COD/L/d
OLR = 1.256 g
COD/L/d
112* (Nam et
al., 2014)
Cellulosic fermentation
wastewater (FWW)
(VFAs+alchohols+proteins)
produced by Clostridium
sp. (1.256 g COD/L)
99*
Carbon felt platinum coated (50
g/m2) titanium mesh
(1mm thickness)
Sythetic wastewater (1.36
g/L NaCH3COO•3H2O),
0.64 g COD/L *
280 280 CEM
0.6 HRT = 0.9 h,
flow rate: 5
mL/min, OLR =
17 g COD/L/d*
85* (Sleutels
et al.,
2013) 0.8 245*
1 643*
AEM 0.6 100*
0.8 429*
1 909*
Graphite
granules
Graphite granules
(diameter between 2
and 6 mm),
porosity of 0.48
Acetate (0.64 g COD/L) 860 860 PEM Anode
potential
at
+2.00V
(vs.
SHE)
Anode flow rate
1.44 L/d, HRT
= 14.33 h, OLR
= 1.08 g COD/
L/d
116 * (Villano et
al., 2012)

16
Table 2.1 – (Continued) Design and performance of two-chamber MECs in continuous-flow mode
Anode Material Cathode Material Anolyte Van
(mL)
Vcat
(mL)
Membrane Eap (V)
(unless
otherwise
stated)
Operation IA
(A/m3) (
Ref.
Graphite felt Ni foam
(10 × 10 × 0.2
cm, 1360 kg/m3)
(128 m2/m2
projected area)
2.72 g/L
NaCH3COO·3H2O
(1.07 g COD/L*)
20 * 20 * AEM 1 Flow rate:
1.3 mL/min;
HRT = 0.26
h*;
OLR = 99 g
COD/L/d*
5704±32 (Jeremiasse
et al.,
2010)
Graphite felt (1
mm)
platinum coated
(50 g/m2)
titanium mesh
(projected surface
area 0.025 m2)
Synthetic wastewater
(1.36 g/L
NaCH3COO·3H2O)
(0.64 g COD/L*)Rate:
5 mL/min; HRT =
0.039 d*; OLR = 16.46
g COD/L/d*
280 280 AEM 1 No force
flow
582 (Sleutels et
al., 2009)
Graphite felt (3
mm)
No force
flow
438
Graphite felt (6.5
mm)
No force
flow
453
Graphite felt (1
mm)
With force
flow
732
Graphite felt (3
mm)
With force
flow
641
Graphite felt (6.5
mm)
With force
flow
607
* refers that the data are calculated based on the information from the literature.
17
Table 2.2 -- Design and performance of single chamber MECs in continuous-flow mode
Anode
Material
Cathode
Material
Substrate V
(mL)
Eap (V)
(unless
otherwise
stated)
Operation Current
density
(A/m2)
(unless
otherwise
stated)
COD
Removal
(%)
(unless
otherwise
stated)
Coulombic
Efficiency
(%)
H2
Production
Rate
(m3H2/m3d)
H2 Yield
(mol/mol)
(unless
otherwise
stated)
IA
(A/m3)
Ref.
8
ammonia
treated
graphite
brushes
stainless
steel
304
mesh
sheet
1 g/L
Acetic
acid;
HRT = 1
day,
flowrate
= 1.67
mL/min
2400 0.9 1.18 31-47 on day 3:
147; on
day 8:
102; on
day 18:
135
0.53 71
(Rader &
Logan,
2010)
three
bundles
of
graphite
fiber
one
bundle
of
graphite
fiber
17 mM
acetate,
HRT
from 6.5
to 1.6 h
125 Anode
potential
-0.126 V
(vs SHE)
6.5 h 83 2.64±0.01 2.03±0.07 1470
(Lee &
Rittmann,
2009)
3.1 h 61 3.70±0.03 1.88 1590
1.6 h 37 4.32±0.46 1.81±0.19 1630
heat
treated
graphite
brush
carbon
cloth
with 0.5
mg/cm2
Pt
1.5 g/L;
50 mM
PBS,
pH=7.04,
28 0-0.2 V
(vs.
Ag/AgCl)
147 ±12
A/m3
90± 6 81 ±9 1.2 ± 0.4
(Nam et
al., 2011)
18
2.3 Microorganisms
Most forms of respiration involve a soluble compound (e.g. oxygen, nitrate, and sulfate) as
an electron acceptor; nevertheless, some microorganisms are able to respire solid electron
acceptors (metal oxides, carbon, and metal electrodes) in order to obtain energy (Torres et al.,
2009). Extracellular electron transfer (EET), which refers to electron transport to the surface of the
solid electron acceptor, is now the most acceptable explanation of how microorganisms respire
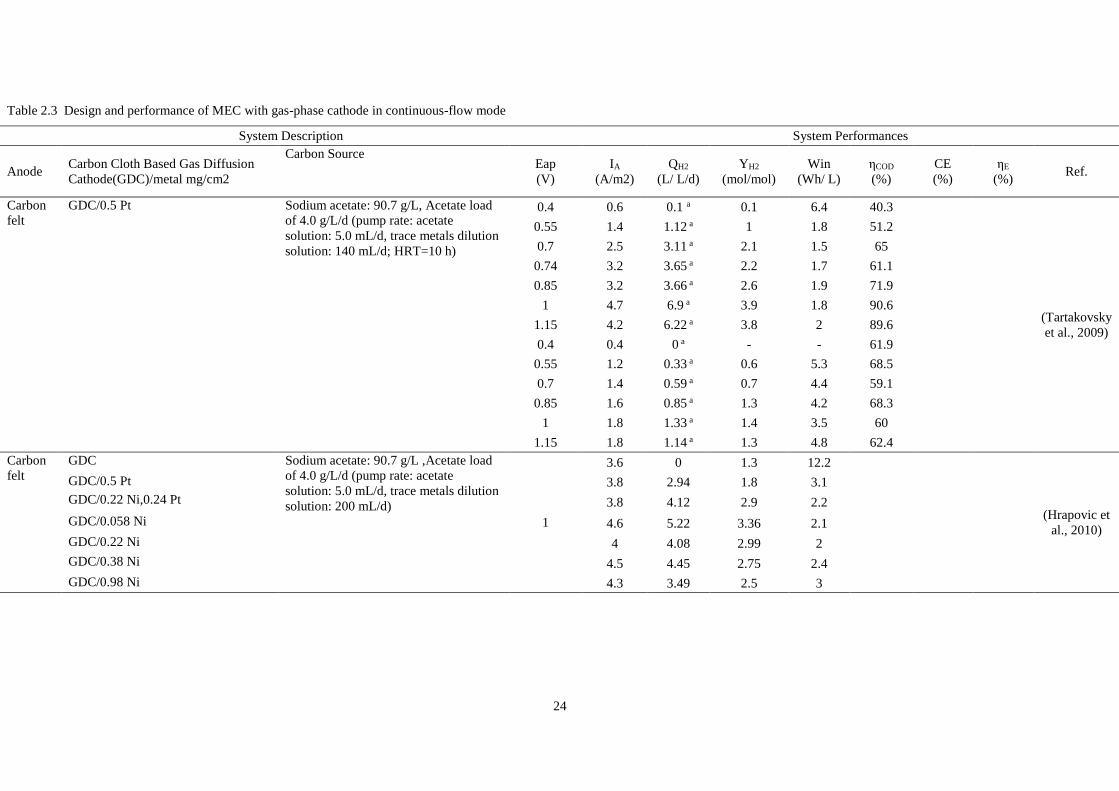
using a solid electron acceptor. Researchers have discovered three distinct EET mechanisms,
which are shown in Figure 2.3. The first mechanism presents direct electron transfer between
electron carriers in the bacteria and the solid electron acceptor (Torres et al., 2009). The second
mechanism occurs in the presence of a soluble electron shuttle, which is a compound (e.g. melanin,
phenazines, flavins, and quinones) that carries electrons between the bacteria and the electrode by
diffusive transport (Newman & Kolter,, 2000; Turick et al.,2002; Hernandez et al., 2004; von
Canstein et al., 2008). The third mechanism proposes a solid component (cellular pili as nanowires)
that is part of the extracellular biofilm matrix and is conductive for electron transfer from the
bacteria to the solid surface (Reguera et al., 2005; Gorby et al., 2006).

19
Figure 2.3 – Schematic of three EET mechanisms used by ARB: (a) direct electron transfer, (b)
soluble electron shuttle, and (c) cellular pili as nanowires.
Liu et al. (2008) studied the community analysis of an MEC and observed that
Pseudomonas spp. and Shewanella spp. existed on the anode. However, because MECs operate
under completely anaerobic conditions, both the obligate anaerobic bacteria, such as
exoelectrogenic Geobacter spp., and nonexoelectrogenic fermentative (or methanogenic
microorganisms) are promoted.
Usually, researchers enrich the bacterial community for a working MFC. The advantages
of this procedure are: (1) ensuring biofilm formation on the anode, (2) preselecting an
exoelectrogenic community for MECs operation. Moreover, the biofilm can be scraped from the
anode and transferred to a new electrode. Last but not least, the effluent from an MFC/MEC

20
containing exoelectrogenic community (presumably displaced from the anode) can be used as an
inoculum.
Methanogenesis could be a problem in MECs, because high concentrations of hydrogen
gas favors the growth of hydrogenotrophic methanogens, which reduces hydrogen gas production
and contaminates the gas with methane. Three methods can be applied to suppress the growth of
methanogens, including: (1) lowering the environment pH by using a medium solution (pH 5.8)
containing phosphate buffer, (2) exposing the cathode to air for 15 min when the methane content
in the headspace was higher than 5%, (3) boiling the anodes from MFCs for 15 min before placing
them in MECs (Hu et al., 2008).
2.4 Modification of MEC design
2.4.1 Multi-electrode
In order to examine the scalability of a multi-electrode MEC, Rader et al (2010) constructed
a 2.5 L single chamber MEC containing 8 separate electrode pairs made of graphite fiber brush
anodes pre-acclimated in MFC using acetate, and 304 stainless steel mesh cathodes (64 m2 m-3)
under continuous-flow conditions, as shown in Figure 2.4. A voltage of 0.9 V was applied across
each pair of electrodes using four separate power supplies. The liquid volume was controlled at ~
2.4 L to allow a headspace in the reactor for collection and analysis in the tubes. The MEC was
operated with a continuous-flow substrate flow at a flowrate of 1.67 mL min-1, a hydraulic retention
time (HRT) of 1 day, with acetic acid concentration of 1 g L-1. The maximum current was 181 mA
(1.18 A m-2 cathode surface area; 74 A m-3) with a maximum hydrogen production of 0.53 L L-1 d-
1 in three days of operation. Current production remained almost steady (days 3-18), but the gas
composition dramatically shifted over time. The methane production increased from 0.049 L L-1
d-1 (day 3) to 0.118 L L-1 d-1 (day 16). The energy efficiency relative to electrical energy input

21
remained above 100% until day 17, with a maximum energy efficiency of 144% on day 3.
The maximum observed current density in the aforementioned study of 1.18 A m-2 is lower
than the current density achieved by Selembo et al (2009), of 4.6 A m-2, despite the use of the
similar electrode architecture due to two reasons: namely the use of plastic separators between the
electrodes, which may have inhibited proton diffusion from the anode to cathode, and a larger
electrode spacing.
Figure 2.4 – (A) Schematic (top view) and (B) photograph of the 2.5 L scale-up continuous-flow
microbial electrolysis cell containing 8 half graphite brush anodes and 8 stainless steel mesh
cathodes: (a) gas bag, (b) power sources, (c) fluid pump, and (d) substrate feed tank. (Rader et
al., 2010)
3.4.2 Gas-phase Cathodes
Tartakovsky et al (2009) developed a membrane-less continuous-flow microbial
electrolysis cell with a gas-collection cathode, as shown in Figure 2.5. This MEC was constructed
of a carbon felt anode and a gas diffusion cathode with a Pt loading of 0.5 mg cm-2. The anode and
cathode were 0.3 mm apart, separated by a piece of J-cloth. The aforementioned authors compared

22
the performance of the MEC with a proton exchange membrane (PEM) and without PEM, and
also examined the effect of voltage on hydrogen production. The absence of PEM reduced the
internal resistance from 27 Ω to 19 Ω. At an acetate loading rate of 4 g LA-1 d-1, hydrogen
production rates of 1.0-1.3 LSTP LA-1d-1, and 6.1-6.5 LSTP LA
-1d-1 were obtained in MEC with
membrane and MEC without membrane, respectively. These values are comparable with hydrogen
production rate of 1 L LA-1d-1 observed in a MEC equipped with a PEM (Rozendal et al., 2007)
and a rate of 3 L LA-1d-1 observed in a single chamber membrane-free MEC (Call & Logan, 2008).
Hydrogen production rate increased in response to the increase in voltage, at applied voltage
between 0.4 and 1.0 V. At an applied voltage of 1 V, a power input of 2 Wh L-1-H2, a hydrogen
yield of 3.9 mol mol-1-acetic acid, and a current density of 4.7 A m-2 was achieved.
Figure 2.5 – Diagram of a continuous-flow MEC setup. (Modified from Tartakovsky et al., 2009)
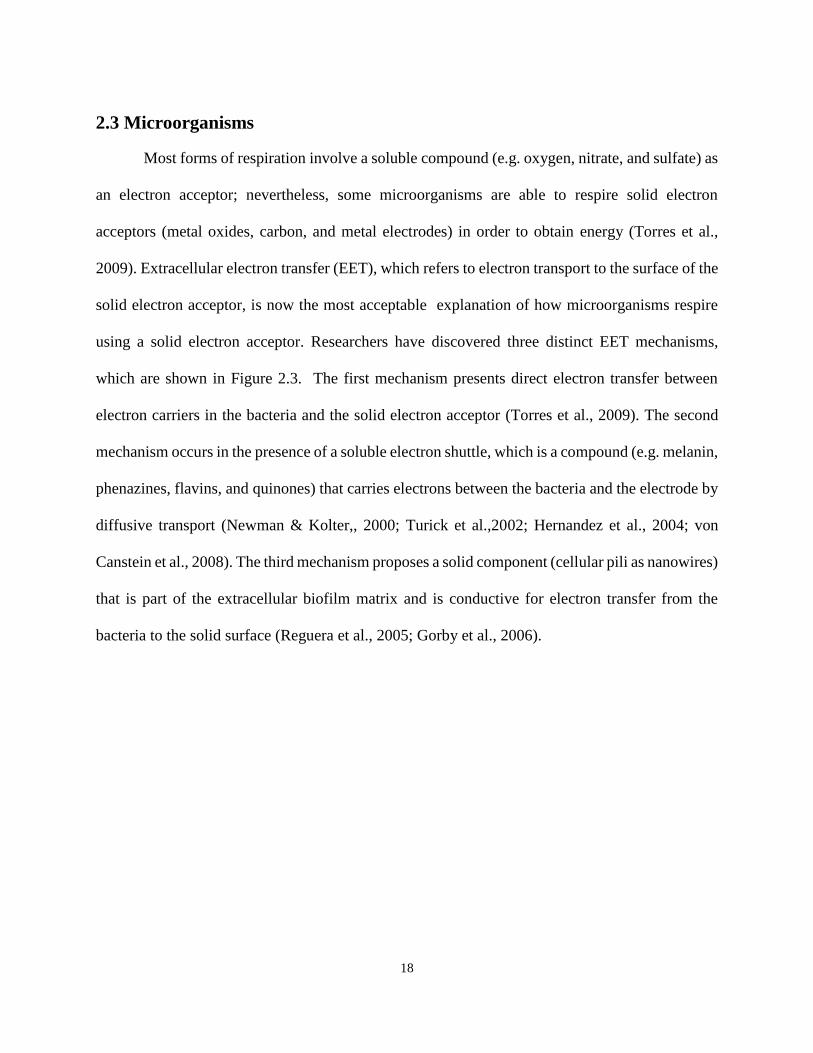
This MEC design was also used by Escapa et al. (2012) to test the effect of organic loading
rate and applied voltage on hydrogen production rates when treating full-strength domestic

23
wastewater, as shown in Table 2.3. A graphite felt anode and a Ni-based gas diffusion cathode
with a Ni load of 0.4 mg cm-2 cathode were used. J-cloth with a thickness of 0.7 mm was also used
in this MEC. At an organic loading rate of 441 mg LA-1 d-1 and applied voltage of 0.75 V, a
maximum of COD reduction of 76% was achieved in this reactor. H2 only evolved at organic
loading rates between 448 mg LA-1 d-1 and 1994 mg LA
-1 d-1 at an applied voltage of 1 V. Hydrogen
production rate as a function of the organic loading rate fit a Monod-type model, with a maximum
hydrogen production constant of 0.462 L LA-1 d-1 and a half saturation coefficient of 1342 mg LA
-
1 d-1, and proved to be highly dependent on the influent COD.
The main advantage of this design is that hydrogen produced in the liquid chamber can be
directly released to the gas collection chamber due to lower mass transfer resistance compared
with the gas transfer through a liquid phase. The challenges of this design could be the cathode
leaking or flooding, and due to the absence of membranes, hydrogen could easily crossover from
the cathode to the anode leading to significant hydrogen re-oxidation.
24
Table 2.3 Design and performance of MEC with gas-phase cathode in continuous-flow mode
System Description System Performances
Anode Carbon Cloth Based Gas Diffusion
Cathode(GDC)/metal mg/cm2
Carbon Source Eap
(V)
IA
(A/m2)
QH2
(L/ L/d)
YH2
(mol/mol)
Win
(Wh/ L)
ηCOD
(%)
CE
(%)
ηE
(%) Ref.
Carbon
felt
GDC/0.5 Pt Sodium acetate: 90.7 g/L, Acetate load
of 4.0 g/L/d (pump rate: acetate
solution: 5.0 mL/d, trace metals dilution
solution: 140 mL/d; HRT=10 h)
0.4 0.6 0.1 a 0.1 6.4 40.3
(Tartakovsky
et al., 2009)
0.55 1.4 1.12 a 1 1.8 51.2
0.7 2.5 3.11 a 2.1 1.5 65
0.74 3.2 3.65 a 2.2 1.7 61.1
0.85 3.2 3.66 a 2.6 1.9 71.9
1 4.7 6.9 a 3.9 1.8 90.6
1.15 4.2 6.22 a 3.8 2 89.6
0.4 0.4 0 a - - 61.9
0.55 1.2 0.33 a 0.6 5.3 68.5
0.7 1.4 0.59 a 0.7 4.4 59.1
0.85 1.6 0.85 a 1.3 4.2 68.3
1 1.8 1.33 a 1.4 3.5 60
1.15 1.8 1.14 a 1.3 4.8 62.4
Carbon
felt
GDC Sodium acetate: 90.7 g/L ,Acetate load
of 4.0 g/L/d (pump rate: acetate
solution: 5.0 mL/d, trace metals dilution
solution: 200 mL/d)
1
3.6 0 1.3 12.2
(Hrapovic et
al., 2010)
GDC/0.5 Pt 3.8 2.94 1.8 3.1
GDC/0.22 Ni,0.24 Pt 3.8 4.12 2.9 2.2
GDC/0.058 Ni 4.6 5.22 3.36 2.1
GDC/0.22 Ni 4 4.08 2.99 2
GDC/0.38 Ni 4.5 4.45 2.75 2.4
GDC/0.98 Ni 4.3 3.49 2.5 3

25
Table 2.3 – (Continued) Design and performance of MEC with gas-phase cathode in continuous-flow mode
System Description System Performances
Anode
Carbon Cloth Based Gas
Diffusion Cathode(GDC)/metal
mg/cm2
Carbon Source Eap
(V)
IA
(A/m2)
QH2
(L/ L/d)
YH2
(mol/mol)
Win
(Wh/ L)
ηCOD
(%)
CE
(%)
ηE
(%) Ref
Carbon felt GDC/0.22 Ni, 0.24 Pt Sodium acetate: 90.7 g/L, Acetate load 5.8 g/L/d
(pump rate: 7.5 mL/d; trace metals dilution
solution: 200 mL/d)
1
4.8 4.2 2.85 2.7
(Hrapovic
et al.,
2010)
GDC/0.058 Ni 4.4 5.02 2.5 2.1
GDC/ 0.22 Ni 4.6 5.4 3.3 2
GDC/0.38 Ni 5.7 5.16 3.14 2.6
GDC/0.98 Ni 5.4 4.68 2.57 2.8
Graphite
felt
carbon cloth GDC Sodium acetate: 90.7 g/L, Acetate load 4.0 g/L/d
(pump rate: 5.0 mL/d; trace metals dilution
solution: 180-190 mL/d, HRT=6.3-6.7 h;
Recirculation: 0.57 L/h)
1
2.47 0.02 0 56.6
(Manuel
et al.,
2010)
GDC/0.3 Pt 2.9 2.61 2.4 75.3
GDC/0.65 Ni, 0.1 Mo, 0.2 Cr,
0.03 Fe 3.54 3.72 2.6 69
GDC/0.75 Ni, 0.228Cr, 0.027 Fe 4.09 3.25 2.4 77.3
GDC/0.61Ni, 0.34 Cr, 0.01Mn 3.39 2.77 1.9 64.9
GDC/0.4 Ni 2.69 2.85 1.9 51
GDC/ 0.6 Ni 3.6 4.14 2.8 68
Graphite
felt
GDC/ 0.4 Ni DWW 1, OLR = 0.243 g COD/L/d, HRT=48 h
1
0.75 b
67 65
(Escapa
et al.,
2012)
DWW 1, OLR = 0.448 g COD/L/d, HRT=24 h 0.79 b 0.12 c 62 59
DWW 1, OLR = 0.62 g COD/L/d, HRT=12 h 0.67 b 0.15 c 58 57
DWW 1, OLR = 1.24 g COD/L/d, HRT=6 h 0.34 b 0.22 c 61 55
DWW 1, OLR = 1.944 g COD/L/d, HRT=6 h 0.27 b 0.27 c 51 54
DWW 1, OLR = 3.128 g COD/L/d, HRT=3 h 0.19 b 0.32 c 44 38

26
Table 2.3 – (Continued) Design and performance of MEC with gas-phase cathode in continuous-flow mode
System Description System Performances
Anode Carbon Cloth Based Gas Diffusion
Cathode(GDC)/metal mg/cm2
Carbon Source Eap
(V)
IA
(A/m2)
QH2
(L/ L/d)
YH2
(mol/mol)
EI
(Wh/ L)
ηCOD
(%)
CE
(%)
ηE
(%) Ref.
Graphite
felt
GDC/ 0.4 Ni SWW 2, OLR = 6.4 g COD/L/d, HRT = 8 h 0.6
0.15 b 131.3 7.8
(Escapa
et al.,
2013)
0.8 0.58 b 18.7 107.6
1 0.98 b 23.3 94.3
SWW 2, OLR = 6.4 g COD/L/d, HRT=10 h 0.6 0.20 b 10.9 129.9
0.8 0.64 b 14.5 106.8
1 1.28 b 23.2 96.2
SWW 2, OLR = 6.4 g COD/L/d, HRT=12 h 0.6 0.23 b 6.9 127
0.8 0.76 b 16.1 106.4
1 1.42 b 24.5 97
a. calculated based on idea gas low, converted from data got at 273 K to 273.15 K
b. data read from the figure in the paper
c. calculated based on the Monod equation provided in the paper
DWW 1. domestic wastewater range from 391 to 486 mg/L COD
SWW 2. synthetic dark fermentation effluent: Acetate: 0.8-1.2 g/L, Propionate: 0.6-0.8 g/L, Butyrate: 0.2-0.4 g/L. a constant OLR of 6.4 g COD/L/d for all HRT tested

27
2.4.3 Up-flow continuous-flow system
Wang et al. (2012) developed a new membrane-free bioelectrochemical system, a
membrane-free named, biocatalyzed electrolysis reactor (UBER), where the influent
flows upwards through the cathode chamber that served primarily to mitigate inhibition
of ARB, as depicted in Figure 2.6. The aforementioned authors used carbon brush as the
anode, which was fixed on the upper portion of the reactor, and graphite granules as the
cathode, which was 2 cm below the anode chamber. To ensure even distribution of up-
flow fluid, two plates with even distribution holes were installed at the top and bottom of
the reactor. They used this reactor to reduce nitrobenzene (Rodriguez et al., 2002) with
acetate as the sole electron donor and carbon source. Nitrobenzene (NB) was efficiently
removed (>99%) with aniline as the major product (>80%) in the cathode. The aniline
can be degraded in natural ecosystems or wastewater treatment system under aerobic or
denitrifying condition (Alexandra De et al., 1994). The nitrobenzene removal rate was
3.5 mol m-3 d-1. The molar ratio of NB removed to acetate consumed varied from 4.3 ±
0.4 to 2.3 ± 0.1 mol mol-1, 3-6 times higher than the theoretical value. Additional energy
requirement was less than 0.075 KWh mol-1 NB.

28
Figure 2.6 – Design of up-flow biocatalyzed electrolysis reactor (UBER). Left:
Schematic diagram of the system. Right: Laboratory scale reactor for NB reduction
(Wang et al., 2012)
Cui et al. (2012) also used the UBER to evaluate the reduction efficiency of azo
dyes and assess the effects of hydraulic retention time on decolourization efficiency of
azo dyes. Azo dyes were efficiently removed (94.8 ± 1.5%) at an HRT of 2 h and a loading
rate of 780 g of alizarin yellow r (AYR) m-3 d-1. The two main reductive products of azo
dyes, phenylenediamine and 5-aminosalicylic acid, were subsequently oxidized in their
lab scale aerobic biological oxidation reactor to simple acids and alcohols.
These results indicate the feasibility of the UBER as a single reactor with anodic
biological and cathodic electrochemical functions. The biggest advantage of this design
is the mitigation of toxicity to the electrogenic microorganism on the anode, since before
going through the anode, the inhibitory chemicals were already reduced to less- or non-
29
toxic forms in the lower cathode chamber. The greatest challenge of this reactor was
bacterial migration from the anode to the cathode caused by the lack of membrane. Even
though the migration rate is slow, further research needs to be conducted to examine
whether the biocathode could enhance the performance of this system.
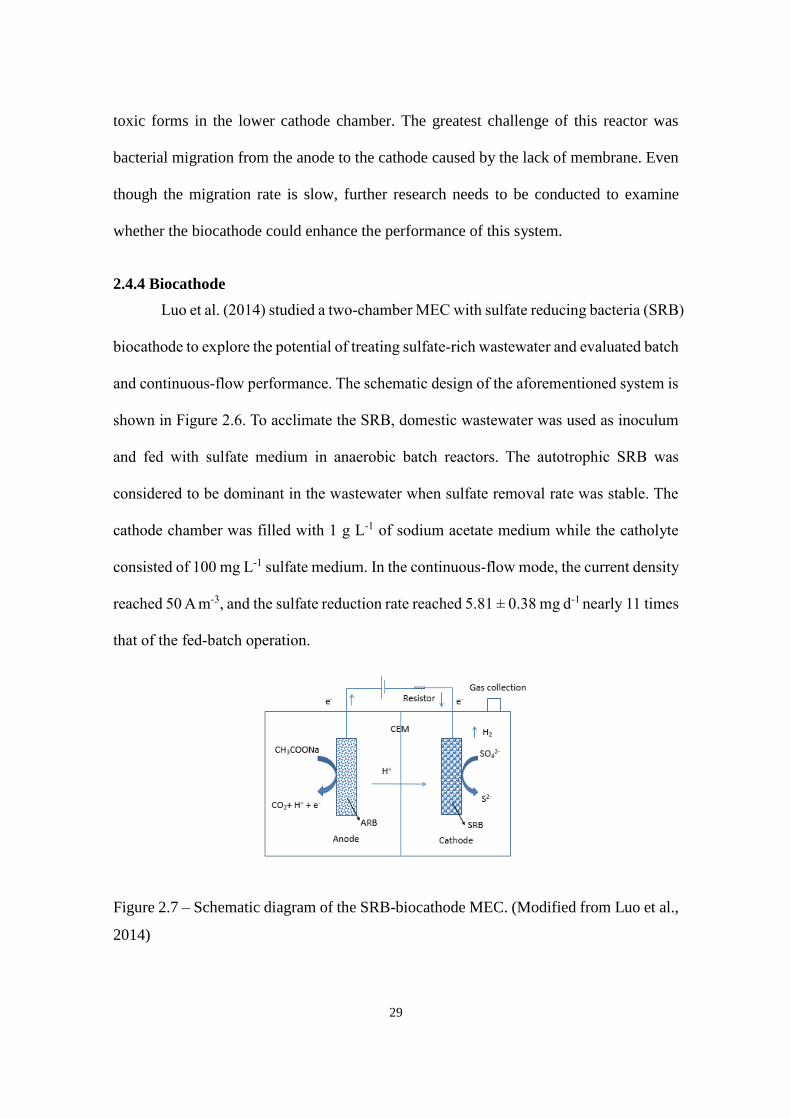
2.4.4 Biocathode
Luo et al. (2014) studied a two-chamber MEC with sulfate reducing bacteria (SRB)
biocathode to explore the potential of treating sulfate-rich wastewater and evaluated batch
and continuous-flow performance. The schematic design of the aforementioned system is
shown in Figure 2.6. To acclimate the SRB, domestic wastewater was used as inoculum
and fed with sulfate medium in anaerobic batch reactors. The autotrophic SRB was
considered to be dominant in the wastewater when sulfate removal rate was stable. The
cathode chamber was filled with 1 g L-1 of sodium acetate medium while the catholyte
consisted of 100 mg L-1 sulfate medium. In the continuous-flow mode, the current density
reached 50 A m-3, and the sulfate reduction rate reached 5.81 ± 0.38 mg d-1 nearly 11 times
that of the fed-batch operation.
Figure 2.7 – Schematic diagram of the SRB-biocathode MEC. (Modified from Luo et al.,
2014)

30
Thrash et al (2007) also studied biocathodes by introducing dissimilatory
perchlorate reducing bacteria (DPRB) to the anode. They investigated the reduction of
perchlorate, which is a very stable contaminant, in the cathodic chamber of a bioelectrical
reactor. Both pure culture of DPRB and natural DPRB populations were tested in this
experiment. The results showed that Dechloromonas and Azospira species in the pure
culture of DPRB readily reduced 90 mg L-1 perchlorate in this system with 2,6-
anthraquinone disulfonate (AQDS) as a mediator. When a natural microbial community
was inoculated into the fed-batch bioelectrical reactor, a novel DPRB, strain VDY, was
isolated which readily reduced perchlorate in a mediator-less reactor. In the continuous-
flow up-flow mode, perchlorate removal efficiency reached 95% at a perchlorate loading
rate of 60 mg L-1 day-1. These results demonstrated the potential for application of
bioelectrical reduction for the treatment of perchlorate contamination.
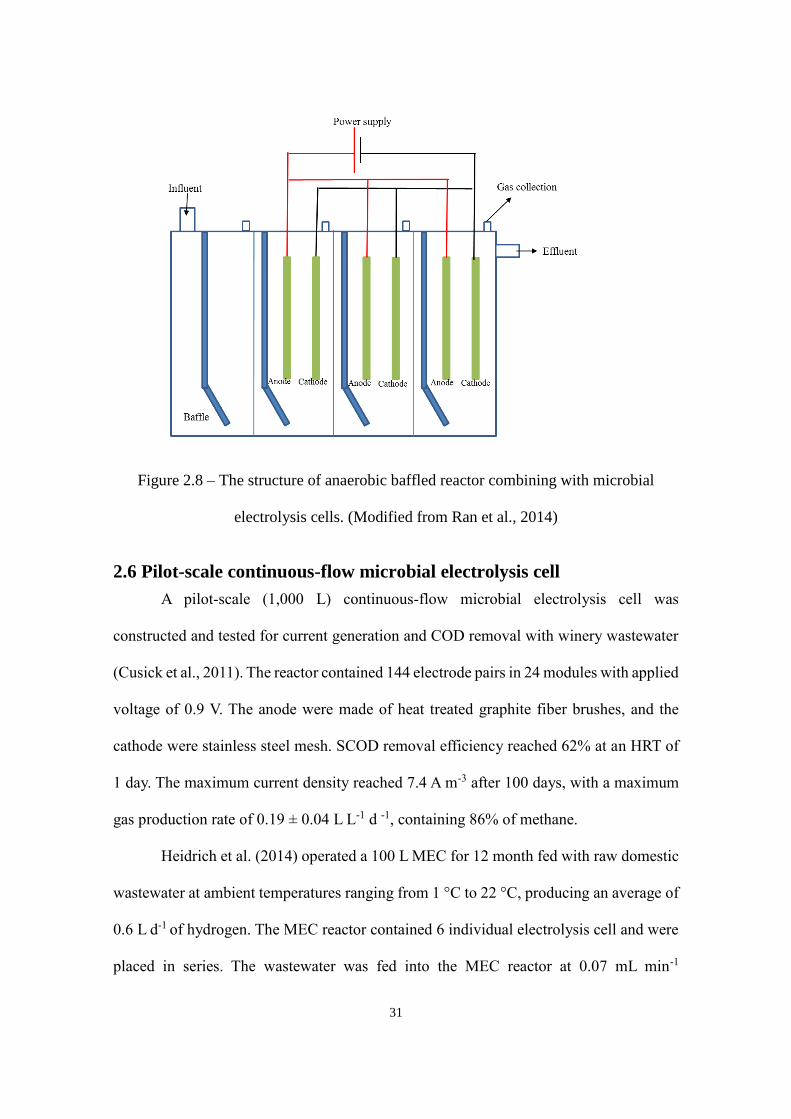
2.5 Combined processes
The anaerobic baffled reactor (ABR) a series of up-flow anaerobic sludge bed
(UASB) reactors may potentially play an important role in wastewater treatment. Ran et
al. (2014) developed a new process to enhance the stability and efficiency of ABR by
combining it with MECs, as shown in Figure 2.8. The lab scale ABR (3.46 L) was divided
into four equal compartments by vertical baffles. The anode and cathode were fixed in
the last three compartments with an applied voltage of 0.9 V and an HRT of 24 h. The
influent COD ranged from 1200 mg L-1 to 3500 mg L-1 with glucose as substrate. This
combined reactor generated both methane and hydrogen, with the hydrogen fraction of
biogas in the first compartment of 20.7% and methane content of 98.8%, 93.6% and 70.1%
in the last three compartments, and achieved 98% COD removal efficiency.
31
Figure 2.8 – The structure of anaerobic baffled reactor combining with microbial
electrolysis cells. (Modified from Ran et al., 2014)
2.6 Pilot-scale continuous-flow microbial electrolysis cell
A pilot-scale (1,000 L) continuous-flow microbial electrolysis cell was
constructed and tested for current generation and COD removal with winery wastewater
(Cusick et al., 2011). The reactor contained 144 electrode pairs in 24 modules with applied
voltage of 0.9 V. The anode were made of heat treated graphite fiber brushes, and the
cathode were stainless steel mesh. SCOD removal efficiency reached 62% at an HRT of
1 day. The maximum current density reached 7.4 A m-3 after 100 days, with a maximum
gas production rate of 0.19 ± 0.04 L L-1 d -1, containing 86% of methane.
Heidrich et al. (2014) operated a 100 L MEC for 12 month fed with raw domestic
wastewater at ambient temperatures ranging from 1 °C to 22 °C, producing an average of
0.6 L d-1 of hydrogen. The MEC reactor contained 6 individual electrolysis cell and were
placed in series. The wastewater was fed into the MEC reactor at 0.07 mL min-1

32
corresponding to a hydraulic retention time of 1 day with an influent COD ranging
between 147 and 1976 mg L-1. The aforementioned authors found that there was a
reduction in the total volume of hydrogen produced throughout the period, from July to
December, an average of 0.8 L d-1 of hydrogen was produced, while from December to
June, an average of 0.4 L d-1 hydrogen production was achieved. COD removal efficiency
was highly variable, sometimes reaching over 60%, sometimes lower than 30%. The
aforementioned authors also found that to maintain the MEC working in ambient
temperature, microbial cultures from the local wastewater treatment plant should be used
as the seed since they were already adapted to the ambient temperatures.
The two main challenges of the scaled-up process are the slow start-up time,
requiring as long as 60 days for the exoelectrogenic biofilm to develop and grow on the
anode, and the low hydrogen production.
2.7 Summary
Microbial electrolysis cell (MEC) is a very promising technology, since it can
convert organic waste to hydrogen with only a small energy input. There are several
parameters that can affect the performance of the MEC, such as the materials being used
(e.g., anode, cathode, and membrane); the MEC configuration; substrate composition; the
applied voltage; the controlled anode potential; as well as the feeding mode (batch or
continuous mode). Carbon, low price metals, and anion exchange membrane are widely
used materials for anode, cathode and membrane, respectively. While traditionally MECs
have been run in a fed-batch mode, the application of the MEC to operate in continuous-
flow mode has become very popular, which includes combining MEC with other
wastewater treatment processes, increasing number of anode electrodes to increase the
anode surface area, and incorporation of a penetrating anode chamber on top of cathode

33
chamber, etc. The continuous-flow mode can help MEC achieve better performance than
batch mode since the organic loading rate can be controlled to preclude substrate
limitations.
Running the MECs in continuous-flow mode is a fundamental step for the
scalability of MEC technology. The main challenge for MECs scaling up is to achieve
higher hydrogen production rate with lower energy input. To overcome the challenge and
commercialize the MEC technology will require the development of effective ARBs,
efficient cathode electrode materials, minimization of the internal losses which refers to
the modification of the MEC architecture, and also integration of different wastewater
treatment processes with MECs.
2.7 Reference
1. Alexandra De, M., O'Connor, O.A., Kosson, D.S. 1994. Metabolism of aniline under
different anaerobic electron-accepting and nutritional conditions. Environ. Toxicol.
Chem., 13, 233-239.
2. Call, D., Logan, B.E. 2008. Hydrogen production in a single chamber microbial
electrolysis cell lacking a membrane. Environ. Sci. Technol., 42, 3401-3406.
3. Cheng, S., Logan, B.E. 2007. Ammonia treatment of carbon cloth anodes to enhance
power generation of microbial fuel cells. Electrochem. Commun., 9, 492-496.
4. Cui, D., Guo, Y.-Q., Cheng, H.-Y., Liang, B., Kong, F.-Y., Lee, H.-S., Wang, A.-J.
2012. Azo dye removal in a membrane-free up-flow biocatalyzed electrolysis reactor
coupled with an aerobic bio-contact oxidation reactor. J. Hazard. Mater., 239, 257-264.
34
5. Cusick, R.D., Ullery, M.L., Dempsey, B.A., Logan, B.E. 2014. Electrochemical
struvite precipitation from digestate with a fluidized bed cathode microbial electrolysis
cell. Water Res., 54, 297-306.
6. Cusick, D.R., Bryan, B., Parker, D.S., Merrill, M.D., Mchanna, M., Diely, P.D., Liu,
G., Logan, B.E., 2011. Performance of a pilot-scale continuous flow microbial
electrolysis cell fed winery wastewater. Bioenergy and Biofuels., 89, 2053-2063.
7. Dennis, P.G., Guo, K., Imelfort, M., Jensen, P., Tyson, G.W., Rabaey, K. 2013. Spatial
uniformity of microbial diversity in a continuous bioelectrochemical system. Bioresour.
Technol., 129, 599-605.
8. Dhar, B.R., Gao, Y., Yeo, H., Lee, H.-S. 2013. Separation of competitive
microorganisms using anaerobic membrane bioreactors as pretreatment to microbial
electrochemical cells. Bioresour. Technol., 148, 208-214.
9. Escapa, A., Gil-Carrera, L., García, V., Morán, A. 2012. Performance of a continuous
flow microbial electrolysis cell (MEC) fed with domestic wastewater. Bioresour.
Technol., 117, 55-62.
10. Escapa, A., Lobato, A., García, D., Morán, A. 2013. Hydrogen production and COD
elimination rate in a continuous flow microbial electrolysis cell: The influence of
hydraulic retention time and applied voltage. Environmental Progress & Sustainable
Energy, 32, 263-268.
11. Gorby, YA., Yamina, S., Mclean JS et al. 2006. Electrically conductive bacterial
nanowires produced by Shewanella oneidensis strain MR-1 and other microorganisms. P.
Natl. Acad. Sci. USA. 103, 11358-11363

35
12. Gusseme, B.D., Soetaert, M., Hennebel, T., Vanhaecke, L., Boon, N., Verstraete, W.
2012. Catalytic dechlorination of diclofenac by biogenic palladium in a microbial
electrolysis cell. Microbial biotechnology, 5, 396-402.
13. Hernandez, ME., Kappler, A, Newman, DK., 2004. Phenazines and other redox-active
antibiotics promote microbial mineral reduction. Appl. Environ. Microb. 20, 921-928.
14. Hrapovic, S., Manuel, M.-F., Luong, J., Guiot, S., Tartakovsky, B. 2010.
Electrodeposition of nickel particles on a gas diffusion cathode for hydrogen production
in a microbial electrolysis cell. Int. J. Hydrogen Energy, 35, 7313-7320.
15. Hu, H., Fan, Y., Liu, H. 2008. Hydrogen production using single-chamber membrane-
free microbial electrolysis cells. Water Res. 42, 4172-4178.
16. Hu, H., Fan, Y., Liu, H. 2009. Hydrogen production in single-chamber tubular
microbial electrolysis cells using non-precious-metal catalysts. Int. J. Hydrogen Energy,
34, 8535-8542.
17. Jeremiasse, A.W., Hamelers, H.V., Saakes, M., Buisman, C.J. 2010. Ni foam cathode
enables high volumetric H 2 production in a microbial electrolysis cell. Int. J. Hydrogen
Energy, 35, 12716-12723.
18. Kadier, A., Simayi, Y., Kalil, M.S., Abdeshahian, P., Hamid, A.A. 2014. A review of
the substrates used in microbial electrolysis cells (MECs) for producing sustainable and
clean hydrogen gas. Renewable Energy, 71, 466-472.
36
19. Kundu, A., Sahu, J.N., Redzwan, G., Hashim, M. 2013. An overview of cathode
material and catalysts suitable for generating hydrogen in microbial electrolysis cell. Int.
J. Hydrogen Energy, 38, 1745-1757.
21. Lee, H.-S., Rittmann, B.E. 2009. Significance of biological hydrogen oxidation in a
continuous single-chamber microbial electrolysis cell. Environ. Sci. Technol., 44, 948-
954.
22. Lee, H.-S., Vermaas, W.F., Rittmann, B.E. 2010. Biological hydrogen production:
prospects and challenges. Trends Biotechnol., 28, 262-271.
23. Liu, W., Wang, A., Ren, N., Zhao, X., Liu, L., Yu, Z., Lee, D., 2008.
Electrochemically assisted biohydrogen production from acetate. Energy Fuels. 22, 159-
163
24. Liu, H., Hu, H., Chignell, J., Fan, Y. 2010. Microbial electrolysis: novel technology
for hydrogen production from biomass. Biofuels, 1, 129-142.
25. Logan, B.E., 2008a. Microbial Fuel Cells. John Wiley and Sons, Inc., Hoboken, New
Jersey.
26. Logan, B.E., Call, D., Cheng, S., Hamelers, H.V., Sleutels, T.H., Jeremiasse, A.W.,
Rozendal, R.A. 2008b. Microbial electrolysis cells for high yield hydrogen gas
production from organic matter. Environ. Sci. Technol., 42, 8630-8640.
27. Luo, H., Fu, S., Liu, G., Zhang, R., Bai, Y., Luo, X. 2014. Autotrophic biocathode for
high efficient sulfate reduction in microbial electrolysis cells. Bioresour. Technol., 167,
462-468.

37
28. Manuel, M.-F., Neburchilov, V., Wang, H., Guiot, S., Tartakovsky, B. 2010.
Hydrogen production in a microbial electrolysis cell with nickel-based gas diffusion
cathodes. J. Power Sources, 195, 5514-5519.
29. Nam, J.-Y., Tokash, J.C., Logan, B.E. 2011. Comparison of microbial electrolysis
cells operated with added voltage or by setting the anode potential. Int. J. Hydrogen
Energy, 36, 10550-10556.
30. Nam, J.Y., Yates, M.D., Zaybak, Z., Logan, B.E. 2014. Examination of protein
degradation in continuous flow, microbial electrolysis cells treating fermentation
wastewater. Bioresour. Technol., 171, 182-186.
30. Newman DK, Kolter R., 2000. A role for excreted quinones in extracecullar electron
transfer. Nature. 405, 94-94.
31. Rabaey, K., Van de Sompel, K., Maignien, L., Boon, N., Aelterman, P., Clauwaert,
P., De Schamphelaire, L., Pham, H.T., Vermeulen, J., Verhaege, M. 2006. Microbial fuel
cells for sulfide removal. Environ. Sci. Technol. 40, 5218-5224.
32. Rader, G.K., Logan, B.E. 2010. Multi-electrode continuous flow microbial
electrolysis cell for biogas production from acetate. Int. J. Hydrogen Energy, 35, 8848-
8854.
33. Ran, Z., Gefu, Z., Kumar, J.A., Chaoxiang, L., Xu, H., Lin, L. 2014. Hydrogen and
methane production in a bio-electrochemical system assisted anaerobic baffled reactor.
Int. J. Hydrogen Energy, 39, 13498-13504.

38
34. Refuera G., McCarthy KD., Mehta T., Nicoll JS., Tuominen MT., Lovely DR., 2005.
Extracellular electron transfer via microbial nanowires. Nature. 435, 1098-1101.
35. Rodriguez, M., Timokhin, V., Michl, F., Contreras, S., Gimenez, J., Esplugas, S.
2002. The influence of different irradiation sources on the treatment of nitrobenzene.
Catal. Today, 76, 291-300.
36. Rozendal, R.A., Hamelers, H.V.M., Buisman, C.J.N., 2006. Effects of membrane
cation transport on pH and microbial fuel cell performance. Environ. Sci. Technol. 40,
5206–5211
37. Rozendal, R.A., Hamelers, H.V., Molenkamp, R.J., Buisman, C.J. 2007. Performance
of single chamber biocatalyzed electrolysis with different types of ion exchange
membranes. Water Res., 41, 1984-1994.
38. Selembo, P.A., Merrill, M.D., Logan, B.E. 2009. The use of stainless steel and nickel
alloys as low-cost cathodes in microbial electrolysis cells. J. Power Sources, 190, 271-
278.
39. Sleutels, T.H., Lodder, R., Hamelers, H.V., Buisman, C.J. 2009. Improved
performance of porous bio-anodes in microbial electrolysis cells by enhancing mass and
charge transport. Int. J. Hydrogen Energy, 34, 9655-9661.
40. Sleutels, T.H., Ter Heijne, A., Buisman, C.J., Hamelers, H.V. 2013. Steady-state
performance and chemical efficiency of Microbial Electrolysis Cells. Int. J. Hydrogen
Energy, 38, 7201-7208.

39
41. Tartakovsky, B., Manuel, M.-F., Wang, H., Guiot, S. 2009. High rate membrane-less
microbial electrolysis cell for continuous hydrogen production. Int. J. Hydrogen Energy,
34, 672-677.
42. Thrash, J.C., Van Trump, J.I., Weber, K.A., Miller, E., Achenbach, L.A., Coates, J.D.
2007. Electrochemical stimulation of microbial perchlorate reduction. Environ. Sci.
Technol, 41, 1740-1746.
43. Turick EK., Tisa LS., Caccavo F., 2002. Melanin production and use as a soluble
electron shuttle for Fe oxide reduction and as a terminal electron acceptor by Shewanella
algae BRy. APPL. Environ. Microb. 68, 2436-2444.
44. Villano, M., Aulenta, F., Beccari, M., Majone, M. 2012. Start-up and performance of
an activated sludge bioanode in microbial electrolysis cells. Chem. Eng. (Mew York), 27.
45. von Canstein H., Ogawa J., Shimizu S, Lloyd Jr., 2008. Secretion of flavins by
Shewanella species and their role in extracellular electron transfer. APP. Environ.
Microb.,74, 615-623.
46. Wang, A.-J., Cui, D., Cheng, H.-Y., Guo, Y.-Q., Kong, F.-Y., Ren, N.-Q., Wu, W.-
M. 2012. A membrane-free, continuously feeding, single chamber up-flow biocatalyzed
electrolysis reactor for nitrobenzene reduction. J. Hazard. Mater., 199, 401-409.
47. Wang, A., Liu, W., Ren, N., Cheng, H., Lee, D.-J. 2010. Reduced internal resistance
of microbial electrolysis cell (MEC) as factors of configuration and stuffing with granular
activated carbon. Int. J. Hydrogen Energy, 35, 13488-13492.

40
48. Wang, X., Cheng, S., Feng, Y., Merrill, M.D., Saito, T., Logan, B.E. 2009. Use of
carbon mesh anodes and the effect of different pretreatment methods on power production
in microbial fuel cells. Environ. Sci. Technol, 43, 6870-6874.
49. Zhao, F., Harnisch, F., Schro¨der, U., Scholz, F., Bogdanoff, P., Herrmann, I., 2006.
Challenges and constraints of using oxygen cathodes in microbial fuel cells. Environ. Sci.
Technol. 40, 5193–5199.
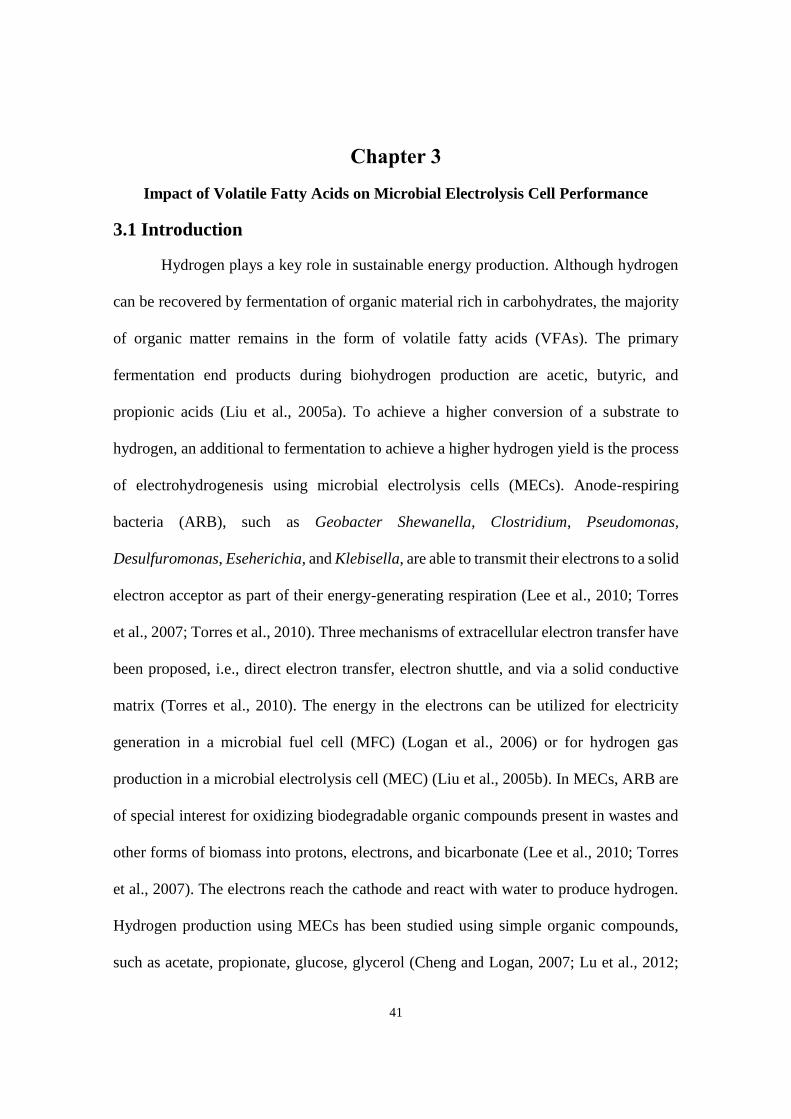
41
Chapter 3
Impact of Volatile Fatty Acids on Microbial Electrolysis Cell Performance
3.1 Introduction
Hydrogen plays a key role in sustainable energy production. Although hydrogen
can be recovered by fermentation of organic material rich in carbohydrates, the majority
of organic matter remains in the form of volatile fatty acids (VFAs). The primary
fermentation end products during biohydrogen production are acetic, butyric, and
propionic acids (Liu et al., 2005a). To achieve a higher conversion of a substrate to
hydrogen, an additional to fermentation to achieve a higher hydrogen yield is the process
of electrohydrogenesis using microbial electrolysis cells (MECs). Anode-respiring
bacteria (ARB), such as Geobacter Shewanella, Clostridium, Pseudomonas,
Desulfuromonas, Eseherichia, and Klebisella, are able to transmit their electrons to a solid
electron acceptor as part of their energy-generating respiration (Lee et al., 2010; Torres
et al., 2007; Torres et al., 2010). Three mechanisms of extracellular electron transfer have
been proposed, i.e., direct electron transfer, electron shuttle, and via a solid conductive
matrix (Torres et al., 2010). The energy in the electrons can be utilized for electricity
generation in a microbial fuel cell (MFC) (Logan et al., 2006) or for hydrogen gas
production in a microbial electrolysis cell (MEC) (Liu et al., 2005b). In MECs, ARB are
of special interest for oxidizing biodegradable organic compounds present in wastes and
other forms of biomass into protons, electrons, and bicarbonate (Lee et al., 2010; Torres
et al., 2007). The electrons reach the cathode and react with water to produce hydrogen.
Hydrogen production using MECs has been studied using simple organic compounds,
such as acetate, propionate, glucose, glycerol (Cheng and Logan, 2007; Lu et al., 2012;

42
Selembo et al., 2009; Sun et al., 2010); complex organic matter, such as starch, protein
(Montpart et al., 2015; Nam et al., 2014); and real wastewater, for example, domestic
wastewater, winery wastewater, and industrial wastewater (Cusick et al., 2011; Ditzig et
al., 2007; Tenca et al., 2013).
Recently, combining dark fermentation with MECs seems to be very promising.
Anode respiration process and fermentation can be combined in two different ways. One
is adding the fermentative microorganisms and anode respiring bacteria in the same
reactor to create a mixture of these two cultures in the MEC anode chamber. Montpart et
al. (2015) obtained a group of microorganisms able to degrade a specific complex
substrate (glycerol, milk and starch) by separately growing fermentative and ARB
microbial communities in culture flasks and in an MFC respectively before combining
both communities in a single chamber MEC. In this approach, they demonstrated that the
growth of an anodic syntrophic consortium between fermentative bacteria and ARB was
operationally enhanced and increased the potential of these complex substrates to be
treated (Montpart et al., 2015). On the other hand, fermentation and hydrolysis could be
separated into an independent reactor, with the MFC/MEC receiving simpler organic
compounds typical of fermentation effluent, which are further consumed by ARB (Torres
et al., 2007). For example, a two-stage dark-fermentation and electrohydrogenesis process
was used to produce hydrogen gas by converting organic compounds such as cellulose
(Lalaurette et al., 2009) and crude glycerol (Chookaew et al., 2014) to smaller
compounds.
As the main end products from dark fermentation, VFAs have a vital impact on
the performance of MECs. Escapa et al. (2013) found that acetate and butyrate were easily

43
degradable, whereas propionate exhibited pseudo-recalcitrant behavior in a continuous-
flow two-chamber MEC fed with synthetic dark fermentation wastewater. However, this
was contradictory to the findings of other groups. Li et al. (2014) indicated that the
propionate had a higher priority sequence for hydrogen production than butyrate in a
single-chamber MEC fed with corn stalk fermentation effluent. In their work, the removal
efficiency of acetate, propionate and butyrate were reported as of 81-91 %, 11-16 % and
4%, respectively (Li et al., 2014). Torres et al. (2007) also demonstrated that acetate and
propionate were consumed more effectively than the butyrate in the continuous-flow H-
type MEC fed with a mixture of fermentation products. They reported a maximum current
density for acetate of 9.0 A/m2, 1.6 A/m2 for propionate, and only 0.16 A/m2 for butyrate.
The detailed comparisons among the above studies are listed in Table 3.1. In order to
clear this contradiction and figure out the impact of different VFAs on the MEC
performance, this study compared MEC operational parameters by feeding the MEC with
different VFAs, namely acetate, butyrate and propionate.

44
Table 3. 1 -- Summary of current densities and removal efficiencies by different authors using acetate, butyrate and propionate
Substrate Running
mode MEC type
Applied
voltage
(V)(unless
otherwise
stated)
Ta
(°C) pH
Influent
component
Influent
COD
(mg/L)
Removal
efficiency
(%)
CDd
(A/m3)
HPRc
(m3/m3/d) Source
CSFE * batch single chamber 0.8 36 7
acetate 1490e 91
340 3.43 Li et al.
(2014) butyrate 1967e 4
propionate 45e 14d
SDFE § continuous-
flow
two chamber (gas
cathode) 1 25 7
acetate 1302e 100
206 1.42
Escapa
et al.
(2013)
butyrate 736e 100
propionate 1227e <100
SDFE § continuous-
flow
H-type dual-
compartment
anode
potential
(+0.1 V
vs
Ag/AgCl)
30 7.4
acetate 2560e 281e Torres et
al.
(2007)
butyrate 6400e 5e
propionate 4480e 50e
Note: Ta: temperature; CDb current density; HPRc: hydrogen production rate; d: the data was gotten from the figure in the reference; e: the
data was calculated based on the information in the literature; CSFE *: corn stalk fermentation effluent; SDFE §: synthetic dark
fermentation effluent

45
3.2 Materials and methods
3.2.1 Reactor set-up
The MEC was fabricated from plexiglass with anode and cathode volumes of 550
mL and 225 mL, respectively. The liquid volume in the anode varied from 500 mL to 530
mL since some of the liquid was washed out with the purge of nitrogen. One bundle of
high density carbon fibers (2293-B, 24K Carbon Tow, Fibre Glast Developments Corp.,
OH, USA) that was intertwined through holes drilled on a stainless steel frame was used
as the anode module. The specific surface area of the fibers was 571429 m2/m3 (fiber’s
diameter, 7 µm; length, 150 cm). The bundle contained 24,000 individual carbon
filaments with a geometric surface area of 7913 cm2. The geometric surface area of the
anodes per MEC anode volume was 1583 m2/m3. The carbon fibers were pretreated with
nitric acid (1N), acetone (1N) and ethanol (1N) for 1 day each, and then washed with
MilliQ water (18.2 MΩ-cm) (Dhar et al., 2013). The cathode electrode was made of a
stainless steel mesh (Type 304, McMaster Carr, OH, USA). An anion exchange
membrane (AMI-7001, Membrane International Inc., NJ, USA) was placed between the
anode and the cathode as a separator, and the geometric surface area of the membrane
was 18 cm2. The membrane was pretreated at 40°C in 5% NaCl solution for 24 hours as
per the manufacturer recommendations. To avoid possible short-circuiting and liquid
leakage, non-conductive polyethylene mats were used between the electrodes and
membrane (Dhar et al., 2013). The distance between the anode and cathode electrodes
was less than 1 cm. A schematic and picture of the sandwich type anode-membrane-
cathode are shown in Figure 3.1.
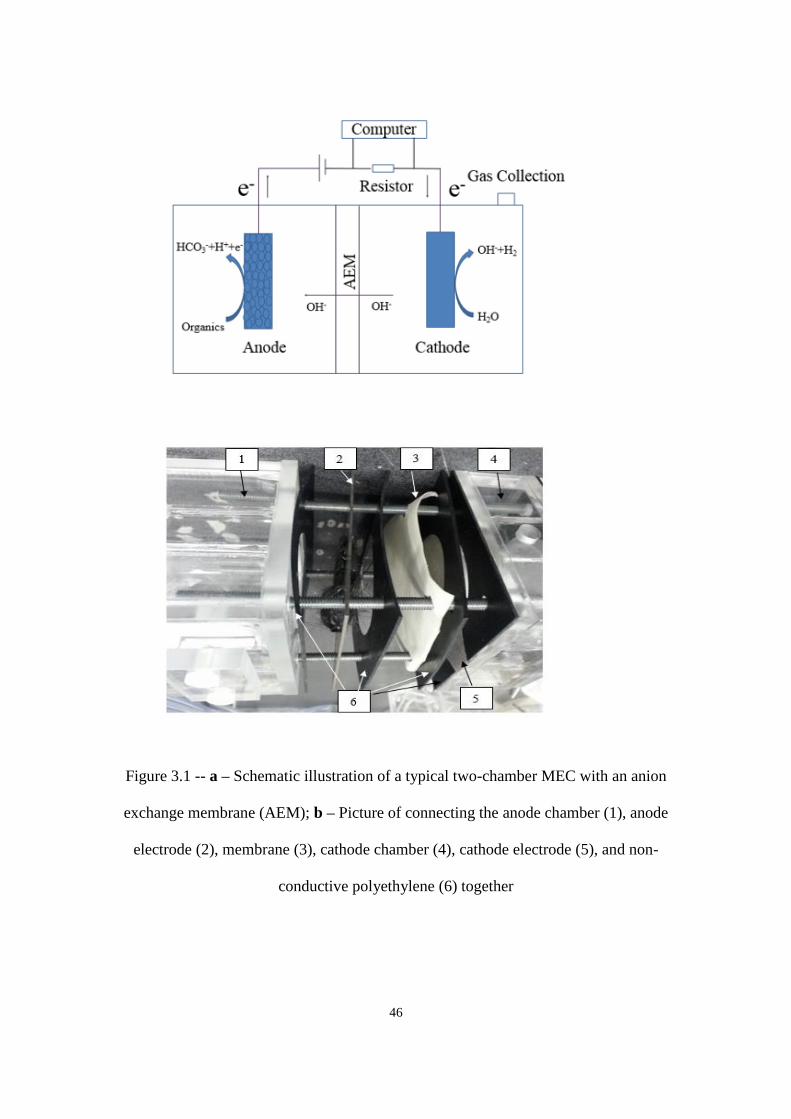
46
Figure 3.1 -- a – Schematic illustration of a typical two-chamber MEC with an anion
exchange membrane (AEM); b – Picture of connecting the anode chamber (1), anode
electrode (2), membrane (3), cathode chamber (4), cathode electrode (5), and non-
conductive polyethylene (6) together

47
A voltage of 1.0 V was applied across the electrodes using a power supply (B&K
Precision Corp., California, USA). The positive lead of the power supply was connected
to the anode, and the negative lead was serially connected to a 10 Ω resistor and the
cathode. The temperature was maintained at room temperature (25°C) during the whole
experiment.
3.2.2 MEC inoculation and operation
The MEC was inoculated with 50 mL of effluent from a working MEC, which
selectively enriched from activated sludge microbial consortium from Adelaide
Wastewater Treatment Plant (London, CA) over a period of three months, during which
the cultures were fed with acetate in batches. The anode chamber was fed with a medium
containing 2.3 g/L KH2PO4, 4.66 g/L Na2HPO4, 0.038 g/L NH4Cl and 0.84 g/L NaHCO3
and 1 mL/L of a trace element mixture with the following composition: 25 mg/L
MgCl2·6H2O; 6 mg/L MnCl2·4H2O; 1.2 mg/L CaCl2·2H2O; 0.5 mg/L ZnCl2; 0.11 mg/L
NiCl2; 0.1 mg/L CuSO4·5H2O; 0.1 mg/L AlK(SO4)2·12H2O; 1 mg/L Co(NO3)2·6H2O;
0.1 mg/L H3BO3; 5 mg/L EDTA; 0.1 mg/L Na2WO4·2H2O; 0.1 mg/L NaHSeO3; 0.2 mg/L
Na2MoO4·2H2O. 20 mM FeCl2·4H2O and 77 mM Na2S·9H2O were also added to the
medium (1 mL/L) (Dhar et al., 2013; Torres et al., 2007). The substrate concentrations
(added as sodium acetate, sodium propionate, sodium butyrate) are noted below. Medium
pH was constant at 7.2 ± 0.2. The cathode chamber was filled with distilled water.
The MEC was carried out in batch mode. At least three consecutive batch cycles
were achieved before changing the substrate. When the current dropped below 2 mA for
acetate and butyrate-fed cycles, and 1 mA for propionate-fed cycles, the liquids in the
anode and cathode chamber were emptied and refilled with the medium as described
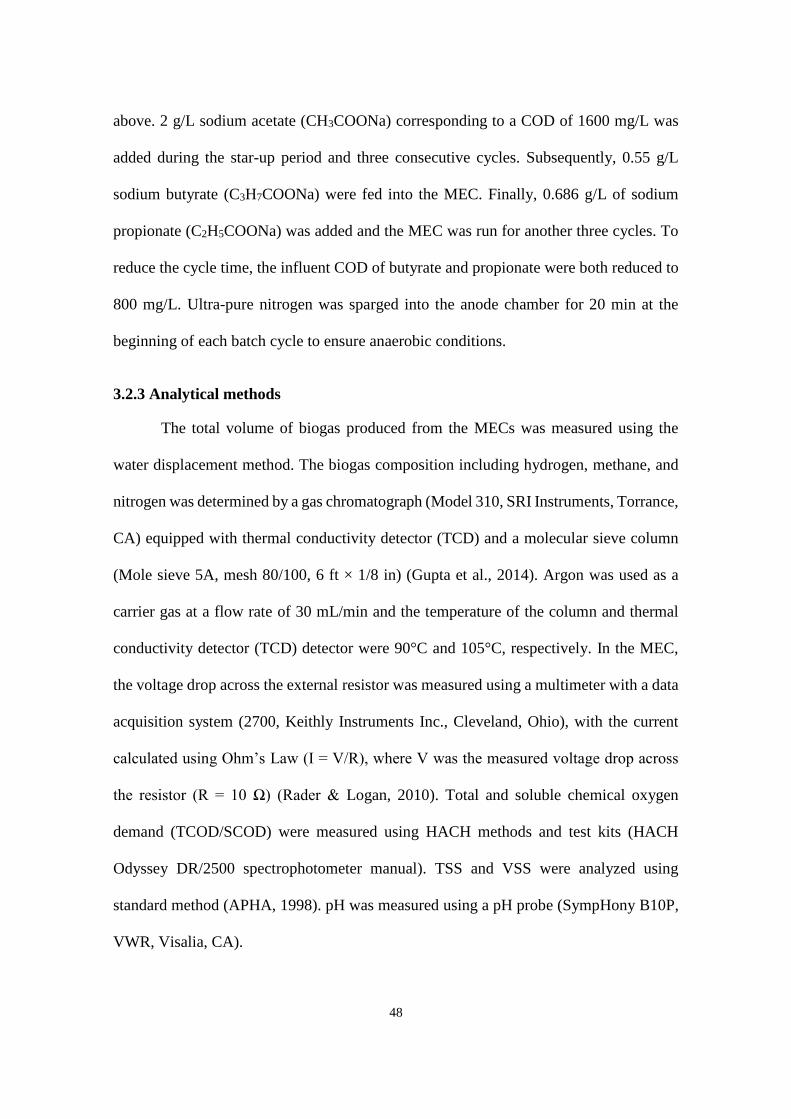
48
above. 2 g/L sodium acetate (CH3COONa) corresponding to a COD of 1600 mg/L was
added during the star-up period and three consecutive cycles. Subsequently, 0.55 g/L
sodium butyrate (C3H7COONa) were fed into the MEC. Finally, 0.686 g/L of sodium
propionate (C2H5COONa) was added and the MEC was run for another three cycles. To
reduce the cycle time, the influent COD of butyrate and propionate were both reduced to
800 mg/L. Ultra-pure nitrogen was sparged into the anode chamber for 20 min at the
beginning of each batch cycle to ensure anaerobic conditions.
3.2.3 Analytical methods
The total volume of biogas produced from the MECs was measured using the
water displacement method. The biogas composition including hydrogen, methane, and
nitrogen was determined by a gas chromatograph (Model 310, SRI Instruments, Torrance,
CA) equipped with thermal conductivity detector (TCD) and a molecular sieve column
(Mole sieve 5A, mesh 80/100, 6 ft × 1/8 in) (Gupta et al., 2014). Argon was used as a
carrier gas at a flow rate of 30 mL/min and the temperature of the column and thermal
conductivity detector (TCD) detector were 90°C and 105°C, respectively. In the MEC,
the voltage drop across the external resistor was measured using a multimeter with a data
acquisition system (2700, Keithly Instruments Inc., Cleveland, Ohio), with the current
calculated using Ohm’s Law (I = V/R), where V was the measured voltage drop across
the resistor (R = 10 Ω) (Rader & Logan, 2010). Total and soluble chemical oxygen
demand (TCOD/SCOD) were measured using HACH methods and test kits (HACH
Odyssey DR/2500 spectrophotometer manual). TSS and VSS were analyzed using
standard method (APHA, 1998). pH was measured using a pH probe (SympHony B10P,
VWR, Visalia, CA).

49
3.2.4 Calculations
3.2.4.1 Hydrogen recovery
Coulombic efficiency (CE) was calculated on the basis of the measured current
compared to the substrate removed using the following equations, (1-3):
CE =𝑛𝐶𝐸
𝑛𝑡ℎ=
8∙IAVG,90∙𝑡
F∆SCOD (1)
nth = 2∆SCOD
MO2 (2)
nCE = IAVG,90𝑡
2F (3)
Where nCE (mol) is the moles of hydrogen that could be recovered based on measured
current, nth (mol) is the maximum theoretical hydrogen potential from the SCOD removal,
F is the Faraday constant (F = 96485 C/mole-), ∆SCOD (g) is the soluble COD removed,
and 8 is the conversion factor of COD to moles of electrons, MO2 (g/mol) is the molecular
weight of oxygen, while the 2 in equation (2) is the number of moles of hydrogen that can
be produced with each mole of SCOD consumed. IAVG, 90 is the average current calculated
over the time (t) for accumulation of 90% of the charge. The use of IAVG, 90 is more
accurate when analyzing MEC performance in a batch cycle because it eliminates the
small current densities at the end of the cycle and focuses on the most useful part of the
current generation cycle (Ivanov et al., 2013).
The cathodic hydrogen recovery (rcat) was calculated using equation (4):
rcat =nH2
nCE (4)
Where nH2 (mol) is the actual moles of hydrogen recovered at the cathode.
The overall hydrogen recovery is (Logan et al., 2008): RH2 = CErcat (5)

50
Theoretical hydrogen yield (YH2) is based on the theoretical maximum production of
hydrogen.
YH2 = nH2
nth (6)
Where nth is the maximum theoretical hydrogen (mol) based on SCOD removal.
Volumetric hydrogen production rate (HPR) (m3 H2/m3/d) was normalized to the
cathode liquid volume (225 mL).
3.2.4.2 Energy recovery
The energy recovered (ηE) based on the energy input was calculated using the
following equation:
ηE =−WH2
Win=
nH2∆HH2
EapIt−I2Rt (7)
Where WH2 (J) is the amount of energy recovered in hydrogen, Win (J) is the electrical
energy input, ∆HH2 (-285.8 J/mol) is the energy content of hydrogen based on the heat
of combustion (Logan et al., 2008), Eap (V) is the applied voltage to the system by the
power supply, I (A) is the current during the batch cycle, R is the external resistor (10
Ω), and t (s) is the time of each batch cycle.
The energy recovered (ηE+S) based on both the energy input and the energy in the
substrate was calculated using the following equation:
ηE+S =−WH2
Win−Ws (8)

51
Where Ws is the energy in the substrate which can be calculated similar to the energy
content of hydrogen, i.e., ∆HAcetate = -874.3 KJ/mol (Logan et al., 2008), ∆HPropionate= -
1528.3 KJ/mol (Chadwick, 1988), ∆HButyrate = -2183.5 KJ/mol (Dorofeeva et al., 2001).
The current density (CD) (A/m2 or A/m3) was the current produced in the batch cycle
per unit membrane surface area, or unit liquid volume.
3.3 Results and discussion
3.3.1 Effects of substrate on current density and hydrogen production rate
The profile of the batch current density fed with different substrates is illustrated
in Figure 3.2. During the start-up period, the current stayed at zero for 24 hours, and then
started to increase. For all other cycles, the current would increase directly (without lag
phase) after feeding. This indicated that the anode respiring bacteria were effectively
attached to the anode. When the MEC was fed with butyrate for the first time (cycle 5),
the current increased smoothly peaking on day 51, 9 days after the butyrate feed, thus
demonstrating that the ARB were adapting to the new substrate. In the last butyrate cycle,
the current peaked only 24 hours after the feed. For all three butyrate batches, the
maximum current was almost the same at 4.5 mA. After feeding the MEC with
propionate, the current also increased very slowly and after 8 days achieved a lower
maximum current of 3.0 mA. In the last cycle of the propionate-fed MEC (cycle 10), the
current did not peak until after 8 days, which was the same as the first propionate cycle
(cycle 8). The comparatively slower rate for the current to peak in the propionate-fed
MEC denoted that the ARB cannot utilize propionate directly. It is more likely that the
propionate was first oxidized to acetate by acetogenic bacteria, and then consumed by
ARB. The average time for accumulation of 90% of the charge were 8.9 days for acetate,
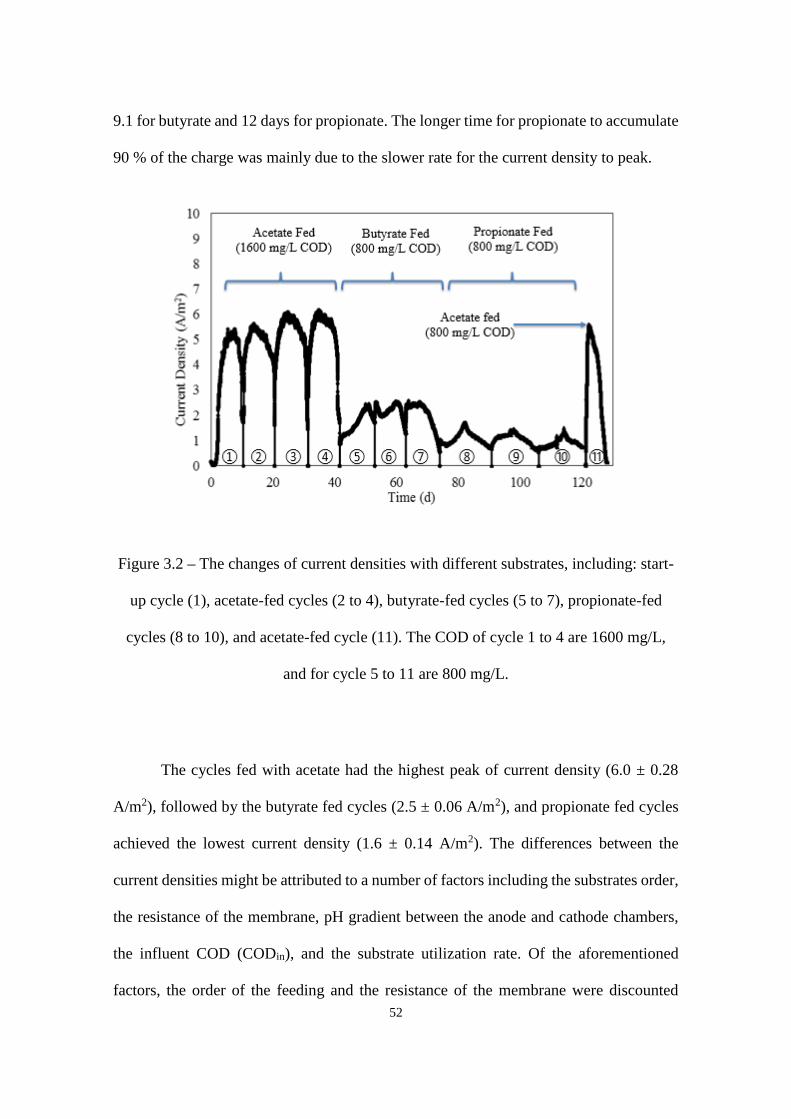
52
9.1 for butyrate and 12 days for propionate. The longer time for propionate to accumulate
90 % of the charge was mainly due to the slower rate for the current density to peak.
Figure 3.2 – The changes of current densities with different substrates, including: start-
up cycle (1), acetate-fed cycles (2 to 4), butyrate-fed cycles (5 to 7), propionate-fed
cycles (8 to 10), and acetate-fed cycle (11). The COD of cycle 1 to 4 are 1600 mg/L,
and for cycle 5 to 11 are 800 mg/L.
The cycles fed with acetate had the highest peak of current density (6.0 ± 0.28
A/m2), followed by the butyrate fed cycles (2.5 ± 0.06 A/m2), and propionate fed cycles
achieved the lowest current density (1.6 ± 0.14 A/m2). The differences between the
current densities might be attributed to a number of factors including the substrates order,
the resistance of the membrane, pH gradient between the anode and cathode chambers,
the influent COD (CODin), and the substrate utilization rate. Of the aforementioned
factors, the order of the feeding and the resistance of the membrane were discounted

53
because at the end of this experiment, the MEC was fed with acetate again at a
concentration of 800 mg COD/L, and the current was almost the same as the current
achieved at the beginning of this experiment (See Figure 3.2). The pH gradient was not a
reason to cause these differences neither, since the pHs of the cathode were very close,
i.e., 9.8 ± 1.7 for acetate, 9.7 ± 0.8 for butyrate, and 10.0 ± 0.4 for propionate. The anode
pHs during the whole experimental period were maintained near neutral by the buffer in
the medium. Even though the influent COD of acetate was different from that of butyrate
and propionate, this could not cause the large difference in the maximum current densities
between acetate and butyrate or propionate, because at the end of the experiment, when
fed with 800 mg/L COD of acetate, the achieved current density was as high as 5.5 A/m2,
which was almost the same as MEC feeding with 1600 mg/L COD acetate. The reduced
influent COD concentration only reduced the cycle time from 10.6 to 6.4 days. This is
consistent with the findings of Liu et al. (2005a) who reported that the voltages generated
in a microbial fuel cell (MFC) using acetate at different concentrations (from 80 mg/L to
800 mg/L) stayed at around 0.45 V. In addition, Oh et al. (2005) noted that the current
density remained the same upon changing the influent propionate concentration from 0.26
mM to 0.53 mM. This clearly demonstrates that the only reason to limit the current
densities in this case was the type of substrate. Acetate has been well known to be easily
utilized by ARB, since it is not fermentable and has relatively rapid oxidation kinetics in
MFC/MECs (Lee et al., 2009), while there has been no agreement on the relative
biodegradability of butyrate and propionate. As the substrate-utilization rate is
proportional to current density in an MEC (Lee and Rittmann., 2009), the utilization rate
of the propionate (28 ± 0.8 mg COD/L/d) might have limited the current density, which
was relatively low when compared with the average substrate utilization rate of acetate

54
(92 ± 5.0 mg COD/L/d) and butyrate (41 ± 4.8 mg COD/L/d). This indicated that the
utilization rate of the substrates for ARB in MECs followed the order: acetate > butyrate
> propionate.
As depicted in Figure 3.3, the type of substrate also has a significant impact on
the hydrogen production rate. Similar to the trend of current density, the hydrogen
production rate decreased from 0.50 ± 0.04 m3/m3/d for acetate to 0.07 ± 0.01 m3/m3/d
for propionate. The current density and hydrogen production exhibited the same trend.
Figure 3.3 – The average current densities and hydrogen production rates in MEC fed
with different substrates
3.3.2 Effects of substrate on hydrogen recovery and energy efficiency
Cathodic hydrogen recovery is a very important parameter to evaluate the MEC
performance, since it takes into account the H2 recovered at the cathode and the electrons
transferred through the electrode. While indeed both electrodes appear independent,
based on equation (4), the cathodic hydrogen recovery depends on both the hydrogen
-0.5
-0.3
-0.1
0.1
0.3
0.5
0.7
0
2
4
6
8
Acetate-Fed Butyrate-Fed Propionate-Fed
Hyd
rogen
pro
duct
ion r
ate
(m3/m
3/d
)
Curr
ent
den
sity
(A
/m2)
Current density
Hydrogen production rate

55
recovery and the electron transferred from the anode to the cathode, which is influenced
by the ARB activity, and hence varied from one substrate to another. According to the
cathodic reaction, the more the electrons transferred to hydrogen, the higher the cathodic
hydrogen recovery. In this study, the cathodic hydrogen recovery decreased in the order
of feeding with acetate, butyrate and propionate as shown in Figure 3.4, which were 98 ±
0.8, 79 ± 4.9, and 71 ± 7.2 %, respectively. The differences in the cathodic hydrogen
recoveries revealed that the electrons transferred to produce hydrogen for propionate was
not as efficient as butyrate and acetate. The ratio of current density over hydrogen
production rate exhibited an inverse linear relationship as shown in Figure 3.5.
Figure 3.4 – The coulombic efficiencies (CE), cathodic hydrogen recoveries and overall
hydrogen recoveries in MEC fed with different substrates
0
20
40
60
80
100
120
Acetate-Fed Butyrate-Fed Propionate-Fed
Rec
over
y (
%)
CE
Cathodic hydrogen recovery
Overall hydrogen recovery
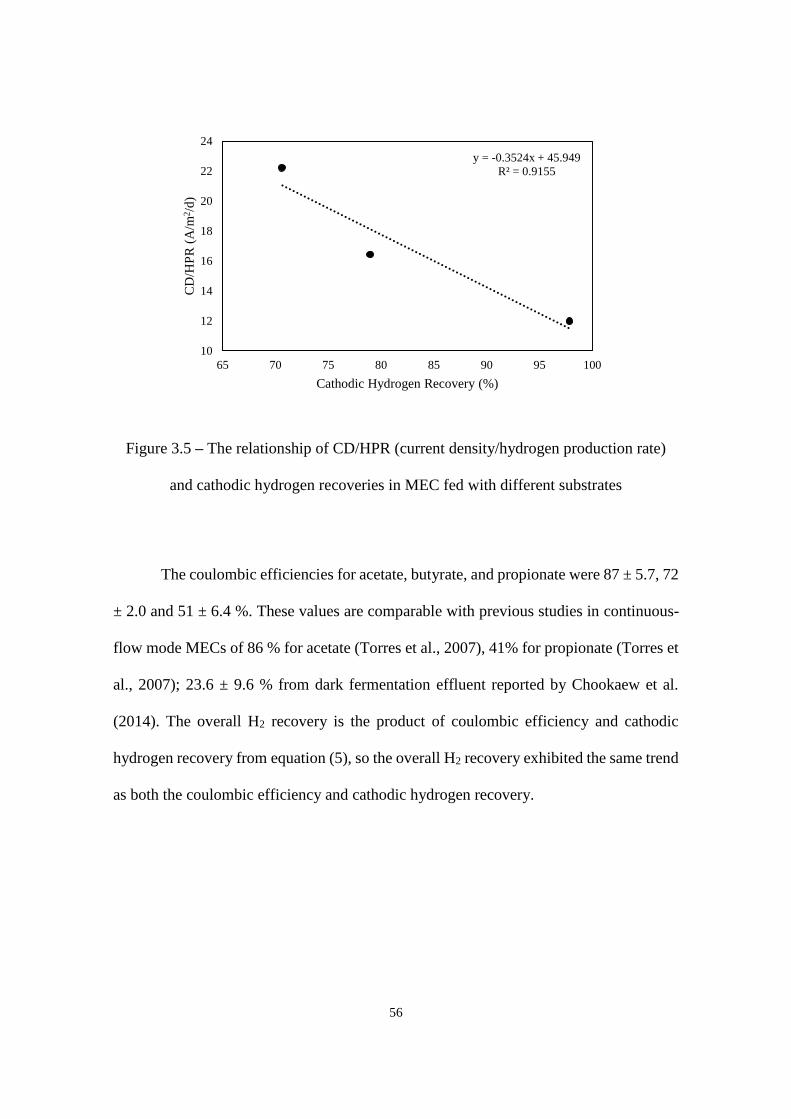
56
Figure 3.5 – The relationship of CD/HPR (current density/hydrogen production rate)
and cathodic hydrogen recoveries in MEC fed with different substrates
The coulombic efficiencies for acetate, butyrate, and propionate were 87 ± 5.7, 72
± 2.0 and 51 ± 6.4 %. These values are comparable with previous studies in continuous-
flow mode MECs of 86 % for acetate (Torres et al., 2007), 41% for propionate (Torres et
al., 2007); 23.6 ± 9.6 % from dark fermentation effluent reported by Chookaew et al.
(2014). The overall H2 recovery is the product of coulombic efficiency and cathodic
hydrogen recovery from equation (5), so the overall H2 recovery exhibited the same trend
as both the coulombic efficiency and cathodic hydrogen recovery.
y = -0.3524x + 45.949
R² = 0.9155
10
12
14
16
18
20
22
24
65 70 75 80 85 90 95 100
CD
/HP
R (
A/m
2/d
)
Cathodic Hydrogen Recovery (%)

57
Table 3. 2 -- Comparison of key parameters reported in literatures versus data obtained in this study
Substrate Eap
(V)
YH2 (mol H2/mol
substrate)(unless otherwise
stated)
RH2
(%)
HPR
(m3/m3/d)
ηE
(%)
ηE+S
(%)
CDa
(A/m3)
CDb
(A/m2)
CE
(%) Source
Acetic acid 0.8 3.65 91 1.1 260 82 99 Cheng and Logan (2007)
0.5 53 0.02 169 53 2.8 92 Rozendal et al. (2006)
Sodium acetate 0.6 62 0.53 204 58 52 75 Hu et al. (2008)
1 24 0.31 26 23 Rozendal et al. (2007)
1 3.9 6.9* 4.7 Tartakovsky et al. (2009)
1 1.4 1.33* 1.8 Tartakovsky et al. (2009)
1 3.6 90 0.53 161 68 22.17 6.16 91 This study
Sodium butyrate 1 5.94 59 0.18 127 48 9.27 2.57 70 This study
Sodium propionate 1 2.56 37 0.072 112 43 5.26 1.46 59 This study
DFE § 1 27.93 mL H2/g COD consumed 1.9 0.019 23.5 9.1 Chookaew et al. (2014)
Note: The data was the highest value chosen from each substrate-fed cycles. Eap: applied voltage; YH2: the hydrogen yield based on substrate consumed;
RH2: overall hydrogen recovery; HPR :average hydrogen production rate; ηE: energy efficiency based on electric energy input; ηE+S: energy efficiency
based on both energy input and the energy content in substrate; CDa: current density based on anode liquid volume; CDb: current density based on anode
or membrane surface area; CE: coulombic efficiency; * : the data was calculated based on the information in the literature; §: dark fermentation effluent
58
The hydrogen yield and energy efficiency are shown in Figure 3.6. Theoretically,
4 moles of hydrogen are produced with 1 mole of acetate consumed according to equation
(9). In this study, 3.4 ± 0.25 moles hydrogen per mole of acetate consumed were observed.
This hydrogen yield corresponded to an energy recovery of 161 ± 1.4 % when evaluated
in terms of only the voltage addition (1 V). For butyrate, the achieved hydrogen yield was
5.6 ± 0.29 mol H2/mol butyrate, as compared with a theoretical value of 10 mol H2/mol
butyrate (Equation (10)). The energy efficiency for butyrate was 121 ± 7.3%. It should be
noted that since the energy efficiency calculation was only based on the electrical input
power, any values above 100% reflect energy recovery from the chemical substrate as
well. These data are comparable with the reported performance in the literature (Table
3.2). In this study, a hydrogen yield of 2.46 ± 0.17 mol H2/mol propionate was achieved
as compared with a theoretical yield of 7 mol H2/mol propionate (Equation (11)). The
relatively lower observed hydrogen yield for propionate in this study is consistent with
the literature. Moreover, the normalized hydrogen production per unit mass of soluble
COD consumed (∆SCOD) are 0.053 mol H2/g ∆SCOD for acetate, 0.035 mol H2/g
∆SCOD for butyrate and 0.022 mol H2/g ∆SCOD for propionate, confirming that more
soluble COD was oxidized to produce hydrogen from acetate and butyrate-fed cycles than
from propionate-fed cycles.

59
Figure 3.6 – The changes of hydrogen yields (YH2), energy efficiencies with only
electric input (ηE), and energy efficiencies including both electric input and the energy
content in substrate (ηE+S) in MEC fed with different substrates
Acetate as substrate:
1/8 CH3COO- + 3/8 H2O → 1/8 CO2 + 1/8 HCO3- + H+ + e- (9)
Butyrate as substrate:
1/20 CH3CH2CH2COO- + 7/20 H2O → 3/20 CO2 + 1/20 HCO3- + H+ + e- (10)
Propionate as substrate:
1/14 CH3CH2COO- + 5/14 H2O → 1/7 CO2 + 1/14 HCO3- + H+ + e- (11)
-20
0
20
40
60
80
100
120
140
160
0
2
4
6
8
10
12
14
16
18
20
Acetate-Fed Butyrate-Fed Propionate-Fed
Ener
gy e
ffic
iency
(%
)
YH
2(m
ol
H2/m
ol
sub
stra
te)
YH2
ηE
η(E+S)

60
3.3.3 Effects of substrate on COD removal and biomass production
Tables 3 and 4 describe the COD removal efficiencies together with a COD mass
distribution for acetate, butyrate, and propionate. The start-up period was not included in
this analysis. Almost all the SCOD was consumed (96 ± 1.7 %) in the acetate-fed MEC.
This was consistent with the high hydrogen yield obtained in this study. The SCOD
removal efficiencies for butyrate and propionate were 88 ± 5.3 and 87 ± 5.8 % respectively.
The relatively lower SCOD removal efficiencies for butyrate and propionate compared
with acetate was consistent with the measured current densities.
Table 3.3 -- COD data for each cycle
Substrate TCOD
initial
(mg)
SCOD
initial
(mg)
TCOD
final
(mg)
SCOD
final (mg)
SCOD
Removed
efficiency
(%)
Average
SCOD
Removal
efficiency
(%)
Acetate-Fed 894.4 894.4 82.3 39.8 95.6
895.6 895.6 48.2 22.4 97.5 96 ± 1.7
797.7 797.7 83.5 46.6 94.2
Butyrate-Fed 420.1 420.1 102.6 74.2 82.3
408.1 408.1 58.8 39.8 90.3 88 ± 5.3
424.9 424.9 89.0 32.9 92.3
Propionate-Fed 401.9 401.9 70.7 26.8 93.3
419.0 419.0 129.2 72.6 82.7 87 ± 5.8
397.8 397.8 109.1 63.6 84.0
Table 3.4 -- COD mass distribution
COD sinks
Acetate-fed MEC Butyrate-fed MEC Propionate-fed MEC
COD
(mg)
Fraction
(%)
COD
(mg)
Fraction
(%)
COD
(mg)
Fraction
(%)
Initial COD 863 100 418 100 406 100
Final SCOD 36 4 49 12 55 14
H2 655 76 208 50 124 31
Suspended biomass 35 4 34 8 49 12
Total COD out 726 84 292 70 227 56
Attached biomass 137 16 126 30 179 44

61
The possible COD sinks in this system were soluble microbial products (SMP),
biomass (suspended and attached) and hydrogen. No methane was detected during the
whole experiment. The initial TCOD was equal to the initial SCOD since the MEC were
fed with synthetic solids-free substrates. The COD equivalent of hydrogen was calculated
by equation (12), and the calculation for suspended biomass is in equation (13) (Lee et
al., 2008). 1 mL of hydrogen is equivalent to 0.654 mg COD at room temperature (25°C).
The suspended biomass was obtained from the COD data. The SMP was determined from
the soluble COD. Thus, the only unknown COD sink is the attached biomass, which can
be estimated from the COD mass balance. Without considering the COD from the
attached biomass, the COD closure for acetate, butyrate and propionate-fed cycles were
84 ± 10.1, 70 ± 6.5 and 56 ± 4.7 %, respectively.
1 mL H2 = 1 mmol H2
22.4mL
273.15K
298.15K
2meq e−
mmol H2
8 mg COD
meq e− = 0.654 mg COD (12)
Suspended biomass = (TCOD − SCOD)final − (TCOD − SCOD)initial (13)
The results showed that the suspended biomass in the acetate-fed MEC only
accounted for 4% of the initial COD. Because the acetate is well known to be readily
degradable by ARB, the acetate fed MEC is more favorable for ARB growth compared to
acetogenic bacteria. In the acetate-fed MEC, the lower the suspended biomass the better,
since it inferred that more ARB was attached. This was consistent with the higher current
density achieved in acetate-fed MEC. The calculated suspended biomass yield and the
estimated attached biomass in the acetate-fed MEC were 0.042 g biomass COD/g
substrate COD and 0.166 g biomass COD/g substrate COD, respectively. These data are
similar to the literature. Lee et al. (2008) observed a suspended biomass yield of 0.058 g
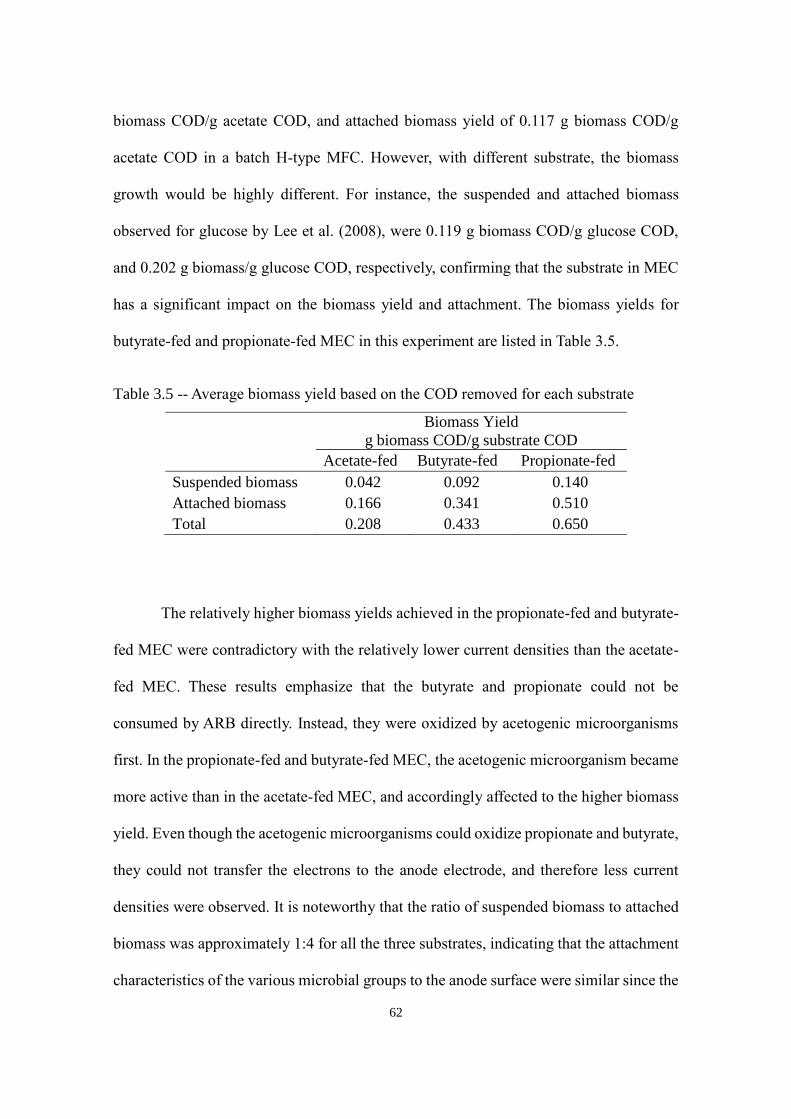
62
biomass COD/g acetate COD, and attached biomass yield of 0.117 g biomass COD/g
acetate COD in a batch H-type MFC. However, with different substrate, the biomass
growth would be highly different. For instance, the suspended and attached biomass
observed for glucose by Lee et al. (2008), were 0.119 g biomass COD/g glucose COD,
and 0.202 g biomass/g glucose COD, respectively, confirming that the substrate in MEC
has a significant impact on the biomass yield and attachment. The biomass yields for
butyrate-fed and propionate-fed MEC in this experiment are listed in Table 3.5.
Table 3.5 -- Average biomass yield based on the COD removed for each substrate
Biomass Yield
g biomass COD/g substrate COD
Acetate-fed Butyrate-fed Propionate-fed
Suspended biomass 0.042 0.092 0.140
Attached biomass 0.166 0.341 0.510
Total 0.208 0.433 0.650
The relatively higher biomass yields achieved in the propionate-fed and butyrate-
fed MEC were contradictory with the relatively lower current densities than the acetate-
fed MEC. These results emphasize that the butyrate and propionate could not be
consumed by ARB directly. Instead, they were oxidized by acetogenic microorganisms
first. In the propionate-fed and butyrate-fed MEC, the acetogenic microorganism became
more active than in the acetate-fed MEC, and accordingly affected to the higher biomass
yield. Even though the acetogenic microorganisms could oxidize propionate and butyrate,
they could not transfer the electrons to the anode electrode, and therefore less current
densities were observed. It is noteworthy that the ratio of suspended biomass to attached
biomass was approximately 1:4 for all the three substrates, indicating that the attachment
characteristics of the various microbial groups to the anode surface were similar since the

63
acetate-fed MEC biomass was predominantly ARB, while both the butyrate and
propionate-fed MECs biomass comprised both acetogenic bacteria and ARB.
Normalizing the maximum current density to the observed attached biomass is a measure
of the activity of ARB and electron transfer capabilities, which as shown in Table 5, yields
43.8, 20.1 and 8.7 A/mg biomass COD/m2 for the acetate-fed, butyrate-fed, and
propionate-fed cycles. This reveals that potentially both the activity and electron transfer
capabilities of the attached biomass in the butyrate-fed MEC was more than twice that of
the propionate-fed MEC. These results further demonstrated that, compared with butyrate,
propionate was more difficult to degrade in the MEC.
3.3.4 Comparison of the results in this study and the results in literatures
The performances of the MECs are largely depend on the MEC configuration,
material, microorganism, pH, feeding conditions, and as well as substrate. It is very hard
to make a comparison unless only one unknown is existed. In this research, all the other
conditions are the same unless the substrate itself. As shown in Table 3.6, based on both
the COD removal efficiencies and current densities, the butyrate feeding MEC can
achieve a better performance than propionate feeding MEC.
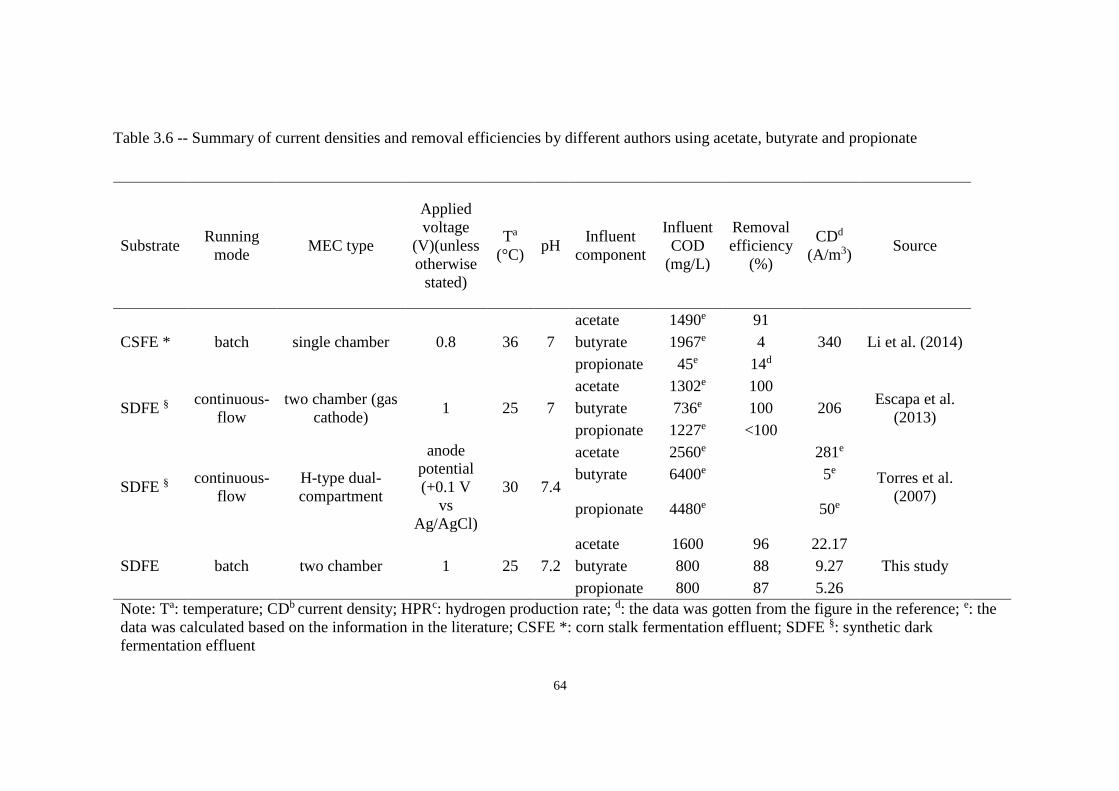
64
Table 3.6 -- Summary of current densities and removal efficiencies by different authors using acetate, butyrate and propionate
Substrate Running
mode MEC type
Applied
voltage
(V)(unless
otherwise
stated)
Ta
(°C) pH
Influent
component
Influent
COD
(mg/L)
Removal
efficiency
(%)
CDd
(A/m3) Source
CSFE * batch single chamber 0.8 36 7
acetate 1490e 91
340 Li et al. (2014) butyrate 1967e 4
propionate 45e 14d
SDFE § continuous-
flow
two chamber (gas
cathode) 1 25 7
acetate 1302e 100
206 Escapa et al.
(2013) butyrate 736e 100
propionate 1227e <100
SDFE § continuous-
flow
H-type dual-
compartment
anode
potential
(+0.1 V
vs
Ag/AgCl)
30 7.4
acetate 2560e 281e
Torres et al.
(2007)
butyrate 6400e 5e
propionate 4480e 50e
SDFE batch two chamber 1 25 7.2
acetate 1600 96 22.17
This study butyrate 800 88 9.27
propionate 800 87 5.26
Note: Ta: temperature; CDb current density; HPRc: hydrogen production rate; d: the data was gotten from the figure in the reference; e: the
data was calculated based on the information in the literature; CSFE *: corn stalk fermentation effluent; SDFE §: synthetic dark
fermentation effluent

65
3.4 Conclusion
This study mainly focused on the comparison of different parameters in MEC feed
with different VFAs (acetate, butyrate and propionate). Each substrate was fed to the
reactor for three consecutive-batch cycles. Of the three operational MECs, the acetate-fed
MEC exhibited the best overall performance, whereas the propionate-fed MEC achieved
the worst performance, which demonstrated that propionate could not be utilized by anode
respiring bacteria as easily as butyrate. The ratio of the suspended biomass to attached
biomass was approximately 1:4 for all the three substrates.
Acknowledgment
The authors would like to acknowledge NSERC CREATE for financial support. The
authors also appreciate the kind and precious helps provided by Dr. Nakhla’s research
group and Western University.
3.5 References
1. American Public Health Association (APHA), 1998. Standard Methods for the
Examination of Water and Wastewater,20th ed. Washington, DC, USA
2. Chadwick, S.S. 1988. Ullmann's Encyclopedia of Industrial Chemistry. Ref. Serv. Rev.
16, 31-34.
3. Cheng, S., Logan, B.E. 2007. Sustainable and efficient biohydrogen production via
electrohydrogenesis. Proc. Natl. Acad. Sci. U.S.A. 104, 18871-18873.
4. Chookaew, T., Prasertsan, P., Ren, Z.J. 2014. Two-stage conversion of crude glycerol
to energy using dark fermentation linked with microbial fuel cell or microbial electrolysis

66
cell. N. Biotechnol. 31, 179-184.
5. Cusick, R.D., Bryan, B., Parker, D.S., Merrill, M.D., Mehanna, M., Kiely, P.D., Liu,
G., Logan, B.E. 2011. Performance of a pilot-scale continuous flow microbial electrolysis
cell fed winery wastewater. Appl. Microbiol. Biotechnol. 89, 2053-2063.
6. Dhar, B.R., Gao, Y., Yeo, H., Lee, H.-S. 2013. Separation of competitive
microorganisms using anaerobic membrane bioreactors as pretreatment to microbial
electrochemical cells. Bioresour. Technol. 148, 208-214.
7. Ditzig, J., Liu, H., Logan, B.E. 2007. Production of hydrogen from domestic
wastewater using a bioelectrochemically assisted microbial reactor (BEAMR). Int. J.
Hydrogen Energy. 32, 2296-2304.
8. Dorofeeva, O., Novikov, V.P., Neumann, D.B. 2001. NIST-JANAF thermochemical
tables. I. Ten organic molecules related to atmospheric chemistry. J. Phys. Chem. Ref.
Data. 30, 475-513.
9. Escapa, A., Lobato, A., García, D., Morán, A. 2013. Hydrogen production and COD
elimination rate in a continuous microbial electrolysis cell: The influence of hydraulic
retention time and applied voltage. Environ. Prog. Sustain. Energy. 32, 263-268.
10. Gupta, M., Velayutham, P., Elbeshbishy, E., Hafez, H., Khafipour, E., Derakhshani,
H., El Naggar, M.H., Levin, D.B., Nakhla, G. 2014. Co-fermentation of glucose, starch,
and cellulose for mesophilic biohydrogen production. Int. J. Hydrogen Energy. 39, 20958-
20967.
11. Hu, H., Fan, Y., Liu, H. 2008. Hydrogen production using single-chamber membrane-

67
free microbial electrolysis cells. Water Res. 42, 4172-4178.
12. Ivanov, I., Ren, L., Siegert, M., Logan, B.E. 2013. A quantitative method to evaluate
microbial electrolysis cell effectiveness for energy recovery and wastewater treatment.
Int. J. Hydrogen Energy. 38, 13135-13142.
13. Lalaurette, E., Thammannagowda, S., Mohagheghi, A., Maness, P.-C., Logan, B.E.
2009. Hydrogen production from cellulose in a two-stage process combining
fermentation and electrohydrogenesis. Int. J. Hydrogen Energy. 34, 6201-6210.
14. Lee, H.-S., Parameswaran, P., Kato-Marcus, A., Torres, C.I., Rittmann, B.E. 2008.
Evaluation of energy-conversion efficiencies in microbial fuel cells (MFCs) utilizing
fermentable and non-fermentable substrates. Water Res. 42, 1501-1510.
15. Lee, H.-S., Rittmann, B.E. 2009. Significance of biological hydrogen oxidation in a
continuous single-chamber microbial electrolysis cell. Environ. Sci. Technol. 44, 948-954.
16. Lee, H.-S., Torres, C.I., Rittmann, B.E. 2009. Effects of substrate diffusion and anode
potential on kinetic parameters for anode-respiring bacteria. Environ. Sci. Technol. 43,
7571-7577.
17. Lee, H.-S., Vermaas, W.F., Rittmann, B.E. 2010. Biological hydrogen production:
prospects and challenges. Trends Biotechnol. 28, 262-271.
18. Li, X.-H., Liang, D.-W., Bai, Y.-X., Fan, Y.-T., Hou, H.-W. 2014. Enhanced H 2
production from corn stalk by integrating dark fermentation and single chamber microbial
electrolysis cells with double anode arrangement. Int. J. Hydrogen Energy. 39, 8977-8982.
19. Liu, H., Cheng, S., Logan, B.E. 2005a. Production of electricity from acetate or
68
butyrate using a single-chamber microbial fuel cell. Environ. Sci. Technol. 39, 658-662.
20. Liu, H., Grot, S., Logan, B.E. 2005b. Electrochemically assisted microbial production
of hydrogen from acetate. Environ Sci. Technol. 39, 4317-4320.
21. Logan, B.E., Call, D., Cheng, S., Hamelers, H.V., Sleutels, T.H., Jeremiasse, A.W.,
Rozendal, R.A. 2008. Microbial electrolysis cells for high yield hydrogen gas production
from organic matter. Environ. Sci. Technol. 42, 8630-8640.
22. Logan, B.E., Hamelers, B., Rozendal, R., Schröder, U., Keller, J., Freguia, S.,
Aelterman, P., Verstraete, W., Rabaey, K. 2006. Microbial fuel cells: methodology and
technology. Environ. Sci. Technol. 40, 5181-5192.
23. Lu, L., Xing, D., Ren, N., Logan, B.E. 2012. Syntrophic interactions drive the
hydrogen production from glucose at low temperature in microbial electrolysis cells.
Bioresour. Technol. 124, 68-76.
24. Montpart, N., Rago, L., Baeza, J.A., Guisasola, A. 2015. Hydrogen production in
single chamber microbial electrolysis cells with different complex substrates. Water Res.
68, 601-615.
25. Nam, J.-Y., Yates, M.D., Zaybak, Z., Logan, B.E. 2014. Examination of protein
degradation in continuous flow, microbial electrolysis cells treating fermentation
wastewater. Bioresour. Technol. 171, 182-186.
26. Oh, S., Logan, B.E. 2005. Hydrogen and electricity production from a food processing
wastewater using fermentation and microbial fuel cell technologies. Water Res. 39, 4673-
4682.

69
27. Rader, G.K., Logan, B.E. 2010. Multi-electrode continuous flow microbial
electrolysis cell for biogas production from acetate. Int. J. Hydrogen Energy. 35, 8848-
8854.
28. Rozendal, R.A., Hamelers, H.V., Euverink, G.J., Metz, S.J., Buisman, C.J. 2006.
Principle and perspectives of hydrogen production through biocatalyzed electrolysis. Int.
J. Hydrogen Energy. 31, 1632-1640.
29. Rozendal, R.A., Hamelers, H.V., Molenkamp, R.J., Buisman, C.J. 2007. Performance
of single chamber biocatalyzed electrolysis with different types of ion exchange
membranes. Water Res. 41, 1984-1994.
30. Selembo, P.A., Perez, J.M., Lloyd, W.A., Logan, B.E. 2009. High hydrogen
production from glycerol or glucose by electrohydrogenesis using microbial electrolysis
cells. Int. J. Hydrogen Energy. 34, 5373-5381.
31. Sun, M., Mu, Z.-X., Sheng, G.-P., Shen, N., Tong, Z.-H., Wang, H.-L., Yu, H.-Q. 2010.
Hydrogen production from propionate in a biocatalyzed system with in-situ utilization of
the electricity generated from a microbial fuel cell. Int. Biodeter. Biodegr. 64, 378-382.
32. Tartakovsky, B., Manuel, M.-F., Wang, H., Guiot, S. 2009. High rate membrane-less
microbial electrolysis cell for continuous hydrogen production. Int. J. Hydrogen Energy.
34, 672-677.
33. Tenca, A., Cusick, R.D., Schievano, A., Oberti, R., Logan, B.E. 2013. Evaluation of
low cost cathode materials for treatment of industrial and food processing wastewater
using microbial electrolysis cells. Int. J. Hydrogen Energy. 38, 1859-1865.

70
34. Torres, C.I., Marcus, A.K., Lee, H.-S., Parameswaran, P., Krajmalnik-Brown, R.,
Rittmann, B.E. 2010. A kinetic perspective on extracellular electron transfer by anode-
respiring bacteria. FEMS Microbiol. Rev. 34, 3-17.
35. Torres, C.I., Marcus, A.K., Rittmann, B.E. 2007. Kinetics of consumption of
fermentation products by anode-respiring bacteria. Appl. Microbiol. Biotechnol. 77, 689-
697.
71
Chapter 4
Conclusions and Recommendations
4.1 Conclusions
The main goals of this study are to further utilize dark fermentation effluent in
MECs, and to assess the impact of VFAs on MEC performance.
In this research, a comprehensive comparison of the effects of acetate, butyrate,
and propionate on MEC is undertaken. For the first time the relationship between
attached biomass and suspended biomass for butyrate and propionate in MEC has been
established. Moreover, a literature review on continuous-flow operating MECs is also
discussed in this thesis, to better understand the challenges associated with scale-up of
MEC system.
The following conclusions can be drawn, based on the experimental findings
of this study:
The cycles fed with acetate had the highest peak of current density (6.0 ± 0.28
A/m2), followed by the butyrate fed cycles (2.5 ± 0.06 A/m2), and propionate
fed cycles achieved the lowest current density (1.6 ± 0.14 A/m2).
The utilization rate of the substrates for ARB in MECs followed the order:
acetate > butyrate > propionate.

72
The cathodic hydrogen recovery decreased in the order of feeding with acetate,
butyrate and propionate were 98 ± 0.8, 79 ± 4.9, and 71 ± 7.2 %, respectively.
The coulombic efficiencies for acetate, butyrate, and propionate were 87 ± 5.7,
72 ± 2.0 and 51 ± 6.4 %.
The SCOD removal efficiencies for butyrate and propionate were 88 ± 5.3 and
87 ± 5.8 % respectively.
The calculated suspended biomass yield and the estimated attached biomass in
the acetate-fed MEC were 0.042 g biomass COD/g substrate COD and 0.166 g
biomass COD/g substrate COD, respectively.
The calculated suspended biomass yield and the estimated attached biomass in
the butyrate-fed MEC were 0.092 g biomass COD/g substrate COD and 0.341
g biomass COD/g substrate COD, respectively.
The calculated suspended biomass yield and the estimated attached biomass in
the propionate-fed MEC were 0.140 g biomass COD/g substrate COD and 0.510
g biomass COD/g substrate COD, respectively.
Normalizing the maximum current density to the observed attached biomass
yields 43.8, 20.1 and 8.7 A/mg biomass COD/m2 for the acetate-fed, butyrate-
fed, and propionate-fed cycles.
73
4.2 Recommendations
Even though further utilization of fermentation effluent in MEC to achieve
higher hydrogen production is very promising, to scale-up from laboratory MECs to
pilot-scale still needs a lot of work. The greatest challenge of scaling up MEC systems
is that the hydrogen production rate is not high at low power input. Major advances in
MEC configuration, the use of high-efficiency materials for electrodes and membranes,
and efficient ARB having rapid substrate-utilization kinetics are required to achieve the
goals of high hydrogen production rate and low applied voltage. Based on the findings
of this study, further research should include:
• The configuration of the MEC could be modified. A membrane-less MEC could
be studied. If the membrane-less MEC is applied, the method to inhibit the
activities of methanogens should be emphasized.
• Anode potential could be controlled during the start-up period to culture a
highly efficient ARB consortium.
• In this experiment, the anode respiring bacteria is cultivated from waste
activated sludge. In the future, a combination of fermentation bacteria and anode
respiring bacteria in MECs could be studied to learn whether glucose or
complex carbohydrates could be degraded more efficiently in MEC or not.

74
• The MECs could be run in continuous-flow mode to facilitate scale-up in the
future.
75
Appendices
These appendices consist of the following information:
The company of the materials, the MEC fabrication procedure, the pretreatment
method of the materials, and the medium preparation used in this study are listed in
Appendix A. The detailed calculation is shown in Appendix B.
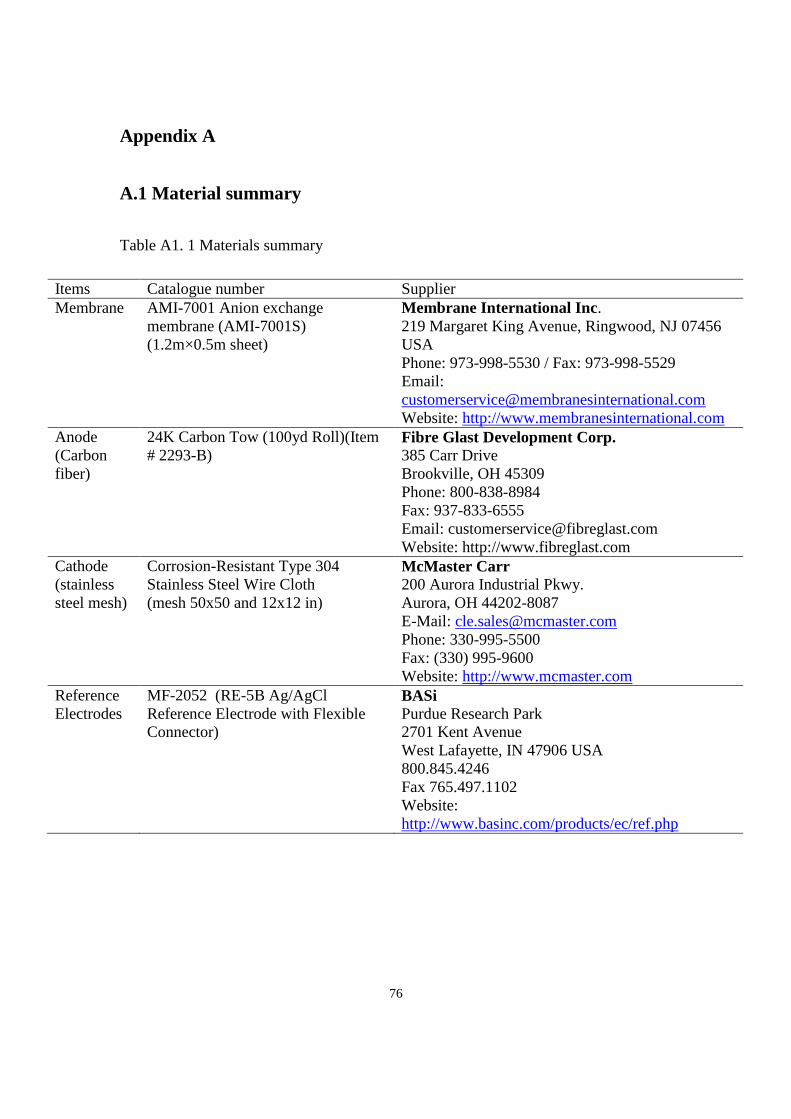
76
Appendix A
A.1 Material summary
Table A1. 1 Materials summary
Items Catalogue number Supplier
Membrane
AMI-7001 Anion exchange
membrane (AMI-7001S)
(1.2m×0.5m sheet)
Membrane International Inc.
219 Margaret King Avenue, Ringwood, NJ 07456
USA
Phone: 973-998-5530 / Fax: 973-998-5529
Email:
Website: http://www.membranesinternational.com
Anode
(Carbon
fiber)
24K Carbon Tow (100yd Roll)(Item
# 2293-B)
Fibre Glast Development Corp. 385 Carr Drive
Brookville, OH 45309
Phone: 800-838-8984
Fax: 937-833-6555
Email: [email protected]
Website: http://www.fibreglast.com
Cathode
(stainless
steel mesh)
Corrosion-Resistant Type 304
Stainless Steel Wire Cloth
(mesh 50x50 and 12x12 in)
McMaster Carr
200 Aurora Industrial Pkwy.
Aurora, OH 44202-8087
E-Mail: [email protected]
Phone: 330-995-5500
Fax: (330) 995-9600
Website: http://www.mcmaster.com
Reference
Electrodes
MF-2052 (RE-5B Ag/AgCl
Reference Electrode with Flexible
Connector)
BASi
Purdue Research Park
2701 Kent Avenue
West Lafayette, IN 47906 USA
800.845.4246
Fax 765.497.1102
Website:
http://www.basinc.com/products/ec/ref.php

77
A.2 MEC fabrication
Figure A2.2 -- Pretreatment of the anode in the fume hood: a) 1st day with nitric acid
(1N); b) 2nd day with acetone (1N); c) 3rd day with ethanol (1N)
Figure A2.1 -- Anode preparation: materials used for anode (left) and wrapping around the
anode electrode with carbon fiber (right).
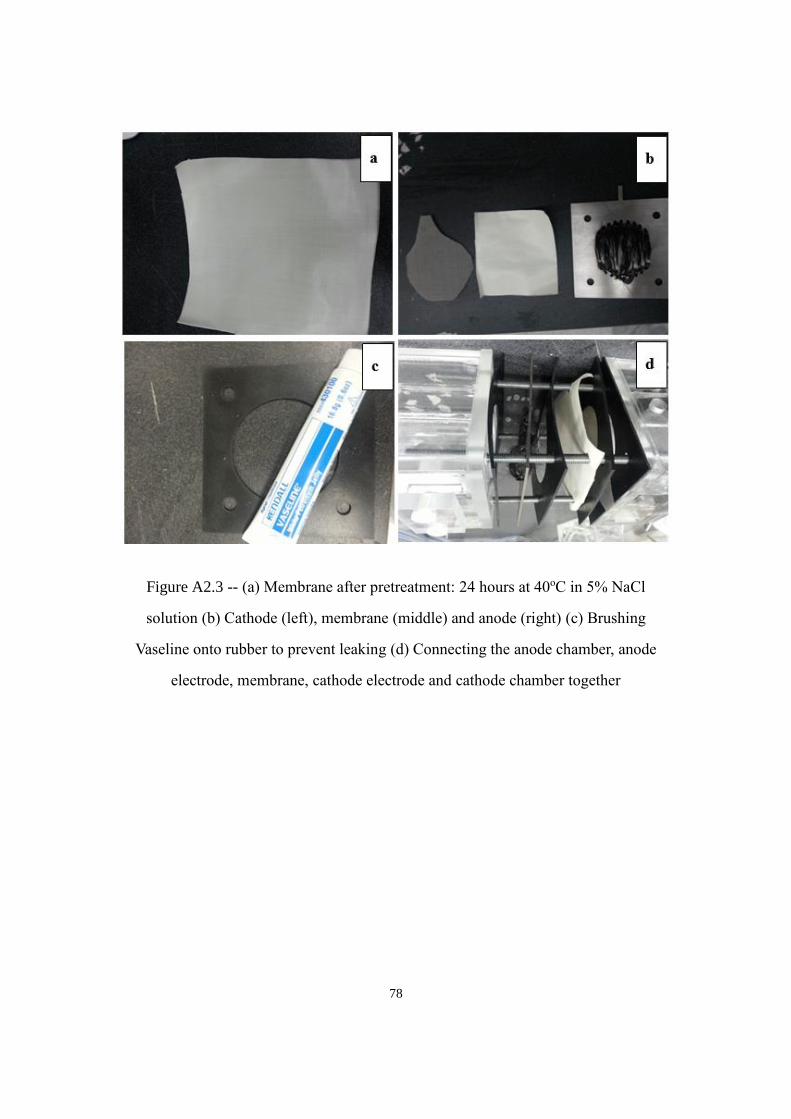
78
Figure A2.3 -- (a) Membrane after pretreatment: 24 hours at 40oC in 5% NaCl
solution (b) Cathode (left), membrane (middle) and anode (right) (c) Brushing
Vaseline onto rubber to prevent leaking (d) Connecting the anode chamber, anode
electrode, membrane, cathode electrode and cathode chamber together

79
Figure A2.4 – (a) Picture of connecting the anode and cathode electrode to the power
supply (b) A resister is connected in series with anode and cathode (c) Set-up picture
of the MEC system
a c
b
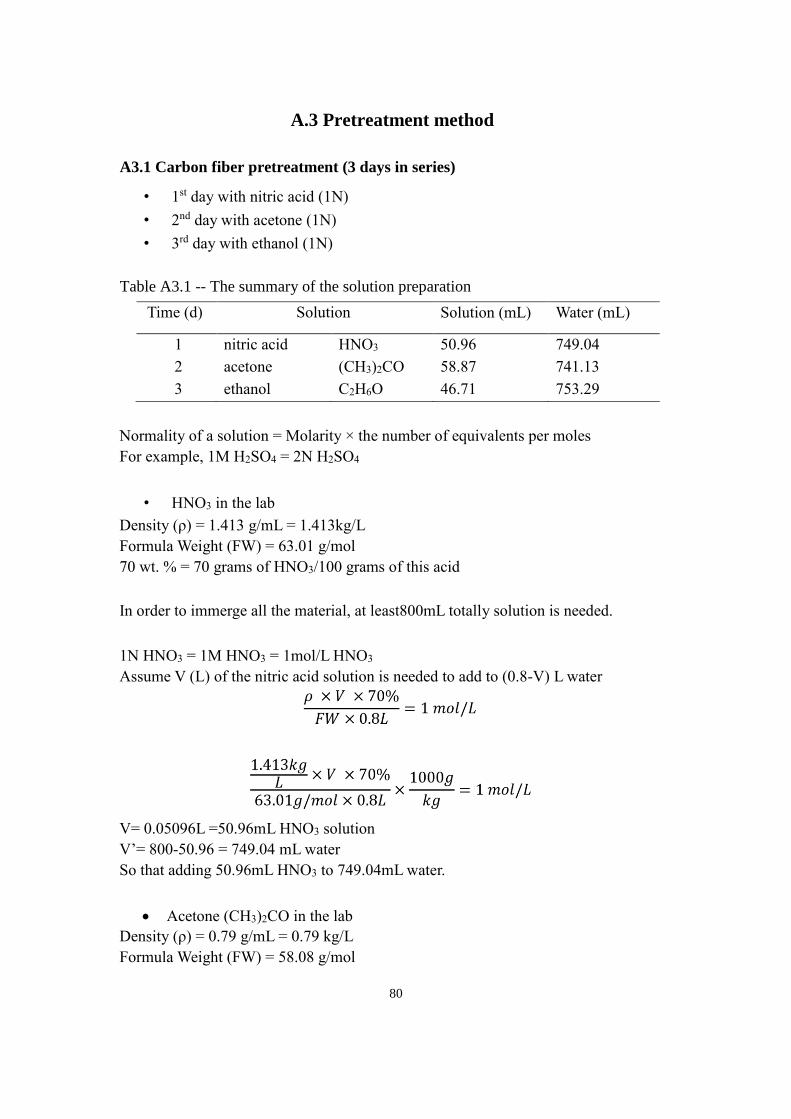
80
A.3 Pretreatment method
A3.1 Carbon fiber pretreatment (3 days in series)
• 1st day with nitric acid (1N)
• 2nd day with acetone (1N)
• 3rd day with ethanol (1N)
Table A3.1 -- The summary of the solution preparation
Time (d) Solution Solution (mL) Water (mL)
1 nitric acid HNO3 50.96 749.04
2 acetone (CH3)2CO 58.87 741.13
3 ethanol C2H6O 46.71 753.29
Normality of a solution = Molarity × the number of equivalents per moles
For example, 1M H2SO4 = 2N H2SO4
• HNO3 in the lab
Density (ρ) = 1.413 g/mL = 1.413kg/L
Formula Weight (FW) = 63.01 g/mol
70 wt. % = 70 grams of HNO3/100 grams of this acid
In order to immerge all the material, at least800mL totally solution is needed.
1N HNO3 = 1M HNO3 = 1mol/L HNO3
Assume V (L) of the nitric acid solution is needed to add to (0.8-V) L water
V= 0.05096L =50.96mL HNO3 solution
V’= 800-50.96 = 749.04 mL water
So that adding 50.96mL HNO3 to 749.04mL water.
Acetone (CH3)2CO in the lab
Density (ρ) = 0.79 g/mL = 0.79 kg/L
Formula Weight (FW) = 58.08 g/mol

81
99.9 %
In order to immerge all the material, at least800mL totally solution is needed.
1N (CH3)2CO = 1M (CH3)2CO = 1mol/L (CH3)2CO
Assume V (L) of the acetone solution is needed to add to (0.8-V)L water
V= 0.05887L =58.87mL Acetone solution
V’= 800-58.87 = 741.13mL water
So that adding 58.87mL Acetone to 741.13mL water.
Ethanol C2H6O
Density (ρ) = 0.789 g/mL = 0.789 kg/L
Formula Weight (FW) = 46.07 g/mol
100%
V’= 800-46.71 = 753.29mL water
So that adding 46.71 mL Ethanol to 753.29mL water.
A3.2. Membrane pre-treatment
24 hours at 40 in 5% NaCl solution (5 g NaCl/100 mL water)
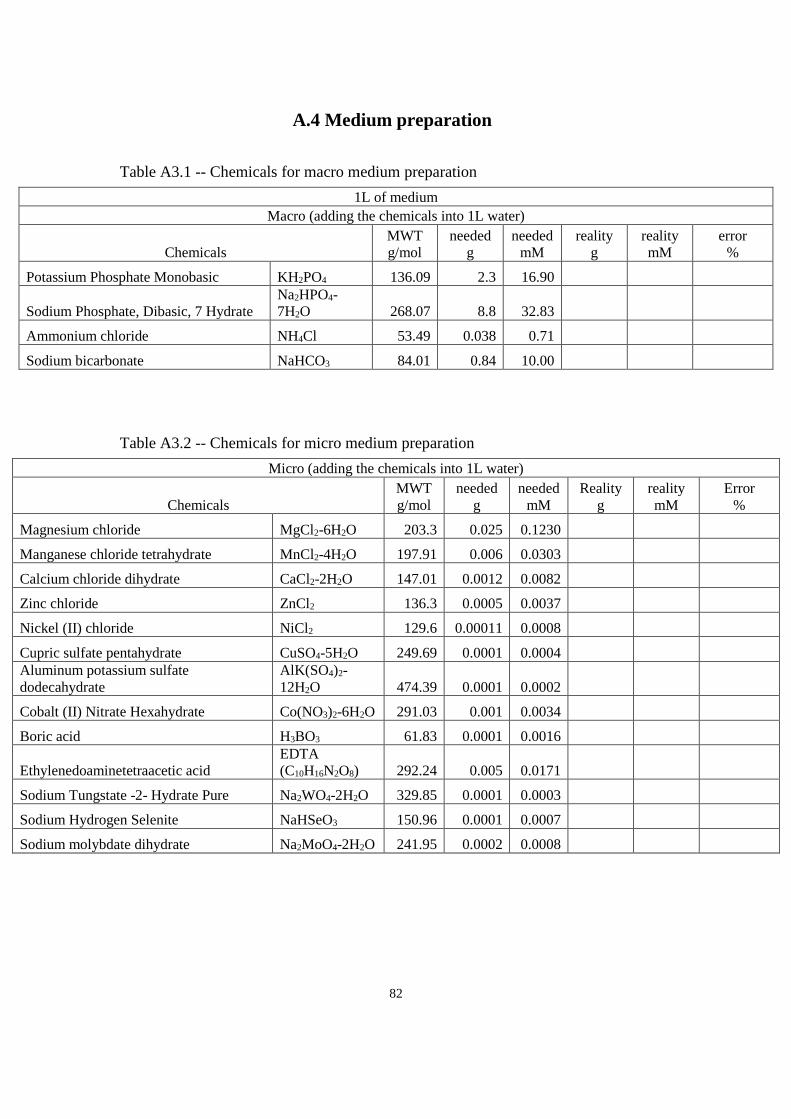
82
A.4 Medium preparation
Table A3.1 -- Chemicals for macro medium preparation
1L of medium
Macro (adding the chemicals into 1L water)
Chemicals
MWT
g/mol
needed
g
needed
mM
reality
g
reality
mM
error
%
Potassium Phosphate Monobasic KH2PO4 136.09 2.3 16.90
Sodium Phosphate, Dibasic, 7 Hydrate
Na2HPO4-
7H2O 268.07 8.8 32.83
Ammonium chloride NH4Cl 53.49 0.038 0.71
Sodium bicarbonate NaHCO3 84.01 0.84 10.00
Table A3.2 -- Chemicals for micro medium preparation
Micro (adding the chemicals into 1L water)
Chemicals
MWT
g/mol
needed
g
needed
mM
Reality
g
reality
mM
Error
%
Magnesium chloride MgCl2-6H2O 203.3 0.025 0.1230
Manganese chloride tetrahydrate MnCl2-4H2O 197.91 0.006 0.0303
Calcium chloride dihydrate CaCl2-2H2O 147.01 0.0012 0.0082
Zinc chloride ZnCl2 136.3 0.0005 0.0037
Nickel (II) chloride NiCl2 129.6 0.00011 0.0008
Cupric sulfate pentahydrate CuSO4-5H2O 249.69 0.0001 0.0004
Aluminum potassium sulfate
dodecahydrate
AlK(SO4)2-
12H2O 474.39 0.0001 0.0002
Cobalt (II) Nitrate Hexahydrate Co(NO3)2-6H2O 291.03 0.001 0.0034
Boric acid H3BO3 61.83 0.0001 0.0016
Ethylenedoaminetetraacetic acid
EDTA
(C10H16N2O8) 292.24 0.005 0.0171
Sodium Tungstate -2- Hydrate Pure Na2WO4-2H2O 329.85 0.0001 0.0003
Sodium Hydrogen Selenite NaHSeO3 150.96 0.0001 0.0007
Sodium molybdate dihydrate Na2MoO4-2H2O 241.95 0.0002 0.0008

83
Table A3.3 -- 77mM Na2S-9H2O preparation
Adding Na2S-9H2O into 500mL water
Chemicals
MWT
g/mol needed g
needed
mM Reality g
reality
mM
error
%
Sodium sulfide nonahydrate Na2S-9H2O 240.18 9.24693 77
Table A3.4 -- 20mM FeCl2-4H2O preparation
Adding FeCl2-4H2O into 500mL water
Chemicals
MWT
g/mol
needed
g
needed
mM reality g
reality
mM
error
%
Ferrous chloride tetrahydrate
FeCl2-
4H2O 198.81 1.9881 20

84
Appendix B. Calculation summary
1. Anode specific surface area of the fibers
Fiber’s diameter = 7 𝜇m
Fiber’s length = 150 cm
The fiber bundle contained 24000 individual carbon filaments.
The geometric surface of the fibers is
= 7μm × 3.14 × 150cm × 24000 ×cm
10000μm= 7912.8 cm2
The volume of the fibers is
= (7μm
2)2 × 3.14 × 150cm × 24000 × (
cm
10000μm)
2
= 1.38474 cm3
The specific surface area of the fibers is
=7912.8cm2
1.38474 cm3×
m2
10000cm2×
1000000cm3
m3= 571429
m2
m3
2. Hydrogen production rate in reality
Total Volume of gas (mL) = Water being replaced(mL)
Percentage of hydrogen → From GC
Hydrogen Volume (mL)
= Total Volume of gas(mL) × Percentage of hydrogen(%)
PV = nRT
n(H2) =PV
RT
Assume: Room Temperature 25=298K, R=0.08206 (L·atm)/(mol·K), P=1atm
n(H2) production in reality (mol) =PV
RT
=1atm × Hydrogen Volume(mL)
0.08206 (L ∙ atm)/(mol ∙ K) × 298K×
L
1000mL
= 0.0000408933 ∙ Hydrogen Volume
3. Hydrogen production rate in reality

85
Hydrogen Production Rate in Reality (m3H2
m3Anode day )
=V(H2) production in reality
Anode Volume ∙ d
Hydrogen Production Rate in Reality (m3H2
m2Anode day )
=V(H2) production in reality
Anode Surface Area ∙ d
4. Transfer H2 production to volume
Assume: Room Temperature 25=298K, R=0.08206 (L·atm)/(mol·K), P=1atm
V(𝐻2) 𝑝𝑟𝑜𝑑𝑢𝑐𝑡𝑖𝑜𝑛 𝑖𝑛 𝑡ℎ𝑒𝑜𝑟𝑦 (𝐿) =𝑛𝑅𝑇
𝑃
=0.08206
𝐿 ∙ 𝑎𝑡𝑚𝑚𝑜𝑙 ∙ 𝐾
× 298𝐾 × n(𝐻2) (𝑚𝑜𝑙
𝑑)
1𝑎𝑡𝑚= 24.45388 ∙ 𝑛(𝐻2)
5. Hydrogen production rate in theory
From the COD reduction, we can get how much Acetate consumed.
𝐶2𝐻4𝑂2 + 2𝑂2 = 2𝐻2𝑂 + 2𝐶𝑂2
n(HAc)(𝑚𝑜𝑙
𝑑) =
𝛥𝑆𝐶𝑂𝐷(𝑚𝑔𝑑
)
2 × 32𝑔/𝑚𝑜𝑙×
𝑔
1000𝑚𝑔= 0.000015625 ∙ 𝛥𝑆𝐶𝑂𝐷
From Acetate consumed rate, we can get the hydrogen producing rate.
𝐶2𝐻4𝑂2 + 2𝐻2𝑂 = 4𝐻2 + 2𝐶𝑂2
n(𝐻2)(𝑚𝑜𝑙
𝑑) = 4 × n(HAc) = 0.0000625 ∙ 𝛥𝑆𝐶𝑂𝐷
6. Hydrogen yield
H2 Yield (mol H2
mol HAc) =
H2 Production in reality (mol)
HAc consumed during this time interval (mol)
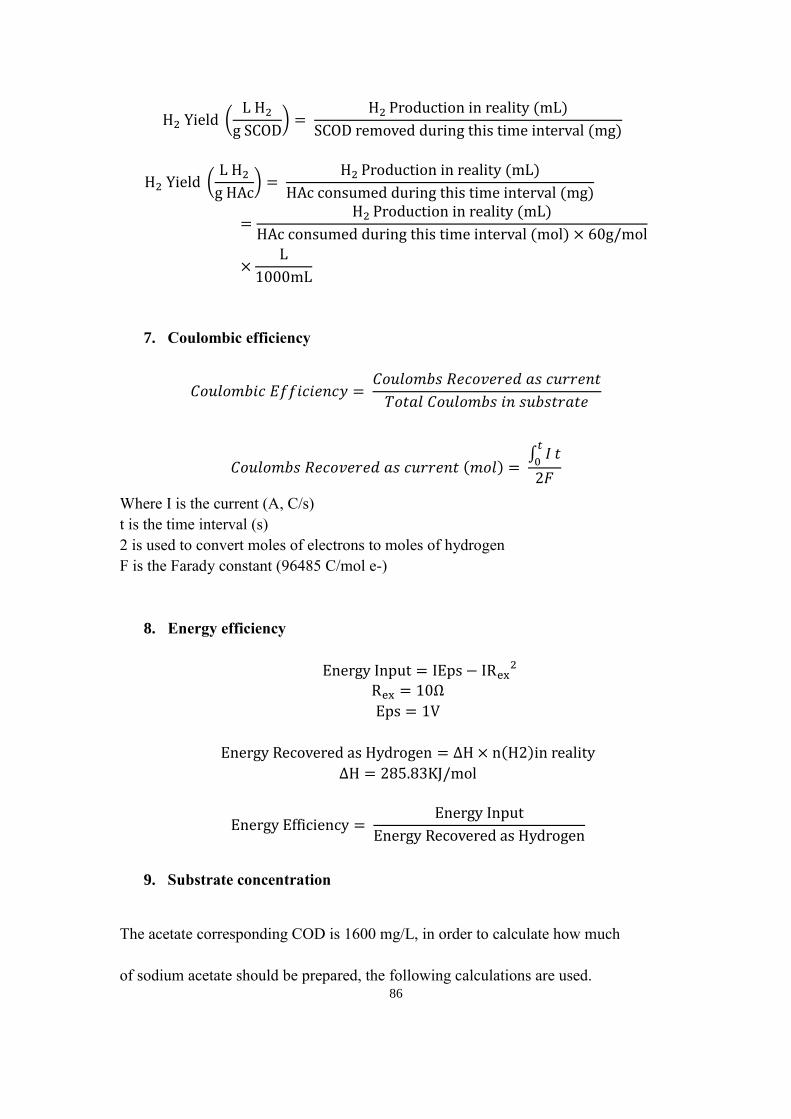
86
H2 Yield (L H2
g SCOD) =
H2 Production in reality (mL)
SCOD removed during this time interval (mg)
H2 Yield (L H2
g HAc) =
H2 Production in reality (mL)
HAc consumed during this time interval (mg)
=H2 Production in reality (mL)
HAc consumed during this time interval (mol) × 60g/mol
×L
1000mL
7. Coulombic efficiency
𝐶𝑜𝑢𝑙𝑜𝑚𝑏𝑖𝑐 𝐸𝑓𝑓𝑖𝑐𝑖𝑒𝑛𝑐𝑦 = 𝐶𝑜𝑢𝑙𝑜𝑚𝑏𝑠 𝑅𝑒𝑐𝑜𝑣𝑒𝑟𝑒𝑑 𝑎𝑠 𝑐𝑢𝑟𝑟𝑒𝑛𝑡
𝑇𝑜𝑡𝑎𝑙 𝐶𝑜𝑢𝑙𝑜𝑚𝑏𝑠 𝑖𝑛 𝑠𝑢𝑏𝑠𝑡𝑟𝑎𝑡𝑒
𝐶𝑜𝑢𝑙𝑜𝑚𝑏𝑠 𝑅𝑒𝑐𝑜𝑣𝑒𝑟𝑒𝑑 𝑎𝑠 𝑐𝑢𝑟𝑟𝑒𝑛𝑡 (𝑚𝑜𝑙) = ∫ 𝐼
𝑡
0𝑡
2𝐹
Where I is the current (A, C/s)
t is the time interval (s)
2 is used to convert moles of electrons to moles of hydrogen
F is the Farady constant (96485 C/mol e-)
8. Energy efficiency
Energy Input = IEps − IRex2
Rex = 10Ω
Eps = 1V
Energy Recovered as Hydrogen = ∆H × n(H2)in reality
∆H = 285.83KJ/mol
Energy Efficiency = Energy Input
Energy Recovered as Hydrogen
9. Substrate concentration
The acetate corresponding COD is 1600 mg/L, in order to calculate how much
of sodium acetate should be prepared, the following calculations are used.

87
𝐶𝐻3𝐶𝑂𝑂𝐻 + 2𝑂2 = 2𝐶𝑂2 + 2𝐻2𝑂
𝑇𝐶𝑂𝐷 = 2 × 32 𝑔
𝑚𝑜𝑙× 𝑐(𝐶𝐻3𝐶𝑂𝑂𝐻) = 1.6 𝑚𝑔/𝐿
𝑐(𝐶𝐻3𝐶𝑂𝑂𝐻) =1.6 𝑔/𝐿
2 × 32= 0.025𝑚𝑜𝑙/𝐿
𝑐(𝐶𝐻3𝐶𝑂𝑂𝑁𝑎) =0.025 𝑚𝑜𝑙
𝐿×
82𝑔
𝑚𝑜𝑙= 2.05 𝑔/𝐿
The propionate and butyrate are also prepared in the same way. Instead of 1600 mg/L
initial COD, 800 mg/L initial COD is used for propionate and butyrate. The substrates
were prepared from sodium propionate and sodium butyrate.
𝐶2𝐻5𝐶𝑂𝑂𝐻 + 3.5𝑂2 = 3𝐶𝑂2 + 3𝐻2𝑂
𝑇𝐶𝑂𝐷 = 3.5 × 32 𝑔
𝑚𝑜𝑙× 𝑐(𝐶𝐻3𝐶𝑂𝑂𝐻) = 0.8𝑔/𝐿
𝑐(𝐶2𝐻5𝐶𝑂𝑂𝐻) =0.8 𝑔/𝐿
3.5 × 32= 0.00714 𝑚𝑜𝑙/𝐿
𝑚(𝐶2𝐻5𝐶𝑂𝑂𝑁𝑎) =0.00714 𝑚𝑜𝑙
𝐿×
96𝑔
𝑚𝑜𝑙= 0.686 𝑔/𝐿
𝐶3𝐻7𝐶𝑂𝑂𝐻 + 5𝑂2 = 4𝐶𝑂2 + 4𝐻2𝑂
𝑇𝐶𝑂𝐷 = 5 × 32 𝑔
𝑚𝑜𝑙× 𝑐(𝐶𝐻3𝐶𝑂𝑂𝐻) = 0.8𝑔/𝐿
𝑐(𝐶2𝐻5𝐶𝑂𝑂𝐻) =0.8 𝑔/𝐿
5 × 32= 0.005𝑚𝑜𝑙/𝐿
𝑚(𝐶2𝐻5𝐶𝑂𝑂𝑁𝑎) =0.005 𝑚𝑜𝑙
𝐿×
110𝑔
𝑚𝑜𝑙= 0.55 𝑔/𝐿
Table B.1 -- Summary of the substrate preparation
Chemicals Molecular
weight
(g/mol)
Concentration
(g/L)
Corresponding COD
(mg/L)
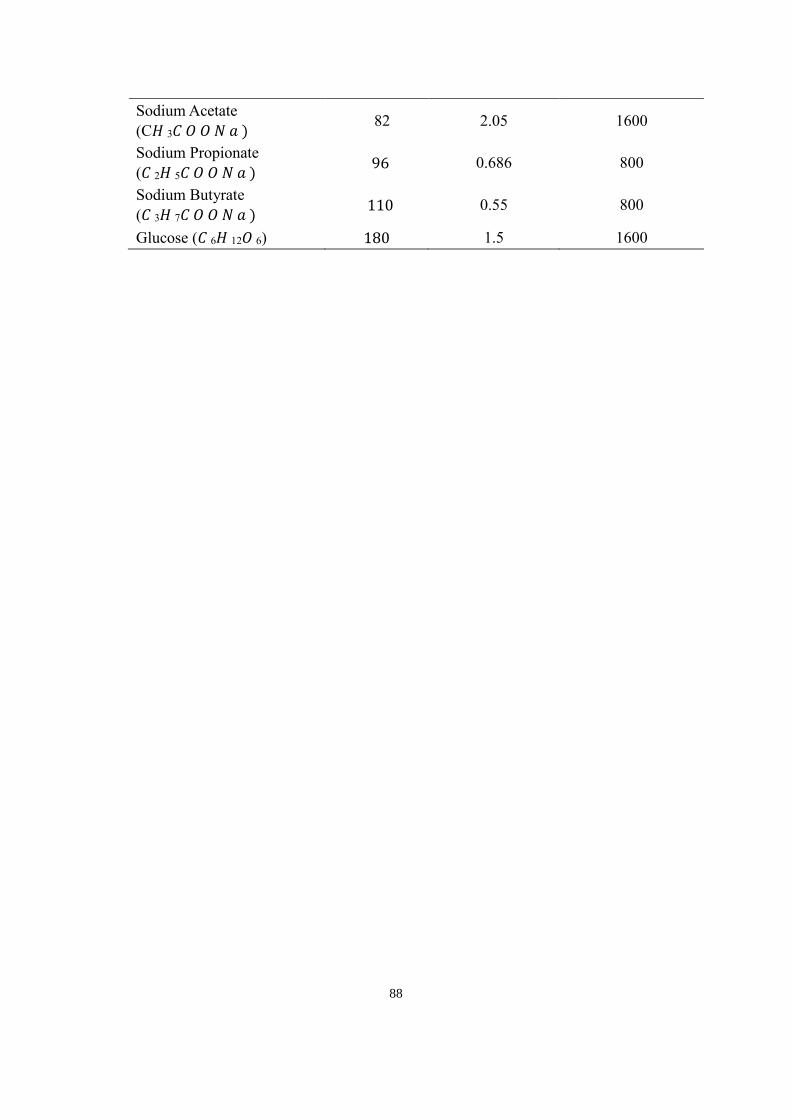
88
Sodium Acetate
(C𝐻 3𝐶 𝑂 𝑂 𝑁 𝑎 ) 82 2.05 1600
Sodium Propionate
(𝐶 2𝐻 5𝐶 𝑂 𝑂 𝑁 𝑎 ) 96 0.686 800
Sodium Butyrate
(𝐶 3𝐻 7𝐶 𝑂 𝑂 𝑁 𝑎 ) 110 0.55 800
Glucose (𝐶 6𝐻 12𝑂 6) 180 1.5 1600

89
Curriculum Vitae
Name: Nan Yang
Post-secondary Western University
Education and London, Ontario, Canada
Degrees: Master of Engineering Science
2013 – Present
Western University
London, Ontario, Canada
Master of Engineering
2012 – 2013
Dalian University of Technology
Dalian, Liaoning, China
Bachelor of Engineering
2008 – 2012
Honors and Fully funded Masters’ tuition recipient
Awards: 2013 – 2015
Related Work Internship
Experience TrojanUV technology
2015 – Present
Teaching Assistant
Western University
2014 – 2015
Publications Yang N., Hafez H., Nakhla G., (2015). Impact of Volatile Fatty
Acids on Microbial Electrolysis Cell Performance. Bioresour Technol.