the effects of urbanization on sand dune · pdf filethe effects of urbanization on sand dune...
TRANSCRIPT

The effects of urbanization on sand dune vegetation
Kendall Kotara1 and Chris Neill
2
1Trinity University, San Antonio, TX USA
2Ecosystems Center, Marine Biological Laboratory, Woods Hole, MA USA

Abstract
Increased urbanization along the Cape Cod, MA shores has been altering the coastal
environments. Alterations, in terms of anthropogenic structures, can lead to changes in key
coastal functions such as sand dunes providing ecosystem services as storm buffers. To look at
how urbanization has been altering sand dune function, comparisons were made from 6 natural
and 8 altered sites. Comparisons were made based on the physical structure, vegetation, and soil
composition of the dunes. The study showed that there were no significant differences in dune
physical structure between natural and altered sites, which imply that there would be no
significant difference in protection functions of the dunes. There was a difference in vegetation
composition and it was found that only in the altered sites did non-native species establish. The
trend of non-native species occurrence appears related to the pattern of nitrogen distribution
throughout the dunes structure and proximity to anthropogenic structures.
Key Words and Phrases
Urbanization, anthropogenic structures, sand dunes, physical structure, vegetation, soil
composition, native versus non-native

Introduction
Over the past 150 years, the Cape Cod, MA shorelines have been developed in ways that
impede their natural development (Tucker, 2010). The increasing urbanization of Cape Cod is
leading to fragmentation of the shorelines. Fragmentation is occurring from both the landward
side of dunes, due to anthropogenic structures, and shoreline aspects of the coast, due to costal
armoring. The Massachusetts coastline is currently at 40% residential development with an
additional 27% from costal-engineered structures such as seawalls and jetties (MA Coastal
Erosion Commission 2015). Residential development has also led to increased urban
infrastructure development of coastal scenic roads and parking lots to both public and private
beaches. These anthropogenic structures threaten to change the function of the sand dunes that
line the coast. Sand dunes provide the important ecosystem structure of acting as a natural storm
buffer by helping to defend against costal erosion.
Urbanization often leads to the alteration of native vegetation, causing a decrease in
native species diversity, while increasing “weedy” non-native species (McKinney, 2002). The
potential for plant community change could alter dune function by causing differences in dune
stability. The vegetation found on costal sand dunes is an important natural component of dune
stabilization (Hayholm et. al., 2004). The plants that grow on sand dunes play an important role
in the dune stabilization because there are few species that have the ability to withstand the harsh
growing environment on a sand dune. Dunes inhibit many plants from successful germination
and establishment because of the large amounts of sand and salt spray and moving substrates that
uncover roots and do not retain water well (Esler, 1970). With increased suburban development
along the coastlines of Cape Cod comes increased nutrient loading and risk of seed dispersal and
from gardening, which, on a local scale, can lead to new habitat structure and colonization of
new species in the foredune (Faggi and Dadon, 2011).
In this study, I looked at how the presence of anthropogenic structures affected the
structure of sand dunes by altering the vegetation community composition. First, I wanted to see
how the presence of anthropogenic structures altered the physical structure of the dune. To
achieve this I looked at characteristics of steepness, height and length of the dunes to get
dimensions and a general shape of the dunes between altered and natural sites. Next, I wanted to
see if the presence of anthropogenic structures altered the vegetation community that is present
on the dunes. I studied the plant communities by looking at characteristics such as species
richness and total cover as a means of plant diversity and distribution. Finally, I looked into
aspects of the soil composition to see if variations in vegetation are due to alterations in soil
characteristics. Anthropogenic structures encourage the stabilization of dunes by decreasing their
mobility, which allows for the growth of later successional plants (Provoost et al., 2011). Early
successional plants allow for more mobility of the sand dune, whereas human alterations of the
coastline leads to rapid successional shifts from increased stabilization. This trend may cause
increasing buildup of soil organic material, allowing for a wider variety of plants to establish due
to the increased abilities of the soil to retain water and nutrients.
Methods
Field Sites
There were a total of 14 field sites, six natural and eight altered, selected from the
southern Cape Cod coastlines to act as replicates in the study (Table 1). Altered dune systems
were determined based on the presence of an anthropogenic structure such as a road, parking lot
or home. Natural dune systems were determined based on the lack of anthropogenic structures.
At each field site, transects were laid out beginning at the wrack line and were run through the
dune to effectively encompass the entirety of the dune structure. Elevation readings were taken
along the transect using surveying gear, from Forestry Suppliers ®, to get a profile of the sand
dune to help depict their general shape.
Along the transects at each site, 10 points of cover were taken at equally dispersed
distances using a 50 cm x 50 cm quadrat. The cover data was used to look at vegetation
characteristics of the dunes such as total percent cover, dominant plant species, species richness,
and native vs. exotic species occurrence. At each point of cover, average plant heights were
taken for the dominant plant species in each quadrat by measuring the aboveground height of
three plants. A 15 cm soil core was taken at every other point of cover along the transect to be
used for soil composition analysis by soil organic matter, extractable nitrogen, and soil cation
exchange as a measure of salinity. A total of five cores were taken per site (Figure 1).
Soil Analysis
Soil analyses were conducted to look at characteristics of the soil composition by soil
organic matter, extractable nitrogen, and soil cation exchange as a measure of salinity. The soil
organic matter was determined by weighing out approximately three grams of soil from each soil
core and placing the samples into a muffle furnace. The samples were ashed for four hours at 450
oC. Following the soil organic matter analysis, all the soil core samples were derooted in order to
run the remaining analyses. Soil moisture was calculated by placing 10 grams of wet soil from

each core into an oven to be dried for approximately 12 hours at 60 oC and then weighed again
after drying.
The extractable nitrogen was determined by performing a 1M potassium chloride
extraction with 15 grams of soil from each core. The extractions were placed on a shaker table
for 1 hour and then filtered for colorimetric analysis to determine the ammonium (NH4+) and
nitrate (NO3-) concentrations of the soil. The analysis was run using a modification of the Wood
et al (1967) and Griess (1879) method, with the nitrate samples run through the Lachat
QuivkChem ® 8500 for automated analysis.
As a measure of salinity, the exchangeable cation concentrations were determined by
performing a 1 M ammonium chloride extraction with 10 grams of soil from each core. The
extractions were shook for one hour and then gravity filtered using a Whatman ® size five filter
paper with a diameter of 125mm. The samples were then run through the A Absorption 400 to
read atomic absorption spectrometer for sodium (Na+), calcium (Ca
2+), magnesium (Mg
2+), and
potassium (K+).
Results
Physical Dune Structure
From the measurements obtained from surveying the dunes, I found that the natural and
altered dunes had no significant difference between their lengths and widths (Figure 2 & 3). The
average slope was determined from the base slope and the front edge slope. Although not
statistically significant, there was a trend seen of the altered dunes having steeper slopes (Figure
4).

Vegetation
In terms of overall cover, there was no significant difference found between the natural
and altered dune sites for the total percent cover throughout the dune structures (Figure 5). The
compositions of the dunes’ vegetation communities were slightly different, as the altered dunes
had higher species richness than the natural dunes (Figure 6). When the non-native species were
removed, native species richness was the same between the altered and natural dune structures.
The non-native species occurrence was only found in the second half of the altered dunes’
structure, further from the wrack line (Figure 7). In contrast, there was no significant difference
in native species cover throughout the dune structure for both treatments (Figure 8).
Soil Composition
The extractable nitrogen included the concentration values (μg/g dry soil) of both nitrate
and ammonium throughout the entirety of the dune structure. The trend of increasing nitrogen
concentrations with increased distance from the wrack line was seen in both natural and altered
sand dunes (Figure 9). There was not a significant difference seen in the concentrations of
nitrogen between the altered and natural treatments.
Extractable cation concentrations (Meq/ 100 g dry soil) for sodium, magnesium, calcium,
and potassium were determined to look at the gradient of salinity throughout the sand dune
structure. It was found that the natural and altered sites both had initially elevated concentrations
of all cations, which then decreased as distance from the wrack line increased (Figures 10, 11, 12
& 13). At the final point of each transect there was also a spike in the cation concentration for
calcium, magnesium, and potassium. The same trend was seen for the altered sites with the

sodium concentration, but was not significantly different than the natural sites. All altered sites
displayed higher concentrations of cations than natural sites, with there being significantly higher
concentrations of calcium in the altered sites than in the natural sites.
Overall, the natural sites had a higher average percent organic matter than the altered
sites (Figure 14). The natural sites had elevated levels of organic matter near the shoreline, which
decreased as distance from the wrack line increased (Figure 15). The altered sites showed a trend
of beginning with low percentages of organic matter near the shore, with only slight increases in
organic matter as distance from the wrack line increased.
Discussion
Physical Structure
There was no significant differences between the natural and altered dunes from the
height or length dimensions of the dunes (Figures 2 & 3). The only trend was that the altered
dunes tended to be steeper than the natural dunes, as they show slightly higher slope values
(Figure 4). With no significant differences between the treatments in the general shape and
dimension of the dunes, there is no evidence that anthropogenic structures have caused a change
in the dunes structure. Sand dune morphology is highly variable because of the reoccurring
phases of stabilization and destabilization that transpire due to the hazardous environment and
frequent disturbances of natural weather events (Martinez et al., 2004). Any distinct variability
between the dune’s treatments may have been too subtle to have been properly detected with my
current sample size (n=14).
Vegetation
The overall total cover did not show a significant difference between the altered and
natural sites. Both dune treatments saw a drastic increase in the percent cover within the first 10
meters of each transect, which was mainly comprised of the beach front, and then maintained a
relatively stable percentage of cover through the remainder of the dune structure (Figure 5). This
trend may be occurring because of the practice of beach nourishment (Nordstrom et al., 2009).
On some of the altered sites, where degradation of the dunes may have happened in previous
years, there were man-made restoration techniques such as filling in lost sediments or planting
pioneer species.
Average species richness varied between the altered and natural sites. The altered sites
displayed a slightly higher species richness than the natural sites (Figure 6). Once the species
richness of native species versus non-native species was analyzed, we saw that the native species
richness of both altered and natural sites were similar. This showed that any difference between
the treatments in aggregate species richness was due to the presence of non-native species being
found exclusively in altered sites. The non-native species only occurred in the later half of the
dune structure, which is where the anthropogenic structures were located (Figure 8). This trend
exhibits a partial urban effect happening at the interface of the dune structure and the
anthropogenic alterations.
The spread of urbanization tends to increase species richness by the introduction of non-
native species from suburban settings and infrastructure disturbance. The increase in
urbanization displaces the native species as they become outcompeted by the weedy non-native
species that are introduced (McKinney, 2002). This effect is partially seen in the introduction of
non-native species at the fringes of anthropogenic structures and sand dunes. The occurrence of
non-native species in the later half of the dune, near the anthropogenic structures, suggests that

there may have been some seed dispersal from the surrounding urban areas. This could facilitate
the elevated species richness seen only in the altered sites (Figure 6). The suburban effect was
only partially seen because even with the occurrence of non-native species, there was no
reduction in native species richness or total cover throughout the dune (Figure 6 &7).
Soil Composition
Between the treatments, there was no significant difference in the concentration of
extractable nitrogen. Both sites were found to have nitrogen further from the wrack line (Figure
9). This trend is common as nutrients are able to build up farther from the immediate harshness
of the shoreline and there are more secondary successional species (Martinez et al., 2004). The
build up of nutrients in the further parts of the foredune can facilitate a wider variety of
vegetation. This, coupled with seed dispersal from adjacent suburban development, could enable
non-native species to establish in the foredune.
Salinity was shown through four common seawater cations; sodium, calcium,
magnesium, and potassium . The salinity analysis found high initial concentrations of cations,
which then decreased as distance from the wrack line increased (Figures 10, 11, 12 & 13). At the
end of the dune structure there was a slight spike in the cation concentrations. The altered sites
exhibited higher salinity concentrations than the natural sites. High salinity could be due to the
proximity of the altered sites to roads and parking lots that would be salted during winter
months. The town of Falmouth, MA uses a combination of rock salt, comprised of sodium
chloride, and Safe Melt 40/60 blend, comprised of forestry byproduct and calcium chloride. The
practice of salting the roads and parking lots in Falmouth may be creating a second wave of
salinity distribution that has salt dispersal coming from both the salt spray of the ocean and salt

from infrastructure.
The percent organic matter showed some variance, as the natural sites tended to show
more percent organic matter than what was found in the altered sites (Figure 14). Looking at the
distribution of the percent organic matter, I found that the highest concentrations of organic
matter were at the shoreline of the natural dunes (Figure15). The natural sites were chosen due to
their lack of anthropogenic structures, which would decrease human interactions with the beach
front. This decrease in interactions might have allowed for a build up of algal deposits from high
tides, which would not have occurred at the visited and maintained beaches. The discrepancy in
algae present at the beach front may account for the elevated organic matter present in the
aggregate analysis (Figures 14 & 15).
Conclusion
From this study we can assume that because there was no physical difference in the
dunes’ structures, there was no significant evidence suggesting that the altered dunes’ protection
function has been altered by the presence of anthropogenic structures. The similarities in dune
shape could be due to the practice of dune nourishment, which is the artificial planting of dune
vegetation (Nordstrom, 2009). Dune nourishment would help the altered sites to reach the same
overall vegetation cover as the natural dunes, thus stabilizing the altered dunes and helping them
to function similarly to the natural dunes. There is also the possibility that the sample size was
not large enough to properly detect any pattern that would occur due to sand dunes having highly
variable substrates, caused by wind and sand dispersal. Future studies would need to increase the
number of sites in total as well as the number of transects per site. Successful studies for this
type of field experiment have included transects in the range of 26,000 total (MA Coastal
Erosion Commission 2015). This would increase replicates within a site and help to obtain more
accurate dune shapes.
The vegetation showed no significant differences between sites in means of total percent
cover, but did display that there is a distinct relationship of native versus non-native presence
between treatments. Non-native species were exclusively found near the anthropogenic
structures at the altered sites. Evidence does not confirm that the presence of the non-native
species is solely the product of anthropogenic structures. The coupling effect of increased
nitrogen concentrations and adjacent suburban areas can lead to the establishment of non-native
species. Dispersed seeds from adjacent suburban surroundings can establish more effectively
when there is adequate nitrogen to accompany the germination process. The similarities in native
cover dominating the shoreline and throughout the dunes, are evidence of the harsh environments
of dunes being that only plants that grow there natively can withstand the hazardous
environments and are the only species that can fill that niche.
Acknowledgements
I would like to thank Chris Neill for his guidance and instruction throughout the project
period. I would also like to thank Anne Giblin for her help with running the atomic absorption
spectrometer for my cation analysis, Rich McHorney for lending me his surveying equipment
and teaching me how to survey, and Ed Rastetter for initial guidance in what metrics I should be
looking at for dune structure. Thanks to my field partner Christian Alexander and lab partner
David Tian for helping me to collect and analyze my samples. Finally, many thanks to the lab-
teaching assistants for transportation to Washburn Island and helping with nutrient analysis.

Literature Cited
Davidson-Arnott, R. (n.d.). Coastal Sand Dunes and Beach/Dune Interaction .lecture.
ESLER, A.E. (1970) Manawatu sand dune vegetation. Proceedings (New Zealand
Ecological Society), 17, 41-46.
Faggi, A. & Damon, J. (2011) Temporal and Spatial Changes in Plant Dune Diversity in Urban
Resorts. Journal of Coastal Conservation, 15, 585–594.
Greiss P. (1879). “Bemerkungen zu der Abhandlung der HH. Weselky und Benedikt Ueber
einige Azo-verbindungen”. Berichte der Deutschen chemischen Gesellschaft 12 (1): 426-
428.
Hayholm, K. G., et al. (2004) Stratigraphy of Back-Barrier Coastal Dunes, Northern North
Carolina and Southern Virginia. Journal of Coastal Research, 20, 980–999.
Martínez, M., Maun, M. & Psuty, N. (2004) The fragility and conservation of the world's coastal
dunes: Geomorphological, ecological and socioeconomic perspectives. Coastal Dunes
Anonymous pp. 355-369. Springer.
McKinney, M. L. (2002) Urbanization, Biodiversity, and Conservation. BioScience, 52, 883–
890.
Nordstrom, K.F., Gamper, U., Fontolan, G., Bezzi, A. & Jackson, N.L. (2009) Characteristics of
coastal dune topography and vegetation in environments recently modified using beach
fill and vegetation plantings, veneto, italy. Environmental Management, 44, 1121-1135.
Provoost, S. M., L. M. Jones & S. E. Edmondson. (2011) Changes in Landscape and Vegetation
of Costal Dunes in Northwest Europe: A Review. Journal of Costal Conservation, 15,
207–226.

Report of the Massachusetts Coastal Erosion Commission. (2015) 1, 1–138.
Tucker, J., et al. (2010) The Future of Falmouth's Buzzards Bay Shore.
Wood ED, Armstrong FAJ, and Richards FA. (1967) Determination of nitrate in seawater by
cadmium-copper reduction to nitrate. Journal of the Marine Biological Association of the
United Kingdom 47: 23-31.
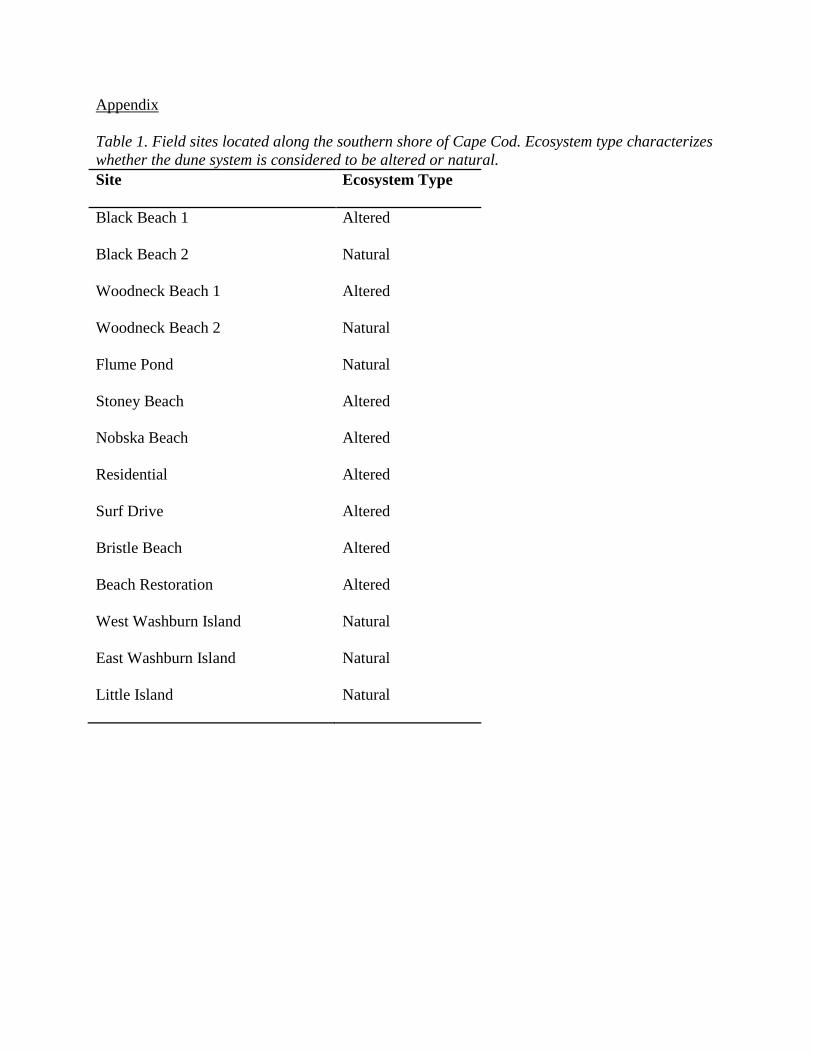
Appendix
Table 1. Field sites located along the southern shore of Cape Cod. Ecosystem type characterizes
whether the dune system is considered to be altered or natural.
Site Ecosystem Type
Black Beach 1
Black Beach 2
Woodneck Beach 1
Woodneck Beach 2
Flume Pond
Stoney Beach
Nobska Beach
Residential
Surf Drive
Bristle Beach
Beach Restoration
West Washburn Island
East Washburn Island
Little Island
Altered
Natural
Altered
Natural
Natural
Altered
Altered
Altered
Altered
Altered
Altered
Natural
Natural
Natural

Figure 1. Experimental set up at each site. Each box along the transect represents a point of
cover. Each red circle within a box represents where a soil core was taken.
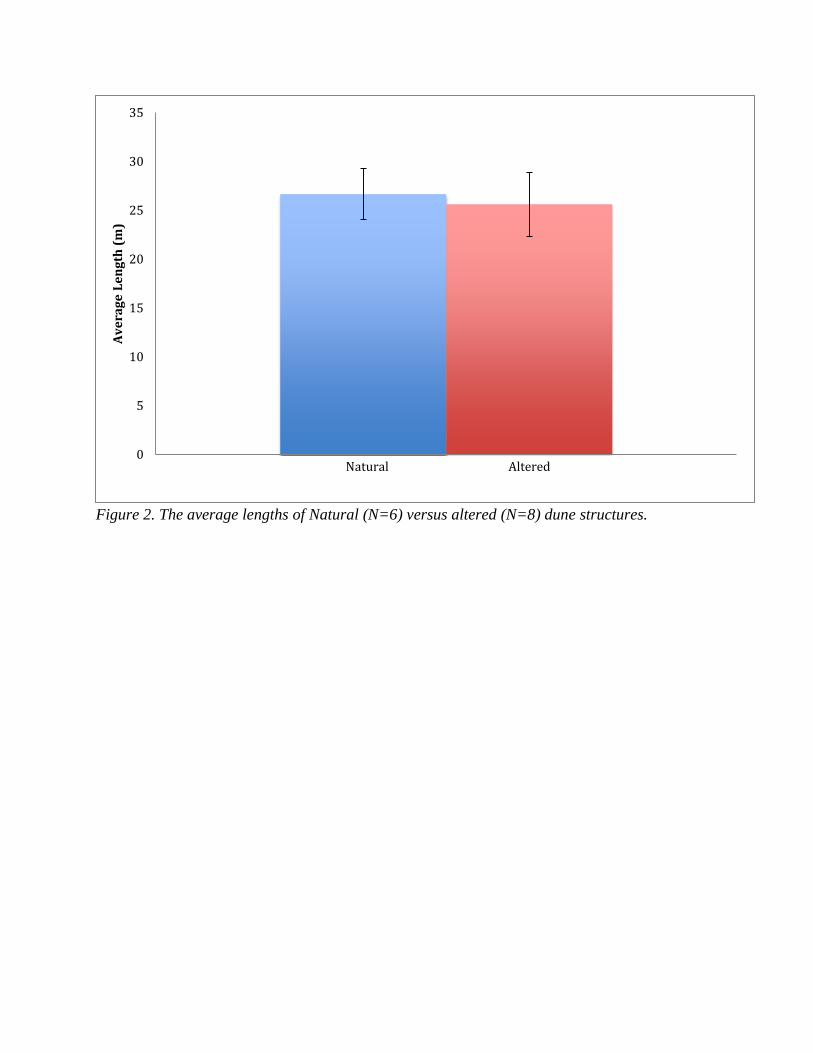
Figure 2. The average lengths of Natural (N=6) versus altered (N=8) dune structures.
Natural Altered 0
5
10
15
20
25
30
35A
ve
rag
e L
en
gth
(m
)
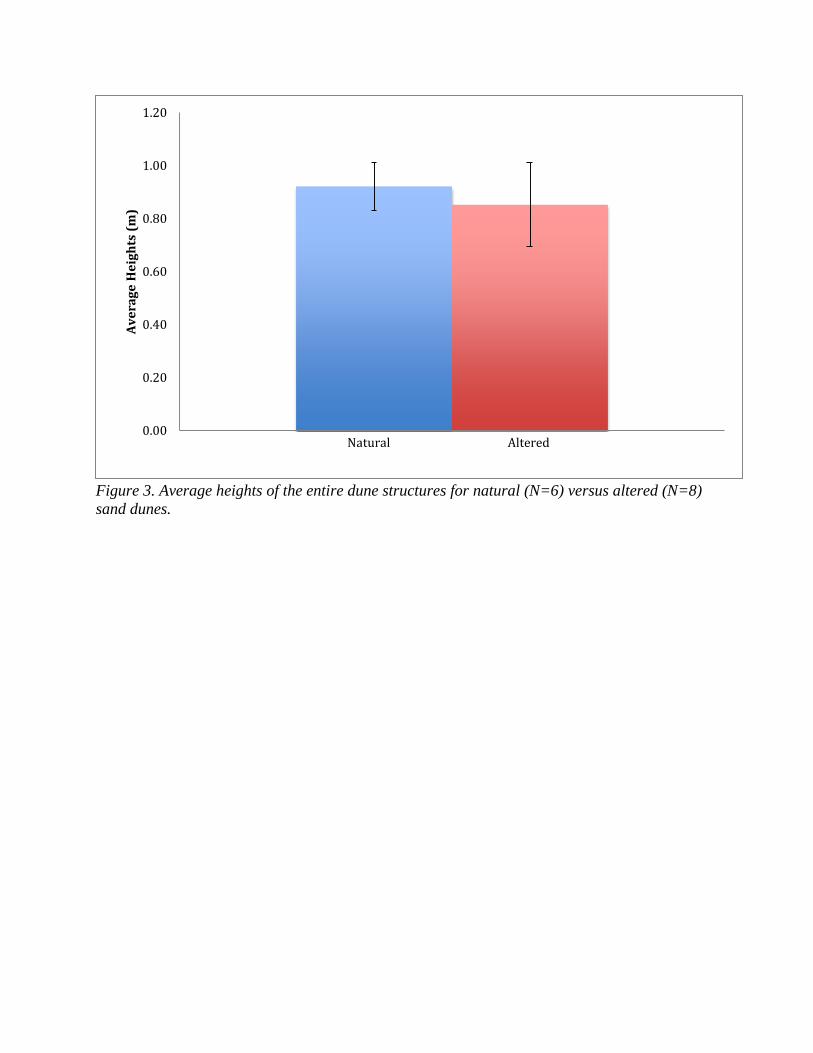
Figure 3. Average heights of the entire dune structures for natural (N=6) versus altered (N=8)
sand dunes.
Natural Altered 0.00
0.20
0.40
0.60
0.80
1.00
1.20
Av
era
ge
He
igh
ts (
m)
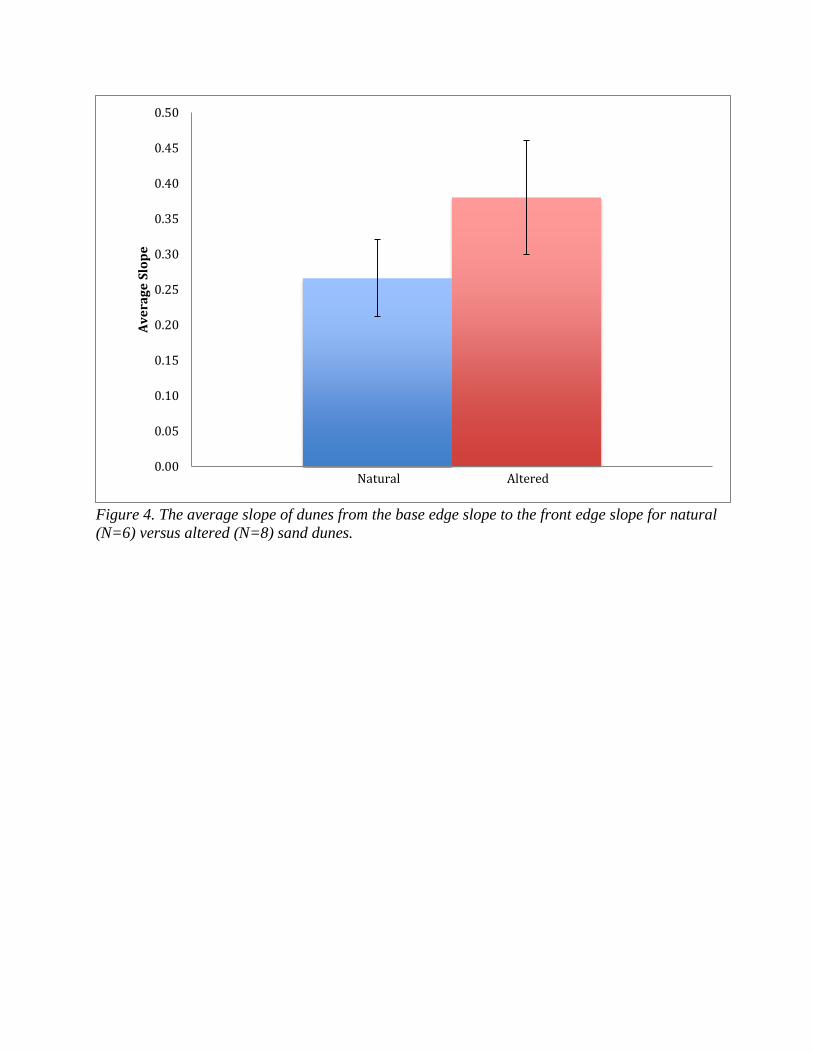
Figure 4. The average slope of dunes from the base edge slope to the front edge slope for natural
(N=6) versus altered (N=8) sand dunes.
Natural Altered 0.00
0.05
0.10
0.15
0.20
0.25
0.30
0.35
0.40
0.45
0.50
Av
era
ge
Slo
pe

Figure 5. The average total percent cover throughout the dune structures for natural (N=6)
versus altered (N=8) sand dunes.
Natural
Altered
0
10
20
30
40
50
60
70
80
90
0 5 10 15 20 25 30
% T
ota
l C
ov
er
Average Distance from Wrack Line (m)
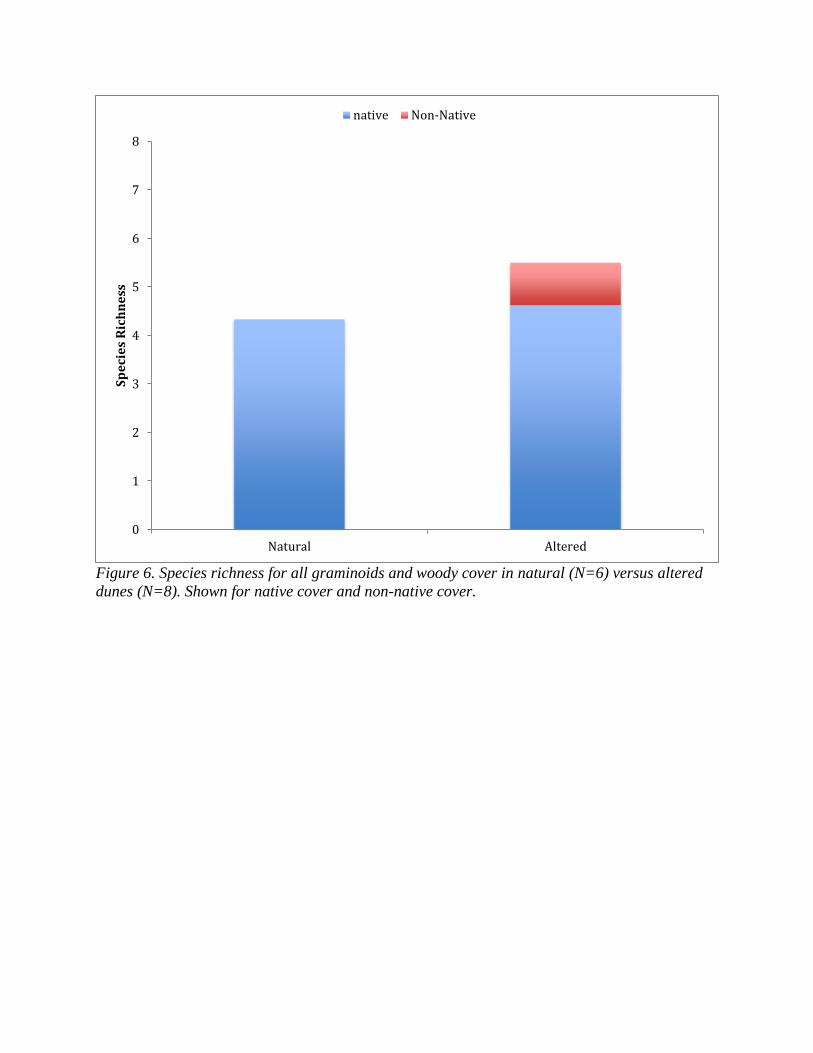
Figure 6. Species richness for all graminoids and woody cover in natural (N=6) versus altered
dunes (N=8). Shown for native cover and non-native cover.
0
1
2
3
4
5
6
7
8
Natural Altered
Sp
eci
es
Ric
hn
ess
native Non-Native

Figure 7. Percent native cover throughout the dune structure for natural (N=6) versus altered
(N=8) sand dunes.
Natural
Altered
0
10
20
30
40
50
60
70
80
0 5 10 15 20 25 30
% C
ov
er
Average distance from Wrack Line (m)
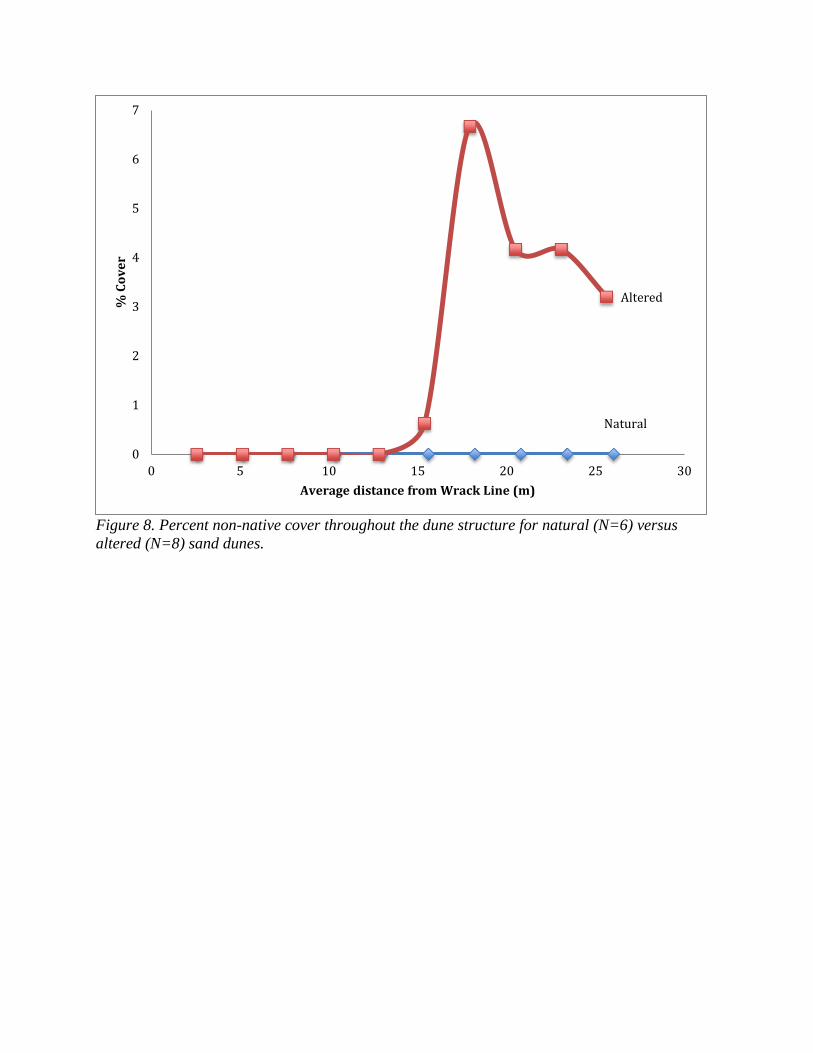
Figure 8. Percent non-native cover throughout the dune structure for natural (N=6) versus
altered (N=8) sand dunes.
Natural
Altered
0
1
2
3
4
5
6
7
0 5 10 15 20 25 30
% C
ov
er
Average distance from Wrack Line (m)

Figure 9. Extractable nitrogen (incorporating both nitrate and ammonium) throughout the dune
structure for natural (N=6) and altered (N=8) sand dunes.
Natural
Altered
0.0
0.2
0.4
0.6
0.8
1.0
1.2
1.4
1.6
1.8
2.0
0 5 10 15 20 25
Co
nc.
N (
ug
/ g
so
il)
Average Distance from Wrack Line (m)

Figure 10. Extractable sodium (Na
+) throughout the dune structure for natural (N=6) and
altered (N=8) sand dunes.
Natural
Altered
0.0
0.2
0.4
0.6
0.8
1.0
1.2
1.4
0 5 10 15 20 25
Co
nc.
Na
(M
eq
/ 1
00
g d
ry s
oil
)
Average Distance from Wrack Line (m)

Figure 11. Extractable calcium (Ca
2+) throughout the dune structure for natural (N=6) and
altered (N=8) sand dunes.
Natural
Altered
0
0.001
0.002
0.003
0.004
0.005
0.006
0.007
0.008
0.009
0 5 10 15 20 25
Co
nc.
Ca
(M
eq
/ 1
00
g d
ry s
oil
)
Average Distance from Wrack Line (m)
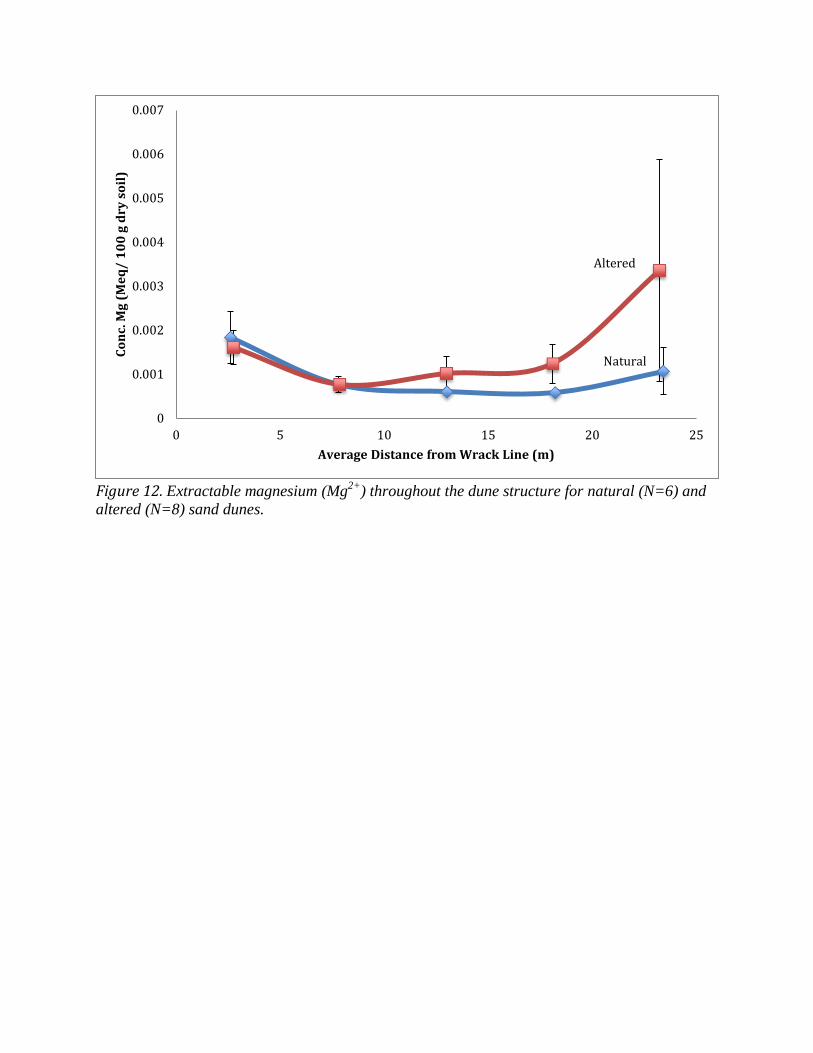
Figure 12. Extractable magnesium (Mg
2+) throughout the dune structure for natural (N=6) and
altered (N=8) sand dunes.
Natural
Altered
0
0.001
0.002
0.003
0.004
0.005
0.006
0.007
0 5 10 15 20 25
Co
nc.
Mg
(M
eq
/ 1
00
g d
ry s
oil
)
Average Distance from Wrack Line (m)

Figure 13. Extractable potassium (K
+) throughout the dune structure for natural (N=6) and
altered (N=8) sand dunes.
Natural
Altered
0
0.0002
0.0004
0.0006
0.0008
0.001
0.0012
0.0014
0 5 10 15 20 25
Co
nc.
K (
Me
q/
10
0 g
dry
so
il)
Average Distance from Wrack Line (m)

Figure 14. Average percent organic matter in natural (N=6) versus altered (N=8) sand dunes.
Natural Altered
0
1
2
3
4
5
6
% O
M

Figure 15. Percent organic matter throughout the dune structure for natural (N=6) versus altered (N=8) sand dunes.
Natural
Altered
0
2
4
6
8
10
12
14
16
18
20
0 5 10 15 20 25
% O
M
Average Distance from Wrack Line (m)