the effects of transgressions and regressions on coastal
TRANSCRIPT

The Effects of Transgressions and Regressions on Coastal and Offshore Groundwater
A case study of Suriname and generic studies into groundwater flow systems salinity patterns and paleogroundwater
Koos Groen
2002
Vrije Universiteit
I
II
c e
r
l
-----------------
Photograph from tover COlTyenne and Joshua children of the aUlhor playing at the beach in Katwijk The Netherlands
Thi siudy is carried oUl at the Facully of Earth- and Lif~ Sciences of the Yrije Universiteit AmSlerdam Parl of thc study is ltI contribution to the NEESDI program funded by the Netherlands 01ganisatioll for Scientific Research (NWOl
Th~ rllil text 01 this Ihesb is availabl~ 1 hnplwwwgeovunlgrolJ
of Groln Jarohll~
The dfeels of Imnsgressions and regressions on coaslal and offshore groundwater A case study or Surinlme and gen~ric studies into groundwater noY systems salinity patterns and paleogroundwater - Doctoral Thesis Yrije Universiteit Amsterdam - With ref - With sumshymary ill Dutch
ISBN 90-9016 1-9
Subi~ct headings hydrology groundwaler I coastal plain I regression I transgression I paleshyogroundwaler I solute transport I hydrogeochemistry I isotope hydrology I groundwater salinity I ~ubmarine groundwater I Suriname I South America
Printed by PrintPanners Ipskamp Enschede The Netherlands
VRIJE UNIVERSITEIT
The Effects of Transgressions and Regressions on
Coastal and Offshore Groundwater
A case study of Suriname and generic studies of groundwater flow systems salinity patterns and paleogroundwater
ACADEMISCH PROEFSCHRIFf
ter verkrijging van de graad van doctor aan de Vrije Universiteit Amsterdam_
op gezag van de rector magnificus profdr T_ Sminia
in het openbaar te verdedigen ten overstaan van de promotiecommissie
van de faculteit der Aard- en Levenswetenschappen op dinsdag 8 oktober 2002 om J545 uur
in de aula van de universiteit De Boelelaan 1105
door
jacobus Groen
geboren te Katwijk aan Zee l
promotor profdr JJ de Vries copromotor dr H Kooi
Soli Deo Gloria
Contents
Voorwoord v
Samenatting vii
1 Introduction 11 Background I 12 Objective and scope of the sLudy I 13 StrucLure oflhe Lhesis 2
2 Some concepts and definitions related to coastal hydrogeology 21 Groundwater origin and salinity 5 22 Flow systems 5 23 FreshsLiline interface 6 24 Paleogroundwater 7
Parr I ClISt Slud of(palto)grmmdwatel ill the coastd plin alld cOlltinellwl shelf of Sfriname
3 Hydrology of the coastal plain and continental shelf of Suriname 31 Introduction II
Climale 12 12 Landscape 13 33 Geology
341 Geleral 342 Cretaeolfs and Teniar) 143 Qllaterl1al
35 Runoff and recharge 351 The sapanlah belt 352 Tilt (oostal plain
36 Groundwater 361 Aqllijerf and aqUitards 362 Groundllater saillit
14 14 18 19
20 20 21 22
22 22
363 Grmmdwoter floll systems ill rile Tertiary fonllariols 24 364 GrofldIater recoel) 26
37 Conclusions 27
4 Freshening of the coastal and offshore sediments during the Wisconsinan regresshysion a reconstruction of paleogeography and groundwater flow systems 41 Introduction 29 42 Paleogeography of the Suriname coastal plain 30
421 Sea lelel and coastliles 30 422 Topogropl- 31 423 Vegetation 31
J
r1 424 Clinlate 31 425 Hydrology during tlle Last Glacial Maximum 32
43 Paleohydrological modelling 33 431 Itroduction 33 432 Recent and sltb~reellt modelling 34 433 Modeling Ihe paleohydrology of the Lae Glacial Maximum 35
44 Discussion and conclusions 37
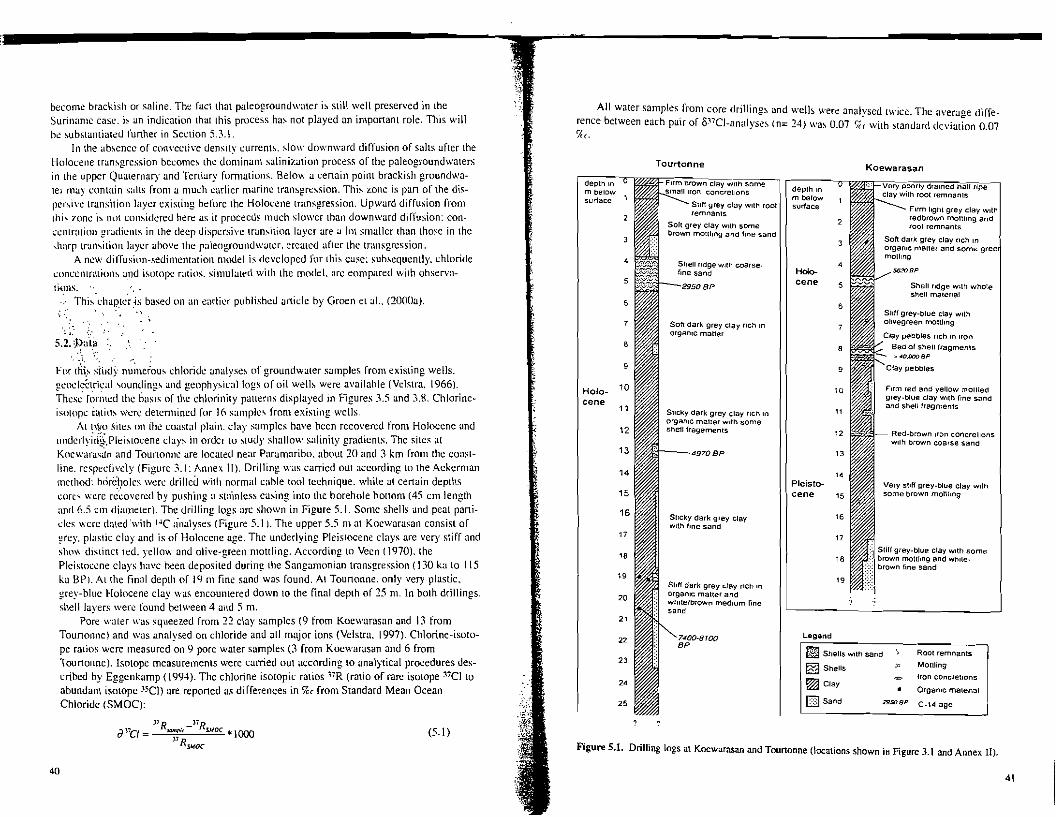
5 Salinization of the coastal and offshore sediments during the Holocene transgresshysion a study of diffusive solute transport 51 Introduction 52 Dal 53 Solute Lrangt~n and fractionalion
531 DOIllrard cOnlectile solute tranfwr 532 DifjUfioll 533 Diffusioll coefficients
39 40 42 42
42 43
534 FractiOlwricm ofchlorine isotopes by diffusive transport 44 535 Diffusioll-sedimentation model simllialillg transgression folltJwed
by regresitJlI 45 54 Rcsults 46
541 DfJ)wlvard diffusiol 46 542 Upward transport ofsaJine and brackish groundwater 50
55 Discussion and conclusions 51
6 Hydrogeochemical signals of the hydrology and paleohydrologJ in the coastal plain of Suriname 61 Introduction 53 62 Data 54 63 Hydrogeochemical evolution of meteoric groundwater in the coastal plain 55
63 J Rainfall and elapotranspiration 55 632 Dissolution ofcarbon ill the soil olle 56 633 Mineral dissoilltioll 57 634 Redox processef 59
64 Cation eJichange and freshening in the Pleistocene clays during the Wisconsinan regression 59 641 ltlT1ducTion 59 642 Obsenatiols 61 643 Cation-exchutlge simulations 61
65 Calion exchange and salinization in the Quaternary and Tertiary formations during the Holocene transgression ~ 64 65 J JtroductioJJ 64 652 Obsenalio1Js 64 653 CaTiorl-excJlallge simulatians 67
66 Discussion and conclusions 68
ii
I 7 Isotopic signals of the hydrology and paleohydrology in the coastal plain of Suriname 71 Introduction 73 72 Data 73
721 New QllalJfS 73 722 Al1alyses from existing isotope studies 74
7J Identification of hydrogeochtmical processes and paleovegetalion with 13 JJC of dissolved inorganic carbon 75 73 Introduction 75 732 Relulls 76
74 Groundwater dating with I~C of dissolved inorganic carbon and gtH of groundlmiddotuter 78shy741 Inrrodu(lioll 78 742 Resuils 80
bull 75 ReconMruction of paleodmute with stable 5ltlQ und 52H isotopes in rclinfall and groundwater 83
751 11Itroduclion 83 752 Resultf 84
76 Discussion and conclusiom 87
forr II Gellui( illlestigali(lIIs inlO he origin ofoffshorc meteoric groundater
8 Worldwide observations of offshore meteoric groundwater 81 Introduction 91 82 Submarine discharge 9
821 Sublllarille springs 92 822 Difuie mbl1larill( discharge 92
83 Meteoric groundwater in offshore boreholes 93 831 Nantucket islalld (USA) -Atlantic Ocean 93 832 New Jersey and MCl1)lalld (USA) - Atlantic Ocea 97 833 Georgia (USA) -Atlantic Oceall 97 834 Georgia (USA) -Arlalltic Ocean 99 835 Part Harroun (Nigeria) - Atlamic Oceall 99 836 IJmuidell (Netherlallds) Nonh Sea 99 837 Sballghai (Chita) - Cbjllese Sea 99
84 Discussion and conclusions 99
CI Prediction of the offshore continuation of eoastal groundwater now systems 91 Introduction 101 92 The New Approximate Model 101 93 Results 105 94 Discussion and conclusions 110
r 10 Flow and salt transport in submarine meteoric groundwater in steady-state and
transient systems 101 Introduction 113 102 Experimental setup 113
021 Nunlerical code 113 022 Discretizatioll 114 023 Models and bounda1) cotlditiolls 115
103 Results 119 1031 Model I staliollary Jubmarille groutdwaler alld wwe
rranspon 119 1032 Model 2 submurhle groundwaler and solwe rrUlUpon during
transgressillg over a flut seaward sloping fOlldsurface 122 1033 Model 3 submarine groulJdwater alld solule lTUllspOn during
transgression (wer a disJected lund surfuce 126 104 Discussion and conclusions 130
11 Summary and conclusions 135
References 143
Annexes I Sediments and aquifers in the Suriname coastal plain 157 II Map of the Suriname coaslBl plain around Paramaribo with sampled wells 163 m Chemical and iS010pic analyses of groundwater in the Suriname coastal plain 167 IV Plant species and photosynthetic pathways in savannah belt of Suriname 191
iv iii
Voorwoord Wuarom en hoe is dit proefschriFt lot stand gekomen Een goed antwoord zou een
ware biografie vereisen omdaL dil werk het resultaat is van een lange keten van gebeuneni~shysen en ontmoetingen ver leruggaand in de iijd hier en daar wat bewuste keuzes wat Qvershytuigingskrachl un anderen maar vooral toevallige mogelijkheden en onmogelijkheden Oil maakt dal ik nu in vrolijke verwondering en dankbaarheid ornzie Ik wil daarom beginnen Olll mijn ouder Corrie en Huig Groen Ie bedanken voar hun uanhoudende steun In mijn j~ugd slimuleerden zij en ook anderen zoals wijlen opa Groen en meester Varkevisser mijn lcergierigheid en lieten mij - londer dat ik het besefle - afdwulen van een bijna voorbeshystcmd lewn als visser
Nu mijn siudie hydrologie aan de VU in Amsterdam (1971101 19MO) heb ik gcwcrkt bij hel adviesbureau IWACO (1980-1994) zowel in Nederland als het verre builenshyland D~i~ period~s waren naluurlijk oak van grote invloed De mensen en belevenissen uj( die periodes draag ik met me mee en maken me to wal ik ben
Pas in 1994 kreeg ik de kans om bij de universiteil Ie gaan werken Ik dank daarom mijll promOlor prof Co de Vries voor zijn venrouwen loen hij mij - all wetenschappelijke outsider - aantrok bij de vakgroep hydralogie en stimuleerde tot dil promotieonderzoek Na lang denken over een geschikL onderverp begon ik in de zomer van 1995 met het onderzoek in Suriname waar ik al eerder als consuhant had gewerkl Afgezien van mooie en intrigerenshyde hydrologische gegevens UiL dat land had ik inmiddels een minstens zo mooie en inlrigeshyrelld~ Surinaamse vrouw De mOlieven waren dus niet zuiver wetenschappelijk Maar zijn ze dat noit
Terugkijkend op de periode van de promotiesludie ben ik vooral veel dank vershyschuldigd aan Henk Kooi mijn copromotor Oat geldt voar zijn kriLische geest hel werk aan de modelexperimenlen maar vooral VOor het aanslekelijke enthousiasme in onze discussies daL voorldurend nieuwe wegen opende Henk lalen we zo doorgaan Ook de hulp van stushydenlen middels hun afstudeeronderzoeken was onmisbaar Ik denk dan aan Jouke Velstra voor fijll kanering van de zoulgehaltes van het grondwater zijn hulp in Suriname en de geochemische en isolopenanalyses aan Vineent Post voor de berekeningen met hel grandshywatermodel aan Tibor Stigter voar het yerzamelem en interpreteren van de hydrogeochemishysche gegevens en aan Kyrian van Vliet voor het uilvoeren en interpreteren van isotopenanashylyses Jongens bedankt zcker ook voor de gezelligheid Dank gaat ook Uil naar VU collegashys voor hulp bij berekeningen literatuuranderzoek lekslcorrecties en logistieke ondersteushyning mel name Antoon Meesters Ersin Seyhan Sampurno Bruynzeel Kick Hemker Michel Groen Vincent Post Boris van Breukelen Ian Simmers en Tony Appclo
Zander hulp uil Suriname zou hel ook niet zo vcr zijn gekomen In de eersle plaals dank ik Theo Goedhan directeur van de Surinaamsche Waterleidingmaalschappij (SWM) die mij op aile mogelijke manieren logistiek heef[ ondersteund bij het veldwerk het verzashymelen van gegevens en met introducties bij andere organisaties Je hoon gewoon bij de SWMmiddotmiddot zei hij laats En zo is het Gedurende mijn vele bezoeken sinds 1990 ben ik me thuis gaan voelen daar aan de GravenStraal in Paramaribo Die dank geld oak voor andere SWMers zoals Rudy Pawiro Anand Gobind en Carolien Ligeon Ook de Djenst Watervoorziening in Suriname ben ik dank verschuldigd in de personen van de heer Tsai Meu Chong de wandelende database van de waterboringen - may he live forever - en Jerrol Ferrier Goede herinneringen bewaar ik ook aan Siela en Pieter Teunissen voar hun gastvrij~
heid Ik heb ook dankbaar gebruik gemaakt van PieLers uitgebreide kennis van vegelatie bodem en landschap van Suriname en zijn uitgebreide netwerk van contacten voor heL vershygaren van inFonnatie Cruciale boorgegevens zijn afkomstig van Staalsolie Maatschappij Suriname waarvoor ik de directeur de heer Jahrap Ferry Nieuwland en Joan Telgt erkenteshylijk ben Oat geldt oak voor de bauxielmaatschappijen Billiton Maatschappij Suriname en SURALCO welke in de personen van respectievelijk Henk Morroy en Jan Vandenberge behulpzaam waren met verlenen van gegevens en bij heL veldwerk Onder de dankbetuiginshygen noem ik verder de heer Coleridge van ConsulLing Services voor het uilvoeren van de pulsboringen en last but not least mijn voarmalige werkgever IWACO nu RoyalHaskoning voor logistieke hulp
lk wil verder enkele personen noemen die mij geholpen hebben metillbornorium analyses Oat zijn Heny Schafer van het hydrochemisch laboratorium van de VU Gareth Davies van hel isolopenlaboTltlIOrium van de VU Harro Meijer Harm-Jan Streurnmn Bert Kers en Hans vun der Plichl van hel Centrum vour Isotopenonderloek in Groningen Arnold van Dijk van hel geochemisch laboralorium van de RUU in Utrecht Sjerry van der Gllast van heL NIOZ in Den Helder Frank Wesselingh van hel museum Naluralis in Leiden Ik heb ook dankbaar gebruik gemaakt van gegevens ter beschikking gesteld doar SHELL (boorgatmetingen via Huib van der Brink) Leen Krook (mineralogische beschrijvingen sedishymen len Suriname) en Theo Levell (geochemische analyses) Beste mensen sommigen van jullie zien dat ik (nog) nieL aile gegevens heb gebruikt maar dm doet nieLs aF van mijn dankshybaarheid voor jullie inzet
Verder ben ik de leden van de leescommissie proF dr HAJ Meijer dr ir TN Oltshoorn proF dr A Leijnse proF dr ThE Wong proF dr W Roeleveld en dr AJ van Loon erkentelijk voor het beoorde1en en becommentarieren van het proeFsehrirt Ik wil in heL bijzonder Tom van Loon bedanken voar zijn zeer grandige correctie van de tekst Tensloue dank ik Henry Sion en Nico SchaeFers van de afdeling FOLografie en vonngeving van onze Faculteil voor hel teken- en opmaakwerk van het proeFschriFt
Gedurende de gehele onderzoeksperiode kreeg ik indireete maar niel minder belangrijke steun in het huishouden van mijn familie meL name van schoonmoeder Gisela Brackman tante Lygia Hardy en schoonvader Oscar Stewart Grantangi lieve mensen Naasl een praeFschrirt hebben de afgelopen jaren mij oak [wee beeldschone kinderen opgeleverd Corryenne en Joshua Schatjes jullie hebben me vooral van mijn werk aFgehouden en daar ben ik jullie eeuwig dankbaar voor En dan mijn vrouw Jacintba lk kan hier nieL opsommen wat je allemaal voor me hebt gedaan Ik volsta mel Ie zeggen dat ik zonder jou niet eens was begonnen aan deze klus lndachtig een Surinaams gezegde ben jij voar mij het water waarin ik zwem Lek fa wan fisi no man Iibi sondra watra so mi no man Iibi sondro yu
Tenslotte het onderzoek duurde lang maar er waren genoeg spannende en plezierishyge momenten van ontdekkingen - vaak samen met anderen - die het enthousiasme erin hielshyden Wat dat betreFt is er weinig verschil tussen aardwetenschappers en kinderen die spelenderwijs hun omgeving onldekken zoals de omslag van dit boek laat zien Hel gaat om de verwondering kinderlijke verwondering over alles water te lien en te beleven is in de natuur Gods eigen speeltuin
Koas Groen
Samenvatting
De effecten van transgressies en regressies op grondwater in kustvlakten en onder de zeebodem
JIIllidillg
Dil p~ocfschr~fL gaul in op de vruug hoe mariene tramigressies en regressies grondw3ler III ku(~ebll~den bemvloeden wal bel~f1 slromingsSYSlemen en processen als verzihins en verzuellns Deze vraag komi YOOn un hel feit dat zoutgehalten van grondwater in kustgebieshyden vltmk een - or he een-ae gezichl - onlogisch patroon Ienonen oer in binnenland kan men -om~ brdk gromlwuler vinden lerwijl onder de zeebodem zoel grondwater wordt aangeshytroffen Dc wczenlijke oof7uak ligl in de grate geologische dynamick van het kustmilieu Hel grondwatersysteem moet zich sleeds aanpassen aan soms abruple gebeunenissen als (nmsgrcssic regressie sedimenlulie en erosie De hierrnee gepaard gaande verzilting dan wei ver_ocling an de -edimenren vollrekt lich trilllg en is vaak nog niet volLooid wanneer hel slromingssysteem in hel ku-agebied alweer vcranden
In dit procfschrift is getrachl een beer begrip te krijgen van deze processen door middel van een case studie van de Surinaamse kustvlakte (Pan I) en observaLies uit andere delcn van de wtreld cn algemenc modelexperimenten (Pan II) De case studie wordt beschrccn in Lie drie volgende paragrafen van de7e samenvatting de algemene ~itudies in de
_voorlaaLste paragraaL
Hil kllsr- ell Ojf-UJI(middot Rchicd I-Oil Suriname ---_shyDe kust hlkle bij Paramaribo vormt een laaggelegen en van nature moeras~bied
waar Kwanaire ma~ene af~uingen grolendeels bestaande uit kleilagen (5 tot 3T~ ~~kte) mn hel oppervlak hggen (Flguur 31 en 35) Ten 7uiden daarvan dagzamen Pliocene zanden in de hoer gelegen savannegordel De Teniaire afzeningen bestaan voomamelijk uit ongeshyconsulideerdc zandmiddot en kleilagen en hebhen een totale dikte van enkele meters i~ de savanshynagordellot 300 m in hel noordelijke HOlocene deel van de kustvlakle De Terti~iremiddot afzettinshy~en waarin Iich de belangrijkste aquifers be inden rosten op kristallijne gesteenies (in liuvannegordel en Pleislocene kustvlakte) of op Krijtafzettingen (in Holocene kustvlakte)
Hel 7outgehalte van hel grondwater in de Teniaire aquifers in mgll chloride varieert van 6 tot WOO mgll Hogere gehalten worden aangelroffen in de slechl doorlatende Krijtafzeuingen en in de Kwanaire kleilagen van de Holocene kustvlakte (Figuur 35) Op een aamal pompstations wordt zoe~grondwater laquo 250 mgll chloride) gewonnen uil de
Tertiaire aquifers op diepten van I tot 180 m Voor deaanvang van de grootschalige grondshywalerwinning (1958 AD ) was het grondwater in de kustvlakle min of meer stagnant De aquifers werden en worden nauwelijks aangevuld mede vanwege de zeer hoge hydraulische weerstand van het Kwanaire kleipakkel Een uitzondering vonnt een hoger gelegen gebied rond hel dorp Lelydorp Grondwater kan wei infiltreren in de Pliocene zanden van de sayanmiddot nagordel maar wordt geheel gedraineerd door de lokale kreken
Uit olieboringen blijkl dat grondwater in het offshore ebied relatief zoet is (Fi uur 3~) lot 90 kIn a(stand van de kUSlwor t no n water mel een c on e e aile 1a er dan 2 rna aangetro en (zeeater hee I een chlorideconcentratie van Ca 20000 mgt1) Dit-
vii
matig brakke grondwater is duidelijk van meteorische oorsprong en moet zijn gevormd door een ander stromingssysteem dan de huidige en wordt daarom aangeduid als ea1eogrondwashy
~
VeroetlJg lan sedil~lelllell ill het kust- ell offshore gebied fln Suriname rljdells de Weichse regressie
l-lC-Ieeflijden duiden erop dal her grondwater in de kustvlakte is gevormd tijdens het Laatsle Glaciale Maximum of LGM (25 [Ot 12 ka BP) en Vroege Holoceen (12 LOI 8 ka BP) In die periode en mogelijk daarvoor (De Weichsel regressie duurde van 115 tot 12 ka BP) moel er aanzienlijke grondwateraanvulling hebben plaatsgevonden teneinde de enorme hoeveelheid paleogrondwaler in het kusl- en offshore gebied te kunnen verklaren Toch was de neerslag gedurende hel LGM ongeveer SO van huidige neerslag die 2200 rnmljaar bednlagl Uil de signatuur van de s~biele waLerisotopen (BIIIO en S2H) in het Pleistocene grondwater bJijkl dat de neerslag waarschijnlijk beperkt was tot het seizoen van april [Ot en met juli In dil koelere en drogere klimaal bedekten uilgeSlrekte grasSavannes de kuslvlakle Dit laatsle kon worden afgeleid uit de stabiele koolstof isolopen in het grondwater cBnc) De relatief hoge BDC waarden wijzen erop dal dit grondwater is geinfilueerd onder eeo begroeiing met voomamelijk planten die een C4-fotosynthese volgen welke lypisch is Voor tropische grassen
Gedurende heL LGM stond de zeespiegel 100 tot 130 m lager dan nu en lag de kusLlijn 140 km noordwaarto van de huidige ligging Na 12 ka BP begon de zeespiegel te stijgen en hereikte rond 6 ka BP het huidige niveau De kustlijn lag loen ongeveer 20 km landinwaarto van de huidige positie Gedurende hel Laat Holoceen begon de kustvlakte zich weer uit te breiden door de voortdurende afzelling van sediment aangevoerd uit de Amazone Boringen in de kustvlakte toonden aan dat de rivieren en kreken diep waren ingesneden (10 tot 30 m) gedurende hel LGM en Vroege Holoceen
Grondwalerstijghoogten in de Tertiaire aquifers moeten veellager zijn geweest dan de huidige vanwege de diep ingesneden dalen en de lagere zeespiegel Daarentegen mag worshyden aangenomen dat de freatische grondwalerstanden op de slecht gedfBlneerde kleiplaleaus dichl aan maaiveld bleven Hieroit werd afgeleid dat door het grote stijghoogteverschil er shyaanzienlijke grondwaleraanvulling van de aquifers kon optreden in deze periode (Figuur 43) Een numeriek grondwatermodel dal deze situatie simuleerde toonde inderdaad aan dat er overal op de kleiplateaus van de kustvlakte grondwateraanvulling van enkele tientallen millimeters per jaar bestond Uit berekende verblijftijden van het grondwater kan verder worden afgeleid dat de peri6lt1e waarin het systeem actief was lang genoeg duurde om al het brakke en zoute grondwater van voorlaatste transgresie (Eemien) uit Ie spoelen ook in het gebied dat nu ver offshore is gelegen (90 km uit de kusI) Dat laatste bleek niet mogelijk te zijn in modelsimulaties van een vlakke kustvlakte zander een erosierelief
Het bestaan van stroming en grondwateraanvulling in de kustvlakte werd bevestigd door hyclrogeochemische modellering van stoftransport en cationuitwisseling in de Pleistocene kleilaag Modelsimulaties lieten zien dal alleen bij neerwaartse stroming gedushyrende de Weichsel regressie de uitwisselbare Na+-ionen van de voonnalige loute klei kon worden gespoeld en de waargenomen dominantie van uitwisselbare Mg2+_ en Ca2ot--ionen ken ontstaan In sirnulaties met alleen diffusief stoftransport - het mornenleel heersende proshyces i~ de Kwanaire klei bull werd dit mel bereikt
viii
Verilrillg rtllI ~edimellen ill her kusr- en offihore gebied I((JI Surilame rijdells de Holocene rnmsgflHie
Gedurende en nil de Holocene transgressie toen ook het erosierelief grotendeels is vershydwenen door sedimenlatie zijn de stromingssystemen in hel kustmiddot en offshore gebied tot Slishyslilnd gekomen Tijdens de nelle transgressie kwam relatief zout en zwaar grondwater op hel s(ilgnilme meleorische grondwater te liggen Oil vormt een potentieeJ instabiele situatie di~ kiln Iciden tOL lonvectieve dichtheidsslromen ltfingering) en snelle verLilting van de tmderliggend~ sedimenten zoab in het Nederlandse kustgebied is gebeurd In de dikke ~Jcchl duorlalende Kwartaire kleilagen van Suriname gebeurde dit niet (geen overschrijding i1n heL kriLische Rilyleigh getal) en verliep de verzilling veeltrager volgens diffusief stofmiddot Lwnsport
Ne~lilarLSe diffusieve verlilling is oak aangetoond mel behulp van waargenomen proshylicl~n al1lhloridecuncentrJlies en chloorisotopenverhoudingen lt5l7CI) Deze protielen zijn cIecken mel de resultaten van een diffusie-sedimentalie model Hieruil kon worden gecondudeerd daL de zouten in de bovenste 125 m van de formaties het gevolg zijn van neshyrwaartse diffusie Uil de mariene Holocene sedimenten Dit impliceerde dat de opgeloste zoushy(ell op groterc diepten afkomstig zijn uil een andere bron Vermoedelijk bestaat deze bran uit dc Krijtafzetlingen op een diepte van ca 300 m waaruit zoui door opwaartse diffusie en lateshymle dispersie in de Tertiaire fonnaties zijn gedrongen
Aanvullend bewijs voor de erschillende oorsprong van de zoulen is gevonden in de ciltionconcentralies van het grondwater in de Tertiaire aquifers Grondwa[er in de bovenste aquifers ondieper dan 125 m heefL een oerschot aan Mg+- en Ca+-ionen (ten opzichte vun conservatieve menging) Oil overschot is in balans met een Na+-tekort en duidt op vershyIilting gepiard gaande met cation ui(wisseling Een chromalOgrafisch patroon in de catiomiddot Ilensamcnstelling zoals elders vaak h wailrgenomen bij verzilting onlbreekt hier Het pilroon kon redelijk goed worden gereproduceerd in hydrogeochemische modelsimulaties in een-dimensionaal diffusief stoflrausport en cationuitwisseling De simulaties lieten vershyda zien dal de cationuitwisseling voornamelijk in de Kwartaire klei plaatsvindt
Hel zoete en brnkke grondwater op diepten groter dan 125 m heefl een geheel andere lhemische compositie en wijst op een andere herkomst
AJgllIIlIIpound studies
He voorkomen van onderzees meleorisch grondwater ver uit de kust in Suriname is niet uniek Een inventarisatie van waarnemingen en studies elders (Verenigde Staten lildonesie China Nigeria Nederland) laat zien dat het verschijnsel eerder regel is dan uitshyzondering Mell kan onderscheid maken tussen twee typen offshore meteorisch water 0) water dat deel uitmaakt van een actief stromingsysteem waarbij grondwater aan land wortH aangevuld en uitstroomt op de zeebodem als diffuse kwel of in de vonn van onderzeese bron en (iil paleogrondwater dat niet langer wordl aangevuld en dus langzaam verdwijnt zoals voor de kust van Sunname
Simulaties met een simpel analytisch grondwatennodel (semi-confined aquifer mel een scherp zoeuzout grensvlak) tonen aan dat actieve stromingssystemen tot maximaal SO km offshore kunnen reiken Een hierop gebaseerd approximate analytisch modellaat zien dat aileen het kustnabije gedeelte van dit stromingssysteem (tot maximaal 5 krn uit de kust) zoet grondwater bevat De Jengte van de zoetwatenong wordt bepaald door de afstand uit de
kust waar de opwaartse onderzeese uitstroming zo laag is dill zout water door neerwaante diffusie tach de aquifer bereikt en daar convectieve dichtheidsslroming veroorzaakt
Tensloue zijn in deze studie een groot aamal simulaties uilgevoerd mel numerieke grondwltJlermodellen VOor variabele dichlheid mel het doel grondwaterverzilting in zijn algeshymeenheid te bestuderen tijdens een mariene lransgressie Transgressies zijn onderzocht in een model bestaande uit een aquifer onder een kleilaag met een hellend oppervlak Dit model kan vergeleken worden met een kustvlakte of cominentaal pial met een Oauwe regioshynale helling De simulaties lieten zien dat de transgressies in het algemeen zo snel verlopen daL hel ZoeUZOUl front de landwuilI1S schuivende kusLlijn niet kan volgen Verzilling na transgressie vindt voornamelijk plaals door neerwaarts tran~pon vii diffusie en convectieve dichlheidsstroming Meestallreden deze twee processen legelijkenijd op diffusie in de klei en convectieve dichlheidsstroming in de aquifer De dikte van de ifdekkende kleiliag blijkt van groot beling te zijn voar de integrale vel7iltingssnelheid
Gesuperponeerd op de regionual hellende kustvlakte van het LGM kenden veel gebieshyden 7oals Suriname en Nederland een erosielandsschap DaUlum zijn ook IrJnsgressiesimushylaties uilgevoerd met een model van zon erosielandschap bestaande uit een aquifer onder een kJeitaag waarin een rivier is ingesneden Uit de simulaties bleek dal heL meleorische siromingssysteem zich nog lang hundhaaft na inundatie van hel dal De opwaartse kwel in het dal of beler estuirium verhindert de verLilling Pas na volledige inundatie draiit de slroming om en dringt zout water naar binnen onder hel dal en wordt het zoete grondwater uitgedreven door opwaartse stroming naar de leebodem vii de kleilaag Hel meLeorische grondwater blijkl zich lang te kunnen handhaven tussen de rivierdalen
SIOIofllIerki1(11
Het groQtste gedeelle van de wereldbevolking woont langs de kus vaak in megacities In veel van deze gebieden vormt de walervoorziening een probleem dm aileen nog maar zal toenemen in de toekomst Er is le weinig grondwater of er vjndt al overexploitatie plaats en soms is hel grondwaler niel meer bruikbaar vanwege verontreinigingen De voorr-Jden matig brak meteorisch grondwater in offshore- en kustgebieden kunnen mogelijk alternatieve bmnshynen vormen in combinatie mel nieuwe en goedkopere OTItziltingslechnieken In hel geval van paleogrondwater is er weliswaar sprake van eindige hoeveelheden maar die zijn van een zodanig grote omvang daL winning nauwelijks als niet-duurzaam kan worden bestempeld Bovendien zouden deze voorraden loch langzaam verdwijnen door diffusieve verzilting
Verder onderzoek naar offshore meteorisch grondw21er is daarom gewensl Met een beler begrip van de omsmndigheden waaronder dit water kan ontstaan is hel mogelijk progw
noses Ie geven over hel voorkomen op bepaalde Jocaties Het voorkomen is zoals reeds gezegd eerder regel dan uitzondering met name in ondiepe zeeen ( lt 70 m) waar de eerste 300 monder de zeebodem bestaan uit afwisselend zand- en kleipakkeuen
Voor de exploratie is heL zinvol om geofysische detectiemethoden te ontwikkelen zoals tmiddot
l de combinatie van transient domain electromagnetics en hoge resolutie seismiek
ix x
Chapter 1
Introduction
II Background
Before joining the - then - Faculty of Eanh Sciences of the Vrije Universilcit Amsterdam in 1994 I worked 14 years in several countries as a consulting hydrogeologist Many of the projects were carried QuI in coastal plains among others those of the Netherlands Mozambique Arabian Gulf and Suriname In these areas I often observed groundwater salinity patterns and flow systems that did not comply with the classic concepts on coasLaI hydrog~ology Notably in Suriname where I worked from 1990 to 19941 was confronted with enigmatic phenQmena like unexplainable anesian heads stagnant bodies of fresh groundwater in deep aquifers near the shore but also saline groundwater bodies far inland (UNDPIWHO 1972 Groen 1998 IWACOIFR Harris 1991) Lack of understanshyding of these phenomena complicated groundwater exploration and management and led to overlooking of valuable fresh groundwater resources and unexpected salinization of wells
In the course of time the impression grew on me that the main reason for anomalous ob~ervations is that classical hydrogeological concepts of coastal plains do not account for geological events operating on large scales of time and space This refers specifically to elimiddot malic changes and marine regressions and transgressions during the last hundreds of thoushysands of years The effects of these events are still reflected in the present hydrogeological Slate Staled differently the ever changng geological conditions of climate topography and sea level appear to have prodLlced hydrogeochemical iSOlopic and even hydraulic head patshyterns in coastal groundwater which are not in equilibrium with present-day boundary condimiddot
lions because of the large relaxation times In that respect we find ourselves at a very specishy
fic point in geological history as a major sea level rise of more than 00 m took place a relatively shon time ago (12000 to 6000 years SP)
After joining the university I proposed to initiate a PhD study into these maUer The coastal plain around the capital of Paramaribo in Suriname (South America) seemed to be a suitable case study because of the availability of data Many eanh scientists and engineers investigated the coasta plain around the capital of Paramaribo especially during Dutch coloshynial times (Wong et aI 1998a Groen 1998) Also water supply mining and oil companies in Suriname were very cooperative in supplying well data and providing assistance in the field Investigations staned in 1995 after promotor prof dr JJ de Vries head of the hydroshylogy depanment of the Faculty of Eanh Sciences had accepted the proposal Dr H Kooi took on the role of copromotor
12 Objective and scope of the study
During the final stage of a PhD study it may be customary to write down objectives that fit the results This may give the thesis a straightforward and scientific appearance It is however not reali~tic to suggest that objectives and scope remained unaltered during this
7middotyear study In my opinion it is essential in science 10 show how the work took place and how and why objectives and scope changed
Iniially the objective of lhe PhD study was to unravel the rehnionship between the anomalous salinity age and flow panerns in coastal groundwater in Suriname and the geoloshygiciJl and paleogeographical development during the Last Glachtl Maximum CLGM) and the Holoce_ne The methodology consisted of conceptualising the paleogeographical and paleoshyhydrologiciJl development using existing geological proxy data and new chemical and isotshyopic groundwater dara Subsequently these concept~ and hypothese~ were tested by numerimiddot cal simulation models
The study area encompassed the 70 km wide sedimemary belt belween the Suriname llnd SaHnnaCCiJ Rivers (see Figure 31) Though initially investigations- were retricted to the lUilwl plain I soon hecarne intrigued by dati from offshore exploration wells in Suriname showing it body of low salinily groundwpler laquo 200 mgll) extending 90 km imo the Offshore sedimcnts~ I ~uspec(ed thai preenl and past onshore processes are intimately coupled to those il) lhe offshore domain and that consequently the latter had to be included in this s1U9Ymiddot _
Related to (his a larger time frame of about 120000 years including the end of lhe prcvmiddotpumiddot~Silngamonian (Eemian) trmsgreision and the entire Wiconsinan regression and HolCX~ne transgression appeared to be more suitable An even longer period would be neshyded in order (0 unswer questions about the genesis of deep groundwater(gt 300 m) However I refrained fmm considering earlier time inlervals because of the many uneertainties regarshyding lh~ Early Pleistocene and Pliocene paleogeography
Afterl had acquired ~ basic understanding of the hydrogeological characteristics of the Suriname cpnslal plain I wanted to know how exceptional this Case aClually was Thus I started to remiddotview data and reports from other coastal plains especially eoncerning the preshysence of fresh or-low-s~linity offshore groundw~ter There appeared 10 be striking similarishyties with the Suriname coast but also dissimilarities It was there that my research took a mort generic tum The review study motivated my colleague Hel1k Kooi and myself to devctlp malhemalical models in order to define the generic conditions which control the presence or absence of offshore low salinily groundwater and the salinization process in general
13 Structure of lhe thesis
Chapter 2 discusses some general concepts and definitions relaled 10 coastal hydrogeoshylogy which will be used in the follOWing chapters The remaining part of the thesis is divishyded in(l two parts in accordance with the objectives described above Part I (Chapters 3middot7) deltlls Wilh observations and interpretations related to hydrogeological processes in the coamiddot stOll plain of Suriname whereas Part II (Chapters 8-10) is concerned with generic processes in coastal plains Staled in other words Part I represents mainly the inductive phase and Part II the deductive phase of this research project
Part I Slans in Chapler 3 with a description of the present hydrological and hydrogeoloshygical condilions in the coastal plain around Paramaribo Chapter 4 presents a reconstruction of the paleogeography and paleohydrology during the last Wisconsinan (Weichselian) glacial and the Holocene mainly based on previous studies and proxy data A conceptual model explains how saline groundwater from the preVious Sangamonian (Eemian) transgression
has been flushed from the coastal and offshore sedimenl in Suriname This process is quanshytitatively evaluated by numerical groundwater modelling Chapter 5 deals with the salinizashytion process of the coastal sediments during the Holocene transgression The concept of the diffusive salinizalion process derived from chloride concenlration and chlorine isotope patshyterns is verified by mathematical modelling In Chapter 6 the hydrogeochemistry of the coa SIal sediments is investigated (0 provide additional clues for the freshening and salinizalion processes during lhe Wisconsinan and Holocene respeclively Special attention is given 10
calion-exchange processes Aho in this chapter concepts derived from analyses are evaluashyted by mathematical hydrogeochemical models Chapler 7 discusses the iSOlOpic composishylion of groundwater The groundwater isotopes shed more light on the paleogeogriJphic conshyditions in the coasml plain of Suriname notably that of climate vegetation and groundwater flow during the Lust Glacial Maximum (LGM) and the Early Holocene
Pan II SUlrts in Chapter 8 with an overview of Ihe worldwide OCLurrence of oFfshore groundwmer of low sulinily (meteoric groundwater) Then in Chapler 9 a model is presentshyed (0 calculale the offshore extension of meteoric groundwater driven by coastal flow systems This model helps to discriminate between recen submarine meteoric groundwa ter belonging to active flow systems and to fossil groundwater bodies formed during glacial low stands (paleogroundwater) In Chapter 10 a vC1riable density flow model is used to study salinity pauerns in time and space for situations in which saline water of high density overlies fresh water of low density The model is applied to 0) middotmiddotsteady state condition~
arising when fresh groundwater is driven by coastal now systems inlo the offshore C1nd disshycharged as submarine seepage and (ij) unsteady-stale conditions created by a sea enCroashyching a coastal plain
2 3
Chapter 2
Some concepts and definitions related to coastal hydrogeology
21 Groundwater origin and salinity
The salinity of groundwater is ellpressed in total dissolved solids (TDS) in mgll and chloride concentration in mgJ or mmolli The first is useful as it is directly related to the water density the second is appropriate because chloride as a conservatJve compound is a beuer tracer for the origin of groundwater and the degree of mixing finition of salinity classes and groundwater origins are n01 consistent in literature This stu y uses lee aisifi~
cation shown- belo)N In Table 21 13 ~ 3t-=-c---------------------------==-----------------t S Salinity class Origin TDS in mgll Chloride in m CJ C CJI
Fresh Pristine meLeoric lt 50 pound zB E Fresh Meteoric 0 - 1000 0 - 250 ~ ~ N~ Moderdlelybmckish Meteoric 1000-12000 250-7000 0 ~ bull Brackilh 12000 - 24000 7000 - 14 2 5 ~ ) CsoSaline Marine 24000 - ~4000 14000 - 20 Col l Q
0 000 _r ri~ Hypersaline gt ~4000 gt - __ t ~ Q ~ 1- =~ ~
Table 21 Groundwater salinity casses -g i t ff Meteoric groundwater is groundwater originated from precipitation that has intil a~ ~ ~ ~
in the soil either directly or indirectly from surfnce water In this study fresh meteori JE ~j groundwater which only contains salts from aerosol dissolution and normal rocklw e8 ~ ~ 4~
interaction is defined as pristine meteoric groundwater As a rule of thumb ground e-J ~_J (
with salinities less than 50 mgll of chloride can be considered pristine in most cons reas~ i Meteoric groundwater in coastal plains with higher chloride contents has generally n ~ Q influenced by diffusive and dispersive mixing with saline groundwater Because g wa- ~
ter looses its meteoric signature with increasing salinity this study has somewhat arbitrari y defined meteoric groundwater as groundwater having a salinity less than 13 of that of seashywater or less than 7000 mgll of chloride According to the definitions used here (Table 21) meteoric groundwater can be fresh to moderately brackish Marine groundwater is saline water defined as water with chlorinities between 14000 and 20000 mgll Note that pracesmiddot ses like evaporation (sabkhas) and dissolution of evaporitic rocks may also increase the salshyinity of meteoric and marine waters This implies that some saline and hypersaline waters may be of meteoric and not of marine origin These p~cesses are not considered here
22 Flow systems
This study adheres to the flow system concept described in Toth (19631995) De Vries (1974) and Engelen and Kloostennan (1996) According to this concept the sedimentary basin fonns a hydraulic continuum in which coastal topography and climate invoke a comshy
5 4
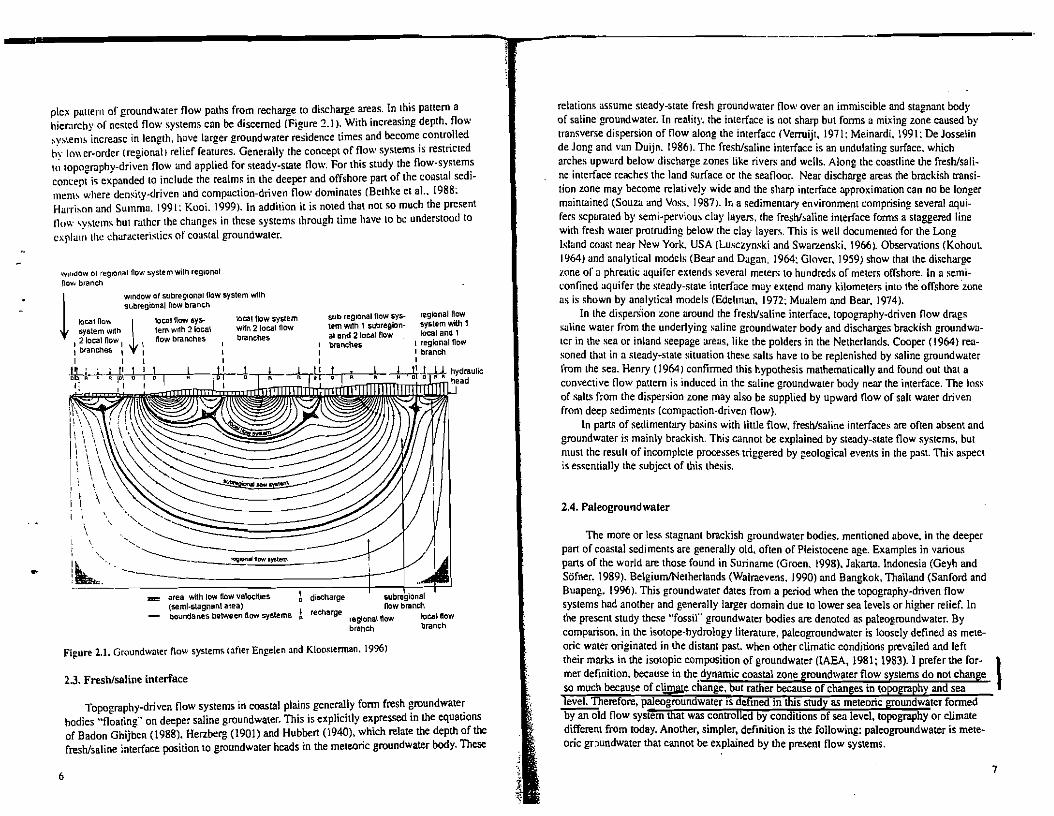
-----------------------------__------shyplex paneIll of groundwater flow paLhs from recharge 10 discharge areas In this pattern a hierarchy of nested flow systems can be discerned (Figure 21) With increasing depth now qenl~ increase tn length have larger groundwater residence times and become controlled hy lower-order (regional I relief features Generally the concept of no systems is restricted lO topography-driven now and applied for steady-state flow For this study the now-systems concept is expanded to include the realms in the deeper and offshore pan of the coastal sedishymem~ where den-itymiddotdriven and compaction-driven flow dominates (Belhke et al 1988 Harri~on and Summa 1991 Kooi J999) In addition it is noted thai not so much the present now w~tcm~ hut rathcr the changes in these systems Ihrough time have 10 be underslOod to expJu Ihe tharacleristics of coastal groundwaler
IwdOW oj regIOnal now system wilh regional nOY branch
Window of subreglonill llow system w11h
1 Sllbregional rtow branch
1012 now ~ local now sysshysysem w~h tem with 2loca
I 2 local now I now branches I branches I
I I I t~ Ll I~- R iQI--l--i-+----shybull I
lOcal now system with 2 local now branches
sub regional now sysshytem WIth 1 subregionshyalllnd 2 local now branches
di5Charge subregional now bllllnth
recharge regional now local now brahch branch
Fi(1ure 11 Gwundwmer now systems (afler Engelen and Klooslennan 1996)
23 Freshsaline interface
Topography-driven flow systems in coastal plains generally fonn fresh groundwater hodies flmuing on deeper saline groundwater This is explicitly expressed in the equations of Badon Ghijben (1988) Herzberg (1901) and Hubbert (1940) which relate the depth of the freshsaline nterface position [Q groundwater heads in the meteoric groundwater body These
6 i gt
relalions assume steady-state fresh groundwater flow over an immiscible and stagnant body of saline groundwater In realilY the interface is nOl sharp but forms a mixing zone caused by transverse dispersion of flow along the interface (Verruijt 1971 Meinardi 1991 De Josselin de Jong and van Duijn 19861 The freshsaline interface is an undulating surface which arches upward below discharge zones like rivers and wells Along the coastline the freshsalishyne interface reaches the land surface or the seafloor Near discharge areas the brackish transishytion zone may become relalively wide and the sharp interface approximation can no be longer maimained (Souza and Voss 1987) In a sedimentary environment comprising several aquishyfers scparaled by semi~pervious clay layers the freshsaline inlerface forms a staggered line with fresh water protruding below the clay layers This is well documented for the Long liland coast near New York USA (Lusczyniki and Swarlenski 1966) Observations (Kohout 1964) and analytiral models (Bear and Dagan 1964 Glover 1959) show that Ihe dlseharge zone of a phreulir aquifer extends several meters to hundreds of meters offshore In U semimiddot eonfined aquifer the steady-stale inlerface may extend many kllometers into the offshore zone as is shown by an~lytical models (Edelman 1972 Muulem and Bear 1914)
In the disperSion zone around [he freshsaline imerface topography-driven now drdgs saline water from the underlying saline groundwater body and discharges brackish groundwashytcr in the sea or inland seepage areas like the polders in the Netherlands Cooper (1964) reashysoned that in a sleady-state situation these salts have to be replenished by saline groundwater from Ihe sea Henry (1964) confirmed this hypothesis mathematically and found out that a convective flow patlem is induced in the saline groundwaler body near the interface The lms of sailS from the dispersion zone may also be supplied by upward now of salt water driven from deep sedimenls (compaction-driven now)
In parts of sedimentary basins with little flow freshsaline interfaces are often absent and groundwater is mainly brackish This cannot be explained by steady-state flow systems bUI must Ihe resull of incomplete processes triggered by geological events in the past This aspect is essemially the subject of this thesis
24 Paleogroundwater
The more or leslti stagnanL brackish groundwater bodies memioned above in the deeper part of coastal sedi ments are generally old often of Pleistocene age Examples in various parts of the world are those found in Suriname (Groen 1998) Jakarta Indonesia (Geyh and Stifner 1989) BelgiurnlNelherlands (Walraevens 1990) and Bangkok Thalland (Sanford and Buapeng 1996) This groundwater dates from a period when the topography-driven flow syslems had another and generally larger domain due 10 lower sea levels or higher relief In the present study these fossil groundwater bodies are denoted as paleogroundwater By comparison in the isotopemiddothydrology literature paleogroundwater is loosely defined as meteshyoric water originated in the distant past when other climatic conditions prevailed and left their marks in the isotopic composition of groundwater (lAEA 1981 1983) I prefer the forshymer definition becaus~ in the dynamic coastal zone groundwater flow syslems do not change so much be~use of ell e change but rather because of changes in to h and sea ~erefore paeogroun water IS e me m s study as meteoric groundwater fonned by an old flow system that was controlled by conditions of sea level topography or climate different from today Another simpler definition is the following paleogroundwater is meteshyoric gTJundwater that cannot be explained by the present flow systems
1
7
Part 1
Case study of (paleo )groundwater in the coastal plain and contishynental shelf of Suriname
9
Chapter 3
Hydrology of the coastal plain and continental shelf of Suriname
31 Introduction
Suriname is situated in South America between In NL and 6deg NL and is bordered b) Guyana in the West French Guiana in the East and Brazil in the South (Figure 31) The Atlamic CO~sl has a length of 350 km Suriname has been a DUlch colony it gained indemiddot
Atlantic Oceen
o HlIalne ITIoIrlne depoamplll Ell ~llaquoene marine deposits bull ~ ClIIIlInenlaI deposits
frJ AMatIIe depoIIla (undlll) ~ Buemtnt rockI
FigUre 31 The coastal plain around Paramaribo Suriname
10 II
pendeme in 1975 During colonial times the physical environment has been studied extensimiddot vel) because of lh~ mineral resources (gold bauxiLe and oil) Hnd the high agricultural proshyduclion of the coustal pluin (Wong et-al 1998a) The populCllion IS about 400000 of which 200OUO ure living in und around Paramaribo The capitClI alwClys relied on the groundwmer i1~ a resource for drinking~water supply because of saline water intrusion in the coastal rier Groen (1998) reviewtd the hydrogeological investigations thal were carried out in the coa~tal plain during Ihe ICl~t century An imponant lheme in these investigations was the complicated groundwater alinity pattern in lhe coastal aquifers This chapter presents an ou(lin~ ul the geology lhe present climate and hydrology and the basic hydrogeological cha~
ralICrislics as ubserved today
32 Climate
Surinamt has a wet tropical dimale with an average annual tempemture of 271 uC and [nlal rainfall of 220b mOl at Paramaribo Seasonal temperature varialion is small the maxishymum difftrence of-monlhly averages is 2 ue Daily temperature fluctuates between an avenlshyge daily maximum of 305 uC andan avemge daily minimum of 228 tlC Seasons are marshyked by the rainfall paUern shown in Figure 32 There is a long miny season from April to mid-Augusl followed by a long dry season until Dectmber Less predictable both in timing lid amoum of rain are the shon rainy season in December and January and the hon dry e~lson in February and Murch -Qry hns a relative meaning because even during the long dry seasoll rainfall at Paramaribo is generally higher than 70 mmmonth
350
E 300E 250 ~
~ 200
~ 150
a
gt
C E 1~~ 11 11 I
o -LLlIILJooJc-JOIUOu
o rainfall pan evaporation-----_
FijUre 32 Rinfall and pan evaporation al Zanderij airpon Surin3me
The rainy seasons are related to the shifting InLer-Tropical Convergence Zone (ITCZ) The ITCZ the average position of which is at 50 NL the meteorological equator passes Suriname twice a year During the long dry season from August until December the ITCZ is at its most northern limit and southeast trade winds prevail During the rest of the year the ITCZ lies over or just south of the study area and northeast trade winds prevail Pan evapomiddot
12
ration at Paramaribo varies from 100 mmmonth during the long rainy season to 170 mm in the long dry season (Figure 32)
33 Landscape
The major pan of Suriname is underlain by the crystalline rocks of the Guiana Shield forming a hilly landscape with tropical rainforest In the north of the country a belt of clastic sediments stretches along the Atlantic coast having a width of 70 km in the study area near Parclmaribo Many earth scientists and biologists have investigated the sedimentary landscashype in delaii (Cohen and Van der Eyk 1953 Van der Eyk 1954 1957 Zonneveld 1955 Lindeman and Moolenaar 1959 Brinkman and Pons 1968 Veen 1970 and Teunissen 1978) The sedimentary landscape can be divided imo three geomorphological uniLs the savannah bell Ihe old or Pleistocene coastal plain and the young or Holocene caas-IUI plain
The 20 km wide savannah belt in themiddot South forms an undulating landscape on Pliocene sands (Figure 31) Elevations vary from + 10 m (relative to mean sea level) in the North to + 50 m in the south Despite its name only 30 of the savannah bell in the project area is covered by typical open savannahs with grasses sedges and low bushes (Teunissen 1978) Most vegetation eonsists of xeromorphie dry-land forest and savannah woodlands Characteristie blaek water creeks bordered by swamp and gallery forests dissect the savanshynah belt Apan from zanderij airpon human impact is small in this sparsely populated area Despite the tropical climate savannah vegetation can persist because of the low moisture retention capacity and nutrient content of the coarse sandy soils and the regular burnings by the Amerindian population
The actual coastal plain north of the savannah bell is much different the flat marine plain is primarily underlain by clays with elongated East-West running beach barrier depomiddot sits (ritlten) as the main morphological features The Pleistocene pan of the coasLal plain is a 25 km wide zone between Zanderij airpon and Lelydorp with elevCltions between +3 to +10 m (Figure 31) The plain is an assembly of clay plates (schollen) dissecLed by numeshyrous swamps and creeks filled with Holocene clay and peat The plain was probably formed during the Sangamonian transgression and later dissected during the Wisconsinan regression (Veen 1970) Between Lelydorp and Rijsdijk road Pleistocene beach barrier deposits have coalesced into an elevated complex (+6 to +10 m) called the Lelydorp sands (Figure 31) Swamp grasses and swamp forests cover the inaccessible and marshy pans mainly in the south while dry-land forest is found on the bener-drained pans In the rest of the area and especially on the Leldyorp sands the original dry-land forests have disappeared by settleshyments and activities like agriculture forestry and cattle breeding Most of the old plantations have been abandoned and are presently overgrown by secondary vegetation In the area betshyween the Rijsdijk road and Paranam the landscape has been strongly affected by the large and deep bauxite mines and the bauxite refinery at Paranam Nowadays the abandoned mines fonn large lakes
The Holocene plain elevated at +1 to +3 m has a width of about 25 km Locally it penetrates deeply southward along the valleys of the Suriname and Saramacca rivers (Figure 31) This pan of the coastal plain has lost most of its original character because of agriculshytural activities settlements and especially the expanding city of Paramaribo The vegetation was fonnerly marked by dry-land forests on th~ beach barriers and better drained pans of
13
the clayey plain and by swamp forests on the low-lying pans Grasses and shrubs dominate the recentlv formed land (after I ka BPJ North of [he line Groningen-ParamariboshyCommewijne River where oils slill contain brackish water
The continental shelf slopes with a gradient of aboul I 2000 to a depth of 50 m aboul 100 km offshore (Figure 33 and 44) Then the gradient increases to I 800 until it reaches he shelf break ul a deplh of 100 m about 140 km offshore where the gradient increases to ilhoul 120 10 I 100 Remarkable morphological fealures are remnants of the Plei~tocene palemhannels or the major rivers like (he Marowijne (Nota 1971) and old coastlines and
depth 01 the sea noor -
-Atlantic Ocean
~OM~bull
-- IOmIDCO I-
coral reef~ reluled 10 interruptions of [he Holocene transgression (Nota 1958 1971)
Figure 3bull Geology and calchmenls llf major rivers llong Ihe Guilna coast (~rler Bosma el al IYl~) III GrJnulil~ belts () Amphibolilt flcier of I (3) low-gr1de meIOl~lmenls (4) Greemaonc lldts I~I Acidmiddotint~nl1edialt meluolcanics (61 Granitoid rocks (71 Roraiml SlndSIOnes (Prccumllrianl fftl Phanero7oic stdiments
34 Geology
34 General
The crystalline basement of Suriname is pan of the Guiana shield (Figure 33) and conshysists mainly of granitoid and metamorphic rocks (De Vlener et al 1998) Metamorphic rocks (Marowijne Group) underlie the northern part of the catchments of the Saramacca and
Suriname riers (Figure 33) and are also encouOIered in boreholes in lhe coastal sedimemiddotnta ry zone The clastic Mesozoic and Cenozoic sediments in the coastal zone and lhe continenmiddot tal shelf are pan of the Guiana Basin which extends from the Wain River in Guyana [0 the Marowijne River in eaSlern Suriname (Figure 33) The sedimems are described in more detail in Annex I (see also DAudretsch (953) Brinkman and Pons (1968) Veen (1970) Krook (1979) Hanou (1981) and Wong (1984 1989) Sedimentation in the Guiana Basin stuned in Late Juraiisic to Early Cretaceous limes when [he African and South American shields began to drift away (Wong 1976)
The stratigraphy (Figure 34) consists of a series of formations increasing in thickness and depth towards the nonh and onlapping (he basemenl rocks or older sediments (Figure 35) The thickness of the sediment wedge increases from a few meters in the savannah belt to 750 m along the coastline llnd fmlllly to 10000 m aboul 140 km offshore (Wong et a 1998b Figure 36) The material for the subsiding basin was derived from the conlinuou~ly
AQUIFERS
confined aquifer between Paranam and lelydorp (Onventadlll and in Hal coastal plain (Saramaoa) nO fl8Sh Willer
phrealic aquifers in sand and shell ridges In
Holocene COlIstal plain mostly fresh
fine and medium
confined aquifer in coaslal plain freh below bull lelydorp sands and Hal coastal plain south ~ ofvelbindingsweg
unconformity
FORMAshyTION
HOLOmiddot CENE Mn
PlEISTOshy shyCENE
PUOshyCENE Mloshy
co- CENE -
~bullOLIGOshy CENE t ~
EOCENE
PAlEO- I jCENE ~ bull
LATE CRETAmiddot CEOUS
Figure 34 Stratigraphy of the coastal plain of Suriname
15
RepubliekSavanna
XXXXXXl(XXX)(XXX _~xxxxxxxxxxxxx X
700
600
500
400
300
200
00
South
in E
1) c i a E ~ c Q
~ W
middotmiddot~xxxxxxxxx xxx xxx Vl(XXXXX XXXXXXXlC xx
~xxxxxxxxxxxxxxXX
Chloride concentration in mgll
H Holocene Mara and Coronie Fm
Pis Pleistocene (Coropina Fm)
Q Quaternary
PI Pliocene (landerij Frn)
M Miocene (Coesewijne Fm)
o E
Oligocene (Burnside Fm)
Eocene JOnverdacht Saramacca
P Paleocene Alliance Fm
c Cretaceous (Nickerie Fm)
17
North Allande OCean
Fgure 35 Nonh-South geological section with groundwater salinities near Paramaribo Suriname
Paramaribo
pound Chloride contents from q geophysical welllOQs
iChloride analyses of groundwater
Horizontal scale
bullbull v x x x x x x x x x t~~1~~t~~~~xocxxxx IoXXX)(XlClltK
ql__1L_p~_1(_~2pkm ~==YVVVVV~lC Crystalline basement x
x x XlC lC lCi~s~( lC lC X lC
XXX))( xx xx
~ )( )( )( )(
lCXXlC
~ ~ t----~~
~ ~r--~ lOlXXX
Geoelectricallt x x x x sounding x wlth resistivimiddot (lC)( Ie lC
tylayers ~)( )( l()( X
lC)(XXX(xxxx
XXXI( lC lC )o()e
(lC)( xx XXXX) l(XXXX
bull lC)( lC x)( xxxxx ~ lC lC )( )( X
X)(XXlC x)( xx xxxlC bull x x)(
xx xxll
Lelydorp
16
rising crysLalline basement south of the basin (Krook 1994) After the Early Miocene the Amazon River became a more important source of supply (Wong 1976 Krook 1979) Before thm lime when the Ande~ Mountains were not yet formed drainage on the South Americm continent wa- directed towards lhe West (Krook 19791
Soulh
Brownsberg No 500 _=== ~== =_== = 50middot1 MO-1 GLOmiddot1
MI
Upper Cretaceous
basement estlmated et10000m
Oligocen
Ii~urc 036 Offshore g~nl()gy (lnCr Wong c( al 199Rbl
3-1 (rewccof lilt n1tiury
lhe Crelaceous sediments in the coaltltal plain consist of terrestrial unconsolidated and consolidated lineto very coarie sands and kaolinitic claystones of the Nickerir Formation
During the Paleocene and Eocene mlinly shallow marine deposits were deposited during seveml transgressive phases Three formations are distinguished with differenl facies (Wong 19R6 1989) the conlinental I to 40 m thick Olleroacht Formatio1l is charaeterized hy coanc kaolinilic sands and kaolinitic clays deposited on alluvial fans and in braided rin~rs during Ihe Paleocene and in floodplains and coastal swamps during the more humid lropiCil1 Eocene In the study area the formation can be found as isolated buried hills capmiddot ped hy bauxile and laterite in a 10 km wide small zone around Onverdacht and further CilSWard The Onverdachl Formation passes nonhward into Saamacca Formation found helween lh~ Groningen-Lelydorp line and the coastline (Hanou 1981) The formation conshysists of alternating quanz sands and kaolinitic clays fonning depositional cycles with altershy-nming marine and continental environments The formation contains thick and continuous sand unils which enable deep groundwater circulation Oil in the Tambaredjo oil field is recovered from one of the lower sand units (T-sands) which is confined by an impermeahle clay layer The top of the fornlation is found at a depth of about -140 m (below msll just North of Lelydorp and slopes to -20 m along the coastline West of Paramaribo Further Nonh the Saramacca Formation changes facies and passes into the marine Alliallce Forlllarioll This formation consisting of silty marls c1a)s calcareous sands and lignites is much less permeable Weathering during a prolonged recession in the Oligocene led to bauxite formation on the Onverdacht formation and crystalline basement rocks Erosion proshyducts were deposited as braided-river and alluvial-fan deposits forming the Bumside Fonllatioll (A-sand aqUifer) In Suriname the formation is found in some northeast-southshywest oriented tecronic basins along the coast like that of Paramaribo (Hanou 1981) The Burnside Formation has been eneounteredjust North of Lelydorp at a depth of -130 m
-~
19681
343 Quaternary
tional centre 10 to 15 km West of Paramaribo
m at Republiek to 35 m along the coastline
North of Paramaribo near the coastline the rop of the formation is found at -180 m The coarse permeable sands of Burnside Formation vary in rhickness from 5 to 80 m in a deposishy
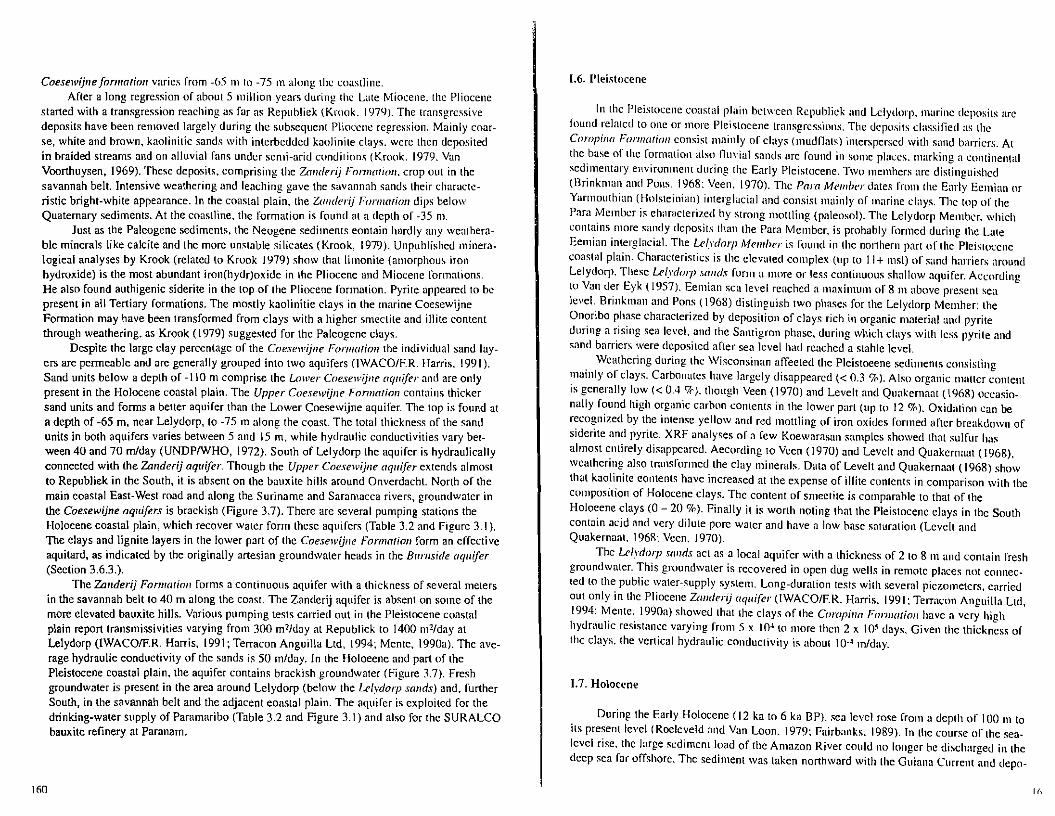
During the Early Miocene two major trangressions led to deposition of clays sandy clays and sandi with glauconite and lignite layers ltCotnIijllt Fomlatioll) Compared to Ihe older formations the deposits of this formation contain much more clay (40-80 k) originashyling from the proto-Amazon catchment The lower more clayey part of the Coesewijne Formation is found only in the Holocene coastal plain at a depth of uround -95 m The upper more sandy purt extends ac far south as lhe Rijsdijk Roud in the Pleistocene coasLul pluin though it is absent on Ihe buried bauxite hills around Onverdacht The depth of the lOp of lhe Coeiewijne Formalion varie5 from -60 m in the south 10 -75 m On the continental shelf lhe facies of the Coesewijne Formution chunges into a shallow-murine carbonate platform
The Pliocene sedimeOls expoied in the savannah bell consist of coarse white and brown kaolinitie sandi with interbedded kaolinile clays and were dcposited in braided streshyams and alluvial fans (Krook 1979 Van Voorthuysen 1969) Inlensive weathering and leashyching gave the savannuh sands their chamcterislic bright-white appeanlOce Nonh of the savannah bell the Zanderij Fomation is covered hy Quaternary clays with a thickness of 4
During a Pleistocene probably the Sangamonian transgression tidal lagoon c1uys intershyspersed with sand barriers were deposited These sediments form the Campiml FOn1lC1ticm and are found in the Pleistocene coastal plain between Republiek and Lelydorp The sand barriers found mainly in the nonhern part of the Pleistocene coastal plain form now a more or less continuous blanket of sands The Wisconsinan regression led to erosion of the Pleislocene surface in the coastal plain and the present offshore zone Veen (1970) and Roeleveld and Van Loon (1979) found several gullies in the Pleistocene plain filled with Holocene deposits to depths of 10 m below the present surface The present author found evidence that Ihe paleochannel of Ihe Suriname River near Paramaribo wai deeper than 30 m This is based on the results of two boreholes drilled for this study (Chapter 5) and on some unpuhlished well logs and cone-penetration tests The Pleistocene clays show signs of deep weathering during the Wiseonsinan regression (Veen 1970 Levell and Quakernaat
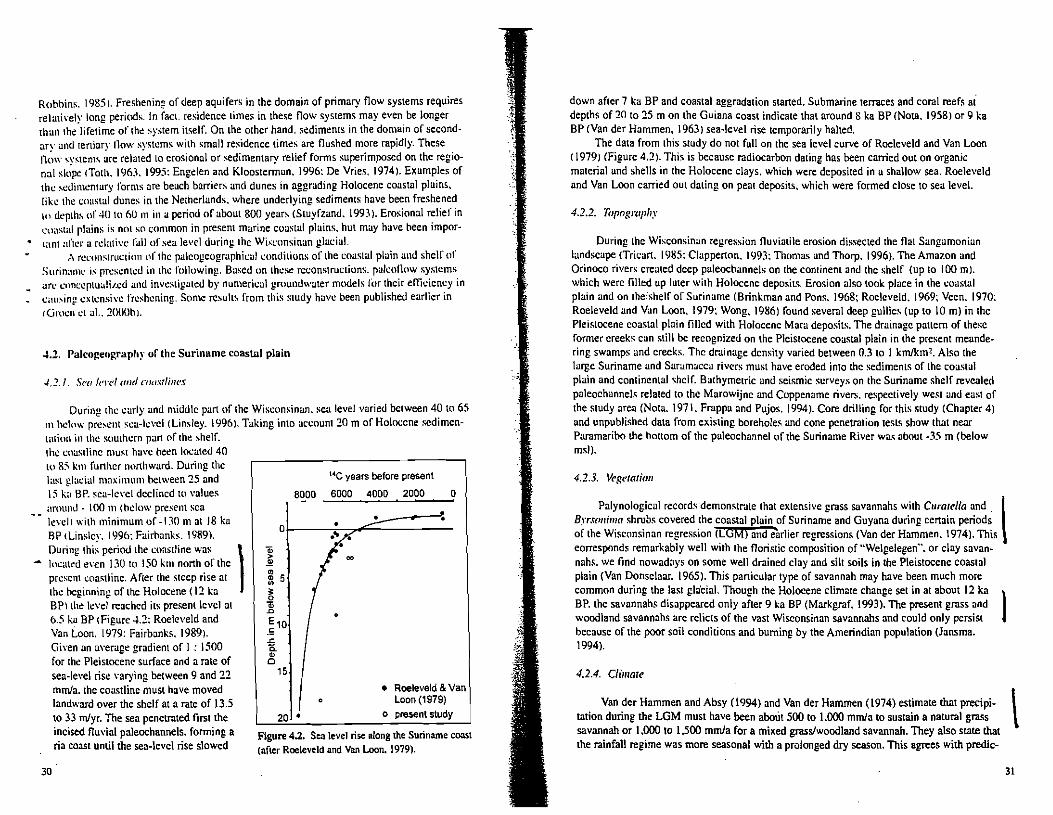
During the Early Holocene from 12 to 6 ka BP the sea level rose from a depth of more than 100 m lo the present levef (Roeleveld and van Loon 1979 Fairbanks 1989 Figure 42) Marine deposition resumed and obliterated most of (he Pleistocene erosion topography Beeause the Holocene transgression did not reach the level of the previous Sangamonian transgression the Pleistocene coastal plain in the south was preserved though the gUllies were filled with the peaty clays of the Mara Fonllatoll and can still be recognized as swamps After sea~level rise slowed down between 6 and 7 ka BP coastal aggradation began and extensive tidal flat clays alternating with beach barriers with sands and shells were deposited in the Holocene coastal plain (Corollie Fonllation) Brinkman and Pons (1968) discerned three distinctive phases in the coastal aggradation the Wanica phase from 6 to 3 ka BP the Moleson phase from 25 10 J3 ka BP and the Commewijne phase from 1 ka BP to present The main pan of the Holocene coastal plain in the study area dates from the Wanica phase Only North of the road Paramaribo-Groningen and the Commewijne River
19 18
recem deposits of the Commewijne phase are found Coastal aggradation is still going on in Ihe littoral zone rapid sedimentation is taking place on moving mud banks (Augustinus 1978 Augustinus el al 1989) Oceanographic surveys show thatthese Holocene mud deposhysits are found on the sea floor up 10 30 km offshore and have a maximum thickness of 20 m INOla 1958 1969)
35 Runoff and recharge
351 Tile SllWIIUlh belr
Rainfall runoff processes have been investigated by Poels (1987) and Brouwer (1996) in small catchments in the savannah belt Poels (1987) studied ltI catchment near Kabo west of (he study area und Brouwer (1996) a savannah catchment in Guyana Both authors report thaI despile the frequent high-intensity rainstorms surface runoff is a small component of lowl runoff laquo 10 9) because of the sandy subsoil and the low surface gr-Jdients Rainfall leaves the catchment mainly via evapotranspiration while the rest is drained by perennial and ephemeral creeks (Table 31) Rainfall is tran~formed in river flow by (1) fast runoff just below or on tbe surface here called interflow and (ii) slow runoff by groundwater which is equal to groundwuter recharge Chemical analyses of peak flows indicltlle that fast runoff is not much ltlffecled by evapotranspiration On the basis of simple water and chloride mass halances using average data of these catchment studies rechltlrge values can be eSlimated
P-E=Q (31 )
Q= Rrlr + RiAl (32)
PmiddotCldh = RrrtIo Cl~m +RIIt middotCltallt (33)
where P = precipitation E actual evapotranspiration Q = creek discharge Rfl(J = ground~
water recharge and Ril =interflow All these fluxes are in mma Clm and Clllrrnmltl are the thloride concentrations of rainfall (and interflow) and groundwater recharge respeclively Equations (3 l (32) and (33) lead to the following relation where groundwater recharge is expressed as a function of measurable variables
(34)
The results for fast and slow runoff are presented in Table 31 For verification Clriltr
can be calculated and compared with the average measured value according to
R CI R CICl m=Omiddot n+Q taw (35)
Variables Kabo (Sur) Mabura Hill (Guy) (1980-1982gt C1991-1992)
Mepsured P mmlaJ 2200 2480 Q ImmJa) 590 1040 Cnln(mmoll) 0025 0023 Clf~mJ ImmolI) 0156 0093 Co (mmolI) 0gt00 0073
Cllcuhucd
R (rnma) 290 570 Rof (rnma) J(Kgt 470 Cmn (rnmoll) OOll2 0055 -------shy
Table 31 Water blllances of calchments in the savunnah belt based on chloride rnas balance DatJ for Kahn are from Pucls (1987) and data fOr Maburo Hill from Brouwer (996)
J
The results (Tlblc 31) how that groundwater rechurge varies between 300 and 500 mma Becltluse the savannah bell in the study area has a relatively large percentage grltlsCs and shrub vegetation a value of ~ mlseems more likely and has been used for groundshywaler modelling According 10 iJampS (I ) and Brouwer (J 996) cutchmentloses by deep groundwater flow are negligible This implies that lhe rechltlrge in the sltlvunnah belt does not feed the Tertiary aquifers in the coastal plain This is corroborated by ltl groundwater mOdelshyling study by Post (1996) Groundwater rechargc appears to take place mainly during the long rainy season observalions of phreatic groundwater levels in the savannah belt (Weyerman 1930 Heyligers 1963 UNDPWHO 1972) show large fluctuation (25 (0 3 m) with maximum levels at the end of the long wet season and minimum levels at the end of thc long dry sea1ion Eff~infall which is equal to rainfall minus actual evapotran~pishyralion i~ positive only durilg the lolsect rainx season This can be inferred from Figure 32 where monlhly rainfall and pan evaporation are shown It is noted that actual evapotranspishyration in the wet tropics is close to potcntial evapotranspiration (Bruijnzeel 1990)
352 Till coastal Iain
Catchments in the flat coaslal plain are not as well defined as in the savannah belt Effective rainfall on clayey lerrain is mainly discharged via overland flow and interflow to swamps creeks and man-made drainage channels Typical for the clay terrain is the kawshyfoetoe surface consisting of little hummocks (01 to 03 m2) separated by small drainage channels (01 to 02 m wide) Even with small topographic gradients such a terrain enables fast overland drainage during heavy rainstorms Phreatic groundwater flow systems cannot develop because of the low permeability and flat topography The more permeable and slightly elevated beach barriers have higher infiltration capacities and sustain small groundshywater flow systems Relatively large phreatic flow systems are found in the Lelydorp sands where drainage density is much smaller than in the rest of the coastal plain
20 21
36 Groundwater
36 J Aqlltrl (lIId (lqUilllld
Only a oeneral descri lion of a uifers and a uitards in the coastal lain of Suriname is given (Annex provides a more de al escrip Ion e most imponam aquifers are found in the Teniary formations The deep Eocene and Paleocene Saramacca Formation in the Holocene coastal plain around Paramaribo have not been investigated much in earlier hydroshygeological sludies (Figure 35) Oil exploration drillings show thaI this formation comains thilk sand units but these are saturated with brackish groundwater The coarse sands of the Oligoltene Burnside Formation form a wellmiddottlefinetl und interconnected unit and have good aquifer propcnies Groundwater in this aquifer is recovered by pumping stations in Panmmriho fur tlrinking water supply (Tahle 321 In hydrogeologiralliterature this aquifer is also known as the Amiddotsantl aquifer The massive Cnesewijne Formation consists of ahemashyling days anti santllbullIyers Sometimes a tlislinclion is made between upper and lower CUlscwijnc aquifers though the aqUifers are not well defined The sunds of the upper Cocswijnc Formation which have the best aquifer properties extentl southward into the PhislOcenc couswl pluin where they link with the overlying Zanderij Formation (Figure 35) Thc Cnesewijne sands ure also exploited in some smull pumpingslUtions in and around Pilnllnariho (Figure 31 anti Table 31) The Zanderij Formution contuins muinly sands and forms u good aquifer which is presem in the entire study urea Sund barriers (dlsen) in the Cnropinu and Comnie Formations form shalllgtw phreatic uquifers of local extent
The lined-graincd compacted Cretaceous deposits act as an aquitard Modem and pakol1(lY systems were not able to flush saline groundwater from these depoiits (Section 541) The clays hetween the Burnside and Coesewijne aquifers probably form another imponam uquitard as is derivcd from the originally anesian groundwater heads (Section 363 l Also clays below the Burnside Formation are believed to have a high hydruulic resistance as the sulinity of pumped water in the well fields only slowly increaies due to lateral advection rather than hy upward now from the more saline deeper strata The QilitCfIl1ry marine clays exposed in the coastal plain form an aquitard with a high hydraulic resislmce as wa observetl in pumping testi (Mente 1990a IWACOIFR Harris t991 Terracon Anguillil Lid)
362 Groundwater miJlity
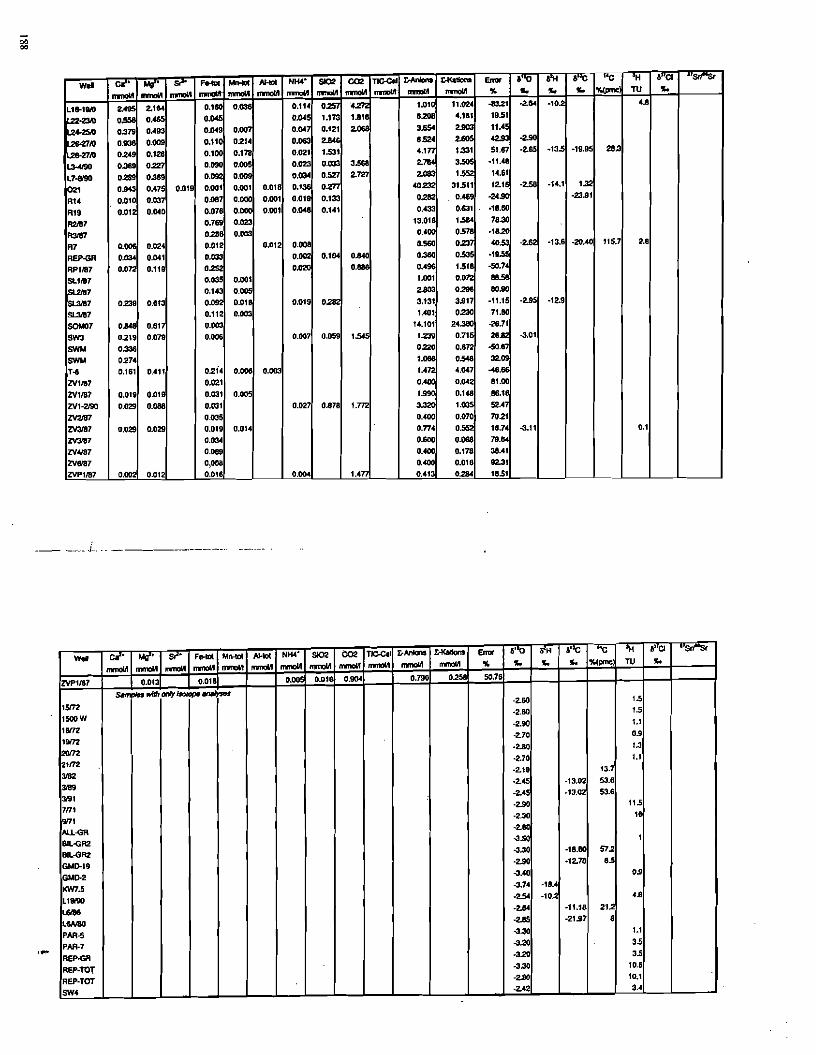
The salinit patlem in thc coastal sediments has been studied before in exploration stushydi for the drinking waler supply (Groen 1998 lWACOIFRHllITis 1991 UNDPIWHO 197) Figure 37 (from Groen 1998) shows on I) the extent of fresh groundwater (chloride coment lt 200 mgll) in the various aquifers Therefore a more detailed survey has been carmiddot ried Oul ltGroen el al 2000a) [0 delineate the salinity contour lines in a Nonh-South and Easl-West section (Figure 35 and Figure 38 respectively) These salinities expressed in mgll of chloride are based on laboratory analyses of water samples from observation and pumping wells and stem tests (exploration drilling) and estimated concentrations from venishycal geophysical soundings and geophysical borehole logs
In the Holocene coastal plain brackish and saline groundwater with chloride concenshytrations exceeding 2000 mg1 is found in the upper 30 to 100 m of the coastal sediments and
shows a deepening trend towards the nonh Saline pore water in the upper pan of the
22
Figure 37 Fresh groundwaler in the coastal aquifers of Suriname around Paramaribo (from Groen 19981
Holocene coastal plain salinity has been panly nushed The depth of freshening depends on the time of retreat of the sea (Brinkman and Pons 1968) and the penneashybility The sandy beach barriers in panicushylar contuin fresh groundwater lenses which were exploited by open wells before public water ~upply was established in 1933
The Teniary sediments contain relatishyvely fresh groundwater of meteoric origin The Nonh-South section of Figure 35 shows that an actual inlerfuce between fresh and saline groundwater does not exist near the coastline as hydrogeo1ogisLio feared in the past (Groen 1998) Groundwater increases only very gradually in the seaward direction Groundwater with low chloride content laquo 2000 mgll) extends even 90 km inlo offshore shelf deposits Fresh potable water with chloride concentrations below 250 mgll is found South of Paramaribo though the panem diffe~ for the various aquifers (Figure 37) In the far South of the coastal plain pockets with brackish ground water are found These are probably related to the shon incursion of the sea in the incised Pleistocene valleys around 6 to 8 ka BP when also the Mara deposits were formiddot med (Roeleveld and Van Loon 1979 Groen 1998) Pristine groundwater not affected by salinization (CI lt 50 mgll) is found below the active recharge areas of the savannah belt and the Lelydorp sands (Figure 35)
Highly mineralised brackish and saline water is also found in the Cretaceous sedishyments in the lower part of the sedimentary wedge at depths of about 300 m (Figures 35 and 38)
23
I
bull observations 1950-1957 o observations 1970-1972
12 10
bullbullbullbull
Burnside aquiferg bull D
bullE bull E ~ o CD dOrawclown Q 8bullbull~ bypumplng cr~ --0_
Repubhek lelydOfP para nbO_2L__~LI -----------_ o 10 W ~ 40 ~
distance In km
Figure 39 Northsoulh section wilh groundwalt~r hcuds bcfore the sub-reccnt or pre-pumping pcritxl (after UNDPIWHO 1(72)
OSlO KIn AUenlic Ocesn O 5 IOKmAllentic Ocean ---- ------shy ---shy
r-------~_
_
If--H=~~~ bnderj quilet kI 1990 lie8ll11r11lle Bumamplde llqUfM In 100 llll mflllh rnped Lo IN Iorwl101 In _ rnped 10 IN Q
He8IIl kith Zenderlj equder bIIrOte IlltIftll)shyGrIIunct-lM pumping Il8lu1s (Table 32)
IOllkll~
LIrnll eumslde aqulor Grvunctwater ~ 11lI1iona crable 32)
Figure 310 Piezometric heads in Zanderij aquifer in 1990 and 1950
Sub-recent groundwater heads (Figure 39) and groundwater modelling result~ (Figure 310 Groen 1998~ Post 1996) showed that the remaining paI1 of the groundwater In the Teniary fonnations was essentially stagnant before large-scale pumping suued ~e present natural flow systems cannot explain the genesis of this stagnant and more nune~lsed par of the groundwater which therefore is denoted as paleogroundwater Indeed earher studIes (UNDPIWHO 1972 Verleur 1991) showed that this groundwater dales from the Last Glacial Maximum to Early Holocene (30 to 8 ka BP In the next chapter a more detailed
West Tambaredjo
011 field
2C-S 010 T17 TA27
East Peramalibo Sulit7Stne Commewf1s AllianceEslUsty
W04 Pb9 JKS RiY
KRI TPS
Crystaline basemenl
near Parnmaribo Suriname
~ bullbullbullbull0 ~
E -lt ~
Dbull
o
100
200
300
400
SOo
500
700
Fi~urc 38
gt( IClClClClClClC
lt lC lC lC lC lC lC lC lC lC ltXlClClC
lClClCgtI lCgtI)I)I
lC IClClC )1 lC lC)I
o r 19 15 ~Okm lC~=)llCllt lt)llC)I)I
lt)I)I)llCgtHorizonlal sce1e
For legend see Figure 35
Easl-Wesl gcological section with groundwater salinitre~
363 GIOlllldllmiddot(terj1mlmiddot sysrelll~ i1 tle Tertiaryformations
The groundwater flow systems in the Pliocene sands of the savannah belt are local ~ystems a- discussed above Groundwater from this zone does not reach the Tertiary aquishyfen ill the coaslal plain Also in [he coastal plain local groundwater flow systems do not extend into the Tertiary formations either because of the high hydraulic resistance of the Quaternary clays Moreover sub-recent heads in the Tertiary aquifers were equal to or higshyher than the phreatic water levels (Figure 39) An exception is the broad complex of sand barriers near Lelydorp The elevated terrain and low drainage density there lead to relatively high groundwater levels even higher than the heads in the Pliocene (Zanderij) aquifer (Figure 39) Given the hydraulic resistance of the Quaternary clays a downward flux or recharge of 10 to 30 mm1a is estimated In this area a flow system has developed in the Pliocene aquifer Groundwater modelling (Post 1996 Groen 1998) showed however that thisgroundwater isdischarged locally by seepage into the bordering creeks and swamps
25 24
allount is gien of the past flow ~ystems which to the formation of paleogroundwmer Pumping hy well fields in and around Paramaribo during the lasl 40 years has led to
large declines in regional groundwater heads uP to5 mI and dominates the entire flo fi~ld in th~ coastal plain
Suh-recent heads in the deep Oligocene Burnside aquifer were artesian (+ 35 mI a condilion abo found in OIher purts of the coastal plain like Nickerie Suriname (UNDPIWHO 197) und th~ coastul plain of Guyana (Ramsahoye 1959 Arad 1983 Groen 1998) Thi phenomenon cannOl be explained easily as the aquifer has no outcrop und groundwater advection from the elevated savannah recharge areu is impossible given Ih( gradienls in the aquifers (Figure 39) Ocean loading suggested by Dixon (1971) does not hold either a~ the wedge of high-density seawater cannor create such an overpressure It i~
more likely Ihal [he ltlrle im h~ud~ are the re~uh of Ihe rapid Holocene ~edimenta(ion
Instantancous sedimenl louding initially evokes increased pore-water pressures and intershygranulilr pressures The lirs nllrmally quickly dissipate by upward seepage In Ihis case_ htlcver the Oerlying Coesewijne du)s must have a very high hydraulic resistivity which has rCIltLfded this process Heads in the Saramacca Formation arc probably even higher than thosc of the Burnside Formation A study of the oil reservoirs in Surinume by Noorthoorn van dcr Krllijff (1970) rep(lrts Ihut the nuids in the Sarumaccll Formation are over-pressurishyzed wilh respcct to hydrostatic pressure
l64 (inJIIlldwaflJ 1COllry
Grol1ndwater recovery for the puhlic water supply started in 1933 with (he Republiek prodUllion slUtion some 45 km ~oulh of Paramaribo (Figure 31) This well field which is still operational pump- groundwater of excellent qUlllity at shallow depths from the Zlt1nderij aquifer Elttrlicr (in 190~llln exploration well revealed the presence of potable water in the Cocsewijne and Burnside aquifers in the very heart of Paramaribo Because groundwater in these llquifcrs had relatively high chloride contents (170 mglll the Dutch water-supply eni~
neers thought Ihilt saline groundllter wult close to (he wells and feared imminent salinizashytion of (he wells (Groen 1998) Thi~ fellr was fed by Ihe serious problem of sall-waler intrushysion in coastal wells in the Netherlands al chat lime
Only in 1958 the first well field was eSlablished al the WK Plein in Parltlmaribo to be followed hy several others in and around Paramaribo during the 20 years thereafler Groen 19981 Table 32 displays a list of all pumping stations with Iheir 1990 extractions which were used for the numerical ~roundater model (Section 432) Mosl groundwater is pumshyped from the Coesewijne and Burnside aquifers Since 1997 a large pumping station at the Van Hanemweg has become operational which eXlraCts groundwater from the Zanderij aquifer
N Station name Aquifer Produclion in m3h in 1991 (model)
I Benie Burnside 50 1 Aom Burnside 100 3 Helena Chrislina Burnside 70
Coesewijne 260
4 5
Parlmun Koewarasan
landerij Zanderij Burnside
70 830
80 Coesewijne 140
26
Zanderij 70 6 Leiding 9a Coesewijne 460 7 Leysweg Bumside 150
Coesewijne 375 8 Livorno Burnside 450 9 WK Plein Burnside 700
Coesewijne 40 10 Meerzorg Burnside 100 II Lelydorp Zanderij 250 12 RepubHek Zanderij 375 13 Tounonne Coesewijne 60 14 Blauwgrond Coesewijne 60 15 Van Hauemweg Zanderij 1000 (afler 1997)
1i1ble 32 Pumpinpound sllions in ltInd around Puramaribo (Numbers refer to location in Figure 310)
Chlorinities of produced groundwater at these well fields vary from 150 to 400 mgll and display a very slowly rising trend with lime This can be explained from the chlorinity pattern in the Tertiary aquifers described above which shows only a very grudual increase towards the North (Figure 35) Another problem are the sleadily declining piezometric heads in the aquifers At the WK Plein regional h~ds in the Burnside aquifer declined from +35 m (artesian) to -25 m Obviously groundwater recovery from the Burnside and Cocsewijne aquifers has not induced much rechDrge and is in fuct mining Groundwater levels and also the regionlll flow pauern in Ihe coastal pluin became complelely controlled hy Ihe extractions even in the Zanderij llquifer (Figure 310) Apart from increasing pumshyping costs the declining groundwaler heads may over time lead 10 land subsidence a proshyblem not uncommOn in coastal plains with overexploitation of groundwater like those n~r
Bangkok and Jakarta In the seventies a quesl for mOre sustainable groundwater exploitation started (Groen
1998) It appeared that sustainability can only be guaranteed in the far south near Republiek where there is ample recharge CUNDPIWHO 1972 IWACOIFRHarris 1991) However exploitation there appeared not feasible f1nanciatly because of the distance and the preltence of cxtensive swamps Bank infiltration along the major Saramacca and Suriname rivers has DlliQ been contemplated but salt-water tongues extend far upstream in these rivers Finally in 1997 a new large well field has been put in operation along the Van Hattem road South of Lelydorp This well field exploits a large isolated body of groundwater of low chloride content laquo 50 mgli) (lWACOIFRHarris 1991) Active recharge is taking place here (see above) but it doe~ not bala~ce the pumping rate Nevenheless the present production could be doubled and suillast for about 100 years At this moment there is sti1l a serious water supply shortage If everlasting sustainability is not required there is still ample scope for groundwaterrecovery from the Coesewijne and Burnside aquifers south and southwest of Paramaribo using properly designed well fields The well fields in and close to Paramaribo should be abandoned in the course of time
37 Conclusions
The main aquifers in the coastal sedimentary zone of Suriname consist of sand layers in the Tertiary fonnations Recharge is only taking place in the savannah belt (Pliocenez gt
27
snndsl in the fOuth and on the Lelydorp sands in the coasral plain This recharge participates in -mall groundwater flow systems and is locally drained Until r~cently most groundwater in the Ter[~ary formations of the coastal plain was more or less stagnant The (former) body of stagnam groundwater is fresh to moderately brackish and extends 90 km into the offshore groundwater where chloride contents are still below 2000 mgl Saline groundwater is presshyent in thr upper 30 m of Holocene and Pleistocene clays and in the fine-grained Cretaceous sedinienls below 300 m The groundwater eliOtraclions realized around Paramaribo after 1Yl8 lreated n man-made regional flow pattern in the coastal plain Naturul recharge does nOl bahlnle the Cwtruclions and therefore groundwater mining leads to large declines in groundwater lCveis and sah~water intrusion The latter problem i~ not as severe as suspected
belltlu-e sulinily variations in the aquifers are very gradual
Chapter 4
Freshening of the coastal and offshore sediments during the Wisconsinan regression a reconstruction of paleogeography and groundwater flow systems
41 Introduction
The Suriname data (Chapter 3) showed that paleogroundwater of low salinity laquo 2000 mgI) in t~e Tertiary sediments extends about 90 km into the onshore zone The stagnant conditions und Lhe high age indicate that this groundwater has been formed by ewtinct now systems of Wisconsin nnd Early Holocene age Note that at the end of the preceding Sangamonian transgression the sea level had reached a level even higher than today At that time the coastal and offshore Tertiary sediments were probably saLUrated with saline and brackish groundwater This assumption is based on the fact that during the early stages of the Sangamonian transgression these sedimenls were not yet protected against saline intrushysion by the Coropina clays (Chapters 5 and 10) Freshening during the Wisconsinan spans a period of 100 ka However the meteoric groundwater found more than 90 km offshore must have been formed during a much shorter period these remale parts of the shelf were only ewposed during the Las Glacial Maximum (25 to 15 ka BP) when sea-level was more than 100 m below presem level (Figure 41 Linsley 1996) As recharge appears to be very limited at present the question now arises what kind of flow syslems could have created this vast body of meteoric groundwaler in Ihe past
In order to address this question in this chapter special attention is being paid to the paleogeographical development After the sea has retracted during a regression IOpographyshydriven now systems ewpand downward and seaward and saline groundwater in their domains is driven oul This does not take place via a simple pushmiddotthrough mechanism Because of macro-dispersion at a regional scale meteoric groundwater has to pass several times through Ihe flow domains before salinities reach a steadymiddotstate (Domenico and
0iii E 20 ~ Q 40 0bull 60 Eshy 80 c Qbull 100 C 120
0bullbull ~
20 40 60 60 100 120 140
age (ka BP)
Figure 41 Sea level during the last 150 lea (after Imbrie et 011 1984 and Linsley 1996)
28 29
Robbins 1985) Freshening of deep aquifers in the domain of primary flow systems requires relatively long periods In fact residence Limes in these flow systems may even be longer than Ihe lifetime of the system itself On the other hand edimems in the domain of secondshyar and lenian now svstems with small residence times are flushed more rapidly These n~) Ktems ~re relill~d Lo erosional or sedimentarv relief forms superimposed on the regiomiddot nal slt~pe IToth 1963 1995 Engden and Klooste~an 1996 De Vries 1974 l Examples of thc Mdimcmary forms are beach barriers and dunes in aggrading Holocene coastal plains lih the coustal dunes in the Netherlands Where underlying sediments have been freshened 11 dtpths (If 40 to 60 III in a period of about 800 yeargt (SlUyfzand 1993) Ermional relief in COilsta plains is nOi so common in present marine coastal plains hut may have heen impor~
1lOt Jflcr a relative fall of sea level during the Wiconsinan glacial r renlllsirutlioll of the palcogeographicul tondiLions or the coastal plain and shell uf
Surinulll i presemed in Ihe following Bused on Ihese reconstrucLiuns puleol1uw systems an tnntepluulied and invesligaLeiJ by numerical gmuniJwater models or their efficiency in tau~inf cxtensive freshening Som~ resuhs from this study have been published earli~r in IGmclI cl 011 2000hl
-12 Paleo~e()graph) of the Suriname coastal plain
2 SC 1(Ie (1( wawlil1es
During thc early and middlc part of the Wisconsinan sea level varied belween 40 to 65 III helnw prc-Cllt -ca-kvcl (Linsley 1996) Taking into accoun120 m of Holoccne scdimenshyW(iUll ill the soulhcrn part of lhe shelf the enasllinc mUi1 have heen located 40 ll Ri kill furthcr lHlrthward During the
Imiddote years before presentla-t glacial mnill1um between 25 and 15 kl BP sea-level declined to value 6000 6000 4000 2000 o mound - 100 m (helm present sca
~_oo_------lolevel I with minimum of - 3D III at 18 ka o+--__---o~-
r _
BP (Linslcy 1996 Fairhank$ 1989) During this perioo the cOilslJine was 1 ltlcat~d even 130 to 150 km north or the prescnt coastline Afler the steep rise al Ihe heginning of the Holocene 02 ka BPI th~ level reachcd its presenllevcl al 65 ku BP (Figure -1-2 Roelceld and Van Loon 1979 Fairbanks 1989)
- Ghen an average gradient of I 1500 15for the PleisLocenc surface and a rate of obull
15sea-level rise varying between 9 and 22 mmla the coastline must have moved bull RoeleveJd amp Van landward over the shelf at a rate of 135 Loon (1979)
0 o present study bull
20 incised fluvial paleochannels forming a to 33 mlyr The sea penelrated first the
Figure 42 Sea level rise along the Suriname coast ria coast until the sea-level rise slowed (after Roeleveld and Van Loon 1979)
down afler 7 ka BP and coastal aggradation started Submarine terraces and coral reef~ al depths of 20 to 25 m on the Guiana coast indicate that around 8 ka BP (Nota 1958) or 9 ka BP (Van der Hammen 1963) sea-level rise temporarily halted
The data from Ihis study do not fall on the sea level curve of Roeleveld and Van Loon (1979) (Figure 42) This is because radiocarbon dating has been carried out on organic malerial and shells in the Holocene clays which were deposited in a shallow sea Roeleveld and Van Loon carried OUt daling on peal deposits which were formed close to sea level
422 Tapogrtlphy
DUring the Wisconsinan regression nuvialile erosion dissected the flat Sangamonian landscape ltTricart 1985 Clapperton 1993 Thomas and Thorp 1996) The Amazon and Orinoco rivers created deep paleochannels on the conlinenL and the shelf (up to 100 m)
which werc filled up later with Holocene deposito Ero~ion also took place in the coastal plain and on Iheshelf or Suriname (Brinkman and Pons 1968 Roeleveld 1969 Veen 1970 Roeleveld and Van Loon 1979~ Wong 1986) found several deep gullies (up to 10 m) in the Pleistocene coastal plain fillcd with Holocene Mara deposits The drainage pallern of these former creeks can still be recognized on the Pleistocene coastal plain in the present meandemiddot ring swamps and creeks Thc dminage dcnsity varied between 03 to 1 kmlkm2bull Also the large Suriname and Saramacca rivers must have eroded into the sedimenls of the coaswl plain and conlinental shelf Bathymetric and seismic surveys on thc Suriname shelf revealed paleochannels related to the Marowijnc and Coppename rive~ respectively wesl und east of the study area (Nota 1971 Frappa and Pujos 1994) Core drilling for this study (Chapter 4) and unpublished data from existing boreholes and cone pcnetration tests show that near Paramaribo the hottom of the paleochannel of the Suriname River wao about -35 m (below mI)
423 Vegetation
Palynological recordsdemonstille that extensive grass savannahs with Cllrardla and l Byrsolma shrub covered the coastal plain of Suriname and Guyana during certain periods of the Wisennsinan regression (LdM) and earlier regressions (Van der Hammen 1974) This eorresponds remarkably well with Ihe floristic composition of Welgelegen or clay savan~
nahs we find nowadays on some well drained clay and silt soils in the Pleistocene coastal plain (Van Donselaar 1965) This particular type of savannah may have been much more common during the laSI glacial Though the Holocene climltlte change set in at about 12 ka I BP the savannahs disappeared only after 9 ka BP (Markgraf 1993) The present grass and woodland savannahs are relicts of the vast Wisconsinan savannahs and could only persist because of the poor soil conditions and burning by the Amerindian population (Jansma 1994)
424 Climare
Van der Hammen and Absy (1994) and Van der Hammen (1974) estimate that precipi- tation during the LGM must have been about 500 [0 1000 mmla to sustain a natural grass savannah or 1000 10 1500 mma for a mixed grasswoodland savannah They also state that the rainfall regime was more seasonal with a prolonged dry season This agrees with predicshy
31 30
lion~ of 150 to 1500 mma for the LGM by global climllle models (Kutzbach et a1 1998) 1 During the Early Holocene precipitation increased (Markgraf 1993) Global climate
model (GCM) simulations show that rainfall still was concentratedin the summer monsoon This may explain he persistence of the savannahgt during the Early Holocene Palynological ~tudies tVan der Hammen and Ahsy 1994) GCM simulations (Kutzbach et al 1998) and noblt-gas studies of groundwater in Brazil and Nemiddot Mexico (Slute el al 1995 Stute and Bonani 1995) all show that the average yearly temperalure was about 5 to 6 ue lower than today during the LGM According to CKutzbach et a1 1998) yearly actual eVilpOlranspirashylion was 15middot h lower than today which leuds to a figure of 1300 mma in Suriname
-125 Hydmogy (JIrillg III LGM
The paleugeographical conditions dtscribcd in the preceding secliun$ enables us to deline a cunceptual mudel of the hydrological processes during the last glacial and the LGM
iin particular In following chapters this concept will be quantified and refined using isotopic and hydrogeochemical data and simulation models
Because of the lower and more seasonal rainf~lI runoff during the last glacial has been smaller than loday but also more variable Nevertheless the Saramacca and Suriname rivets wilh their large catchments would still have had a substantial base flow during the
)1- ~ntire year Water levels of these rivers were probably not much higher than the base of the
inci~d paleochannels
from loday though recharge must have been lower and the smaller creeks probably had a
more ephemeral character Despite thc large uncertainties in the paleoclimate we may conshy
clude that in the savannah belt recharge to the Tertiary aquifers was lower [han 200 mma during the LGM which i~ much less that the present amount of 500 mma (Section 351)
In he savannah belt nJnoff processes during the last glacial were not much different
f Estimating recharge in the coastal plain is more difficult as it depends mainly on the
heads in [he Zanderij aquifer below the Quaternary clays (see next section) Conditions on the Pleistocene surface in the present coastal plain and continental shelf were much different UP (0 140 km offshore during the LGM) This surface had a relatively flat sloping primary (opography and a secondary topography of incised creeks The interfluvial areas middotfonned clay plateaus which are preserved as the schollen landscape in the present Pleistocene coastal plain (Section 33) Most rainfall on the clay plateaus was drained by overland flow similar to whltlt we observe today in the coastal plain Most likely the incised creeks between the plateaus only carried water during (he mOnsoon season Because of the low penneability of lhe subsoil and the low drainage density base flows were very low If there were any seepashyge into the creek valleys it would have been entirely consumed by the vegelation in the gal~
lery forests in tht valleys This situation can now be observed in some regions in West and South Africa with lillie rainfall or a strong seasonality in rainfall On the flat clay plateaus marshy conditions must have existed during the summer monsoon with phreatic groundwashyter levels close [0 the surface Groundwater heads in the Pliocene sands below the clays must have been much lower as they were controlled by the water levels of the South-North running Suriname and Saramacca rivers which were deeply incised into the Pliocene zanderij formation The relatively low heads indUCed downward seepage and recharge to the Teniary aquifers (Figure 43) This recharge though small per unit surface area acted on the entire coastal plain and continental shelf and may have been greater than the recharge in the
Present situation
~ - - - - bull middotT~r1iary aquller
Topography-driven Row
Sllvsnnah
Last glacial maximum (around 15 ka SP)
---------__----
Figure 43 Present and paleohydrological conditions on the surtuce and in the Quatemary clays
zanderij aquifer outcrop The recharge and the resulting flow systcms in the Tertiary aqui~
fers were halted by the encroaching sea in the Holocene but probably persisted in lhe presshyent coastal plain to 9 ka or even 7 ka BP In this period the sea intnJded the paleochannels of the Suriname and Saramacca rivers and the grass and shrub savannahs disappeared (Markgraf 1993) River erosion may even have increased during the Early Holocene as rainfall increased while retaining its strong seasonality (Markgraf 1993 KUlZbach et aI 1998)
The next section deals with the question whether this hypothesized recharge mechashynism and the resulting flow systems were sufficient to flush all brackish and saline groundmiddot water from the Tertiary sediments up to the outer part of the continental shelf during the last glacial
43 Paleohydrological modeling
431 lnrroduction
The hypothesis from the preceding sectionmiddot ie that flow systems related [0 the prishymary and secondary erosion topography of the Pleistocene surface were responsible for the fonnalion of onshore and offshore paJeogroundwater in Suriname - has been verified with a
33 32
Boundary model C and o
_10m
Boundary model A nd B middot20m
L~nd
bull Cry51 b~~emen
IIllII Fluval deposilS bull Savann3n
o PI~tocenl plan
o HDloeene plan
~ Qlplh 51a [oor
_ MOltlIIA~ndEl
_ MOltl~CandQ
O~~__20km
Figure 44 Boundaries or numeri~QI ~roundaler models
the high hydraulic resistanees of the clay layers The southern border is a no-now boundary luimiding with the basement outcrops somh of the savannah belt Also Ihe western and easlern boundariegt are no-now boundaries which are assumed 10 follol the general SouthshyNonh now paths The nonhern houndary or the models simulating recent (1990) and subshy
model B and A respectively is located 40 km offshore in the Allantie Ocean and contains fixed freshmiddotwater heads in all aquifers In the coastal plain and offshore fixed heads were assigned to lhe nodes of a lOp system in the coastal plain they represent [he level of phreatic groundwater in 1he Quaternary clays offshore the heads corshyrespond to fresh-water heads ltalculated from the offshore wedge of seawater and saline groundwater These hetijs are generally + to +2 m except for the elevated Lelydorp sand
numerital groundwater model For this purshypo-e firsl a ~teady-~tate groundwmer model or the ~(lb-retent ilUation agt ton~trutled
I ~lodcl A) and calihrmed with groundwater head rmm thi~ period Net a non-sleadyshytate model a made ror the pre~ent (1990)
-iWlliul1 (Model HI and lalibralcd with pregtshyem groundwater head Finally the model wa~
ddapted lO the palcohydrologittll ~iluation
Juring thl LGM (Modd~ C and OJ Thi- palemiddot otl1odding ~ludy hlgt hlcn reponed in glllIer JLlail in Groln el al 1(JOOh)
-132 Reccllf (1(1 J-(((111 maddling
For the fOundwlter ~il11ulation~ model flf the Paramaribo coast1I plain Wil~ lomtrulshyLcd ha~ed Oil the MICROFEM lode (DiodllO 19971 The 1ICROFEM code i~ a Ilnile deshymellt (ode for simulation or 4Uil~i thnc-dimenshy iolla 1l011-s(alilIllr~ nlllndwatct nuw in a ~ ~tetll of atjuirereparatllJ hy scm-perl1le~lshy
hk layer~ For 11K cllnSlrutioll of this model carlier ground ater l1ll(klling gttulJicgt or the Pliocene and Miocelle il4uifergt (WACOFR HaITi 1l)911 lIld the Oli~oLenL aquiler (Hutchinson ll)l)()) have been consultelJ The l1lodel comprigtegt the following live aquifer (Figungt 3 4 and 351 (i) ZanlJerij (Pliocene) (ii) Upper C((~e ijne (tvlioccne l (iiil Lower Coc-ewijne Ovlitcenel (iYl BumsilJe (Oligolenel and (v) Saramacea (Eolene and Paleoccne l The first version or tlligt groundwashyter model was 1llltlde by Post (1996) The modelled area igt shown in Figure 44
A large modelling area was chosen O
account for the large leakage factor caused by
recent (19571 condition~
barriers where heads of +4 mare mltlinlaishyned For the outcrop of Ille Pliocene Zanderij aquifer in the savannah belt a fixed recharge of 500 milla is imposed on the node~ Model A (1957 situation) wa~
run in steady-state and lalibrated with the data from the 1950-1957 period Then Ihe non-steady-state run wa~ made by imrodushycing the various abstractions in the period between 1958 and 1990 The Iinal situation in 1990 (model B) wa~ lalibrated wilh headgt measured in the period 197-1990
The procedure WIS repealed several time~
until a reasonable lit was reathed The aveshyrage difference between mcasured and lalshyculated heads in the Zanderij and Coesewijne aquifers for thc 1990 situation wa~ U49 m and equal to the modelling sllldy of IWACOFR Harris ( 1991)
~
~
1
1 1
~
I Paltod1annel SarilmaCCl RJIf
1
1 1
-- I )---1 I
-40
1 I----J] lL__7=---j
Comparing meaured and calculated heads for the BUTniue aquifer was more difficult Fi~un -15 Sirnulaled headgt ill the Zmdcrij
because most observationgt werc done within aquifer during thl LGM the cones of depresiongt around the pumping station Dirferences varied from 025 to 200 m just as in the study or Hutchinson (1990) In Figure 45 groundwaler heads in the Zandcrij and Burnside aquifer arc shown cltlkulated by model A (1957 AD) and model B (1990 AD) The contour maps show thai grt1undwater now in the coastal plain in 1990 is complelely controlled by groundwaler extractions while beroshyre 1958 almost stagnant conditions prevailed
433 Modellillg Ille paleollydrology (~f II( Luc Glochll MOmiddotillllllll
In order to study the groundwater now systems during the LGM tnd the role or the ero~ional relief paleohydrological modeb (model C and D) were conslructed on the basis or model A These models have only experimental value as the ofrshore permeabilily dislribu~
lion is largely unknown apart from a general trend of decreasing permeabilities as sediments becomes finer towards the Nonh During the LGM the coaSiline was localed close to the shelr break 140 km nonh of the present coastline (Figure 44) Therefore the nonhern boundary of the models was extended to the shelf hreak where no-now conditions were imposed in all aquifers
In model C fixed heads along the Suriname and Saramacca Rivers were set equal 10 the boltom of [he paleochannels which grades from the present river bottom ltJl the edge of lhe crystalline basement in the south [0 a depth of 30 m relative to the Pleistocene surface al Paramaribo and finally 10 an assumed depth of 15 m below the Pleistocene surface (seltlnoor) ltIt the shelfbreak Recharge on the Zanderij outcrop (present savannah belt) was lowered from 500 to 200 mmla (see Section 25) In model C the lOp system in the coastal plain was turned into a phrealic system with fixed recharge Also a drainage level of 10 m below the Pleistocene surfice (depth of the creeks) and a drainage resistance of 5105 days were assigshy
35 34
I ncd [~) aln()dc~ The urainage resistance calculllcd hy relmions given by De Vries (19741
llliltc bl~h hccau~e or the low permeahility ll the clay~ and the large spacing of the creeshyk 0 Irial and errol the rccharge rate~ on the coastal plain were varied umjl roundwaler
lech Crlmiddot dm~ tn Ihe PJci~locene surflec ~his was ha~ed on the assumptio lhat marshy (olldll(]n~ preltuled On Illc Hat alld badly drained clay puleaus_ For verilication a ~econd pakohydrnlugical model mudel DJ wa~ made wilhout incised paleochannel in order to illc~tigl1 the effect or the erosional rdief In thi case all node~ 011 the coastal plain were a~IJlId Ilxcd head~ equal 10 tbe Pleis(Ocene urface
~illllt1ali(lI1o with model C showed Ihat inliltralinn occur everywhlre on lhe day plashyICHI In the Pklstocene cOilstal plain Recharge varies between 44 and 56 m1l1 Because of Ille high drallllgl rei~tallce llilly a small pan (lt 2 k) of lhis amOUIH exfi1trille~ in the
IIlli~Ld Lrlel on lh~ day pIUleau~ MOSI pan nf the inlihraled groundwater seeps downward l~l tllL underlylllg PII(lLene ZlIldenj aquifel Thi~ aquiler i drained hy the deeply illtised Sllllll llne ltId SanmlltlCCa rivers as i~ shown in Figure 45 This now system is called a sec oll~ry 110 y-km a it is controlled hy Ihe secondary topogruphy created hy erosion of the ]1qor ~lIfJ11amL and ~arlI1lacca rivers Heads in Ihe deeper aquifers are less COntrolled by the maJur fI vcr and md1cate a mOre rqional paHern wih recharge on the clay plateaus in lI~e iOUlhcrn part of cOastal plain presem coutul plain aoLl southern part of the shein and dl charge l~l the lloodplains Ill Ihe Sarumacca and Suriname rivers in the north (northern part ot Ile ohell) In FIgure -1( groundwaler age wnL inlhe aquifers are presented Note that the~~ ~Igc refer IOlillle elapsed afler recharge In lhl upper Zanderij aquifer groundwater is rclahvely young laquo 0511) lhroughout the coastal plain because of the rapid eirculation in lhe ecandary Il~J sy~ICI11S C1emly -oaline groundwater in lhe domain of lhese seeondary ll~ yslel1l~ could have heen Ilushcd entirely even in the Olller part of the sheIL which was lxpncd onl) dUring the LGM The deeper aquifers helong to the domain of the primary and rcgmnal nuw -slem In this domain grouIdwater ages vary from a few hUlldred years in lhe ~lllth~fI1 In ~o ka in the northern and outer pan of the shelf This implies that saline water in lhe pnllllry no domain could no1 have heen nushed from the Ouler part of the shelf
In model D Ithollt the erosion lopography only 1 primary groundwaler now system CII Recharge occur~ in the southern par of the exposed sheiL up to 25 km offshore from lile presenl coast Upward seepage dominates in the outer pan of the shelf Groundwater
a) Model C b) Model 0 Lelyd
Savanna Param 0 50km 0 I I CQasUtne
j
200
00 ~ 0
600
OJ lt1ka
0
Basement 200
400
iii 2-4ka II 8-12ka II 16 -20kam 1 -2 ka 4middot8ka D 12-16ka II gt20
Figure 46 Groundwaler a~es calculated by paleohydrologieal models C and D
recharge arie~ from 5 10 lJ mma in thc zone coinciLling with the present Holocenc coastal plain and 20 050 mmJu in the present Pleistocene coaslal plain Highesl values are found in the zone between Rijsdijk Road 0 Republiek where the PleislOlenc clay layer (Coropin1 Formution) is relatively thin Groundwater age~ in lhe deep aquifers arc ahoul equal to those in model C Only in the ollter northern pan or thc shelf ages are higher than in model C According to model 0 saline ground WOller could nOI have heen Ilushed from the outer pltJrt
of the shelf
44 DiscussJon and conelusions
The stagnanl body of fresh and moderately brackish groul)d~Her Cgtlending from the coastal plain to more Ihan 90 kill offshme ltanl1ot have been produllu by the pre~cnt low systems (Chapter 3) This paleogroundwuter has been formed hy diflerenl groundwater llo syslCms during 1he Wisconsinan regression (115 ka to 12 ka BP) During this period sea level was much lower and large pam or the eonlinental shelves were egtposed During the LGM (25 to 15 ka BP) sea level dropped more than 100 m wilh respeello lhe presenllevel In thm period the coastline was located 140 km further north Climate wu~ colder (5 C dil- krence) dryer (50 (1-) and had u more seasonal rainfall pauem (horeal summer monsoon) Grass and shruh savannahs covered the Pleistocene surface Rivers and creek~ eroded the surfuc-c and crealed a landscape of c lay plateaus and intlsed valleys ( 0 10 30 m deep) Perennial runoff only occurred in the large Suriname and Saralflacca rivers_ Because of lhe incised rivers groundwater head~ in the Zanderij aquifers werc much lower lhan today which induced widespread rechLlrge The larger recharge LInd the erosion reliel crealcd secshyondary now systems superposed on a primary and regional Ilow system (Figure 47) Paleohydrological groundwaler models showed thaI (he primary now system could not have led to freshening of the outer pan of lhe 5ihelf within lhe shon pcrlod of the LGM Only (he residence times in the secondary now systems were short enough to allow severul Ilushings of the upper aquifen The conclusion is thm during the Wisconsinan rtgression secondary now systems exisled relaled 10 an erosIon topopgraphy which is no~ obscured by Holocene sedimcnls These syslem~ played un essential role in freshening [he upper Tenilfy sediments
Pleohydrologieul modeling using lhese quasi-3D hydmulic grOlllldwaler models is useful for qualiwlive interpretalion and the creation of eoncepwal ideas as described above In the firsl pce there are 100 many unknown hydrogeological paramelers e5ipecially in lhe offshore zone for a realistic simulation In lhe second place the applied code is not suitable 10 study the actual process of freshening as it does not lake inw accoum solu(e transport and variable-densilY nov it would be inleresling (0 use vmiablc~densily Om codes like l1e one presented in the last chapter to study the dynamics of freshening on large temporal and spashylial scales
37
~ brackish Topography- driven Refreshening during regression
now
bull 00
Fi~un -17 Frcshclling or the lumaal md onshore der(Jsi(~ during llrunsgrcssiol by primary and -Clondary now sy~ILmiddotmj
Chapter 5
Salinization of the coastal and offshore sediments during the Holocene transgression a stud) of diffusive solute transport
51 Introduction
in the coastal and onshore Tcrtiary gtcdilllcl1tgt or Suriname a large stagnam body of fresh to moderately nrackish groundmer is prcscnI (Chapter 3 Figure 35) It was motivashyled in ChaplCf that Ihis groundwater was formcd hy extinct now systemgt that were aLtimiddotc during tbe Wisconsinln regression Thigt meteoric groundwater is therefore denoled as pltllcshyogroundwatcr according 10 Ihe delinition propogted in Section 24 Pristine groundwalcr (secshytion 21) with chlorinilies less Ihan 50 mgll occurs only in the present recharge areas of the savtnmlh helt Ind the Lelydorp sands (Figure 35 Sections 362 and 363) The remaining and major [JUri of meteoric groundwater in the Terliary formalions the aClUal paleogroundshywater is more mincralised with chlorinitic~ up to 2000 mgll (Figures 35 and 38) though origimdly the chloride content of this groundwater must have been Iqwer md comparable to present pristinc groundwater It is mosl likely Ihm salinization of the paleogroundwater stan~
ed after the marine suhmersion of the shelf during the Holqcene In lhis chapter we will have a closer look al the salinization process which is related (0 horizontal adveclion or vcrmiddot lical transpqrt from the qverlying and underlying saline sediments (Figure 35 and 38)
Horiwntal advection lakes place when the shoreline advances landward during a transshygressiqn and the freshsltlline interface mqves along with it driven hy density differences in groundwater Mei~ler el a (984) sludied the dynamics of a freshsaline interfltlce in a conshyfined aquifer 90 km offshqre fmOl New Jersey (Hmhaway et aL 1979) where conditions are comparable ((l those in Suriname Using a numerical groundwater model lhey found out that the imerface there is mqving landward wilh a speed of 003 mla under innuencc of the Hqlqeenc Imnltigressioll Essaid ( 1990) carried OUI a ltiimilar study in Momerey Bay CaJifqrnia and repqrlcd value~ of 00510 02 ma On the other hand shorelines migrated landwJrd wilh a speed arying between 3 and [80 mla during this time based on rates of sea level rise of 10 to 30 mmla (Cronin 1983) and shelf slopes of 16000 to 11300 CqmpJri~on of thesc figures shows thatlhe freshsaline interface in groundwater lag behind th~ advancing Holqcene shorelines and that salinization of fonner meleoric groundwater is mainly the result of vertical transport This applie~ to Suriname but is probably of more g~neral significance as will be discussed in chapter 10
Salinization by vertical salt transport may take place as convective density-driven no Under certain crilical conditions density currents in the fonn of downward protruding finmiddot gers of saline water arise in groundwater with an inverse density stratifieaLion (Wooding el al 1997a 1997b) In this case the reverse strntification relates to saline groundwater deposhysited by the encroaching sea on top of fresh groundwater Van der Molen (1958 1989) and Gieske (1991) believe Lhm convective density flows may have been responsible for the rapid salinization of the mainly sandy formations in the eoastal plain of the Netherlands They calshyeulated the approximate velocity of downward moving fingers of saline water and concluded that in a period of less than 200 years more than 200 m of sandy sediments could have been
38 39
become brackish or saline The fael lhat paleogroundwmer i~ still well preserved in the Suriname case i~ an indication that lhis process htl- not played an important role This will he -ubSliIlHiatcd further in Section 53
In the lbence of convective density Lurrenb slow downward diffusion of salts after the Holocene trangression become the dominanl salinization process of the paleogroundwaters in Lhe upper QuHernary and Teniary fomlations Below a rertain point brackish groundwashyter rllay contain salts from a mULh earlier marine transgression Thi zone is part of the disshypcnivc lransition layer existing before the Holmcne transgression Upward diffusion from lhi rone i llot cOI1idered here as it proceeds much slower tban downward dirrusion conshy~middotenlrillioll gladicills in the deep dispersive transition layer are a 1m smaller lhltln those in the Illrp trltlnition layer ahove the paleogroundwuLer created lifter the tfillsgression
A new diITusilln-~edimcnta[ioll model is developed for Lhigt case subequently Lhloride cOIlLCnlfILon alJd igtotopc fltltios simulaLtd with lhe model ltIre eompared with observashyti-tlllS
This lhilpler~s based 011 an eartier published arlcle by Groen eL al (2000a)
i
Fm t~i~ silld) numerougt chloride analyse- of groundwater samples rrom existing wells gcodcetrical oundin~ and geophysiLallogs of oil welb were availahle (Vclstra 1966) These fl)llncd the hasis or the chlorinity pauerns displayed in Figures 35 and 38 Chlorine~ iSOlOPC [~Hi~ were determined for 16 salllplc~ from existing wells
Al tlo s-ites on ille coastal plain clay samples have been recovered from Holocene ltlnd 1IIldcrlyimiddotli~PleisLoLene clI)S in order 10 study shallow salinity gradienls The sites al Koewarasin and Tourtonnc are located near Paramariho about W and 3 km from the coastshyline rcspcdively (Figure 31 Annex 11) Drilling was carried out according Lo the Ackerman llethod bt)re)lOlcs were drilled will normal cllble tool technique while at certain depths lOfC were remiddotlQered by pushing a st_lll1less caing inlo Ute borehole bo[om (45 em length and 65 cm diameler) The drilling logs arc shown in Figure 51 Some shells and peat pltlnishycles were dated with IJC analyses (Figure 51) The upper 55 mat Koewarasltln consist of grey plastic clay and is or Holocene age The underlying Pleistocene clays are very stiff and sIH)~ dislinelltd yellow ltlnd olive-green mouling AeLording 1O Veen (1970) the Pleistolene clays havc been deposited during the Sangamonian transgre~sion ( 130 b 10 115 ka BPl AL the final depth of 19 III fine sand was found AI Tounonne only very plastic grey-blue Holocene clay was encountered down to the final deplh of 25 m In bOlh drillings shell layers were found between 4 and 5 m
Pore waler was squeezed from 11 cltI) samples (9 from Koewamsan and 13 from Tounonne) and was analysed on chloride and all major ions (Velstra 1997) Chlorine-isotoshype ratios were measured on 9 pore water sltlmples (3 from Koewarasan and 6 from Tourtonne) Isotope mcasuremenls were carried out according 0 ltlnalytical procedures desshycribed by Eggenkltlmp (1994) The chlorine isotopic mtios J1R (rmio of rare isolope J7CI to abundam i~otope J5CI) are reponed ltIS dirferences in c from Srandltlrd Meltlll Ocean Chloride (SMOC) shy
)1 R _ J7R 001lt llfOC 1000 (51 )
RSJoc
All water sltlmplesfrom core driHing- and welb wer analysed twice The ltlverage dHfe rence between each pillr of omiddotl7CI-analyse~ (n= 24) wagt 007 Ifr wilh standard dcviation 007 Wr
Tourtonne KoewaraSltln
depth In Firm hrown clay wllh some m belOW small Iron concretions
Very poorly drained half ripe clay wilh root remnat1ls
depth In
m below SlIlf grey day With root
sunace surface Firm IIghl grey day Withremnants
redbrown mottling and SOfl grey clay Wllh some tool remnants brown mOUllng and line sand
Soft dark grey clay nch In
organiC mailer and Some gree moiling Shelllldge Wllh coarsemiddot rne sand ampOBPHoloshy
cene 5 Shell rrdge WIth whOle shell malenal
2950B
6 6 Sllff grey-blue clay With ohvegreen moUllngSoft dark grey Clay rich In
orgamc maller Clay pebbles rich n Iroo
bull Bed of Shellltagmensbull - gt 40000 9P
9 Clay pebbles9
10 Firm red and yellow moliledHoloshygrey-blue clay With fine SJnd cene and shell fragments
SIlcky dark grey clay nch In
organiC maUer wllh some
11
shetllragemenls12 - Red-brown Iron coocreLlons wllh brown coarse sand 13 4970BP 19
Pleisto- Very sllft grey-blue clay With 15 cene some brown mollllOg5
16 Stltcky dark grey clay With fine sand
Stiff grey-blue clay With some 18 brown mottling and whlleshy
brown fine sand19
19 Strff dark grey clay rich In organic matter and20 Whilebrown medium fine sand
Legend7400-810022 BP ~ Shells With sand Root remnants
2J MOlllingsect Shells Iron conClellonS
~ Clay OrganiC malenal
Q Sand 29508P25 C_14 age
Figure 51 Drilling logs at Koewarasan and Tounonne (Iocalions shown ill Figure 31 and Annex II)
4 40
53 Solute lransport and fractionation
531 DOII11IIH comiciImiddotc SOIIIC I IlInsp01
The critical conditions under which convective density eurrents arise in groundwater wilh a reverse and linear density strmillcation are anained when the Raleigh number Ra eceed- -l12 (Paschke and Hoopes 198-l Schincuriol and Schwartz 1990) Wilh
(52)R
whereJp is the densil) difference hetween top and hOllom of the sediment layer (kgmll ~
the acceleration due to grtvity (ms 2)1J Ihe dynamic viscosily CPamiddots) K the intrinsic penneashybilil or the -edil1lelH (111 2) H Ihe thickne-s of the ocdimem layer (Ill) and D the erreclive dilT~-illn codlicienl (m 2-) Permcahility den-ity difference and thickness are the delermishyning factors in the Rayleigh numher A-IJ (d(P) g (gt10) and D (gt10 10 ) do not vary much and f the hydraulic conductivity in mday is equal to KpgllJ (pgIJ = HP) E4 52 can be
-implilied 10
Ra gt 1(( bp JkH
Eq 53 ha- heen applied 10 thc Quaternary clays of Suriname with a hydraulic conductishyit~ 1c--than 10-1 mda) a hickness larger than 20 m and a maximum density difference of ~ km between seawater md fresh water This results in Rayleigh numhers far less lhan Ihe ~riicJ1 alue of 41[2 indicnlillg that diffusion is Ihe dominming process in the
Quaternary days
Diffusion (If molecule~ in ltI lilUid is a llmss transport process due 10 random thermal (Brownian) motion of the molecules Fickmiddots first IDW describes Ihe diffusion process DS
(541
where F is lhe flux of molecules (mollsm2) C the concentration of molecules (mollm) and D the diffusion coefficient in waleI (m2Is) Combining Ficks firsl law with the law of conshy
seralion of milSS yields Ficks second law
(551
The equation can be solved for various boundary conditions The most appropriate case is a semi-infinite porous medium filled with waleI with concemnllion Co which at the finite end is suddenly exposed to a solution with u constant concentration Cs With boundary conshy
ditions C= Cf for gt 0 und f = 0 c = CI for = co and f ~ 0 and c =C for = 0 and T ~ O lhe following unulylicul expr~ssion can be derived ltCurSDW and Jaeger 1959)
(561C =c+(c-C)ef~ 2fo] Note thut D i- replaced hy D the effective diffusion coefficient in a porou- medium
(see below) If advective groundwatcr now abo contributc~ 10 mass transport Equation (55) is expanded with it llow term to
(57)
~ i Il7 3Jwherc i~ the llow vdodlY of water h_oSwe
tlJSz ~
For the case of a fluid with sail concentration C entering a semi-infinite porous n - j 8J-8~ um with waler of sail concentralion Com a now velocity Eq 57 can be solved wi e] sect 4i shysame houndary condilions a for Eq 55 Ogata and Banksmiddot ( 1961 ) found the followi lIlilg g sect t
l IV 0 0I)lical expressionmiddot QuQtv_~~J(
e ~ iti ~ C 0+ (C-C)[J~-lJ~ +ex II ( J~~secttJ--C J~+J]shyell ~
2 LJD D 2JD1 E ~ ~ ~Jj ~~
t 5 gj i 533 DWil~i(m cOlfficiellTJ Omiddot$~~
E3 ~~1 Diffusion coefficiems of solutes in water are a function of temperature an ~lecuor
ltnomic mass Based on Ihe Stokes-Einstein equation Woreh (1993) (in Gmtw ~ 99R6 Jf derived the following rclalionship for uncharged molecules like gases ~
(591
Where T = tempermure (K)IJ = dynamic viscosity (Pas [1002 x 10middot) and III = molecular mass (gmol) for a certain ~olute
Aceording 10 Grntwohl (1998) this equalion works also well for non-dissocimed organic ~ubstances However for charged ions his relation does nO( apply because the ions cannot diffuse in isolalion electroslutic forces mutually influence the mobility of the ions The result of this complicaled coupled diffusion process is that differences in diffusion coeffishycients are much smaller lhan expected from their molecular weight Experiments show thal diffusion eoefficiems of Ihe major ions in Waler vary from I x 109 to 2 x 10⁹ m2s at 25 ltC Robinson and Stokes (1965) and Li and Gre~ory (1974) repon a value of 12 x 109 m2s for seawater diffusing into distilled water the self-diffusion coefficient of water molecules is 27 x 109 m2s (Wang el aL 1953)
Diffusion in pore Water of saturated sediments is slowed down by obstruction of the grains and by the tonUosily of the pOle channels Various empirical relations have been defshy
43 42
ined between the effective dilTusion LoelTicient (Dc) and lexwral properties such as tile effectiv transport-lrough porosily Ipan or porosity acting as transport channel~) lortuosity of tbe pore channeb and pore con~lriclivjl~ (Grathwohl 1998) In practice these paramelers arc unknown and onl~ the bull porosily llpl 01 ~edimenl~ i~ delermined Most authors lise lh empirical relation
[5101
field md laboratory ~ludic yield a wide variation or alue~ 01 m which also seem 10
he il rllllcion ill p()r(lil~ In hle md compacted days 11 i~ relatively high Remenda el II ( 191)(]) ille~ligmcd dilfll~ion of Ol~() in a day-rich till and found a value of about 01 for the raliu D DltI which l~JITCPOllds In aboul 11 = 2 with day porosiie~ varying between 03 and (U5 Lernmll (11)71)) ill Ranganathan and HanoI (1987) found vallle~ of 25 (0 SA for ~hlk For yuungel ks~ consolidated day~ and ~ands IJ1 i closcr to I (Appelo and Postma ])Yi)
Studie hy )esaulniers et al (19811 Bedman (1991) Volker and Van del Molen ( IYY II and Eggcnkamp tl a1 ( 1994) resulted in valueo for D varying from 5 x JOIO to 13 x I() III 1ll~ A thc conditions of these studies arc comparable to tbose reported here diffushy~i(111 c(Jl~llilicnt an expecled 10 fall ill the same range
3J FnllilJlIlI1l11 f(chorille-is((JCI hy d(lIsil( 1(I~lOll
Chloride iOlls ar~ ch~lnically inert in underground environments and are therefore the 1I1l1S appropriatl ion~ for studying diffusioll processes Measuring chlorine-isotopes middot~CI and 7CI g1middotC alliahle extra information as diffusive transport creales fractionation of concenshytration Till dillennlc in atomie mass of the isotopes brings about differences in mobility am] dilll1~i)n loelrkienLs (Eq 59) The heavier isotope i slower and therefore the solUlion heClIllK rllativcly depkted in heavy isotopes at the diffusion front and relatively enriched tlar Ilk ourcc Th~ r~ltio of cllcetive diffusion coefficients for both isotopes is equal to the fralmiddottitlnalitlll faclor 0
D middot0 tto--- (511 )
v 0
Thi~ factor cannot be dcrived thcorc1ically as for gases because hydration of chluride iL1n~ in Ihe solution moderates the effect of the mas difference belween Ihe two chloride i~owpe Fraetiotlltllion factors derived from isolOpe measurements in comparable environshymenh - shallow sediments affected by recenl transgressions and regressions - vary from 10012 to 10030 (Desaulniers et al 1981 Beekmall 1991 Eggenkamp et a1 1994)
Fractionation of chlorine-isotopes as a result of diffusion can be simulated by separalely calculating the 3~CI and 37Cl concentrations using Eq 58 or 513 Initial concentrations are - based on the chloride concentrations and the chlorine-isotope ratios (J7R) of seawater and
fresh groundwater For the present study the l7R of these waters were eonsidered 10 be equal to a 37RsMOC of 031978 (Eggenkamp 1994)
r
------------- shy
535 D(flfSrJ1l-sedilllll1lali(II IIlruil sillluaring mmsgreHr)ll follmnd by regrlssioN
The downward diffusion process in the Suriname coastal plain is more complicated than the simple analytical model of Eq 58 Firslly exposure to the sea was temporary and secondly marine sedimentation took plale during the transgressive phasc Eggenkamp (1994) found a solution for the sedimentation problem by letting lhc origin ( = 0) move along with thc rising sea noor during sedimentation and regarding Ihe salinization process a~
a downward now of salt waleI in lhe underlying sediments with diffusion at the salt front If edimentaLion is constant Eq 58 is valid with I equal 10 Ihe sedimemalion rate However lhe lrans~ressive phase and Ihe sedimentation are of finile duration and are followed by a regressive phase and Ixposurt to fresh wattr at the lOp Beekman (19Y I) used a finitc diffeshyrence scheme lo simulall lhtse condition Here another solution i~ proposed analogous (0
thaI for the hcat-no problem described by Cars law and Jaeger (1959 p 58) In order to apply this solution the semi-infinite concentration profile at the start of the regression is madc infinite using
(S12)C_~I = 2C rtfl - C J
where f is Ihe lime elJpsed between Holocene transgression and regression C1f is the chloshyride concentralion aceording to Eq 58 and CTltI is the chloride concentration of fresh groundvmiddotater at the surface C t i~ tbe imaginary chloride profilc eXlending infinitely upward from the surface The cvolution of the ltubsurface pan (- 0) of this infinite profile according to the diffusion equation is exactly the same as the evolulion of thc semimiddot infinite profile with boundary condition C(I = CiI After the regression (I I) the evolution of the chloride conlenl until presenl can be determined by convolulion of the initial profile (at the SUln of the regression) with Greens function The convolution inlegral ha the following fonn
(5131
where II is elapsed lime between the Holocene regression and the present
A straiglllfonvard analytical expression does not exist for this equation The function has to bc made discrele by calculating a large number (N) of concentration at certain depths with spacing 6 beforc the convolution is applied Because the integration has to be carried between certain limits along Nt mus be large enough to include the area of influence of lhe diffusion process The calculations were perfonned using tbe mathematical MATLAB computation program (The Math Works Inc Natich USA) accuracy was tesled by varying the spacing and N Results indicated that the final eoncentration values did not change for 6 lt 025 m nor for N gt 600
Applying Eq 58 and 5l3 in the actual field situation is only valid if the aquifers and the Pleistocene clays contained prisline meteoric water (C= Co for gt 0 and 1=0) al the onset of the Holocene transgression The Pleistocene clays from the Sangamonian transgre5~
sion contained seawater However it can be readily shown with a simple diffusion model that during 100 ka of the Wisconsinan regression all salls from the Sangamonian transgresshy
44 45
sion hae dillu~ed OUI of the clay~ to the phreatic surface and to Ihe fresh underlying aquishyfers Further evidelHe i~ given by Levell and Quakernaat (1(68) who reponed dilute pore walCr in Ihe Pleistocenc clay~ in the ~ouhern pan of the coa~ilal plain Fre~heting of the cJy during Ihe Wisconsinnn rcgrc~sion Wl probably enhanced by downward ~eeragc
induced hy the deeply illci ed river~ and creeb (Chapler 3)
5~ Rcsulls
(jliiemon dan In tile ah-clIce of cOllective densiL) How discu~sed in Section 5J I the di lfusiol1-scdishymelllltiOIl model can he applied to the Quaternary clay~ Figun i2 display~ depth prorile~
or chloride cOllCenlrLion and the 07CI alues for pore water from the clay con~s al
oewaraan lI1d TOllrlonne Maximum cOllcelllralion~ an ahout JOOO mgtl (or H5 Illmoll) 1( KoewanNlll and IXOOO mgtl (or SOD lllllloltl) at Tounonne Toward~ the top and hottom (If the chI) ronnaliOlh watel become~ fresher The high salinil) al Tounonne marks a rccell nnat of the ~ea II lhj~ ~ite Koc ara~an hJS experienced a longer period of frehening 67el middotIlles deviate fTlm the SMOC value W(kd indicaLing a diffusion elreet in the proshyCl~ of rre hening The oliCI vdue at Tounonne decrca~e down profile from positive to negalic Thi~ indicate downward dilTusion Wilh iSOlOpic enrichmenL at the pcak COlleentrashyli(lll~ and depletion elo~er 10 the dilTu~ion front The onCl llues aI Koewlrasan where only three analyse~ have h~cn clrried Out are distinctly more posilive Apparently a longer period of dilu~ion la resulled in a relatively large enrichment throughout the entire clay layer
It wmdd hc impn~sihlc to calibrale all paramecr- of the diffusioll model (Eq 58 and 5131 with the anuly-cs of chloride eoments and chlorine-isotope ralios Howevcr for some pamlllcleh reliabk assuillptiom can he made The time of tTltlIlsgression can be derived from 1)(lt11 ~Cltl lccl cune 1Brinkrnan and Pons tX Roeleveld and Van Llon 1979) TrIl~~re~~ion at Kocwlwsan and Tourtonnc is estimated at 6 ka BP and 10 ka BP re~pectishy
nI) TIllS lil11~ i~ equal Lo the sum of and I in Eq 513 Holocene sedilllentmion ra[e~ 1middot)
al KoeWilntSan and Tourwnne have been deried from l~C dates of shells and orgnnic mateshyriltll in Ihe clay (Figurc 51) the rate~ ar~ 29 and 26 mmyear respectively The chloride
~ cOl1ccntra(iOIl~ of fresh llleicoric groulldwler before the transgression (Co and C P
r) and at
the surface aflcr the transgression (Crr) are 25 mgl orO7 mmol1 This value is the aerlshyge concemration of groundwater in the Tertiary fonnaLions below the recharge area of the Ldydorp ~amb Seawater chloride concentration is assumed to be 20000 mgl or 566 m1ll0ltl (Appclo and Postma 1993) The isotopic rmio of seawater chloride (7Rs~IOC) is equal 10 03 1978 (Eggenkamp 1994) We may assume that in coaslal arens like Suriname ehlorid~ ill rainfall and in fresh meteoric groundwmcr is of marine origin (Appelo and Postlna 1993 Drever 1997) Evaporitic rocks which may release chloride do not occur in this area Moreover Krook (979) states that only the most stable siliemes in the Tertiary sediments of Suriname have survived intensive weathering Consequently fresh meteoric groundwater must have lhe same isotopic chlorine ratio as seawater which is expressed as amp7C is equal to 0 9Cc With the assumptions on concentrations and isotopic ralios the initial concentrllions of 35CI and 37CI are known
I I 0
L __~o~_=~~
o Chlorido lmgll 0000Cnlgnde (gll Cnlde (mgll)m 00
0 0 -------- _ 0 I --~)~)II~~I - bull 10 I 0
i rJI i I I ~
~ I TononneTononnei Tononne ~--~=~
~31CI 11001 ~]7CI (1001 ~]7CI 1100)
0 10 middot171
0
lti I I bull J I r
Tonorne I Tononne I30 Tonolll1e i 30 KoewarUJn Torlol1l1e
8 3700 Effective ChlOllee b = 3900b= 10022b 510 ~ JRegreSSiondiffUSion lTacttollshy
C 400 c = 500 date In yrs J ooJC 710 coeffoents c= 10027 allonlacshyd= 700 BPd 4300d = 910middotmiddot t (De) In mls d = 10031 tors (u)
e 4500 e = 900e = loo]~e 1110 0
Analyse~
-
Figure 52 Measured and simulated chloride concemrations and 0-7C1 vn~ues or ~re water fr~m Ille Qualemnry c1nys al Koewarasan and Tourtonne Curve fitling resulted 111 nn optimum ef~ectiVe diffusion coefficient nnd cllionne-isolope fractionation of7 x 10middot0 m~s and 10027 respecllvely Witll curve fining regression al Koewarasan and Tourtonne was dated nI 41 ka BP ~nd 05 kn BP respectively leading to sedimentation rates of 29 mmyear and ~6 mmyear respectlvely Tile assumed lransgression al both sites at 6 ka and 10 ka BP respecltvely was previously based on 1C-analyses
47 46
Thr~e unknown parameter~ r~ Icn in the dirrultiion modeL 1 = pcriod bctween regresshy~ion and present (1 + is known) D = effeclive diffu-ion eoertlcicm of the abundant middotmiddotiCI isoltlpe a = fracliomnion faClOr hetwcen the middotCI and IC iSOIopes Thc model parametergt n and a were optimised by trial and errur ulHilthe calculated prolie~ of the chloride COI1shylemlation and 61Cl ril~d the luhoralory meauremenb (Figure 52) As an cxtra comaraim w thi- procedure values for 1J and a for both siles were set equal to cnsur~ the reproducibishylity of the a~-ul1led diffu-ion process For D a llue of 7 X I0- 10 m~s la~ found which lics within the rlI1ge of value- reported abomiddote The same holds (rue for the value of 10027 fuund for a The n~ ultillg regression dale- arc 41 ka BP and 05 ka BP for Koewarasln and Tourtollilc respectively
Figure )2 di-plays tile sellsitiity of thc modcl for variations in parameters value- PMltlmder c in each subllgure represents the optimised vulue It is interesting to note- that the modelled 07CI at KO~ilrsall is nm verv scnsitive In variation of the regression date This is hecause Ihe rmio of the IraL1sgn~ssive period to tile regressive period does nOl differ much within thl ranc 01 rcre-ssion dales At Tourtonn~ regression lOok place only a few hundred years ago Threfore ~arying thc regression dale with the same order of magnitude has more erfect at this sileo It goes withoul saying that variation of the fraetionJlion factor has no visishyhie effect on the total thloridc concentration
Gimiddoten the maximum values for the density difference or pore water in the cll)s (5 kgIll Ii lhe hydraulic conductivilics (4 x 10middot~ mday) and the thickness (30 m) of the Qualernary clay lhe Rayleigh oumher calculated with Eq )2 appears to be smaller than I Thi~ i- well hllow the stahililY cri1erion of 41[~ and therefore we may conclude thai conshyvcclhe dcnsit nows will 001 occur
7ClfI(IIT 10moliOIS
Fi~lrc 53 showgt the simulation results for ehloride concentrmions and 5~7Cl values of Jround~watcr over a Jreater dcpth range in the Tertiary formations aI Koewarasan and Tourtonne Model parameters are equal 10 those described ahove Implicitly it is assumed that also in these formations diffusion controls salt transport which may not be true for the sand 11ers There are no vertical series of analyses in the Tertiary formations ltII the Koewa~asall and Tourtonne siles Therefore chloride concenlrations from nearhy wells Ire shown in Figurc 53 The chlorine-isolope rmios in Figure 53 are from various wells from all parts of thc coastal plain and cannot be compared with the simulations Figure 53 shows thaI the simulaled chloride concentrations at hath sites decrease rapidly downward which is in agreemenl with the analyses from nearhy wells (see also Figures 35 38 and 54) At Tourtonne concentrations in nearb wells are lower Ihan predicted by the model Unlike lhe Tourtonne borehole these wells ae probably locmed outside the paleochannel of the Surinamc River where lransgression and salinization started relatively early
Aicording 10 Ihe model~the diffusion front has not penetrated deeper than 60 and 90 m ill Koewarasan and Tourtonne respectively The diffusion front is arbitrarily defined as the wne where chloride concenlralions have inereased to twice lhe average background concenshytration of 25 mgt The mus defined value of 50 mgfl is approximately the concentration at which groundwiller is delectably affected by salinizalion Sensitivity analyses using me parameter varimion above demonstrate mal the depth of me diffusion fronl varies with 30 m
Conspicuous are the modelled negative peals in 53CI at 50 and 80 m at Koewarasan and Tourtonne respectively just above the diffusion fronts The fractionation effect normalshyly increases along me diffusion pam but deereltlses again near the diffusion front Near the
CI contonllmglj
10000 15000 20000 - -10 -8
0
bull Kegtew3asan
-so
-100
I poundmiddot150 n ~
-200 - dlHuslon models
6
a
5000
-20
pore waler Tourtonne - diHuSlcn models
groufldw (mlerp ) Tourtonne pore waler Koewarasan bull pore water Koewarasan 6 pore waler Tounonne middot250
middot140 o groundwaler Tertiary lormallons o groundw (mlerp 1Koewarasan
-160 L _ middot300 ~-----------~
Fi~urc 53 MeJsured chillride comcntralioll and 017CI valuc~ of groundwater from Tertiar) fomamiddot tions and valuc~ simulncd with the diffusion-scdimenlation model for Kocwarasan and Tourtonnc
front chloride concentrations are low and the isotopic composilioll is dominated by the compOSition of the inililtll fresh groundwater Sensitivity analyses show that the magnitude of the peaks varies betwecn -5 and -12 ~r and depends mainly on the fractionation factor The depth of Ihe peaks depends on the diffusion coefficient and varies within a range of 30 m around the depths staled above Also the initial chloride conceillralion is of innuence ifhe initial chloride concentration is increased tenfold thc peak reduces to half its value The 537CI analyses in Figure 53 are from wells located far from each olher and with different diffusion histories which does not ltllIow a meaningful comparison with modelled 8~7CI
values Yet the pattern of negalive values ranging between -4 and 0 above a depth of -125 m and values between -13 and +13 below that depth rna) renecllhe simulated 5~7CI peaks
We expect that if water samples from Ihe Tertiary sediments at Ihe two sites were obtaishyned and analysed it would be difficult to reproduce the analyses with the diffusion simulashytions for several reasons First of all the model does not account for upward salt transport from deep saline groundwlter which may be of innuence in the fresh and moderately bracshyIish zone below a depth of -40 m Secondly the assumption of negligible advective transshyport which seems appropria(e for the Quaternary clays may not hold for the Tertiary sands Advection may be related to regional compaction and densily-driven now as discussed in section 3 or now caused by pumping More important is the advection caused by free conshyveclive density nows (mixing) which may arise in the Pliocene aquifer if the stability crileshyrion of 41t~ for the Rayleigh number is exceeded (Eq 5_2 Wilh estimates ror densily diffeshyrence ~p (09 - 36 kgm3) hydraulic conductivity k (10 - 30 mlday) and aquifer thickness H (15 - 30 m) the Rayleigh number varies between 1350 and 32400 This suggests mal free convection is an effeclive mixing process in the upper Pliocene aquifer which will reduce me modelled concenualion gradient and the peak of me chlorine-isoLOpe ralio (Figure 53) In the aquifers deeper man 70 m below [he surface density differences are probably 100
small to creale density flows
o 0 o 0
o
49 48
5J2 UI(mlI(Il-lJOrl (~rl(llill( (llId )mckimiddoth glOllulI(Ipound1
The saline groundwltller in the Cretaceous sedime11l~ i nO connalc Comacl with fresh meteoric groundwater during long regressive period in the Late Cretaceougt and Oligocene would have drawn much o( the original salt from the sedimcnts by diffugtion The high conshycentration found in the lower parl of Cretaceous deposits may be the resull of salinization during later Iransgressions As the ediments are nOL very permeable salini7ation by down~
ward diffusive Lransport requires a prolonged period of marine submersion suggesting a Miocene age for this deep saline water Another explanation is that saline groundwater from the deep and seuward Pltlrt of lhe Guiana basin hltl migmtcd upslope and landward Noonworn vm del Kruijff (1970) proposed this mechanislll 01 compltlction-driven llow iO
c~plain the presence of oil in the Lower Tcniary west of Pawmuriho The chlorinity prolilcs in Figure 54 indicate an upward nux or salts from the
Cretaceous sediments The nux that persisted during a lnng time in the Neogene is controlmiddot kd hy dilTusivc transport and lateral dispersion related to meteoric groundwater 110w in the Tertiary sediments during regression phases (Meinardi 1991) This transport process has heen going on for it long time during the Neogene and is nOl only controlled by diffusion During pcriods of low sea level groundwaler 110w in the permeahle Tertiary formation enhanced upward transport hy lalcral dispersion These meleoric 110w -ystems have been arrested and reaclivated severaltimcs during Ihe Neogene Unceflainty un these boundary conditions makes simulltllions of upward sail Iranspofl from the Cretaceous sedimems less Il1canin~rullhan Ihose of downward transport described earlier Nevertheless chloride (onshyLentration~ in Figure 54 and the 8middot7Cl vltllues in Figure 53 in the deeper part of the Tertiary formiltions slill permiL somc qualitalivc conclusions Geophysjcallog~ from the eastern
~
Chloride content (mgll)
1000 10000 100000
----------~------_____-----=---i
100
i Teruai
200
I I ~ 300 D I Crelaceous ~ i
I _00 i
I
I __0_middotmiddot
bull
JbullOD I
J____p_a__ma_n_b_O_W___ -~-~-_
Figure 54 Chloride profiles in oil exploration wells based on geophysical borehole logs
50
wells near Paramaribo show a gradual increase in chlorinily from a minimum of 600-800 mgtl at depths between 100 und 200 m to almost seawater quality below 500 m In the Tambaredjo wells minimum chloride concentrations attain relatively low alues of aboUl 200 mgl1 at depths between OO and 50 m Below this depth a sharp increa~e in chloride concentration is observed This seems to be related to the clay layer above the basal Tertiary sand layer thaI also forms the host rock for the oil of the Tambaredjo field The presence of oil implies that the clay must be very impenneable and has protecled the lower deposits against l1ushing by meteoric groundwaler flow during regressions Otherwise the oil would have been dispersed and microbiologically degraded as a result of mixing vilh meteoric waler We believe lhat the steep chlorinity gradient below the clay seal renects upward diffushysive transport of salts in stagnant formalion waler East of the Tambaredjo oil field the clay is absent or less conlinuous which enabled groundwater flow systemgt 10 extend to Ihe top of the Cretaceous sediments during regressions Meinardi (1991) points out lhat in such a situashytion lateral dispersion along the inlerface of fresh and brackish groundwater enhances the upward solute transport As a result larger and more gradual transition zones arc found in the eastern wells compared to those in the western Tambaredjo wells (Figure 54)
II is concluded from the simulations of downward diffusion thal groundwaler below a depth of 100 to 125 m could not have been influenced by Holocene salinization Nevertheless groundwater from the Paleogene formations is marked by chlorinemiddotisotope fractionation 8~7Cl values vary from -13 r 10 +13 7r below a depth of ahout -15 m (Figure 53) It is believed that the oJ7CI variations are indicalive of diffusive processes However il mOre profound interprelation of vertical solute transpqrt in deep groundwater based on the availuble oJ7Cl data is impossible as the values are frqm different wells (Figure 53) Moreover borehole logs of these wells were not available
55 Discussion and conclusions
Salinization of sediments with fresh groundwaler following a lransgression can take place Ihrough several processes as depicted in Figure 55 In Ihe case of Suriname diffusive transshyport is the dominant process
A diffusion-sedimentlIion model has been set up that simulates chloride diffusion and chlorinemiddotisOlope fractionation in sedimenls that have been exposed 10 marine inundation and sedimentation during a finile period The simulated chloride concentrations and 8)7CImiddotvalues were in good agreement wilh analyses of pore waler from two siles in the coastal plain Values found for the effective groundwater diffusion coefficient or chloride and the fraclioshynation factor for Ihe Chlorine-isotopes are 7 x 10¹⁰ ms and JOO7 respectively These values are supponed by previous studies (Desaulniers et al 1981 Beekman 1991 Volker and Van der Molen 1991 Eggenkamp et al 1994)
Chloride concentralions and chlorinemiddotisotope ratios as well as the diffusion model show that salts from the Holocene transgression have penetrated to a maximum depth of 100 to 15 m in the underlying Tertiary sediments (Figure 53 and 54)
The model could even be used agt a marker for the marine transgression and regression during the Holocene at the two siles Transgression al Tourtonne and Koewarasan located more inland took place al 10 ka and 6 ka BP respectively Regression occurred al 05 ka BP and 41 ka BP respectively These dates are in line with results from earlier studies in the Suriname coastal plain based on I-lC-dating (Brinkman and Pons 1968 Roeleveld and Van Loon 1979)
51
Salinizatlon and formation of paleoshygroundwater after transgression
saline
brackiSh
bullsail diffusion
convecllve denslly now 000 t
Figure 55 Salinizmil1l1 in offshore and ltoaslal sedimcnt~ after a transgression
SailS belovmiddot depths of lbout 125 m belong to the pre-exiting dispersive freshsaline lranshysilion zone ltlnd originate from the Cretaceous The thickness of this zone depends on the pn~scncc of impermeable clays at lhe base of the Teniary (Figure 38) In the clay layer seashyling the Tamharedjo oil reservoir diffusive transport dominates whereas groundwater above the clay is cominually nushed by meleoric now systems during regressions In the Paramuriho arel the day is lackIng which allowed more lateral dispersive mixing al the TcniaryCretaceous boundary resulting in more gradational salinity profiles (Figure 38) In fc1 the chloride profile in lhe upper 250 m may be used as a proxy to detect lhc presence uf clay seals and pcrhltlp~ shallow oil reservoirs in Ihe Guiana Basin
Reconstruction of the upward transpon of sahi from the Creiaceous sediments was not possible due to lack of data In addition modelling i~ meaningless as boundary conditions rclated to lhe various transgreisions and regressioni are Ufknown
Thi~ study and earlier itudies (Beekman 1991 Eggenkamp et al 1994) show lhat the approach of combining chloride and Sl7CI analyses and salt IranspOr1 modelling is successshyful in reconslructing paleohydrological events in coastal areas These techniques may also be applied 10 study diffusion in low-penneabilily environments around deep disposal sites of nuclear waste ltlod landfills
Funher work focuses on combination of chlorine-isotope analyses with 2- and 3-dimenshysional modelling of waler and solute transpOr1 of variable densities
Chapter 6
Hydrogeochemical signals of the hydrology and paleohydroloshygy in the coastal plain of Suriname
61 Introduction
Thi~ chapter dcal~ with lhe hydrochemical composilion 01 groundwater vith the objecshylive to provide new evidence on the hydrology ltlnd paleohydrology of the coastal plain or Suriname and W ubstamiaLc re~ulls derived at in carlier chlpters Attention is given in parmiddot ticular to proceses of cation-exchange This process accompanied freshening during the lasl glacial when the body of stagnam meleoric groundwater in lhe coastal and offshore Tertiary sediments was formed (Chapter 4) It also occurred in a reverse order during the subse~
quent sillinization after the Holocene tramgression Calion-exchange belween soluble ilnd adsorbed phases is of panicular imeres1 as il provides a signal with a long memof)middot Calionshyexchange occurs when groundwater with a hydrochemical composition differem from lhe residing groundwater penelrate~ a formalion (Appelo ilnd Postma 1993) The exchange promiddot cess for saline waleI (dominated by Na+) flowing in a formerly fresh aquifer (with exchanshygers dominaLed by Ca~) can be described by
No - + 11 (Co X ~) ~ (No X)+ I~ Ca~- 161)
In which X reprcsent the cxchange sites Oil charged surfaces like clays Thc equilibrium condition according to the Gines Thomas convention (Appelo and Postma 1993) is cx pressed as
[No - XJlCa ] 162)
[Co-xJmiddot[Na ] The coefficienl Kuc is not a true constant but depends on thc ialinity of the poreshy
water The ieJecLivity of an exchanger differs for various species but decreasei in the folloshywing order Ca Mg K NH 10 Na Because exchange reaclions are fast with respect to advective and diffusive transpor1 continuous chemical equilibrium may bc assumed between dissolved and adsorbed phasei Because of the cominuous release of cations from a relativeshyly arge pool of adsorbed ions on lhc exchangers lhe carion composition in pore-warer at a particular point requires some time (several nushings) before il assumes lhe composilion al the source In the front zone of a water type moving or diffusing into anolher waler type exchange effect can bc noticed in the cation composition This has been reported in many studies dealing with freshening of coastal aquifers (Appelo and Postma 1993) Due lO exchange processes the front zone of fresh groundwa1er flushing a saline aquifer is often enriched in sodium or magnesium with respecllo conservative mixing (based on conservashylive traeers like chloride) Calcium the prineipal cation in fresh water is then exehanged for sodium and magnesium which dominaled the exchange complex during the fanner marine conditions Sometimes even a chromatographic panem of groundwater facies with Na~CI
Na-HCO Mg-HCO to Ca-HCOJ water1ypes is observed (Edmunds and Walton 1983
52 53
Walraevemllnu Lehbe 1989 Stuyfzand 1993 Appelo 1994) Freshening and the accompashynying ciltion-echange may take place in young fiow systems developed below dunes and beach bilrrjer~ in aggrading Holocene plains It can also bc observed in much older and often deep 110 sySlem thaI have been active during thc last glacial or even earlier bUI have not entirely l1u~hed the formations becausc of low fiow velocities Salinization of formations Ie-ulting from a marinc tran~gresion cvokes the reverse exchange process and leads to a relative urplus or calcium or magnesium However this process is hard to recognize in lhe fidd a- the large odium concentrations in the passing Saline groundwater resull in rapid quilibration hetween the dissolved and ah~orbed phases (Appelo and POSll1lltl 1993) Ca-Cl and Mg-Cl water lypes are only obscrved near relatively rccenL aline groundwater intrushy-iom n~ar wdb (Stuyfzand 1993) and polders (Geirnaert 1lt)69)
6~ Dahl
For the present study hydrochemical analyse have been used from previous sludies (UNDPfVHO 1972 IWACO 1983 Ho Len Fal 1986 Poels 1987 Planning and Research CorpNation Iq88 Menlc 1990a I990b IWACOIFRHarris 1991) and unpublished analyshy-c of water supply companies In add ilion analyses were earried out on 95 samples collecshylld hy the author inllle period from 1995 to 1998 Most water samples were tapped from running production welb or were pumped from observation wells with cenlrifugal suetion PUIllP~ or small diallltcr suhmersible pumps (Annex II and 111) A special group are lhc water ample~ squeelcd from clay samples retrieved for this study from two percussion drillings (Vebtra 1997 in the Holocene coastal plain at Tounonne and at Koewarasan (Figure 31) The pereussion drillings have been discussed in more dcrail in Chapter 4
Most wmer sample originate from the Quaternary and Teniaf) formations in the coastal plain around Paramariho Two groups of analyses from oUlside the study area (Annex II and Figure 31) have been analysed as well these are groundwater analyses from the Paleocene oil hcarin~ and layer of the Tambaredjo oil field 40 km west of ParJmUlibo (Ho Len Fa 1986) and illlalysegt of shallow phreatic groundwater fram the savannah belt near Kabo 60 km southshywet of Zanderij airpon (Poel~ 1987) The sample~ from the study area are not evenly distrishyhtlled Oer the various formatiom Because most sample were laken from pumping wells and ohser31ions well of water-supply agencil~ the sample density is relatively high in the zones containing fresh groundwater with chloride contents less than ~50 mgll
The sampling and laboratof) procedures of the archived samples are unknown The amples taken for this study were analysed in the laboratory of the Vrije Universiteil in Am~lcrdam Sample were filtered in the field and stored in aeidified and non-acidified boushyles In the field pH electrical conductivity lemperature and ill some cases alkalinity were measured The soil samples were retrieved from the borehole in stainless sleellUbes which were sealed and cooled during transpon 10 the Netherlands Pore-waler was squeezed from the clay samples in the lltlboralory of the Eanh Sciences Faculty of the Universily of Utrecht
Stigler (1996) compiled lhe initial hydrochemical dataset The final datasel for this sludy consists of 221 analyses of all prineipal chemical components with an electro-neulfalishyIy imbalance of less than 10 Ie (Annex III) The chosen eleclro-neutrality imbalance is higshyher than the usual 5 Ck in order to include analyses from zones with a low sample density For this data also dissolved total inorganic carbon (TIC) has been calculated with the PHREEQC code Annex III also includes incomplete analyses (59) and analyses (47) with
an electro-neutrality imbalance higher than 10 1L In some qualilative interpretations of hydrochemical and isompic pallerns also incomplete analyses have been used
Information on the mineralogy and geochemistry of the Quaternary and Teniaf) fonnashylions has been found in studies of DAudretsch (1953) Brinkman and Pons (968) Levelt and Quakernaat (1968) Hartman (1969) Veen (1970) Eisma and Van der Marel (1971) UNDPIWHO (1972) Krook ( 979) Wong (1983 1989) and Poelo (1987) For this study the composition of elements on all Quaternaf) clays oamples from Ihe percussion drilling wa~
studied hy X-ray fiuorescence (XRF) For this study also cillion-exchange capacilies (CEC) have been delermined on 22 bulk
soil samples from the two percussion drillings (7 on PleislOcene clays and 15 on Holocene clays) In this procedure exchangers were saturated first with ammonium by rinsing wilh an ammonium-acetate solution subsequcntly the absorhed ammonium was displaced by sodishyum by fiushing with a sodium-chloride Solulion CEC equals the total amount of liberated ammonium (Velslra 1997)
Existing CEC analyses of Pleistocene clays (51) and Pliocene sand~ (17) were availashyble from other studies (Levelt and Quakernaill 1968 Veen 1970 Poels 1987) These analyshyses were carried OUl on the clay fraction only laquo 211m)
63 Hydrogeochemical cvolution of meteoric groundwater in the eoastal plain
631 RainIa and (apUfrUllspimrioll
Analyses of rainwater al Kabo by Poels (1987) demonstrale the dominanl innuence of marine aerosols though calcium and potassium are significantly enriched (Figure 61) This enrichment is probably the result of dissolUlion of pyrogenic organic aero~ols (Crutzen and Andreae 1990) advected from the African continenl (Prospera el aL 1981) On its way lhrough lhe canopy and the upper soil zone rainwater becomes more concentrated by evapomiddot transpiration Chloride contents in groundwaler at Kabo (Poels 1987) indicate that rainwater has been concentraled hy a factor of 64 (Figure 61) Coneenlration faclors for calcium and pOlassium are much lower because they are largely filtered out in the root mal (BruijnzeeJ 1990 Foni and Neal 199~ Grimaldi 1988) As discussed above the reactivity of lhe Pliocene and Pleistoeene sediments is quile low Therefore groundwater below the presenl recharge area~ of the savannah belt and the Lelydorp sands has remined the marine hydroshychemical signature of the aerosols (Figure 61) This groundwater is denoted here as pristine meteoric groundwater marked by chloride concentrations of less lhan 50 mgL This distincshytion is necessaf) as groundwater with higher chloride contents has a marine signature caused by salt intrusion (Chapter 3 and 4) The average chloride concentration of pristine groundshywater in the Pliocene aquifer in the savannah belt ranges from 2 to 16 mgll This groundwashyler is very young as il contains high trilium concentrations (Chapter 7 UNDPIWHO 1972) Pristine groundwater in the Pliocene aquifer below the Lelydorp sands contains more chlorishyde (IS to 45 mgll) which may be due to the proximily of the ocean at the time of infiltration (2 to 8 ka BP Chapter 7) higher evapotranspiration or leaching of salts from the overlying Pleislocene clays
54 55
020
----------- 160 A~erage 9ounOwaler In Zand~1 Formation 11
Savann2h Ionpound
tl Kabo(n=S2 l0 Poel5 lft87)
o Zanoenj n 61
~ o~
E E
l Q~I LLJ1LL-L-Ll-LtlJJ~ CI tliJ Ca ~q so 50)
00 Average rain at Kabo (n )19 Poels 9B7 f shy
~ ~
0
0
- groundwater In Aelage
ZanderiJ Form at Lelydorp (n 17)
~ r C Na K C Mg so so
0 Average seawashyter (Appelo 11shyPostma 993)
~
f shy
~ r shy 5 E ~
h-r0 CI N~ K c~ lAp SO $0 CI Na I en Ig so 50
Filun (11 Hyuroch~mi(al cornposiljo)l of rain [1rj_~lill meleoric groundwater anu cawalcr in
Suriname
63] OilwllllioN (( C(lrholl ill till wil oc
Acid Londilion lpH lt 5) prelail in Ihe soil and shallow phreatic groundwater in Ihe c[)astul plain (Brinkman and Pons 1968 Levell and Quakemaat 1968 Vcell 1970 Poets 19R7 They resull from dissolution ill the soil zone of carbon-dioxide gas and organic acids The taller give the strongcsl acid reactions McKnight et aL (1985) repon lhal these acids a lolllplcx of humic and fulvic acid~ Iypically buffer solutions around a pH of 45 as is also tht case in Ihe study area The prelience of organic acids is also apparent ill lhe numerous middotblack waLer creeb in Ihe savannah belt and the Pleistocene coastal plain
In ord~r to understand other hydrogeochemical and isotopic processes (Chapler 7) il is importanl to estimate the inilial contenl of dissolved carbon in the recharging groundwater According to a compilltltioll by Brook et al (1983) and to a study by Davidson and Trumbore (1995) in Brazil soil carbon-dioxide pressures in Iropical soils may vary between 10middot~ 10 10- - atm (10000 to -loOOOO ppmV) Given Ihis pressure range speciation calculashytions wilh PHREEQC showed that the initial inorganic carbon content of groundwater varies between 084 and 167 mmoill According to analyses by Poels (1987) organic carbon conshytents in savannah groundwater vary from 0 10 09 mmoVi (average of 017 mmolll) Therefore [he total amount of initial carbon of groundwater is expecled 10 be in lhe range of I 102 mmolll
56
Shallo middot phreatic groundwaler analyses from the present study and earlier investigashylions (Poels 1987 UNDPIWHO 1972) represent mainly the savannah bell and hardly the coaswl plain with its more dense and different vegetation The early hydrochemical developshyment of groundwater described above may therefore be biased However conditions in the savannah bell arc of panicular interest most of the deeper groundwater has been recharged during the LGM and Early Holocene (Chapters ~ and 6) when the emire coastal plain was loered by grass and shrub savannahs comparable to Lhat of he presem savannah belt (Chapterl Vall der Hammen 1974)
633 MiHemisolIfiol
Low feldspar contents ulld the absence of calcite and arugonlle in the Tertiary sedishyment- are signs of prolonged leaching by groundwater now (Krook 1979) Krook aIm believes thaL the mosily kaolinilje Teniary clays (of marine origin) origillaly had a higher comen of smeclites and illites and thallhey were later transformed as il result of weathering and leaching Despite lhe low reactivity of the sediments wealhering of detrital silicales bas led to enrichment in cations as can be observed in the pristine groundwater of the recharge areas (Fig 61) Cationchloride ralios are higher chan lhose of rain which is characterized mainly by dissolved marine aerosols Outside the prisline groundwuter the innuence of weashyIhering on [he groundwater chemimy is masked by salt imrusion StabililY diugrams in Figure 62 show Ihal kuolinile is the stable silicate phase in nlO~t circumslJnCes which agree~ wilh the hypOlhesis of Krook (1979) thai most kaolinite in the Teniary sediments consists of transformed marinc illites or smectites In saline environmens like Iho~ in which Holocene clays were deposited smectites form the stable silicate phase Carbonate dissolution hardly lakes place in Ihe Teniuf) sediments Mosl groundwater samples inclushy
Ca-sihcate stability diagram 16 -------~----=-C-M------- 12
~gc~~8 - ~ 6
4 co1~~- ac~~~~__~r__o____ ~ middot5 -3 middot2
Legend
ZandenJ fomahon In Savannah
ZandenJ fOlTTlatlon at Republlek wellfield
6 Zanderij and CoesewlJne Fm in Pleistocene coastal plain
Namiddotsilicale stability diagram 8 -----------+-----Nmml
)~ bull
2
o 91bbsl1e -5 -3 -2
Zanderij and Coesewijne Fm in Holocene coastal plain
bull Bumside and Saramacca Fm in Holocene coastal plain
bull Qualemary Clays in Tourtonne and Koewarasan boreholes
Figure 62 Siability diagrams of silicate minerals wim respeci 10 me groundwaler analyses from Ute eoasla plain of Suriname
57
2
0 q
0 ~ Sam les middotbull
-2
6~ ~alclte I sjenle
-ltl o pore waler cbullQUill cia sOi tifP~ 0bull I bull -6 glounClwillerbull cTertii a ulf bull
Silluril1l0n ndeo
groundwater In nvannah
4 5 6 7 8 9 pH
Figur~ 63 Saturation inuitc~ ror cltllcile llld lgtidcrilC for groundshyWaler III the coastal plain oj Suriname
07140
07130
07120
HOlOtene Clays
10 Pleistocene clays
bull aqlIteis
10 011 sands (S Fm)
bull
bull 0710 ~bull ~ 000
O7090~ ~
bull
bull
07080 07090jo
07070 o7DB8
o 2t 40 60
0 500 1000 1500 2000 2500 3000
Sr (mmol)
Figure 64 Strontium isotopes rlItm ilainSI strontium contcnshymllions in groundwller from the toasl~ plain of SUrinllTIC
12 x
10
XXbull8
is c 6E ~t bull bull bullbull S 4 Ic zanderiJ I bull bull0 0 u o 8 pi=
0 bullbull bull2 fSumalde bull bullbull11ee-J~1 go 0x Saramacea 00 -2 - 0 2
excess 504 Immoll1)
Figure 6S Exec55 sulphale against lotal inorganic carbon (TIC) for groundwater In the coaslal plain of Suriname TiC has been calculated with PHREEQC
S8
ding Ihose innuenced by salinization are under-salurated wilh respect to calcite and have pH alues lower Ihan 65 (Figure 63) Suontium-isolOpe ralios provide information on the
provenance of dissolved calcium as the chemically familiar element occurs concomitantly with calcium in most minemls (Faure 1986 Bierman et aL 1998) ~7SrJ86Sr isotopes ralios in groundwater samples Figure 64 l measured a the VU iSOlope laboralory proved to be much higher than the ralios for strontium in seawater and marine carbonates (Burke et al 1982) These relalively high 117S rJ8oSr ratios are ypical for strontium in the plmonic crystalline rocks of the Guiaml shield (Priem et al 1980 Vonhof el al 1998) Therefore dissolved slrontium and calcium 1I10S1 probably originmed form delrital silicales in the Tenia) sediments
6]4 Redox flJ(lCpoundsses
Calculated TIC contents of groundwater in the Teniary formations mnge from 2 to 8 mmollL However the estimated initial amount of carbon which is dissolved in groundwaler in the savannah bell at presenl varies between I and 2 mmol1 1l is assumed that at the time of recharge during the LGM and Early Holocene the initial TIC content of groundwater did not much differ from these values It follows that in absence of camonme dissolution oxidation of sediment organic maHer (SOM) must have led La the enrichment in dissolved carhon In the Pliocene and Miocene formations SOM oxidation is probably coupled ith iron reduction as groundwater contains relalively high contents of ferric iron but also sulphale II is likely that the liberated ferric iron has precipitated as siderite as many samples indicate saturation with respect to siderite (Figure 63) This corresponds with the observations by Krook (1979) who reponed thal these formations in panicular contain amorphous iron hydroxides and authigenic siderite while in the lower formations the more stable hematite and goethite dominate High TIC and low sulphate contents (Figure 65) and enriched BDCTlC values (Chapter 6) in groundwater of the deeper Paleogene (Oligocene Eocene and Paleocene) formalions give evishydence of sulphate reduction and methanogenesis The saline reactive Holocene clays form a completely different hydrogeochemical environment groundwater is generally satumted with respect Lo calcite which is present as allogenic and authigenic minemls in the sediments pyrishyte and TIC contents are high because of sulphate reduction and methanogenesis (Figures 66
and 67 Groen unpublished data) The same holds for the Cretaceous the source rock of the oil that is found in several place in the coastal plain This can be derived from groundwater samples from the oil-bearing sands at the bottom of the Teniary at Saramacca
64 Cation-exchange and freshening in the Pleistocene clays during the Wisconsinan regression
641 1mroductioTl
During the 100 ka of the Wisconsinan regression meteoric now systems in lhe coastal plain have nushed all saline groundwater formed during the preceding Sangamonian transshy
gression 1I is expected thai calion exchange has long reached equilibrium If there were any cation-exchange signals left they would be expected in the clays because of the high eationshyexchange capacities (see next section) This applies in particular to Pleistocene clays (Coropina Formation) in the southern part of the coastal plain which have not been affected by the Holocene transgression The following sections are mainly based on data from Leveh and
59
Total Total II tlcns CI HCO ~IanjnslE
I 1 11mB]8 0 lt ~
t l Cl ~
200 00 fmc g ~ ~5middotlI(e 0 4Q 600Jll 20 mmol~ mmaln mmltllil malr
I ~ 1 I~=g 0 1~
L
L__b_l_-l=JLll_---l_-l-__ deg l(l D 0 080-1[ 0 00 0 1Omiddot0~ 0
mmolr mmoln mmoVI malll
Fi~urc 66 Chcrnl~lry of pnrC-Ultr squcetl fnJm HO]OItnc clay sal1lple~ relrictu m ToUrtonnc CIshy~Iltl HCO-COnlcnt- arc nwl cOI(cntrlIiol1 Na- K- Ca- Mg- NH~- ltJill SO~-COnCnIS arc cxpnsscu 01- ClCSCllt will1 nspcl 11 conscfvalllC lI1iJing tIt seawater anrJ fresh gmunuwlcr I(kllion~)shy~(ani(lll~) irnballllc j given in mlllolll UllJ ltJ1~(l us plrccnlages
o
~ 1 ~ L ---
2 I g f___------I-----l--6 0 1- ---- ~f___-----Jdeg - -L --J l_LL-__--
1)O D 0 1(1 middot20 0 lO JO 0 0 _
m~m n1moln mmoln mmaln
E
l
1r
euro 1
~ ~o 0 bull0 0 ~ 0m_ 0 0
m~ m_ ~
Figure 67 Chemistry of pore-water squeezed from Holocene and PleislOcene clay samples retrieved at Koewarasan CI- and HCO-conlents are total concentrations Na- K- Ca- Mg- NHr and SO~-conshylCnts arc Cilprcssetl as eltsses with respect to conselValve mixing of seawater nnd fresh groundwater Eltkationsl-1(anions) imbalance is given in mmoll am] also as percentages
60
Quakemaal (19681 and Veen (1970) who carned out physical and chemical analyses on clays in this area
642 Obserlariols
Calion-exchange effecls in the Pleis(oeene clays are expected to be large beeause of the high CEC CECs of 7 samples from the Koewamsan borchole vary from 161029 meqlOO g of dry 50il with an average of 24 mellllOO g The CECs of 5 samples from the studies in the southern pan of the coastal plain (Levelt and Quakernaal 1968 Veen 1970) are consishyderably lower (average of 12 meqllOO g) This may be due LO the higher silt fraction in lhal pan of the coastal plain Also these CEC were calculultd on lht basis of analyses of clay fraetions only whieh may introduce errors Average base saturation for the samples from lhe boreholes is abOUl 34 C The low base saturation is normal for Ihe present day acid condishylions but in more mineralised and less acid groundwater base salUralion would probably be higher
A typical depth profile of the calion composilion on the exchange sites of the Coropina clays is shown in Figure 68 Magnesium appeared to be the dominlOl cation adsorbed to the exchange sites followed by calcium In the first inslanee one is tempted to attribule the high magnesium content of lhc exchange sites to the marine origin of the clays which would imply thm the calion-exchange process has not been compleled This would he in accorshydance with lhe suggestion made in Seclion 541 thaL the higher chloride col1lents of pristi~
nc groundwaler below the clays may be the result of leaching of residual salts from the 35
SangamOlJiiln clays On the 30 other hand the currently infilshytrating water is nOl very minerashylised and has a low calcium concentration (Section 63) Also Levell and Quakemaal (1968) repan very dilule pore~ 10
waters This raises the question of whether the observed cation composition of the exchange o 5 10 20sites is in equilibrium with the depth (m) infiltrating waleI These Figure 68 ExchangeJble cations and cxchJngc capacity of questions will be addressed by PleiMocene clays in the sOUlhcm part of the coastal plain of cation-exchange modelling in Suriname (unpublished dala from Levelt and Quakemam 1968) the nexl secllon
643 CarioJ-excltJllge simulariolls
Model sel-up
Cation-exchange occurring along with freshening of the Pleistocene clays has been simulated with the PHREEQC code for hydrogeochemical modelling (Parkhurst and Appelo 1999) Simulations are restricted to processes of one-dimensional advective and diffusive solute transpon and cation-exchange The results are compared with observed cation composhy
61
Silions of lhe exchange site of the clays in the southem part of the coastal plain (Levell and QuakemaaL 1968lshy
In the reference model a venical column of J2 cells with lenglhs of 1 m each represhyent~ lhe clayey Pleistocene Formation This corresponds to an average thickness of the forshymation varying from 2 to 20 m In the model an effeclive CEC of 600 mmolll was applied (ba~ed on the average CEC of25 mgiiOO g of dry soil bulk density of 18 grcmJ porosity of (U and an estimated bae SUluralion of 40 K l For the diffusion coefficient a value of 7 x 1(J-II m~~ was used hased on the chlorine isotopc study (Chapter 4) The exchange coeffishy
lint~ AuC and Kf~ (Equmion 52) of 04 and 05 are average values based on a compishyhllion hy Appelo and Postml (1973) Other hydrogeochemical processes like oxidalion of ryrilc~ and -elliment organic maHer and calcitc dis~olulion have not been accounted for hClau~ (i) the lower pan of the Pleistocene days had alrcady heen imenli]vely oxidized during an early rcgrcs~ion phase in Ihe Sangamonian or even during the Illinoian (Saalien rl~nsion (Vccn 1970) II1d (ii) it is assumed that during the prolonged Wisconsinan regresshyion the day quickly lOst their reactivity and cation-exchmge became the dominam proshyl~ The simulmion- cover a period of 105 ka from the end of the Sangamonian (around 115 ka BPl ransgression 0 the Holocene transgression (around 10 ka BP) In each simulashytion exchange sites arc irst equilibrmed with seawater reprelienting the situation during the Sangamonian transgression As a result exchange siLes become filled mainly by sodium and magnesium Freshening hy diffusive transpon during the Wisconsinan is controlled by fiKed ion concentralion~ of fresh groundwater at the lOP and the bOllom of [he column With re~~
reel () the laller houndary condilion it is assumed that during the Wisconsinan the underlyshying Plimene formation was rapidly flushed by meteoric groundwater For the fresh groundshywaler It the bottom the composition of average Lelydorp groundwater was chosen At lhe lOp fresh water wilh a theoreical composition was imposed chloride concentration was set equal III the average of groundwmcr helow Lelydorp and calions concentrations were proshyportionallo thaI of chloride as in seawater (Figure 69) For simulations of freshening by adeclive Iransport the laller water type wn~ used lo nush the column The now rJte through the column was based on a recharge of 30 mmla and an effective porosity of 30 Estlmilted dispersiviy for adveClive trmsport a~ set at 01 rl1
The sensitivily of the diffusive and adveclive freshening models has been ested by varying model parameters between reasonable end member values In Table 61 the parameshyten used for the various simulations are lisled Simulations 1 and II are the reference
models for diffusive and advective salt transport respectively Aso the chemical composishytion of water at lhe top boundary condition was varied instead of the theoretical fresh water composition with a marine signature (dilute marine) also runs were made with average Lelydorp groundwater althe top (100 if Lelydorpl and a water type fomling a mixture of average Lelydorp groundwater and the diluted marine water (50 9 Lelydorp)
Resull~
The most interesting results of the simulations are shown in Figure 69 The concentrJshylions of dissolved and exchangeable cations are plaued against depLh Simulation I demonshystrates that diffusion alone is nOI able Lo drive out all sodium from the exchange sites (Figure 69lt1) This also applies to other simulations under conditions that enhance the exchange like small layer thickness (simulation 2) maximum and minimum selectivity for magnesium and calcium respectively (in simulalion 4) small effective CEC (300 mmolll in simulHion 5) and high diffusivity (10 x 10middot10 ms in simulation 10) Figure 69a shows that
dffuslonfwalerlypes 1 and 3
20 r-r-----=e- 400
s ~ 15 300 ~ E E 10 200 ~ bull
~~ ltII 05 100 -5
~
a o 2 4 6 8 10 12
deplh in m
advechonJ waterlype l recharge 5 mmfa
0 ~J~~O~l400
08 f 300 i~ 06 I~~~~~
Sim20s s 200 ~
~ 100 -5
~
a o 2 4 6 8 10 12
deplh in m
advectiON walertype 1 r~harge 30 mmfa 10 400
08
~ 06
ls 04
02
a
~ LIi~~l=sect~te
Sim11
o 2 4 6 8 10 12 depth in m
advectionl walerlype 11 recharge 55 mmla
10 400
if08 300 ES sE06 s Sim21 200 ~
c 04 ~ S lt ltII
100 ~02 bull
a a o 2 4 6 8 10 12
depth In m
adveclionl watertype 2J recharge 30 mmla advectionl watertype 2J recharge 30 mmla high Mg seleclIlJlly
10 e 400 10
08 Sim18 08 Sim19300 i
~ s ~ I c---~+E 06 EO61- I bullbullbullbullbull 11 s 200 g s
04 ~ 04~ bull bull I bull bull bull I
oeeeeeeeeeeo Ai 1= ~ Samp Ail amplt
100 ~ lt1 02 ltII 02 bull 11L
a a aa 2 4 6 10 a 2 4 6 8 10 12 depth in m depth in m
300 ~ s
200 sect ~
100 -5 ~
a
advectlonl waler1ype 2J recharge 5 mmfa Legend high Mg selectivity Salutes
-a- N
-a- ~ 5 300 ~ __ CO
20 ~J--=~iiiil400
-a- 1 5E Sim22s 5 s~O 200~
c - 10
Exd1 callon5 ___ NaX
05 100-5 0~~GJ~
~ ---+- MX2
i a a -- CaX2 a 2 4 6 8 10 12
depth in m
Walerlypes
bull 1) dutll mllnne wale (CDIlUrIItraled rain)
II 2) 50 k mil o llltydal graurKlwllllf lind dilute ITiInnu_llJf
0 3) 100 10 Lelydorp 9~undw3ler
Figure 69 Simulated concentrations of dissolved and exchangeable cations and chloride in Pleistocene clays after 105 ka of freshening during me Wisconsinan regression PHREEQC models simulate fresheshyning by vertical diffusive and advective solute transpon (recharge) and cation-exchange (see Table 61)
63
400
62
the release or sodium wkes place more quickly at the bouom of the Pleistocene clays This is caused hy the relatively high calion concentrmions of the bouom boundary condilion (100 If( Lelydorp groundwater) Simulltltion 7 with 100 9( Lelydorp groundwater ltI Op boundary condilion results in ltI faster equilibration ltIt the Op ran but sodium is still not driven out Though diffusion mltlY not hltlc led to complelc cltltion-exchange the process itself i~ ltlst enough to dric out the chloride ltlnd other conservalive solutes from the original saline poreshywater il appears Ihal after 35 ka (one-third of simulation period) thc lotal concentration (mcql) in pore-water has ltII most reaehed the total mncenlrmion of the solutions at the bounshydaries
Freshening hy ltldvectie lransport with the reference model (simulation II) is also not sufficient (l reach equilibrium between the solute infiltrating at the top ltlnd the exehange sites (Figure 69b) Varying pltlramelers such as the recharge rates (5 II1ma in simulltltion 20 and 55 mmltl in ~ilnulalion 21) has some elTeet though the exchange equilibrium franl does not reach the bOlom or the days (Figures 69c and 69d) Raising the cation concentra~
lion in Ihe infiltrating groundwater 11ltIS a much larger effeet as the quantities exchanged hetween dissolved and adsorbed cations are larger If 100 9 Lelydorp groundwater is alloshywed to inrihrale (~imulalion 17) the entire clay column reaches equilibrium Wilh the infihrashyling water If SO h Lelyuorp groundwaler is used (simulalion 18) Ihe bo[om part is not completely equilibrated with he inriltrating water (Figure 6ge) The equilibrium MgXJCuX ratio is about 13 which is slilllower lhan the observed rmio of 4 (Levelt and Quakernaat 18) In simulation 19 the same mixcd watcr Iype was lised together with a maximum
sdcctiit~ for magnesium (Kxoc = 06 and KIM~= OAl Equilibrium is reached everywheshyre with this model With a MgXCaX ratio of aboui 6 (Figure 690 In simulation 22 which comhincs simulation model 19 with a low recharge rate of 5 mma the exchange front did no reach the bOllom (Figure 69g) This indicates thal relatively high reeharge rates (gt 30 lllllla) during thc Wisconsinan are likely as was concluded in Chapter 4 based on the paleshyohydrologicalmodel Willi the incised paleovalleys
65 Cation-exchange and salinization in the Quaternar~ and Tertiar) formations during the HiJlocene transgression
65 lJ1frodllcriOl
Whcn the sea inundated the present coastal plain during Ihe Early Holocene fresh groundwater in the Tertiary aquifers Slopped nowing and became subjected to salinizalion from above and below muinly by diffusive solute transport (Chapler 3 and 5) It was demonlrated in Chapler 5 that downward diffusive transport in the coaslal plain reachcd a maximum depth of -125 m Deeper salts have been rransported from below by diffusion and Imeral dispersion during regression periods with deep groundwater flo In the neXI sections cation-exchange is tudied occurring during the downward diffusive salt transport This study is mainly based on analyses of pore-water recovered from clay samples from twO boreholes m Koewarasan and Tourtonne and analyses of water from existing wells
6520bsenQrions
Because of lhe high smectite contents of the Holocene clays CECs of 15 samples from
the Koewarasan and Tourtonnc boreholes are relatively high arying between 18 and 3~
meqllOO g with an aerage of 25 meqlOO g CEC values for the Pliocene sands vary from 01 to I meqll 00 g dry soil with an average or 06 n)cqlOO g Base sltluration of the ltlcid savannah salld~ is lesgt than 20 7c
Holocene clays lCoronie Fm1 The pore-water analyses from the Tourtonne and Koewarasan boreholes ltIre displayed
in Figures 66 and 67 In these ligures cation and SUlphate concemfations arc expressed alt excesses and delicits with repect to mixing of fresh water and seawater based on chloride content At Tourtonne ltI 25 m thIck succession of Holocene clays is found covering a period of about 10 ka In the rCJctive Holocene sedil1len~ the original seaWaier compositIon Ims been transformed by sulphme reduclion Ilhich produced large quanitie~ of bicarbonate lind consequently by precipitation of ealcile and pyrite Velma 19(7) Because the ~ea
withdrew from this arca only 500 years ago the chloride concentrations tire still close to lhose in seawmer (Section SA I) The loss of dissolved ealeium j partly compensated hy desorplion of caleium from the exchange sites coupled with admrption of sodium and ammonium The net result of lhese proeesses is a delieit for dissolved sodium as well as calshycium These processes are best illustrated by samrle T21 (Figure 66) The Olher samples have a relatively large imbalance in ion electro neutrality mainly causcd hy inaccuracies in the sodium ltlnalyses
At Koewarasan where marine innuencc lasted from ahoulolO 4 ka BP only the upper 6 m consist of Holocene sediments Pore-waler salinities are much lower than at Tourtonne (Chapter 4) Here the reverse process becomes apparent (Figure 67) pyrites formed during and shortly after deposition have already been oxidized leading 10 acid soils high sulphatl eOlllents in pore-waler and dissolution of carbonates Veltra 1997)
Pleistocene clays (Cororina Fm) Pleistocene clay have lost most of their reaetivity due to prolonged weathering during
the last glacial (Veen 1970 Levell and Quakemaat 1968 Section 16 tn Annex I) A a resull salinization by diffusion from lhe overlying Holocene sediments results only in calionshyexchange as ean be observed by the calcium excess and sodium deficil of pore-water in Figure 67 The magnesium excesses or deficits diplay a more erratic patlern
Neogene fonnations Cation-exchange pauerns in the Neogene formations should be tudied along the verlishy
cal diffusion path just as in the Quaternary elays However thi was not possible since samples were taken from different wells far apart Therefore instead the chloride concenrashytion was used to mark the advancement of the diffusion process (Chapter 5) In Figure 610 excess cation concentrations of all wells in the coastal plain have been ploued against chloshyride concenlrations in mmol1 Ion excesses (and deficits) have been delermined with respeet 10 mixing of seawaler and fresh pristine groundwater below the Lelydorp sands (Figure 61) The latter is supposed to be the dominant groundwater type in the formations before the Holocene transgression Samples affecled by salinization (Cl gt 50 mgI or 14 mmolll) have sodium deficits balanced in milliequivalents by calcium and magnesium excesses This is a sign of cation-exchange in this ease related to diffusive salinization Figure 610 further shows thai cation dericits and excesses increase linearly with chloride contents This is nOl expected because of the non-linear relation between selectivity coefficients and concentrashy
64 65
Zanderij and Coesewijne Formations
cr (mmoUIJ
Figure (1111 Ecc~~ ion~ nll1tcnts in the Plilllenc and Mioccne romlalions (Zandcrij and CoesclOijnc hll ) agauN chlliride cOllleru~ E)ccs~ ion~ concelllraliom are cxprcssed a~ cxccsscs relmive to the ellCClcd nlllcemrmioll from ClI1~erlive miing or frcsh groundlOalcr (groundwalcr in Plioccnc romlashylillll~ rcchargcd oelo the Lelydorp sltlnd j and seaWacr MLdng nuios arc bascd on chloride cnlllcms
tion (E4uati01 5~) and IIc chromatographic order of cation release from the exchangers Thi~ sug~est~ that in the Tertiary formations which have low CECs cation-exchange is ncgle~ihle Therefore the observed cation-exchange signature of groundwater in the Neogene formltltiolls has probltlbly hcen formcd in lhe overlying PleislOcene clays
Sligter ( 1(96) plotted the calion eCCSSCS of some samples against the distancc to the cOilstline Th~ givc~ essentially the same result since chloride concentrations generally illclcae toward- the north where diffusion started carlier on the sloping Pleistocene surface
Groundwltlter also displays sulphate excesses with respect to mixing which cannot be explained easil~ Pyrile oxidation has probably taken place but the deeper pan of the Holocene c1ltly the source of the salt i strongly reduced and has low sulphate contents
Paleo(lene formations Figures 611 and 61~ show the dala for the Oligocene (Burnside) and
EoeenefPaleocene (Saramacca) fornullions Here a complelely different patlern emerges Sodium concenlrations are in exces~ while calcium and magnesium do not exhibit clear excesses or defIcits This pattern is most outspoken for the samples of the Paleocene fonnashytion (T-sandsl from the Tambaredjo oil field Most of the sulphate is reduced The low conshylcms of dissolved iron whieh has precipitated as pyrite_ are probably related to this As h~s
been discussed in Chapter 5 the solutes al these deplhs most likely originale from the saline Creraceous (Figure 35) Due to lack of sufficient infonnation on hydraulic and hydrogeoshychemical processes at lhese depths no attempt has been made to analyse these observations in more detail
653 Carioll-excIlge simulations
Model SeHIP In lhi~ section the hypotheses
regarding the salinization of the Pleistocene and Neogene formalions (Section 45 and Chapter 4) are verifishyed by PHREEQC modelling Simulations in lhi- case are restricled to diffusive solute transpon (Chapter -1-) and calion-exchmge The resuhs are compared with the groundwater chemistry of the Neogene formations
The reference model consists of a column with 12 cells at the lOp rcpreseming the Pleistocene clays folshylowed by 113 cells for the Tertiary -ediment~ All cells have lengths of I m The effeclive CEC of the Terliary is quite low 144 mmolll and is based on the average CEC from swdies hy Poets (1987) ltlnd Level and Quakernaat (1968) of sands of the Pliocene Zanderij formation Diffusion and exchange coefficients lind CEC for the clay are equal to thosc of the previous freshening model (Table 61 ) For lhe CEC of the Tertiary sedimems in lhe reference model a value of 14 meql is uscd The downward diffusion process was allowed to continue for a period of 10 ka which corresponds 10 Ihe length of time afler the sea had reached the presenl coastal plain in the Early Holocene
In all simulalions pore-waler in lhe cells has the composition of averashyge Lelydorp groundwmer prior to the Holoeene inundalion The inilial cation composition of lhe exchange sites of the Pleistocene clays was derived from the fmdings of Levelt and Quakernaal (1968) and Veen
(1970) The initial cation composishytions of the exchange sites of the Tertiary formations were detennined
lt E 0
~ 9
~ -1
middot2
middot3
Burnside Fonnation
= = 0
C0 =
A
bull
~ - bull~~D ~ =bull A
C
i8Na I
c_c i GJ =-$0
0 8 12 Ct (mmoln)
Fi~ure 611 Excess ions cOnlcnts in thc Oligocenc Fomlalinn (Burnside Fro) againsl chloride comem~ Excesshyions concentfilliom arc expressed u- exccsses relalivc 10 lhc cxpectcd concentnlliun from elnscrvltlllve mixing or fresh groundwatcr (groundwaler in Plioccne f(lmllt1tion~ recharged below the Lclydorp sandsl und scawaler Mixing r-uim ltIre bascd on ehloridc contcnts
12
shy~ a
4~
~ ~ 0
~
~
Oil sands in Saramacca Formation
D D
Dco i g DC
0 cr 1 0
-en
D
shygt0
bull
x~middot~o~ _ o 20 40 50 80 0
Cf (mmollll
Figure 612 Excess ions contents in lhc oils sands at lhe basc of lhc Palcocene (Saramacca Fm) against chloride conshyIcms Excess ions concemrmions are expresscd as exccssCS relative 10 lhe expected conccntration from consenllic mixing of fresh groundwaler (groundwater in Pliocene forshymations recharged below lhe Lelydorp sands) and seawatcr Mixing ratios are bascd on chloride contents
67 66
bv PHREEQC ilsruming equilibrium with porc-waler For the diffusion fixed concentrashyli~m~ of ~aline waler arc impo~ed at the top of the column These concentralions are derived rom pore-water malyses of Ihe Holocene clays at Ihe botlom of Tourtonne borehole (samshyple T~ J) The regre~gtioll and the ~ubleql1enl upward diffusion arc not taken into aeeoum agt in chapter -I The sensitivily of the model Wlgt tesled for the range of paramelers lisled in Tahle 6~ For hc chemiell boundary condition a the 1ltJp also pure seawater WlS ugted and llle c()ll1p()~itioll of pore-waler gtarnple K) from the Holocene day in Ihe Koewarasan boreshy1101middot Tlli sample has a relatively low salinlt~ and IS inJ1uenced by pyrite oxidation
fc ulb --Ill Figurcs 61 )t and 6I)b the total coneentrHlon- ne shown for solutes and lhe
exthangeabk taliolls respecllvely againsl depth according to the reference model (simulashylion 11 ln Fi~urcs 6I)c and 61-11 excess concentrations of catiom have been plotled ~aimt depth and chloride concentration respectively Excess concentration is defmed as lhe L~ce~~ (or deficit) with respect to mixing hetween seawater and average Lelydorp groundshywlter Plouing excesses againsl chloride allows comparison with the analyses shown in r-i~ure 61 O Fi~urc 613a shows how lhe simulltHed chloride concenlralions decrease rapidly dwnward app-roaching the background value of Lelydorp groundwater at 75 m below lhe lOp or lhe Pleistocene Coropina Formation This is in agreement with lhe measurements and lnalvliLltl1 simulations of Cblpter 4 It should be noted however that the PHREEQC model doe~ nOI Iilke into accounl the effecl~ of Holocene sedimentation and regression Figures 61~c and 6 14a show lbat diffusion of salts igt accompanied by Calion-exchange This proshyc~s~ leadgt (l sodiulll deficits and calcium and magnesium exce~ses with respecltO conservashytive mixing Clearly eXlhange ha~ not reached equilibrium The exchange takes place mainshyIv in the Pleisloc~ne elay with its large pool of exchangeable caLions - 111 the Tcrtiarv formations there is little exchangels can be seen in Figure 614a
which -huw- the ((ulsilinear relationship between chloride and cation excesses The simulashyli~111 results compare favorably with lhe chemical analyses shown in Figure 610 though the
Me~~jCa~~wratio of 2 in the Tertiary formalions is lower than lhe ratios derived from the lnollse~ t3 to 6) Nevcrtheless the results suggesl lhal the hydrochemistry of the Tertiary fornalions is largely defined by conservative mixing of old Pleistocene water and downward diffusing salts which has acquired its composition by Calion-exchange in lhe Pleistocene clay~ The high Mg excess is explained by the dominance of Mg on lhe exchange sites in Ihese clays prior to lhe transgression as measured by Levelt and Quakernaat (1968) and Veen (1970) Most of the sensillvity tests show more or less lhe same results
The maximum scleetivity for magnesium used in simulation 4 is nm likely as it leads to almost equal magnesium and calcium eXcesses (Figure 614b) In this simulation less ma~nesiulll and more calcium is released from the clays inilially Simulation 13 with maximiddot mu~ effeclive CEC (1200 meqll) for the Pleistocene clays and minimum effeclive CEC for
the Tertiary fomlations (2 Illeqfl) resuhed in Mg~cCaCwgt ralio of 35 and provided the best malch wilh lhe analyses (Figure 614c)
66 Discussion and conclusions
Most groundwaler in the coastal formations is mineralised because of salt inuusion (Figure 35) Pristine groundwater is only found in the savannah belt and below the Lelydorp sands
bull
This water even the relatively old pristine water aI Lelydorp (gt I ka BPl has retained a rainshywaler composition because of the low reaclivity of the sedlment~ The Pleistoeene and Tertiary formations contain hardly any calcite and weatherablc silicmes (Krook 1979 Selttion~ lA 15 16 in Annex I) which is a sign lhat the coastal formJtions experienced intensive nushing by mcteoric water during protraeted regreisions (Chapter 4) The present swgnam flow conditions in the coastal plain (Chapter J) are the exeepllon rather than the rule considered 011 a geological time scale
Most groundwater is acid (pH less than 65) and undersaturaled wilh respect to calcite
1000 C-- = bull
5 100
~ sect 10 Sim 1
bull~ g
25 50 75 100 125 10 20 30 deplh (m)
1000 rn---------b 10 b----------shy
9~ 100 ~
Sim 1
~ ~ -20 -h~9h~M~9~~I~~~~y---_---__=
25 50 75 100 125 a 10 20 3 depth (m)
CImmolll)
cr (mmolll)
o
c
Sim
5025
N
depth (m)
Figure 613 Simulled concentralions of dissolved and exchan2eable cations and chloride in the Pleisto~ene and Neogene fonnations arler S ka of salinization durin the Holocene lransgression PHREEQC shymodels simulille venica diffusive solute transpon and cation-exchange Saline source is pore-water from Holocene clays (SimuJalion I in Table 62)
10
~ E
0 6 ~10 ~
lJ
~ 20 -I~-C~E~C~T~-m-- ~___
a 10 20 3C
Cl(mmOlIlJ
Figure 614 Simulaled concenlrations of dissolshyved and exchangeable calions in the Pleistocene and Neogene fonnations after 8 ka of salinizashytion ploned against chloride concentrallon PHREEQC models simul03te venical diffusive solute transpon and cation-exchange Saline source is pore-water from Holocene clays (see Table 62) Three different simulations are shown (Simulalion I 4 and 13 in Table 62)
C
Sim13 high Mg selel11vl1y high CEC Plels clays
c
N
69 68
-----
In the deeper formmions below a depth of 150 m and in the Holocene claygt_ sulphate reductishyon und rntthanogellesi~ ha~ wken place
The Pleislocene day~ in the ~oulhem pUrl of the cmmal plain contain fresh pore-waler now while Ihe exchange ~ites of llle cluy~ are mainlgt occupied by mngnesium ions Silllulatiom with Ihe PHREEQC hydrageochemicnl code ha IhH (hi~ cunnOl be explained (I~ dirru~ic ~olute lranSp0rl during the Wisconimm regresion Advectie trolnspon correshysponding 10 a recharge of morl thun 5 mma i required 10 accounl for thi effect This is in agreenllH wilh the rlJ1ding~ of the nUlllericul pilleohydralogitmiddotulmodel which showed Ihm a rdalilly high and widespread recharge IllllL havc persblcd during Ihe Wisconsinul1
GroundWltller in the Plei toccnc ilntl Ncogene (Zallderij und Coescwijne) formations in Ilk nonhcrn lnd Holocene pan of llie comal plain i affected by tliffusive downward salinimiddot Ialion (Chilplcr Sl Catiunmiddotc~change uSOCiUlcd wilh Ihe salinl_ltlliol1 i rccognied hy the ~ollillll1 dericil~ ~l1d ll1ugncsiul11 and calcium ece~se with respect 1(1 lonservative mixing of frlsh wI1Ir and scawater DilluSltlll and caliol-exchunge simulations with Ihe PHREEQC code lorHur WJlh this showing a good corre~p()ndence between ohserved and calculated Imiddotalion deficit and excesse~ The cUlion-exlhange appears to have taken place mainly in lhe Pkis1lccne c1lyS CEC in lhe Teniary formalions are very low and alts from the overlying Quullrnary day hamiddote mixed conservltIlively wilh the fresh paleogroundwaer This explains Ihl uniform mtiu or cation deficils ami exces-es in the Neogene larmations
In the Plcogene rBurnside and Saramacca Formalions) groundwater generally has sotlishy1lI11 cxccsc Salinization and ca(lol-cxchange processes in these deep formations cannot be rll(ll1strulletl
- _-----shy
Sil11 ChCI1Ct1Illp ChlllL tnmp Clllumn CEC K-lI(~ DilTuion Recharge Longit Ilr Top ~ol(lm Ilnglh coeffk ralC uipers
(Inl (mmolIl (Illcs) (mma) (m)
K~~l~
uilulIJ marine mor Lclyulrp 6() 0-1 U5 7 101(1
dillileu iIlarinc 100r- Ldyuorp ( 000 0-1 05 7 x 10 111
Jiluled marine ]jOt- Ldyuorp 600 0-1 05 IOmiddotllI 4 11iluled In-Irinc I(lOK Ldyump 600 06 0-1 7 x 10 III
dilulcll1larinc ](JflCk Lclydnrp 3()1 04 Oi 7 10 111
I dillilcu Inarim 1UOCk LelyJorp 120[) 04 Oi 7 10 111
100ii- Lcl~dnrp IOOIfi Lclyuorp 6()) j-I 05 7 10 11
dilIlCU marine uilllteJ marin 600 0-1 05 7) 10 10
II uiluleJ Illlrine I()()lt Lclyunrp 600 04 05 4 I (11I
III uilulCd marine I()lr LelyJ(lrp 600 0-1 Oi 10 x 10 II ~
II Jilulltd mlrine 600 04 05 10 10 0 01
dillllCtl marine 6 hOO 04 05 7 10- 10 0 01 I~ UillllCU marine 4 (i00 04 05 7 10middot(1 0 01 14 JilulCU marine 11 000 06 04 7gt IO IU 0 01
uilulcJ marine 300 0 05 7w 10 111 0 0116 uilulCd marine 1200 04 05 7 10 111 0 01 17 ](lOr Ldydl1rp 000 04 05 7 x Wmiddotw 0 01 IS 50r Lelyoofll 600 04 05 7x 10¹⁰ 0 0 IY 50i( Lclyuorp 600 06 0 7 x 10¹⁰ 0 0
20 uiluled marine 600 04 05 7 x 10⁻¹⁰ 5 01 (~~r
diluled marine 600 0 05 7 x 10- 10 55 01 2 50-- Lclydorp 600 06 0 7 x 10¹⁰ 5 0
y~
Table 61 Simulation parameters for modeling calion-exchange in a column of ori~inally saline Pleistocene clays in Suriname as a result of freshening during lhe Wisconsinan
70
----------
Sirn Cherncomp Chem compo Column lenglh (ml CECtmmol K~gtiC KJM~ Diffu~ion
N- lOp hotom c~nic
Plei~t Tertiun PleisL Tertiarv m~~l
saline T21 IDO7( Lelydorp 113 600 04 05 7 ~ 10 1
saline T21 100S Lelydorp 6 II ~ 14 600 0 05 7xlO 1II
sal inc T21 1007pound Lelydorp 4 113 14 600 0-1 U5 7 ~ 10 111
4 saline T21 1007r Lelyuorp IlJ 14 600 06 0-1 7 x 10-IH
5 saline T I 1007( Lclyuorp 113 14 3()1 0 05 7 X 10-)1gt
6 saline T21 100ck Lelydorp 113 14 1OO 0 05 7 ]) III
7 hrakish K3 1007lt Lelydorp 113 14 600 04 05 7 Illmiddot II
X saline T21 100il- Lelyuorp 113 600 0-1 05 7 I(I-lil
9 ~ulinc T21 IOOlk Lclyuorp JI1 24 600 O- 05
7( 10 111
10 ~eUWUlcr 1001l- Lclyuorp 113 14 O)) 04 05 7 x 10 III
II saline 121 I)(Jlif Lclydorp 113 14 600 04 05 4 III saline T21 10(llr Lclyuorp 113 14 (iOO 0 05 10 x 101 7) 10 111j) saline T21 mOCk Lclyuorp l~ 1200 01 05
Table 62 SimulJlion paranlelerS for nlouellint ltation-exchangc in a lolunln of Pleistoccne and Ncoglnc rormation~ in Suriname a a result of salinizalinn uuring the Holocene transgreslon
71
Chapter 7
Isotopic signals of the hydrology and paleohydrology in the coastal plain of Suriname
71 Introduction
In lhi chapler the isotopic puameler- (~H middotH IC I~C and 101 in gmundwler ar -audicd They may add new information on the paleohydrological conditions in the coaslal
plltlin or SUrinOlnle_ There io ahundanl literature on the applicalion of these iiotopes to detershymine vurious aspects of groundwater like origin mixing now system age tinct recharge but also of (palco)tcmperaUrc~ vegetllion and rainfall patterns (Clark and Fritz [997 Kendall and McDonnell 1998 Cook and Herczeg 2000 Mook 2000a)
In Chtlptcr 4 u reconstruction was presented of the LGM landscape based mainly on earlier studies the nll Pleistocene surface of the coastal plain and the cominental shelf had heen dissected by Ouvial erosion during the Wisconsinan low stand rainrltlll was about half the present-day value and more concentraLed in the long rainy season while temperatures were ahout 4 to5 oC lower [han IOday the eleated interllllves were covered by gras~ and shruh savannahs while the incised alley~ were hordered by g~l1lcry ronst~ The Sammacca and Surinnme rivers running through deep (gt 10 Ill) vnlley~ were probahly perennial while [he [rihutaric~ had an ephemeral chamcter In this chapter I will use isotopic informntion mltlillly to define groundwater ages and no patterns and to obtain more insight in vegetashytion and rainfall pauerns
72 Data
72 J Nell (IIwyIlt
~C~i~rJ_~_
For this study 30 groundwaler samples were gathered They were analyzed on I-IC isotshyopes by the laboratory of the Center for Isotope Research IC10) of the Groningen Unirersity (the Netherlandsl For these analyses groundwltlter samples of 30 liters were collected in plltlstic containers In Suriname all CO~ gas was expelled from the eonlainers by adding acid and injecting air The gas was led through a lUbe and released in boule with a NaOH solushytion where the gas dissolved as carbonltlte and bicarbonate The [-IC isotope radioactivity was detemlined hy measuring ~ decay events in a low baekground proportional counter filshyled with thc purified sample CO~
The [-IC content is expressed as a percentage of the measured activity (11) to lhe activishyty of oxalic acid from 1950 (ao) the standard for modern atmospherie carbon The accuracy of I-lC analyses of this slUdy is about I (standard deviation) The accuracy is dependem on counting time and counter volume For groundwater samples an accuracy of 1 (stanshydard deviation) is normally sufficienl
72 73
Groundwiller samples have become slightly depleted in ~e isotopes by CO2 los~
during transpon hee next ~eclionl bUl the effecl on I~e content expressed as a percentage of nlockrn carbon is negligible
I C-iMll~ I C12C isolOpic ralios were analyzed by CIO on w groundwaler samples To aVOId
hilllo~ical reacLi()n~ and fractionaLion all I~-KI solution was added to the sample~ The ral1o~
arc n~easured on eo~ gas expelled from Lhe Wltler ny orthophosphoric acid Rat~os ar cxprescd as ope middotullles These arc dcilion~ in per millofthe musured DCI_C nlt~o 01 thc sample with thUL or the internmional VPDB culibratlon matenal ~c~uracy of 01 ~
nlealIremcms is (Jl rtl It appeared thaL many meusured OlC values 01 dissolved tolalmor il11ic carhon ITICl were inlluenced hy loss of CO~ gas in the period between sampll11g ~nd
~nalsis Lo~_ or C02 vhich is isotopically light with respect (0 hicarhonatc leuds 10 higher 81lelIl vallles and higher pH The latter was ohserved in the differencc helween lahoratory
pH and field pH of most samples For mmt samples CO~ loss could he e~t~maed hy sub- tfltlclin the amount of TIC measured a1 the CIO Iltlboratory from the ongmal TIC The onshytinal TIC was calculated Wilh the PHREEQC code (Parkhursl and Appelo 1999) on lhe hais of field pH and hydrochemical composition Subsequently the e~ect [ CO I~ss o~ i)1Cnc was calculutcd with a Raleigh distillmion model usmg the eqUllibnum ~ractlO~allOn
faclors reponed by Mook C()OOh) In the calculations i was assu~ed ~ha~ alkalll1Ity ~I not chant1 durin CO escap~ md thai dissolved carbon species remamed In IsotOpIC equl1lbnshylIlll Calculations showed thaI the analyses needed negative corrections of I 0 -4 tkr
iH-iOLOpe~ - - -7 G~oundwaler samples were analY7ed on ~H content (tritium) by pradimion counting
in the CIO laboratory Prior 10 measuring H~ wa extracled from ~aler in a mg-oven an~
combined wilh Irilium-free ethcne gas 0 form ethane gas The lfltlUm eontent IS determmed h rdaling 111~ meltlsured aClivily 10 the activily of a labormory referenee of kn~wn TU ~~ IS tl~e Iriiiulll unit and equal 10 one H aiOm per loui hydrogen alO~ls Samples With Iw mllum (01lCnl i lt 20 TUl like thosc rrom Suriname me anificially ennched by electrolySIS before Illca~UrCm~nL M~asurcmcnt accuracy of enriched wmer of the new analyses is 02 TU
Iso-ilI1~~JtjillLemes ~ I I~ t7 Sample were analyzed at the CIO labormory on ISOlhO and -HI H rallOs The 0shy
ratios are determined by isotope ratio mass speetrometry (lRMS) on CO~ gas whIch IS
equilibrated with the water sample ~HlIH ratios are measured with a mass speclrometer on H gas formed from waler by directing Water apor over hot uranIUm Rallos are expressed in-o~IlO and iPH as differences with the inlemmional calibration material Vienna Slandard Mean Ocean Waler (VSMOW) Accuracy of the 0180 and o~H measurements is 01 and 1 lr( respeclively
722 Allalyses from exisrillg isotope Sridies
In earlier hydrooeolo1ical studies isotope analyses have been carried on groundwaler samples from the coa~lal plain of Suriname (UNDPIWHO 1972 Verleur 1991) These anashylyses on I-IC (23) 3H (39) 180 (64) 2H (II) and 13C (19) are combined with those camed out for lhe present slUdy These analyses have been carried out by CIO III Gronmgen The
Nelherland~ and the International Atomic Energy Agency (fAEA) in Vienna Accuracies of exisling analyses are comparable to thme mentioned above for the new analyses carricd out for lhis study
In order to relate the isotopic characterisljc~ of groundwater with those of rainfall data were used from the meleorological slations of Cayenne (French Guiana) and Belem ltBrazill These slmions are located 350 km easl and I IOU km southeasL from the study area respecli ~middotely T~e lIa~a were retrieved from lhc IAEA GNIP dmabase (Global Network for 1s00opes m PreclpitallOn) (htlplisohisiaeaorg) The dalubase contains OIXO en o~H analyse of monthly precipilalion tmab The Cayenne dalaSet comprises 79 record~ (31 records lack deulerium analyses) from lhe 1962 to 1976 period The Belem dalubaM~ cover~ the 1965 to 1988 period and cllmains 233 recorll (32 record without deulerium analyses)
Apart from the GNIP datu also precipilalion analyses from other sLUdies were u~ed Negrel at al ( 1997 J studied isotopk and hyllrochemical compoilion of monthly rainfall samples from Cayenne in 1995 Important for the present stud were also the dala from Matsui et al (1983) who curried OUI OIXO analyses on more than 400 daily samples from Belern in the J978 to 1980 period
~an Vliel (1998) gathered all exisling and new i~olopic lIata Her repon also present ISOlOPIC data of pore waler squeezed from samples of the KoeVarasan and TOurtonne core drilling (Velstra 1997) These will be discussed in future pUblicalions
73 Identification or hydrogeoehemieal processes and paleovegetalion with oBc or dissolved inorganic earbon
73 Il11rodtcrirm
olC iSDlope ratios of dissolved Iota I inorganic carbon (TIC) can provide valuable inforshymalion regarding the carbon sources and sinks along the groundwater pathway As soon as
~roundwmer entef the soil carbon-dioxide gas is taken up because of Ihe relatively high parshytial pressure caused by root respiration and oxidmion or soil organic maUer The OIC value of Ihis gas (ODCCO(PII) depends on the pholosynthetie process orthe vegelation (OLeary 1988) Most plams have a Calvin or C3 photosynthelie pathway and produce carbon with olC If r bull h
a ues a --- lO --~~ Ire WIt an average of -27 c (Vogel 1993) ThiS figure IS also representative for soil organic maner produced by forests in Brazil (Martinelli et al 1996) Carbon from plants with a Hmch-Slack or C4 photosynthetie pathway is characterized by OI~CCO~IP values varying between from -10 [0 -16 ( with an average of -13 7r( (Vogel 1993) Plams operating according lo the CAM palhway have intennedime ouC values Most
C--I planls are found ilmong the family of monocotyledonous grasses and sedges C4 plants thrive particularly well in semi arid and hot climates and low atmospheric CO~ contem (Ehlennger et al 1997) This is why C4 plants were much more abundanl during the LGM when the atmospheric CO~ content Was 180 ppmV (Cole and Monger 1994) During the Holocene mmospherie C01 content increased to a preindustial value of 275 ppmV and curshyrently to 370 ppmV as a result of fossil-fuel combustion during the last century
Because of diffusion and miXing with atmospheric carbon-dioxide gas (oI3Cco~ al present i~ -8 e- and in preindustrial Holocene -65 0) the actual isotopic compositi~~~f carbon-dioxide gas (0I3CC02(SO) is higher than ODCC02PI) Cerling (1984) and Ceding et al (199]) showed lhat a minimal enrichmem of 44 0 could be expecled below the root zone
74
75
in ~()il- 1111 a high paniu carbon-Jimide pre ur~ Igt 10- atml like we fmd in $urinnme (5eelion 612) Curbon-diQlide ga- dis~olYed in the percolating groundwaler (ODCCO~IjI) i~
d~pkd hy I~L with res-pen to OlCCO lt11 the averagc soillcmperature of 27 C in Surinamc It i thereforc u~-umcd lhal in Ih~ tropical ~olb of Surinallle oL1C(nI~1J will be thou _ILi under (--1- vegelation and -235 under C] vegetmion At presenl lhe natur1 ege~
Iillion of the lUd) area ltomist~ mainl) of dry-land foreSis and marshland fore~b in tne lower clay~) pam of the toastal pluin (Lindeman and Moolennar 1959 Teunissen 1978l Thl~C cgclllioll type~ cotl1pri~e Illo~lly C~ plam-
Further alon~ the Ihm pmh lroon nlly ne added 10 the groundwaler by dissolution of lliinrll~ and -cdllcnt nrgmic maHer (SOM) Thec rc(tton- do 11m take place in the deshyrly WLllhcllt_d Mlil~ of the rechnrgc arens in SUlinillllc hut ill Inrger depth in thc siHurllcd OI1C (Scclioll ()J--1-) umkr c1tl cd (ndition~ (Ilo illlcnLtion with ~oil gasesi In Ihnl GISC
the Ol1CTIC 01 total illlllganic cmhtm in groulldwater i~ a mixture of the original dliC(o~Iltj1
and thc i~OI(pic clImposilion of the added carhon unlc~~ fraclionalion occur- due 10 precipishytation or l1lethlI)o~cnc~i- (Clark and fritz 1997)
Carhonale d~~(JILJlion does nOl occur in lhc Teniar) sedil11enl- of the coaslal plain which a~ inditaled hv he undcr-salfilinn wilh repeCl to lalcile and by the non-carbonate ~ource of di~sohcd stronlium (Seclion 633) Prelipitation of ~ideritc mny take place in ~()mc parts (Sectiml 6J--1-1 which is alcltHnranicd by sOllie fmctiollation However this ciTcL will nol he lil~en into aCLount in this slutl)
Carhon i oilly addcd to the groundwater hy liberalization of SOM which i~ found frcshyquently lt1- ligllitc in the lower Plimclll und Mioecne sediments m Audretseh 195J) Pi1)nologiLill dat (WymSlril I96lJ) show this SOM eon~ist mainly ofC3 plant material l Rhiopnm 1I1d PalmaL-1 rnalysc- of HoI(lLCne peat wih tbe ~ame plant material show hal dliC (l~l middotnlue- ltlry from -5 to -~ I ~1r (Roclevcld and Van Loon 1979 Van Vliet 1998) Teniwy SOM will rrohnbly he enriLhcd relative to Ihcse nlues beeausc of hreakdown of Ihe IllI)rC reaoive organi c()l1lpound~ Maninclli et a1 (1996) found an enriehmcm of about 2 fi for orglniL rnmlcr of Pleistocene ilgC in Brazilian soib Therefore nn average of -25 ~h
i a~sumcd for SOM in Ihe Teniary lormallons Broaldowll or SUM 1kes place mainly by iron and sulphlle rcduetion in thc Plioccne
Mmcnc and Olgolene flltmaions and results in inorganic clrhon with OllC equal (1 its source In the morc slline decpcr forrnmions and in the Holocenc days methanogencsis takcs place lnd produccs highly enrichcd inorganic carbon (gt 5 ~r) As thi~ signal ubscures he other procesls the sa11lple- with salinities higher than 1000 mgll have bcen left oul
732 RlIIIrS
The mnge of ol(m--- value- of gmundwlttcr in he Tertiary formations is shown in Figure 71 The annl~scs hac been suhdiYided in age categories expressed in I-IC actiVities - hough the samples over ltl wide range of middotalues between -26 and +2 c almost h31r of the sample (l7 l7c) f111 in the range of -17 to -20 ltr ( Note thm no samples have been found in the IJC activity class between 30 and 45 q
All samples arc enriched wilh respect to the initial soil carbon-dioxide formed under C3 vegetation presently covering mOSI of the study area Dissolution of marine carbonates with oue values betwecn -3 to +3 ~(Clark and Fritz 1997) is usually the cause for the enrichment bUI is absent in this case (Section 633) Methanogenesis as a possible cause of enrichment is nOllikely either becnuse samples from the saline and mostly methanogenic
35 ------- ~_ ___zones have been left ou In il fC
samples the me thanagenic cause Age dasses30for high ot~C values (gt -II If(r) ciln In 0 pm c
be inferred from the anomalously bull 25high TIC cOntents Thi-gt leads to 15-30
II 3045thc hypolhe~is Ihat the dl~CTlC ~
~ 20 045_600value of soil carbon-dioxide may bull
have been higher han aI present ~ 15
Two mcchnnism~ may lend to the Etypical ODCTlC values of -17 to o 10 -20lfk I Dissolution or carbon-dioxide 5
gltl~ inl soil under a vcgetashylion with a mixture of C3 ( o
1 -2 -5 -8 -11 -14 -17 -20 -23 -26n5 lit) and C4 (middot95 c)
plnms it is noted thnt C3 and C4 plants do not necessarily hnve 10 be mixed within n Figure 71 Frequency of OllCr] amlly~c for diITercnt single vegetation type mixing rildiocarbon aClivil) c1as~cs exrr~~cd a~ Ii- of Inodcrn IJC
aCljil) (pine)in the uquifer~ of groundwillcr formed under different vegeshytation~ has the same effect
2 Dissolution of carhon-dioxide in lhe soil undcr1 C4 vegelation (-95 rd followcd hy dissolution of carbon from SOM (~25 cr(j undcr tnnlJenee of iron and sulphme rcduc~i-on 1ixing leads to the observed rangc hetween -17 to -20 ito(
The lirst Illcchanim implies that the contrihution of C3 nnd C4 plants to soil carbon-dioxide is ahout equal and thnt no carbon from SOM is added funher along thc groundwater now pnths This not likely as TIC of most groundwater samples ranges from 2 to Rmmoll which exceeds the initial TlC of 1 lO 2 mmol] estimated in Section 6l2 The second mechanism is more realistic but requires a vegetmion dominated by C4 plants
In Chaplcr 4 it was conjectured on hydraulic ground thaI Ihe major pan of the groundwClIer wns formed during thc LGM and Early Holocene At that time extensive grass savannahs covered the slUdy area (V3n der Hammen 1974 Markgraf 1989 Van der Hammen and Absy 1994) Relics of these grass sav3nnahs are the present pntches of open savannahs in lhe savannah ZOne and some isolated well-drnined places in the Pleistocene cO1stal p1Llin (Jansma 1994) (Ill the study area open grass and shrub snvannahs occupy only 30 k of tile savannah zone) These grass sav3nn3h patches persist on the leached sandy 3nd silty soib hecausc of lhe low relent ion capacity for moisture and nutrients Because the modem saltlt1l1Jhs are believed to contain the same plant species 3S the old savannahs their C3C4 plants ratio was determined based on floristic studies of the modem savannahs (Heyligers 1963 Van Donselaar 1965 Jansma 1994) For species with a dominance factor higher than I (surface coverage of more than 5 1c-) lhe photosynthclic palhways were detennined by eonsulting plant dalabases (Dallwitz 1980 Dallwitz et aI J993 and onwards Ehleringer et aI 1997) The results are presented in Annex IV It appeared that 83 eTc of the dominant plant species mostly grasses and sedges from the open gnss savannahs belong to the C4 group By contrast in the savannah bushes and foresls less than 7 70 of the dominant species have C4 poolOsymheuc pathways For verification plant tissue of the most
77 76
-----~-- --
place under closed conditiongt (see above) Witham admixture from other sources groundshywater age can be determined according 10
II~ -867 In ( (7] )u
where 1jJ = Lime since groundwater recharge (I-lC age) and a and (10 are the activilies of the measured I-IC and Ulmospheric t-lC during recharge exprcssed a- pmc (percentages 10
modem carbon in 1950) A- shown in Sections 633 and 634 organic material SOM frnnl the Tertiary formaLions i- dissolved along the groundwater pathway and carbonme dissolushytion is neg legible Since SOM is very old compared 10 lhe half life of I~C only dead carshyhon i- added which dilutes the I~C coment of the initial carbon from the soil zone Under these conditions the corrccted age J helomes (Clark and Frilz 1997)
- -867 o TIC Jrl~ - _ 1 --- (72) au TIC
where TIC is the measured TIC content of the sample and TIC i- the initial TIC conlent after recharge TIC values of groundwater from the Teniary formations were calculated with the PHREEQC code from mea~ured pH and bicarbollltlte coments of the samples and ranged from 0510 12 mmoll (Annex III) Estimates for TIC in the recharge area based on soil CO~ pres-ure range from I lOt 2 mllloil (Section 6J2) Interpretation of Ihe OUCT1C values of groundwater learned That TlCtt was probably close to 18 mmolli
Outsid~ the present recharge areas (savannah zone and Ihe Lelydorp sands) groundshywater is influenced 10 some degree by mixing with saline ground waters from the Holocene formations above or the Early Tertiary and CreLaceous formations below Because TIC and I-IC contcnt of these saline sources arc not well known all samples with chloride concentrashytions higher than 1000 mgll (more than 5 7( seawater cOnlribution) were again left out
Apan from geochemical reactions corrections rna) also be required for diffusive los~
of l~C (Sanford 1997) or dispersion ltJohnson and Depaolo 1996) However these correctishyons cannot be applied unless presenl and previous now paths can be reconstructed in some detail
The iniLial atnlospheric aClivity (IO in (I) and (1) has nol been a constant in time AlnlOspheric I~C conlem has decreased steadily from 150 pmc at 20 ka BP to 100 pmc in 1950 AD This effect has been Olccounled for by correcting l-lC ages by means of an empishyrical relation based on calibralion data from Stuiveret al (1998)
(73)
~
~ -20 u
u 30
dominant ra~~ (PtllliCIIIII micrmlJIIIIII) and shrub (ClIISitlodttllltI) from the gra~s saannah -outh or Z~lnderij wa- analyzed in Ille CIO labormory of the Groningen University The asurned C3 and C-I character of the~e plams was confirmed by the alC alue~ of -2995 and -1395 9t lespeetiely The general condu-ion i- lhal all grasse and sedge- in lhe opell avannah area belong 10 the C-I gfllUp whik all dicOlyledonou planL belong to Lhe C3 group Therefore groundater recharged in gra saannah- i e~pected to have relativeshyI~ high Ol5CT1C middotalues alCT1C values or ~hallow groundwater sample- confirm lhis though thev arc few in llumber alCw value- of -I sample are lower than -23lfi (fully C3 vegeshytJli~l11) while one sample on Ihe border of all open gras- savannah has a a 1middotCT1( of -12 9ir (more thall SO 9 C-IlOJlIributiolJ L
The hypOlhcsis i- vcrilicd hy dehnnining the 1(rlC mass balallle Knoving the aDC tlues of dissolved soil carhon dioxide ta- (-lJ5 711) and mincraJied SOM (-25 itr) and Lhe
~ total TIC lOlllcnt and alC value of il samshyo ------------- ple Ihe initial TIC content an he calculashy
ted The oUILome is 1 wide range of TIC middotallle- averaging around a value of 18 mmolli FigurC 72 shows the reuhs of a reerse alculalion where measured and calculated aDCTlC for groundwater are shown for an initial TIC of 18 mmolli Espedally the large group with value- betshywcen -17 and -20 r seems LO lit well The amoum of 18 mmoll for initial TIC i- dose to upper limit of the range of I to 2
L- ---J mmolll estimated in Section 632
middot30 -20 middot10 o The idea thai C4 specie- dominalCd
measured il13cIC~ the LGM savannahs is corroborated hy
Fi~urc 72 MeilsUled and callulaled a11 c TI( or al~C shifts in organic material in Brazilian soils (tvtaninelli et al 1996) Shifts in ODC
gWlIllJwller hil~cJ nn mixing or Inilial TIC ( 11 of soil carbonates in New Mexico were al~o111111(111) fnlll1 Ji~~llluti(n or ~oil Glrbon-dio~id
a~ in redlare re under C-I veQcullion (-10 rj related to change of C4 to C3 vcgetalion middotith ~cl(I1Jry TIC rrom (lxid)(i~lIl of sedimenl belween 7 and 9 ka (radiocarbon) BP (Cole organimiddot mltltlcr t-S Ql and Monger 199-1-)
74 Groundwater dating with 14C of dissolved inorganic carbon and JH of ground wamiddot ttr
7-1 J Iwmducrioll
Groundwater dating based on the exponential decay of radiogenic I~C in dissolved inorganic carhon (TlCl may be eomplicated by admixture of other carhon sources as discusshysed ahove In the studv area the situation is relatively simple In the soiL groundwater takes up gaseous earbon-di~xide and therefore has an inilial I~C activity equal 10 atmospheric l~C activity The fractionation by gas diffusion and dissolution as discussed above has a neglishygible effect on the l4C activity expressed as a percentage ratio 10 modem atmospheric carshybon Apart from soil carbon-dioxide dissolution all other processes are assumed to take
78 79
bull bull bull
7-12 Hellil1
In Figure i~ the uncorrected
rltJdiocarhon uge~ 11 (Equalion 71 ) ar~ ploned ltJgUJnSI the age~ corrected
lor d~ltJd-carbon di~solulion r J
IEljUalillll 72) and ulnlOspheric ~C
aCliit) I (Equation 71) Most
-lpl- -ho a -ilabk redlLlion in agc after dead-carhon wrrection The comuion for aunospherlc I~C aCliviL)
(Eljuutlon 7~) re~uhs in an increa~e in
age 101 agc- higher thlll I () ka BP Thc radiocarbon age~ ltIre
checked hy plolling OI~O of gHiundshy
lIer against IhL correclld rldiocarshyhon age (Figure 74) The shift in OI~O
CU1llent marking the climatic change
al tile hegillning orlhe Holoeene is lllund around a rauiocurhon age or JO b HP which correspond~ with other groul1d a~r dining siudie- in Ine lroshypic~ ilnd suhtropic (Kimmelman el
d lq~y StUle tt al t995 Healon ~
ltII 19H6 SllHl lI1d Talmltl 1(98) Although this does nm prove that
he applied corrections are corrccL il
docs indica Ie Ihtll lhere i~ given the untenaintie~ no point to pursue furshy
lhcr correctiol1s The frrors introduced hy fIeld lahonllory and correclion procedures creale a large un(enaimy ill the IInnl grollndwller ages
Epeciltllly thc errors related to the ~lsumplions for thtgt dead-carbon corshyrection ltIre very crilical These errors
an mlSi probubly sysltnmtic and theshyrelore relative groundwater agcs and
iochrone~ pattcrns are more signifishy
ltjnl rather than absolute ages Deadmiddotcarhon dissolution
during p~ssage through lignite layers
in the Late Teniar) formations is accompanied by rapid decrease of IJC content and expla1s the lack of
samples with IJC activities between 30 and 45 7c as was noted above This is
40-shy ~
o t lC correcled for oxydallon of SQM
o LCd ~orreCled tor almO$ph~nc l~C
20
deg 0
(0
O~O 0 000
~B
~ 0 10 20 30 40
uncorrected ralflocarbon age 114C (ka BP)
Figure 73 Raoiocarbon ~ge for grounowalcr nlrrcClctl for scawJlcr mioing o~idalion or seoishylllel1lorganic mailer (SOM) ilno atmospheric I~C
aClivity
-22-------- ----
-3_~ -36 -I----~--_J___~--~_~
c 00 lOOOO 15000 20000 25000
rallllxarbgtn age yailllS BP)
FigufC 74 Relation of 0110 and radiocarbon age of groundwater Values have been corrected for dead-carbon dissolution by oxidation of organic malter Figure 76 North-South geological seclion in the coastal plain of Suriname with groundwater ages
and salinitics
consiSlelH with Figure 75 which shows that sample~ low in I~C activity generally
have higher TIC contents Figure 76 shows the groundwater
agel in l Nonh-SoUlh transecl in the coamiddot
swi plain The correcled and calibnJled groundmiddotler age in lhe Young Coasal
Plain range from 20 to 7 ka BP These
agegt dcmonStmle that groundater ha~
becn rarmed in u period he fore the sea
imacle he presem cOltl~tal plain wben
there wa- still groundwater now in the Teniicy lormaiom Cllip~cr 4 Groundwater in the Holocene coaswl
plain therefore can be denoted a~ paleo gmunuwuler (tlelinilion in Section 24)
A~ would be expeeted younger groundshywater is only found below (he present rechargc areas of lhe savannah zone and the LeJydorp sands where groundwater has not
been affected by saliniwtion (Seclions 362 and 561)
Although there are not many data the subhorizontal isoehrones in lhe Holocene eoamiddot ~lal pluill indicale lhal during the Late Wiseon$inan recharge to the TeniaI) aquifers was
more wide-pread as a~ derived from the paleohydrological model discussed in Chapter 4
jf paleorecharge woulltl hae been confined to the present rechltlrgc areas lhe isochrones in the Holocenc wastal plain would shov a more oblique panem
o
1 ~ 100
i 200
g ~ C
581~nnah
~
bull DOO ~~~ ~ ~ ~~ ~~ ~j~~ ChlOiidc eonI8~i ~
o ltso o SOmiddot 250mgn
o 250middot l000mg1
100Qsoormgll
bull gt IlOOO mg~
--------------=----
o
()gtiOpmc
O-ISpme
_5
I lt15-60 pmc
bull bull
c D
ligurc 75 Talal inorganilt carbon lttJl11enL ~nd
OUCTlC of groundwmcT for different radiocarblln activity duscs exprcscu u~ u pencnillge or nlOutrIl r~C aCliily (pmc)
80 81
o--------------------r--r Preclpilahon at Belem
c Precipitation al
20 l
Cayenne
Groundwater near bull Paramaribo
o--~-~--~--
~ -20
-40
bullbull LMWLCayenne I2H=S111160 ot 49(R2 =O87)
LMWL Paramaribo groundwater b2H 62 b 180 of- 45 (R2 = 060)
LMWL Belem 1gt2 H = 71 ll1BO + 67 (R2 = 091)
shy80 L--G~M~W~LC2cH--6-17~1~6~O~11~27~(R~o~z~a~~ke~~a~I-993)~__~---J -10 -8 -6 -4 -2 0 2
160 lObo
Fi~urc 77 Wlighhd m(lnlhl~ aeragc~ of slat-ok-isClltlPC l1l111positiol1 in rainlall al Caylnnc Frcllch Glli~lna 0 IQ7S1 IOU Hdcm BWIit (1965 - 19l5) and in groundwalcr arounJ Parunariho SUrlnalll Rainfall Uall Olre dcricJ fromlhc IAEAfWMO GNIP datahase
figure 78 cSllI() pilllcm of average yearly rainfall over Nanh and South America Afric~ and Europe (After RozanslJ Cl al 1993)
75 Reconstruction the paleoclimate with slable 6180 and oH isotopes in rainfall and
groundwater
75 [llmdllCliml
The smble iUiO and o~H isotopes of groundwater may contain paleoclimuic infonnashytion as they reneet the isotopic signature of precipilation allhc time of recharge First we will havej closet look at spatial and temporal stable-isOlope patterns of tropical rlinfall uoshythey are somcwhal differem from those al middle lalitude-
The rehuion between OJIlO and PH of tropical rainfall deviates slighlly frolll the Global Meteoric Waler Line rGMWL) shown in Figure 77 IH07anski e til 19(3)
(7 Al8~H = 81781~O+ J 127
The slope of local-metcoric water lics (LMWLJ til Ine lropics is often smuller because of the amount effect (Dunsguurd 19(4) Relmively lighl ruins appear 10 he enriched in dlSO and dH in comparison to heavy rains The ovefjll effect is Ihat the slope of the LMWL through the dmu poims is smaller than 8 According to Dansgaurd (1964) the main cause is evapormion and hence enrichment of raindrops of light mins Other explanation-o for the difference belween light and heavy rains proposed by him are (i) exchan~c with heavier atmospheric moisture helow the clouds which lendo- to hltle more effect on light showero- and Oi) gradual depletion of the condensate during rain development resulting in low isotopshyic content in prolonged ruin showers
The average weighted oUOmiddotvalues of precipitalion 01 various meteorologiLal sllltions displays a worldwide spatiltll pattern (Figure 78) called the latitude effect (Dansgaard 19(4) Superposed on this pattern are continenlal effecs and mountain effectlt (Dansgaard 1964) These patterns result from Rayleigh distil1alion taking place during (011shy
tinuouS condensation and rainoUl from water-vapor masses which are moving from warm 10 colder regions (Merlivat and JouzeJ 1983 Van der Slraaten and Mook 1983) Consequently average weighled SIHO of precipitation is linearly relatcd to tllc average yearly lempermure al the meteorogical station (Jouzel et a1 1994) The relation of spatial patterns with tempeshyrature does nOl exisl in (subltropicul regions with avera telllpcralUrcs above 20 c Relevant for Surimlme is the study by SaJali et al (1979) who al1ributed the small easHe~t
gradients in stable-isotopes of rainfall over Amazonia to recirculation of water by evapOlranshyspiration from Ihc rainforesl
Seasonal 10 secular lime variations in the stable-imtope composition of precipitation are also related 10 lemperalUre variations in middle and high latitudes (R07anslil e al 1992 1998) A bOI 801bT value of 06 is generally used to calculate the difference between the LGM and present temperatures This vaue includes the correction of about 11 for the higher 180 content of ocean water during the LGM (Shackleton 1987 Jouzel et al 1994l Just as he spatial relationShip the large-scale temporal relationship is absem in the lropics and sublropics according to Rozanski et al (1992 1998) and Stute et al (1995) The reason is that distance and temperature difference between the tropical landmasse and the oceans (vapor source) are small also during the LGM Therefore isotopic depletion of water vapor by Rayleigh distillation during rainout is limited and not much effected by global cooling
Nevenheless tropical and subrropical America and Africa were aboUl4 106 OC colshyder during the LGM (Heaton et a1 1986 Stute et al 1992 1995 Plummer 1993 Dunon
83 82
bull bull bull bull
lLJ-)) SlUW and Bonani 1995 Clark el ai 1947 1998 SlUte and Talmu lY9Sl Some re~eshyarher Iill relale 010 dcplClilll1 Ill old grounJwaler ill lhe IfOpies 0 a lower LGM lempemiddot ralure like SanfnnJ and Bulpcng (1996 for groundaler al Bangkok and HeHon el al l 1YX6) Illr iround Her al UillJ1hag~ Soulh Africa In mOSl other ltlren~ deplclcd and even enriched O[~O middotalt1C~ or pilkngruundOIler arc cgtpllined difflrenll~ III Windhoek ltlnd Sallhlod ill ~l1lihia Vogel ami Van Urh (1975) dlcOmiddotercd Lale Pleistocene groullllwatcr wILl Ol~() middotalue deplCled by 2A r with rc~pecl III recell groundwaler which lhey anribushyhd (I rcellarc in diwnl and more elevaled urea durin~ Ihat period Slute and Tallllltl (19981 rcpl)lled lI)I~)picdly ellrichcd ( 11 If ) grounuwHer of LGM age illlhe S~ampri~t aqu~fer lhll irr Nllllihia Th) uggestcd lhal thi as caused hy the advecllon 01 AtlanllC mOIsture onru d1rI11g he L(jM AI-o lhe Floridan i1LJuifcr lsoutheaslern USA) contaIns PleistoLcne lollJd[ICl ~llriehed in nmiddoto i~(l(ope~ (23 XI) Plummer Il(91) ltHlrihuled hi~ III an inLensishyimiddotllmiddotIillJ III U1l111lel lwpiel lOrm during Ihe LGM Clark ~t oIl (1997) fOUlld groundwater ill 11lL alHl I~gioll which 1ltllhr correcting for lhl enriched glacial ocelIl was slipoundhtly llLpklld ilh 06 I They uggcsled halltJi wa~ due to the larger dislamc 0 the coastline dllrin~ Ih LGtvl (C()Jllinlllal dfeCl) Earlier Love el al (1994) proposed Ihe Sltlme mechashynismo plain the lttrying degree uf I~O depletion in Pleislocene groundvJlers in the Olwav Ba-in in AUlJltlliu Around Jukana in Indonesia groundwater does not show any ChHl~Cll 11 in o~() lhroughoul the LGM and Holocene (Geyh and S6fner 1989) In the ljlla~ ArLc-iall l3a-in In AUstralia JrtJundwatel with ages ranging from recent 10 300 ka BP hl~ lillie varialion in sliIhle-isohlpes (Aircy et al 1979) Though Stute et al (1995) do lol I[lorl 61~O dILltI ill lh~ir paleotemperalure ludy of northeastern Brazil they state that ~llhle-i~olopC ltIf [loL 11latd to paloclelllperulLlre Anolher study in the south of Brazil 1111middot- PllIIIlLClll ~nlUlldwaLcr dcpletcd in 01~0 by 25lk r (Kimmelman eL al 1989)
(lre I1ltHlld~hlmiddot laken in using groundwater as In ltlrchive for the isotopic composition or pa prLLipiwliull The i~otopic composition of grollndwller may no be equal to the wcillILd OILra~L COll[lIsition of precipitation if recharge is conllned 10 a certain season likl-Brillklllanil cl al 11961) and Vogel and Van Urk (1975) inferred for the Rhinc valley and ~I111ihia fCplYlI middotely The stahlc-isolope composition of groundwater may also be atkclcl1 11) lmiddotap0nlliul nr Isotopic exehange with the rock matrix bUI these effects may be iCCU~lliCd 1 iI dcpalllllc from Ihe GMWL or LMWL provided onc analyses both ClliO anu
l~middotH
- 5~ 1~1middotllIlls
III Fiture 77 ~lbk-isolope unalyses of rainfall (monthly weighted average) at Belem HId Cv[lle and groundwater from study area around Paramaribo are presenled (i1l1l1H1lLer and Cayenne rainfall analyses plot along a similar LMWL
isfi=(J 1401~O+487 (R~=087) (75)
AhhollQh thc correlation coefficient for the groundwater samples is low (060) compashyred to tl111 C~venne rainfall (087) there is statistically no difference between the two popushylations Theremiddotrore 11 is reasonable to assume thal the weather system at Cayenne is represenshytative for the Paramaribo area The LMWL of Belem rainfall differs slightly from the CayennePammaribo LMWL because of some etreme values but the majority of the Belem
dnla fall in the Sltlme domain as Cayenne and Paramaribo data (Figure 771 Thc middotmiddotlmountmiddot effect di~Lu~sed above can be recngnized in Ihe relmively low slope and In imercep lt1- compared lO the GMWL Thi effect ~eem~ abo apparent in Figure 79 showing the ncgltltimiddote eorrelation betshyween average mOnlhly 010 values and average monlhly rainfall amounts for Cayenne and Aelem (A discussed ahove the paltern doe- nm correlaLe with lll(l[ll1ly lemperature which hardly varicgt anyway in thi~ re~ioll) The supposed corshyrelaion with amounL is much weaker if lhL i~olOpit (omposilion of daily rainfall is lIJwlysed fllr data from Belem (Matsui et lt11 1983) In Figure 710 the daily records are shown for thc wet season (January to June) and the dry season Rain~ in hOlh SCltlsom display a small llllount effecL However Ihe setlsonll difshyference is much sironger ll wet scason and dry season rains of the same amoum differ hr ahout ~ 7rr Therefore the
monLhly average~ of OI~O in Figure 79 are nO( so mueh relmcuLO middot-amount hUI ralher to ~easonal diffcrences in vapour origin eondensation process or amhient air humidity Dansgaaru (1964) studied daily rainfall data from Binza in Congo and concluded that air humidity hl an important effeci of the stable isOopie composition lower air humidiLy causshycs stronger evaporation and fractionation of (he raindrops
10Fi~ure 7JO Duil rainmiddot rail imltlUrn~ am ()l~O uluc- of 400 daily rainmiddot
5fall ~all1plcs al Belem frow 1978 to 1980 IDilla from Malsui el a1
01910 l Rain from the relHively weI season -J(JmlUar to Julv) and reialively dr season -5
July IOl December) are c depleted separately 20middot poim moving averag~s
-10
of OI~O are calculated ~ for daily rains in order
-15
arid )0
-bull
20 pis mOVIng B~erage of preClpAiIton
0 0_c of increasing magnilude lt-~ ~- 20 40 60
-20 01 1 10 100
daily precipitation (mm)
amp5
0 wet season dry seasonbull bull
bull --d_8__~~igt
bull0
8 goo 00deg0 bull if
0
0 0 dry season 0
00
00 0 0 0
wet season
600 r---------- o
-1 500
-2
2002 -3
o 100E -E 50~ rc----------- tioS _ Ii
shymiddot2
-3
200 -4
100 - 1- -5
r -6
0------~__L=--7 -7j f m a m j j
Figure 79 Average mumhty minfall and wcighlcd momhly iJcrage of OI~O in nlinr ll al Cayenne French Guiana mtl Selent Brazil Ba~ic tlata for Cavcnn~~ cover Ihe years 196-1975 (IAEAWMO GNIP uliilhasc) and 1995 CNcgrel el a1 19971 For Belem dala arc frolll lhlt years 1965-1985 (IAEAlWMOGNlpuLllllhasc)
0
A~ climalic mndilinm in Ihe Guiana~ and northeastern Brazil are not essentially dirfeshyrLn abo thc ~ea~onal i~otoric behaiour of rain at Ca~enne and Paramaribo is related 10
caollal ~lthcr condilion rather than amount Rainfall at Cayenne and Paramaribo is marked h lWO rdalicly wet and IWO relatiely dry sea~on~ relaled to the passage of the ITCZ or lhi~ region twice a year Figure 79 shows that in particular the rain~ from the Jon~ rain~ ea~on from Aprilw July have depleted alue~ bela -2 ilL
Rainrall t1uring Ihe long rainy gtcason in Cayenne i~ higher than in the study area around Paramarioo (compare Figurc 79 and 32) Therefore the weighled yearly average of lahk-ioLOpc~ in rainfall al Paramariho will be diffcrent [rom that al Cayenne Thc former ha bccncalLulalcd a~~ullling Ihal the monthly i~otopic composilion at Cayenne and PJfalllaribu lrL IhL ~ame Thi~ a~~u11lption i~ based on the ohservalion that the isotopic comshyluiliol1 in thi~ region i~ related to ~(a~)n rather than amoum Calculalion~ shoymiddot that aVefltlshyLmiddot rHnrall al Pllltlmariho is sligluly enriched wIlh respect (0 thaI of Cayenne (Figure 711) M~l grollntlwatCr samr1es arc depleled with respect to the averagc rainfall signature i Figurc 711 ThL most probaolc cxrlanation is Ihat recharge mainly occurs during Ihe monlh or thl shurl anti long rainy season whcn rain are relaLively depleted This wa- alreshyady condudctl in Section 351 on the oa-igt of monlhly rainfall and potential evaporalion lll~kctllhl wciglHcd avcmgc of modern recharge water calculated from stablc-isotopes of prcciriwtion during Ihe ~ weltesl mOn1h~ is elose 10 the compoilion of average Holocene ~flltll1t1walcr (Figure 711 )
Groundwater of the LGM and Early Holocene i- depleled in comparisDn to younger ~1(]L1ndwaler ilCraC 810 or LGM and Holoeene ~rountlwiller arc -29 9( and -25 lc( middotLmiddot pLctlely The at~utl t1irrerence is larger if the effec of lhe enriched glacial ocean (11 1 i Included The review in the introduction above made clear thal the LGMHolocene inlor1Lmiddot shift is not relatetltu the temperature shifl Hypotheses related to different walershy apm ourccs and ~calhcr ~ys(ems arc not likely a- these have not essentially changed in
a Figult 711 Yearly weighted averages of Sldshy
0 blc-isOlope eomposilinn of rainfllI m Clycnnc und
middot5
0
Panlmaribo and sUlblemiddot isOiope compnsilion of00
~roulldwJIer around 0
Plfunwribo 0 o ~o
0o llJ 014 0 0 DO amp (]gtrP
b8 DO DO 0
g Aa 0 bullmiddot15 bullbull0
a A
bull lall Par3tn11nbO 1ltaIDJlilledj o I1cgtOC gOU_1N la-- mID)
A modem red8rge wale 1IDJliIled)bull PloolSlOC 9flJUfCl_aler (BYege D) Ol Illnlall C~JeM~ (meaoureodl A ~~==~a=lodlo
-35 -3 middot15
86
Ihis area Larger distance lO the LGM shoreline (about 100 km) does not explain lhe shih either as OIHO gradients in present rainfall over northern Amazonia are only 0_75 Cc( per 1000 km or less (Salati et aI 1979) In lhe present study the more seasonal rainfall pattern during the LGM is proposed as a possible cause According 10 palynological studies (Van der Hammen 1974) and global climate models (Kutzbach el al 1998) rainfall during the LGM was about half of the present amOUnL of 2200 mma and resricted Lo a sinole rain season coinciding wilh the present long rainy season during April through July Ground~a(er recharge during the LGM took place only during this rainy season with a ~table-isotope composition comparable 10 Ihal of presenL-day rainfall The OIIiO of this paleorecharge water has been determined by calcUlating he weighted average from the four wellest month~ (sceshynario aJ and lhe two weltest months (scenario b) of pre-cnl-day rainfall Figure 711 demonshymates that tile paleorecharge Water according to -cenurio a) is close 10 lhe average iSOIOpic compo-ition of PleislOcene groundwater However if Ihe correction for the enriched ocean during he LGM (II ltd i- upplied paleorecharge according to ~eenario bl i~ more likely
76 Discussion and conclusions
ODC analyses in combinalion wilh hydrogeochemical information show that the dissolshyved Inorganie earbon (TIC) resuhs from dissolution of carbon-dioxide ga in the soil zone and minerali-l1ion of sedimem organic mailer (SOM) The dUC mass balance demonstrates thai in most samples in thc coastal plain -oil carbon-t1ioxide gus has been produced under a vegetation dominated by plants with a Hateh-Slack (C4) symhetic pathway (OLeary 1988) However today C4 plams are not common in the natural vegetal ion types of the study area consisting mainly of dicOlyledonous plants (Lindeman and Moolenaar 1959 Teunissen 1978) Data from floristic studies revealed thaL C4 plants (grasses and edges) arc currently dominant only in Ihe open grass savannahs found in some isolated pans of the study area (Heyligers 1963 Van Donselaar 1965 Jansma 1994) Since most groundwater t1ales from lhe LGM and Early Holocene open grass yuvannahs must have c(vercd the major pan of the coaslal plain during Ihis interval This was also concluded by Van der Hammen (1974) on the basis of palynological data The presenl open grass savannahs in the savannah belt are supposed 10 be relics Df these vast grass savannahs during the LGM (Teunissen personal communication)
The ODCTlC values appear to be innuenced by loss of CO~ during sampling and tfimsshypan For these acid Walers it is recDmmended to carry out pH and alkalinity tess bOlb in the field and prior 10 processing in the laboratory in order to check and if necessary to correCl measured OI1CTtC
Groundwater ages in Ihe Tel1iary formal Ions of the coastal plain of Suriname vary from recent to 30 ka BP The outcropping Pliocene sands in lhe savannah zone in the south conbull tain recenigWijndwater tbe high tritium canteills (UNDP 1972) indicate lhat the major pan of lhe groundwater has been recharged after 1950 In the coastal plain nonhward of R~publiek groundwater aees are gendally higiier than 1000 years and more~ineralised ~locene groundwater (J to 5 ka BPJ is found in the upper part of the Pliocene formashytion The recharge zone of the Lelydorp sands is marked by a downward protrusion of this relatively young groundwater Groundwater in the major part of the coastal fonnatians is of Early Holocene to LGM age This supports the conclusion from Chapler 4 thatlhe large body of slagnant groundwater in the coastal plain is paleogroundwater fonned before the
87
marine inundution In thul period the lower and the more northward position or the coastline and the eWgtle relkf of the (oaslal plain led 10 small bUl more widerread recharge in the Part II entire coastal pllin Despite LIJ~ low accurlcy of the agegt [he subhnrilomnl POsilion of the i~ochrone~ sugges~ thaI ground~aler recharge vmiddota~ not confined (0 the present recharge lrea~
The lIllOUIlL effecl can tw observed in the weighted monthly aerage~ of stable-isotope LI)1llpo-ilioll (81i0 and o~H) in rainl~lll at Bel~m and CayenneltllaleJ ~S() kill eaSi and 1100 Generic investigations ill() the origin of ojlhorc meteoric 1-111 lJuthCISI ()f the S[IIJ~ are1 However lhe amount effect largely disappears in lhe ltlllalyshy grollluwaler c- 0[ t1tih rainfall lt11 Belem (MI[~lli et al l)HJl It i- thererore concluded that Lhe seasonal
I1
gtlahlemiddot i-lllgtpC plliern i mOle real~d 10 ~pecit IC w~a(hcr sYStems relaled 10 Ihe posilion of lllC IUler-Tropical C(lnvltmiddotrg~nce Zone (ITCZl The Ulllll1tr 1110n~(lon rain Ialling dunng lhe northward ra~~lgL of lhc [TeZ from April 10 Augut (long rainy season) ha~ the nlOSIiLplcled lllIe~
I Aera~e Holocene groundwltcr in the Suriname loltJ~lal pllin i~ deplcled ~ith reS[Jccl Illgt 11clagc rainfall 11 Cayenne and Paramaribo The depletion with re~pelttto rainfall i~ auri hLllld lolhe fael Ihal neharge take plUlc mumly during Ihe wei rnolllh~ of Ihe shorl and
IOllf rainy ea-ons which lJh Jl1on depleted rain~ (see tl~o Seelion 351 l Average Pkiloccnc rmllHlwatcr i~ even more depleted than Holocene ~roundwater which in the
11lopic i~ nt)~ rdaleulo the colur climale The low amp~O amI amp~H values probably indicate 1
111 1 [Jakolcchilrgc a~ reslricled III a rainy ~eaSOll dLlrin~ borel llllllller similar to the pre~IlI1Hb~ long rainy oCltlmn v-Ilich i~ lhe WC[C~I period with the most depleled rains Thi~ is Ill) ~ICell1lnt with )1cr ~mi6 san h1 rainfall durin Ihe LGM wao lower unL more 11la~-lIllllhall (Od rVall der l-Iltlmll1e~ 197 Mark~rltlf 1989 IYY3 Van Jer Hammen and b~ 19lJ-I KlIIbalth Cl al 199(-) The diflere-111 dlll1Jltlc p(lllern 1~ probably relaled () the Ill lied po~iiOl or Ihc ITel dunng Ile LGM
89
0
Chapter 8
Worldwide observations of offshore meteoric groundwater
81 Introduction
The preeeding chapler dealL with the paleohydrologica procesles that have led to the ruther specilie groundwUler eondilions of the Suriname coastal plain nOlahly the vast body of meteoric groundwater (dclined in Section 21) extending 10 more thun 90 km offshore the Suriname coast The question now mies how abnormal is the Suriname case compared 10
other cDustal plains worldwide And can we state somelhing in general about the origin of offshore groundwater This is an impol1unt question as in many classical concepls of coamiddot stal hydrology the meteoric groundwaler domain is slill supposed to end somewhere near the coaslline
Although systematic surveys of offshore groundwater arc rare an attempt is made here to revicw a number of ohservations of offshore meteoric groundwater In this case offshoshyrc means a distance of more than a few hundreds of meters from the coast since the preshy-ence of meteoric groundwater in the very ncar-coastal wne would be considered normal The observations are divided jnlO two groups ohsenalion- of -ubmarine groundwater disshycharge and ohservations of groundwater in wells and boreholes
82 Submarine groundwater discharge
Meteoric groundwater lllay discharge directly 10 the sea via submarine sprinpounds and as diffuse seepage through aquitards This form of discharge of meteoric groundwaters a suhshystantial part of the world hydrological balance Zektser and Loaiciga ( 1993) estimate that Iota I groundwater discharge is ahout 6 lJr of the river discharge to the oceans while the disshysolved solid dislharge by ~roundwater is even 52 9(- of the discharge hy rivers
82 J 511)1II0-ill JprillSJ
Submarine springs are well known all over the world Their occurrence and functioshyning is described by several authors (Kohou 1966 Slringlield and LeGrand 1969 1971 Zektzer et al 1973 Custodio 1987) The coasts of the Mediterranean Black Sea Persian Gulf Florida Yucatan (Mexico) and the Caribbean are well known for this phenomenon Suhmarine springs are also reported from Hawaii Samoa Auslralia Japan Nonvay and Chile Strabo and Plinius the elder writers from the classical world already described this phenomenon (KohoUl 1966) The lalter repons how groundwater from such a spring near Anmiddotad an island 4 km off the Syrian coast was diverted by a lead bowl placed on the sea floor over the spring the pressure buill up under the funnel forced the water through a long leather hose to the sea surface (Figure 81) Spectacular is also the account by Williams (1946) of submarine springs around Bahrein in the Arabian Gulf Until recently these springs were used by local water vendors who dived down to the springs and filled deflated
91
I
r
i
Romln captation of a submarine Water recovery of a submarine spring near Arvad (Syria) spring near Bahrein
I
I
I ~-
I raquo goatskin bags Iille 7 by aneslan pressure
I
Filurc It Caplalioll 01 suhll1aril1l sprillgs al Syria ltlnd Bahreill
g(lah~ill bag~ (Figure XI j Springs can be oh~erved cither hy the cyc m the sea surface as hllil dilfcrcnl eoluring bull1 thc walcr or ~Iie~ and Ilo)(h ~ca surface~ or by measuring salinshyil~ Ckllricll (l1dultiviy and tempefatun or SeWltllCC Dicharges can be quile high based Oil all mamiddothalalHx Glkulatiom KohoUl (19661 Cs[ill1~llcd lt1 discharge ofl2 mmiddotlls for a pringl kill ()n~lnrc from Crc ecnt Belch Florida
CircUlllstantial Ividcnct ror lhe prescncc or pling- is provided by geomorphological fcaturc- at the SI1 hOllom like brstic cavilie- (blue hole~) slumps resuhing from groundwashytcr -apping in Sleep Uhlllilrinc cHlyon ltlnd pockmarks (circular depressions on the seafshylOUr) (1ohrhon IlJ3LJa 1934b Hirringlon 198 Robb 1990) Indicative arc also deposils of 1](111- lIld manganc-e-oxidc prellpiwId on the -ea noor from reduced groundwater entering Ihl oxic Oleall (Manheim 1967)
G(lIerally the spring~ arc rdatLd to discharge poinl~ of ~arslified aquifers of carbonJle rnd or baslll- liJe the MeditLmmcan coast~ (Zeksler el 11 1973) Springs rna) also be
rLlalcd to Iratigmphic structural or erosive illdow~ in aquicludes where meteoric water emerge from undlrlying confined aquifers (Kohout 19661 Most reported spring- occur Oil Her dcpth~ less lhal1 lO m (Custodio ISIS I and within S km from the coaslline Custodio (19g71 reason~ [hll the submarine springs in carbonate terrain hae been formed by karSlic dJ~oltllion during lo sea Icmiddotmiddotd~ Milnheim and Horn (1968) repon the ei~tence of springs II Illllch larger depth- on Ihe conlillelHal slopes though their discharge lllay not be meleoric groundmiddotatel
middot~1 DiftiHI sflbIllOrll( diqllIrgl
Submarine discharge by diffuse seepage is more difficult to ascertain than by springs though according O Zekster et al (1973) it accounts for the major pan of groundwater disshycharge to the sea Submarine seepage may be observed and quantified by means of salinity and hydraulic head panerns beneath the sea floor (Kohoul 1964) seepage meters (Lee 1977 Simmons el aL 1991) or analyses of chemical and isotopic tracers in seawater like
salinity (Guglielmi ilnd Prieur 1997) radon (Cable ela 1996a 1996b) radium (Moore 1996 Cable el al 1997) methane (Cable et al I996a) and barium (Shaw el ul 1998) BelHhie bioindicators lile dialomes may also reveal seepage zones (Pie~arck-Jalkoska
1996) Sometimes very high ~eepage rates are found with these mcthods ( 10 70 mmJday The widlll~ of thc area over which (hese -ee[lage rates have been ealeuillted ary from 2 to 20 km which Implies thaI the aquifers rnUs1 tran~mit large quamilielgt of groundwater ranging rrom 20 to IlOO m day per meter width of the lOJstline These nows would require aquishyfers wilh extremely high transmissivities and also very large recharge areas It is questiona hk whether Ibese methods actually quantify the -eepagc of melcorie groundwUler from the underlying aquifcrs lracer- nwy not he representative for meteoric groundwatcr or therc is ~eepage or -eltlWiter eirculming lhrough the upper ~eanoor ~edimenb
Promising i- Ihe study of groundwatcr seepage bastd on concentration proli1e- of conshy-ervative tracers in [lore watcr- of sealloor sediments_ II seepage rate- are low the concenshylration renew the competition of advelLivc and diffusive solute transport Post el al (20001 used chloride eonccnlrations ISO and 7Cl isotope ratios for a site 50 km of( the Dutch mast They concluded that there was no upward seepage but only downward sail diffusion Piekarek-JJnkowska (1996) dctermined chloride concentration IHO and ~H isotope analyses ill [lorc wmer from sediments in the Puck Bay near Gdansk Poland Groundwater scepage was noL qU~ll1tificd with these dma but seepage rates of 04 mmday are reponed based on regional groundwaler now calculillions
~13 Meteoric groundwater in offshore boreholes
Well log data (rom oil exploration and production wells could provide a wealth or illformmioll on offshore groundwater However dala are often classified and in most cases the first fcw hundreds of meter) are not logged Nevertheless some interesting publication- are reviewed below indicating the presence of offshore meteoric groundwater The locations arc shown on Ihe world map in Figures 82a Lo 82c
831 NUIlliCkel ifatul (USA) ~ Atlallic Demit
Kohout et al (1977) describe a borehole al Nantue~el Island 70 km ofr the Atlantic coasl al Cap Cod (USA) traversing a 457 m succession of Quaternary Olnd Tenia) clastic sedimems on basement rock Fresh groundwater laquo 1000 mgll TOS) was found until a depth of 158 m below sea level followed by a zone with alternating layers of brackish and saline waler lIntil 350 m The basal sands layers below 350 m contained water of a relatively low salinity laquo 1000 mgI TDS) As the piezometric head in the upper fresh water is 36 III abow l11sl it is concluded that this groundwater j- a lens of recently fonned fresh WOller fioshyJling on saline waler In the basal sands however a groundwater head of +7 m with respccl to sea level exists while the head has a landward gradient as inferred from measurements in a well on a nearby island Kohout et al (1977) assume thal groundwater in the basal sands was fonned during the last glacial and is now being forced landward by the encroaching wedge of seawater on the continental shelf They funher state that the landward drive may be panicularly strong because the aquifer il in direcl hydraulic eontacl with the sea through outcrops on the shelf slope (Rona (969)
02 03
bullbull bull bull
6IJOW
AIJ8nl~8n
NewJersey
Far offshore meteoric groundwater in wells
o Sea depthgt 200 m
IilIJ 100 lt Sea deplh lt 200 mj (conlinenlat shelT)
0lt Sea depth lt 100 m
0lt land elevation 20 m (- coaslat plains)
Figure 818 Coastel plains and cominenlal shelves or Nonh 3m South America
15011 Rgt _
~R ~_bull bull _-rlt Port HarrotJrt
Colombo
L_ t
r) J -shy
Far offshore meteoric groundwaler In wells
Sea depthgt 200 m
Illll 100 lt Sea depth lt 200 mj 1 h I
o (contlnenla s e
0lt Sea depth lt 100 m
0lt land elevation 20 m (- coastal plains)
Figure 82b Coalel plains and conl~renlal shelves of Europe Middle Easl and Africa
95
i
94
D
Far oNshore meleolic groundwater in wells
o Sea deplh gt 200 m
JIII 100 lt Sea depth ltc 200 ml
(continental shelf) 0lt Sea depth lt 100 m bull
bull 0 Land elevaUon 20 m (- coastal plains)
Figure 82e Coastc[ plaillS and comincnlal shelves of sia and Australia
832 Nell Jer( (md Maryand (USA) - Arlt11l1ic OClal
In 1976 a serje~ of boreholes were drilled for the (AMCOR) Atlantic Margin Coring Program (HathawilY e al 197 fj) In this scientific program also pore water squeezed from edirncill samples wm studied A mlfiseCI of) horcho1e~ perpendicular 0 the Atlantic COl1 01 New Jersey tUSA) show~d Ihat groundwller wilh ltaliniLies less thm 5000 mgll TDS eXlench 100 km offshore (Figure 83) This meleorit groundwater is found belween 100 and ~OO m he 10 ms in the Miocene (Kirkwood Formation) md in Pliocene rormation~ hee Figure lL3J In mother AMCOR well fUflher south some 20 km offshorc of Maryland evel fresh pOlable groundwater was encountered Along the eastern and hoHom fringes of the meteOriC wller vcry wide lmnsilion zones are found while lhere is a sharp transition 1 Lhe top
The New Jerey transett WIS the hasis for the paleohydrologicalll1odcling slUdy by Meisler et a (1984j The model showed lhat the offshore interface igt now very slowly moving Inndward They concluded lhat the high frequency of the Qualernnry sea-level oscilshyIntions caused only small movements of the interface and thm its position largely reneets the average sea level during the Quaternary Meisler et al (1984) concluded lhat the wide transishylion zone around the interface is tbe result of lhe Inrger periodicity of sea-level movemenl~
during the Miocene and Pliocene A reneellon of the to and fro movement is the hydrocheshymistry of the offshore groundwater The more dihne meleoric groundwater shows a sodium surplus with respect 10 mixing of meteoric and marine walers while more brackish and sali~
ne willers show a calcium surplus Assuming that Ihis pattern is caused by cation exchange it suggests that closer to the coaltt freshening dominates while in the transilion zone satinishyzllion is tltlking place Before groundwaer development started in the last ccnlury groundmiddot water heads were artesian (Kohout et a 1988J whieh indicates that close to the shore the meLcoriL groundwater body may belong to ltI lopograplly-driven now domain
833 Georgia (USA) - Affal1lic Oceal
A transect of JOIDES wells and two cxplormion well- offshore southeast Georgia (Figure 83) revealed n body of meteoric groundwmer (C concenlrmion lt 2000 mgll) in the Eocene Ocala limestones extending 120 km offshore nnd almo-t reaching to the shelf ltlope (Manheim 1967) Analyses were carried ouL on pore Waters squeezed from sediment sampshyles Later a drill -tem tesl on an oil exploration well S5 km offshore and nearby lhe JOIDES Iransect produced groundwater with a concentration less than 700 mgl (Kohoul 1966) Also the resistiVity log of an oil exploration well at the shelf edge showed the presence of braekish water in the upper 900 m (Manheim and Pnull 1981) The top of the meleoric water hody slopes from -50 m (with respecllo sea-level) to middot200 m at 120 km offshore The bnse of the meteoric groundwater body ranges from 1000 III al the cos to at least 600 m at the JOIDES well at 120 km offshore During drilling a hydraulic hend of 9 m above msl was measured in the JOIDES well at 40 km offshore (Manheim 1967) Stringfield (1966) reports onshore artesian heads in the prepumping period of + 18 m with respect lO sea level He ealculmed malmis head would be sufficient to force meleoric groundwmer through me highly penneable Ocala aquifer 10 a submarine outlel m some 100 km offshore Kohout el aJ (1988) and Manheim (1967) assume therefore mal until recently me offshore meteoric groundwater body was part of an active flow system wilh onshore recharge and submarine discharge on the shelf slope
97 96
Eas
WeSl 20 ~ ~so bull
New Jersey bull ~ 0
E
l ] i blY
0
~~ (ilh~rHflJilyell 1979)
West GeorgiaIUSA)
oSouth
IS-r
V )
- ~o~
Nonh
Jakarta - Java Pa 0_5bull
~
r
bull~
- V 7
(Aher Al8I1ftHns e181 1996)
Figure 83 Seclions of offshore meteoric groundwater m New Jersey (USA) Georgia (USA) and Java (Indonesia)
83-1 Georgia (USA) - Allallic OnlIlI
MaHhuis et al (1996) report the presence of meteoric water in well- in the coastal plain near Jakarta and tVo coral-reef island~ Palau Kapal ami Palau Damar at 5 and 15 km onshore (Figure 83) Groundwaler with chloride coments Iegtgt lhan 1000 mgll i~ found betmiddot ween depthgt of 50 lO 300 m Hydraulic head~ in the island well- are close to sel level Therefore deep fresh groundater in the island wells CllnllOl be part 01 a recently fomled len~ recharged on the island il~e1r It must have been formed by another now system In the Jakal1J coastal plain the hydraulic heads of deep meteoric groundator ll1ea~ured befon large-scale groundwater pumping SlaTted rmge from 5 1010 m abovc ms I-Ie data of thi~
groundwaler indicate Pleistocene ages exceeding 30 ka BP (Geyh and Sbfner 1989) This suggesls lhat Ihe ofrshore meteoric groundwater i~ formed by an old iOpogruphy-drivcn now yslem rccharged in thc hills south of the coa~lal plain Thi- now system remained aClive during the Holocene though gradienls mUSI Ia-= been reduced after the rise of the sea level (Geyh and SOfner ]1)89)
835 Porr HarcOllrl (Ni~lria) - AtlaJlic Oceal
The resistivity log~ of 12 oil wells IS 10 40 km offshore POri Harcourt in Nigeria indishycltlIe the presence of groundwater with concentrations or le~s thm 1000 mgl chloride b~tshy
ween depth- of 12010450 m below sea-level (Shell unpuhlished dala)
836 lJllIfidel (Nelhuands) - North Sea
A shallow well drilled in the Norlh Seu 60 km offshore from lJmuiden Oil the Dutch coasl revealed the presence of brackish groundwater (POSI el al 20(0) The well IS drilshyled only 55 m into a clay layer (Brown Bank Formatioll) exposed at the sean(lor Poremiddotwaler samples squeezed from sediment samples showed lhat chloride concemTation decrcased from 20000 mgtl at the sea noor to 9000 mgJl a 55 m depth POSl el al (2000) showcd thaI Ihe vertical decrease or chloride eoncenlmllons could be explained by salt diffusion from Ihe sea into fresh groundwater starting 8500 years BP when tbc sea submerged the ~oulhern
North Sea
CU7 Slumglwi (Chila) - Chinese Seo
Meteoric groundwater was found in a well bel ween deplhs of 150 to 320 m on one of the Holocene Shengsi islands 50 km offshore in the Chinese Sca ncar Shunghai (Wang 1991) Groundwmer deeper Ihan 229 m appeared even to be potable II i- unlikely thaI this groundwater has been rormed during recem times Moreover groundwaler onshore al the same depths is or LGM age (Hua Aibing 1998)
84 Discussion and conclusions
The observations show that meLeoric groundwater observed in wells 10 [0 100 km offshore is not restricted to Suriname but occurs all over the world AccounLlt of submarine disehar~~ are even more numerous though generally the discharge is located closer to the
99 98
horc either ltJ~ pring- or a diffuse ~ecpage De~pite the sC~n1Y and ill-documenled obsershymiddotaliOIh Iconclude Ihal lhe onhore mCleoric groundwater cJn no longer he con~idered a~ In excepllOnltl1 phenomenon
~10 Ohsefali~ns do nO Ilmke clear whelher Ihl meteoric groundwaler belong~ 10 ltIn Idic lopogmphy-dnven nO ~ys[em with onshore reeharge or to jlLlleogroundwater forshymed b~ exti~ct now system The Nev Jersey coast i~ the only case in which the dislal offsshyh(lre meteonc groundw~ler can he d~ignlled a~ paleogroundwaler (Meisler et al 1984 l SUblllltlrine di~chargc will genenilly he il sign of an ltlctive now syslem but it rnav also be di~dlarge of a very large pi1eogrouldwltlter hody IhLl( i~ s[ovly squeezed oUI hv dcnsitvshydriven f)rce~ after the Holocene lran gre~sion Age is not Jlways a diagnostic ~larker ilher ~Ince lI~ old groundwaler may slill belong to an active lopography-driven lhm svstem with I vcr) long residence time The same applie~ 10 salinity in COltlstal and ofrsh~re disshydwrge area~ very wide di~perie Imnslion zone exisl (Sousa and Vogt~ 19i57) where bmcshykish groundwatcr igt slill parl of Ihe adivc now domain The next chapters will address thi tLlesion in more dctail
Thb slud) and that of Meikr el al t 19~4) show that a nat and shallow eontinental ~hell a~d a thick cominuou fortl1ltltion of [ow permeahi[ity below the sea noor together l1h chmille and secondary topography are the most important conditions for thc formation of llffshore paleogroundwater A worldwide inventory of these conditions would be useful 10
predicI tl~e pn~cnt~ of offshore pill~ogroundwat~r which may become an exploiwbe rCUllnC In fuwre The world map in Figuregt 82tlto 82 shows extensive continem~l shelshymiddot~and man) inland ~ea~ wilh depths less than 100 m These orfshore areas were exposed
~dUllllg tile lGM and tavored paleogroundwater [ormation
L
Chapter 9
Prediction of the offshore continuation of coastal groundwater flow systems
91 Introduction
There are nlltln) obgtervaliom of ofrshore metc()ric groundwater a~ discl1ssed in Chapler is Hoccr in many ca the (lhscfltltion cannOI conclusively indicale whether lhigt groundwater i () paleogrouJldwalcr formcd hy )1111( now ~yslcm~ or (ii) glOundwashytel in a l1lodan llow syStl1ll wilh onshorc recharge Thigt can only be eSlablishcd with a dcnse oflhorc ohervation nelwork 01 bead or pre~~ure- which b quile costly Kohoul (1(64) carried out such a delailed sllrvey of offshore groundwater close to the shoreline in Bigtcilyne Bay Florida In lhigt chapter Ihe question about Ihe origin of offshore meteoric groundwater is addressed indirecI[y given the presenl condilions how far could fresh and meteoric groundwater penetrate inlo lhe olTshorcl Reilly and Goodman (19iS5) Cuslodio (1l)~7) ltlnd Kooi and Groen (20011 rcviewed Ll numshyher of modelgt and concepls defining the submarine exten~ion of fresh groundwater
Through time the complexity of Ihe models increased Figure 91 schematically illustrale~ a nllmber of da~-ical sludies that employed miougt levels of approximltlliol1 in model calculltltions and variou- suhsurr~lee conditions First analytical solUlions wcre foulld rur sharp-inlcrface models in phrcatic aquifers (Badon Ghijhen 1888 Glo er 1(59) md cmi-confined aquifers (Edclnwl1 1972 Mualem and Bear 1974) Later numerical codes were dcvcloped for sharp-interface models to Illow incorporation of spatial geological beterogencity ~lnd non-slationary modelling (E~~aid 1986 1990 Meisler et al 1984) DilTusion and dispersion rroce-~es along the freshsaline interface were studied analytically hy Henry (19M) and lalcr illcorpOfltLled in numerical codes (Huyacorn et al [987 Voss ami Sousa 1987 Dude Essink [91 However none of Ihc above models accounted for the pOlenlial imanbi1ity or ~Jl inverse sa[inily and density stratification in the top of the offshore meteoric grollndwJler hody Such instability leads 10 the development of convective densily CUITenls (when a cri[ical Raleigh [Ulllber is exceeded) Kooi and Groen (200[) de ised an ltlpproximate morJel lAM) thaI determines the distance from the shore to the place wherc the inverse stratification in an aquifer becomes unstable and where salinization by eonvective mixing takes place Thi~ chaptcr which is largely hased on this aniclc discusses the result~
of a modified version of AM the Ne Approximme Model (NAM1
92 The Ne Approximale Model
The approximate analytical model (NAM) presented here combines two competing processes of solme transpon in the offshore zone (Figure 92) The first process is the advecshytion of salt by groundwater noV through the aquifer ill combination with Lhe upward seepashyge through an aquitard to the sea noor The adveetion is based on the model of Edelmln
100
-- ----- -c
(197~) r~r r~e-h ~roundwalcr now in an orfshore semi-confined aquifer with a sharp treh-allllc Interlace The second proce-- is the downward diffusion from the sea awards the underlying rrcsh groundwater through the aquitard which is de-cribed bv a one-dimenshy~i(Jnal dillu-ion-advection model
Badon Ghijben sail (1888)
b
Glover (1959)
~ semimiddotpermeable layer
+-- Edelman (1972)
_i~~~s~-~--~-b ---------------Mualem amp Bear (1974)
e ~age~~ +-shy
Henry (1964) groundwater WIth vanable +shysalinity and denSity __~-_-- _
figure 91 Conceplual models of coastal groundwaler flow syslems with fresh and saline groundwater ac~ordlng to same classical studies (from Kooi and Groen 2001)
coastlin~
x=o L
s~a l~ve
+-shy
1 1--- -----------~---------IT---------- W
iH
~ H
figure 92 Schematic ~ection showing groumlwUlcr Ilow aClurding to the orrshor~
~harp-inlcrrale model (SIMl and uownwtlrd ~a1t lrmsfl0rl by diffusion und lonvcClion
The NAM defines lhe distance from the coast where the upward seepage become so smalllhm downward diffusie IranspOri reaches into lhe aquifer and creales inslability and convective densily currcms II is assumed lhat lhis distance is a good measure for the offshoshyre limil of the fresh groundwuter tongue
Slwrp-imelface lIIudei The geomelry of Ihe Sharp-Interface Model (SIM) based on the model of Edelman
(1972) for offshore fresh groundwater now i shown in Figure 93 The salt water is assumiddot
Fresh groundwater tongue (approximate model)
bull Fresh groundwater tongue (sharp-intertace model)
---- shyUpward flow according to modified Downward diffusion t Edelman solution
I Density currents where critical Steady-state salinity profile cY Rayleigh number is exceeded according to diffusionshy (only in aquifer)advection equation rE
Figure 93 Schematic diagram of the sharp-interface model used to calculalc the length L of a sleadyshystate offshore freshmiddotwaler longue (from Kooi and Groen 2001)
103 102
med to be ~tlIit except for the waler within the confining layer because upward seepage Ihrough thl~ layer into (he Oerlying ~ea ~hould be allowed The Dupuit assumption are applied ie within the aquifer fresh-water head~ are assumed 10 be uniform with depth and wilhin the confining layer aboe the fresh-watcr tonguc salt-water helds are as-umed unishyform in th~ horizontal In cantriL l to Edelman (1971l the aqullard abol the fresh-waLer len i- a-sunled fully saline to avoid having a finite fresh-wmer seepage raIl at x = U (the ~cawlrd-most edge of the tongue where its thicknei- hecomes nil) Independent uriable of
the syslem are lhe rre-h-walcr discharge at lht Loas Qw the horizontal hydraulic conducshytiviL~ and thicknc-- of the aquifer k and H the venical hydraulic conductivity and thkk Iles- 01 the Lonrining (day) layer k and H and the local depth of the sea IV ConduLLivili~- and thidne~se- an not lumped illlO re-istilllces 1Ild Lranslllissivitie becausc ill Lhis as well IS in the following -cction somc or the dcpcndelll ariables an funttions of the scpmate parameters The unkowm which arc to he solved lrc measures or the offshoshy
fl fnh-wltHcr ICllgth L and Ihl fresh-watcr piclOmetric head al the shoreline H The analylilti1 soluLion for SIM described in nore detail in Kooi and Grocn CWO I l is scr~lratcly
dlfled tor the plf( Where fresh groundwater completely fills the aquifer and for the part ~hcle th~ lbicknes or thL frc~h water i~ smaller than thc ilquifer thickness (Figure 9Jl
lJ(llilsilm-lIdlC(Ti(lII((ll
The downwlf(J dirru-lon or salt through the aquilard with a countcracting upwilrd scshypage can he wrillcll by the ildvectilln-dispersion lquation as
d~w dw tJ-- -q _=()
(9 I) dgt d
where fI i~ the vertical Dlrey veloclt) w is the salt mas- fraction and D i~ the vcnical LOInponcnt of thc ditluslon tenor (inclUding effects or porosity and (()n~osity) Eq 91 implicitly assumcs thll D is constant The Boussinesq approXimation has heen ilpplied which assumes that ~pillial density variations can be neglect cd ill the mass balance These lssurnplions arc reasonltlhle for the level of accuracy required in the present ltll1alysis lorcOmiddoter the difference in density hetween seilWater ilnd fresh water is about 259( onlv
II effecls of hnrizoJHal advection witbin thc aquifer at the hase of the confining layer arc ignored the oluLion to Eq 9 I i- givcn by
(92)
where (I) is the salt mas~ tnlction or sea water and 0 i~ the characteristic thickness of the qationary exponcntial houndary layer Ihm forms a transition zone between sea water and (reh water In(92) is taken posilive downward from thc seatloor The upward seepage rate can he estimated from SIM by
r k q = ---=-~1J bull r H (93)
where r and yare the specific weights of seawater and fresh water respectively and 11_ is the salt-water head at the base of the aquila rd
Convective break-up and fmgering of this boundary layer will take place when Lhe boundary-layer Rayleigh number Ra~ wbich is defined as
)04
6pko (9A)Ra =-nP
cxceeds the critical due of about IU (Wooding eL al 1997a) In practice houndary layers in clayey sediments (aquitards) will be -tablc because of their low penneab~litics The pershymeabilities of ~ands and sills are several order~ of magnitudc higher Therelore Rj 01 the boundlry layer in sandy and silty aquifers lend~ 10 be above thc critical value evcn for small densitmiddot contrast~ and limited thickneseo The onsel of illsLability is defined III occur here ltH the l~cation where the critiLal Raleigh number or Ihe boundary layer within lhl aqUifer is exceedcd This criterion is physically more realistic than the crilerion in lite AM model of Kooi and Groen COOl where onset of instability was as~umed when thc thIckmiddot nLS or Ihe houlldary layer a~ a whole exceeded Ihe Ihickness of lhe clay
93 ResulLlt
In the ljr~q series of calculali()n~ (Figure 94) the length of the fresh groundwater wedne was calculated with threc different models SIM AM and NAM The lengths were calc~lated for varying alues of aquiwrd thickness H (I 10 100 nt x-axis) aquitard hydraushylic conductivity k (IOmiddotImh IltP Ill~ and HP ms) and coastal hcads h1 (+2 and +IU m abovc Illsi in left and right paneI- respcctively) The lOngue Icngths L predicted by SIM arl largcr than thc lengths of Ihe aPrroximalc models L for Ihe lower hydraulic conductivities k 10middot) ms and k = 10x ms This is lhe result of lhe predicted elTeLI or instability when Ihe diffusive houndary layer reaches the aquifcr This is particularly truc for the lowest aquishylard permeahility (k = 10-lt) I11S) maximum tongue lengths of 5 km and more than 100 km
are predicled hy NAM and SIM respeclively for 111 +10 m ab~ve msl for 111 ~ +2 m abovc msl the tonue ICnlhs are 0 III and more Ihm 30 km respecl1vely For the relallvely high hydraulic eo~ductivity k = 107 ms the difference in lOngue lengths i~ not veT) large hetween all models Comparison of the lWO approximale models AM and NAM shows thaI NAM (Figure 9Ac) leads to smaller tongue lengths than AM (Figure 9Ah) Again the discreshyraney is largest for the low hydraulic conductivity
For high hydraulic heads at thc coastline (111 = + I() m above msl) the longue length inercltlses with the tbickncss of the aquitard (Figure 94a 10 94c right panels) However for low hydraulic hcads (lin = +2 III ahove msl) the length initially increases hUl decrea~es at thickncss or over 40 m (Figure 9+a 10 94c left panels) This effect is primarily due to the flt that the increasing hydraUlic resis-tance of the clay (Hike) cvemually reduces the tOlal outnow under this low hvdraulic driving force The maximum lengtbs for AM and NAM (Figures 94b en 94e left panels) arc found at smaller He than lhal for SIM (Figure 94a left pltlnel) This is duc to the earlier onset of instability
In the next series of ealeulalions the influenee of aquifer parameters was tested Fjure 95a shows the results of NAM calculations with an aquifer transmissivity Hk of 45 x 10- m~s (- 400 m~day) and a coastaJ head ((oos) of +2 m above msL In the lefl panel
aquifer thickness H and hydraulic eonduetivity k ~re 10 m and 45 x I~-I~s ~speel1velt
and in the nDhl panel 30 m and 15 x 10-1 mlsIn Figure 95b the transmlsslvuy IS 15 x 10middotmiddot ms (- 1300 mday) where in the left panel aquifer thickness and hydraulic conductivity are 100 m and 15 10-1 mis respeclively and in the right panel 0 and 15 x 10- mls The
transmissivity in Figure 95b is 3 times as high as that of Figure 95a bUI the lengths of the
105
bull bull
bull bullbull
20 o
[ 80
bullbull 20 40 60 60 100 20 40 60 60 100
He(m) Hc(m)
(b) AM model (Groen amp Kooi 2001) 10
hcoast = +2 m 100 hcoasl - +10 m 6 bullbullbull aD
o
E 6 bull ~ 60
-jOOo bull o 0~
00J 40 po bull1 4 bull 2 20 (_ bullbull
666
0 o 66
0 20 40 60 80 100 o 20 40 60 60 100
0
He(m) Hc(m)
hcoasl = +2 m 4 40
3 rfIImiddot bullbull
E 30 [ 6 6 66 bullshy bull
~ 201 2 ~ bullbull ~
bullbull bull bull bull
bull
10 8 t
0 0
0
40 60 60 100 0 20 4U 60 60 100
He(m) He(m)
010-9 10-6 6 10-7 I
Ii~urc I)bullbull-I S I 1l1ll10iruiC CXhIlSioll llr flI~tllI11C modd (SIfll tb rl~h broulldwlller uconlill I dlllg to K bull ) lpplowllalc mlldd (AM) e (1 thr thlkrCl1L modI001 ltl11l (ImCI1 (IK)I) I wllh dowl1nrd d c s tal slmrr-I IHe kness () ol 100m- d t l on11 md Clll011LIOrshy I) h n W bullbull arrrmlll111e mod I (NAil tlvcllying day laycr (f ) I ~n a ly~lrlIIltc cllndulivily (J) of ~ - I Ie sClliHonlined lL-Iuiicr 1 tk nlh 101 Th I k) 11 111 I I w I 100 for I I d n of h +2 +10 h t I h elm 10 nl 10 I I) I d) of h
bull Illgt ( C t and righl pallds) SCl j~ph 0IuI)~ Ill10 ms Coa-tal helds (IJ)
3 2 s (a) aquifer transmissivity 45 x 10- m
7 H = 10 m
7 6 k = 45 10-4 mis H ~JO m k = 15 10-4 mis6 5
5 E 4
~ ~ 3 -IA A 6-
2 bull oo o--ltgt_~--ltgt----l 8040 6020o
80 DO40 60 Hc(m)20o Hc(m)
3 2 (b) aquifer transmissivity = 15 x 10- m s
7 --------- shy
7 6 H 100 m 6 k = 15 10-4 mis
I45
5 6
E 4 1 J~ - H= 10m ~ 3 ( l6 A 6- bull k=15 10bull3
2 fI bull bull o - bull 40 6020
60 60 Hc(m) o0 100
4020 Helm)
7
0
-----------_deg----deg-9--10-8k A 10- ][ (mls)c
figure 95 Submarine cIngtioll of fresh grounuWaler for different values of the aqu
ami uau-lllis-ivity and a coa-lal head (ln~I) of +2 III above ins Cakulaion- have beelllarred oul with lhe new approimale model (NAM) (a) in tt panelgt r _cond a4I wlI a la) (HkJ of 45 x 0) ms (- 40 in Ihe kh paud aquik Ihidnes~ (H) lnd hydrulic conducliviy (k) are 10 m and 4 rin Ihe righl panel 30 alld 5) 10-- ms respectivdY (b) in Ihe lower panelS the trar J(J 1ll~(s (_ 300 1ll~ldyl wherc lllllle left pand aquifcr thickness an and hydraul v~rc 0011 and 15 llmiddot~ ms and lllille righl panel 10 lnd 15) 10) mJS respectiDr he overlying dl) llyer H) hls been varied belween I lnd 100 m For (he hydn1
or Ihe day (1) Ihree dilTercnl vlue hae heen ~hosen IO ms 10middot1t Ills and 0
(V) i~ 0 m
bull bull bull bull bull bull bull bull bull bull
bull bull
bull bull bull bull
28
24
I1620
J12
bull bull bull ~
8 8 bull bull bull
bull bull bull 4 6~ ~ 4bull 0 0deg0 00 0
0 20 40 60 80 100 0 20 40 60 80 He (m) rlc(m)
(b) aquifer transmissivity =15 x 10-3 m21s
28 28bull24 24bull bullbullbull20 20bull H= 100m bullbull16E bull bull k 15 x 104 mrs E 16
lt0shy ~ 12 ~ 12 bull
bull bull bull
~ ~ bullbull8 8 bull bull bull bull
lt0shy
H =10 m fJ6 00
bull
4 4 k = 15 x 103 mls0 0
00
0 00
0 20 40 60 80 100 0 20 40 60 80 He(m) Hc(m)
(a) aquifer transmissivity =45 x 10-3 m2s
28 H 1U mH = 30 m
24 k = 45 x 10-4 mfsk 15 x 10-4 mrs
20
E 16 lt0shybull bull~ 12 bull
100
100
k (mls) o 10-9 10-8 6 107 [
Figure 96 Submarine cXlension of frc~h groundwllicr for different vlluc- (If Ihe aquifer Ihicl1C~
and transmissivity and a oustal hcud (h) of In In ltmvc msl Calculations have been carried (lut with the new approximate mode (NAM) (a) in the upper (wo panels for OJ semi-confined aquifer with a transmissivity (Hk) of 45 x 10- m~h (- 400 l11~day) where in the left panel aquirer thickneJs (If) and hydraulic LOndlictivhy (k) are 10 OJ ltlnd 45 x l()-J ml~ lInl in the right panel 30 and 15 lt 10 ms respectively (b) in the lower panels the transmissivity i~ 15 lt 003 mlls (- 1300 m~day) vhere in the left panel aquifer thickne~~ (H) and hydraulic conductivity (k)
are 100 m and 15lt 10-1 ms and in the right panel 10 and 15 lt 10middot~ ms re~pectively The thickl1ess of lhe overlying clay layer (Hr ) has been varied between I and 100 Ill Fnr the hydraulic conductivity of the clay (k ) three dirrerenl values have been chosen 10middotlt) ms 10-~ ms and 10) mhbull Sea depth r(W) is a m
)8
hecasl =2 m above sea level 7 7
sea depth =0 n set depth 10 m6 6 5 5
4 4E Elt0shy lt0shy~ 3 ~ 3 ~ bullbull bull ~ bullbull 61lll 6 62 2bull bullbull bull
bull0 0 0 20 40 60 80 100 0 20 40 60 80 100
He (m) Hc(m)
hC08St = 10m above sea level 28 28
sea depth = 0 m sea depth - 10 m 24 bull bull 24 bull
20 bullbull 20 bull E 16
bullbull bullE 16 bulllt0shy lt0shy
~ 12 bull ~ 12
bull bull~ bull
8 ~ bullbull 8 ~ lIo0 0 0~
bull
bull
bull bull
bull
116 0 04 00 4 0 0
0 0
00
0 20 40 60 80 100 0 20 40 60 80 100 Hc(m) Hc(m)
k (ms) o 10-9 10-8 6 10-7
Fi~un 97 Slbnwrl1e CICIljllll 11 fresh wul1dwlIlr Im diffcrcnt sca dcplhs clkulatcd with the ncw appnnimac l1lodcl (NA~ll (I) ill tile uppcr panels 1i1r a llilslal head () If +2 III a(1l IIIsl and(b) illthc h1middot panel rllr a olsml head (II) of 10 III all1-e Illsl Ille sClllilmliIlCd aquifer hIS
athlckncss (J 01 100 m ami hydraulic CI1llhlltivity (I) of 15 x 1114ms sea ltkpth (11) inlhl kfl and ngh p1I1c1s IS () and I() 1JI respectivcly The thkness of tile lwcrlying day laycr (If ) has becl1 varied betwcen I md 100111 Ff the hydraulic conductivity llf the clay (k J lhrec differellt values hHe hecn chosen 1()middotI11~ IO-~ Ills and III ~ Ills
10
fresh wll~r longll~s an onl~ 5 10 50 cc bigh~r Vmiuinn or ~Iqllir~r (hidlll~s fI unci aquifer hydnlLllll ~OIHJlIl(IVIlY k with the same lfallsmissivity (lompare left and rinlll panels) does bull l~n~ I)il~ much lnl1uClllC Only cahullion with the highcM vlue for the hydrnulil conducshytivIty 01 Ihl Hlllllml leads 10 lonsidcrably longer longue lengths NOie thil for Ihe lowest
hydraulic conuueliviy 01 the aqlliwrd here is no submarine cxlcn~ion of fresh gmumlwoncr a- was ohscrvlt1 alrLOIdy ill the disussion of Figure 9-J In rigurc 96 similar n~sllILS are shown for a loastal head (h) or + I0 III above illS Again the effecls of varying aquifer parameters arc less important than that of the aquiLard
111 fi~llrc 97 the rCSull-i ilrc ol1lplr~d for allulllions witl1 ltl sea dcpth of () and 10 n1
(lell and nghl pands lc-ipcctivcly) Varying -iea oeplhs appear to lwve only a minor effect
UI~ tbe (lnglle ~ength This i-i not surprising as it can be reasoncd lhat eXlra seawater luaoing 01 10 III IS cqulvltllclll 10 iI nulIclion or the toilst1hellO witb only 025 Ill
Note thatlhe markers in Figures 9-1 95 96 ano 97 sometimcs do not follow smooth curvcs The rcason is that lhl loastal hLuh ror th~se data arc nOl exactly +2 ur + I0 111 above
111sl in lhe cakulations Qhr is all independent variable ilnd is caldulated by the mOlIe Tlerdorc i Imge IIHhLr of ciknlaions wih var)in Q have heen gtanmiddotmiddot Ut e- 1 u 110111 Wbldl the 1 closcst to +2 and +10 above Illsl have heen chosen
94 Disclission and conclusions
Orfshore extension or fresh groundwuer in a semi-confined oastal aquifer with steashydYmiddotSlUC now is smalh=r than calculaled With il simple SIHUp-lllterfille model (SIM) Tbe sllhmarine discha~ge detTeses in an offshore direction uilliithe diffusive boundary lltlyer in
Ihe overlYing aqultard eVLntually reilches the lltlllircr anti creates imaability and convective (Iensity LU1Tcnls
Thc New Appmxill~ Moud (NAM) presemLd ahoye resuhs in an ~arlier onset of
instability and ShOIlCf fresh water tongues Lhan th~ old Approximate Model of Kooi and Groen (200 I ) uid In gcllclal hmh mt1uds leu to similar cotclusinns
SCllsitivilY tests with NAM which combines upward seepage and downward ditTushy
ion sllow tlwt increasing the hydraulic resi~tance I-Ik or the ilquilard iniliully results in IOllger fresh waleI tongues Howevcr II very high resist lIlCes the Icn~ths decrease in duc to a comhillatioll of lWO effects (i) tntal submarine gmundwlIcr lUI110W dimish~s and (ii) the declining upward slepage (though becoming spreatlout over a larger distance) leads 10 instlhilit) closer to the coasl
The scnsitivity tests Wilh NAM rUriher show lliallhc fresh glOundwalLr tongllcs UO nO( extcnd more Ilwn 6 to 2X kill offshore ror colstal groundwller hlads (Ii) of +2 III and
+0 III ltmve msl Jlspccivcy Leaving oUllhe eXlreme cases tl-l gt 50 h gt +2 III ahove I11sl) nile Illay ilSSUl1le thaI fresh groundwater generally docs nm eXlcnd more than 5 kill
tllfshtltc Brackish groundwiltLr within a topography-dri en now domaill may cXl~nd further
olfsbore In this Irmsitioll ZOlle tile salinity will grildually rise as Ihe SClwartl tlOWlll meleshymic groundwater mixes with downward IfUnsponed saIl Thl OllieI limils uf he triIIlSiion
IO~le ilcconling to SIM vary rrulll-Jo to 1-10 kill ror h1 == +~ 11110 +10 111 respcclively Alter hillIlg oul th~ extrCllle CtLS agaill IIlL outer limit in most Lases will nol c Lecd 50 kill
The Ntt lllmlLl is compared Willi two nr the hcS(-doclIllKnlcd LlL Ihe New Jersey
coast of the USA and Ihe coast of Suriname (Chapter 8) The model input values
New Jersey coast derived from the study by Meisler et al (1984) were He == 50 X IO-b mIs 1] = 350 m k ~ fx O~ rrJs W== SO m anJ Ilmfm ==+6 m ahove msl
responding lengths of the fresh groundwater calculated with SIM (L) and NAM ( ilnd 0 km respectvely For the Suriname coast the inpul values are He ~ 25 m k J mIs H == 250 m k == I X 0-1 mIs W == 50 In and 11(1H +35 m above ~sl The an L of 9 km and a L of 0 km This makes clear that the offshore meteonc groun
these lWO sites has been fanned by different flow syslems and can therefore deno
ogroundwater The situation offshore Ihe coast of Florida where very high hydraulic heads
above msl) prevailed until cxtensive pumping started in the lasl century is differ meteoric groundwaler beyono 100 km offshore may be fed by ac~ive flow sysle
hore recharge It can be inferred frolll the sensitivity analysis ilnd the cornpanson of mode
with observations Ihat occurrences of moderalely brackish meleoric groundwater the offshore ilre nm in equilibrium wilh presenl-day onshore hydrological condit
independent measurements of sub-sea pressure head and gr~undwaterage are n ~her asccnain Iha~ Ihese waters are indeed rdics from changmg condHlons al a g
time scale and to provide data for more detailed modelling (Ch~pler 10) Flow aI1d solutc Iransport in the brackish lransition zone Will also be S[Udle
10 ilh a model that incorporates variable density now ano transport including
ment of conv~ctive oensily currents
Chapter 10
Flow and salt transport in sulJlnaline mcteolic gronndwater in steady-state and trgtlIIsient systems
101 In(rndllclioll
III Ill( prcclding cha[lllr- tlo ltHId solute transport processes IlJt hCL1l Olllllietl hased ~m singk- or Jouhk-dcllsilY density groundwater now Illmlcls (Chaplers -l ami 9) Jlld lhlshymica and isotopic rarmlclcrs (Chapl~r~ 5 6 ltlmI7) HOLt~r 111ll1tlslalillillg lll nnw and sltllllte lranspon in the coastal ltlntl orfhofl zone requires integratioll or [upograplly-dril1l tlo dCll~ily-l1ricl1 lIo diffusion Jispcrsinn ltlIKj free COIvCltlUIl ill ullstahly slruificd grouIHJalcrs Especially the lauer process is scluolll mcOlllllcll for ill grnundwlIcr modeb tm it is very imponalll in elllStl] I1It suhllwrinc groundwater where inverse salinity slratilishy
calions often arise Thcse prOlcs~es arc relevant ill situatiolls where OIl flelth groul1uwltltCI recharged onshore nows into the olTshore r~lrl or all lquirer h) a cnustallandscape hCCOllllS ~lIhmergell uuring a falls1-lessioll The suhmarinc Olltnow situalion (a) forms a steady-Slate cOlHlitioll ~Itld has hCCll invcstigahd with lhc appnxlnmtc model in the prcct2uing chapter The lrall~~ressioll silliatioll (h) Lreales ullstcauy-statc conuitiul1s which hac heen uiscusseu in Chapter 5 111 the rrcscllt chapter the dynamics of these situatiolls arc ~tllllieltl in nUlllerical experill1ents llsing models that cOlllbine all relevant proccsses Mouel I silllull1es the submarine tltllllow gtitUltiOl Mmlels 2 anu 3 rerresel1t transgression situations over a flat continental shelr anu a sbelf witb all erosive topography respectively Mntlel3 is relevant as imestigatiol1s (ChaplCf 4) demonshystrated thaI ullling the lagtt glacial the exposeu sl1elr was suhjecleu to strong fluvial erosion h1 such a landscape salinization (ar[s in valleys which arc intnlued hy the se1 ill all early slage while topography-drmiddotIen sy~lel1ls continue [0 rUllction on the llllcrnlives The COlllellts or this chapter arc partly ha~ed on article published carlier (Kuoi et al 2000 Kooi and Groen 2001)
102 Explrimenlnl setup
fO2f NUIlerical code
The 1ll1lHeric11 experimcnts reportell here were conducted wilh the tillite-elell1clIt vari~
ahle~uensily now and tran~rorl code METROPOL-3 Fort uctailcd ue~criplioll or the code Ibe reader is rcferreu to the ork~ hy Leijllse (1992) Sauter et al (1993) Leijllse 1Ild Oo~trolll (1994) and Oostrom el al (1994) The code slllves twn couplet partial difrlrclltial equations in salt mass rraction (0 and nuiu pressure p The equations are nonlinear because Ibe nuid density p dynalllk vi~cositYIl depend on (0 The eqtHllillilS are coupled lrltlugh q and p Here we use a con~tallt value for p because or the low salt mass fractions L(msidered For nuid lIensily p = p(Jerrmiddotl i u-ed where PIl b the rre~h-waler density alld r 069 The latter vallie gives nuid densities deviatillg less th1I1 0 1 from experimental val lies for salt
11 2
ass fn~ctiolls viLfying from (0 = 0 (frcsh water) to Co = 026 (satunllcd brinc) (Leijnse
J~2~ Flllld Iml pO~c c()[npressibililics are neglected ~orrcspolldillg to uro sp~cific sLorage IllS IS rCls)nah~ given thilL lh~ changcs ill pressure boundary condiions OCCUr ollly vcry olwly
~hc IlLllllcrical schcme lIses thc Galcrkin weighLcd ~sidual tiniLe-elemcllL method fully lpl~Clt backward Inlc stepping Wilh automatiC Lime ~lep cOlllrol based un convcq~encc
1 ulIcmenls ~ conslsLent vclociy forlllulalion is uscd to represent Darcy vdocilie~ (Voss III Souza Iqn) METROPOL-3 has been compared with other codes for a number of
lIchmark prohlcms in the HYDROCOIN projecL (Leijnse and Hasslnisadeh 1981Ja IX9h) and was fnlltlll to givc cmuparable resulLs
122 [)inIliIIIiOl
TilL spatial 1I1d tClllporal sCltllcs that cm he Iwndled by variilble-densily tlow simulators ~ lilllitcd bClluse of strict nquiremems ul grilUmcsh resolution This applies ill parlicular Ihe SIllIuli1Litlll of diffusiun in the boundary layer helow the SCI nODr and density-driven
middotnvccLlon 1I1 unstably sLfiltified J1uids
Inmodel 2 I lid 3 a tiJllc~depell~C1t Dirichlct boundary com1itioll is used for lhe lOp
1II1dlly w~lcre w~uddellly Jumps lrum 0 to (0 alterhe lransgrCs~ion Striclly speaking IS mCtlOd I~ phyilcillly lUlL very rei1istic tiS ovcr time ial is introducetl in the top elcshyllts 01 the ltlllLe-clcmct lllCsh (becausc (I) varies linearly withinlII dement) which IS not
mullcd Ior hy houndary luxes However as long as the vcrticallHcsh siLe tl is small llWSS-hi1mllc enor is lisn Slllall (morLover its causC is known l
In ()n1l~ 10 achieve convcrgencc in lhe caculalions Ihc conditioJl J lt S shoultl be l whcrel5a denotes the thickness of tht saline houndary layer ill tllc lOp of Ihe domain at
Illstant It beL~ol~les 1InsLlhle lId lingers start to dcvelop which OCClIrs when the boundilfy er reaches allll1te thickness This implies Ihatlhe Raylcigh number for a bountlary layer 111lcngth (thlckncss) scale 1 has 0 hc slllilller lhiln the criLical boundary layer Rayleigh IIlhe llr
APt [ 6pr 8 1--- lt Ru = ----- (1 nl )11J) - pD
ILre Jp = p - Po g and arc lbs)Jllte values of gravitllionallctcleration and (iSOlroshy) intrinsic penneability f) is the scalar valuc of an lSSllIllCd isolropic dispersiOI Icnsor
IlClS uf porosity II Hid tortuosity r arc acculInled for ill Ihe way D is delncd in the
delas [) = I[)r wilh [) as the diffusivity in water (mcchanical disperloion i~llorcd) [I
gt ( Ihe boundafy layer hat is creilleL nUllIerically just below lhe seal100r iS~llways tahle (ils Rayleigh nUll1ber is hlrgef than criticall Ilene untlLr these Cir~t1111Slitncs finshying Slarts Iml carly in the model More crucial howcver is Ihat upward scepage of rre-h leI IIlto the ca lend 10 crClle 1 boundry layer or flllite thidn~ss () = Dlq which is re cl1IJpres~eLl if tile upl10w is lotronglr (Wouding el al 1997111 II the upllow is strong
ltlgh tile houndary layer is cOlllpressetl to sueh an extenl tlmt il remain stable at all shyIlS llence under Illese llmditiollS illSlltlicicllt ~pltinl L1istretitatioll -1 gt 0 will creatl 1I11 tahle hOllndary layer and fingering in the modd L111jll~tly Wootling ct al (191)7a)
Ind Nu 10 frulll hutll perlurbiltion analy-es llld numerical anti Hde-Sba cell cxperico
Ills
Similarly 1x has to be choscn such lhalthc criLical wavelength of boundary-layer instabilitics A whch conLrols the dimensions of finger instabilities)5 resolved Bccause
lT
A = 15S_ (Wootling cl aI 1997a) the following is appropriate a
(102)
The validity of lhe above condiLions was corroborated for the long-heater Elder probler (Elder 1968) (sea-Waler conditions along enLire width of the top of the domain) with and wilhout upOow That is numerical experimenls were performetl to tcst (I) gridmesh con gellce and (2) Rll 10 Wilhout upOow progressive refinemenL of Ihe mesh both in the
rr
horizontal anti venical direclion and retluclion of lime stepping indeed resulted in conver solutions where the locaion of individual lingers varied but their characteristic wavelenl and growlh rale became constant Too coarse discretization led to a different timing of in bilily development and linger dimensions that were too large Insuflicient horizontal disc tization was found to have a stabilizing effect causing tinger developmem to be delayed fmger widLhs equal LO lhe element size Convergence was also achieved when upflow w imposed for lhe above problem Stable boundary layers occurred tor boundary layer
Rayleigh numbers of 1 and smaller consistenL with the results of Wooding et at (1991a) Too coarse vertical discrelization here led unjustly to fingering and salinisation The gri(
convergence shows lhat the dynamiCS of lhe numerical ~yslem is governed by physics at
nOI by the particular realizalion of noise (in our case truncation errors in the code) w
seeds boundary-layer instabilily This contrasts with recent findings of Simmons et al (1999) who suggest lhat in applying the SUTRA code to Wooding el as (I991a) salt-I problem it is inappropriale to rey on round-off errors The cause for this difference is
unclear Rccently Kolditz et al (1998) showed grid convergence for the shortmiddotheater Elder problem applrently also relying on rountl-off errors The grid size for which the)
obtain i converged solution agrees wilh Eq 101 and 102 For the experiments in model I and 2 thc mesh size was chosen to satisfy Eq lC
and 102 Wilh tlispersion dominaled by molecular diffusion (substilULion of the paramel
lisled in Table 101 102 and 103 in Eq 101 and 102 and using RlIrr = 7 yields L1z lt III and 1x lt 056 m respectively) This should ensure proper discretizution with respec
Peclel anti Courant conditions n model 3 hydrodynamic dispersion has been intlOtluced 10ngilUdinai and trans
dispersion IengLhs are u f = 1 m und aT =01 m respeclively Under these condilions t maximum mesh size can bc enlarged to Llz = I III and L1x2 m LO fulfill Peclel and 0 conditiuns The maximum mesh for the simulltJtion of density currents will also be larg Ihlll in lutlel I and] ahhough [q 101 lnd 102 cannot be applied Nevertheless Lhl sen dimenoiuns are hclievetlto ensure 1 proper reprtsentation of the density currents
1023 Model WIl hOlldwy nmdiliollmiddot
Mmd I 11imUly mmlll rilllt gmwlm(el lII1 sotile 1111SP011
BeCllISC of sritt requiremellts or gridmesh resoh1ilm accuratc simulation of fr
Water longucs lhal extend over a hmg dislanCl into the offshore is nOl feasible The c menls presenlcd here were conducled OIl a SOD III long slction anti a 10 m thick aquil overlain hYl I m thick wnlning laycr (Figure 101) For Ihe gtallw reaons the aquifc
Model 1 h = 0 m (r) =m sea
sea level c
coas
no flow no dilt
E 0
20 elms) aquifer
h = +1 m (I) =0
bull no flow no diff
500 m (1500 elms) bull
Model 2 final sea level
iiiiiiiiriiiiil~aiin~ljii=1O3bullbully~~~afteri2O~O-2000 yr
r ~ initial sea level
hydroslati SOmE(27 elms)w=o hydrostatic aquifer
(I) =(11 sea
no flow no diff
400 m (800 elms)
permeable zone Model 3 in experiment 3y
900 m (18 elms) 150m 400m(30el s) l40etms)
no flow no diff
final sea aHer 2000 - 8000 years t no flow no diff
E o
no diffno flow 50 m (50 elms) 50 m (50 elms)
Figure 101 Sehematic structures (If three numerical models (elms = elements)
I1Kahility ha~ [0 hl a~~iJlIed a fcalinly low luc 0= ID x 10 11 11l~ ur k (hydraulic COlishydUCIjly) = 01 Illdl) Fixld Plllll1C(l1 Vlll~- arc listed ill Tahk 101 Ollly Ihe illllinsil
permeahility of thc ltlql1itanl I was varied in slILTcssic LXpLrilllLllb ThL finilL-eklllL1l1 mesh clll1sia~ of ~7()O qlllurilaleral dLmCllts 1~O) illihe horiiolltal and 2 inthL vertical direction The horillllt1l (klllent size i~ ul1ifoflll with d 05 Ill The erliLal clement sill
in tilL lOp I III of Ihe ~lllion is1~ 02 Ill hdow this layer L~ = )J~ Ill Inilially the edishyOil rilled WIth SCltlWatef Subseql1ently each experilllent was fUll 1lI1lii ~1 stLady-sHi slshyinity ditrihulion was ohtained Mosl simulations (lnly showed a quasi-steady solulioll heCtlllSl t01letliL lllller instahilities caused slllllity values lllt tll low ridd 1(1 llllttl1ltllL
round a tOllSlal1( Illean Till dimellslllllS 11ld Jtluifcr pll111Lahililics did not CUIlLspond wilh the actual ca-c- where lIleleoric ~rulllluwlIcr is fOllnd Illllly kilometers olTshore and (1
depth or -e lral hllndreds of meters (Clwpter Rl Til plirpOSl of Ihese lXpcrilllellts is to erify the a-U1llptioIlS and thL rlull lt1f the Ne AppmxilllJte Model (NArll Ill Chapte 9
Hrltfl 2 Ihllllrilll grol(lnllll (lml SOlllff nllspo dlril1g f(Ilgnslmiddotjlli 0(1 11 7f1 IItImiddot
lanopilltI hlld s(((
Mpdcl experimenls nr the transgressing sea have heL1l carried oul on two-dimcnsioshynal enicalcross-Setlioll with a length Dr -lUll III llU an al[uifer thicknLss or 10 Ill (iel)melry llld houlldary ClmdilillllS arc depicted in Figure It)l TllC nmdili(m at Ille (lP
and ril111 hOlllluary arc limc dependent depending tln sea level The right hllUllllary is assigshylIcd hydroslalic prcssun cOlluitions anu collstanl seawater salinity The pressure part or [he lop-houl1dary condition is givcn by
f)~ = () hi 1lt 0 f 1113)
where 1 is (he houl1uary Iluid pressllle and 11(1) is [he 1IKai sea dcplh lnllllcnce of lidal ll11ctUiliollS is nol lakL1l inlo account The sectioll is assumed fully saturatcd such thai the topographic grauienl cOlllnlls the llll-hme hydraulit pressure gradient The gradielll of Ihe
opographie sllrrace in the experimenls is (3 =1 x 10 whidl is a typcallllean vahl( ror conshytinental shelves ( 100 III waler depth at I the edge or a 1Of) krn wide shein A tillie-dcpendent
Dirichlet bOlilluary cOluilion i lI~ed for (I) a[ the OP houndary
w~ = (I) m I h( I ) () w~ () I h( ) lt 0 Fixeu parallleter alllcs arc showll in Tahle 102 while plllllelerS valnes varied illihe varishyau experiments Ire prescnted in Tlhle 103
The finite-element mesh WrlstSIS of 29600 tjHadrilateraleklllllls HOO ill the horilo11shytal ami 37 in he vertical diHclion The horizontal element sile is lilliIm-ill with Llx =05 Ill The Y(nital elemelt sie in the top I 111 01 the sectioll is k 01 Ill below this laYlr1~ = 033 m Thc maximulll lime step eillployeu is 1 x 1()7 s which keeps Couranl 11l1lllber ~1l1shyler than I a Jllllimcs EI(11 experill1LlH starleu with he steady-stalL salinity dislrihlllioll and 110w field for a sca level or +005 m which torresptlilds 10 a coastlinc 10cltio11 ) Il1 from
Ihe righL boundary or the Illcsh Model experiment simulatcd lIhsequcnt salinislliOII fur a givell rale of sea-lee1 rise during a period of 200 to U)()() year
Again he dimensions of thee experiments slllTer rrol11 the same nUlllericallimitaliolls as in model I Howeycr the hilsic styles of seawater ilHrusioll thaI canllevclop arc well illustrated even at these rcullceu scales Moreover from the experiments and the discussion
below il cun he underslood how sahnisllion at rger space and time scales occms In Ihese experimen[ atlelllion is gien to the speed of the encroKhillg sca rehl1ive to
mcction of the fresh-saline inlerface Earlier modelling stlldies hy Meisler It al (19H4l and
116
t
water lable amp land surface
II llr
- - - - - -- - - -- -- -- -- - -- --_ -_ -t 5
fresh water
sail water
-
x
c=
I-igur~ 1112 D~l1sj[ydri~n oree olllhe r~jhl~aill~ illlcrfilce Juring Irallsgrcssioll mltonlillg to model 2
EsmitJ (t)l)OJ ~hmVLd lInt II I I bull Ic IlIlcr Ice reacts very slowly I I III Ill Idvlctioll orlhc illl r _ () t 1C mnvlOg shoreline The
tr ICc IS plllllanly dClermmed by II I on lite shelf depicted in FilIrc 10 IK 11 we ge ot heavy seaWater
- 001 llld Groen ~OOO)
A 11 -p gmiddotl(llJ
IItl ~oJ 1104)
Where fJ is Ihc lalldwmJ ltlip of llle shelf Th sca Icvcl rise hy L IC[Ut1l lallsgresslOll speed Ir- is rela[ed LO Lhe
1= ftltlnfJ
Till transgression speed call he expressed in (f 110n- J1nen~IUIl( lerl11s by
r = I l~l = ~___ KPg middot(III~ J ( 105)
Where the crilical vallie is expec[clJ IL fl-r - I E I0 ~ I would rlvor lhe lain behind II I~ I - q ) S lllWS Ihat high ilIIlCS or r which
re r (It 1 l-Wilter wed C t I shyIow pClllleahilily (0) and illl1ani I I e- en to OCCur IOl larg~ values of l fll Ir ow-gradlenr land sUrrafC5 (Wn 1J ~
Mocld 3 Ilfhllllri( ~(IIclll(lltil(l wllr( flWl) IWltllIII((( 0 ( elm f)]~ IIWI greSllIIl 01(1 (I diutCed
ThL Llll 1 I L S () I nSlIlg SLj Icvl1 ellClOadlin Il
lopo~laflhy hIS b~ll s[lldi u [I e ponl (ontinellial shell wuh alley t I 1 d t WO-dllllCllslOnal model gt
el lltlll lmm a valky [0middot1 Vmiddotltmiddot I I rep[t~ellllllg a vCrlllallross_ lr ul[l C ltI~ mtlcuLd ill F 10 I
(lOll IS 1500 Ill The i1quilcr Ihickll --10 l-llll - Th~ length of the scc-tjS IS Ill whefea-o the Ihicknc~s or the clay layLf OJ] lOp
varies from 10 m in the valley to 40 m at the waler divide Bottom left and right b are no-now and no-diffusion boundaries The hydraulic and concentration conditior open lOp boundlry ampIre lime dependent relaled to the rising sea level as in model 2 experimenl slarted with a steadY-Slate situation with only fresh groundwater flow 1 sea penelrmeu lhe valley and rose in 2000 years to its final position submerging l~
landscape The water divide was then eovered by 10 m of seawater Afterwards the mell was continued for another 6000 years This is a realistic stenario reflecting ral Holocene sea level rise (Chapler 4) at 8 ka BP the sea level was still rising tho below the present level but at 6 ka BP it reached its present level
ConSlant parameter values are shown in Table lOA The vertical and horizont abilities of Ihe day layer in exrerimem I are 10-16 and 10-IS m2 respectively (or J(
~ mday in hydrmlic conductivity) In [he second ex~riment the permeability has increased by a factor of 10 with respect to the first experiment In the lhird experin permeabililies were equal to Ihose in experiment I except for a 50 m wide zone n1 water divide where they were increased by a factor of 100 relaLive [0 that of the f rimelli
The finite-element mesh consists of 9660 quadrilateral elements 138 in the 11
lllU 70 in (he vertical direction The horizollial element size varied from L1x = I m ley and gradually increased to tlx = 50 m at Ihe water divide The vertical element the aquifer equaled k = I m while the element size in the clay varied from1z =l Ihe valley to L1 = 133 III at the waLer divide For experiment 3 the horizontal grit the permeable zone was relined to d = I m to allow convective densily currents
103 Results
1031 Model I Ilalimuuymbmarine grmtlllllcaer and solule transport
Figure 103 displays the sleady-state salinity distrihUlion for three expenm which Ihe penneabilily of the aquitard was rrogressively reduced from 74 x 10-1
x 10middotr7 m~ to 15 x 10 17 m2 The corresponding now fields are depicted in Figur Three distinci zones can be dislinguished (i) a proximal Slable zone c10sesL 10 Ih where groundwater in the aquifer is fresh and high seepage rates restrain Ihe diff dar) layer to tbe clay layer (ii) an inlermetliate instahle zone where the diffusive
laycr reaches the aqUifer and creates convection (densiLy currents) and (iii) a dist zone where free convection is absent and slllinilies are high though slillless Ihn seawater
In Ihe firsl experimenl seepage rales were high because of (he relatively hi aquilard A proximal $lable zone of about 50 m developed The length of this zo
aboUt equltil [0 lhe length o he fresh-water lOngue according to the New Appro Model (NAM) from Chapter 9 (indicated by an asterisk) Going further offshore rapidly diminished md the intermediate unstable zone commenced DensilY cu clearly visible in Figure IOAiI Beyond 100 Ill [he distal stable zone is found w very link now and $ulinities are high with very small vertical gradiems The 10
second experiment Icd to a reduction of the upward seepage rJte but also (0 an the seepage zone inLo the offshore zonl In this cllse ltI wid~ inlermediate unstab dearly visible from 10010250 Jll offshore (Figure IO3band IO4b) The trbulll1lsi
proximtIIlble iJJIlC h tlot c1elr[ he 011( up If) lCJfJ 111 (Ilhhqrc hY- lahlt_ hUl it appear
lhat frtJm 11 IiJllI~ drnily ClHfllll drorlIJ1 rdkUIfIl Ih qllJmiddotmiddotImiddotmiddotmiddotl~IlI flallJn 111h~ ~lCI1
The intjjhiliy ljll jl-IJ t)l~ lenvrd fPHlI tl1 la lhlt (II 1 middot_r~h~d llthl II~TlC llun
lO3b) and lhere ilIJIJ uhllllrilll IrtIJ-jTlJIJIld ltl1Cr rHljUC Hl3JrtJllll llJ the ~rl ~odd
(Figure IO3h) Apparently the instahility i not very high a illakc a c)n~J~rahl~l1lTle [0
develop fingers Another possibility is thal the small disrcrsi~m ha lt~ sLablilmg ellecl on the boundary layer Further reduction or 1( in the third experlmel1t dId noL change the geneshy
ral pattern apart from the intermediate zone with frequent density cu~middotelHs which noe~
closer to the shore This is the result of the lower seepage rates allowlllg more salllJltruslOIl
into the aquifer
~
-
JOO x (m) 200 100 0
300 x (111) 200 100 o
300 x (m)
Fi ure 103 Variable-density now and solute tTltmsport in expcrimcnls of mouel I slcldY-SltlIC submashyrin~ outflow of fresh groundwatcr cxperiments 1 10 3 are results fr K equal lo 74 X ](ImiddotI~ 74 X 10-11
and 15 x 1017 m2 respectively Solid lines contours of salt-mass ImCIlOn from ~() = 0005 to ~ = 0035 with contour interval 0005 Shaded arca zonc with OJgt 0020 Heavy dashed lines Ireshsahne hounshydary according to sharp interface model Asterisk above each panel extent of fresh groundwater accorshyding to new approximlte mooel
20
1 exp11 lt I
i 1lmiddotlldd am(
1~lllllllk - 10 111middotx AIl~k 1111 IlPJI(llal = ~5
middot10 shy
b (J lexp21
LmiddotE lt ~ fgt
-10
500 tlXl JOO x (Ill) ~(ItJ too 0 c u lexp31
(~E lt ~ middotn
middot10
iOO middottoO 300 x (Ill) 200 100 0
Fi~llr( 104 Vi~ualillilln Ill lhc Ilow ficlus in expcrimcllls (If l110del I Truc low c1Illilils arl ~IH (Darcy vcl(lLily ulidcu by ptl[(lsilyl The vclocily is Ihl samc ftlr the llllCC panels allli i~ indicalld ill llpper pancl
Also shown for each of lhese experiments is lhe corresponding sharp-inlerface SOIUlil according to lhe Snl Illodel (Chapler 9) for lhe employed bOllndary condition for the coa l
groLlrllthalcl head 11 = I m The corresponding values of the suhmarine groundwater outtlo QI for lhe harp-inlerfacc ohnions arc respectively 263 x 10 7bull R32 x IO-S alllt
371 x IO-s l11~s Valu of Q Infcrred frol1lthe tlow licld 01 lhe Illlllleric~11 simulatitm arc respectively 2(13 x ]()-7 R07 X 10-il and 331 x IOmiddotH m)s The sliglHly lowr values [
the latter IWo numcrical simulations as cOlllpared to the valucs for the sharp-inlerrace
appll1ximations arc caused by the dcnsity effect associateu with lhe presence of more salilll water in the aqui rcr close to lhc coast Comparison of the rcsulls for the two types of mmlt shows that the sharp-intcrface approximations tend to overeslimate the length of lhe freshshy
waler tongue and lhal lhe discrepancy grows signilicantly with dccreasing The numeri cal experiments dcmonstrale that lhc downward salinization hy convective density Cllrrellloshy
hecomcs progressively more dominanl lhat is lhc fresh-water lcngth initially increilscs hlll reaehcs a maximulll valuc and then dccreascs upon furlher rcduction of Por the hydroge ological conditions adopted in lhe cxperiments this oplimum approximately occurs for Ihe
IL)(-I-----ltCIII-I-----IX----(-I1-)-=IX~) -----CIX-~==~O
01- E _ -5 I 20 years
N
-10-- shy
or 5 t=40 years
_10L--~--
--- shy
_10L~~~--
o
l=1OOO years
~C-
X~ 1 CaellaleJ sahnilY
gt( I of moue lute ua1lport in C4pC~mel b_criticilltrlIlsgresSIOll rale
105_ VilriablemiddottlcIlS1Y no~ ~~r substrate in combiallon wlh ~ su frOln 00= 00005 to O~355 lion at hr~~ ~inc ~t~pS ~~r ~~JnJss of shiltling cO~o~r~ S~~o~ob~rn a~tcrisk Details pte glVcfl
gt ffllction increases Wit 1 f ~hc shoreline IS IllunalC
I ih current locillon 0 oml ullervu s lt
ICla -to
sect N
cttHld cxptrilllcnt Finally all inleresting feature of the predilted si1inity pltlHerrlS displayed in Figure 103
tlwt l(lw-~alinity water~ extend fanhest offshore neilr lhe OilSC or the aquifer This lonlrasts Irtlngly with lhe resllhs or sharpmiddotinterftlle models whilh show fresb waler to he progrcssishydy ltllllinclitu the lOp piln of Ihe aquifer when moving in ltl seaward direllion
lJ32 AIldd 2 sufllllClrIU gnJlltfdwlIftl IIl1tlsolHt tnillsWI durilllf 11(I11ign~middotsilg unI1I
Iho (mClnlloli1~ alld SIIj((
The experimellts tbat Vere lOlldllcted wilh the ~el(lrltl lI10del arc sllll1nllricd in Tabk (lt Inlhe experimcnts the following paral1le(crs or lontJitiolls wac varietJ ) strl(igrlphy (I) single sand layer (ilquirer) (b) ~ingle ell) laya (aquilartJj (l) aqllilard Lrlying all ilqllifer
rale of seil-Ievel rise 1
dly lerlllcahility I~ and longitudinal and transversal dispergti vity a j bull and a Parameter vidue that were kcpt eonstllll are given in Tahle 102 The term middotmiddotsmdmiddot is
Ld here and in (he following h) dtllote stdimenls with permeahilities that are high relative
days Thl perllleability value listed in Table 102 correspomls to fine sand or sill Using a ~hcr pcnueahililY wouhl imply a major innease in nUlllerilal co~l as expbintd in section 1~2_ ~1ltIJ1rfanJ rlrdenoc ht non-dimensionltll transgression rate 01 Eq 105 mhstilllling 1 and dly pellllehililY rcspcclivdy
Experilllllls 1-7 lllt~tnill the lriliellrlnS~ression nne rmiddot for a uniform sand subshyI(e and very small hydmdymuuic dispersion (ll1ore thall 40 times smaller than molecular fusion) pr was found to occur for this set of experiments b~tween 558 and 651 (Tlble ]) Figure 105 displays the horizontal style or salini~llion for expelimellt I It shows lhat lransition zone quickly assunls a stteper ltmlnarrower geometry during its laleral Imiddot~ltion in wmpltJrison with the initial steul)y-sllte situation It WilS fOlllld thm this tfretl is l11gef 101 higher rl~s of sea-level rise The observed steepening is probably due to inhihishyouttlowat the landwmll side of the lmnsilion zone and lhercfonmiddot cllhill1lC( input of salt he tup uf the transilion zone This steepening in turn tlnhalccs tht- CkllIWtSt- on-x in now llclu (sstlciued with the density dislrihulion whilh lends to llaucll the transition
IC Apparel1ly the Iwo effel1S (inpU or salt at thc seafloor and thc enhanced clockwise lCOX) work together 10 (I) maintain a conswnt shape of the lmnsition zone and (2) provide Ildlilliism for Iltend migratiun or the transition zone in addition to (hat due to the chanshy pr~~ure houlidary wntJilions ill (he land surfule The Jaller eflecl prohltlbly explains h~ exp~rimclllaly Jelcrmillcli value of Th of aboul 6 is lilfgcllhan Jhl ~allie of I preshy-1I ill S(xlillll IOU
Figure 106 ~hows lhe sulinisHioll history fm experimcllI 7 h this experiment thc ~ilillil zune IJgs hcilind lhe l1ligratill1J cUltlstline und e-wata fjuglrs eman~Hed frol1l a lsive huunuary layer whilh JcvcloJls IS a moving wltlc ill (he top or the aquiferls sea _T overrllJe fresh gmumlwatcr ltllis hOllnrJary layer is seen llort clearly in Figure 107 re it rClllaind stable because of low ~rlleabiJity)Theorelilally lingering unly ~lancu
rc this bOllntlilry layer rcacl1cs illritieal thickness In Figure 108 this ocurred Ilos to Hrn shoreline hClilue the lrililallhitkness was very small Ilsing Eq 101 iUlU ilUOpmiddot RCI 7 yields 8 O1X m SeHIter lIngers lank 0 th- base of the ICjuifer and in CllI rresh wallr CSClplU llpwmls inw the s~a As 1 r~slJh a id~ high-salillity trlllsishy
x(m) 1 Caclilalcd salm1ty ol7ofmouc n
lute uanspOlt III e4pltrlIne u rol-Crltle011 tr01nsgreSSIO
lire 106 alllhk-ucnSY I1lI alu~~r ~ubsuae t11Ionblnauon WIWl ~re from OJ 00005 to
slCpS llIrI J 1 l ContoUrS s Left 100 mUlbtlllOn Illhf-( 1Il( bull lIh darkneo 0 SlauH~ 1I C lieu by all sen~
Sat-lllLS~ tral tlun mClS nl Ill IHOl III he lhorcllllc 1- In 1 I Ihe cune bull
~015S al umhmn ll1ld a 11 l)ctllb ltiT gLCn III the lexl li model UlH11alll I 1101 ~h
-10
bull a 1shy
~ -5 1=40 years
Ol- bull
E 5 ~ t=120 years N I
-10 L--shy
bullo - Z-sectpoundpound M-~
~200Ye~~~ -1gb-----~2ii(r 300 400
X(m)
Figure 107 Variable-density now and solute Iron1ipurl in cx~tTirncnl ~ of model ~Clllculntcd salinshyity distribution at three lime steps for n cluy subslralc iu omnmallon wllh a supra-cnlca lransgresslon rale SaIl-mass frltletion inCrCltIliCli with darkness of shadmg C(mt()~lrS st~owu arc fr~llll (I) = f)OODS 0 00355 at uniform intervals An asterisk indicates the current loeallnn oj the shorehl1c Len 100 Il of model domain is not hown Detail arc given in [he [ex
bullI ----shy-10
E 0 r --- -5 t=140 years
N -10 _
bullo
E ~-5 t=200 yearsN
-1qoo----shyX(m)
F 108 Yanable-densily now and solute transport in experiment 17 of model 2 Calculated sulioi-Igure k I I h ty distribution at three time steps for a sandy aquifer o~erlajn by a 05 ~n thle cay aycr II~ COlli mallon with a supra-crilical transgression rate Salt-mass fraction mcreases ~lt~ darkness 01 shadmg Co~tours shown are from OJ = 00005 to 00355 at uniform intervals A~ astcns~ Ind~cntes the CUITelll locatIOn of lhe shoreline Left 100 III of model domain is not shown Detmls arc gIven In the text
tion 1011e developed hclweLn the fnnilcr ilnd nev coastline Very lillic l10w UlllIITed illtllis 7(lne once the flngcls rCiHhcd thc ha~c of tile aquifer alld eonsequelltly the slIhsrqllelH development of this zone lowards full ~eil-water qUllity was dominated by dilTusinl1 amI therltlore cry ~1(Jw In Figure 106 tile rnllllill fingers were ucl1ected somewhat landward as they ue~nl1rJed deeper into the aquifcr
In experimellts X-12 the role of hydrouynillllic dispc[~iol1 was illvcstigated ExperirmlHs Xlrld () arc the same as exrerillleHI 7 excert for increased dispelsivilies In experill1ent 9 with largest disrersiitics al = 1 III and aT 01 111 nipcctivdy lingers emanated rmlll a thicker slline boumhuy Ilyer and finger dimcnsions were ahoul thrce tillics larger than ill e~pcrilllel1l 7 hUllllc huic style of sea-water intrusion was not altercd Experimcnts 10-12 which wrrcspond with experiments 4-6 showetllhat hydrodynamic disshyperioll sliglHly increases [11 to a alue he tween 651 and 744
Ererilllcllls 13 and 14 inwlttigaled salinisalion of a uniform dltly ltuhstnlte In lhesl experiments vcrtiGli intrusion by diffusion dominnted Figure 107 illuslrates the movingshywave behavior of the diffusive houndary layer tlmt develuped below the sea 11001 for exreshyIiment 13 Due to the lo permeability of the day the boundary layer stayed il11acl Nut surshyrrisingly il ltelwanJ dipping fresh water wedge lIevcloped ill the offshore
The set uf exrerinlents 15-20 were conductell ror a ubstrale in which a 05 III thick day layer uvcrlies a sandy aquifer Figure 108 illustriltes the Iinisation histury ror experishyment 17 which apart from the 05 J1llhiek clay layer WltlS the same as the exreril1lel1l of Figure 106 The clay layer affects Ihe results ill everal ways Firs beclUse of its low pershymeability the high salinity pan uf Ille difrusive boundary layer which developell within the clay layer is stable (see also Figure 107) Inslabilities germinatell bcneath Ihe clHy layer where the diffusive boundary layer within the aquifer bad reached a critical thickness Second tl1is critical thickness was larger than for a uniform sanlly sl1bstrate (ol gt 028 Ill) because (i) the density euntrast across Ihe boundary layer within the aquifer was less than the freshsel-water density contras anll (ii) now illlo the top of the bounllary waS restricted relalive (0 that in the experirnellt of Figure 106 The enhaneell stability of the boundary layer is apparell in Figure 108 from the fact that instabilities arrearell a finite distance frum Ihe currelll coa~tline Third once the instabilirles hnve grown into macroscopic sail finshygers Ihey do not sink as readily as in Figure 106 because of the sll1allllensity contrasl with the ambient grounllwater and because of the greater resistance to lIrawing lIellie flllill frolll the overlying sea reservoir Therefore a wide low-salinity transition 7one rJevelored which is illlerlllellialc in nature relative to the experiments of Figures 106 anll 107 It should be noted that a minimum thickness of the sanlly layer is required fur instabilities to arise
Experiments 15 and 16 constrained tIle nun-dimensional criticaltransgressiol1 rae t(l OClur between 11 = 093 anll rIl1 =186 which is approximately 5 times lowcr Ihan for a pure sand substrate A greater thickilCss of Ihe clay layer will probably further rellllce the crishytleill transgression rate and result Jlower salinity pore waters in the ullllerlying aquifer However this was not tested within the preselll set of experiments
The effect uf hydrodYIlJll1ie lIispersion was investigated 11 experimenls 19 and 20 It WJS found thaI similar to a uniform sanll substrate hydrodynamic lIispersion increased the thickness of the boundary layer and the willih of the fingers but Old not alter the molle of intrusion in a significJnt way
124 125
I
1lJ33 Mudd 3 wlw(Iilt gmwbllllll will mllllt I1l11lsIwrt durillg rrlllugreuiOlI [lIa a
dimiddotHllld Ilind ~IIflln
Figure 109 shuws the salinily tlistrihuliun at four uiIT~r~nt stltlg~s ilr(~r Ihc sea has inundltltcd lhe disSCllcd lantlslape Afl~r I oon y~ar s~a levd has risen to 20 m ahov~ th~
vallcy hOUOI11 bUllhc inhrl111vcs have not been subm~rg~d y~L At this slage a ria-type lOilstlinc has been formeu as call still he obs~rved along many loas[s Despite the inundashylion of he valley salt-waler intrusion does not mlur The reason ror this b~haior is that Ihe groundwater systcm is still r~chilrg~d 011 lhe int~rl1uv~s and strong upward seepllge helow (he vdky is l1lililllain~t1 pr~ven(ing u()wnwartl tlilTusion into (he aquifer Only il thin stable
diffusivc bOllntlary Illyer has tleveloped in Ihe top of the aquitartl This is shown by the vecshytor lidtl ill Figurc 109 Whcn ancr 1500 ycars the enlin~ lamlslape becomes submerged
the now field tlramatically changes The meteoric low systcm loses its drive and the fresh groundwater bccomes subjecled (0 diffusion and densily-tlriven l1ow The salt-water wctlge
in the drowned vllley makcs the fresh WOller nOW in the reverse direclion antl drives it from the aquifer by upwmd Seepilge thmugh (he aquitartl al the w ller divitle Below the valley
salls ellter the aquifer by diffusive antl atlvective transpofl and creale instabili(y antl tlensily currents The expulsion and salinizalion of lhe meteoric groundwater body is a slow process
after 2000 yeltlrs whcn Ihe sea has level reached ils linal position l111lSl of the aquifer is slill
fresh Salinization takes place mainly by downward diffusion through Ihe aquitard and denshysity drivcnllow along the bOllOlll of the aquifer After 8000 years (representing the presentshyday sillmlion) groundwater in the aquifer is no longer rresh though w is still hclllW OJll llllUlrneath the inhrllllves (chloritle concenlration lt 6000 mgt)
Figl1le 1010 displays the results of lhc second experiment where the hydraulic COIlshy
ductivily of the aquilard has been incrcased by a faclor of 10 with respect to experimenl I Only Ihe situalioll after 2()O() and 8O[)O yenrs is shown It is clear th H the higher conducli shyvity of the aqulhlrd has led to a larger nux of saIl water inl(J the alluifcr below the valley
Also the upward scepilge of rresh water fllnher away from Ihe villley has increased Thcrefore Ihe dilTusivc houndary layer in this pari is smaller (han in the lir~1 experiment
Bccause of tile larger Ilow ratcs salinization proceeds more rapidly afler SOOO years almost Ihe cntire syslem has hecnme saline
In Ihe lilst expcrimetllthe effec( of a relalively permeahle zone in the aquililrd has heen ~tUllied Paramelers ilre equal 10 experimcnt I IXCCpl ror the 50 III wide zone where
hydraulic condwtiviLies have been inlfcased hy faclor of 100 The salinities in (his zone after 2000 YCilfS ill Figure 1011 dearly show that a prcrerelltiaillow pilth has developed here for the expUlsion of Ihe meleoric groundwaler lhe high outllow velmiLies compress Ihe dirfusive hnulldmy layer to a thin zone Howewr ariel 3000 amISOOO years saline intrushy
sion hy c[)lvectin densily cllrrelllS eilIl be observed ill the pcrmeahlc zone Comparing the rcsults after loUlO) yenrs in experiments I and J shows Ihal the uqllirer in experimenl 3 has a lower salinity Apparently lllc two entrance zones resuhetl in lower groundwater low Clocishy
lieS or cvcn slagllilnt wiles whidl retardetl the salinization process
clay
-80k~-~~---~---~-----To-O-_-_-_-_-_-_-_-_-_-_--rn~i------~---------Joo
1500 0 [----=~~~~~~1~~~777771 years -20 _~_~~~~~~-~~-~~~~-~ ~
---------_ ~ -40 ~lI~~g~~======
-60 ~~---------__ 80 bullbullbull_~- ~~_~~ -~ ~ r r r
2000 0 [----=======~ years -20
g -40 N
-60
-60 L ~ ~----~
8000 years
Figure 109 Variable-dcll~ilY now and solute trltlllSprt ill cxperi~cnl I of m~del 3Calcul~tec disuibutiilll 011 100U 1500 lOOO 1Ild amp000 years aller 1rll~gressloll started In ~~e valley VaUf dcd in day IOJyer overlying a sOJndy aquifer Vertical and borizontal day pc~mca~llItlesilre 1( = 1 = 10 15 m~ respectively Sail-mass fraction inereasc~ with darkness ot shadmg Contours sf rr~lIn (V = 00005 10 00355 al unilorm illlcrOJls For lime Slep of ltiO) and 1500 years now
given
2000 0 sea eve years
-20
I -40 N
-60
-60
3000 0 years
-20
I -40 N
-so
-80
8000 years
~ N
-so
-80
Figure 1010 Vnrinblc-dcnlity now and lolule lra1lpmt in experiment ~ of lllmld 3 CnlctI~lcd ~(llini~y distribulion at 2000 3000 and 8000 years after transgression stuned In the valley Valley IS eroded In
clay layer overlying a snIldy aquifer Vcrtknl Dlld horizontal clay pcnnca~i1ities arc K = 1Omiddot1~ and K~ = 10- m2 respectiely Salt~mass fraction increases with darknCss of -ihaJmg Con(Qurs shown arc rrom CJ) 00005 to 00355 at uliform imcrvals
128
2000 yr sea eve_bull__====~= = ==
3000 yr
8000 yr
Figure 1011 Vlriattlc-dcmiIY flow and solule transport in experiment of l11odcl3 Caltulllcd sllinishyty disribullOll II 2000 3000 and RO)O YCllTS aflcr transgression slarlet in the valley VlIey is cnld~d in elay layer ()vcrlyin~ a sallltJy aquifcr VeniC11 and h(lriZ~1l1Ial day peflllcilhilitic lIrC = 10 It lIllIJ = 1O-1~ lll~ respectively as in cxperiment I Penlleaoi1ilie~ in (he pcnllehle zOl1e arc 1l() tinlcS high~r
Snlt-l1lltISS fraction incrcases Wilh darkness of shadil1c Conlours shown are from (I) = 00005 [0 0055 nl uniform interval ~
129
bull
bull
IO~_ I)isclission and conclusions
10-1 Modell
The eXp~rillCllS show thaI Lh~ steady-stme onshore outtlow )r coaslal iroundwarer scmi-cOillincd Iquifers can result in extcllsive transitioli zones of low- 10 high-salinilY _ grollHlwlllCr (illt~rmcdilc unslltlhk and distal slIhlc zone) In th~se zones relatively freshl
pmc wtt~r extends rarth~s( illlo the olYshorc Ilear tllc hlse 01 (he Iuiler These lransitioo ltllleS rcsult from ronveclive mixing in the form of density currents Fresh unmilted off rc grolilidwilter is found in Ihe ncar-shore zone only when the upward seepage is high cl(m~h Itl restrict the diffusive boundtry layer to Ihe day Illyer and prevent instabilily (proxlllHlI Slahk Ione) N)te that frcsh groundwater ~i1n abo OCClII in the bonom of the aqllirer ill the illtcnnedilte llllstahle zone where densily tUrren(S arise infrequcmly
~lthmlgh Ihc prciellt work was lomerned with steady-stale ialinily distributionslbe analySIS docs tkmonslratc tlul major modifications in offshore salinity paHerns can occur a nsuli of relalively minor changes in coaswi hydrological regime As ~ulh changes are likely to hlVe (llCllllcd ill many COliwI areas1t lime scales of thousands of years the clated landward alld seaward shifts of the fresh-water domain would have cOlHributed to me devcdeglllllclll of wide trallsition zones The inverted salinity distribution occurrin wilhin me _ bull 0
lOnlllll11g layer and Lo a lesser extent in Lhe tquifer ai predicted hy the variable-density l10w mmldling has hecn documented for instltlcc for the Norlh Sea (Post et al 2000) anci~ thc Baltic Sea (Pickilrck-Jankowska IlJlJ6) and may have impmtallt implications for sedi- ~ IIllnl diagcllcsis in surh offshore cnvironments It may Iherefore he an interestillo feature lO e lOllilder 111 gcochcmil11 Illotkb of early diagenetic proClSilS Werner 1980)
10-12 Modell
Ibsed 011 lhe Iindings or the second model sillllll~ling transgression 011 i nm sloping continental shelf our modes of ielWlcr ilHrusioli Ife distinuished
Mode I Qulsi-stcady horizontal seOlwi1er intrusion i~l the form of landward migrn iOll or I narrow tmllsilion wne closely following shoreline migration (Figure 105) This 1lI0dc occurs for a slilliriemly slow_ sub-critkal rate uf transgression An eSlimale or the crilical trangression mle at whilh the transition to modes 1 or 3 occurs for unishyforlll suhslratc conditions is given by Ell 10-1 Experiments showed that Eq 10-1 is allllflle to olle mder of magnillidc and tends to lIndereSlimlle fl r Referring 10 the recent Iiolocene trallsgreisioll lhis intrusion mode was Ilot thc dOl1linant process in most ur lhe olfshOle i1qllikrs The transgression speeds during thc Early Holocene for lIlallY contincntal margins away from the major cOlHlnelllill IlC shcets of the last ire age were flr higher (gt 100 ma) than critical lran-gression speed- Mode 2 Vertical selwaler intrusion by lingers of selwater Fi1ure I061 Thi~ ll1(hle orrurs for supra-crilklI (rlnsgression mtes and a relatimiddotely hiih-pcnneahility ~ubstra(e (sandsilt) A wide high-salinity lnmiition zone develops This rapid intrusion moLe can kccp up even Wilh rapidly advancing shorelincs It explains as an example the presenshyce or higb-sdinity groundwller in the exposcd sandy aquifers in the western pari of the Netherlands wbich were illl1l1dlled during the Early Holocene Mode 3 Vcnical seawalcr intrusion by diffusion (Figure 107) This mode orCllrs for supra-crilical lransgre~~ion nltes whilh call he very small and for l()wpermeability
subslrate sediments (siltclay) up lo greal depth An extensive seaward dipping freshshywaleI wedge develops below a thick mainly vertically layered transition zone Salinization is mainly COlli rolled by downward diffusion This intrusion mode is restricled to shelf sediments with very thick clayey sediments beloW the sea floor Mode 4 Vertical seawater inlrusion by low-salinity tlngers (Figure 108) This mode occurs for supra-critical transgression rates and a layer of low-permeability sea-floor sediments (siltclay) overlaying a relatively high-permeability aquifer A wide low-s inity transition zone develops in the aqUifer resulting from convective density currenl while in Ihe overluying low-permeability layer a relatively sharp diffusive boundary layer is present This intrusion mode explains just as the Ihird mode the temporary preservation of olYshore meleoric groundwaler Allhough the dimensions of the rnode are small lhe same process explains the presence of vasl bodies of meteoric ground ter far offshore dong the coast of Suriname the Netherlands Indonesia (Java Sea) a
lhe eastern USA (Chapter 8)
The experimenls are carried Ollt for simple one- and two-layer systems MOSl elastic cOlllinemal shelves comprise a succcssion of alternllting sand lind clay layers Therefore s ne intru~i)n may take place by superposilion of various modes For inslance rapid salini lion in a top sand lltlyer lakes place by convection in accordance to mode 2 The resulling high salinity in the sand aquifer 1lluy invoke diffusive salinization of a thick underlying c layer according 10 mode 3 in Ihe subsequent sand layer salinizltllion may proceed as mn via lonvective density currelllS conlrolled by diffusion through the overlying cluy
1043 Modell
The lfilllsgression experimellls with model 3 on a hilly landscape show that salinizi below valleys starts only after sea level has risen 10 a sufllciently high level Intrusion Sl
in when the uischarge in Ihc valley related 10 Ihe fonner meteoric now system declines disappears ahogeher NOie that in this case a wet climate is assumed wilh high groundv levels in a landscape underlain hy a clay layer Under more arid condilions (lower seep rales) anL more permeable sediments under the valleys salinization will start earlier Tt experiments show that arler suhmersion of Ihe landscape the llow system reve~ses Fres and low-salinity groundwater is slowly expelled from the upland areilS where It was ret oed before either as diffuse discharge or via permeable pathways The sludied cases wi relatively low but otherwise Iypical pcrmeabilities show lhat meleonc submarme grour tCl call bl preserved for thousands of years after the submersion of the landscape Thes paleow~tters may form very large bodies which slowly disuppear either by expulsion 0
fusion Some obscrvnions of groundwater discharge eilher as diffuse discharge submari
springs or based on geomoq)hological fealUres may be rcllted Lo the eltpulsion of pale ters This applies especially for observations far offshore which cannol be related to a dyslatc groundwater llow syslem with onshore relharge The NAM model (Chapter 9 demonstliuc~ that these systems under nOrlnal circulTIstanles extend only several kilon imo lhc offshore In the experimenls only I few parameters have been varied The pUr] WilS not to show lhe various modes or salinization as in the experiments of model 2 b mercly to show the possibility 01 preservation of otlshore paleogroundwuter
---
1044 Additiollal remarks
Incorporation of diurnal crfccls stich as tides might affect details of thc predicled salshyinity patterns This would apply in parlleular to the relatively small spatial scale or lhe expeshyriments presenled here However it seems reasonable tu assume that the results prescnted here provide insight into processes for mllch larger spatial scalcs (tens to hundrcds of kiloshymeters) and geological time scales for which Ille magnitude or sea-lcvcl change uverwhelms
thn of diurnal processes Perhaps more important shorlcomings of thc modeling with rcspect tu its applicability
to natural systems are its 2-dimensional character and (he absence of hetcrogcneity in submiddot
surface conditions
h_ +1 m n 03
m 00357
P 10 kgm-1
K 10-13 m (aquifer) I 10-1 Pamiddots
G = 10 ms-2
D 10 m2 middots-1
a 02 m
aT 002 m
Table 101 Congtlant parameter values for [nodd I
N 03 00357
P 10
K(sand) 10-0
I 10-3
G 10 10-9D
Table 102 Constant parameter valuegt for model 2
IExperiment ILilholog l 11 fad fda I(cr a a inlrusil)
Ii) (mOlOIl (111) 1m) (m) n
I sand 01 093 - 10 10-) hor
2 I 02 186 - 10- 10-1 lur
3 05 465 - 0-) 10-1 hor
4 06 558 - 10-1 10-) hor
5 07 651 - 10 to-] vert
6 08 744 10-) 10-1 vert
7 10 930 10- IO-J vert
8 10 930 - ro- 10-1 vert
9 10 930 - 10 to-I vert
10 06 558 - 10 W-l hor
II 07 651 - 10 10-1 hOT
12 08 744 10 10- 1 vert
13 clay 10 93middot10 10-17 10-) 10-) vert
14 10 93103 1O-1~ 10-3 10-) vcrt
15 ~andJclay 01 093 93101 10-11 IO-~ 10-3 hor
16 02 186 19 middot10 1017 10-) 10-1 ven
17
10 930 93middot10 1011 10-3 10-) vcrt
18 10 930 93101 1O-1~ 10-] 10-1 vert
19 10 930 93middot10 10-11 ro- l 10- vert
20
10 930 93 middotIO~ 10~17 10 10-1 vert
Tahle 1lIt Vlriuble parall1ehr allll~ for experimellts or l1lodel 2
N
CLlsra
Po K
(aquifer) I G D
lIt a
Tallie iliA
03 00357
10 kgmiddot m 1O-1J m
IO-J Pamiddots
10 m middots-~
IO-Q m2 s- 1
02 m 0D2 m
(01101111 parametcr alul~ lilr l110del ~
132
bull
Chapter 11
Summary and conclusions
Imrodu(lioll
The objective of Ihe work presemed in Ihis thesis is 10 shed more light on salinizati( and freshening of cous(ol groumJwuler fit geological time scales and on the origin of onsl re and offshore paleogroundwater An essential approach to meet this objective is the reCI
slruclioll of paleogeogmphy wd a~sociUled paleohydrology of coaslal plains The scope ( the study ellcompasses groundWiller in coastal plains lind offshore
In lllany cases lhe salinity distribution in groundwater in coastal plains and offshore aquifers is complex and does not comply with lhe c1ussic concepts on coastal hydrogeolc The main reason for this incongruence is thut these concepts do not account for geologic evenls like regressions lransgressions seiJimenlalion uniJ landscupe changes These even have triggereiJ processes that may nol have reacheiJ steaiJy slate with respect to the salini concentrations of specilic chemical components and even groundw31er heads This applic in partilular to groundwuter salinizalion resulting from the Early Holocene transgressior and the subsequem freshening afler coastal aggradation set in during the Late Holocene Because now systems change rnpidly in the dynamic coaswl am offshore zone bodies () fresh 10 moderately brackish groundwater (Clmiddot lt 7000 mgtl) occur lhat do not belong to present-day now syslems These meteoric groundwaters have been formed by extinct systems and are designated as paleogroundwaLers (Chapter 21)
Part I of Ihis thesis eomprises lhe results of a case sluiJy of the coastal plain around Paramaribo the capital of Suriname in South America where peculiar salinity patterns J
paleogroundwaters were known to exist Many researchers of various earth-scienLific di~
pliliCS as well as conslIlling hydrogeologis(s have inve-igaced Ihe area Existing infonn~
from these sluiJies new hyiJrogeochemical aniJ isotopic iJata and malhematical simulati were used to explain the salinity patterns in the coastal plain aniJ the offshore area
Purt 11 contains the results of gelleral sludies imo the phenumenon of offshore met groundwaler as found in Suriname Observations of olher coasts were reviewed and eXI ments wilh generic molles were cltlrried OUI 10 lIndersland lhe genesis of offshore metec groundwmer
Plrt I Case sludy of lhe Suriname coast
I-frdrology (~rrhl coasal phill (Umple 3)
The loastal s~dimentary zone in Suriname has a width of 70 km near the capital 0
Paramariho (Figure 31) In the Soulh Pliocene sands arc exposed forming a rolling la pc cal1eu the savannah helt because of the saYannah-lype vegelillion The low-lying m coastal plain stretches nonhward of the savannah bell and is underlain by Pleistocene ltSouth allu HoIOllfle days (Nonh) Housillg and agricullural activities are concelltral
the slightly elevaled sand barriers in thc loLslltll rlain The straligraphy eompriscs II wcdg~ of Illainly dastic forlllati()n~ of Lal~ CretilleOUS (0
Holocene age (Figure 35 and 36) Rcgional groundwater flow lltlke~ mainly place in Ihe Teniary scdiments fanning an illtcrmllltlg slllcession of stlnd alld day laycrs The Teniary aquifers contain frcsh to rnoderlltely brackish (meteoric) groundwater (Figures 35 and 38) Pristine meteoric groundwater (Cl-lt 50 mgl) is only found helow he recharge zolles of Ihe savannah belt and the Lelydorp sands in the Pleistocene coaslal plain (Figure 31) -hteorie groundwater is sandwiched between saline groundater in lhe Holocene clays and deep salishyne groundwater in Ihe Cretaceous formiltions and extellds abol1tl)() km illto lhe orfshore
deposits Rainfall (2200 mmlI) llIl1y occur all year ronml hut is most ahlllllhlllt during the short
(Dec-Jan) and long (Apr-Jul) rlliny season (Figure 32) Groundwaler recharge rate in the sandy soils of the savannah belt sue high hut this groundwater is discharged locally bypoundreshyks and does I the aquifers in the coastal plain Diree[ recharge of the Tertiary aquifers is restncted in the coastal plain to t 1e e y orp sands where phrealic groundwater levels are relatively high ~~_he reamptof-tlE plain the large hydraulic resistance and small vertical head gradient in the Quaternary elaY11rohibit recharge In the period before blrge-seale groundshywater pumping (before 958) gr9lndwater in Ihe aql1ifers was almasl stagnant (r-igures 39 and 310) Nowadqys grbundw~er now in completely controlled hy thc extracliolls in and around Paramarlb (Figu(~ 31 O)~ -
Interesting af~ the artesj~l11 f~t1s in the Oligocene aquifer in the prepumping period (Figure 39) The~~he~dsmiddotmiddot~a~~oiiJ~ related to an elevated recharge area hut are attributed to
the rapid Holocerie)edim~_middotntalio Most probably the sediment loading caused an excess hydraulic pressur~hi_~h)la~~orfllilydissipued in this case This effect may he more comshymon than we think [Ho~g oihefeois( with high sedimentalion rates However it may be weakly developedj~the absence or confining layers or ohseured by regional coastal now systems with submrlt-lne discharge
~
Freshelling dllrillg ih~ WiscrJiinoll egr(~itm (ChapTer 4) - shy
Onshore and orJsho~e meteoric groundwater in Suriname must have been formed by extinct flow systemsmiddot-atting underclim~lte landscape and sea level conditions different from today During the Wi~consinan (Weiehs~lian) glacial sea level stood mueh lower with a minimum of 130 m beiow present sea level during the last glacial maximum (LGM) from 25 ka to 15 ka BP(Figur~middotlttl) The Pleistocene surface was eroded and resuhed in a topograshyphy of clay plateaus disseeted by gullielt and rivers Climate during the LGM was colder and dryer The large eoaslal plain of that lime was covered by grass and shruh savnnltlh- ~jmilar
to those in the present savannah Recharge in Ihe Pliocene sand outcrop (prc-ent savannah belt) is estimated at 200 mma (at present SOO mma) Paleohydrologic1I conditions were much different In the coastal plain the incised SaramltlccltImd Slifiname rivers (about 10 m incision near Paramaribo) lowered groundwater hcads in the Pliocene aquifer inducing widespread recharge from the overlying clay plaleaus (Figure 4 1)
The lalter assumption was conflmled by simulating the paleohydrology wilh a groundwashyter model The model shows that the secondary topography of Ihe eroded river vallcys created secondary flow systems superimposed on a regional primary now syslem (Figure t7) Despite the large hydraulic resistanee of the Pleistoeenc elays in the cOllstal plain (gt I x IO~ days) recharge rates reached values of 40 to 60 mma The paleohydrologicalmodel showed Ihltu
groundltIter e~idelllx til1le~ ill Ihe regional primary nIW ySlllll was not sllltidllltltl nush bracki~h or saline water (rolll the lql1ifer~ ngure 461 II appears tht till more dYIIllllil Sllshyondary ~ystell1s wi1l1 Ihe mallcr residence times rdated III the lrosiOIl hpography arc esscntishyal for cxplaining thc pre~cnt-day occurrence of lllChorIC lJOUlltWtICI Im o1T~hore
S(lliialfiol dlrillg rhe -lolInI( fnlllHrc~middotilJl1 (ChOPf 5)
Dl1rin~ Ihe I-Iolocene tnlllsgre~sioll in Surinlllle the se1 lncroached the Pleistocene coashystal plain with a speed or 3 [0 ISO Illa Thl sllbvcnical freshsaline grllllllllwtll intlrfacc nelr the Pleislocenc coastline l o 1ll00ed hl11dward Howecr carlier inestigatiolls shoed lhat the density-drilll Ilnriolltal disrllcelllclll or thl interface cOllltillot keep llP Wilh such a rapidly 111ignuing iosllil1l WhCll ill such a situatioll like in Sllrinallle saline ~rollndwatel
overlie rrcsh groumlater dlI1 ani alinilation lakes place hy convcctive dlnsity curshyrellls lnd diffusioll (Figurc 5i l Ikcause lile former is a very rlpid prl1ces and not in areshymllH Wilh the prescllee of Ille lllshore lllcteoric groundwater hody dilTllsive solute IlanSport is assumed 10 he Ihe main salinilIioll proclss in the SUrini111le coastal plain This hypotheis has hlcn veri tied lly sl1dying chloride COlltllltratiolls and chlorine-isolope ratios (8 11 (1) in groundwater Irom elb and ill pore ater ffOllllhc Quaternary clays sampled atlwo sitls in the coaslal plaintKl1ewarlsall and TOllrlonnl) Thc analyses were compared with simulashylion wilh i1lllodelthat incorporatcd crtical difrusive sol me trallport related hy the Early Holoclne Irallsgreillil and Late Holoccl1l regrcssion and Holoclne edimentalion (Figure )2 and iJl Tran~rcssiotl~ a 6 ka alld 10 ka BP for Koewarasan and TOllrLOllne respectishyvely IS well i1~ sedil1llntation ratc- of 2Y alld 26 1I1111a were cSlltlblished on tllc hasis of radioearhllll dating Simulated verticl profiles ltIre in good agreement with the analyses when all effective chloride difrusion LollTiciellt 71O- 111 l11~s and a fractionalioll factor for the chlorine isotopes of 1J027 Wlre applicd Thegte values arc within the ranges reported in difshyfusion studies and stlppmt lhc hypothesis The regrcssion dales established by the diffusion model are also quite rcnlistic ct I ka BP at Kocwarasan and 05 ka BP at Tourtonlle
Sillltllltions and analyses indicate that dirfusive salinlliltion has penetraled to a maxishymum depth or IDf) to ISO nl (Figure 531 Below 125 m conccnlrlIions of cl110ridc illcrelse gradually with depth (Figure ~5 38 and 541 These salts have riseJlupwmd from the Cretaceous sedimcnts by diffusion and transversal dispersion activHed hy deep regional now systems during regression CIltlY seals hove oil reservoir sands in Slirillallll in the lower pan of the Tertiary ohsln1cted transverse di-per-ion of meteoric groundwater lo The anomalously low salinities abl)c these dly seals and the steep slIinily gradients in the clays (Figure 5A) suggest thaI the salinity profiles may he uscd ltIS proxies for the prlscnee of day seallt which Illay possihly art ltI stratigraphic traps for oil r(servoil~
Hydlogc(chellli((f signals (ChaIJer (j)
The hydrochemistry of groundwater in the coastal plain of Surinamc is mainly dctermshyined hy the degree or diffll~ive lIlixing with salts or advective miing with saline gnlllllLlwamiddot IeI Pristine meteoric groundwlIer in the Tertiary sediments (CI contellt lt 50 mgI) is only found in thc savannah hell and below the Lelydorp sand (Figl1le 15) Becausc of the low reactivity of the Tertiary formations pristine groundwaler hasically has retained a rainwat~r
composition transformed mainly hy evapotranspiration and uptake of earhonmiddotdioxide in the soil zone (Figure 61) Consequently 1110S1 groundwater dso mixed types is acid (pH lt 65)
136
illld uld~r-hlrat~d with r~sp~~t to ~allite Oxidalion of sedimenl organit maier (SOM) hltlS raiscd lhc initial dissolved innrgallit carbon contcnt (TIC)
The Plehaocene days in th~ southern pltlfl or lhe couslal plain which remained oUlside Lhe inllucllle of the Holocene transgression have very dilllle pore walers and exchangeubk cations which are dmninaled hy magnesium (Figure 6H) This is an indication for cation exchangc since sodium was the dominant exchangeahlc cation at the timc of deposition during thc Slillgamonian transgression Simulations of vcrtical solute tmnsport and cation exchangc in these days during 105 ka of the Wisconsinan regrcssion showed thai diffusive solU1C lransport could nol have driven uut III sodium from the exchange ites (Figure 69) Only dowllwilrd mlvcctive transport related to a rechmgc of at Icast 5 mma could have had this ellcrt This supports thc rondusion from paleohydrologiralmodeling (Chapter 4) thaL widcspreld rcrharge must have orrurred during the Wisronsinan despitc the hydraulic resistance uf the days Th~ high ronlent of exrhangeahle magnesiulll is the result of the equilihnHinll bctwccn cxrhl1lgc siles and very dilme infihration watcr with relatively high lllagllcsiulll rontcnt (rainwillcr signature)
Groundwater in the PleislOcelle and Neogene sediments which are inlluenced hy salinshyiwtion (CI gt 50 lllgl) is characterizcd hy a sodium delidl balanced by ckium and magneshysium exccsscs (Figure 610) This is dearly the result of ralion exchange accompanying [he diffusive salillilation Simulations of downward diffusive solute transport (salinizalion) and calion exchlIlgc frum the saline Holocene reproduced thc ohserved cation compositions (Figures 61) amI614l Cation exchange is [iking place mainly in the Pleistocene clays where rllioll exrhangc clparitics are two ordcrs or magnitude higher than in Ihe Teniary formations In Ihe Tertiary formations mixing only occurs between the pre-existing groundshywater (palcogroundwater) and dmvnward diffusing sllts The Paleogene sedimeuts at deplhs greater llwn -125 III rontain grouudwater wilh a sodium cxcess (Figure 611 and 611) which is it sign that the salls in Ihese sediments have not heen lransponed by ditTusion from ahow bUI tbat lhey prohahly originate from the deepcr saline Crctareous sedimcllis This supports Ihe cOllclusion from rhloride and chlmine-isOlope modeling (Chapter 5)
[llto[lie sigllals (Cla[Jlaquo1 7
High tritiulll contcns indirate thlt groundwater in the Pliocene sands of Ihe savannah helt is of rcrent age (after 1950) and cirrlIlucs in syslems with shorl residcnce times Rmliorarhotl dating of grollndwalcr - rorrected for deld carhon dissolution (SOM) and ICIllshy
pond rhangcs in atmospheric I~C lrlivity - shows that groundwiHcr in the coastal plain i~
generally older thiln I ka BP (Figl1le 76) In the Pkistorene eOilslal plain Late Holoccne groundwater (I to 5 ka BP) is found in the upper part of lhe Pliocene formal ion Dceper groundwatcr dates from Early Holocene to Late Wisronsillilll The suhhorizolllal position of the isochrones suggesls tllt pulcorecharge was nol ronlined to the present recharge areas of the savannah belt and he Ldydorp sands The groundwuter ages corresJlond well with the groundwater now systems descrihed in Chapter 3 and 4
Thc OIC valucs Ill dissolved total inorganic carbon (TIC) ill grollndwUlcr in the coastal plain 1~111 in thc range hetween -17 0 -20 Simple mass-balanre caulmiolls based on the hyllrogrorhcmic1l proresses dcscribed ill C1mptCf 5 lead to the conrlnsiOI that ODC of dissolshyved rarh(lll diJxide in inliltfating grllllndwatcr lllUSI have becn relatively high (around -10 7c) during Latc Pleistocene ami Early Holocene (Figure 71) This is allrihut~d to a pakovegetashytion ronsistillg mainly of plants with II C-l- photosYlllh~tir pullay (mostly grasses ilnd sedshy
ges) though C3 plants dominate the present natural vegetation in the coastal plain The cone sion that grasses dominatcd the coaslal plain during the LGM amI Early Holocene is consiStl with the results of palynological studies Relics of these old grass savannahs in the coastal plain have survived in the savannah bclt An inventory of all major plants species in the pres ent savannahs leamelllhat almost all species indeed belong to the C4 group (Annex IV)
Monthly weighted averages of stable iSOlopes (61amp0 and o2H) in rainfall in the nearb stations of Cayenne French Guiana and Belem Brazil are negatively correlated with mQ[ Iy rainfall (Figure 79) This relation is commonly known in the tropics as the amount effect However il seems 10 be all artifact in this case as lhe relation largely disappears h analyses of daily rainfall al Belem (Figure 710) Isotopic variations are associated with Sl
sonally changing weathcr systems and source regions of water vapor Average slable-isOlope composition of Holocene groundwater in the coastal plain 01
Suriname is depleted with respect to the average composition of rainfall at Paramaribo (Figure 711) The depletion is attributed to groundwater recharge in wet months with rel vely low iSOlopic ratios GrOlmdwater of Pleistocene age is even ore ep resp to Holocene groundwater and rainfall (Figure 711) The LGM w (ioC c~er t Loda this region but does not explain lhe isotopic depletion in paleopr ~itaLiol ThQ atial temporal relationship betwcen stable iSOlopes of water and temp Jrur~ c~mo mld( latitutles is absenl in lhe (sub)tropics according [0 many other s ~s~tamp ~r~ ely t rccharge lhcll was restrictcd to the boreal summer monsoon (M ~ JtilgWgtIgt8w~ h ha~ most depletcd wins ~ased on the present egime (Figures 79 anp3~~~ ~s~~ ologtlt studies and global c111natc modehng studIes report that ramfall l~tnSejorewSs ower I
more seasonal at the end of the last glacial 3~-EI~ amp g 8 c-~Io)~
ttl C) Q ~ Q1-J~ cn~cshyCJ ClI gt C ~IParl II Generic investigations ~ ~ I ~
1 Q ~ ~i ClI = - IOjTlOre meteoric RIOIIIUWtef (Gllplel 8) em omiddotcE~ ~ shyThere are worldwide numerous accounls of fresh to m dWate4yLiracki~ ubmarin
0fOundwaler Thcse observaLious may be related to 0) large Jimariti spri~ ohen fOl ~ear coasts with karstk limestones Oi) diffuse submarine aargereg c1as~J coasts (d~ ted by trarers) or (iii) offshore boreholes whcre pore-water analyses or res~ ity loggil
have been carri~d out (Figure 83) Generally the observations do not conclusively answer the queslion whether offs
meteoric groundwatcr belongs to an active Lopography-driven flow syslem with onshor recharge or to paleogroundwater formed by extinct now systemgt Occurrence far offsh (gt 50 km) may be a sign of paleogroundwater whereas meteoric groundwater dose to shore especially observed as submmine discharge is probably related to an active coa
low system The geological conditions or the coast and continental shelf in Suriname are by n
means unique This in combination with the fact that Olher occurrences are found all c the world strongly suggests that offshore meteorir groundwater is a very common phe
menon lhat may well he rule rather than exception
The offshore extensiol of meteoric grOllluhlllter (Chaprer 9)
The question whether offshore meteoric groundwater is part 01 an activc topographyshydriven flow system or paleogroundwater has been addressed with an analytical model The Sharp Interface Model (SIM) determines the length of the offshore extension of fresh groundwaler in a semimiddotconfined aquifer with onshore recharge and submarine groundwater seepage The New Approximate Model (NAM) u-es the SIM model but takes into account the downward diffusive salt transport through the aquitard which counteracts the upward seepage The approximate offshore extension of fresh water is according to the NAM model equal to the distance offshore wherc the diffusive transition layer becomes large enough to creale convective density eurrents in the aquifer (Figure 91) The coaswl now domain may extend somewhat beyond this poi Ill but groundwater is brackish The SIM model approximates the outer limit of this zonc
Sensitivity analyses with the NAM model demonstrated that fresh groumwaler geneshyrally does not extend more than 5 km offshore except whcn cxtreme values for model parameters are adopted Sensitivity analyses with the SIM model indicated thH the offshoshyre extension of the brackish groundwater tongue will not exceed 50 km Applying the chashyracteristics of the coasts of Suriname and New Jersey to these models learns that meteoric groundwater found offshore must be paleogroundwaler
Flow and sat tronsport ill submarine groul1dul(rer (Chapter 10)
In coastal and offshore sediments inverse groundwatcr densily stratifications may arise where (i) there is offshore outnow of fresh groundwater in steady state coaslill now systems or (ii) where fresh sediments become inundated by the sea during a transgression which creates an unsteady-state situation The dynamics of these situations have hcen stushydied in three numerical models simulltlting variable density Ilow ltmd solute transport by advection dispersion and diffusion
Modell served to investigate the offshore salinity pallerns for the situation of steadyshystate offshore outflow On the basis of model experiments three zones can be distinguished (Figure 103)
a proximal stable zone of fresh groundwater where high upward seepage ratcs prevent downward salinization by diffusion and convective density currents an intermediate zone with moderately brackish to brackish groundwater where convecshytive density currents arise continuously although groundwater is brackish there is still a net seaward topography-driven flow of groundwater in the landward part of the intershymediate zone fresh groundwater can s(ill be found at the bottom of he aquifer a distal stable zone with brackish water where density differences are too small to trigshyger convective density currents here topography driven now and upward seepage have become very small
The length of the proximal stable zone corresponds with the length of the fresh groundwater tongue calculated by the New Approximale Model in Chapler 8
The changing salinity patterns following a marine transgression have been investigated with two different models Experiments with Model 2 simulating the effects of a sea encroshyaching on a slightly inclined continental shelf showed four differenl modcs of salinization
Modc I middotmiddotHorizontal scawaler Intrusion in thc 1)fIn of the slow landward migration ulthe freshsaline transition zone or middotmiddotinterfacemiddotmiddot (Figure 105) Rclcrring to the reccnt IlolocCllC transgrcssionthis intrusion mode was not (he dominant process in most oltl1e
offshorc aquifcrs The transgr~ssioll speeds during the Early Holocene for many contishynentall11argins wcre far higher (gt 100 Illa) lhan the critical transgr~ssi(ln speed at which the interfacc could kcep pace Mode 2 Vertical scawater illtll1~ion by convcctivc dcnsity currents Wigure 106) This mode occurs for ~llp]Icriticaltransgression ratcs and relativcly high-permcability SllhshySlrlle sediments (sandsilL) A widc high-salinity transition zonc develops This rapid intrusion modc can keep Lip een with rapidly advilncing shorelill~s
Mode 3 Vertical scawalcr Intrusion by diffusion (Figure 107) This Illode occurs for supra-criticaltransgressiun rates and low-pcrmeability substrate scdiments (siltclay) up to greal depth An cxtcnsive seaward dipping fresh-water wedge develops hclow a thick almost venically layered transition ZOIlC Salinization is mainly controlled by downshyward diffusion This intrusion mode is restricted to shelf sedimcnts with vcry thick clayshyey sediments below the sca noot Mode 4 Vertical seawater intrusion by convcctivc density currcnts of low-salinity rinshygcrs (Figure 108) This mode occurs for suprtHriticaltransgrcssion rales and a layer of low-permeability sea-floor sedimenls (sillclay) overlying a relatively high-pcrmeability aquifer A wide low-salinity transition zone develops in the aquifcr resulting from COIlshy
vcctive density currents whilc a relatively sharp diffusive boundary layer is present in thc ovcrlying low-permelttbilily lilyer
Thc second intrusion mode explains the presence of high-salinity groundwater in thc exposed sandy aquifers in the wcstcrn pan of the Netherlands which was inundated during lhe Early Holocene Mode- 3 and 4 cxplain thc tcmporary preservation of offshore meteoric groundwater Although the dimensions of the modcl arc small lhe same process explains the presence of vast hodies of mcteoric groundwater far offshore along the coast of Surinamc thc Nctherlands Indoncsia (Jaa Sca) and the easlern USA (Chaplcr H)
Experiments with Model 3 simulat~d the lransgression of the sca over a hilly tcrrain with a substratc of all aquifer covered by a clay layer This lerrain reprcsents lhc dissectcd landscape of thc cxposcd continental shelf off Surinamc during thc lasl glacial (Chaptcr 0 During lhe transgression the valleys become submersed alld form cstuarics Salinization only starts when sea level in a alley has riscn 10 certain level and fresh groundwater secpagc in he alley has diminished (Figurcs 109 and 1010) As soon as the entire landscape becomes sllhmcrged the now ystem reverses The rcmaining fresh and moderately hrackish glOundshywater is slowly expelled via seepage from (he former hills or platell1s either as L1ilTuse scshypagc or seepage through a pcrmcable mne (101)
The cxpcriments wilh Model 2 and 3 show thatmetcoric sublllilrine groundwatcr call be preserved as palcogroundwmer for lhousands of years after the suhmcrsion or thc landsshycapc The waning of the paleogroundwaters is an ongoing process Some nhservatiOlls of groundwater dischargc far offshore may he relatcd to this process
C(mdlldillg III(k~
The overallmcthodology of this study is a typical example of an associltive approach where data and methodologics from varlous earth sciences needed to he combined in order
140 141
Ul umlerstaml mort abmn c()astal nd offshore groundwattr This associ at ve approlch is
essential to the science of hydrology as the characteristics of waler are continuously chanshy
ging while it circulatcs through - and inleracls with - all compartlllCllIs of the atmosphere
lithosphere and biosphere
During the hlst years this stUlJy has triggered new idtltls ror research in related subshy
jelts In this hcsis variahle density l10w and transport modelling focus on salinization proshy
cesses HowcVlr much still needs 10 be learned frmn modelling of freshening processes Oil
geologicaltime scales Also s~linization mechanisms in more complex layered sedimentary
ellvimnmeills require fllllher rcsearch hOlh hy lidd studies using chemical anJ isotopic Irashylers and lllodelling experimcllts
As for the exploration nl nffshore meteoric groundwater ilpplicalion of nlpiJ geophysishycal surveying tecllniques blsed on Tnll1sient Donlain Eltltromagnelics ltTDEM) Ind
Shallow High Resolutioll Seismics (SHRS) is under investigation
More insight into the suhmarine disharge of offshore meteoric grOlmJwlttr lllay hewshy
me relevant in unJerstanding proctsscs relateJ 10 gas hyJralcs unJerneath the sea 110m
marine ecology and thermo-hal inc cirulation in Iht seas
One of the reasons for choming the coastal pllin of Suriname as a case slUdy was the
occurrencc of meteoric grounJwater extenJing 90 kill inlo Ihe offshore sedilllerus The work
in this thesis shows thaI this phenomenon can no longer he consiJered ltIll otldity but may he
lbe rule rather rule tlwn eXleption on a glohal slllle This offshore Illtt~oril groundwater
Illay hecolllc iI valuable walt~rmiddotsupply source for dcnsely populated coaslal areas where
waler reS(lunes arc heing overexploited or polluteJ Treatment of lllcteoric groundwater may
involve Jesalination hut is still 111l1ch cheaper than desalination or seawater This idel is curshy
rently heing markcted at the 1110l11cnt by a consortiull1 of commercial tOmpanies anti (he
Vrije Universitdt One wuld mguc th( this resource is nOll-renewable and tlut its exploilashy
lion is ul1-lswinahle But in III opinion this principle is not valid here as these bodies of
llffshon palcogrollntlwater are so large that they could sustain coastul POPlllltioJls for hundshy
reJs to thollsanJs of ye lrS In adJition Ihese Illttemic waters wOllld graJuully disappear anyway hy llatlful salinization processes
References
Airey P L Calf G E Campbell B L Hartley P E Roman D and Habermehl M Abull 1979 AspelLS of lhe isolOpe hydrology of lhe Great Allesian Basin Australia In ISOIOpe
Hydrology 1978 IAEAlUNESCD Vienna 205middot219 Appelo C A J and Postma D 1993 Geochemislry groulldwater and pollution Buikema
ROllerdam 536 pp Appelo C A J 1994 Calion und proton exthangc pH variatiolls and carbonate reaclions in a frc
ning aquifer Wmer Resources Research 30 2793-2805
~rad A 1983 A summary of the arlesian coastal ~asin of ~uyana Journul ~f Hy~~olo~y 63 299shyegt Augu~inlls P G E E 1978 The changing shoreline of Sunnum PhD IhcslS RIJksuOlversllelt
Ulreeht 232 pp eYuguslinus P G E F Hazelhorr L and Kroon A 1989 The chenier eO~1 of Suriname mod~n
and geological developmcnl In P G E F Augustinus (Ed) Chemers and cheOicr plalm
Marine Geology 90 269-281 Badon Ghijben W 1888 Nola in verband met de voorgenomcil putboring nabij Amsterdam
Tijdsehrifl Koninklijk [nslituUl voor Ingenieurs Verh 888-18898-22
Bcar J and Dagan G 19M Some exaCI solulions or inlerfaee problems by means of the hydro
melhod Journal of Geophysical Research 69 1563-1572 Beekman HE 1991 lOll ehromalOgraphy of rresh- and seawU(er intrusion mullieomponenl disp
ve anrJ diffultive transpor in groundwater PhD thesis Vrije Univenliteil Amsterdam
pp Berger AL CI al (Eds) Milankovitch and Climate Parl 1269middot305 Remer R A 1980 Early Diagemsis A Theorclical Approach Princeton University Press 241
Belhke C M Harrison W Jbull UpSOIl C and Allaner S P 1988 Supercomputer analysis of SCI
menlary basins SeienLC 239 261-267 Bierman P R Albrecht A BOlhner M H Brown E T Bullen T D Gray L B and Turpin
199~l Erosion weulhenng and sedimelltatioll In C Kendall and J McDonnell (Eds)
Isotope Iracers in Gltclmlt1l1 hydrology Elsevier Amsterdam 647-678 AoslIla W Kroonenberg S B Maas K and De Roever E W E 1983 Igneous and metam01
e complexes 01 the Guiana Shield in Suriname Geoogie en Mijnbouw 62 241-254
e Brinkman R al~ Pons L J 968 A pedol1mrpho~ogieal da-sil~eali~n ~nd map of I~~ Holoee l1Ie11S III the coaslal plalll oj lhc three GUlanas Netherlands SOli Survey InsIUlc
Wagcllingen The NeLherlllllUS Soil Survey Papers No4 40 pp Brinkmanl1 R Eichler R Ehhal D anrJ Miinnich K D 1963 Uber den [)cueriumgehalt vc
Niedcrschlal- und Grundwasser Nalurwissenschanen 50 611-612 BrooK GA Folkoff~ME lIld Rox ED 1983 A world model of soil carbon dioxide Eallh S
Procegtses 8 79-8M Brouwer L C 1996 Nlltriell f)c1ing in prisline anrJ logged rain rOreSl A study in Guyana P~
G lhegtb UnivcrsilY or ULfCdu 2-l pp Bruijl1cel LA 1990 Hydrology Ilf mui-I lropical foresls IIlld clrcclS of lonversion a Slate 01
1cu~c review UNESCDIIAHS Nelhcrlanu- lHP CUlllmiuec 224 pp
Burke WH Denison RE Hetherington LA KIJpl1lck RB Nelson Nr alld Olin JB I()X~ Vnriaion or scawJtcr -ISrfuSr lhroughmll Phancrnolc lime Cieology 10 i 16-51 tJ
Cable J E Bugna G C RUnlen W C ltIud ChlI1lon J P IlJl)6a Applkation of ~~Rll and CH J for
assessment of grmllKlwltcr dilcl1lt1r~c tllhc cOltls[d ocean IjrllllOlogy and OcclI1lgrlt1phy~
1347-1353 Cable J E Burnctl W C Chanlol1 J P lind Weatherly G L 1996h E-til1laLing grnlllldwulcrdisshy
charge into northeastern Gulf of Mexico using radon-222 filnh and Planetary Science
Letters 144591-604 Cable J Ebull Burnett W C ilnrJ Chanton J P 1997 Magnitude and varimions of groundwater oCCP
ge along a Florida marine shoreline Bioctlchcmislry JR IR9-205
Carslaw HS and Jaeger JC 1959 Cunduttion of heat in solids Oxfonl Ul11vcrslty Press London
m~ T E 1984 The smble iSOlope composition of modern soil CiJrbOnlle ami lis relutlOnhlp to CerImiddotmg
climate Earth and Planetary Science Leiters 71 229-140
Cerling T E Solomon D K Quade J and Bowillan J R 1991 Oilibe isotopic composltloll of
carbon in soil carbon dmiddotloxide Geoehimica et CosmochimiciJ ACla 55 3403middot3405
C M 1993 Nature of environmental changes In Somb America at Ihe lasl glacilll maxi-o CIappenon mum Palaeogeography Palaeoclimatology Palaeoecology 101 1R9-20R
Clark 1 D and Fritz P 1997 Environmental isotopes in hydrogeology Lewis Puhlishers New York
m~ Clark J F Stute M Schlmser P und Drenkard S 1997 A trucer study of the Florllhn aquiler In
southeastern Georgia implications for groundwater now and paleoclimale Water Resources
Research 33281-289 Clark J E Davisson M L Hudson G B and Macfarlane PI 1998 Noble gaes stable isotope
and radiocarbon as tracers of now in the Dakotu aquifer Colorado and Kansas Journal of
Hydrology 211 151-167 e Cohen A and Van der Eyk J 1953 Klassillcatie ell ontstaan an stvallnen in Suriname GeologiC en
Mijnbouw 15202-214 Cole D R and Monger H c 1994 InOuencc of atmospheric CO~ on the decline of C4 rlants dUring
the last deglaciation Nature 36R 533-536 Cook P and Herczeg AL (Eds) 2000 Environmenml Tracers in Subsurface Hydrology Kluwer
Academic Publishers 529 pp Cooper H H bull 1964 A hypothesis concerning Ihe dynOlmic balmce of freroh aml salt water in iJ coastal
aquifer In Sea water in coastal aquifers US Geological Survey WOller Surply Parer 1613shy
C I-II Cronin T M 1983 Rapid sea level and eli male change evidence from continental and island marshy
gins Quaternary Science Reviews I 177-214 Crutzen P J and Andreae M 0 199U Biomass Burning in lhe Trorics Impact on Atnmsphenc
Chemistry and Biogeochemical Cyeres Science 2501669-1678
Custodio E 1987 Groundwater problems in eoastlll areas Studies in hydrology Nr 45 IHP-UNESshy
Co 645 pp DallwilZ M J 1980 A general system Cor coding taxonomic descrirtiolls Taxon 29 41-46
Dallwitz M J Paine T A and Zurcher E J 1993 and onwards Users Guide to the DELTA
System a General System for Processing Taxonomic Descrirtions (4th cd) CSIRO DIVISIon
of Entomology Canberra httpbiodiversityunoedudeltaJ
Dansgaard W 1964 Stable isotores in precipitation Tellus 16436-468
DAudretsch F C bull 1953 Recentc Waterboringen in Suriname Mededeltng Geologlschc
144
1Ilijllh()llkllll(LgC Diln t Silrinallll No 10 I-I~
Ihjlj(lrJ 1 and Tnllnbtlrc S_ E ItJ)5 Ga~ dirrusIilY and pmdllclion (lr(o~ in dlell stlih of lhl
cl~llm Amlon Tetlll~ ~7B 1middot16
Dl~altlnilmiddotr~ D E Cherry J A alld frill P 19-11 Origill age and 1l1llemCIll Ofr1lrl watcrs ill argilshy
Iannll QUHCn1ary dep(~ih al four ~ite~ III S(llllhc~lern Ontario JotlnJal lr lIydrolngy 50
2~ 1middot27
D01llcnico PA and Rohbins (jA 19-5 The dis[lkln1111111 o(connate ater~ from aqllikrs (ilol
SOl Irner Bull 9( 32~-3 ~5
Dc J(l~~elill dc Jong G and Van [)lIijlJ C1 191laquo1 Transcloc disrersiun from an originally sharp
fresh-salt irHcrfacc GlllSIl h~ sh(r low Journ1I of I-Iyurtllo~y R~ 55-79
Dc Vleller D R ]Cmiddot1 G 1 J md Krlllllknhlrg S J1 IlJl)R Researlh intn the IrecalllbriUIll of
Suriname In~ T E Jilg D R De Vktltr L Krollk_ J 1 S ZOllllevcld and 1 VlIllooll J
(Ed~) The hi~tnry or larth sdellc ill Sllrinulle Royal Nethcrlallds Academy If Arts lnd
Sciences Netherllllds lnslitllll Ilf Aprlied GClseielllC middotrNO 15-6~
Dc Vric~ J1 197~ Groundwater nnw ~ystems and strealll nlts in IIle NClhcr[llIds PhD lhcis Vrije
Ulliersilcit Amslerdam
Diodato Drl 1997 Soflwltlre SP(lllighl GroUlluwatcr 35 912-92l
Dixon V R 197 J Some Jspecl~ of lhc cmlstal artesian basin ncar Paralllaribn Mctlcdding
Geologi~che Mljnbouwkundige Diell~t Suriname 11 167-175
Dutton A R I (95 Grmllldwller iSOlOpic evidence for raleorechlrge in U S Hi~h Phlins l(luifcrs
QlIalcmary Research ~J 211-211
ElIcmm J H 197~ Groundwaler hydraulics of etensive aquifer~ I nlcmJti(mal Illslilute for Land
RcelulHJlion JIld DrJinage Bulletin Vageningen 216 rr
Edmullds WM Uld Wlloll NRG 19X1 The Lincolnshire limestone - HydrogeolhcmiLal cmlUliOll
l er a len-year rerjlld Journal of Hydrology 61 201middot211
Eggenkamr HGM 1994 The geochemistry of chlorine isotopes PhD thesis Geologica
Ultrilicctina Uniersitcit vall Utrecht Mededclingen viln de Faculteit Aardwetell~lllprcn
No 116 150 rr
Eggenbmp H G M Middelburg J J and Kreulen R 199~ Preferential diffusion of middotl~C] relalivc
to lICl in sediments of Kau l3Jy Halmaher Illdonesia Chelllilal Geology 1161 17-125
Ehleringer J R Cerling T E ilnd Hclliker R R 19(7 C4 rhowsYlllhesis l1l1lOsrheric CO and
dimate Oecologiltl 112 1R5-Q9
EislllL D and vall der Marc H W 1971 Marine muds llong Ihe GUYl1l COISI lIld their origin from
the Al11ltlWll ha~in COllr MinerlIngy and Pelfl]ngy1 I 21-04
Elder JW 1968 The unstable ltcrmll interrace Journal of Fluid Mechll1ks n 6lt)-96
Engclen GB lI1d Kloosterman F H 1996 Hydrological syslell1s lllaly~is Kluwer [)onlrecllt 151
rpmiddot Essaid H J 19R6 f cOlnrarisoll of the lnlpled fresh water-salt water now llllllle Ghijllen-Hcriherg
sharp inlerface approaches to modelillg of transient behavior ill co~~I1 aquifcr systems
Journal of Hydrology R6 164-193
Essaid H I 1990 A multilayered sharp inlerfl(e lllodel of coupled fre-hwllter ami sltwalcr now in
coast11 sySlems model devclopment and lrrlication Willer Resources Researeh 2Cl ImiddotU 1shy
1454
Fairhanks R G 19R9 A 170()(l-year glaciHU~latk sea level record inlluence of glaciallllelling
rates on the Younger Dryls eltf1l and deer-ocean circulltion Nature 3-12 637-6~2
Faure G 19R6 Stahle ISJIOpe Geology (211d cd) Srrillger Vertag Berlin 5R9 rp
Forti M C alld Neal C 1992 Hydrochemical cye1c~ ill trorical ruillf(lresls an overview wilh
clIlphmiis on CllIlml Alllcritt Journal of Hydrology 13-1 lO)-IIS
Gs Fmppil M ilild Pujus Mbull IWooL Laic Quaternary evolution of the French Guiana cnillinciltal shdf Evidence from 35 IH data Marine Gelllngy 121 231-2-15
Gdrnacrt W ItJ6lJ Pnlimilllly rcpDlt ntl hydrOlhcmical investigations in the Westen] Netherlands Geologic ell MijuhollW -H 2-19-25-1
Gyh M A and SMller B I tJHlJ GroundwOllcr analysis of Cllvirnlll1lCntal carhon and Olher isot()pe~
froPl 11Il Jakma basin ilquifer Indonesia Rmlimroorl J I 919925
Gihhs IJ l1J67 Tile GClchcmislry (If tllc AI11ltltlll rilr sylclll pn I The faC(lfS thill CUrlIn)] the
Ialinity tIIl the cUlllpnsilion ltllld the Cllllcclltrltnillll or lilc sllspended solids Geo Soc Am
Bull 7H 1203-1232
(Jilskt J M J 991 Dt nurspnlllg van hel hmkke gmndwaler inllel IJsselmeergebied diffusie disshy
ptri of dihtheidsslmlnillg H~O 2-1 I HH-19J
(Jlmr RE 1959 The l1luerll of rrcshWltllcr now in ltl coaslul lquifcr Joumal or (Jllphyical
Rescarch (H middotLW--+75
Grathwl1hl P 199H Diffusioll in nalJral pt1nlus media conlaminalll transporl sorptiDnJdesorplitl1l anu
dissolulion killetics Kluwlr Dmurldu 22-+ pp
GrimOlldi c 19HH Origine de la cOlllptlsitinll chimillue des eaux suplrlicielles en miliLutmpical
humide eXllIplt ue UCliX pelils bassins versants sous forel ell Guyane FrancaisI Sci GeoL
Bull -+ 12-+7-2(12
amp Gmen L 199M Ilyumgeulogical invesligalions in SUliname III T E Wong D R De Vlellcr L Krook J I S Zonllcvcld anu A J Vl1l LOOll tEdsl Thc histmy or eilnh sciences in
Surillill1l Roy1 Nelhcrlanus AlltldeIllY of Ans anu ScicJllcs Nelhcrlands Inslitme of
Allplild GllIsliCllcc TNO 129-17-+
jGrocn1 VLmiddotsla 1 llIJ Mecslers AGCA bull 2000a SaliniJalioll prolessc in palcowalcrs in coaslal
sCllilllLnls nf Suriname evidclUc from dmiddotlJe lIlalyi~ anu uiffusillll llloueling Journill of
Ilydrtllngy 23-11-20
JGroen L Pma V E A Knlli 1-1 and Hcmker CJ 2000h Palaeohydrogeolngy of Ihc ~euil1llnlary plainllf Suriname In Pn11lcdings Trarlmiddot21100 Conferencc 011 Tracer and MmJclling in
Ilydmgelllogy Liege IklgiuJIl IAHS Puhlilmiddotillion No 6 -+ 17- -+2-t
bull Guglielmi Y and Prieur L 1997 Locating and cstimating suhmarine freshwater uj~chMgL frnm an
illler~titiallllnfined lOOlSIOiI alluifer hy llllasurcments at sea eIampk fWlll lhc 111er Val alshy
ley Irancc JOlll1wl of Hyurohlgy ll)[) I [I-I
1111011 tl J 19HI GClllllgic illlli pLlnleulIllnOilysls tlfille Suriname colgttal regitlll Slaalsnlic
t-1aahlhappij SUIinlI11e N V PmltLlllariho Suriname
llarrillgltill P K 19H5 Illllilatitlll til podJllltlrh hy ptlre-waler escapc Mlrinc Lcllers 5 193-197
IIl1Tisllll Y J l1ld SUlllllIL I L 199 I Paleohydrology of IhL Gulf llr Mlxilll Basin Alllerica
Jllurnal l1f SCicllll 9 I I(l9-176
lIartmanI 19h1) The 11ly I1linerab ffllllllhc boring AlIialle-2H Surinam Geologic en Mijnhouw
-+H 121-1-I
lInlly Jr Pllag CW Valenline Pc Miller)ltE Sdltllll DM Mlllhcim fT Kohoul EA
Bnlhnl( MH and Smgrcy DA 1979 US Gcolngical Survey Core urilling un lhe
Allanlit shelf Sciellcc 206 515-527
1kOl1l11 T II E Talma A Sbull1lld Vogcl J C 19H6 Dissolved gls pleohlIpCmlmcs and dl~O variashy
liun derivld Irum groundwaler IIcar Uilllhage South Africa Quaternary Re~erch 5 79shy
SH
1kllry II IL 1-1- Elkc or di persioll nil salt cntroalhme1l1 In waslal aqullcs In Sea waleI in
colslal aquilers US Geolllgical SurLY Water-Supply Paper 16tl-C 70-H-+
Herlberg B 190 I Die Waserverzorgung einiger Noordseebader Zcitschrirt Gasbcleuchlung und
Wasserverzorgung 44 815-819 und 842middot844
Hcyligers PC 1963 Vegetalion and soil of u white-sand savanne in Suriname The Vegelution of
Suriname Ill PhD Ihesis Vcrhandelingcn Koninldijke Nederlandse Akademie van
Welenschappen Serie 1 deel 54 148 pp
eI 110 Len Fm A G bull 1986 Waler innuence on h~avy crude oil production A qualilalive assessment t 0863) Stamsolie Maalslhuppij SurinamI NV
Hua Aihing 19 The impact of hislorilal sea level changes to groundwltJtcr in Shungbai China
Geological Review 44 220-224 (Chinese)
Hubben M K 19-+0 The theory of ground-waler mOlion Joumul of Geology 48 Part I 785-94
Hutchinson C B 1990 Analysis of grouudwater now in the A-sand aquifer at Paramaribo Surina
Soulh-America US Geological Survey Waler-Resourles Investigation Report 90-4036
pp jiuyacorn PS Anderson PE Merlmiddoter 1w and While Jr HO 1987 Saltwater intrusion in aquif
Y developmenl and testing of a three-dimen ional linile elemenl model WaleI Resources
Researdl 23 293-312
IAEA 1 I Slable isotope hydrology deuterium and oxygell-IS in the waleI cycle Technical repl
scrics no 210 Internmional Alolllk Energy Agency Vienna 337 pp
IAEA 19H3 Paleoclimates anu paleowalcrs a collection of ellvironmenwl iSOlOpe studies Panel I
ceedings series International Alomilmiddot Energy Agency Vienna 207 pp
Imbric Jbull Hays J D bull Martinson DG Melnlyre Abull Mixbull AC Morley JJ Pisias NG Prell
WL and Shadle ton NJ_ J 9K-I The orhilallheory of Plcis(()cene climate support for a
rcvised chronology of the marine oxygen isotope recoru In
) IWACO 19B Winplaalsonderloek en uitbreiding van het drinkwalervoorLieningsysleem van
Panunaribo Surinaunsche Wmerlciding Maatschappij ParalHltlribo
~ IWACO 19l57 Projcl hydrauliquc villagcoise Volta-Noire Programme des forages Rapport final
lravaux de foragcs Ministere de leau Oflice national des puits el foruges Burkina Faso
ljIWACOER Harris 1991 Expansion of the water supply system of Ihe city of Parumaribo and il
mClmpolilan area final report Surinllmsche Wmerleiding Maatslhappij Paramaribo
vansma R 199-+ Ecology or somc Nonhern Suriname savannas Koehz Koenigstein 199 pp
Jollmson D w 1939b Origin or submarine cUl1yons Juurnal of Geomorphology II 213-236
Johnson D W I939a Origin or suhmarine canyons Journal of Geomorphology II 133-158
JOhllStllL T M and Depaolo D 1 1996 Reactiun-lranspon models for radiocarbon in groundwal
the dfect~ of longitudinal dillpersion and lhe usc of Sr-isotope ratios 10 correct for walel
interallion Water Resources Researlh 32 2103-2212
Jlltllcl J KOSier R D Suoao R 1 and Russell G 1 994 Siuble water isolope behavior dUJ
Ihe lallt gladul maximum A general drlulalion model analysis Journal of Geophysical
Research 99(DI2) 25791middot25801
Jouzel J Frodllich K mu SchouerlJ U 1997 Deutcrium and oxygell-I 8 in present day preci~
lion uala and 1110Uelling Hyurological Sciences Journal 42 747-763
Kendall C anu Md)OI111el1 1 J (EJ~) 199H Isotope tracers in catdllllenl hyurology Elsevier
AnhlerdmJl lS39 pp
Kimmelman A A Da Cunha Reholllall S A and Freilas Santiago M Mbull 1989 I-lC analyses a groundwaler rrnm Ihe Bolulalu aquilcr system in Brazil In A Long R S Kra and D
(Eus) Pruleedings or Ihc 13th internalional rauiocarhon conferenle Radiocarbon 3 9
935
Kohout E A 196-+ The now or fresh water and slll waler in thc Biscayne aquifer of lhe Miami
FloriLla In Sei waler in llilslill lquikrs US GCIllngieal Survcy Washingliln I~-J2
KohoUI F A 1966 Submarinc springs lncglectcd phclo11cnon of cnltl~lal hydrology In
ProceeLlings HyLlrology mtl Walcr Rcstlurces Dcvclop111tnt Symposium Ankara 391-413
KohoUI F A Hath~way J C Folger D w BCJthncr M H Walkcr E H Dclancy D_ F r-rimptcr
M H WeeLl E GA and Rhodehamel E C 1977 r-rcsh groundwalcr stored in aquifcrs
unLler the continentrll shelf implicatiolls fmm a deep lest Nltllllucket Islmd MasuhuclI_
Water Resources Bulletin 13 73-3H6
Kohout F A Meisler H Meyer F W Johnslon R H Leve G V and Wait R L IlJH~
HyLlrogeology of the Atlantic conlineltal margin In R E Sheridan anLl J A Gm (ELIl
The Atlantic continental margin Geoh)gical Society of America 463-4S0
KoldilZ D Rntke R Diersch H-J G and Zielke W 19lJS Coupled groundwatcr now and tranltshy
port I Veril1crllion of variahle den~ilY now and trmsport models Advances in Waler
Resources 2 I 27-46
Kooi H 1999 Competition between lopography- and compacllon-drivcn Ilow in a conlillcd Iquifcr
some anrllytical results HyLlrogeology Journal 7 245-250
KooL H Groen J and Leijnse A 2000 Model or seaWlter intrusion timing tmmgressions Waler
Resources Resellrch 36 3581-3589
Kooi H and Groen J 2001 Offshore conlinualion of coastal groundwaler systems predictions using
sharp interface opproximotion~nd voriable-dcn~il) now modelling JOllfnul of Hydrology
246 19-35
~Krook L 1979 Sediment petrographical -tudies in northern Suriname PhD thesis Vrije Uniycrsiteit
Amsterdam Also published in Krook L 1984 Medcde1ing Geologische en
Mijnbouwkundige Dienst Suriname No 28 143 pp
yKrook L 1994 De geologische en geomorfologische ontwikkeling von Noord Suriname In LJ Van
der Steen (Ed) Reeenle geologische en mijnhouwkundige ontwikkelingen in Surinlme
Publication Found Sci Res Corrihean Rcgion Amsterdam 21-40
V Kutzboch J Gallimore R Harrison S Behling P Selin R and LannI F IlJ98 Clilllate ltJnd
biome simulations for the pasl21000 ycars Qualcrnary Science Reviews 17471-506
ifLaeyendeckerRoosenburg DM 1966 A palynological investigation of some archaeologically inlershy
esting sections in northwest Surinam Leidse Geologische Mededelingell 3H 31-16
Lee DR 1977 A device for measuring seepage nux in lakes and estuarie Limnology and
Oeeonogrophy 22 155-163
Leijnsc A 1992 Three-dimensional modeling of coupled now and transport in porous media PhD
thesis NOIre Dame University Indiona 251 pp
Leijnse A and Hossanisadeh SM 19890 Verification of the METROPOL code for density dependshy
ent flow in porow media Hydrocoin project level 2 case 2 RIVM Report 72852ROO2
Bilthoven The Netherlands
Leijnse A ond Hassanisodeh SM 198 Verincolion of the METROPOL codc for density dependshy
em flow in porous media Hydrocoin projcct level I cose 5 and levcl J case 4 RIVM Report
728528004 Bilthoven
Leijnse A ond Oostrom M 1994 The onset of instabilities in the numerical simlilation of densitymiddot
driven flow in porous medio In A Peters et a1(Eds) Computational methods in Water resources X 1011-1018
Lerman A 1979 Geochemical processes Wiley New York 4HO pro Levelt TWM and Quakemaat 1 1968 Some results of profile drilling along the railroad betwecn
Onverwacht and Zanderij Surinam Geologic ell Mijnbouw 47 140-345
L1 YH and Gregory S bull 1974 Diffusion of ions in seltlwltuer ltlnd in deep-sea sediments Geochimica
el C(lllHlChimica Cla 1X 7(1middot 71-1
JLilldemlIl 1 C and r-middotlolllellJm S P IY59 TIll c~ltalilll Ill SurinamL In LA ilL IlulslLr and J
La1lioU~ (Edsl A series (If paper (lil plant C01Jllllllnilics ltllllllheir tJli~in Ilislrihnilll and
relation to Llil11atc and hahitat Voluille I Part ~ Van Eltll-Ilflillds s LlIlds BIlhchccr Surinamc -15 pr
Linley B_ K 1996 (h~gcn isoppe recnrd III sea lecl and clilllale arilli(lll~ il1lhe SUItI Sla 1l1LI
the pas 15011(J() years Nl1ure 3XO 23-1-237
LtleA J HenJlmiddotg L Leltlney E 1 Stadler M E Dightoll J C and ArillSl1Ong D It)l)-I
Groulldwater Ieidcncc tillle allli palleohydmlllgy in the Olly Bl~ill Smllh AUSlri1ia ~H
I~O and I~C dill Jltlurnll or Hydmlog) 151 157-IX7
LusnmiddotYll~ki N S and SwauensJi W V I96() Slll water clllloaChillLnl in Stll1thlfI1 Na~sall alltl Oltllllshy
Ihellern Quecll~ cownie Long Island New )Ilrk US GLlIlo~icl1 SliLY Walcl Sl1pply Paper 1613-F
Maathuis 11 Yllilg R N Idi S and Prawiradi-astrl S It)l)(l DlclIlPlllLlll or ~llllll1dallr 111lt111
agcl1lClit -tralegic- ill the coaslal rcgion of Jakarta Intlonc~ia r-inal report No SRC Pub Rshy
1250-I-E-Y6) IIlILflllt1lioll11 Devclopmenl RCelrch Centrc (I DRC) Elliml1lllClltll1ld
Natural Re-ollrccs DiI~i(111 OUawa ClIl1dl (ll pp
Manheim E 1 alld Horn M K 196X CIllllp(Jsititll1 Ill decper sllhsurfacc Wllcrs alltlllg the Allanlic
cOlHinelHal marin SOllhca-lcrn (COlllgy 9 ~ 15-~36
Manheim F T and Panl C K _ 19X I Plllltrns of glOlllldwltller gtllillity changcs in a dccp c(Jl1tincntalshy
(leemil Inll1-eel 011 till 111hcI~lerl1 Allantic C(la~l or lhc US Jllurilalol Ilydmlo) 5-1 95-10
Manhcim r- T IlJ67 Eidel1lc lilT uhlllalil1e dischltlrge or water 011 thc A(lallliL ContincllUl1 slope of
Ihc ~ollthcrn Uniled Slates alld -llggc-tioIlS fur furthcr rescareh Transacliolls or thc New
York 1ladenw of Scieme Serics II 29 RJ9-H54
W Mlrkgraf v IlJi9 PalletKlimalcs in CClllral and South America sincc IX()OO)r BP based 011 pollcn
and lake lelcl records Quatemary Sciellce Reviews H 1-2
VMarkgrlf v 1993 C1i1l1atic histmy or Celltral and South America sincc I XOOll yr 131 COlllplriSllll
11 pollen rccords and rnodc simulatiolls In H E Wright (Ed) Glohal c1imalcs illCC the
l1~t gllciall1laximulli Ullicrsity of tImiddotlinncsota Press 357-1H5
Martinelli L A Pesscl1da L C R Espinoza E Camargo P B Telles E C Victoria RI
Arltmiddotel1a R Ridlcy J and Trul11bnre S 1996 Carboll-l1 variatioll wilh ltIepth in sHils or Armil and clilllate ChUl~C durill the QlIaternary Occnlogil 106 176-1HI
Malsui E Salati E Ribeiro M N G Rei~ eM TanlrediA C S N and (at J R 19H1
Precipilatioll ill thc cClltr1Amatlll1 hasin Ihe isotopic cOllipnsilion of rain allli ltLlll1llsphcrk
moislurell Btlelll and tllal1all~ ICI1 AI11mlllic 13307-169
McKnighll) M Thllnnall E t1 Wershaw R L and HcmondI 19X5 Bi(lgeochclllislry nfaelillashy
liL hlltllit llh_~tance~ in Thoreaus Jog COllcnrd MassachllscllS EClllogy 66 1139-135~
Meinarlli C R IlJ91 The tJrigin of hradisll grOlll1dwater in thc ltlwcr pariS (If the Nctllcrll1lds In
De Rreud V tEd) Hyllrogeology nfsah walcr intrllsion selection olSWIM ppers
IntcrnltionaIA~sneilti(lnllf Hydmgelilogists Heise Itanl1ltlver 2712HIJ
Meisler H Leahy P P md Knohcl L L 19H- Elkct of ell static sea-level ehmges on slltwaler
freshwater relalions in the northern AthllHic coastal plain US Geological Survey Waler
Supply Paper 2255
Mente A 19lJOa Mission report Hil hydrogcolngicallielll inCstigltioll OIl Rijsdijk _ Suriname
SurinalIl1sehe Waterleiding Maalschappij Organilniol1 of Amcrican Sales
Mente A 1990h Mis-inll rcpnrl un hyltlrogenlogical invesligatinl ror Wlter supply expansinll at
148 1-19
Mecrlllrg ar~l - Surinamc Guvrnmcnl of Surina1lJ~ Orgallialinll of Amerian Sllles
Merlivll l lnd Joui-d J llJ83 Dlllcrium and _I~O in pr~cipillIil)n a global mud1 frolll (lCilllS 10
k laps In Pilllcodimals and pilllenwaters a colkllinn of envirullm~nlOiI iSUlope slUdis lnlnliltion Alomic Enrgy Agency Viclllla Auslria 65-66
MOllK wG lEd) 2000a EllirUllmclllal isotures in Ihc hydmlngical cyd~ Principles ami arpicashy
linns Illlematiulwl Hydrology Progrmnllle UNESCOIAEA T~chllical ()OCUl11elllS ill Ilydmlogy No 1I) 2liO pp
rlonk WCi 2000h Ilillmluuitlll lhenry Illclhods rei~w (Volulllc I) 11 WG MouK (Ed)
Ellvinllllllcliial iSOlllpS in Ihe hydrolugilal cycle Princirl~s nu arrlicalions Inlernilliollal
Ilydrollgy Pmgrilllllllc LJNESCOIlAEA Technical DllCUIllCIliS in Hydmlogy No N 2HO rr
Moore W S llJ9lJ Largc grolllldwiUer inputs III CllISlal wat~rs nvcilkd by 226-Ra curicllments NHlllrc JHO 612-61-1
~lllalel1l Y and Hcal J 197-1 The shape or Ih~ inl~rfacc ill steldy Ilow ill a -lralified aquifer Val~r IksllLllces R~seanh 1n 1207-1215
Negrel P lachassagne P lld Larmlc P IlJlJ7 Caractcrislion chimique el iso(()rique des pluies de
Ca)~nnc (GuylIle rrancitiscl ACldemic d~s Scienc~ 32-1(~elie 111) 379-316
NOllrlhlltlrn van dcr KruijlL J F 11)70 Surinamc onshorc exploratiun IlJh~1969 Petmkumel1tincshy
ring and g~ulogy Inl~rtlal r~porl Shell Suriname Exploralic and PJtlullcli~lIIalIsdllppij 37 11(1middot
Alolu D J G 195M Scdimenls of thc W~Slcrn GlIilIa shelf Rcr0rls un the Orinoco shdf expcdition
VnlUIll~ n Mcdedding~n van de Lllldbnuwhngschuul te Wag~nillg~n 5H l-tJ~ rNota D J Ci 19(1) Gctllllurpholugy and s~dilllCllts ofwcStCfll Surinilm -hdf a pr~lill1illar) nllle
C1colllgi~ ell Mijnhtluw -1M IH5-1 ~H
VNtllltl D J G 11)71 Mtllphology 1I1d cdilll~lll off Ihe Mlrllwijne Riv r Clstern SUrin1I11 shelf In
SLiclllific illvcsligalitJIIs 1111 the shelf of Surinam HM ~I S Luylltes 1901J Royal
N lherlands Navy HydmgOlphil N~wslc((er SrCLmiddot Puh No h 31-16
Ogala A t1Id Bl1lkl RU 1961 A solUlinll of the dilTerential cqulIiOli of lungiludirlill di~persion in
pnnms lIl~dia USGeological Survey Prnlmiddot-ssiunal Par~r -III-A
OmiddotLcI1) M II 19~H CarlHlll isnlOr~s in rholOsynlhesis BioscienL~ 3M J2M-3J5
(hlslnllll tv1 Llijllsc A and Roh~rson KR 199-1 Sitllliialioll of two- and thre~-di1llensiunal dense
solul~ plulll~ hchavior wilh the METROPOL-J code Ill A Peter- el al (Eds)
Cllillpulalional m~IIUJds in wller r~SllllrL~S X Kluwer Academic Pub Nethcrlands 975shy9H2
Oud Essink GIIP 19lJ6 Impa l or s~r kvd ris~ on grollndwilla llow regimes a sen-ilivil) lllalyshy
si- fur lh Ndh~rhlllds PhD lhesis Tedmisehc Ullivcrsitcil Ddft -12M pro
Parkhur-1 D Land Appelu C A Jbull 191)1) Uscrs gui~te 10 PHREEQC (versinn 2) -l com pUler proshy
gram Im sjl~cia(i(Jn hllclJ r~attillil nnc-dilllcllsillTlltl1 tran-rOll and invtr-e cllchelllical calshy
culalions Wllef-ReSIll1rte- Ine~ligalilllls Repnrl t)l)--I259 US (jcolngical Suncy
PltlSLM~ N W il1ld Hoopes J A 19M-I Bunyanl cUlIlllnillltlllllt1l~s ill UfllUlldwalcr Waler Resources Re-~anh 20 II MJ-II tJ2 ~
Picklrtk-Jankuwskl IL It)lJ6 Hydrnche1Jlical effect of -llbmarill~ urmllJdwllcl dischame 10 thl Puck
Bil) (Smllhefll Baltic S~a Poillnul GCtlgraphia Polonica 67 101-119 ~ Plannillg il~1 Rc-clch Corpnration II)MX F~asihility study illld rrdimillilry design for Ih~ improve
llIenls md cxransinll of the pnllhk wal~r ~t1pply Im Parallllriho Iud its melroroliulIl ltlrtu Surirwillll dlc Win~rl~iding Maalschappij Paramaribo
Pllll1ll11~r I N Il)t) Stlhk iSOlllpc ~l1ridllllelll in palcowilIcr-middot Ill 11K snlHhelsl Atlllllie Coa--tal Plilill 1I1liled Stalls SCiCllLC 2(12 2(Jlh-20~()
I
~lels R L H 1987 Soils waler and nUlrienls in a foresl ecosyslelll in Suriname PhD thesis
Agricultural Universily Wag~llillgen 253 pp
Vost V E A 1996 Mod~~ling ~f th~ r~leohydrological situalion in Ihe coaslal plain of Surinam
MSc lhesis VnJe UlllVersuell Amslerdam 35 pp
Pos VEA Hooljhoer AEJ Groen J Gieske JMJ and Kooi H 2000 Pore water chemistry c ~ clay layers in the southern Nonh Sea clues 10 the hydrogeologiLal evolulion of coastal arc
Proceedings 16lh SWIM Conference Miedzydroje-Wollin Island 127-132
Pricm H N A De Roever EWF and Bosma W 1980 A nolc Oll Ihe age of the Pammaka metav
canks in nonheaslern Surimune Geologie en Mijnhouw 59171-173
PfUspenl J M Glacculll R A and Nccs R T 1981 AlmosrheriL lransport of soil dust from Afri
10 SOlllh Amcrica NalUn 289 510-572
Ralllsahnye L E 1959 The groundwalcr rnlenlial of the coaslal arcas of Brilish Guiana In Fifth
V liner-Guiana Geolo~ical COllferencc GeurgclUwn Geolugical Survey Depanment Brilist
Giliana 03-309
Ramsahuye L E 1959 The groundwater rOlential of Ihc couslal areas of British Guiana Proceedi
Fiflh luter-Guiana Geological Conference Geurgetown Gcological Survey Department
British Guiana 303-309
Rungallathan V and Hanor J S 1987 A numerical model fur Ihe formation of saline walers due t
diffusion or dissolved NaCI ill suhsidillg sedimenlary basins with cvaporites Journal of
Hydrology 92 97-120
Reilly 1 E and Goodman A S bull 1985 QuantitUlive analysis of saltwalermiddotfreshwaler relationships
groundwater syslems - a hislUrical per~pec(ivc Jourtlal of Hydrology 80 125-160
Remenda V H Van del Kalllp G and Cherry J A 1996 u~ of verlical profiles of Jl80 10 con
Slrain eSlimales of hydraulic cunduclivily in a Ihick unfraclUred aquilard Waler Resoure
Research 32 2979middot2987
Robb J M 1990 Groulldwal~r rro(cs~es in the submarille environmenlln C G Higgins and D
COales (Eds) Groundwater geomorphology 111e role of subsurface water in earth-surfa
proccs-es and lalldforms Geological SocielY uf America Boulder Colorado 267-281shy
Robinson RA alld StoKes RH 1965 Elcclrolyle solutions Bunerwonh London
Roeleveld W and Van Loon A J 1979 The Hulocelle develupment of the young coastal pain (
Surinamc Geologie en Mijnbouw 58 21-28
Rona P A llJ69 Middle Atlantic continental slope of United StltlIes derosilion and erOsion AA
Bl1llelin 53 1453-1465
RUZltl1l-ki K Araguas-Araguas Land Gonl1anlini R 1992 Relalion between long-term Irends
oxygen-18 isulope comrosilion of prccipitalion alld climalc Science 258 98 I-985
Rozanski K Aracuas-Afaguas L and GUllliantini R_ 1993 ISOloric pauerns in modem global
rilltiltlI1Yln P K Swart K C Lohmann J McKenzie and S Savill (Eds) Climate ch~ in contillcntal isotopic records Am~rican Gcnrhysical Union 1-36
Rnzall-ki K J)lm-cn S 1 Schollcrcr U and Thomrsun L G 199M R~comaruction of pasl e
lcs fnml stable iotor~ r~cords of palaeo-precipitalioll prescrved in COntinental archivc
Hydrological Scienccs Journal middotn 725-744
Sali E DatlOlio A Matsui E alld Gal J R 1971J Recycling of WatCf in the Amazon Basi
IsolOpic Study Water Resources RcgtearLh 15 1250-1258
Sanford W E 1997 Correclillg rllr dillusion in carbon-14 daling of ground water Ground Wal
357-161
Sanford W E and Bulpeng S 1996 ASS~SSl1lenl of a groundwaler now mudel of Ihe Bangkol
hasin Thailand lIsinl carbon-I-l-hascd ag~s and paleohydrology Hydrogeology journ
26-40 Sauter FJ Leljnse A and Bellscn AHW 199 Mctropnls users guide National Instinnc of
Public Health and Environmental ProIC(lion RIVM Billhovcn Schincariol R A and SChwUrl7 F w 1990 An cxpcril11cllwl investigation ofvjriablc density now
anu mixing in homugeneous and heterogeneous media Water Resources Rcscanh 26 2317shy
2329
ShOlcklclon N J 1987 Oxygen iSOIOPCS icc volume lUll sea level QUalCnlltlfY Science Reviews 6 183-190
Shaw T Jbull Moore W S Kloepfer J and Suc1mski M A 199H The l1u uf Dirium to the cnasll waters of lhe southeastern USA The in1p0rlnmc of sllhmarinc groundwater disdulrgc
Gcochimica ct CosmuchimicltI Acta 62 047-1054
Simmons CT Narayan KA and Wooding RA 1999 On a test case for densily-dcpndclll groundshy
water now and solule transporl modcls Thc salt lakc problcm Watcr Rcsourccs Research
353607-3620 Simmons GMJ 1992 Importance of submarinc groundwater disclmrge (SGWD) lfld swcatcr
cycling 10 material nux across scdiment watcr intcrrilCcs il11l1arinc cllviwlllllcnts Marinc
Ecology Progress Scries 84 17-184
Souza WR and Voss ci 1987 Analysis of lin anbotropic cOilswl aquifer systcm using varianlc-denmiddot
sity now and solutc transport simulation Jounml of Hydrology 92 17-41
Stigler T Y 1996 Analysing the hydrochcmislry or groundwalcr in Surinam MSc Ih~sis Vrijc
Univcrsilcit Amsterdam 43 pp
Stringfield VT 1966 Artcsian water in Tcrtilttry limestonc ill thc Southeltlstcrn States U S
Geological Survey Professional Paper 226 pp
Stringfield V T and leGrand H Ebull 1969 Rclation of sca water to frcsh water in carbonatc rocks in
coastal areas with special refercnee (() Floridltl USA and Cephaloniil (Kerhallinia) Grcece
Joum411 of Hydrology 9 387-404
Stringfield V T and leGrand H Ebull 1971 Effccts of knrsl features of circulation of wller in carbonashy
te rocks in coastal arCJls Journal of Hydrology 14 139-157
Stuiver M Reimer PJ Bard E Beck JW Burr GS Hughen KA Kromer B McCormilL G
Van der Plicht J and Spurk M 1998 INTCAL98 Radiocarbon age calibration 24000 - 0
cal BP Radiocarbon 401041-1083
Stule Mbullmd Bonanl G bull 1995 A 30000 yr contincntal paleotemperature record derivcd fnllll noblc
gas dissolved in groundwater from the San Juan Basin New Mexico Qllatcrnltlry Rescarch
43 209middot220 Stule M and Ta1ma A S 1998 Glacial tcmpcralures Hnd moislllfc trnnspurl regimes reconstructed
from noble gases al1d 0-18 Stamprict aquifer Namihia 111 Isotupc tcchl1iqucs In thc Hld)
of environmental change IAEA Vicuna 107-1 I H
Stute M Schlosser Pbull Clark J F and Bruecker WS 1992 PalcnlempcrOlwres in the sOllthshy
we~tem Uniled Statcs derived from nuhle gas measurcmCHS in grollndwalcr Sciencc 25()
1000-1003
Stute M Forster M Frischk011l H Serejo A Clark J F Schlosscr P Broeckcr W S and
Bonani G 1995 Cooling of Tropical BTilzil (5C) during the Last Glacial MlXillltllll
Science 269 379-383
Stuyfzand PJ 1993 Hydrochemi~try and hydrology of thc coaslat dnne arca of the wcstern
Nctherlands PhD thcsis Vrije Universiteit Amslcrdam
JTerracon Anguilla Ltd 1994 Hydrogeology and dewatering iludy for Lclydorp Ill final rcport
Client N V Billilon Mining Company Surinamc
J TlUI1ltltCI1 P A IL)7~C IhTOlll1liltlnll mlp Ill Surinam LllwllIld EcmylcllIS I~UlU)UU ST1NSlI
Par111arihll Surillamlmiddot
Thoma tv F l1ltl Thorp 711 B 1l)tJ(I The response of gcomorphic sy~Iel11s to di11lltttic l1ld hydmloshy
giC11 change during Ihe LaIc Ghllill lI1d carly 1-01lCenC in thc IUI111id and sllh-hul11id tmpie
Ill J E A Br1I1soll (Ed) Glt1balch1ngcs thc conlexl ofpalilLohytlrnlogy Geologkal
Stlckly fuhllc1110n I YJ-15J
1olh J 9C11 A lhclllelical anal~sis or ~nllllllwatcr Ilnw ill ~alllil drainagc hISills JOllrJIal (II flel)physiLal Reslarch 6~ j7l)i-H~12
Tmh Jbull 1995 Hydraulic cl1nlilluity ill largc sedimentary hasins 11ydnlgeology J(lllrnal 1 t-I h
yTlicll1 T 19H5 Eidcnce of t Irrcr Plcisloccne dry climalc in l10nhcrn Soulh Alllcrka Ill l Dougla and T Srcllccr (Ed~l EIlirolllllclllal challgc and tropkal gOll1Olphology Allen
~nd Unwin London 197-217
~ UNDPWHO 1972 Puhlic walcr ~lIprlie and s(wragc projecl Volul11c III WaleI Resollrces
(Hydm~eollgilal and Ilydnlllgkal Silidies) Unilcd Nalilllls I)Lchlplllenllnlgnlnlnll allli
World HClhh OrganiOllion 12H pp
VlclHill H 19~-L Die KII~ICIl dcl Erdc BeilragclUl illlgclllcincn L111d regiollalcll
Kwaellll1orphologk ErglIllullgshcft Ilt Pctermallns liel-raphischell Mitteilullgen Nr 2(1
Golha Haad
tJVan dCl Ey~ J L 19~t Dc landsdwppeu all Surinilme CClllraal BUleau Ll(hll~lt(lkartcrillg
Paramaribo Suriname Publlealie 111 1522 PI Van der Evk J 1 1957 Ree()llnlis~ance soil sun( ill Northern Surinill11 PhD lhcsis
I Lalldblluwl1ogcSl110ol IC Wagcllillgcll 99 pp
~V1I1 dCl Hal11ll1cn T 11 ral) l10lngical study Oil Ihe Qualernary of British Guiana Lcitbe
Geolopischc lledelklingn No 29 125-1 HO
Van dCl Hammell T 1974 Thc Plcistllccne change of vcgctation lI1d climate in tropical SOIlIh
Amcrica Journal or Biogeo~raphy I -26
JVan tin HlIWllen T alld Ansy M L 199-1 Amazollia durillg the last glacial Palacogeography
Palaenclimltltology Pahleoeentlgy 109247-261
Vall dcr Molen V H 1l)~H Ocr dc wuthllishlluding in de Noonluostroldcr Tjcenk Willink Zwolle
70 pp
Vall der Molcn W H II)~I) Het lOlllC grondwatcr in Wcst NederllIld CCIl gcvolg vall dkhtheid~-lllshy
l11ingen 1 H20 221() -311 llld Jt(l
Vall dcr Straatcn C M ilild Mllll W G 19Ht Stahle isotopic cllmpll-ilillll Ill rrccipiialillll and llimiddot
malic variabililY In Plllcodillll~middotS and palactlwilters a cllllcclion of Cl1irol1ll1~lllal iolllplmiddot
sludils Internalioll Alollic El1cr~y Aglncy ViCllna 51-6-1
o Van D(ln~llalr 1 [965 11 C~lIl(lical and phytngeographic sludy of llorthern Surinam sa1I1Ilas Thc
V~elati(ll Ill Surinamc IV r-kdedclingen Un tI(ls Ilcrh llllcdll Wenlia 1-1 16 PImiddot VaH Vlict K 199~ Is(ltlpi~- -urey Ill the Tcniary and Qllllmary aquifcrs or the cols1 plain til
Surinam t1Sc Ihe-is Vrijc Ul1iersitcit Amsterdam (j() pp
egt Van VOllfllHlylcn J H 191tJ tltroductioll and sumlllary of Ihe Slllligraphical and sldimelll1l1gica
rcsults oj boring lli1l1Clmiddotmiddot2~ in Ih coastal plain or Surinam (Dutch Ciuimll) GClllugic ell
rvlijnbollwtH 11-116
G Vcell 1 Y L 1970 On gcogcncsis alld pedll~cncsi~ in thc Old Coaslal Plain lit Surinill11 (South
Amcrica PhD Ihesis Unicrsilcil van Amstcrdam 17(l pp
a Velstra J 19 The ~llinity tlistrihutlnn and hydrogCllogy in Ihc coastal plain of Surimlll1 MSr thcshy
si- Vrije Ullicrsilcit Amstcrdam ~9 pp
CraquoVelslfilr 1997 Sludy and I11l1dlling or the porc waler chcmistry illlhc QUillcrnary days or Surinam
152
MSc thcsis Vrijl Ullivcrsilcit Al11sl~rdalll S3 pp
t Vcrkllr II 19l) I HydnlgeL)ltgic~1 survey ur the CtHlstal plain Ill Surillillll MSc Ih~sis Vrij~
Ulliversit~it Amslerdilm 69 pp
Verruijt A 1971 SluIy dispersion ltlems iln illterfac~ in a pumll mclliulll Journal of Hydrology I~
B7-3middotn Vogel Je I t)l)l VariahililY of lilrlwll isotope rraclillrlltiull during photosynthesis In JR Ehl~riJlger
AE Iiall and GD Fmluhar (Eds) Swhlc iSOlOpeS and phUlllarholl - waLer relation~
Academic Prss SiHl Digu 29-3g
Vogll J C illId Van Urk H 1975 ISIJlOpic lumpositillJl of groullllwlcr in Slmi-lrid rcgions HI Smllhlr11 Africil JI~llrnal or HyrJrology 25 23-J6
Volker Abull1Ilt V1Il dcr Mullll WH bull 1991 The inluellee or groundwaLer lin diffusion proc~sses in a
lake hmtmn 11 old rlpn][ nviewld Jmlrlill of Hydrology 126 159-ltW
VOJlhof II 13 Wlssclillgh r P llld Ganssen G M It)t)g RCCtlllstrLlclion of the Minlene Western
Al11azuniall aquatk systelll using Illolluseln isoltlpic sigllanlr~s Pal~ogengruphy
Pllcuolimattllogy and Plkoccology 1-11 H5-93
Voss (1 )Ild Smla WR 19H7 Variank dlllsity low and sol lite lrmspO(t simulation or regional
aquiflrs cOlHailling a narrow frlshwatcr-sltwltlter transition Inll~ Waler Rcsourc~s Reseurch
23 IH51-IKM
Wllrlcv~ns K It)t)() Natlral-isuIOPC rcseanh on gmundwater from the stmi-conrmed Ledoshy
P1I1isclilll aquilcr in Oelgium application of I~C-tllrrcttion melhods
NiltLJUrwetellschapp~lijkTijdsthrift 72 79-8tJ
Walraevcns K and L~hhe L 1989 Groundwater quality in the T~niary Ledo-Pllliselian aquifer ill Bdginm as a r~sull of rrtsh-VIl~r inlrusion into s~dimenls in chel11ioal equilibrium with th~
sca Ill W Dc Brcuck ll1d L WalsdlOt Eds) IOlh Salt Water ll1lrwlol1 Meeting (SWIM)
COllference Ghcllt Naluurwctclschapp~lijkTijdschrift 70 30--1-1
Wmg JH Rohinson CV and EddmanIS 195J Self diffusion and structure of liqllid watcr with
~H 11middot1 lIld 1MO as lraeers Journal or Ihc AIlltrit1ll Cht=mical Socicty 75 -I6l-~7)
Wang R 199-1 Survey ora rrcsh wal~r aquitcr in Sht=ngsi st=a artil Hydrogt=ology and Enginccring
(i~olugy 3 5-10
Wcycnnan JWJ ltJJO Twce rapportcn IWer J~n aanleg t=ner waterltiding Ie PMillllariho tlitgebracht
mll dell GI~llVCllCtlr Villi Surinamc It)tJ pp
lt3gt Wijmstra T A lilt Van der HUlllllCll T 1t)6l Palynnlogkal data on Ihe hilmy of tropical slannas
in lHlrthcrn Stlulh AlllcritI Lcidse G~ologisdlC MLlIcdclingell 3H 71-9()
Williams M 0 19-1l Bilhrtill Port Ill pearls and petmkulll Ntilm11 Geographic H9 19-1-210
egt WUllg Th E 1976 TClliary straligraphy ll1d lllicmpal~nnlOlogy of lh~ Guiana hilsin PhD the~is
llniversitcit vall lItrethl Also puhlished ill tVkdcdeling Geoh)gische tvlijllhmlkundige
Diensl Stlllm111e No 2513-107
0Wtlng Th I~ 19H-I SlraligXilphy aud sedill1~nlary history nf thc Guiana Btsin r-ktblding
Gcologisdlc ~n MijllhlluWhUlldig~Dknst SUrilllIllt No 27 H3-9(l
eVong Th E 19H6 OUllinc of tht sraligraphy and geological hislOry of the Surinamc ooastal plain
Gcultlgic cn Mijnhouw 65 22J-2-11 e Wong Th E 19H9 Rcvisioll of thc stlltigritpll) uf the coaSlU1 phtin of Sllrinarne Mtdedcling
Nilltlllrwetell-Lhppehjke Sllldi~kring Imr Suriname ell d~ Nederlamlsc Antillen No 1236-1
pp
Wmlg Th E 199H I-lydntarhull eploratioll and ~xploili1lillll in Suriname III Th Wlng DR dc
Vl~uer 1 Kmok J1S Z1l1llcdJ and AJ VIIl LntllllEdsl The hi~lory or eanh ~tiences in
SminlIl1e Nctherl1I111s Inslilllt 111 Applicd GemdlnLt TNO Royal NelhcrllI1d~ Alademy of
Arts and Scicnces 377-1969 Wong Th E De Vlcller D R Kronk L Zonneveld J I S lind Van Loon A J (Eds) 1998a1l
hislory of earth sliences in Suriname Nelherlands Instltule of Applied Geoscience TNO
Royal Nctherlands Aeademy of Arts and Sciences Amsterdam 479 pp
eWOllg Th E Kmok L and Zonncveld JIS 1998blnvestigations in the coastal plain and offshc
arca of Suriname In ThW Wong DR tle Vletter L Krook JtS Zonneve1d and AJ
Loon (Eds) The history or earlh sciences in Suriname Nethcrlands Institute of Applied
G~)science TNO Royal NClherlands Academy of Arts and Scicnces 73-100 Wooding R A Tyler S W and White I 1997 Conveclion in groundwater below un evaporatin
saL lake 1 Onset of instabililY Water Resources Rcscarch 33 1199-1217
Woodin~ R Abull Tylcr S Wbull WhiLe I and Andcrson P A bull 1997b Convection in groundwater be - an evaporang salt lake 2 Evolution of fingers or plumes Waler Resources Research 3
1219-1228 Worch E 1993 Eine neue Gleichung wr Berechnung von Diffusionskoeflizienten geloschter Sto
Vom Wasser 81 289middot297 Wymma T A 1969 Pllynology or the Alliance Well Geologie en Mijnbouw 48 125-134
Zektscr 1 S and Loticiga H Abull 1993 Groundwater lluxes in the global hydrologic cycle past
ent and future Journal of Hydrology 144405-427
Zckt7er I S Ivanov V A illld Meskheleli A V 1973 The problem of direct groundwater disch
to the seas Journal of Hydrology 201-36
G Zonneve1d JIS bull 1955 Over de geologische ell paleogeogralische olltwikkeling van de Surinaarr
kustvllkIC Leidse Geologisehe Medcdclingen No 20 214-224
Annex 1
Sediments and aquifers in the Suriname coastal plain
11 The Guinnn shilld
The ProlclOzoic crystalline basement of Suriname is pari oj the Guiana shield (Figure 33) and consists mainly nf granitoid rOLks wilh 11l1111Crous elongated dolerite intrusions (Dl Vlelter e( al 1998) In the nonheaslcrn part of Suriname a regioll of metamorphic rocks OCCUI consisting or metaJl1orphosed volcano-sedimentary rocks (Marowijnc GrOllpl anti gneisses and amphiblJlile~ (Coeroeni Group) Metamorphic rocks (metabasalts and greenstoshynes) underlie the Ilorthern part of the Ciuchmcnts of the Sammltlcca and Suriname rivers (Figure l3)anrJ afC also encountered in boreholes in the coastal sedimentary wile lFigurc 35) The lOp is strongly weathered which could be detected in vertical electrical soundings (Ve1tra 199() the Cillben~d layer appeared to have a very low resistivity of around 10 Wm vhieh WtlS also ohserverJ in similar vlIlcano-serJimentary deposits in West Africa (IWACO 19Rh
12 The sedimentar) coastal plain
The clastic Mesozoic anrJ Cenozoic serJiments in the coastal zone form the southern pari of the Guiana Basin whith extends roughly from the Waini River In Guyana to Caycnne in Frcnch GUiana (Figurc 33) The rollowing rJeslfiptions or Ihe serJimentary histoshyry nnd or the stratigraphy or Ihe coaslal plain arc rJeriverJ mainly rrom Wong (19H4 1(89) Krook ( 1979) Hallou ( 1981) Veen ( 1970) anrJ Brinkman anrJ Pons ( 19(8)
The depositional ccnler is located at the mouth or the Corantiin River where the forshymations allain their maximum thickness SerJimentalion in the Guiana Basin started in Late Jurassic to Early Cretateolls limes when the Arrican aJlrJ South Ameritan shielrJs hegan to drift away (Wong 1976) The coaslal plain is unrJeriain with various rormations intreasing ill thickness and rJcplh lowards the North ilnrJ onlnpping olrJer serJilllents or the hl~elllellt
rocks (Figurcs J4 nnd JS) The thidness or the serJimenl werJge incrclscs froIH a fcw mctcrs ill the savannah hcll 10 7S0 III along the coastline atlrJ linOllly W S(lInc 10000 III ahmlt ISO km ofrshore (Wong et al 1998h) The Suriname coma is ImllerJ 011 the hingc hetween the suhsirJing Guiana Basin mlrJ the rising Guimltl Shield (Kronk 1994 l SllhsidcllCC WOIS
aeeompanierJ by faulting and resuhed in seveml hona HnrJ grOlhen structures Structuwlly the slultJy area arounrJ Paramariho is IOCJtcd on the lower block on thc eastcrn lll1lk of the Bakhui horst The fault remainerJ activc until Early Tertiary time (Wong 1994 HmlOu 1981) The material for the uhsiltJing bmin wa dcriverJ from the continuously rising crystalshyline basement ltJirectly south of the bJsin After the Early Miocene the Amazon River hecashyme ltl more imponant oune of supply (Krook 1979) Earlier when the AnrJes Mountains were not yet formed rJrainage on the South American contincnt was rJirecterJ tmvarrJs the west (Krook 1979)
156 157
13 Crctaccuus
The Laic Cretalcow sediments in IhL loaslal zon~ lonsist or terrestrial lllllonsolidated md consnlidalLd fine sands and kilolinitil dayslones dassiled as lhe Nickerie FOJlltIlioll
Ihe Crelltlleolis contain iI high pLnel1tage or feldspar whkh implies that lhe wearhered top lias heen eroded (Krook 1979) Apparently during lhe Cenoloil Ihe impermeahle middotn~talCOliS material imj1elkd nushing hy aggrLssive metLoril grouIllJwlttLr which leached 1110St or non-qualls minLwls from thc overlying Tertiary sedilllcllls Ncar Paramariho the Vidtlie fOnJlllfiol is round al a deplh of around -300 m (hdow SLil leel) The lOp of lhe middotn~lilleOliS dips to ahlllll-3OOO m mtllL shelf slnpe 150 km offshore (Figure 3tl) The lOp If lllL ClctlcCOUS is rccogniled hy a conspicuous density shift in geophysilal well logs and cismic sl1lveys l~)r oil explomtioll
lA Paleogcne
During thL PalLocene and EtJlene mainly shallow marine sedimenlS were deposited luring several (rilnsgrLssive phases Three l~)rmalions are dislinguished with different facies Wong 19Htl 19H9) the lOmillLlllal Olllnlacht Formation is charncterized by loarse kaolishylitlL sands lIld kaolinitic days deposited In alluvial hillS and braided rivers in the Paleocene Illd l10mlplains and loilstal swamps in thL more humid tropilal Eocene The 101040 m hick formation is IOlally round as buried hills lupped with bauxite and laterite in a 10 kill ide small zone lnllmd OnvLrdadlt and further easlward The top of lhe forlllation is found -lose 10 the surfalL lrounJ Onverdalht until dcpths of 30 m below the surrale near dydorp Bauxite is tbe result or intensive weathering and leachinn durinll the Ion (I
lligolcne regression The original sands were probahly arkoses alorJin to Krook (1979) lmOSI all hauxite in the study ltlrea has been excavaled in open mines
The Olllnladlf Forllation pa~ses nonhward imo the marine SctrClllIcca FOlllwtic)
hough lh~ transilion is not llear due In faulting (UNDPWHO 1972) In the study area the IHllluioll is found belween the line Grollingen-Lelydorp and the loastlinc (i-Ianol 1981) Ihe formation lOnSiSls of alLernaling quartz sands and kaolinitic clays rorming series of lLpnsitionallydes beginning with shallowmiddotlllarine deposit~ gmding into beadl and dcltuil lcpnsits ami finally cnding with Iluvial (poiIltbar and lhmnclldeposits The formation conmiddot tins thick ami contilluou~ smd lInits whkh enabled deep groundwaler lirculation Oil in he TambarLdjo oil tCd is rClovcred from OIlL of the lower sand uniLs (T-sands) which i~
onflncd hy Ill impcnneahle chly layer The sounc rods of the oil are the offshore Lower rLUIleOUS nmrine shalLs (Wong 1998)
The top of the formation is found II a depth of about -140 m (helow se1 level) just lorth or Lclydorp and slopes to - no m along (he loastline west of Parullllribo
FUrlhcr North the SarwllacCCl Forlcuioll lhanges into the AlliaJct Formation which llJlsiss of silly marls days lakltlreOllS sands and lignites deposited in i shallow-marine Ilvironl1lctlt and in loastallagoons Sand layers are nm as massive as in the SCICIIIICCCCI
orlllCltion and therdore the formation as a whole is mlllh Icss permeable During the OligolcnL the seu withdrew (10 million yeur~) while dimate changed from 1
lImidlropil1I to scmi-Irid Weuhcrillg during this long period led to bauxile formalion on teogclle sedimcnts and lrystallinc h~lsemLnt rOlks Eroion prolUlLS were deposited il~
midLd-river llld illiuvial-Iilndcposils forming the BUrJlside FOIIIICIIIlJl In the Hololene
coastal plain the formation is restrilled to several northeast-southwest oriented tectonic basins along the conSI (Hunou 1981) The sLUdy area is located on one of the basins betw Groningell and Paramaribo Easl of the Suriname River lhe formation is absent The BUrIIsicle Forilatioll has been encountered just North of Lelydorp at - 130 m North of Paramaribo near lhe coastline lhe top of the formation is found at -180 m The lhickness varies from 5 m to 80 III in the depoitional cenLer west of Paramaribo
Low feldspar contents and the absence of calcite and aragonite in the Paleogene sec menlS are signs of prolonged lealhing by groundwater now (Krook 1979) Krook also believes thai the moslly kaolinitic Tertiary clays (of marine origin) originally had a highf content of smectites and illiles and thallhey were Ialer iransformed as a result of weathe and leaching Magnelile and hematite appear to be the dominam iron(hydr)oxide minera
Thin aquifers with rresh water are found in the OllverdCH11t Formatioll below the blUxile caps though lhey are discontinuous and of little imporlance to the regional grou warer now The massive sand units in lhe SarcullClcca FOTl1lCllioll form aquifers of regio extent Around Paramaribo the aquifers of this formation are moderaLely brackish and n suitable for water supply Well known is the T-sand unil at the base of lhe formation wr hOSiS the oil of the Tambaredjo oil field 35 km wesl of Paramaribo Though groundwatc this oil-bearing layer is highly bracklsh fresh groundwaler is found just above the clay sealing the T-sands UNDPIWHO (1972) rep0rls hydraulic conduetivilies varying from 40 Illday derived from slem tests The lota1 thickness of the sand units is aboul 50 to 7
The coarse sands of the BUrilsicle FOfl11C1lion vary in thickness from 10 to 60 m an form a good aquifer also called A-wlIlcl ClCJuifer Around Paramaribo hydraulic conduct ties and transmissivilies vary from 30 to 80 m1day and 900 to 3200 m2day respectively (UNDPIWHO 1972) The high trunsmissivity for the Leysweg well field is related to tl relatively large thickness and gravely nature of lhe aquifer near the depositional center 81rJ1icle FormCltioli West of Paramaribo In the southern pan of the Holocene coastal the aquifer contains fresh groundwaler A tongue of fresh water protrudes to the city of Paramaribo (Figure 37) where the aquifer is heavily exploited for the drinking water ~
ply Clays below the BIIJlsiclt FOlllICliOI probably have a high hydraulic resistance a
as the salinity of pumped water in the well fields only slowly increases due to lateral a (ion rather lhnn by upwarJ tlow from lhe more saline deeper slrala
15 Neogene
During the Early Miocene transgression clays sandy clays and sands with glauc and lignite layers were deposited as b~ach sands and swamp clays with mangrove veg (CoestlIijlle FOJmatioll) Compared to Ihe older formutions the deposits of lhis form~
contain much more clay (40 to 80 ) originating from the proto-Amazon catchment continentul sbelf the f~eies of the CoestlIijne FomlClticn changes into a shallow-man bonate plalform (Figure 36) After a regression lasling 2 lo 3 million years sedimentlt resumed during the mid Early Miocene More sands (beach and fluvial deposits) were deposited In the study area tbe lower more clayey part 01 the Coesewijlle FormatiOl
only found in the Hololene coaslal plain at u depth of around -95 m The upper more pUrl extends as far sOUlh as lhe Rijsdijk Road in lhe Pleistocene coastul plain lhougb absent on the buried bauxile hills arollml Ollverdadll fhe depth of the top of the
I
Coesewljlleformarol varies rrom -65 11) to -75 m along thc coastline Arter a long regreltsion or about 5 million years during lhc lone Miocene the Pliocene
started with a transgression reaching as rar as Republiek (Krook I ()79) The ransgrcssive deposits have been removed largely during the subsequem Plioccne regression Mainly coarshyse white and brown kaolinitic sands with interbedded kaolinite clays were then deposited in braided streams and on alluvial rans under semi-arid conditions (Krook 1979 Van Voorthuysen 1969) These deposits comprising the ZWlllerij Formatioll crop out in the savannah belt Intensive weathering and leaching gave the savannah sands their charltlctcshyristic bright-white appearance In the coastal plain the ZOllclerij Forlllariol dips below Quaternary sediments At the coastline the formation is round at a depth or -35 Ill
JUSt as the Paleogene sediments the Neogene sediments eontain hardly any weatherashyble minerals like calcite and the more unstable silicales (Krook 1979) Unpuhlished minerashylogieal analyses by Krook (related to Krook 1979) show lhatlimonite (amorphou~ iron hydroxide) is the most abundant iron(hydr)oxide in he Pliocene and Miocene formations He also found authigenic siderite in the top or the Pliocene rormation Pyrile appeared to be present in aU Tertiary rormations The mostly kaolinitie clays in the marine Coesewijne Formation may have been lransrormed rrom clays with a higher smectite and iIlile content through weathering as Krook (1979) suggested ror the Paleogene clays
Despite the large clay percentage or the Coesewijne r()fl(aOfl the individual sand layshyers are permeable and are generally grouped into two aquirers (lWACOFR Harris 1991) Sand units below a depth or -110 m comprise the Lower Coesellijne aquifer ami are only present in the Holocene coastal plain The Upper Coesewijlle Formatioll contains thicker sand units and forms a better aquirer than the Lower Coesewijne aquifer The top is found at a depth of -65 m near Lelydorp to -75 m along the coasl The total thickness of the stlnd units in both aquifers varies between 5 and 15 m while hydraulie conductivities vary betshyween 40 and 70 m1day (UNDPIWHO 1972) South of Lelydorp the aquifer is hydraulically conneeted with the Zanderij aquifer Though the Upper Coesewijlle aquifer extends almost to Republiek in the South it is absent on the bauxite hills around Onverdachl North or the main coastal East-West road and along the Suriname and Saramacca rivers groundwater in the Coesewijne aquifers is brackish (Figure 37) There are several pumping stations the Holocene coastal plain which recover water form these aquirers (Table 32 and Figure 31) The clays and lignite layers in the lower part of the Coesewijlle FormnfiOl form an errective aquitard as indicated by the originally artesian groundwater heads in the Bfflllside aqllifer (Section 363)
The Zaflderij Forllaroll rorms a continuous aquifer with a thickness of several meters in the savannah belt to 40 m along the coast The Zanderij aquifer is absent on some of the more elevated bauxite hills Various pumping tests carried out in the Pleistocene coastal plain report transmissivities varying from 300 m2day at Republiek to 1400 m2day at Lelydorp (IWACOIFR Harris 1991 Terracon Anguilla Ltd 1994 Mente 1990a) The aveshyrage hydraulie eonductivity of the sands is 50 mday In the Holoeene and part of the Pleistocene coastal plain the aquifer contains brackish groundwater (Figure 37) Fresh groundwater is present in the area around Lelydorp (below the Lelydorp sands) and rurther South in the savannah belt and the adjacent eoastal plain The aquirer is exploited for the drinking-water supply of Paramaribo (Table 32 and Figure 31) and also for the SURALCO bauxite refinery at Paranam
t60
16 Pleilttocene
In thc Pleistocene coastal plain between Rcpubliek and Lclydorp marine deposits are lound relatcd lo one or more Pleistocene transgrcssinns The depusits dassil1ed as the Compilla Formariol consist mainly or clays (mudnats) intersperscd with sand barriers At the base of the formation also nuvial sands are round in some pllccs marking a cunlinental sed~l11entary environmem during the Early Pleistocene Two lllemhers are distinguished (Brmkman and POllS 1968 Vcen 1970) Thc Pam Mlm1(r dates rrom the Early Eelllian or YarlllOlnhian (Holsteinian) interglacial and cOl1sistmainly or marine days Thc lOp of the Para Member is eharucleri7cd by strong mouling (paleosol) The Lelydorp Membcr which conlains more sandy deposits than the Para Member is prohably rormed during the Lite Eelllian interglacial The Lelydoll Member is round in the northern part of the Pleisl(lcne coastal plain Characleristics is the eleVltlled complex (up to 11+ msl) or sand harriers around Lelydorp T~lese Lelydorl ~I(1s rorlll a more or less continuous shallow aquifer According to Van d~r Eyk (1957) Eerl11an sca level reached a maximum of 8 III above present ea level Brmkman and Pons (1968) distinguish two phases ror the Lelydorp Memher the Onoribo phase haracterized by deposition or clays rich in organic material and pyrite during a ~isillg sea level and the Santigron phase during which clays with less pyrite and sand barner~ were deposited after sea level had reached a stahle level
Weathering during the Wisconsinan arreeted the Pleistoeene sediments consisting ~nalllly or clays Carbonates have largely disappearcd laquo 03 ) Also organic mattcr contenl IS generally low laquo 04 9() though Veen (1970) and Levell and Quakernau ( 9(8) occasio nally round high organic carbon tOntents in the lower part (up to 12 ) Oxidation can be recognized by the intense yellow and red moUling or iron oxides rormed after breakdown of siderite and pyrite XRF analyses or a few Koewarasan samples showed lhal sulfur has almost ~nlirely disappeared Aecording to Veen (1970) and Levell and Quakernaat (1968) weathermg also transrormed the clay minerals Dala of Levell and Quakernaal (1968) show lhat kaolinite eontents have increased at the expense of illite conlents in comparison with the composition of Holocene clays The content or smeetite is comparable to that of the Holoeene clays (0 - 20 ) Finally it is worth noting that the Pleistocene elays in the South contain acid and very dilute pore Water and have a low base snturation (Levelt and Quakernaa 1968 Veen 1970)
The LelydOll sWld act as a local aquifer with a thickness of 2108 m and contain rresh groundwater This groundwater is recovered in open dug wells in remote places not cOllnec ted 10 lhe public water-supply system Long-duration tests with several piczomecrs carried out only in the Pliocene Z((erij lIqll(el (IWACOFR Harris 1991 Temuon Anguilln Ltd 1994 ~ente 1990a) sho~ved thaI the clays of the Coropilla Forllatioll Imve n very high hydraullc resistance varymg rrom 5 x 101 to more thcn 2 x 10~ days Given the thickness of the clays the vertical hydraulic conductivity IS about 0 mday
17 Holocene
During the Early Holocene (12 ka to 6 ka DP)ltea level rose rr011l a depth of 100 III 10 liS present level (Roelcveld and Van Loon 1979 Fairbanks 1989) In the course or the seashylevel rise the large sediment load of the Amazon River could 110 longer be dischtrged inlhe deep sea rar offshore The sedimem was taken northward with Ihe Guiana Current and deposhy
itcll along the lOlsL The Holocene sellimems obliterated 1110st or the Pleistocene erosion lopogrilphy Because the HolOlene lmnsgression did not reach the level of the previolls iltlllgamoniall transgression the PleislOlene coaswl plain in the south was sparell though (he ~ullics were tilled with the peiHY clays or Ihe Mara Fomlllticm and lan still be recognized as Vamps After sea-level rise slowed lIown between 7 and 6 ka SP coastal aggradation began Inll extensive lillal-l1al clays ahernming with beach barriers with sanlls am] shells were lieposited in the Holmcnc coastal plain (Ommie Formation) Brinkman anti Pons (1968) discerned three distillltiw phases in the coastal aggrallalion the Wanica phase from 6 10 3 ka SP the Mokson phase from 25 to 13 ka BP ulHIthe Commewijne phuse from I ka BP to present The main pan of the Holocene coaslill plltlin in the stully area lIates from the Wanica phase Only Nonh of the Paramaribo-Groningen roall and the Commewijne River nxent deposits or the Comlllcwijne phase are found In the littoral zone sedimenHHion and oastal lggradation lontinues (Augustinlls 1978 Augustinus et al 1989) A series or mud hanks where suspended load from the Guiana lUfrent precipitates is lontinuollsly moving weslwilfd while hetween the Illud banks energy-ridl environments lreate elongated beach hIITicrs Oceanographil surveys show that thesc mull deposits are present 011 the sea 11001 to distance or 30 km offshore and have a maximum thickness of 20 III (Nota 1958 1969) Further North sandy deposits l1re found on the sea 110or Just as in the coastal plain the Holocene deposits have obliteratellthe Pleistocene topography apan from Pleistocene paleoshychannels of the major rivers like the Marowijne (Nota 1971) Other submarine morphologishycal features are old coastlines anll coral reefs which inllicale imerruptions of the Holocene lransgression A coastline al a depth of 21 to 25 III was found dating from 8 to 9 ka BP I Nota 1958Van del Hammen 1963) A coral reef at 80 10 90 III lIepth has an age of 12 to
17 ka BP(Nola 1958 1971) The days or thc COOIIe Formlltioll have high smectite and illite 00 to 60 90) and low
kaolinite laquo 30 fr) lonLents (Eisma and Van tier Marcl 1971) The smcltites and illites origishynate from the Andean moulllains and were transported to the Suriname loast hy the Amazon River and its trihutaries anll subsequently the Guyana current (Gibbs 1967) According to ll1alyses by Eisma and Van der Marel ( 197 ) anll samples from the Koewanlsan and rOllftonne boreholes (Chapter 5) carhonate anll organic maHer eontcnt arc ahout 2 - 6 Illll 1-2 respellivcly The days are also rich in pyrite formed afler lIcpositioll (Brinkman lIld Pons 196H) as can be derivell from the XRF analyses or Kocwilrasan and TOllrlonne ampks (sulfur lontents from n to 08 ) However after regression ill the Late Holocene tafter 4 ka BP) soil Iorming pnKcsses in the uppcr few mctcrs of thc Hololcnc lli1ys led to pyrite oxillation and acidililmioll (BrinknuIl and POllS 1968)
The sillds and shells laycrs in the Holocene beadl-barricr lieposits form local aquifers rrom whilh groundwatcr was rccovcrell by open dug wells heron the OmsLfllltion of the middotity water-supply systcm in 19J3
Annex II
Map of the Suriname coastal plain around Paramaribo with san pled wells
~
SOW ~ ----------r--shy4 -=-u
_~~ 1middotI~
NI
~
j I~ C A= ~ =1 r
SlNI-GR SlNIImiddotG
J7 S Om
MOrlOO
gt1 J lillI
~IC
1~
_ SON
TA~~-GR
TA~ImiddotGP
~o
2-
bull IN 1m
-39m
~middot-imiddotdlM ~HP 16 1 I11III 61
4Sl~ H~J~
~----=~n~~~
TamDl~JlI_II~
51 1111(13
0
Coesewllne River
Allantic Ocean
~
~
~
~)
J~ ~
~
-
go
0ltiI_
V1ap of the Suriname CDaSlal plain around Paralnuibo wilh sampled wells
Annex III j
Chemical and isotopic analysis of groundwater in the Suriname coastal plain (for locations see Annex II)
g Chemical and isotopic analysis of groundwater in the Suriname coastal plain (for locations see Annex II)
screen Fcwmatlon DepChW m
Sa wM analyses of all macroiom BOO BItXtJO-MUtnJllty error lt 10
0l200O 0l200O or2OOW 012800 00 K
Kobo 0I400W
OItOOW
~OOO
Kbo onQOO K onQOO onoow Kobo onoow OOW K MOOW Van Hallemweg172 W Meerzorg
m2 Haariem
HeariemH2
A11dllk
10(70 68
Leiding 9a on MOI1co JI 10(7 MOlkxIII
Mudlke SUAALCO 1(73
MeerzOlg Mudlake SUAAlCO
72 Mon PlalsllWeg
Mudake SURAlCO 13 AIISdI(lt Sou1h
14 72
Mudlalce SURAlCQ 4(72 Rllsdllk
2 -7S 2 -75 2 middot75 2 middot75 2 75 2 middot75 2 -75
1 2 75 2 middot75 2 -75 2 -75 2 -75 2 -75 2 -75 2 -402 5 -1511 -7602 -7602 2 ~2 5 middot18J5 middot623 middot623 2 middot344 5 -1511 2 -251 bull -1250 2 -290 2 -303 2 middot290
2 middot345I
- SOlt No KHCOOmiddot NOshy PQH-Bie- crEcveld 1= I-pHmiddotLob pHmiddotAdDale mmmiddotc 51= 51= -
0 17-oa-83
010703570032aon2] 012001)015 0-0090121246260-00-83 01140133 OOltl5 0002013300 00100149613
25
01410067 0004 0124246- 000901230Ol50004 0015013027-06-83 535 035000040465525 57 02]2 00010001 0023-17-08-83 OJ
OODJ009700110051 00982417-06-83 5 0204 00110Q15 0025005201943527
0006018900]8 0010 0022012265217 01120044 009lt1 0016 001024593 0003OltW7000502SO17-06-83 5
001803570024002111029 0421607 6301-06-83 010212171700 0104045111()9middot72 7bull 02)037401344 0166338500005-12-80 7 01252827 1015 1721 0468 0001 005231-12middot82 66
14middot07middot95 2173 18107 US7 14D4f 02602506 0006727 7 SO 3H2-90
33 0004 1652 00651100 0032169229243 605
9656 021219000049939329-01-71 7 59S9 01022200 05514936 004921-05-71 0212965619000049939329-01-70 7
6394 01301349 4615-OJ-9 266 5 4219 023001663949 442716 6005-12-60 043917633493915)3middot95 66 2610 16645267 010254801200 171013820-05middot72 6 09674393237179 2161905-lt15-95 673 57SO266 0040OOOS 10431100 119 008331-12-90 569 160
05-05-95 22
050620SJO617217827268 631 006900042721 1297 OOJ4 086931-12-90 273 772
analyses of o(h~r parJlntCrs art tominucu on page 179 to 189
KNoHCOOmiddot NOJ 04-orthSOlCOJcr 8EemiddotVeld7_ pHmiddotFJd ECmiddotl8bpHmiddotLab mmo
Formallon 010W Dhlocation Sa~ mmommommommo mmommomiddotc 51= 51= mmom ~ 0639321671079027447 2 3970645-290 05-lt15-95 26MUdlake SUAALCO15 0179576 1000 014S541607-07-71 5 51116m Meel7org 02947872 1216
17m 050017235-388 04middot08middot712Pad ven Walllea 0053291400010260 0220031middot1290 605-5962 Allsdiik OlSJ43930900 39n 0349 0468 02-06-71I 4 -126226 01432474
I
1573 12494172 7
282 676 599 6450](17middot95middot6040Koew81asan 0104 18701207500076122-02middot72
2S22 middot68721n WamplgedacN 8 008500021080 07524052 2 623 254 62131-12middot90-300Land5OQord(Javaweg)21n3 0409157980100029951622670 27middot07middot71 5Cltlmrnowljne km24 22m
01020762 16040049 036601middot08-72middot16922112 Allsdljk 005119130545101S 00002-09-71 7-6371 004015220900 0156 2
1128-598 27middot08-71 6M_genlaWellledachl C 2517 013624921934 0014 0001 185330532 S -1727 08-08middot95 28 3325172 Gamll0ampMP3d 010222181700 2256 5 middot1727 20Q9-72G~OIInspad25172 OOSI10430080 0322112831-06-71002 72171 OlSJ15960800 0726152315-09middot71271
2 middot525HlllampnI ChnUnaweg 7
006317390149 0800 013513547208-04middot71J7 middot5232 2Aijsdl~ 00740007 10001327 0031 00010811l14531-12-7J7 -2902Aljsclijk 5 0IS85785 0199 1100 10823413
1 -761 09-03-71 J7
1513 0059 0836 0093 0004
2 642
665 266 51791 00826 116-3 2 0006
2~9 0000560104middot08-95 269middot300 0S23523204-ltgt6-95 6270 60
1030 1(199 0002 0003 3239 0163
61 1629
3392 279
S IJolO 63ltl12middot12middot96 288 56 50Helena CMstIna1leg n 01571322 0)01
1595675 50S 229 5 J3oCO 07-07middot95 295 576 5Helem Ovlstlnaweg 3592 00482737 23111187 -740 16-07-9 297 605 093264LeIOng 019124351974 078031(71 31-01middot7 000 Helena CMstInaweg
~72 7
4579 027110206 0004 OOOS1213 642057~72 12-1296 81931m Helena CMstIoaweg 272 4764 0220524 140S 002007-07middot95 56~72 277 56531n1 _CMoN 13 016026571468 00245669 501l0 07-07middot95
271 618 0366n 0207520 0006 26495440 1609 0001 1021
13-12-96 271 5611 0230J31
2 -377 JO-09-71 6 13737 0= 060-
010215221100 0520gt059I 2 -430 8-10-71 65171 shy 01791400 6265 5 -1568 15-10-713amp7 Zorg en Hoop (Corsu) = 0593 1435 0104~2 09-11-69 7 -5Skod 1ll Ill171
~
~
w
61aw 7OW
0 m
2
ISconl 41n1
2 682
682
68 ow 614000
614000
61400W
61400W
ow OW
6f72
682
68 6CENT
NT 6A
7f72 7f7
Muttake SURALCO
Lilting 9 Cornnelane Kreek
AiJsdlJk South Rljsdij Sou4h RI~Sou4h
RijoO
Rijgtd~
Zorg en Hoop (POSloll)
Zorg ell Hoop (SWCC9
Carolina
Mudlake SURALCO
Rljsdljk
AljsdlJk
Aijsdijk
Gronlngen
Kbo
Kbo Kbo
Kbo
Kbo
Kbo
Kbo La V1gllanlla
RiJsdiJk
RIJsdIJk
Kbo
Kobo
Mudlake SURALCO
Tljgerlueek
Helena Chrls~naweo
Ksolt NN03HC03cr BEC-UO Ec-V ICODepCh Dale T pH pH-Ad F_ SianmiddotC Sianm shy 15280 022521780 1536531818063-327I 6 gtltXgt 000101090078011730middot75I 2 53 003000069 007-4 0000middot752 bull 019117491100 un7~ ~middotn63 0 bull 358961203lt 2SOO7785 530g76 0amp-00middot712bull D17947840001 000501970 761681011middot12-8 28middot3832 2 583 89160001 0003 271213973267 1100
67
31middot12-8 282bull 01633lt36000100113 65 31middot12-82 28-1533 1217 0046 00042 00213162 303-2722 32~ 29570002103 02 355 m31-12-82 595 275I 2 016815000471005-11-71I 5 middot1573 3871 01461400392111middot11-71I 5 -15lt17
01020195253 0400~7 23middot11-70 6I 2 23019O41ol36498 50 7029615-03-95-148 7I I 6 020lt1585020000010754180531-12-82-162 53 2 01532783000700170852290061-572 31middot12-82I 2 01173697000309751319US52057631middot12-82middot939I 3 22 02171624 0=2039759 5 00026-07-95 652 685middot1360I
0543 00lt450012 00500120 13amp4776middot75 5I 2 01 00290077002100190t18 00223161317-D8-8JI 2 middot75 001800900000020125 003925-75I 2 2701
0172 000500180153 0085647-75I 2 0017602310002 0006 36
0062I 2 -75 01 00170219
0198 0080 0002 0041 0222 0013 0210 00230024I 2 -75 17-08-8J 603
2 -75 01-D6-8J 661 15796 2200 0197 15963 02I 2 -ZU 01-OH2 6 42190007 00114 00067616 01298002 31middot12-82 26 71 00001 865510126 0719 06532 middot369 31middot12-90 561 0160 00010126 0-149 0020middot75 691 392 272 1256
0127 0147 00060117middot75 302 01-06-83 688 1432 73945337210871middot39 15-03-9 amp7 1009
bull 016111570480028n 2915middot1300 1507-72 7 3736 01840721 1239 00124400-515 20-07middot95 797 698272 653 63lt
N KHCOOB( co3 s N03 Po+orttcrpHmiddotAd Ee-llb Ec-VeidDale T pHmiddotLAbFOImalion DepthLocallon Saeo mmolJlW mmmSian mSianmiddotC mm 01843871000500010218 m m
0662976031middot12-82 28 52 -2242Rljsdl(ic 019142197m 00050001009303117616bull 5831-12-822 -3247m2 RISdllk 1483109612263713376528 62
lI20
00015-03-952 -395I7A Mucllake SURALCO 205811309200082578611249613570 I 715-0395middot172 7Mudlake SUAALCO 01488 626302700800bull 8603674 -1140 11middot04middot726f72 Adh 0171300100020011Oln0573493663 5731-12-82 2B 2 middot210RIJsdijk082 031210874000106222655I6n 14753 1975713315 816-0795I 5 -1742BI Bani Park 10265 0000601702918001501375695 88 50627-D695 5 -1772BL1A191 B1auwgrond 020421901041196 440 47856883050$-12-80 5 -1575CIO Zorg en Hoop 01504158000905113163928n61360769529630middot06middot955 middott698ID31V72 lMgtmo 03067520052344070106-12-80 315 middot1575I 22EO Zors en Hoop 001601910000000600001049136 2277 572 middot50IZander1]BS 18432957 4598 0 0800 1301 2Q-(l7-71 54 -1265GMD22 Koewarasan 0434103080199 660055577711-05-71 middot1035IGMD28 Allillnce 01945176 0145110051906723-07middot715 middot1445IGM07 MN 02535230049 100027084 -1265 22-03middot71 5 22IKarnpong BartleGMODl 00072955 031middot12-90 2712 middot143IHighway (5 of Parent HI1B7 0010034700820112 0= 258331middot12middot90 2382 2 -143alrp)f1 Z8nderllHI-2I9O 00040157 00070087 00830182355425t918middot12-96 2972 ~5HoyKreelltHOY 046515963 33229 2147 2436 3818 3530623 760 26-07-95KwallawegHO bull 0051286000036bull 36289355011 176002 721 81I 2002~7KWI Koewarasan
bull _68600 10800324 02450 6557650076-112 20-02middot9 72KWl1 Koewa~~ 096100023_ 0026 800233lO 719 8320 ~OOOmiddot122 82002middotKWI2 Koewa~ 113000020212 000522987middot162 2002~Kbullbull~KWI6 085645900OOOt 085979000 -
bull
bullbull
716 82 6956 -= -172 2002~KWI7 0003 01130 0039 50081700 93716 -192 2002~7IKoewa~KW19 00020002530_ 50075 68762002~7I 0 ~2 72KW3 070900 0085 500~OO 227338712 lI22 2002-KW9 0315517900050931 0003 260
63 0 17-12middot96 28bull 006LV31 - bull 00511918 0183 2S660874110031middott2~ 24t 6013 -7103 0311D-140 Van Hattonweg wesl
bull 1478 00003O28ll1184 11803 745 31middot12-90
252 5
200Ll2I9O Van Hattonweg wesl 00810 739O~25OS middot505 31-12-90 23~ 3lI3 052LlSOD Van Hallonweg wesl
bull 0 005800740423 ~730931-12-90116-11W Van Hall- wes1 5~
i ~ ~ ~ ~ ~_ _ 000
NO ~
M N _ _ _ _ N _ _ _ _ N - _ _ _ _ _ _ _ _ _ _ _ _ _ _ _ _ _ _ _ _
~ - 0~ - 0
I i
I I
N ~ a ~ ~ 000
~ ~ ~ ~ ~ o 0 0
1
shy
nw 1013 T TOIS
T017
T~TOl9 Tourtonne02 T_T023 Tounonne025 T~TOO TOO Tourtonroe Toul101lne I07 Tool1onneTOO nCI9I Tourtonne Tourtonnen191 W02 Tambarecllo 011 Reld WI Zorg ampn Hoop Wmiddotl0 Paranam ParanamwmiddotaA ParanamWmiddot WWcS TambarecrjO 011 fleld Tarrbaredjo oilfieldWWSM
ZOR-GR 20tg en Hoop I 20rg en HoopZORmiddotGR zVImiddotmo V1erklndefen ZVImiddot290 V1erklndetlln 2 ZV1middotmo V1erklnderen ZVSlS7 Mana
Sempltl$ with Inromplete enalyses and eleclro-neutrarity errorgt 10 K8bo0500 gtltaboOW 014000 gtltabo Stolkslusl16 Stolkslusl 216 S10rkslusl16
_ SOlt N03 No KHC03Be I_orpH Ec-VekpH-Fk1 ECgtUbDo~ ~ middotcm 51= 51= 70003550000101 00520461199304730000 middot132 13m-97 25 700 53060000097 003105681821013-lt12-97 00lt0 middot152 725
6370(1058 3180000116920 05500013-02-97 70 middot172 25 32 32-4000 500500131 0056D151601(725 75 0500013-02-970 192
5760299000OCJ4512760 053nOOO75 29980 7791)-02middot970 middot212 25 90 rosOOO0625 0026 011 7145703-4700072513-02-97 28000 23 445032314000370550 002914so3041000725IH12-97 70 middot252 2 3070138000016017120 4379 0079~ 143000B213-02-97 7310
8439 0026 1360000 99052 13600013-CZ-97
0 80 57103350000106 008918390 037942UlOO335303-02-97 7 74203490000067 007518510 1019498000729 7713-02-970 middot82 5380 021882790003272(1 0009 00097029329 7075 -1amp45 17middot12-96 82 OS 0187 80460058 637 0007555 middot1845 138 23631 026600020083 7008920 5600755 858 143703-01-976 middot2990 gt0 5359 1442 0166 5283 023031 7113 05 middot1575 06-12altl 0018050000090149049327720-03middot952 300 0020 middot300 20-0395 69 5 0699 023 0843 001820-03middot95 bullbullbull 0753 0178 0674282middot300 12
10265 0416037371674 1610 4541bull middot1070 24-07middot95 305 697 85 n9 6437 0248 1822 016140657435 middot1555 24-07middot95 301 698 8010 3523 0179070823135 05 15-02middot72 82 600 6785 0281l262lt0 015 003775035 05 31-12-82 31 82
01130011 7916013471652 middot3-43 31-12middot90 236 2008 720 0004 0170 0017000380 0136 00003 0 001middot123 25-08-95 323 6-03 80
0235OOOS 0022 681971 1019 1017 6420 00119 2880 003625-08middot95 321 705 2 middot140 14-04-87 8 130 040025
002B 00292 middot75 OH)6-83 0040 0009 02989 01 00090022 0Dl5 0021 00372 middot75 6 18 0032 01 0021 0005 0087 00042 middot75 0103 0023595 24 370middot872 61111971 0100 20192318 838
20612 625 6111197 5190
2 -437 61111971 17884 1
KSOlt NoN03HC03Be C03crpHmiddotLab pHmiddotFJcI Ec-Ub EcmiddotVeldDale T_Oop4hFormadonw Locallon Sa~ mmom m
51= 51= = mcm 386430()6middot715 -1439Toullul Faul 03322218300070187 00013278If 0705 28 82 50031middot12-82bull middotlflOHaartem 01092914162 0055000100101803250 Oso 872831middot12-822 -470Hear1em162 0169 5528middot02middot32 middot116RepJblIek000 N 0169 519-03middot302 ~6 0104OOOS 1609R_ 0200 82 middot165 2-MalrwoaOlCoropina Cr1172 4915 05370_26555amp41780 73109-12-80 -194MoricoWesl3171 166511005amp4 -79bull 28-07middot711MorkoWest 0102317 065200240451 500 802-08middot722RIJsdlk ~no 0083OBOO0789 09(17middot712 middot199Aljsdljk5 0143 503-02-302 middot157Republleilt600W 070835937 02-Q6712 middot27126
023050890049 6002228 20-07middot71 84 -1329Gronlngen270 -shy88020-07-712Gnnlngn270 01040160 0200 18-D2-r2 159PIamplJe Kondre272 00200739000012105801bull0 ~ 12560527331-12middot902AIISdJjl2185 0155220056 2295200231-12-9C 8 5 50SpoR lVea228 01pound1203471499 22)Bmiddot72 82 middot1002n2 CoIllU 0102 0270 52209001071572 -lt3 26-06middot712817 Do C D13G495~16 67132810 gbull 15-03middot9 5Mudllke SURALCQ 14362bull0052 -237 03-08-71no Tamanrecfto 010 0585soo 005200998 019-04middot712 middot290Rljsdljlo 0076~8961bull09 10138238 85231-12middot90Ri)sdIjII -683168
028 0820 gt00 0270 5807 2 27-09-71Caroline 01014780691600076108-10-712 -490 8DeCran~217 010201300100 0104 01122 22middot10071 53171 Carolina 1700 01048Q511-71 8p 2 0
0~71 0016 00050766 01502 middot75 OS41670W 0127 0593 0479852 7 30-12-71-shy 01G4028 0100016929middot12-71 52Powakra Wesl 00010120 0192483H2middot9C 52 8 PowokkoW 394920-11)70 LllIdlng 9a 1915 -~
_71 3921m1n-7n 8_--
~
__------- --__
----------_
LoogtJJon _don m
Nofth 01 CaIqjna cr 2 2 ~2
Rok I 2 middot133
I 6 2269
landeI1 Malla 2 ~
1~M8llll 2 s bull
Magentll-WampIgedachl C 5 middot1251
I 5 -1251
bullbullIOS2
no 2 -6
BIIllIOfl I 2 middot~s
BerflIn (bronJ 2 -oS
_I I 2 -os
Ca 6 -1975
Republlek 2 -106
I -1335
HlghWlIf ($ 01 Pariill I 2 143
A1rporl~1 2 -243
Tamanredlo I 6 -2760
Highway (S or ParanaJ 2 65
Highway (S 01 P81lln81 2 middot128
Highway (S 01 P81l1na I 2 middot128
Highway (5 01 P818na I 2 middot88
HighWay (5 01 Parana 2 -400
HlghWBy (5 01 Parampfl8 I 2 -273
HIghWay (5 01 Parana 2 2 23
Highway (5 01 ParBn8 bull 2 -60
HIghwaV (5 01 P81arull I 2 -160
Highway (S 01 Paranlll I 2 -178
I 0 -62
Van Hallomweg W~I -1050
Van HslletTlYfeg W8S1 2 3 middot910
Van HallemwuQ West bull 2 -580
Van Hall West S 2 -340
OallJ _ pH-lab FHfkI Ee- o-Veld E
SIan cr
Bf I
COO
HCOOmiddot SOlt
JO-laquot
K
w
MI2
SOOSW 6170
gt71 7m 870
8707 70
m BlL-GR
BVB Bve
C6 CEtmlE
Gl40l1
Hlm7
H1-2I9O
H17 H2I87
H3I87
H3I87
H M7
H4-Sf90
H45I9O
HSn
H HP1187
KW8
Ll001410
Ll0014JO
L10014JO
L1G-4O
10--12-8 ~O
09-10-70
02-08-71
02-D1l-71
31-12-70
01-o7middot9~ 31middot12-70
11middot12-90 08-10-71
15-01middot7 13_10_11
29-lt18-10
ol-07-1J7
31-12middot90
C
29
25
261 287
285
S7
SS
7
S 37
bullbullbullbullbull
502
bull53 7
5 bullbullbullbull s
s
451
7
1011
3S
ISO
SIan
19
23
3290
1= 0lt09
11283 0211
0930
2905
6375
5782
D3O
OS
0138
0096
2905
0169
1974
0600 0141
26300
0401
0592
0600
0959
3404
0
0225
0400
040
040
5140
087
095
08-4
059
0
0
0
4
9
5
2
0199
0199
0199
00459
0400
0390 ~
3196
3900
0550 0390
sooo 0100
0280
7880
0890
1655
0419
0760
0300
39sa
3180
2639
2524
1803
0333
0031
0218
0017
1239
0009
0053
0031
0156
0728
Ol32
0385
0706
0106
0259
15599
0265 0372
0306
0
0003
0006
0035
0008
000l
0040
0027
0001
0000
0000
0037
0002
0007
0001
0001
0001
0004
0069
0003
0366
29 0054
139
0130
39
0521
0061
0080
1 78
0260
1652
24300
2218
204
1000
0542
62800
4175
400 3392
0719
0179
0102
0lot7
0102
0001
0006
0191
0102
0012
0371
0033
0089
0369
L470
0081
0076
007
0025
~g
15-GHI1
31middot12middot90
15-04-87
31middot12middot90
12-05middot87
31middot12-90
31middot12middot91
12(15-87
15-G4middotIP
13-G4-17
20)2-97
3H2-90
3H2middot9(
31middot12middot90
31middot12-90
345
26amp
249
264
263
256
248
246
252
242
751
bull 659
3
bullbullbullbull 455
514
bullbullbull 7
662
65lt
33 618
7
6
3337 00
213
220
272
20 80
100
as
53 8 471
26S
LocallonWO
L16-I9JO
lZ23IO
L24middot251O
12amp-270
L26-27O
shyL7_
e21
R RI9 R2I87 R3187 R7 REP-GA
API187
SllJ87
SU87 Sl3I87
Sl3I87
SOM07 SW3 SWM
SWM
Tolt ZV1l87
ZV1J87
ZVl-2J90
ZV2Ilt1 lI3I87 lI3I87
lt187 ZV6I87 ZVP1187
Vall Hallemweg WfJSl
SBlltlgroo
VallHall~
loollT Ghancl w8ll
loolhls Ghandl w8ll
Van Hanemweg
Van Hallernweo West
Ttumaredjo 011 neld
Aepubllek
Rapubliell
R RllSdlk
R Aepvbllek
R_ Alimalt eN tJI A~I
AaimacI (N of AepuIIll
RaBtoad (N 01 Aeputil
Rair08Cl (N 01 Aetlltil
T8JTampt~ oillielcl Van Haaemweg
L_
-p~
no
- --
sa
2
2
2 I
2 I I
I
bull I I I
3 2 2 I I
I
I
Formalion
J
2
2
2
2
2
2 6
2
2 2 2
2 2
2
2
2
2
2 6
I
2
2
2
2
2 2
2 2
2 2
2 2
Ooplt m middot780
-440
middot390
middot360
middot590
middot617
middot363
-3005
-220
middot220
-365
middot325
-225
OS -325
-130
middot160
middot240
middot240
-2920
~
-29
-180
middot180 -190
middot180
-180
130
-300
-183
Dale Tomp middotC
pHmiddotLab pHmiddotF1dEC-Lab
SIan Ec-Velcl SIan
Cf
m Bf
m~
C03
m~
Heor
mmo S shymmoIIl
N03
m~
04-orth
mmo Nmiddot
m K
m~
31-12-90
031middot12middot90
31-12middot90
248
249
259
56
bullbullbull 619
7 000
37S
3
0169
0959
1156
0557
23n
1704
0142
1436
0397
0218
0004
1000
2000
1000
0200
31-12middot90
31middot12middot90
31-12middot90
231
228
257
639
607
602
163
305
1410
1692
118-4
007
0070
1560
2519
397 0020
0005
000
0001
0001
0004 2044 0056
31-12-90
03-01middot97
249
271
632
72
505
S lt161
266
3903
5lt
ltlUO
0874
31900
0146
0839
8140
003-4
0185
0 0049 0003
0025
0002
0001
28100
0167
0435
0013
2T1 611 S3 03 0138 004lt1 0005 0001 00310 0016
1Il-o~17 6 157 13018
I 1 165 0400
18-12middot96
31-12-82
267
851
S
S3 26 0198
0112
0241
0144
0057
0052
0007 0145
0287 0030
0 26 641 0400 0095 0001 0006 0556 OOSE
13-05-87 6 00 1001
13-05-87 2B03
31-12-90 252 646 29S -7 1nO 0032 0010 1913 0061
13-05-6
19-11-84
31middot12middot90
middot29
2229
20-03~
Zl
bull S
bullbull S
S
0
10
1401
2l6 0338
0220 0818
0163
0390
0513
0105
0124
0301 0001
2101-44
2392
0100
0071
7 6 as 0400
Jlmiddot12-91 26 S 0= 1737
31middot12middot91 31-12middot91
0amplt17-8
I
I
26
29
Sshy
bull 541
bullbullbull
60
66
9S
70
0338 0400
0536
0amp00
0400 0lt00
0=
0380
0=
0213
391 0024
0001
0595
03lt7
0
0017
00Zl
006
obull
H wmiddot
E~ ~~~~~~~~~~~~ij~~~i~~~~ci~~~j N IN N - N N - N N ~ N N N N ~ - _ ~ ~ N N N N N_
-l-------------------------shyl---I-lt----------------1
i
ij o
o
~~ ~~~~~~~~~~~~~~~~~~~~~~~~ w
8~ ~~~ m ~ ~ cIn i--~----~middot-----~-~-------~~-~i-~middotd---------middot~--~-j
ii ~---------------sect--~ --sect----sect---1
bull ~Oi____=___CN___-__O~ -O_-Olli~~~~~~~~~~~~~~~ ~~ ~ ~ ~~ ~ ~ 11]~~~~~~~~~~~~~~~~~~~~~~~ ~
~u LS ~-llmiddotcuE5No0-ogmiddot-~o~oC~~o-gOoo~ middot-~middot~Clt~~~o~~-~middotli~gt ~~ -middoto-c~middot--middot~~c middot~o~o1I~~iccic 0 oooo~ci-_oo_oo~_ci~o
~~~~~~~~~~~~~~~~3~~~~~~~~~~~~o E oS 0
-~---------~~-~~~~--~~___1
inuuun
-
~1~~~~sect~9~~~~~~~~~~~~~~~~~sect~~S~
81
p ~ - 1
~ o
sect
8
llUiHiH888 coo 0 ci 0 ci ci ci ci
IRO
bulliii I ~ 0 0 D
M
~ ~ M ~ - 0
~
-~ bull~
~
~ ~ ~ ~ ~ ~ ~ ~ ~
~m m m - 0 ~ ~ bull D~ ~ ~ ~ ~ M ~ ~bullo
0 ~ ~ ~bull il middot ~ ~ ~ ~ M ~ ~ M ~ ~ ~ M ~ ~ ~ ~ ~
0 N N 0 ~ ~ ~ ~ ~ bull bullM ~ ~ =0 N 0 ~ ~ M bull N ~ ~ ~ ~ 5 ~ ~ ~ M bull ~ ~bull M 0 M
~ ~ ~ ~ re ~ ~ ~ ~ M ~ 3 M ~ ~ ~ ~ bull ~ ~ ~ bull ~ ~ ~ ~ bull ~ ~ ~ bull ~ ~ ~ ~ ~ ~
g ~~ N N
~ ~ ~ ~ ~ ~ ~ ~ ~ ~ ~ 1l ~ ~ 5~ ~ middot ci g~ ~ ~ bull ~ ~ ~ ~ ~ ~ ~
k~
U oJ
Iu ~p 1-
oJbull
~oJ
~ oJbull
~ ~ Sigt ~ ~ M
~
en~ ~
W
~ 1bull~ ~ re ~ ~~ bull bull bull bull
~
1 bull l ~ ~ ~U ~ S~~
~ ~ ~ ~H - bull
M
~ - -~
~
81~ ~ ~ m 0 0
~ ~tH ~ D ~
Q ci0
1~ ~ bull sect ~ ~
z 0 0
~ 1 ~ gQlt
~ 1N 8 ~~ ~ M
~ ~bull 0 0 0 D 0 ~
bull1re e ~ ~I 0 0 ~ Dbull 0 D -
~l
~l m-~ ~ ~ ~ 0 ~
~D 0
~l ~
~ ~ ~
~ ~B0 - D 0
bullbull N N N
~ ~ ~ ~ ~
bull ~ ~ bull ~ lt ~ ~ sect ~ ~ i ~ ~ ~ ~ ~ 0 ~ ~ ~ ~ ~ ~ 0 M M ~ ~bull - - N -0 bull bull N shy~ ~ ~ 5sect0 0
N N ~~ ~ ~ M 0 ~ 0
g ~ 5 ~ ~
0 0 ~
0 ~
0 ~
00
0 ~ ~
0 MO
bull N sect ~~
~
~ g ~
~
Q 0 0 ~ ~ ~ 0 0 ~ ~ Q ~ ~ ~ 0
M sect 8 ~ ~ ~ ~ ~ ~ ~ ~ ~ 0 0 ~ 0 0 0 ~ D D 0 ~ ~ 0
M ~ M ~ N 0 0
0~ sect ~ bull 8 0 ~ ~ ~ sect M~ 0 0 0 ~ D ~ 0 0 ~ ~ 0 0 0 0 ~
g~ ~ bull ~ igt ~ ~ ~ ~ ~ ~11 ~ ~ ~ ~ middot~ ~ ~ 0 0 0 0 ~ 0 ~ 0 0 0 ~ 0 ~ ~ ~ 0 0 ci ~ ~ ~
~~ ~ ~ ~ 0 0 D ~ ~ 0 0
~ M 8 ~ 0 8~~ ~ ~ ~ ~ ~ ~ m ~ bull ~ ~ N 0 D ~ 0 0 ~ ~ ~ ~ ~ ~ ~ ~ -- 0 ~ ~
N g ~ S 8 g bull bull ~ ~ ~ ~ M ~ ~ i ~ middot Bsect ~ middot B M ~ ~ 0 0 D 0 ci middot 0 D ~ D 0 0 0 bull m - ~ ~- =N
N ~ re N ~ 0 c c c c ~ gt ~
bull~ e0 ~ ~ ~ ~ ~ 0iii 0 U 0
M W w ~ ~ ~ ~ i i ~ ~ ~ ~ ~ ~ ~ ~
~ M
~ g
~ ~
middot ~
N ~ M
N N ~ ~ M
~ bull~ ~- M~ ~ ~ M
~ ~ re N
~ Em ~- bull ~ N Me bull 0
~ ~ ~ ~ ~ - ~ ~ M
middot ~ ~ ~ - ~0 N M
sect N
shy0 Nbull ~ ~ ~ ~-
~ ~ ~ M ~ ~ ~
0 D 0 0 ~
lt e ~ ~ ~ D ~ 0 ~ ~
~ ~ 0 0
N ~bullmiddot S ~ ~ middot~ ~ ~ D 0 0 0
~ s~ 0 0 ~ ~ 0 ~ D 0 0 0
~ ~ ~ 0
~ ~ bull8 ~ bull D ~ ~ ~ ~
bullmiddot ~ ~ ~ ~ ~5 0 D 0 0 D
~ ~ ~ ~ ~ ~ ~
i
W
5
cr
029
Mgbull
0651
fOlt~
0
Mnmiddotlo
0001
01 0002
NH4
0033
SlO2 0260
CO2
TIC-CoJ
5687
DAnlons
11536
E-Ka
~ 10amp49
E_
251
0 middot292
-14o
0 middotc -1284 0
H
TU
SftCl Sr~r
SINI-GR 1097 0209 0030 0136 ~763 3047 3139 -149
SlNlI-GR 1172 0 0019 0113 2749 3047 3437 -601
SOMOl SOMOI
SOMOI
1amp48 1212
1020
893 00 1130 0022
Cl002
0003 0002
0001
0D18
0099
0292
0325
9405
11507
129
60144
49106
44478
60414
45D~
38915
~22
26
006
middot~90
-263
-126
-130
-019
061 0 1317
SCM02 1322 -23lt 10128 098 46086 335
SCM 222 0905 9595 30524 33511 0175
SOMl)4 SC_
0823 1247
1769
1563
0001 9508 12260
44289
46696
51119
42592
-716
460
5005 0149 1399 8561 42853 352llJ 969
SOMOS 1746 2181 0001 10287 58808 62227 -282
SOMOS 0873 2057 9557 56- 58056 -158
SCMOO 0199 2016 6161 18691 16652 5n
5010410 aU9 135El 9934 41393 34375 02 SOMll 022 1563 10532 48078 41199 771
5010412 1422 1152 9amp42 35096 40467 -711
501413 1347 1316 0001 un 42970 46345 -378
501418 0748 1028 7635 16936 17166 -087
501416 0623 0823 10032 18695 15375 974
SOMI8 1197 1563 9835 40029 44188 ~ 50M22 0249 1975 8535 23361 20193 727
SOMmiddotWl 0773 2345 8149 18135 17371 215
SWM 0399 0617 0266 2604 117
flA 0299 0823 0059 2090 1792 10574 10697 058
T2C9 0653 2810 0553 0029 0001 0053 0908 2207 5170 14979 0 middot271 middot153 -1863 1t8 -1255 070964
T31 0324 0699 0075 0181 0389 9927 8850 574
TAOS 2669 3209 13531 919ZJ 265 435 TAM1-GA 1447 037 0010 015 03 4164 4897 809
TAMU-GA 222 090 0005 0136 2510 4074 467B -691
TLE5
TOI
TOil
0988
1739
0743
2230
22400
49300
0031
0045
1187
0063
0021
0016
0063
0005
0001
0071
0063
0072
0379
6019
0232
0 0425
0339
20644
19787
16591
187388
478511
17382
185067
481407
233
0 -030
middot298
-198
11 5
-12B
-142
~3
middot2042
-2254
207
070929
070918
W
T013
T015
T017
T019
TOO
TO T025 TOO
T05
TO TOO TI4191
TT W02
ctshym~
06n
0690
0654
1269
1129
1489
1209 1589
1519
0B71
1139
0267
0279
0131
Mlt m -t7600
41800
39900
37-200 36100
35700
31600
15300
13300
40Boo
46000
0496
0440
0526
Fe-tO
- -shy00-t9 00laquo
0063 0072
0049 0044
0053 0073
0042 0049
0048 0081
0426 0357
0025 0032
0024 0061
OMB 035
0051 0055
000lt 0001
0007 0001
Mnmiddotlo
m~
0005
OOO-t
0005
0036
000lt
0006
0005
0008
0001
Nmiddotlol
m~
0054
0067
0079
0047
0070
0046
0173
0D48
042
0068
0064
0004 0001
0010
NH4
m~
6300
4779
6739
6539
7879
8939
2109
2250
51~9
6059
006
0054 0104
5102
m~
0725
1040
0472
0273
OAI20
4390
0339
0291
0556
0653
0233
0
Co2-- TICmiddotCaI
m
20248
18438
18105
15543
12745
14886
14054
16241
18608
as3 5 5392
20lt
tmiddotAnO1s m~_
493953
462443
468179
422269
393363
36284
356609
168957
152926
445254
518615
9936
10675
14amp46
tmiddotKalJons
m
-tamp4952
401891
412)15
413073
387195
391259
402933
177(l~
172136
429471
456883
10092
9725
133130
E=I
302
701
613
10
079
middot377
middot610
middot233
middot591
IBO 633
-018
466
449
0 middot092
middot102
middot102
096
-103
middot133
-114
-125
middot127
-131
-228
middot271
middot)01
middot252
H ~
middot76
-76
middot35
middot63
middot97 ~
-80
_114
middot66
-127
-157
middot159
-152
c c Yo(pmcJ
middot660 $26
middot271 435
-ZO25 916
-259 665
1474 528
middot1752 39
963
H TU
sCI 00685
0101
0192
0196
-0163
035
-1131
SrSr
070917
070919
070916
070915
070922
070921
070925
070920
0109201
070919
0709371
WI 0174 0576 0057 0250 1695 7133 7107 018
W-10 0012 0045 0003 0003 0192 1736 0651 0038 LOI
W3A W-ltA
WWCS
0011
001
0341
0049
0039
2231
000lt 0006
0021 0015
0003
0003
0001 0 5
0231 0253
0908
4319
5151
5868
0936
0931
18440
0791
0802
16252
840
631 middot30t -137 1866 bullbull 0
wws 0351 05gt0 0103 0002 0001 0063 0694 -858 9n6 8725 5 middot284 -118 1729 5
ZOR-GR 0249 0 0035 0007 3403 5= 6012 -697
ZOR-GA ZVl2J90
ZV1-2J90
0324
023 0272
0854
0266
0011
0175
0023
0033
0009 0012
0007
0002
0031
000lt
0164
0817
0173
1613
0909
2739
2095
1791
9092 0B15
9612
-200
0833
-381
oJHI
middot109 -324 180 middot1116 1043
ZVl-2J90
ZV 0610 -00 0098
0214
0021 0076 0658 3251 9380 0400
9JH 0428
018
middot338
-279 145 -1299 467 035
~ willi IncompIeIIll ana)ys8S and e1ecl1O-OOUlJailtl enor gt 10 shy
011500 0006 0014 0057 0001 0055 0026 0356 0267 1427
W 0017 0012 0007 0001 0015 0001 0104 0133 -1224
01laquo100 0006 000 0002 0002 0089 0174 0125 10
~ 0 2757 0017 0020 8369 13662 middot2-t11 28-0 3
~ 0000
~ 10000
~
bull bull
ltbull
~ e~
~ ~ ~ ~ ~ c C N c
~ e 0
~
1 ~ II ~ ~ ~ ~ ~
~~~~~~~~~~~~~~~~~~~~88gsect~sect~ ~C~sect~~~~I~~~~88
~H~~~~5 ~ ~ l~_ll Hlii~l1H ~~ ~ ~ ~ori~ l1on~NOCOl100
~5~~Uil~ ~ ~ ~~~~ ~~~~n~n o0055 c I Q~ ~~ _IJOlDOlllgCl
~~ ~ H ~sect ~
~
~ n
liC ~o c
~ 1c
~ ~ u H 2~~ f8 ~ ~ c c c ccc c
~~~ ij amp C~--B~ ~~ ~ _ c
~o~oo000 0000 c c c
U~~H e ~ ~ ~~ll~~~ liiJf3 h~8-e1IQ~ OOClClON c OQClClOCJ 00 I) 0 0 oood
~5HU ~ ~
~ 5~i~i ~altamplmiddot ~ ~ ~ ~ -~ ~
cicocia II - (oj qOClOOOO C C OlJOO o 0 0 ci
zw 3 ~
~~~sectsect~~~~~~OC~~~~~ c_~~~~~~~~-oc-----~----- ~~ ~~~ ~~ sect~~
~=~hH~~
B qshy
F pI b ft~
iP~-1
il II ~l ~l ~l
il n II H ~l l ~l
I
1gt il ~
c
~ 0
- -~ d F ~ pi I
p ~ II ~
- ~
ft~ ~ ~ ll bull
~ ~ ~
Ie~ ~8 ~ ~ ~ ~ 1 ~ ~ ~ ~ ~ ~ ~
1rrin ~~ ~ ~ ~ ~ ~ ~ ~ i ~ ~ ~ ~ secti ~ ~= ~ a~ ~ ~~~ ~
11 ~ B ~ ~ ~ h ( ~ ~ ~ ~ ~ s ~Ta n ~ ~ secti H ~ ~ cioo~2 __ cid~ei o_~ei ci O_OOOO~lD~
UIU g~ ~ ~ ~ ~ ~~ ~~ ~ fn ~ ~ ~ ~ _c
n ~l 3 ~ ii ~ H~
~l R ~ ~ -~ ~
~~~~ c c c d d
H ~ ~ ~~ h l 1 c cc c
n ij H l ~ c c c c
It ~ BB ij Hun as_ q q
c ccc
HIB --~H--U~~ pH~n-~~~~-B~~ci~~~~oo~o o~ooooo~~~oo~o~oo
il l ~ c
l ~1 ~ ~ ~~8~~ ~ $ 8 1 ~~~~q
_ c - c c c 000000 oltiooc
~l BI
~ ~ F~H~ ~~ ~ 81 ~5 ~un d~ O~~OCl~ cc c cc 0_ 0 0 c
w~ ii ss~ ~ ~~~sect~~i~~~~~~~i~i~iili ij~~~~1
00 00
W CO nmolo1
__ rrmtI0llmlll1it rmd1 rrmoIt1
NH4
rnt1lOIM
SlO2
ImdII
CO2 TlltgtCoJ IIWllOlo1 ~
rIIIIOI4
rrmoL1
0
lW
C
c (pmC
H TU
C1 lW
L18-1Ml 2A95 21amp4 O1lSC1 O~ D1U 0257 t272 1010 11024 -8321 -254 -10 48
l22- bull bull 1173 U bull 208 51 L24-2SG 0379 OA93 0J)49 0001 004 0121 2068 3654 ~ 11A5
L26-27JQ
13-490
bull 024
0369
009 0128
O2Z
11 0100
0090
~ 0178
OOO
003 0021
0023
1531
0033 3568
52n 2~
1331
3~
5167
middot148
zS 435 -995 283
l7-amp90 D28 0369 009 OOO 0034 0527 27Z1 2083 t$ 461 021 094 O~75 001 ooot 0001 001 D3E O27i 40~ 30511 121 258 _141 13
RU 000 o~ 0D8 0000 000 oon 0133 028 OM middot249C -2391 Rt 001 0040 0016 aDIM 0001 O04e 041 0433 0631 middot1860 RM1 0769 0023 1301 1584 7830
117 28lt 003 bullbull bull 57 middot102lt R7 000l 0024 001 0012 0008 0560 023 405 -262 -136 -2040 U57 28
REP-GR 0034 0041 0033 ~002 0104 G84O 0380 ~~ middot95 PlIO bullbullr bull11 151 St7 0035 0001 l(101 o~n 885E ~ ~la~ ~ ~ ~ SLva7 0239 Oe13 0-09i 001 0019 0282 3131 3917 -1115 middot295 middot129
SL3I87 0112 0003 1401 0230 7180
S0M01 OM 081 0003 1101 24380 middot2871 SW3 0219 0079 0006 0007 0059 1~ 1zJ9 07H 2amp1 -301
SWN 33lt 220 bull or ~ SWN 02 549 32m HI 0181 un 02i4 0006 000 14r -U7 -488t
ZV1187 0021 0400 OQC~ 8100
ZV1187 001 001 0031 0005 f99C 0148 861 ZV1middot2I9O 0029 0088 0031 0027 U78 1712 332C 1~ 524
ll2fI1 0035 000 0070 7021 rri3I87 0029 0029 0019 0014 0n4 0552 167 -311 01
ZVJIe1 0034 0600 0068 79amp4 ri4l87 0069 0400 0178 3UI
ZV6l81 0008 0-400 0018 9231 ZVP187 OM 0012 001 0D04 14T 0413 0284 1851
____~_ i_ _
w
ZVPlf87
15172 ISOOW
cr I So shy M mmolII mmolII shy mmolII mmolII
0013 0018 --shy N
SI02
mmolII
00
CO2 TlC-Coo U- mmolII mmolII mmolII 79lt
shylt
SO
0 ~ -260 ~
~H 0 c
H TU
- 5 11
~Cl ISlt
1B172 middot270 9
~ - middot270 11
21112 middot219 13
3182 middot245 -1302 53
3I81l 3191
~ middot13 53 115
I iOI7l AU-G SIL-GR2 all-GR2 GMD-19
joMo-1ltW7L1 lOMlOP
30
~ ~so ~30 ~ -374 254
~-30
_184
-10~
- middot1270
-111amp -2197
57~
95
2U
bull
os
4A
1
P REP-GR
~20
~20
35 35
REPmiddotTOT REPmiddotTOT SW
~30 10amp
101
3 I
shy
Annex IV
Plant species and photosynthetic pathways in the savannah belt oj Suriname
Species Fuuily Salannah Photos Type pUlhwny
PaSI(flfllll puJclJellum Palkml micralllJwlII ulgelOCarpus tremllills
bull RllyllcllOspora gramillue RIlYIlcJwsp01ll wIlis Pepawl1llls polyridlOiaes Sderia pyramidalis Abolhoda ameriClillo Xyris glfilllltmss TmchypogOlI pllf11l0SIIS Bulhostylis cOlliem Xyris slrillCmenss Lllgenactplfs weigeltii Mesosellllll loliiforme 8ulborrisllSCiculllta Mill(clirplIs di~(olor
Amlloplls pulcher Hypogonilf1l ljrglllwII PlllieUIII Jftllodaides AXOIIOI1llr drsiles LepIOCOI)PlliwlI IllllCllllIII PllIIClIllIllenogtfllII RlrYllduupoll globml Mcmsellll1l (lIelllltll~e
bull
RIlYlldwslmltl blllI)(1lI SllgOIICIIIIIIIU lImellallls Palklllll polymlllllll COllwlill lemCOSll
AXlIIwplIsflahellifol7llis PUicUIII nflt~ei
TlmuWI pelmsll Sp(II(Jlwllmiddot (Ilhellli~
Bulboslylis jlllldfomi~middot
PoaccOie Poaceae Cyperllceae Cypemceae CyperilceOie Eriocaulaceile Cyperaceae Xyridaceae Xyridaceae Poaceae Cypemceae Xyriduceae Cyperaceae POllceae Cypemceae Rubiaceae Poaceae Poaceae POilceile Pouceue PoaceOle POOlceOle CyperOlceOle POOlceue CyperOlceOle EriocltlulceOle Poceae Melstomuuceu Puceae Pouceue Pmleeue Pouceae Cypemceuc
Zan Zan Zan ( Kus) Zun Zan Zun Kils Zan Zun Kus Coe Zan Kas Coe Zun Kus Kas Zan Kas Kas Kas Wei Coe Wei Wei Wei Zan Kas Wei Coe Zun Wei Coo Zan Wei Coe Zan Zun Zun KOlS Coo Coo Coo Coo
C4 C4 C4 C4 non-C4 1 C4 C4 C4 C4 C3 C4 C4 C4 C4 C4 C4 C4 C4 C4 non-C4 C4 non-C4 C4 C4 C4 C4 C4
Bulluwylh ((Ipillli~ vOIr rellilifoli Cyperlceae Coo C4 DtniIIl1 CUpall Dillcnicee Kus non-C4
Table IV1 Species of the open svltlnnhs
Species FUlllily SaVlllllmiddotiIh Phottls typc- patlnvay
Lkana lcana Chrysohilanlcca~ Km Zan Chlsia fockfcmu Clusiaecle Zan I Ka~l
HImiria halwlllicmiddotm var Imlmlllifenl HUllliriltell~ Kas Zm Humiria hafamiJimiddot( arj1oli1mJlda HUllliriltltel~ Kas Ternslmemia plcrata Th~aeeae Kas Zan Swarrzia Jmma Lcgum-CacsalpinioidclIc Kas Dinorphantlra conjllgata Lcgum-Cacgtnlpininidcac Ku Retiniphyllum sdwmlmrRkii Ruhimcac Zan Marayha opma Sapimlllcll Kas MIrcia sylvutica Myrtaccae KH~
Bactris campeHrir J11Inmc 2m Conollorpha maRlwliifolic Myrsinaecac Zan KilS
Ormasia co~lIIlotcl Lcgum-PapililllltlidcilC Zan 1ibollehina Uflfro Mclaslolllataccc WclCoc Imperata hrasiliellsis Ponccae Cae Byrsollma eoccoloblfillia Malpighiaeeae Cue Byrsoltima Imiddoterbmdfolio Malpighimcae CDC-
Scleria pymmhlalis Cypemceac Zan Sclerin braetellta Cypcraccltlc Coe Marliera mOllana Myrlaceac Zan Cfratella americana-----_---- shy Dillcliaeeae Wcl Coe
Table IV2 Specics of savannah buhes
Species Fmnily Photos pnlhw~y
CIIIsn ffJckeana Clusiaceae non-C4 Humirj balsamifera Hurniriaceae Somia ballnia Legum~Cnesalpinioideae C3 llex maJ1inialla Aqllifolimenl~ CJ Oeatea scllombllrgkano LlUraceae Dimorplrandra eOlljtl~acl Lcgurn-Caesalpinioideae non-C4 lsertia aneeps Ruhiaeclle C3 Ueania divaricato ChryS(lMlanuceae PlOtium lIeplaphyUm Burseraceae C3 Tapirora guiallensr Anncardiaceac CJ AspidogtpcrlllCl magraviamm ApoeYllltleeae CJ ltlnd CAM n(Jmbaxj1a~if1orllln Bornhaeaeeae C3 Matayba opaea Sltlpindaccn~ non-C4 lieania illeana Chrysobalamllllt1c Conomarpha muglloliifolio Myrsinneeae non-C4
~~~ierea mo~~~ _ Myrlat~~ ~__ __~~ _
Pdble IV3 Species of dryland forcsl
Legend Zan = Savannahs of Zandcrij type (poorly drained white sand savannnhs) Kas = Savannahs of K3siporn type (extrcrnCly well drained white snnd savmnnhs) Coe = Savannahs of Cocscwijne type (well drained brown loamy sand to sandy loam S8-annahs) Wei = Savnnnahs u( Welgclen type (well draincd clay savannahs) Spe~ies are based on studies of H~yligcrs (1963) Votn DOllsclanr (1965) and JanSllll (1994) Photosynthetic pathways are derived form dalahases of Dallwit7 (1980) Dallwitz et al (1993) and onward and Ehleringcr et al (1997)
Inll-C-~ D o o nnn-C4 CJ o non-C4 (]
111l-C4 (4 llo11-C4 norimiddotC4
192

c e
r
l
-----------------
Photograph from tover COlTyenne and Joshua children of the aUlhor playing at the beach in Katwijk The Netherlands
Thi siudy is carried oUl at the Facully of Earth- and Lif~ Sciences of the Yrije Universiteit AmSlerdam Parl of thc study is ltI contribution to the NEESDI program funded by the Netherlands 01ganisatioll for Scientific Research (NWOl
Th~ rllil text 01 this Ihesb is availabl~ 1 hnplwwwgeovunlgrolJ
of Groln Jarohll~
The dfeels of Imnsgressions and regressions on coaslal and offshore groundwater A case study or Surinlme and gen~ric studies into groundwater noY systems salinity patterns and paleogroundwater - Doctoral Thesis Yrije Universiteit Amsterdam - With ref - With sumshymary ill Dutch
ISBN 90-9016 1-9
Subi~ct headings hydrology groundwaler I coastal plain I regression I transgression I paleshyogroundwaler I solute transport I hydrogeochemistry I isotope hydrology I groundwater salinity I ~ubmarine groundwater I Suriname I South America
Printed by PrintPanners Ipskamp Enschede The Netherlands
VRIJE UNIVERSITEIT
The Effects of Transgressions and Regressions on
Coastal and Offshore Groundwater
A case study of Suriname and generic studies of groundwater flow systems salinity patterns and paleogroundwater
ACADEMISCH PROEFSCHRIFf
ter verkrijging van de graad van doctor aan de Vrije Universiteit Amsterdam_
op gezag van de rector magnificus profdr T_ Sminia
in het openbaar te verdedigen ten overstaan van de promotiecommissie
van de faculteit der Aard- en Levenswetenschappen op dinsdag 8 oktober 2002 om J545 uur
in de aula van de universiteit De Boelelaan 1105
door
jacobus Groen
geboren te Katwijk aan Zee l
promotor profdr JJ de Vries copromotor dr H Kooi
Soli Deo Gloria
Contents
Voorwoord v
Samenatting vii
1 Introduction 11 Background I 12 Objective and scope of the sLudy I 13 StrucLure oflhe Lhesis 2
2 Some concepts and definitions related to coastal hydrogeology 21 Groundwater origin and salinity 5 22 Flow systems 5 23 FreshsLiline interface 6 24 Paleogroundwater 7
Parr I ClISt Slud of(palto)grmmdwatel ill the coastd plin alld cOlltinellwl shelf of Sfriname
3 Hydrology of the coastal plain and continental shelf of Suriname 31 Introduction II
Climale 12 12 Landscape 13 33 Geology
341 Geleral 342 Cretaeolfs and Teniar) 143 Qllaterl1al
35 Runoff and recharge 351 The sapanlah belt 352 Tilt (oostal plain
36 Groundwater 361 Aqllijerf and aqUitards 362 Groundllater saillit
14 14 18 19
20 20 21 22
22 22
363 Grmmdwoter floll systems ill rile Tertiary fonllariols 24 364 GrofldIater recoel) 26
37 Conclusions 27
4 Freshening of the coastal and offshore sediments during the Wisconsinan regresshysion a reconstruction of paleogeography and groundwater flow systems 41 Introduction 29 42 Paleogeography of the Suriname coastal plain 30
421 Sea lelel and coastliles 30 422 Topogropl- 31 423 Vegetation 31
J
r1 424 Clinlate 31 425 Hydrology during tlle Last Glacial Maximum 32
43 Paleohydrological modelling 33 431 Itroduction 33 432 Recent and sltb~reellt modelling 34 433 Modeling Ihe paleohydrology of the Lae Glacial Maximum 35
44 Discussion and conclusions 37
5 Salinization of the coastal and offshore sediments during the Holocene transgresshysion a study of diffusive solute transport 51 Introduction 52 Dal 53 Solute Lrangt~n and fractionalion
531 DOIllrard cOnlectile solute tranfwr 532 DifjUfioll 533 Diffusioll coefficients
39 40 42 42
42 43
534 FractiOlwricm ofchlorine isotopes by diffusive transport 44 535 Diffusioll-sedimentation model simllialillg transgression folltJwed
by regresitJlI 45 54 Rcsults 46
541 DfJ)wlvard diffusiol 46 542 Upward transport ofsaJine and brackish groundwater 50
55 Discussion and conclusions 51
6 Hydrogeochemical signals of the hydrology and paleohydrologJ in the coastal plain of Suriname 61 Introduction 53 62 Data 54 63 Hydrogeochemical evolution of meteoric groundwater in the coastal plain 55
63 J Rainfall and elapotranspiration 55 632 Dissolution ofcarbon ill the soil olle 56 633 Mineral dissoilltioll 57 634 Redox processef 59
64 Cation eJichange and freshening in the Pleistocene clays during the Wisconsinan regression 59 641 ltlT1ducTion 59 642 Obsenatiols 61 643 Cation-exchutlge simulations 61
65 Calion exchange and salinization in the Quaternary and Tertiary formations during the Holocene transgression ~ 64 65 J JtroductioJJ 64 652 Obsenalio1Js 64 653 CaTiorl-excJlallge simulatians 67
66 Discussion and conclusions 68
ii
I 7 Isotopic signals of the hydrology and paleohydrology in the coastal plain of Suriname 71 Introduction 73 72 Data 73
721 New QllalJfS 73 722 Al1alyses from existing isotope studies 74
7J Identification of hydrogeochtmical processes and paleovegetalion with 13 JJC of dissolved inorganic carbon 75 73 Introduction 75 732 Relulls 76
74 Groundwater dating with I~C of dissolved inorganic carbon and gtH of groundlmiddotuter 78shy741 Inrrodu(lioll 78 742 Resuils 80
bull 75 ReconMruction of paleodmute with stable 5ltlQ und 52H isotopes in rclinfall and groundwater 83
751 11Itroduclion 83 752 Resultf 84
76 Discussion and conclusiom 87
forr II Gellui( illlestigali(lIIs inlO he origin ofoffshorc meteoric groundater
8 Worldwide observations of offshore meteoric groundwater 81 Introduction 91 82 Submarine discharge 9
821 Sublllarille springs 92 822 Difuie mbl1larill( discharge 92
83 Meteoric groundwater in offshore boreholes 93 831 Nantucket islalld (USA) -Atlantic Ocean 93 832 New Jersey and MCl1)lalld (USA) - Atlantic Ocea 97 833 Georgia (USA) -Atlantic Oceall 97 834 Georgia (USA) -Arlalltic Ocean 99 835 Part Harroun (Nigeria) - Atlamic Oceall 99 836 IJmuidell (Netherlallds) Nonh Sea 99 837 Sballghai (Chita) - Cbjllese Sea 99
84 Discussion and conclusions 99
CI Prediction of the offshore continuation of eoastal groundwater now systems 91 Introduction 101 92 The New Approximate Model 101 93 Results 105 94 Discussion and conclusions 110
r 10 Flow and salt transport in submarine meteoric groundwater in steady-state and
transient systems 101 Introduction 113 102 Experimental setup 113
021 Nunlerical code 113 022 Discretizatioll 114 023 Models and bounda1) cotlditiolls 115
103 Results 119 1031 Model I staliollary Jubmarille groutdwaler alld wwe
rranspon 119 1032 Model 2 submurhle groundwaler and solwe rrUlUpon during
transgressillg over a flut seaward sloping fOlldsurface 122 1033 Model 3 submarine groulJdwater alld solule lTUllspOn during
transgression (wer a disJected lund surfuce 126 104 Discussion and conclusions 130
11 Summary and conclusions 135
References 143
Annexes I Sediments and aquifers in the Suriname coastal plain 157 II Map of the Suriname coaslBl plain around Paramaribo with sampled wells 163 m Chemical and iS010pic analyses of groundwater in the Suriname coastal plain 167 IV Plant species and photosynthetic pathways in savannah belt of Suriname 191
iv iii
Voorwoord Wuarom en hoe is dit proefschriFt lot stand gekomen Een goed antwoord zou een
ware biografie vereisen omdaL dil werk het resultaat is van een lange keten van gebeuneni~shysen en ontmoetingen ver leruggaand in de iijd hier en daar wat bewuste keuzes wat Qvershytuigingskrachl un anderen maar vooral toevallige mogelijkheden en onmogelijkheden Oil maakt dal ik nu in vrolijke verwondering en dankbaarheid ornzie Ik wil daarom beginnen Olll mijn ouder Corrie en Huig Groen Ie bedanken voar hun uanhoudende steun In mijn j~ugd slimuleerden zij en ook anderen zoals wijlen opa Groen en meester Varkevisser mijn lcergierigheid en lieten mij - londer dat ik het besefle - afdwulen van een bijna voorbeshystcmd lewn als visser
Nu mijn siudie hydrologie aan de VU in Amsterdam (1971101 19MO) heb ik gcwcrkt bij hel adviesbureau IWACO (1980-1994) zowel in Nederland als het verre builenshyland D~i~ period~s waren naluurlijk oak van grote invloed De mensen en belevenissen uj( die periodes draag ik met me mee en maken me to wal ik ben
Pas in 1994 kreeg ik de kans om bij de universiteil Ie gaan werken Ik dank daarom mijll promOlor prof Co de Vries voor zijn venrouwen loen hij mij - all wetenschappelijke outsider - aantrok bij de vakgroep hydralogie en stimuleerde tot dil promotieonderzoek Na lang denken over een geschikL onderverp begon ik in de zomer van 1995 met het onderzoek in Suriname waar ik al eerder als consuhant had gewerkl Afgezien van mooie en intrigerenshyde hydrologische gegevens UiL dat land had ik inmiddels een minstens zo mooie en inlrigeshyrelld~ Surinaamse vrouw De mOlieven waren dus niet zuiver wetenschappelijk Maar zijn ze dat noit
Terugkijkend op de periode van de promotiesludie ben ik vooral veel dank vershyschuldigd aan Henk Kooi mijn copromotor Oat geldt voar zijn kriLische geest hel werk aan de modelexperimenlen maar vooral VOor het aanslekelijke enthousiasme in onze discussies daL voorldurend nieuwe wegen opende Henk lalen we zo doorgaan Ook de hulp van stushydenlen middels hun afstudeeronderzoeken was onmisbaar Ik denk dan aan Jouke Velstra voor fijll kanering van de zoulgehaltes van het grondwater zijn hulp in Suriname en de geochemische en isolopenanalyses aan Vineent Post voor de berekeningen met hel grandshywatermodel aan Tibor Stigter voar het yerzamelem en interpreteren van de hydrogeochemishysche gegevens en aan Kyrian van Vliet voor het uilvoeren en interpreteren van isotopenanashylyses Jongens bedankt zcker ook voor de gezelligheid Dank gaat ook Uil naar VU collegashys voor hulp bij berekeningen literatuuranderzoek lekslcorrecties en logistieke ondersteushyning mel name Antoon Meesters Ersin Seyhan Sampurno Bruynzeel Kick Hemker Michel Groen Vincent Post Boris van Breukelen Ian Simmers en Tony Appclo
Zander hulp uil Suriname zou hel ook niet zo vcr zijn gekomen In de eersle plaals dank ik Theo Goedhan directeur van de Surinaamsche Waterleidingmaalschappij (SWM) die mij op aile mogelijke manieren logistiek heef[ ondersteund bij het veldwerk het verzashymelen van gegevens en met introducties bij andere organisaties Je hoon gewoon bij de SWMmiddotmiddot zei hij laats En zo is het Gedurende mijn vele bezoeken sinds 1990 ben ik me thuis gaan voelen daar aan de GravenStraal in Paramaribo Die dank geld oak voor andere SWMers zoals Rudy Pawiro Anand Gobind en Carolien Ligeon Ook de Djenst Watervoorziening in Suriname ben ik dank verschuldigd in de personen van de heer Tsai Meu Chong de wandelende database van de waterboringen - may he live forever - en Jerrol Ferrier Goede herinneringen bewaar ik ook aan Siela en Pieter Teunissen voar hun gastvrij~
heid Ik heb ook dankbaar gebruik gemaakt van PieLers uitgebreide kennis van vegelatie bodem en landschap van Suriname en zijn uitgebreide netwerk van contacten voor heL vershygaren van inFonnatie Cruciale boorgegevens zijn afkomstig van Staalsolie Maatschappij Suriname waarvoor ik de directeur de heer Jahrap Ferry Nieuwland en Joan Telgt erkenteshylijk ben Oat geldt oak voor de bauxielmaatschappijen Billiton Maatschappij Suriname en SURALCO welke in de personen van respectievelijk Henk Morroy en Jan Vandenberge behulpzaam waren met verlenen van gegevens en bij heL veldwerk Onder de dankbetuiginshygen noem ik verder de heer Coleridge van ConsulLing Services voor het uilvoeren van de pulsboringen en last but not least mijn voarmalige werkgever IWACO nu RoyalHaskoning voor logistieke hulp
lk wil verder enkele personen noemen die mij geholpen hebben metillbornorium analyses Oat zijn Heny Schafer van het hydrochemisch laboratorium van de VU Gareth Davies van hel isolopenlaboTltlIOrium van de VU Harro Meijer Harm-Jan Streurnmn Bert Kers en Hans vun der Plichl van hel Centrum vour Isotopenonderloek in Groningen Arnold van Dijk van hel geochemisch laboralorium van de RUU in Utrecht Sjerry van der Gllast van heL NIOZ in Den Helder Frank Wesselingh van hel museum Naluralis in Leiden Ik heb ook dankbaar gebruik gemaakt van gegevens ter beschikking gesteld doar SHELL (boorgatmetingen via Huib van der Brink) Leen Krook (mineralogische beschrijvingen sedishymen len Suriname) en Theo Levell (geochemische analyses) Beste mensen sommigen van jullie zien dat ik (nog) nieL aile gegevens heb gebruikt maar dm doet nieLs aF van mijn dankshybaarheid voor jullie inzet
Verder ben ik de leden van de leescommissie proF dr HAJ Meijer dr ir TN Oltshoorn proF dr A Leijnse proF dr ThE Wong proF dr W Roeleveld en dr AJ van Loon erkentelijk voor het beoorde1en en becommentarieren van het proeFsehrirt Ik wil in heL bijzonder Tom van Loon bedanken voar zijn zeer grandige correctie van de tekst Tensloue dank ik Henry Sion en Nico SchaeFers van de afdeling FOLografie en vonngeving van onze Faculteil voor hel teken- en opmaakwerk van het proeFschriFt
Gedurende de gehele onderzoeksperiode kreeg ik indireete maar niel minder belangrijke steun in het huishouden van mijn familie meL name van schoonmoeder Gisela Brackman tante Lygia Hardy en schoonvader Oscar Stewart Grantangi lieve mensen Naasl een praeFschrirt hebben de afgelopen jaren mij oak [wee beeldschone kinderen opgeleverd Corryenne en Joshua Schatjes jullie hebben me vooral van mijn werk aFgehouden en daar ben ik jullie eeuwig dankbaar voor En dan mijn vrouw Jacintba lk kan hier nieL opsommen wat je allemaal voor me hebt gedaan Ik volsta mel Ie zeggen dat ik zonder jou niet eens was begonnen aan deze klus lndachtig een Surinaams gezegde ben jij voar mij het water waarin ik zwem Lek fa wan fisi no man Iibi sondra watra so mi no man Iibi sondro yu
Tenslotte het onderzoek duurde lang maar er waren genoeg spannende en plezierishyge momenten van ontdekkingen - vaak samen met anderen - die het enthousiasme erin hielshyden Wat dat betreFt is er weinig verschil tussen aardwetenschappers en kinderen die spelenderwijs hun omgeving onldekken zoals de omslag van dit boek laat zien Hel gaat om de verwondering kinderlijke verwondering over alles water te lien en te beleven is in de natuur Gods eigen speeltuin
Koas Groen
Samenvatting
De effecten van transgressies en regressies op grondwater in kustvlakten en onder de zeebodem
JIIllidillg
Dil p~ocfschr~fL gaul in op de vruug hoe mariene tramigressies en regressies grondw3ler III ku(~ebll~den bemvloeden wal bel~f1 slromingsSYSlemen en processen als verzihins en verzuellns Deze vraag komi YOOn un hel feit dat zoutgehalten van grondwater in kustgebieshyden vltmk een - or he een-ae gezichl - onlogisch patroon Ienonen oer in binnenland kan men -om~ brdk gromlwuler vinden lerwijl onder de zeebodem zoel grondwater wordt aangeshytroffen Dc wczenlijke oof7uak ligl in de grate geologische dynamick van het kustmilieu Hel grondwatersysteem moet zich sleeds aanpassen aan soms abruple gebeunenissen als (nmsgrcssic regressie sedimenlulie en erosie De hierrnee gepaard gaande verzilting dan wei ver_ocling an de -edimenren vollrekt lich trilllg en is vaak nog niet volLooid wanneer hel slromingssysteem in hel ku-agebied alweer vcranden
In dit procfschrift is getrachl een beer begrip te krijgen van deze processen door middel van een case studie van de Surinaamse kustvlakte (Pan I) en observaLies uit andere delcn van de wtreld cn algemenc modelexperimenten (Pan II) De case studie wordt beschrccn in Lie drie volgende paragrafen van de7e samenvatting de algemene ~itudies in de
_voorlaaLste paragraaL
Hil kllsr- ell Ojf-UJI(middot Rchicd I-Oil Suriname ---_shyDe kust hlkle bij Paramaribo vormt een laaggelegen en van nature moeras~bied
waar Kwanaire ma~ene af~uingen grolendeels bestaande uit kleilagen (5 tot 3T~ ~~kte) mn hel oppervlak hggen (Flguur 31 en 35) Ten 7uiden daarvan dagzamen Pliocene zanden in de hoer gelegen savannegordel De Teniaire afzeningen bestaan voomamelijk uit ongeshyconsulideerdc zandmiddot en kleilagen en hebhen een totale dikte van enkele meters i~ de savanshynagordellot 300 m in hel noordelijke HOlocene deel van de kustvlakle De Terti~iremiddot afzettinshy~en waarin Iich de belangrijkste aquifers be inden rosten op kristallijne gesteenies (in liuvannegordel en Pleislocene kustvlakte) of op Krijtafzettingen (in Holocene kustvlakte)
Hel 7outgehalte van hel grondwater in de Teniaire aquifers in mgll chloride varieert van 6 tot WOO mgll Hogere gehalten worden aangelroffen in de slechl doorlatende Krijtafzeuingen en in de Kwanaire kleilagen van de Holocene kustvlakte (Figuur 35) Op een aamal pompstations wordt zoe~grondwater laquo 250 mgll chloride) gewonnen uil de
Tertiaire aquifers op diepten van I tot 180 m Voor deaanvang van de grootschalige grondshywalerwinning (1958 AD ) was het grondwater in de kustvlakle min of meer stagnant De aquifers werden en worden nauwelijks aangevuld mede vanwege de zeer hoge hydraulische weerstand van het Kwanaire kleipakkel Een uitzondering vonnt een hoger gelegen gebied rond hel dorp Lelydorp Grondwater kan wei infiltreren in de Pliocene zanden van de sayanmiddot nagordel maar wordt geheel gedraineerd door de lokale kreken
Uit olieboringen blijkl dat grondwater in het offshore ebied relatief zoet is (Fi uur 3~) lot 90 kIn a(stand van de kUSlwor t no n water mel een c on e e aile 1a er dan 2 rna aangetro en (zeeater hee I een chlorideconcentratie van Ca 20000 mgt1) Dit-
vii
matig brakke grondwater is duidelijk van meteorische oorsprong en moet zijn gevormd door een ander stromingssysteem dan de huidige en wordt daarom aangeduid als ea1eogrondwashy
~
VeroetlJg lan sedil~lelllell ill het kust- ell offshore gebied fln Suriname rljdells de Weichse regressie
l-lC-Ieeflijden duiden erop dal her grondwater in de kustvlakte is gevormd tijdens het Laatsle Glaciale Maximum of LGM (25 [Ot 12 ka BP) en Vroege Holoceen (12 LOI 8 ka BP) In die periode en mogelijk daarvoor (De Weichsel regressie duurde van 115 tot 12 ka BP) moel er aanzienlijke grondwateraanvulling hebben plaatsgevonden teneinde de enorme hoeveelheid paleogrondwaler in het kusl- en offshore gebied te kunnen verklaren Toch was de neerslag gedurende hel LGM ongeveer SO van huidige neerslag die 2200 rnmljaar bednlagl Uil de signatuur van de s~biele waLerisotopen (BIIIO en S2H) in het Pleistocene grondwater bJijkl dat de neerslag waarschijnlijk beperkt was tot het seizoen van april [Ot en met juli In dil koelere en drogere klimaal bedekten uilgeSlrekte grasSavannes de kuslvlakle Dit laatsle kon worden afgeleid uit de stabiele koolstof isolopen in het grondwater cBnc) De relatief hoge BDC waarden wijzen erop dal dit grondwater is geinfilueerd onder eeo begroeiing met voomamelijk planten die een C4-fotosynthese volgen welke lypisch is Voor tropische grassen
Gedurende heL LGM stond de zeespiegel 100 tot 130 m lager dan nu en lag de kusLlijn 140 km noordwaarto van de huidige ligging Na 12 ka BP begon de zeespiegel te stijgen en hereikte rond 6 ka BP het huidige niveau De kustlijn lag loen ongeveer 20 km landinwaarto van de huidige positie Gedurende hel Laat Holoceen begon de kustvlakte zich weer uit te breiden door de voortdurende afzelling van sediment aangevoerd uit de Amazone Boringen in de kustvlakte toonden aan dat de rivieren en kreken diep waren ingesneden (10 tot 30 m) gedurende hel LGM en Vroege Holoceen
Grondwalerstijghoogten in de Tertiaire aquifers moeten veellager zijn geweest dan de huidige vanwege de diep ingesneden dalen en de lagere zeespiegel Daarentegen mag worshyden aangenomen dat de freatische grondwalerstanden op de slecht gedfBlneerde kleiplaleaus dichl aan maaiveld bleven Hieroit werd afgeleid dat door het grote stijghoogteverschil er shyaanzienlijke grondwaleraanvulling van de aquifers kon optreden in deze periode (Figuur 43) Een numeriek grondwatermodel dal deze situatie simuleerde toonde inderdaad aan dat er overal op de kleiplateaus van de kustvlakte grondwateraanvulling van enkele tientallen millimeters per jaar bestond Uit berekende verblijftijden van het grondwater kan verder worden afgeleid dat de peri6lt1e waarin het systeem actief was lang genoeg duurde om al het brakke en zoute grondwater van voorlaatste transgresie (Eemien) uit Ie spoelen ook in het gebied dat nu ver offshore is gelegen (90 km uit de kusI) Dat laatste bleek niet mogelijk te zijn in modelsimulaties van een vlakke kustvlakte zander een erosierelief
Het bestaan van stroming en grondwateraanvulling in de kustvlakte werd bevestigd door hyclrogeochemische modellering van stoftransport en cationuitwisseling in de Pleistocene kleilaag Modelsimulaties lieten zien dal alleen bij neerwaartse stroming gedushyrende de Weichsel regressie de uitwisselbare Na+-ionen van de voonnalige loute klei kon worden gespoeld en de waargenomen dominantie van uitwisselbare Mg2+_ en Ca2ot--ionen ken ontstaan In sirnulaties met alleen diffusief stoftransport - het mornenleel heersende proshyces i~ de Kwanaire klei bull werd dit mel bereikt
viii
Verilrillg rtllI ~edimellen ill her kusr- en offihore gebied I((JI Surilame rijdells de Holocene rnmsgflHie
Gedurende en nil de Holocene transgressie toen ook het erosierelief grotendeels is vershydwenen door sedimenlatie zijn de stromingssystemen in hel kustmiddot en offshore gebied tot Slishyslilnd gekomen Tijdens de nelle transgressie kwam relatief zout en zwaar grondwater op hel s(ilgnilme meleorische grondwater te liggen Oil vormt een potentieeJ instabiele situatie di~ kiln Iciden tOL lonvectieve dichtheidsslromen ltfingering) en snelle verLilting van de tmderliggend~ sedimenten zoab in het Nederlandse kustgebied is gebeurd In de dikke ~Jcchl duorlalende Kwartaire kleilagen van Suriname gebeurde dit niet (geen overschrijding i1n heL kriLische Rilyleigh getal) en verliep de verzilling veeltrager volgens diffusief stofmiddot Lwnsport
Ne~lilarLSe diffusieve verlilling is oak aangetoond mel behulp van waargenomen proshylicl~n al1lhloridecuncentrJlies en chloorisotopenverhoudingen lt5l7CI) Deze protielen zijn cIecken mel de resultaten van een diffusie-sedimentalie model Hieruil kon worden gecondudeerd daL de zouten in de bovenste 125 m van de formaties het gevolg zijn van neshyrwaartse diffusie Uil de mariene Holocene sedimenten Dit impliceerde dat de opgeloste zoushy(ell op groterc diepten afkomstig zijn uil een andere bron Vermoedelijk bestaat deze bran uit dc Krijtafzetlingen op een diepte van ca 300 m waaruit zoui door opwaartse diffusie en lateshymle dispersie in de Tertiaire fonnaties zijn gedrongen
Aanvullend bewijs voor de erschillende oorsprong van de zoulen is gevonden in de ciltionconcentralies van het grondwater in de Tertiaire aquifers Grondwa[er in de bovenste aquifers ondieper dan 125 m heefL een oerschot aan Mg+- en Ca+-ionen (ten opzichte vun conservatieve menging) Oil overschot is in balans met een Na+-tekort en duidt op vershyIilting gepiard gaande met cation ui(wisseling Een chromalOgrafisch patroon in de catiomiddot Ilensamcnstelling zoals elders vaak h wailrgenomen bij verzilting onlbreekt hier Het pilroon kon redelijk goed worden gereproduceerd in hydrogeochemische modelsimulaties in een-dimensionaal diffusief stoflrausport en cationuitwisseling De simulaties lieten vershyda zien dal de cationuitwisseling voornamelijk in de Kwartaire klei plaatsvindt
Hel zoete en brnkke grondwater op diepten groter dan 125 m heefl een geheel andere lhemische compositie en wijst op een andere herkomst
AJgllIIlIIpound studies
He voorkomen van onderzees meleorisch grondwater ver uit de kust in Suriname is niet uniek Een inventarisatie van waarnemingen en studies elders (Verenigde Staten lildonesie China Nigeria Nederland) laat zien dat het verschijnsel eerder regel is dan uitshyzondering Mell kan onderscheid maken tussen twee typen offshore meteorisch water 0) water dat deel uitmaakt van een actief stromingsysteem waarbij grondwater aan land wortH aangevuld en uitstroomt op de zeebodem als diffuse kwel of in de vonn van onderzeese bron en (iil paleogrondwater dat niet langer wordl aangevuld en dus langzaam verdwijnt zoals voor de kust van Sunname
Simulaties met een simpel analytisch grondwatennodel (semi-confined aquifer mel een scherp zoeuzout grensvlak) tonen aan dat actieve stromingssystemen tot maximaal SO km offshore kunnen reiken Een hierop gebaseerd approximate analytisch modellaat zien dat aileen het kustnabije gedeelte van dit stromingssysteem (tot maximaal 5 krn uit de kust) zoet grondwater bevat De Jengte van de zoetwatenong wordt bepaald door de afstand uit de
kust waar de opwaartse onderzeese uitstroming zo laag is dill zout water door neerwaante diffusie tach de aquifer bereikt en daar convectieve dichtheidsslroming veroorzaakt
Tensloue zijn in deze studie een groot aamal simulaties uilgevoerd mel numerieke grondwltJlermodellen VOor variabele dichlheid mel het doel grondwaterverzilting in zijn algeshymeenheid te bestuderen tijdens een mariene lransgressie Transgressies zijn onderzocht in een model bestaande uit een aquifer onder een kleilaag met een hellend oppervlak Dit model kan vergeleken worden met een kustvlakte of cominentaal pial met een Oauwe regioshynale helling De simulaties lieten zien dat de transgressies in het algemeen zo snel verlopen daL hel ZoeUZOUl front de landwuilI1S schuivende kusLlijn niet kan volgen Verzilling na transgressie vindt voornamelijk plaals door neerwaarts tran~pon vii diffusie en convectieve dichlheidsstroming Meestallreden deze twee processen legelijkenijd op diffusie in de klei en convectieve dichlheidsstroming in de aquifer De dikte van de ifdekkende kleiliag blijkt van groot beling te zijn voar de integrale vel7iltingssnelheid
Gesuperponeerd op de regionual hellende kustvlakte van het LGM kenden veel gebieshyden 7oals Suriname en Nederland een erosielandsschap DaUlum zijn ook IrJnsgressiesimushylaties uilgevoerd met een model van zon erosielandschap bestaande uit een aquifer onder een kJeitaag waarin een rivier is ingesneden Uit de simulaties bleek dal heL meleorische siromingssysteem zich nog lang hundhaaft na inundatie van hel dal De opwaartse kwel in het dal of beler estuirium verhindert de verLilling Pas na volledige inundatie draiit de slroming om en dringt zout water naar binnen onder hel dal en wordt het zoete grondwater uitgedreven door opwaartse stroming naar de leebodem vii de kleilaag Hel meLeorische grondwater blijkl zich lang te kunnen handhaven tussen de rivierdalen
SIOIofllIerki1(11
Het groQtste gedeelle van de wereldbevolking woont langs de kus vaak in megacities In veel van deze gebieden vormt de walervoorziening een probleem dm aileen nog maar zal toenemen in de toekomst Er is le weinig grondwater of er vjndt al overexploitatie plaats en soms is hel grondwaler niel meer bruikbaar vanwege verontreinigingen De voorr-Jden matig brak meteorisch grondwater in offshore- en kustgebieden kunnen mogelijk alternatieve bmnshynen vormen in combinatie mel nieuwe en goedkopere OTItziltingslechnieken In hel geval van paleogrondwater is er weliswaar sprake van eindige hoeveelheden maar die zijn van een zodanig grote omvang daL winning nauwelijks als niet-duurzaam kan worden bestempeld Bovendien zouden deze voorraden loch langzaam verdwijnen door diffusieve verzilting
Verder onderzoek naar offshore meteorisch grondw21er is daarom gewensl Met een beler begrip van de omsmndigheden waaronder dit water kan ontstaan is hel mogelijk progw
noses Ie geven over hel voorkomen op bepaalde Jocaties Het voorkomen is zoals reeds gezegd eerder regel dan uitzondering met name in ondiepe zeeen ( lt 70 m) waar de eerste 300 monder de zeebodem bestaan uit afwisselend zand- en kleipakkeuen
Voor de exploratie is heL zinvol om geofysische detectiemethoden te ontwikkelen zoals tmiddot
l de combinatie van transient domain electromagnetics en hoge resolutie seismiek
ix x
Chapter 1
Introduction
II Background
Before joining the - then - Faculty of Eanh Sciences of the Vrije Universilcit Amsterdam in 1994 I worked 14 years in several countries as a consulting hydrogeologist Many of the projects were carried QuI in coastal plains among others those of the Netherlands Mozambique Arabian Gulf and Suriname In these areas I often observed groundwater salinity patterns and flow systems that did not comply with the classic concepts on coasLaI hydrog~ology Notably in Suriname where I worked from 1990 to 19941 was confronted with enigmatic phenQmena like unexplainable anesian heads stagnant bodies of fresh groundwater in deep aquifers near the shore but also saline groundwater bodies far inland (UNDPIWHO 1972 Groen 1998 IWACOIFR Harris 1991) Lack of understanshyding of these phenomena complicated groundwater exploration and management and led to overlooking of valuable fresh groundwater resources and unexpected salinization of wells
In the course of time the impression grew on me that the main reason for anomalous ob~ervations is that classical hydrogeological concepts of coastal plains do not account for geological events operating on large scales of time and space This refers specifically to elimiddot malic changes and marine regressions and transgressions during the last hundreds of thoushysands of years The effects of these events are still reflected in the present hydrogeological Slate Staled differently the ever changng geological conditions of climate topography and sea level appear to have prodLlced hydrogeochemical iSOlopic and even hydraulic head patshyterns in coastal groundwater which are not in equilibrium with present-day boundary condimiddot
lions because of the large relaxation times In that respect we find ourselves at a very specishy
fic point in geological history as a major sea level rise of more than 00 m took place a relatively shon time ago (12000 to 6000 years SP)
After joining the university I proposed to initiate a PhD study into these maUer The coastal plain around the capital of Paramaribo in Suriname (South America) seemed to be a suitable case study because of the availability of data Many eanh scientists and engineers investigated the coasta plain around the capital of Paramaribo especially during Dutch coloshynial times (Wong et aI 1998a Groen 1998) Also water supply mining and oil companies in Suriname were very cooperative in supplying well data and providing assistance in the field Investigations staned in 1995 after promotor prof dr JJ de Vries head of the hydroshylogy depanment of the Faculty of Eanh Sciences had accepted the proposal Dr H Kooi took on the role of copromotor
12 Objective and scope of the study
During the final stage of a PhD study it may be customary to write down objectives that fit the results This may give the thesis a straightforward and scientific appearance It is however not reali~tic to suggest that objectives and scope remained unaltered during this
7middotyear study In my opinion it is essential in science 10 show how the work took place and how and why objectives and scope changed
Iniially the objective of lhe PhD study was to unravel the rehnionship between the anomalous salinity age and flow panerns in coastal groundwater in Suriname and the geoloshygiciJl and paleogeographical development during the Last Glachtl Maximum CLGM) and the Holoce_ne The methodology consisted of conceptualising the paleogeographical and paleoshyhydrologiciJl development using existing geological proxy data and new chemical and isotshyopic groundwater dara Subsequently these concept~ and hypothese~ were tested by numerimiddot cal simulation models
The study area encompassed the 70 km wide sedimemary belt belween the Suriname llnd SaHnnaCCiJ Rivers (see Figure 31) Though initially investigations- were retricted to the lUilwl plain I soon hecarne intrigued by dati from offshore exploration wells in Suriname showing it body of low salinily groundwpler laquo 200 mgll) extending 90 km imo the Offshore sedimcnts~ I ~uspec(ed thai preenl and past onshore processes are intimately coupled to those il) lhe offshore domain and that consequently the latter had to be included in this s1U9Ymiddot _
Related to (his a larger time frame of about 120000 years including the end of lhe prcvmiddotpumiddot~Silngamonian (Eemian) trmsgreision and the entire Wiconsinan regression and HolCX~ne transgression appeared to be more suitable An even longer period would be neshyded in order (0 unswer questions about the genesis of deep groundwater(gt 300 m) However I refrained fmm considering earlier time inlervals because of the many uneertainties regarshyding lh~ Early Pleistocene and Pliocene paleogeography
Afterl had acquired ~ basic understanding of the hydrogeological characteristics of the Suriname cpnslal plain I wanted to know how exceptional this Case aClually was Thus I started to remiddotview data and reports from other coastal plains especially eoncerning the preshysence of fresh or-low-s~linity offshore groundw~ter There appeared 10 be striking similarishyties with the Suriname coast but also dissimilarities It was there that my research took a mort generic tum The review study motivated my colleague Hel1k Kooi and myself to devctlp malhemalical models in order to define the generic conditions which control the presence or absence of offshore low salinily groundwater and the salinization process in general
13 Structure of lhe thesis
Chapter 2 discusses some general concepts and definitions relaled 10 coastal hydrogeoshylogy which will be used in the follOWing chapters The remaining part of the thesis is divishyded in(l two parts in accordance with the objectives described above Part I (Chapters 3middot7) deltlls Wilh observations and interpretations related to hydrogeological processes in the coamiddot stOll plain of Suriname whereas Part II (Chapters 8-10) is concerned with generic processes in coastal plains Staled in other words Part I represents mainly the inductive phase and Part II the deductive phase of this research project
Part I Slans in Chapler 3 with a description of the present hydrological and hydrogeoloshygical condilions in the coastal plain around Paramaribo Chapter 4 presents a reconstruction of the paleogeography and paleohydrology during the last Wisconsinan (Weichselian) glacial and the Holocene mainly based on previous studies and proxy data A conceptual model explains how saline groundwater from the preVious Sangamonian (Eemian) transgression
has been flushed from the coastal and offshore sedimenl in Suriname This process is quanshytitatively evaluated by numerical groundwater modelling Chapter 5 deals with the salinizashytion process of the coastal sediments during the Holocene transgression The concept of the diffusive salinizalion process derived from chloride concenlration and chlorine isotope patshyterns is verified by mathematical modelling In Chapter 6 the hydrogeochemistry of the coa SIal sediments is investigated (0 provide additional clues for the freshening and salinizalion processes during lhe Wisconsinan and Holocene respeclively Special attention is given 10
calion-exchange processes Aho in this chapter concepts derived from analyses are evaluashyted by mathematical hydrogeochemical models Chapler 7 discusses the iSOlOpic composishylion of groundwater The groundwater isotopes shed more light on the paleogeogriJphic conshyditions in the coasml plain of Suriname notably that of climate vegetation and groundwater flow during the Lust Glacial Maximum (LGM) and the Early Holocene
Pan II SUlrts in Chapter 8 with an overview of Ihe worldwide OCLurrence of oFfshore groundwmer of low sulinily (meteoric groundwater) Then in Chapler 9 a model is presentshyed (0 calculale the offshore extension of meteoric groundwater driven by coastal flow systems This model helps to discriminate between recen submarine meteoric groundwa ter belonging to active flow systems and to fossil groundwater bodies formed during glacial low stands (paleogroundwater) In Chapter 10 a vC1riable density flow model is used to study salinity pauerns in time and space for situations in which saline water of high density overlies fresh water of low density The model is applied to 0) middotmiddotsteady state condition~
arising when fresh groundwater is driven by coastal now systems inlo the offshore C1nd disshycharged as submarine seepage and (ij) unsteady-stale conditions created by a sea enCroashyching a coastal plain
2 3
Chapter 2
Some concepts and definitions related to coastal hydrogeology
21 Groundwater origin and salinity
The salinity of groundwater is ellpressed in total dissolved solids (TDS) in mgll and chloride concentration in mgJ or mmolli The first is useful as it is directly related to the water density the second is appropriate because chloride as a conservatJve compound is a beuer tracer for the origin of groundwater and the degree of mixing finition of salinity classes and groundwater origins are n01 consistent in literature This stu y uses lee aisifi~
cation shown- belo)N In Table 21 13 ~ 3t-=-c---------------------------==-----------------t S Salinity class Origin TDS in mgll Chloride in m CJ C CJI
Fresh Pristine meLeoric lt 50 pound zB E Fresh Meteoric 0 - 1000 0 - 250 ~ ~ N~ Moderdlelybmckish Meteoric 1000-12000 250-7000 0 ~ bull Brackilh 12000 - 24000 7000 - 14 2 5 ~ ) CsoSaline Marine 24000 - ~4000 14000 - 20 Col l Q
0 000 _r ri~ Hypersaline gt ~4000 gt - __ t ~ Q ~ 1- =~ ~
Table 21 Groundwater salinity casses -g i t ff Meteoric groundwater is groundwater originated from precipitation that has intil a~ ~ ~ ~
in the soil either directly or indirectly from surfnce water In this study fresh meteori JE ~j groundwater which only contains salts from aerosol dissolution and normal rocklw e8 ~ ~ 4~
interaction is defined as pristine meteoric groundwater As a rule of thumb ground e-J ~_J (
with salinities less than 50 mgll of chloride can be considered pristine in most cons reas~ i Meteoric groundwater in coastal plains with higher chloride contents has generally n ~ Q influenced by diffusive and dispersive mixing with saline groundwater Because g wa- ~
ter looses its meteoric signature with increasing salinity this study has somewhat arbitrari y defined meteoric groundwater as groundwater having a salinity less than 13 of that of seashywater or less than 7000 mgll of chloride According to the definitions used here (Table 21) meteoric groundwater can be fresh to moderately brackish Marine groundwater is saline water defined as water with chlorinities between 14000 and 20000 mgll Note that pracesmiddot ses like evaporation (sabkhas) and dissolution of evaporitic rocks may also increase the salshyinity of meteoric and marine waters This implies that some saline and hypersaline waters may be of meteoric and not of marine origin These p~cesses are not considered here
22 Flow systems
This study adheres to the flow system concept described in Toth (19631995) De Vries (1974) and Engelen and Kloostennan (1996) According to this concept the sedimentary basin fonns a hydraulic continuum in which coastal topography and climate invoke a comshy
5 4
-----------------------------__------shyplex paneIll of groundwater flow paLhs from recharge 10 discharge areas In this pattern a hierarchy of nested flow systems can be discerned (Figure 21) With increasing depth now qenl~ increase tn length have larger groundwater residence times and become controlled hy lower-order (regional I relief features Generally the concept of no systems is restricted lO topography-driven now and applied for steady-state flow For this study the now-systems concept is expanded to include the realms in the deeper and offshore pan of the coastal sedishymem~ where den-itymiddotdriven and compaction-driven flow dominates (Belhke et al 1988 Harri~on and Summa 1991 Kooi J999) In addition it is noted thai not so much the present now w~tcm~ hut rathcr the changes in these systems Ihrough time have 10 be underslOod to expJu Ihe tharacleristics of coastal groundwaler
IwdOW oj regIOnal now system wilh regional nOY branch
Window of subreglonill llow system w11h
1 Sllbregional rtow branch
1012 now ~ local now sysshysysem w~h tem with 2loca
I 2 local now I now branches I branches I
I I I t~ Ll I~- R iQI--l--i-+----shybull I
lOcal now system with 2 local now branches
sub regional now sysshytem WIth 1 subregionshyalllnd 2 local now branches
di5Charge subregional now bllllnth
recharge regional now local now brahch branch
Fi(1ure 11 Gwundwmer now systems (afler Engelen and Klooslennan 1996)
23 Freshsaline interface
Topography-driven flow systems in coastal plains generally fonn fresh groundwater hodies flmuing on deeper saline groundwater This is explicitly expressed in the equations of Badon Ghijben (1988) Herzberg (1901) and Hubbert (1940) which relate the depth of the freshsaline nterface position [Q groundwater heads in the meteoric groundwater body These
6 i gt
relalions assume steady-state fresh groundwater flow over an immiscible and stagnant body of saline groundwater In realilY the interface is nOl sharp but forms a mixing zone caused by transverse dispersion of flow along the interface (Verruijt 1971 Meinardi 1991 De Josselin de Jong and van Duijn 19861 The freshsaline interface is an undulating surface which arches upward below discharge zones like rivers and wells Along the coastline the freshsalishyne interface reaches the land surface or the seafloor Near discharge areas the brackish transishytion zone may become relalively wide and the sharp interface approximation can no be longer maimained (Souza and Voss 1987) In a sedimentary environment comprising several aquishyfers scparaled by semi~pervious clay layers the freshsaline inlerface forms a staggered line with fresh water protruding below the clay layers This is well documented for the Long liland coast near New York USA (Lusczyniki and Swarlenski 1966) Observations (Kohout 1964) and analytiral models (Bear and Dagan 1964 Glover 1959) show that Ihe dlseharge zone of a phreulir aquifer extends several meters to hundreds of meters offshore In U semimiddot eonfined aquifer the steady-stale inlerface may extend many kllometers into the offshore zone as is shown by an~lytical models (Edelman 1972 Muulem and Bear 1914)
In the disperSion zone around [he freshsaline imerface topography-driven now drdgs saline water from the underlying saline groundwater body and discharges brackish groundwashytcr in the sea or inland seepage areas like the polders in the Netherlands Cooper (1964) reashysoned that in a sleady-state situation these salts have to be replenished by saline groundwater from Ihe sea Henry (1964) confirmed this hypothesis mathematically and found out that a convective flow patlem is induced in the saline groundwaler body near the interface The lms of sailS from the dispersion zone may also be supplied by upward now of salt water driven from deep sedimenls (compaction-driven now)
In parts of sedimentary basins with little flow freshsaline interfaces are often absent and groundwater is mainly brackish This cannot be explained by steady-state flow systems bUI must Ihe resull of incomplete processes triggered by geological events in the past This aspect is essemially the subject of this thesis
24 Paleogroundwater
The more or leslti stagnanL brackish groundwater bodies memioned above in the deeper part of coastal sedi ments are generally old often of Pleistocene age Examples in various parts of the world are those found in Suriname (Groen 1998) Jakarta Indonesia (Geyh and Stifner 1989) BelgiurnlNelherlands (Walraevens 1990) and Bangkok Thalland (Sanford and Buapeng 1996) This groundwater dates from a period when the topography-driven flow syslems had another and generally larger domain due 10 lower sea levels or higher relief In the present study these fossil groundwater bodies are denoted as paleogroundwater By comparison in the isotopemiddothydrology literature paleogroundwater is loosely defined as meteshyoric water originated in the distant past when other climatic conditions prevailed and left their marks in the isotopic composition of groundwater (lAEA 1981 1983) I prefer the forshymer definition becaus~ in the dynamic coastal zone groundwater flow syslems do not change so much be~use of ell e change but rather because of changes in to h and sea ~erefore paeogroun water IS e me m s study as meteoric groundwater fonned by an old flow system that was controlled by conditions of sea level topography or climate different from today Another simpler definition is the following paleogroundwater is meteshyoric gTJundwater that cannot be explained by the present flow systems
1
7
Part 1
Case study of (paleo )groundwater in the coastal plain and contishynental shelf of Suriname
9
Chapter 3
Hydrology of the coastal plain and continental shelf of Suriname
31 Introduction
Suriname is situated in South America between In NL and 6deg NL and is bordered b) Guyana in the West French Guiana in the East and Brazil in the South (Figure 31) The Atlamic CO~sl has a length of 350 km Suriname has been a DUlch colony it gained indemiddot
Atlantic Oceen
o HlIalne ITIoIrlne depoamplll Ell ~llaquoene marine deposits bull ~ ClIIIlInenlaI deposits
frJ AMatIIe depoIIla (undlll) ~ Buemtnt rockI
FigUre 31 The coastal plain around Paramaribo Suriname
10 II
pendeme in 1975 During colonial times the physical environment has been studied extensimiddot vel) because of lh~ mineral resources (gold bauxiLe and oil) Hnd the high agricultural proshyduclion of the coustal pluin (Wong et-al 1998a) The populCllion IS about 400000 of which 200OUO ure living in und around Paramaribo The capitClI alwClys relied on the groundwmer i1~ a resource for drinking~water supply because of saline water intrusion in the coastal rier Groen (1998) reviewtd the hydrogeological investigations thal were carried out in the coa~tal plain during Ihe ICl~t century An imponant lheme in these investigations was the complicated groundwater alinity pattern in lhe coastal aquifers This chapter presents an ou(lin~ ul the geology lhe present climate and hydrology and the basic hydrogeological cha~
ralICrislics as ubserved today
32 Climate
Surinamt has a wet tropical dimale with an average annual tempemture of 271 uC and [nlal rainfall of 220b mOl at Paramaribo Seasonal temperature varialion is small the maxishymum difftrence of-monlhly averages is 2 ue Daily temperature fluctuates between an avenlshyge daily maximum of 305 uC andan avemge daily minimum of 228 tlC Seasons are marshyked by the rainfall paUern shown in Figure 32 There is a long miny season from April to mid-Augusl followed by a long dry season until Dectmber Less predictable both in timing lid amoum of rain are the shon rainy season in December and January and the hon dry e~lson in February and Murch -Qry hns a relative meaning because even during the long dry seasoll rainfall at Paramaribo is generally higher than 70 mmmonth
350
E 300E 250 ~
~ 200
~ 150
a
gt
C E 1~~ 11 11 I
o -LLlIILJooJc-JOIUOu
o rainfall pan evaporation-----_
FijUre 32 Rinfall and pan evaporation al Zanderij airpon Surin3me
The rainy seasons are related to the shifting InLer-Tropical Convergence Zone (ITCZ) The ITCZ the average position of which is at 50 NL the meteorological equator passes Suriname twice a year During the long dry season from August until December the ITCZ is at its most northern limit and southeast trade winds prevail During the rest of the year the ITCZ lies over or just south of the study area and northeast trade winds prevail Pan evapomiddot
12
ration at Paramaribo varies from 100 mmmonth during the long rainy season to 170 mm in the long dry season (Figure 32)
33 Landscape
The major pan of Suriname is underlain by the crystalline rocks of the Guiana Shield forming a hilly landscape with tropical rainforest In the north of the country a belt of clastic sediments stretches along the Atlantic coast having a width of 70 km in the study area near Parclmaribo Many earth scientists and biologists have investigated the sedimentary landscashype in delaii (Cohen and Van der Eyk 1953 Van der Eyk 1954 1957 Zonneveld 1955 Lindeman and Moolenaar 1959 Brinkman and Pons 1968 Veen 1970 and Teunissen 1978) The sedimentary landscape can be divided imo three geomorphological uniLs the savannah bell Ihe old or Pleistocene coastal plain and the young or Holocene caas-IUI plain
The 20 km wide savannah belt in themiddot South forms an undulating landscape on Pliocene sands (Figure 31) Elevations vary from + 10 m (relative to mean sea level) in the North to + 50 m in the south Despite its name only 30 of the savannah bell in the project area is covered by typical open savannahs with grasses sedges and low bushes (Teunissen 1978) Most vegetation eonsists of xeromorphie dry-land forest and savannah woodlands Characteristie blaek water creeks bordered by swamp and gallery forests dissect the savanshynah belt Apan from zanderij airpon human impact is small in this sparsely populated area Despite the tropical climate savannah vegetation can persist because of the low moisture retention capacity and nutrient content of the coarse sandy soils and the regular burnings by the Amerindian population
The actual coastal plain north of the savannah bell is much different the flat marine plain is primarily underlain by clays with elongated East-West running beach barrier depomiddot sits (ritlten) as the main morphological features The Pleistocene pan of the coasLal plain is a 25 km wide zone between Zanderij airpon and Lelydorp with elevCltions between +3 to +10 m (Figure 31) The plain is an assembly of clay plates (schollen) dissecLed by numeshyrous swamps and creeks filled with Holocene clay and peat The plain was probably formed during the Sangamonian transgression and later dissected during the Wisconsinan regression (Veen 1970) Between Lelydorp and Rijsdijk road Pleistocene beach barrier deposits have coalesced into an elevated complex (+6 to +10 m) called the Lelydorp sands (Figure 31) Swamp grasses and swamp forests cover the inaccessible and marshy pans mainly in the south while dry-land forest is found on the bener-drained pans In the rest of the area and especially on the Leldyorp sands the original dry-land forests have disappeared by settleshyments and activities like agriculture forestry and cattle breeding Most of the old plantations have been abandoned and are presently overgrown by secondary vegetation In the area betshyween the Rijsdijk road and Paranam the landscape has been strongly affected by the large and deep bauxite mines and the bauxite refinery at Paranam Nowadays the abandoned mines fonn large lakes
The Holocene plain elevated at +1 to +3 m has a width of about 25 km Locally it penetrates deeply southward along the valleys of the Suriname and Saramacca rivers (Figure 31) This pan of the coastal plain has lost most of its original character because of agriculshytural activities settlements and especially the expanding city of Paramaribo The vegetation was fonnerly marked by dry-land forests on th~ beach barriers and better drained pans of
13
the clayey plain and by swamp forests on the low-lying pans Grasses and shrubs dominate the recentlv formed land (after I ka BPJ North of [he line Groningen-ParamariboshyCommewijne River where oils slill contain brackish water
The continental shelf slopes with a gradient of aboul I 2000 to a depth of 50 m aboul 100 km offshore (Figure 33 and 44) Then the gradient increases to I 800 until it reaches he shelf break ul a deplh of 100 m about 140 km offshore where the gradient increases to ilhoul 120 10 I 100 Remarkable morphological fealures are remnants of the Plei~tocene palemhannels or the major rivers like (he Marowijne (Nota 1971) and old coastlines and
depth 01 the sea noor -
-Atlantic Ocean
~OM~bull
-- IOmIDCO I-
coral reef~ reluled 10 interruptions of [he Holocene transgression (Nota 1958 1971)
Figure 3bull Geology and calchmenls llf major rivers llong Ihe Guilna coast (~rler Bosma el al IYl~) III GrJnulil~ belts () Amphibolilt flcier of I (3) low-gr1de meIOl~lmenls (4) Greemaonc lldts I~I Acidmiddotint~nl1edialt meluolcanics (61 Granitoid rocks (71 Roraiml SlndSIOnes (Prccumllrianl fftl Phanero7oic stdiments
34 Geology
34 General
The crystalline basement of Suriname is pan of the Guiana shield (Figure 33) and conshysists mainly of granitoid and metamorphic rocks (De Vlener et al 1998) Metamorphic rocks (Marowijne Group) underlie the northern part of the catchments of the Saramacca and
Suriname riers (Figure 33) and are also encouOIered in boreholes in lhe coastal sedimemiddotnta ry zone The clastic Mesozoic and Cenozoic sediments in the coastal zone and lhe continenmiddot tal shelf are pan of the Guiana Basin which extends from the Wain River in Guyana [0 the Marowijne River in eaSlern Suriname (Figure 33) The sedimems are described in more detail in Annex I (see also DAudretsch (953) Brinkman and Pons (1968) Veen (1970) Krook (1979) Hanou (1981) and Wong (1984 1989) Sedimentation in the Guiana Basin stuned in Late Juraiisic to Early Cretaceous limes when [he African and South American shields began to drift away (Wong 1976)
The stratigraphy (Figure 34) consists of a series of formations increasing in thickness and depth towards the nonh and onlapping (he basemenl rocks or older sediments (Figure 35) The thickness of the sediment wedge increases from a few meters in the savannah belt to 750 m along the coastline llnd fmlllly to 10000 m aboul 140 km offshore (Wong et a 1998b Figure 36) The material for the subsiding basin was derived from the conlinuou~ly
AQUIFERS
confined aquifer between Paranam and lelydorp (Onventadlll and in Hal coastal plain (Saramaoa) nO fl8Sh Willer
phrealic aquifers in sand and shell ridges In
Holocene COlIstal plain mostly fresh
fine and medium
confined aquifer in coaslal plain freh below bull lelydorp sands and Hal coastal plain south ~ ofvelbindingsweg
unconformity
FORMAshyTION
HOLOmiddot CENE Mn
PlEISTOshy shyCENE
PUOshyCENE Mloshy
co- CENE -
~bullOLIGOshy CENE t ~
EOCENE
PAlEO- I jCENE ~ bull
LATE CRETAmiddot CEOUS
Figure 34 Stratigraphy of the coastal plain of Suriname
15
RepubliekSavanna
XXXXXXl(XXX)(XXX _~xxxxxxxxxxxxx X
700
600
500
400
300
200
00
South
in E
1) c i a E ~ c Q
~ W
middotmiddot~xxxxxxxxx xxx xxx Vl(XXXXX XXXXXXXlC xx
~xxxxxxxxxxxxxxXX
Chloride concentration in mgll
H Holocene Mara and Coronie Fm
Pis Pleistocene (Coropina Fm)
Q Quaternary
PI Pliocene (landerij Frn)
M Miocene (Coesewijne Fm)
o E
Oligocene (Burnside Fm)
Eocene JOnverdacht Saramacca
P Paleocene Alliance Fm
c Cretaceous (Nickerie Fm)
17
North Allande OCean
Fgure 35 Nonh-South geological section with groundwater salinities near Paramaribo Suriname
Paramaribo
pound Chloride contents from q geophysical welllOQs
iChloride analyses of groundwater
Horizontal scale
bullbull v x x x x x x x x x t~~1~~t~~~~xocxxxx IoXXX)(XlClltK
ql__1L_p~_1(_~2pkm ~==YVVVVV~lC Crystalline basement x
x x XlC lC lCi~s~( lC lC X lC
XXX))( xx xx
~ )( )( )( )(
lCXXlC
~ ~ t----~~
~ ~r--~ lOlXXX
Geoelectricallt x x x x sounding x wlth resistivimiddot (lC)( Ie lC
tylayers ~)( )( l()( X
lC)(XXX(xxxx
XXXI( lC lC )o()e
(lC)( xx XXXX) l(XXXX
bull lC)( lC x)( xxxxx ~ lC lC )( )( X
X)(XXlC x)( xx xxxlC bull x x)(
xx xxll
Lelydorp
16
rising crysLalline basement south of the basin (Krook 1994) After the Early Miocene the Amazon River became a more important source of supply (Wong 1976 Krook 1979) Before thm lime when the Ande~ Mountains were not yet formed drainage on the South Americm continent wa- directed towards lhe West (Krook 19791
Soulh
Brownsberg No 500 _=== ~== =_== = 50middot1 MO-1 GLOmiddot1
MI
Upper Cretaceous
basement estlmated et10000m
Oligocen
Ii~urc 036 Offshore g~nl()gy (lnCr Wong c( al 199Rbl
3-1 (rewccof lilt n1tiury
lhe Crelaceous sediments in the coaltltal plain consist of terrestrial unconsolidated and consolidated lineto very coarie sands and kaolinitic claystones of the Nickerir Formation
During the Paleocene and Eocene mlinly shallow marine deposits were deposited during seveml transgressive phases Three formations are distinguished with differenl facies (Wong 19R6 1989) the conlinental I to 40 m thick Olleroacht Formatio1l is charaeterized hy coanc kaolinilic sands and kaolinitic clays deposited on alluvial fans and in braided rin~rs during Ihe Paleocene and in floodplains and coastal swamps during the more humid lropiCil1 Eocene In the study area the formation can be found as isolated buried hills capmiddot ped hy bauxile and laterite in a 10 km wide small zone around Onverdacht and further CilSWard The Onverdachl Formation passes nonhward into Saamacca Formation found helween lh~ Groningen-Lelydorp line and the coastline (Hanou 1981) The formation conshysists of alternating quanz sands and kaolinitic clays fonning depositional cycles with altershy-nming marine and continental environments The formation contains thick and continuous sand unils which enable deep groundwater circulation Oil in the Tambaredjo oil field is recovered from one of the lower sand units (T-sands) which is confined by an impermeahle clay layer The top of the fornlation is found at a depth of about -140 m (below msll just North of Lelydorp and slopes to -20 m along the coastline West of Paramaribo Further Nonh the Saramacca Formation changes facies and passes into the marine Alliallce Forlllarioll This formation consisting of silty marls c1a)s calcareous sands and lignites is much less permeable Weathering during a prolonged recession in the Oligocene led to bauxite formation on the Onverdacht formation and crystalline basement rocks Erosion proshyducts were deposited as braided-river and alluvial-fan deposits forming the Bumside Fonllatioll (A-sand aqUifer) In Suriname the formation is found in some northeast-southshywest oriented tecronic basins along the coast like that of Paramaribo (Hanou 1981) The Burnside Formation has been eneounteredjust North of Lelydorp at a depth of -130 m
-~
19681
343 Quaternary
tional centre 10 to 15 km West of Paramaribo
m at Republiek to 35 m along the coastline
North of Paramaribo near the coastline the rop of the formation is found at -180 m The coarse permeable sands of Burnside Formation vary in rhickness from 5 to 80 m in a deposishy
During the Early Miocene two major trangressions led to deposition of clays sandy clays and sandi with glauconite and lignite layers ltCotnIijllt Fomlatioll) Compared to Ihe older formations the deposits of this formation contain much more clay (40-80 k) originashyling from the proto-Amazon catchment The lower more clayey part of the Coesewijne Formation is found only in the Holocene coastal plain at a depth of uround -95 m The upper more sandy purt extends ac far south as lhe Rijsdijk Roud in the Pleistocene coasLul pluin though it is absent on Ihe buried bauxite hills around Onverdacht The depth of the lOp of lhe Coeiewijne Formalion varie5 from -60 m in the south 10 -75 m On the continental shelf lhe facies of the Coesewijne Formution chunges into a shallow-murine carbonate platform
The Pliocene sedimeOls expoied in the savannah bell consist of coarse white and brown kaolinitie sandi with interbedded kaolinile clays and were dcposited in braided streshyams and alluvial fans (Krook 1979 Van Voorthuysen 1969) Inlensive weathering and leashyching gave the savannuh sands their chamcterislic bright-white appeanlOce Nonh of the savannah bell the Zanderij Fomation is covered hy Quaternary clays with a thickness of 4
During a Pleistocene probably the Sangamonian transgression tidal lagoon c1uys intershyspersed with sand barriers were deposited These sediments form the Campiml FOn1lC1ticm and are found in the Pleistocene coastal plain between Republiek and Lelydorp The sand barriers found mainly in the nonhern part of the Pleistocene coastal plain form now a more or less continuous blanket of sands The Wisconsinan regression led to erosion of the Pleislocene surface in the coastal plain and the present offshore zone Veen (1970) and Roeleveld and Van Loon (1979) found several gullies in the Pleistocene plain filled with Holocene deposits to depths of 10 m below the present surface The present author found evidence that Ihe paleochannel of Ihe Suriname River near Paramaribo wai deeper than 30 m This is based on the results of two boreholes drilled for this study (Chapter 5) and on some unpuhlished well logs and cone-penetration tests The Pleistocene clays show signs of deep weathering during the Wiseonsinan regression (Veen 1970 Levell and Quakernaat
During the Early Holocene from 12 to 6 ka BP the sea level rose from a depth of more than 100 m lo the present levef (Roeleveld and van Loon 1979 Fairbanks 1989 Figure 42) Marine deposition resumed and obliterated most of (he Pleistocene erosion topography Beeause the Holocene transgression did not reach the level of the previous Sangamonian transgression the Pleistocene coastal plain in the south was preserved though the gUllies were filled with the peaty clays of the Mara Fonllatoll and can still be recognized as swamps After sea~level rise slowed down between 6 and 7 ka BP coastal aggradation began and extensive tidal flat clays alternating with beach barriers with sands and shells were deposited in the Holocene coastal plain (Corollie Fonllation) Brinkman and Pons (1968) discerned three distinctive phases in the coastal aggradation the Wanica phase from 6 to 3 ka BP the Moleson phase from 25 10 J3 ka BP and the Commewijne phase from 1 ka BP to present The main pan of the Holocene coastal plain in the study area dates from the Wanica phase Only North of the road Paramaribo-Groningen and the Commewijne River
19 18
recem deposits of the Commewijne phase are found Coastal aggradation is still going on in Ihe littoral zone rapid sedimentation is taking place on moving mud banks (Augustinus 1978 Augustinus el al 1989) Oceanographic surveys show thatthese Holocene mud deposhysits are found on the sea floor up 10 30 km offshore and have a maximum thickness of 20 m INOla 1958 1969)
35 Runoff and recharge
351 Tile SllWIIUlh belr
Rainfall runoff processes have been investigated by Poels (1987) and Brouwer (1996) in small catchments in the savannah belt Poels (1987) studied ltI catchment near Kabo west of (he study area und Brouwer (1996) a savannah catchment in Guyana Both authors report thaI despile the frequent high-intensity rainstorms surface runoff is a small component of lowl runoff laquo 10 9) because of the sandy subsoil and the low surface gr-Jdients Rainfall leaves the catchment mainly via evapotranspiration while the rest is drained by perennial and ephemeral creeks (Table 31) Rainfall is tran~formed in river flow by (1) fast runoff just below or on tbe surface here called interflow and (ii) slow runoff by groundwater which is equal to groundwuter recharge Chemical analyses of peak flows indicltlle that fast runoff is not much ltlffecled by evapotranspiration On the basis of simple water and chloride mass halances using average data of these catchment studies rechltlrge values can be eSlimated
P-E=Q (31 )
Q= Rrlr + RiAl (32)
PmiddotCldh = RrrtIo Cl~m +RIIt middotCltallt (33)
where P = precipitation E actual evapotranspiration Q = creek discharge Rfl(J = ground~
water recharge and Ril =interflow All these fluxes are in mma Clm and Clllrrnmltl are the thloride concentrations of rainfall (and interflow) and groundwater recharge respeclively Equations (3 l (32) and (33) lead to the following relation where groundwater recharge is expressed as a function of measurable variables
(34)
The results for fast and slow runoff are presented in Table 31 For verification Clriltr
can be calculated and compared with the average measured value according to
R CI R CICl m=Omiddot n+Q taw (35)
Variables Kabo (Sur) Mabura Hill (Guy) (1980-1982gt C1991-1992)
Mepsured P mmlaJ 2200 2480 Q ImmJa) 590 1040 Cnln(mmoll) 0025 0023 Clf~mJ ImmolI) 0156 0093 Co (mmolI) 0gt00 0073
Cllcuhucd
R (rnma) 290 570 Rof (rnma) J(Kgt 470 Cmn (rnmoll) OOll2 0055 -------shy
Table 31 Water blllances of calchments in the savunnah belt based on chloride rnas balance DatJ for Kahn are from Pucls (1987) and data fOr Maburo Hill from Brouwer (996)
J
The results (Tlblc 31) how that groundwater rechurge varies between 300 and 500 mma Becltluse the savannah bell in the study area has a relatively large percentage grltlsCs and shrub vegetation a value of ~ mlseems more likely and has been used for groundshywaler modelling According 10 iJampS (I ) and Brouwer (J 996) cutchmentloses by deep groundwater flow are negligible This implies that lhe rechltlrge in the sltlvunnah belt does not feed the Tertiary aquifers in the coastal plain This is corroborated by ltl groundwater mOdelshyling study by Post (1996) Groundwater rechargc appears to take place mainly during the long rainy season observalions of phreatic groundwater levels in the savannah belt (Weyerman 1930 Heyligers 1963 UNDPWHO 1972) show large fluctuation (25 (0 3 m) with maximum levels at the end of the long wet season and minimum levels at the end of thc long dry sea1ion Eff~infall which is equal to rainfall minus actual evapotran~pishyralion i~ positive only durilg the lolsect rainx season This can be inferred from Figure 32 where monlhly rainfall and pan evaporation are shown It is noted that actual evapotranspishyration in the wet tropics is close to potcntial evapotranspiration (Bruijnzeel 1990)
352 Till coastal Iain
Catchments in the flat coaslal plain are not as well defined as in the savannah belt Effective rainfall on clayey lerrain is mainly discharged via overland flow and interflow to swamps creeks and man-made drainage channels Typical for the clay terrain is the kawshyfoetoe surface consisting of little hummocks (01 to 03 m2) separated by small drainage channels (01 to 02 m wide) Even with small topographic gradients such a terrain enables fast overland drainage during heavy rainstorms Phreatic groundwater flow systems cannot develop because of the low permeability and flat topography The more permeable and slightly elevated beach barriers have higher infiltration capacities and sustain small groundshywater flow systems Relatively large phreatic flow systems are found in the Lelydorp sands where drainage density is much smaller than in the rest of the coastal plain
20 21
36 Groundwater
36 J Aqlltrl (lIId (lqUilllld
Only a oeneral descri lion of a uifers and a uitards in the coastal lain of Suriname is given (Annex provides a more de al escrip Ion e most imponam aquifers are found in the Teniary formations The deep Eocene and Paleocene Saramacca Formation in the Holocene coastal plain around Paramaribo have not been investigated much in earlier hydroshygeological sludies (Figure 35) Oil exploration drillings show thaI this formation comains thilk sand units but these are saturated with brackish groundwater The coarse sands of the Oligoltene Burnside Formation form a wellmiddottlefinetl und interconnected unit and have good aquifer propcnies Groundwater in this aquifer is recovered by pumping stations in Panmmriho fur tlrinking water supply (Tahle 321 In hydrogeologiralliterature this aquifer is also known as the Amiddotsantl aquifer The massive Cnesewijne Formation consists of ahemashyling days anti santllbullIyers Sometimes a tlislinclion is made between upper and lower CUlscwijnc aquifers though the aqUifers are not well defined The sunds of the upper Cocswijnc Formation which have the best aquifer properties extentl southward into the PhislOcenc couswl pluin where they link with the overlying Zanderij Formation (Figure 35) Thc Cnesewijne sands ure also exploited in some smull pumpingslUtions in and around Pilnllnariho (Figure 31 anti Table 31) The Zanderij Formution contuins muinly sands and forms u good aquifer which is presem in the entire study urea Sund barriers (dlsen) in the Cnropinu and Comnie Formations form shalllgtw phreatic uquifers of local extent
The lined-graincd compacted Cretaceous deposits act as an aquitard Modem and pakol1(lY systems were not able to flush saline groundwater from these depoiits (Section 541) The clays hetween the Burnside and Coesewijne aquifers probably form another imponam uquitard as is derivcd from the originally anesian groundwater heads (Section 363 l Also clays below the Burnside Formation are believed to have a high hydruulic resistance as the sulinity of pumped water in the well fields only slowly increaies due to lateral advection rather than hy upward now from the more saline deeper strata The QilitCfIl1ry marine clays exposed in the coastal plain form an aquitard with a high hydraulic resislmce as wa observetl in pumping testi (Mente 1990a IWACOIFR Harris t991 Terracon Anguillil Lid)
362 Groundwater miJlity
The salinit patlem in thc coastal sediments has been studied before in exploration stushydi for the drinking waler supply (Groen 1998 lWACOIFRHllITis 1991 UNDPIWHO 197) Figure 37 (from Groen 1998) shows on I) the extent of fresh groundwater (chloride coment lt 200 mgll) in the various aquifers Therefore a more detailed survey has been carmiddot ried Oul ltGroen el al 2000a) [0 delineate the salinity contour lines in a Nonh-South and Easl-West section (Figure 35 and Figure 38 respectively) These salinities expressed in mgll of chloride are based on laboratory analyses of water samples from observation and pumping wells and stem tests (exploration drilling) and estimated concentrations from venishycal geophysical soundings and geophysical borehole logs
In the Holocene coastal plain brackish and saline groundwater with chloride concenshytrations exceeding 2000 mg1 is found in the upper 30 to 100 m of the coastal sediments and
shows a deepening trend towards the nonh Saline pore water in the upper pan of the
22
Figure 37 Fresh groundwaler in the coastal aquifers of Suriname around Paramaribo (from Groen 19981
Holocene coastal plain salinity has been panly nushed The depth of freshening depends on the time of retreat of the sea (Brinkman and Pons 1968) and the penneashybility The sandy beach barriers in panicushylar contuin fresh groundwater lenses which were exploited by open wells before public water ~upply was established in 1933
The Teniary sediments contain relatishyvely fresh groundwater of meteoric origin The Nonh-South section of Figure 35 shows that an actual inlerfuce between fresh and saline groundwater does not exist near the coastline as hydrogeo1ogisLio feared in the past (Groen 1998) Groundwater increases only very gradually in the seaward direction Groundwater with low chloride content laquo 2000 mgll) extends even 90 km inlo offshore shelf deposits Fresh potable water with chloride concentrations below 250 mgll is found South of Paramaribo though the panem diffe~ for the various aquifers (Figure 37) In the far South of the coastal plain pockets with brackish ground water are found These are probably related to the shon incursion of the sea in the incised Pleistocene valleys around 6 to 8 ka BP when also the Mara deposits were formiddot med (Roeleveld and Van Loon 1979 Groen 1998) Pristine groundwater not affected by salinization (CI lt 50 mgll) is found below the active recharge areas of the savannah belt and the Lelydorp sands (Figure 35)
Highly mineralised brackish and saline water is also found in the Cretaceous sedishyments in the lower part of the sedimentary wedge at depths of about 300 m (Figures 35 and 38)
23
I
bull observations 1950-1957 o observations 1970-1972
12 10
bullbullbullbull
Burnside aquiferg bull D
bullE bull E ~ o CD dOrawclown Q 8bullbull~ bypumplng cr~ --0_
Repubhek lelydOfP para nbO_2L__~LI -----------_ o 10 W ~ 40 ~
distance In km
Figure 39 Northsoulh section wilh groundwalt~r hcuds bcfore the sub-reccnt or pre-pumping pcritxl (after UNDPIWHO 1(72)
OSlO KIn AUenlic Ocesn O 5 IOKmAllentic Ocean ---- ------shy ---shy
r-------~_
_
If--H=~~~ bnderj quilet kI 1990 lie8ll11r11lle Bumamplde llqUfM In 100 llll mflllh rnped Lo IN Iorwl101 In _ rnped 10 IN Q
He8IIl kith Zenderlj equder bIIrOte IlltIftll)shyGrIIunct-lM pumping Il8lu1s (Table 32)
IOllkll~
LIrnll eumslde aqulor Grvunctwater ~ 11lI1iona crable 32)
Figure 310 Piezometric heads in Zanderij aquifer in 1990 and 1950
Sub-recent groundwater heads (Figure 39) and groundwater modelling result~ (Figure 310 Groen 1998~ Post 1996) showed that the remaining paI1 of the groundwater In the Teniary fonnations was essentially stagnant before large-scale pumping suued ~e present natural flow systems cannot explain the genesis of this stagnant and more nune~lsed par of the groundwater which therefore is denoted as paleogroundwater Indeed earher studIes (UNDPIWHO 1972 Verleur 1991) showed that this groundwater dales from the Last Glacial Maximum to Early Holocene (30 to 8 ka BP In the next chapter a more detailed
West Tambaredjo
011 field
2C-S 010 T17 TA27
East Peramalibo Sulit7Stne Commewf1s AllianceEslUsty
W04 Pb9 JKS RiY
KRI TPS
Crystaline basemenl
near Parnmaribo Suriname
~ bullbullbullbull0 ~
E -lt ~
Dbull
o
100
200
300
400
SOo
500
700
Fi~urc 38
gt( IClClClClClClC
lt lC lC lC lC lC lC lC lC lC ltXlClClC
lClClCgtI lCgtI)I)I
lC IClClC )1 lC lC)I
o r 19 15 ~Okm lC~=)llCllt lt)llC)I)I
lt)I)I)llCgtHorizonlal sce1e
For legend see Figure 35
Easl-Wesl gcological section with groundwater salinitre~
363 GIOlllldllmiddot(terj1mlmiddot sysrelll~ i1 tle Tertiaryformations
The groundwater flow systems in the Pliocene sands of the savannah belt are local ~ystems a- discussed above Groundwater from this zone does not reach the Tertiary aquishyfen ill the coaslal plain Also in [he coastal plain local groundwater flow systems do not extend into the Tertiary formations either because of the high hydraulic resistance of the Quaternary clays Moreover sub-recent heads in the Tertiary aquifers were equal to or higshyher than the phreatic water levels (Figure 39) An exception is the broad complex of sand barriers near Lelydorp The elevated terrain and low drainage density there lead to relatively high groundwater levels even higher than the heads in the Pliocene (Zanderij) aquifer (Figure 39) Given the hydraulic resistance of the Quaternary clays a downward flux or recharge of 10 to 30 mm1a is estimated In this area a flow system has developed in the Pliocene aquifer Groundwater modelling (Post 1996 Groen 1998) showed however that thisgroundwater isdischarged locally by seepage into the bordering creeks and swamps
25 24
allount is gien of the past flow ~ystems which to the formation of paleogroundwmer Pumping hy well fields in and around Paramaribo during the lasl 40 years has led to
large declines in regional groundwater heads uP to5 mI and dominates the entire flo fi~ld in th~ coastal plain
Suh-recent heads in the deep Oligocene Burnside aquifer were artesian (+ 35 mI a condilion abo found in OIher purts of the coastal plain like Nickerie Suriname (UNDPIWHO 197) und th~ coastul plain of Guyana (Ramsahoye 1959 Arad 1983 Groen 1998) Thi phenomenon cannOl be explained easily as the aquifer has no outcrop und groundwater advection from the elevated savannah recharge areu is impossible given Ih( gradienls in the aquifers (Figure 39) Ocean loading suggested by Dixon (1971) does not hold either a~ the wedge of high-density seawater cannor create such an overpressure It i~
more likely Ihal [he ltlrle im h~ud~ are the re~uh of Ihe rapid Holocene ~edimenta(ion
Instantancous sedimenl louding initially evokes increased pore-water pressures and intershygranulilr pressures The lirs nllrmally quickly dissipate by upward seepage In Ihis case_ htlcver the Oerlying Coesewijne du)s must have a very high hydraulic resistivity which has rCIltLfded this process Heads in the Saramacca Formation arc probably even higher than thosc of the Burnside Formation A study of the oil reservoirs in Surinume by Noorthoorn van dcr Krllijff (1970) rep(lrts Ihut the nuids in the Sarumaccll Formation are over-pressurishyzed wilh respcct to hydrostatic pressure
l64 (inJIIlldwaflJ 1COllry
Grol1ndwater recovery for the puhlic water supply started in 1933 with (he Republiek prodUllion slUtion some 45 km ~oulh of Paramaribo (Figure 31) This well field which is still operational pump- groundwater of excellent qUlllity at shallow depths from the Zlt1nderij aquifer Elttrlicr (in 190~llln exploration well revealed the presence of potable water in the Cocsewijne and Burnside aquifers in the very heart of Paramaribo Because groundwater in these llquifcrs had relatively high chloride contents (170 mglll the Dutch water-supply eni~
neers thought Ihilt saline groundllter wult close to (he wells and feared imminent salinizashytion of (he wells (Groen 1998) Thi~ fellr was fed by Ihe serious problem of sall-waler intrushysion in coastal wells in the Netherlands al chat lime
Only in 1958 the first well field was eSlablished al the WK Plein in Parltlmaribo to be followed hy several others in and around Paramaribo during the 20 years thereafler Groen 19981 Table 32 displays a list of all pumping stations with Iheir 1990 extractions which were used for the numerical ~roundater model (Section 432) Mosl groundwater is pumshyped from the Coesewijne and Burnside aquifers Since 1997 a large pumping station at the Van Hanemweg has become operational which eXlraCts groundwater from the Zanderij aquifer
N Station name Aquifer Produclion in m3h in 1991 (model)
I Benie Burnside 50 1 Aom Burnside 100 3 Helena Chrislina Burnside 70
Coesewijne 260
4 5
Parlmun Koewarasan
landerij Zanderij Burnside
70 830
80 Coesewijne 140
26
Zanderij 70 6 Leiding 9a Coesewijne 460 7 Leysweg Bumside 150
Coesewijne 375 8 Livorno Burnside 450 9 WK Plein Burnside 700
Coesewijne 40 10 Meerzorg Burnside 100 II Lelydorp Zanderij 250 12 RepubHek Zanderij 375 13 Tounonne Coesewijne 60 14 Blauwgrond Coesewijne 60 15 Van Hauemweg Zanderij 1000 (afler 1997)
1i1ble 32 Pumpinpound sllions in ltInd around Puramaribo (Numbers refer to location in Figure 310)
Chlorinities of produced groundwater at these well fields vary from 150 to 400 mgll and display a very slowly rising trend with lime This can be explained from the chlorinity pattern in the Tertiary aquifers described above which shows only a very grudual increase towards the North (Figure 35) Another problem are the sleadily declining piezometric heads in the aquifers At the WK Plein regional h~ds in the Burnside aquifer declined from +35 m (artesian) to -25 m Obviously groundwater recovery from the Burnside and Cocsewijne aquifers has not induced much rechDrge and is in fuct mining Groundwater levels and also the regionlll flow pauern in Ihe coastal pluin became complelely controlled hy Ihe extractions even in the Zanderij llquifer (Figure 310) Apart from increasing pumshyping costs the declining groundwaler heads may over time lead 10 land subsidence a proshyblem not uncommOn in coastal plains with overexploitation of groundwater like those n~r
Bangkok and Jakarta In the seventies a quesl for mOre sustainable groundwater exploitation started (Groen
1998) It appeared that sustainability can only be guaranteed in the far south near Republiek where there is ample recharge CUNDPIWHO 1972 IWACOIFRHarris 1991) However exploitation there appeared not feasible f1nanciatly because of the distance and the preltence of cxtensive swamps Bank infiltration along the major Saramacca and Suriname rivers has DlliQ been contemplated but salt-water tongues extend far upstream in these rivers Finally in 1997 a new large well field has been put in operation along the Van Hattem road South of Lelydorp This well field exploits a large isolated body of groundwater of low chloride content laquo 50 mgli) (lWACOIFRHarris 1991) Active recharge is taking place here (see above) but it doe~ not bala~ce the pumping rate Nevenheless the present production could be doubled and suillast for about 100 years At this moment there is sti1l a serious water supply shortage If everlasting sustainability is not required there is still ample scope for groundwaterrecovery from the Coesewijne and Burnside aquifers south and southwest of Paramaribo using properly designed well fields The well fields in and close to Paramaribo should be abandoned in the course of time
37 Conclusions
The main aquifers in the coastal sedimentary zone of Suriname consist of sand layers in the Tertiary fonnations Recharge is only taking place in the savannah belt (Pliocenez gt
27
snndsl in the fOuth and on the Lelydorp sands in the coasral plain This recharge participates in -mall groundwater flow systems and is locally drained Until r~cently most groundwater in the Ter[~ary formations of the coastal plain was more or less stagnant The (former) body of stagnam groundwater is fresh to moderately brackish and extends 90 km into the offshore groundwater where chloride contents are still below 2000 mgl Saline groundwater is presshyent in thr upper 30 m of Holocene and Pleistocene clays and in the fine-grained Cretaceous sedinienls below 300 m The groundwater eliOtraclions realized around Paramaribo after 1Yl8 lreated n man-made regional flow pattern in the coastal plain Naturul recharge does nOl bahlnle the Cwtruclions and therefore groundwater mining leads to large declines in groundwater lCveis and sah~water intrusion The latter problem i~ not as severe as suspected
belltlu-e sulinily variations in the aquifers are very gradual
Chapter 4
Freshening of the coastal and offshore sediments during the Wisconsinan regression a reconstruction of paleogeography and groundwater flow systems
41 Introduction
The Suriname data (Chapter 3) showed that paleogroundwater of low salinity laquo 2000 mgI) in t~e Tertiary sediments extends about 90 km into the onshore zone The stagnant conditions und Lhe high age indicate that this groundwater has been formed by ewtinct now systems of Wisconsin nnd Early Holocene age Note that at the end of the preceding Sangamonian transgression the sea level had reached a level even higher than today At that time the coastal and offshore Tertiary sediments were probably saLUrated with saline and brackish groundwater This assumption is based on the fact that during the early stages of the Sangamonian transgression these sedimenls were not yet protected against saline intrushysion by the Coropina clays (Chapters 5 and 10) Freshening during the Wisconsinan spans a period of 100 ka However the meteoric groundwater found more than 90 km offshore must have been formed during a much shorter period these remale parts of the shelf were only ewposed during the Las Glacial Maximum (25 to 15 ka BP) when sea-level was more than 100 m below presem level (Figure 41 Linsley 1996) As recharge appears to be very limited at present the question now arises what kind of flow syslems could have created this vast body of meteoric groundwaler in Ihe past
In order to address this question in this chapter special attention is being paid to the paleogeographical development After the sea has retracted during a regression IOpographyshydriven now systems ewpand downward and seaward and saline groundwater in their domains is driven oul This does not take place via a simple pushmiddotthrough mechanism Because of macro-dispersion at a regional scale meteoric groundwater has to pass several times through Ihe flow domains before salinities reach a steadymiddotstate (Domenico and
0iii E 20 ~ Q 40 0bull 60 Eshy 80 c Qbull 100 C 120
0bullbull ~
20 40 60 60 100 120 140
age (ka BP)
Figure 41 Sea level during the last 150 lea (after Imbrie et 011 1984 and Linsley 1996)
28 29
Robbins 1985) Freshening of deep aquifers in the domain of primary flow systems requires relatively long periods In fact residence Limes in these flow systems may even be longer than Ihe lifetime of the system itself On the other hand edimems in the domain of secondshyar and lenian now svstems with small residence times are flushed more rapidly These n~) Ktems ~re relill~d Lo erosional or sedimentarv relief forms superimposed on the regiomiddot nal slt~pe IToth 1963 1995 Engden and Klooste~an 1996 De Vries 1974 l Examples of thc Mdimcmary forms are beach barriers and dunes in aggrading Holocene coastal plains lih the coustal dunes in the Netherlands Where underlying sediments have been freshened 11 dtpths (If 40 to 60 III in a period of about 800 yeargt (SlUyfzand 1993) Ermional relief in COilsta plains is nOi so common in present marine coastal plains hut may have heen impor~
1lOt Jflcr a relative fall of sea level during the Wiconsinan glacial r renlllsirutlioll of the palcogeographicul tondiLions or the coastal plain and shell uf
Surinulll i presemed in Ihe following Bused on Ihese reconstrucLiuns puleol1uw systems an tnntepluulied and invesligaLeiJ by numerical gmuniJwater models or their efficiency in tau~inf cxtensive freshening Som~ resuhs from this study have been published earli~r in IGmclI cl 011 2000hl
-12 Paleo~e()graph) of the Suriname coastal plain
2 SC 1(Ie (1( wawlil1es
During thc early and middlc part of the Wisconsinan sea level varied belween 40 to 65 III helnw prc-Cllt -ca-kvcl (Linsley 1996) Taking into accoun120 m of Holoccne scdimenshyW(iUll ill the soulhcrn part of lhe shelf the enasllinc mUi1 have heen located 40 ll Ri kill furthcr lHlrthward During the
Imiddote years before presentla-t glacial mnill1um between 25 and 15 kl BP sea-level declined to value 6000 6000 4000 2000 o mound - 100 m (helm present sca
~_oo_------lolevel I with minimum of - 3D III at 18 ka o+--__---o~-
r _
BP (Linslcy 1996 Fairhank$ 1989) During this perioo the cOilslJine was 1 ltlcat~d even 130 to 150 km north or the prescnt coastline Afler the steep rise al Ihe heginning of the Holocene 02 ka BPI th~ level reachcd its presenllevcl al 65 ku BP (Figure -1-2 Roelceld and Van Loon 1979 Fairbanks 1989)
- Ghen an average gradient of I 1500 15for the PleisLocenc surface and a rate of obull
15sea-level rise varying between 9 and 22 mmla the coastline must have moved bull RoeleveJd amp Van landward over the shelf at a rate of 135 Loon (1979)
0 o present study bull
20 incised fluvial paleochannels forming a to 33 mlyr The sea penelrated first the
Figure 42 Sea level rise along the Suriname coast ria coast until the sea-level rise slowed (after Roeleveld and Van Loon 1979)
down afler 7 ka BP and coastal aggradation started Submarine terraces and coral reef~ al depths of 20 to 25 m on the Guiana coast indicate that around 8 ka BP (Nota 1958) or 9 ka BP (Van der Hammen 1963) sea-level rise temporarily halted
The data from Ihis study do not fall on the sea level curve of Roeleveld and Van Loon (1979) (Figure 42) This is because radiocarbon dating has been carried out on organic malerial and shells in the Holocene clays which were deposited in a shallow sea Roeleveld and Van Loon carried OUt daling on peal deposits which were formed close to sea level
422 Tapogrtlphy
DUring the Wisconsinan regression nuvialile erosion dissected the flat Sangamonian landscape ltTricart 1985 Clapperton 1993 Thomas and Thorp 1996) The Amazon and Orinoco rivers created deep paleochannels on the conlinenL and the shelf (up to 100 m)
which werc filled up later with Holocene deposito Ero~ion also took place in the coastal plain and on Iheshelf or Suriname (Brinkman and Pons 1968 Roeleveld 1969 Veen 1970 Roeleveld and Van Loon 1979~ Wong 1986) found several deep gullies (up to 10 m) in the Pleistocene coastal plain fillcd with Holocene Mara deposits The drainage pallern of these former creeks can still be recognized on the Pleistocene coastal plain in the present meandemiddot ring swamps and creeks Thc dminage dcnsity varied between 03 to 1 kmlkm2bull Also the large Suriname and Saramacca rivers must have eroded into the sedimenls of the coaswl plain and conlinental shelf Bathymetric and seismic surveys on thc Suriname shelf revealed paleochannels related to the Marowijnc and Coppename rive~ respectively wesl und east of the study area (Nota 1971 Frappa and Pujos 1994) Core drilling for this study (Chapter 4) and unpublished data from existing boreholes and cone pcnetration tests show that near Paramaribo the hottom of the paleochannel of the Suriname River wao about -35 m (below mI)
423 Vegetation
Palynological recordsdemonstille that extensive grass savannahs with Cllrardla and l Byrsolma shrub covered the coastal plain of Suriname and Guyana during certain periods of the Wisennsinan regression (LdM) and earlier regressions (Van der Hammen 1974) This eorresponds remarkably well with Ihe floristic composition of Welgelegen or clay savan~
nahs we find nowadays on some well drained clay and silt soils in the Pleistocene coastal plain (Van Donselaar 1965) This particular type of savannah may have been much more common during the laSI glacial Though the Holocene climltlte change set in at about 12 ka I BP the savannahs disappeared only after 9 ka BP (Markgraf 1993) The present grass and woodland savannahs are relicts of the vast Wisconsinan savannahs and could only persist because of the poor soil conditions and burning by the Amerindian population (Jansma 1994)
424 Climare
Van der Hammen and Absy (1994) and Van der Hammen (1974) estimate that precipi- tation during the LGM must have been about 500 [0 1000 mmla to sustain a natural grass savannah or 1000 10 1500 mma for a mixed grasswoodland savannah They also state that the rainfall regime was more seasonal with a prolonged dry season This agrees with predicshy
31 30
lion~ of 150 to 1500 mma for the LGM by global climllle models (Kutzbach et a1 1998) 1 During the Early Holocene precipitation increased (Markgraf 1993) Global climate
model (GCM) simulations show that rainfall still was concentratedin the summer monsoon This may explain he persistence of the savannahgt during the Early Holocene Palynological ~tudies tVan der Hammen and Ahsy 1994) GCM simulations (Kutzbach et al 1998) and noblt-gas studies of groundwater in Brazil and Nemiddot Mexico (Slute el al 1995 Stute and Bonani 1995) all show that the average yearly temperalure was about 5 to 6 ue lower than today during the LGM According to CKutzbach et a1 1998) yearly actual eVilpOlranspirashylion was 15middot h lower than today which leuds to a figure of 1300 mma in Suriname
-125 Hydmogy (JIrillg III LGM
The paleugeographical conditions dtscribcd in the preceding secliun$ enables us to deline a cunceptual mudel of the hydrological processes during the last glacial and the LGM
iin particular In following chapters this concept will be quantified and refined using isotopic and hydrogeochemical data and simulation models
Because of the lower and more seasonal rainf~lI runoff during the last glacial has been smaller than loday but also more variable Nevertheless the Saramacca and Suriname rivets wilh their large catchments would still have had a substantial base flow during the
)1- ~ntire year Water levels of these rivers were probably not much higher than the base of the
inci~d paleochannels
from loday though recharge must have been lower and the smaller creeks probably had a
more ephemeral character Despite thc large uncertainties in the paleoclimate we may conshy
clude that in the savannah belt recharge to the Tertiary aquifers was lower [han 200 mma during the LGM which i~ much less that the present amount of 500 mma (Section 351)
In he savannah belt nJnoff processes during the last glacial were not much different
f Estimating recharge in the coastal plain is more difficult as it depends mainly on the
heads in [he Zanderij aquifer below the Quaternary clays (see next section) Conditions on the Pleistocene surface in the present coastal plain and continental shelf were much different UP (0 140 km offshore during the LGM) This surface had a relatively flat sloping primary (opography and a secondary topography of incised creeks The interfluvial areas middotfonned clay plateaus which are preserved as the schollen landscape in the present Pleistocene coastal plain (Section 33) Most rainfall on the clay plateaus was drained by overland flow similar to whltlt we observe today in the coastal plain Most likely the incised creeks between the plateaus only carried water during (he mOnsoon season Because of the low penneability of lhe subsoil and the low drainage density base flows were very low If there were any seepashyge into the creek valleys it would have been entirely consumed by the vegelation in the gal~
lery forests in tht valleys This situation can now be observed in some regions in West and South Africa with lillie rainfall or a strong seasonality in rainfall On the flat clay plateaus marshy conditions must have existed during the summer monsoon with phreatic groundwashyter levels close [0 the surface Groundwater heads in the Pliocene sands below the clays must have been much lower as they were controlled by the water levels of the South-North running Suriname and Saramacca rivers which were deeply incised into the Pliocene zanderij formation The relatively low heads indUCed downward seepage and recharge to the Teniary aquifers (Figure 43) This recharge though small per unit surface area acted on the entire coastal plain and continental shelf and may have been greater than the recharge in the
Present situation
~ - - - - bull middotT~r1iary aquller
Topography-driven Row
Sllvsnnah
Last glacial maximum (around 15 ka SP)
---------__----
Figure 43 Present and paleohydrological conditions on the surtuce and in the Quatemary clays
zanderij aquifer outcrop The recharge and the resulting flow systcms in the Tertiary aqui~
fers were halted by the encroaching sea in the Holocene but probably persisted in lhe presshyent coastal plain to 9 ka or even 7 ka BP In this period the sea intnJded the paleochannels of the Suriname and Saramacca rivers and the grass and shrub savannahs disappeared (Markgraf 1993) River erosion may even have increased during the Early Holocene as rainfall increased while retaining its strong seasonality (Markgraf 1993 KUlZbach et aI 1998)
The next section deals with the question whether this hypothesized recharge mechashynism and the resulting flow systems were sufficient to flush all brackish and saline groundmiddot water from the Tertiary sediments up to the outer part of the continental shelf during the last glacial
43 Paleohydrological modeling
431 lnrroduction
The hypothesis from the preceding sectionmiddot ie that flow systems related [0 the prishymary and secondary erosion topography of the Pleistocene surface were responsible for the fonnalion of onshore and offshore paJeogroundwater in Suriname - has been verified with a
33 32
Boundary model C and o
_10m
Boundary model A nd B middot20m
L~nd
bull Cry51 b~~emen
IIllII Fluval deposilS bull Savann3n
o PI~tocenl plan
o HDloeene plan
~ Qlplh 51a [oor
_ MOltlIIA~ndEl
_ MOltl~CandQ
O~~__20km
Figure 44 Boundaries or numeri~QI ~roundaler models
the high hydraulic resistanees of the clay layers The southern border is a no-now boundary luimiding with the basement outcrops somh of the savannah belt Also Ihe western and easlern boundariegt are no-now boundaries which are assumed 10 follol the general SouthshyNonh now paths The nonhern houndary or the models simulating recent (1990) and subshy
model B and A respectively is located 40 km offshore in the Allantie Ocean and contains fixed freshmiddotwater heads in all aquifers In the coastal plain and offshore fixed heads were assigned to lhe nodes of a lOp system in the coastal plain they represent [he level of phreatic groundwater in 1he Quaternary clays offshore the heads corshyrespond to fresh-water heads ltalculated from the offshore wedge of seawater and saline groundwater These hetijs are generally + to +2 m except for the elevated Lelydorp sand
numerital groundwater model For this purshypo-e firsl a ~teady-~tate groundwmer model or the ~(lb-retent ilUation agt ton~trutled
I ~lodcl A) and calihrmed with groundwater head rmm thi~ period Net a non-sleadyshytate model a made ror the pre~ent (1990)
-iWlliul1 (Model HI and lalibralcd with pregtshyem groundwater head Finally the model wa~
ddapted lO the palcohydrologittll ~iluation
Juring thl LGM (Modd~ C and OJ Thi- palemiddot otl1odding ~ludy hlgt hlcn reponed in glllIer JLlail in Groln el al 1(JOOh)
-132 Reccllf (1(1 J-(((111 maddling
For the fOundwlter ~il11ulation~ model flf the Paramaribo coast1I plain Wil~ lomtrulshyLcd ha~ed Oil the MICROFEM lode (DiodllO 19971 The 1ICROFEM code i~ a Ilnile deshymellt (ode for simulation or 4Uil~i thnc-dimenshy iolla 1l011-s(alilIllr~ nlllndwatct nuw in a ~ ~tetll of atjuirereparatllJ hy scm-perl1le~lshy
hk layer~ For 11K cllnSlrutioll of this model carlier ground ater l1ll(klling gttulJicgt or the Pliocene and Miocelle il4uifergt (WACOFR HaITi 1l)911 lIld the Oli~oLenL aquiler (Hutchinson ll)l)()) have been consultelJ The l1lodel comprigtegt the following live aquifer (Figungt 3 4 and 351 (i) ZanlJerij (Pliocene) (ii) Upper C((~e ijne (tvlioccne l (iiil Lower Coc-ewijne Ovlitcenel (iYl BumsilJe (Oligolenel and (v) Saramacea (Eolene and Paleoccne l The first version or tlligt groundwashyter model was 1llltlde by Post (1996) The modelled area igt shown in Figure 44
A large modelling area was chosen O
account for the large leakage factor caused by
recent (19571 condition~
barriers where heads of +4 mare mltlinlaishyned For the outcrop of Ille Pliocene Zanderij aquifer in the savannah belt a fixed recharge of 500 milla is imposed on the node~ Model A (1957 situation) wa~
run in steady-state and lalibrated with the data from the 1950-1957 period Then Ihe non-steady-state run wa~ made by imrodushycing the various abstractions in the period between 1958 and 1990 The Iinal situation in 1990 (model B) wa~ lalibrated wilh headgt measured in the period 197-1990
The procedure WIS repealed several time~
until a reasonable lit was reathed The aveshyrage difference between mcasured and lalshyculated heads in the Zanderij and Coesewijne aquifers for thc 1990 situation wa~ U49 m and equal to the modelling sllldy of IWACOFR Harris ( 1991)
~
~
1
1 1
~
I Paltod1annel SarilmaCCl RJIf
1
1 1
-- I )---1 I
-40
1 I----J] lL__7=---j
Comparing meaured and calculated heads for the BUTniue aquifer was more difficult Fi~un -15 Sirnulaled headgt ill the Zmdcrij
because most observationgt werc done within aquifer during thl LGM the cones of depresiongt around the pumping station Dirferences varied from 025 to 200 m just as in the study or Hutchinson (1990) In Figure 45 groundwaler heads in the Zandcrij and Burnside aquifer arc shown cltlkulated by model A (1957 AD) and model B (1990 AD) The contour maps show thai grt1undwater now in the coastal plain in 1990 is complelely controlled by groundwaler extractions while beroshyre 1958 almost stagnant conditions prevailed
433 Modellillg Ille paleollydrology (~f II( Luc Glochll MOmiddotillllllll
In order to study the groundwater now systems during the LGM tnd the role or the ero~ional relief paleohydrological modeb (model C and D) were conslructed on the basis or model A These models have only experimental value as the ofrshore permeabilily dislribu~
lion is largely unknown apart from a general trend of decreasing permeabilities as sediments becomes finer towards the Nonh During the LGM the coaSiline was localed close to the shelr break 140 km nonh of the present coastline (Figure 44) Therefore the nonhern boundary of the models was extended to the shelf hreak where no-now conditions were imposed in all aquifers
In model C fixed heads along the Suriname and Saramacca Rivers were set equal 10 the boltom of [he paleochannels which grades from the present river bottom ltJl the edge of lhe crystalline basement in the south [0 a depth of 30 m relative to the Pleistocene surface al Paramaribo and finally 10 an assumed depth of 15 m below the Pleistocene surface (seltlnoor) ltIt the shelfbreak Recharge on the Zanderij outcrop (present savannah belt) was lowered from 500 to 200 mmla (see Section 25) In model C the lOp system in the coastal plain was turned into a phrealic system with fixed recharge Also a drainage level of 10 m below the Pleistocene surfice (depth of the creeks) and a drainage resistance of 5105 days were assigshy
35 34
I ncd [~) aln()dc~ The urainage resistance calculllcd hy relmions given by De Vries (19741
llliltc bl~h hccau~e or the low permeahility ll the clay~ and the large spacing of the creeshyk 0 Irial and errol the rccharge rate~ on the coastal plain were varied umjl roundwaler
lech Crlmiddot dm~ tn Ihe PJci~locene surflec ~his was ha~ed on the assumptio lhat marshy (olldll(]n~ preltuled On Illc Hat alld badly drained clay puleaus_ For verilication a ~econd pakohydrnlugical model mudel DJ wa~ made wilhout incised paleochannel in order to illc~tigl1 the effect or the erosional rdief In thi case all node~ 011 the coastal plain were a~IJlId Ilxcd head~ equal 10 tbe Pleis(Ocene urface
~illllt1ali(lI1o with model C showed Ihat inliltralinn occur everywhlre on lhe day plashyICHI In the Pklstocene cOilstal plain Recharge varies between 44 and 56 m1l1 Because of Ille high drallllgl rei~tallce llilly a small pan (lt 2 k) of lhis amOUIH exfi1trille~ in the
IIlli~Ld Lrlel on lh~ day pIUleau~ MOSI pan nf the inlihraled groundwater seeps downward l~l tllL underlylllg PII(lLene ZlIldenj aquifel Thi~ aquiler i drained hy the deeply illtised Sllllll llne ltId SanmlltlCCa rivers as i~ shown in Figure 45 This now system is called a sec oll~ry 110 y-km a it is controlled hy Ihe secondary topogruphy created hy erosion of the ]1qor ~lIfJ11amL and ~arlI1lacca rivers Heads in Ihe deeper aquifers are less COntrolled by the maJur fI vcr and md1cate a mOre rqional paHern wih recharge on the clay plateaus in lI~e iOUlhcrn part of cOastal plain presem coutul plain aoLl southern part of the shein and dl charge l~l the lloodplains Ill Ihe Sarumacca and Suriname rivers in the north (northern part ot Ile ohell) In FIgure -1( groundwaler age wnL inlhe aquifers are presented Note that the~~ ~Igc refer IOlillle elapsed afler recharge In lhl upper Zanderij aquifer groundwater is rclahvely young laquo 0511) lhroughout the coastal plain because of the rapid eirculation in lhe ecandary Il~J sy~ICI11S C1emly -oaline groundwater in lhe domain of lhese seeondary ll~ yslel1l~ could have heen Ilushcd entirely even in the Olller part of the sheIL which was lxpncd onl) dUring the LGM The deeper aquifers helong to the domain of the primary and rcgmnal nuw -slem In this domain grouIdwater ages vary from a few hUlldred years in lhe ~lllth~fI1 In ~o ka in the northern and outer pan of the shelf This implies that saline water in lhe pnllllry no domain could no1 have heen nushed from the Ouler part of the shelf
In model D Ithollt the erosion lopography only 1 primary groundwaler now system CII Recharge occur~ in the southern par of the exposed sheiL up to 25 km offshore from lile presenl coast Upward seepage dominates in the outer pan of the shelf Groundwater
a) Model C b) Model 0 Lelyd
Savanna Param 0 50km 0 I I CQasUtne
j
200
00 ~ 0
600
OJ lt1ka
0
Basement 200
400
iii 2-4ka II 8-12ka II 16 -20kam 1 -2 ka 4middot8ka D 12-16ka II gt20
Figure 46 Groundwaler a~es calculated by paleohydrologieal models C and D
recharge arie~ from 5 10 lJ mma in thc zone coinciLling with the present Holocenc coastal plain and 20 050 mmJu in the present Pleistocene coaslal plain Highesl values are found in the zone between Rijsdijk Road 0 Republiek where the PleislOlenc clay layer (Coropin1 Formution) is relatively thin Groundwater age~ in lhe deep aquifers arc ahoul equal to those in model C Only in the ollter northern pan or thc shelf ages are higher than in model C According to model 0 saline ground WOller could nOI have heen Ilushed from the outer pltJrt
of the shelf
44 DiscussJon and conelusions
The stagnanl body of fresh and moderately brackish groul)d~Her Cgtlending from the coastal plain to more Ihan 90 kill offshme ltanl1ot have been produllu by the pre~cnt low systems (Chapter 3) This paleogroundwuter has been formed hy diflerenl groundwater llo syslCms during 1he Wisconsinan regression (115 ka to 12 ka BP) During this period sea level was much lower and large pam or the eonlinental shelves were egtposed During the LGM (25 to 15 ka BP) sea level dropped more than 100 m wilh respeello lhe presenllevel In thm period the coastline was located 140 km further north Climate wu~ colder (5 C dil- krence) dryer (50 (1-) and had u more seasonal rainfall pauem (horeal summer monsoon) Grass and shruh savannahs covered the Pleistocene surface Rivers and creek~ eroded the surfuc-c and crealed a landscape of c lay plateaus and intlsed valleys ( 0 10 30 m deep) Perennial runoff only occurred in the large Suriname and Saralflacca rivers_ Because of lhe incised rivers groundwater head~ in the Zanderij aquifers werc much lower lhan today which induced widespread rechLlrge The larger recharge LInd the erosion reliel crealcd secshyondary now systems superposed on a primary and regional Ilow system (Figure 47) Paleohydrological groundwaler models showed thaI (he primary now system could not have led to freshening of the outer pan of lhe 5ihelf within lhe shon pcrlod of the LGM Only (he residence times in the secondary now systems were short enough to allow severul Ilushings of the upper aquifen The conclusion is thm during the Wisconsinan rtgression secondary now systems exisled relaled 10 an erosIon topopgraphy which is no~ obscured by Holocene sedimcnls These syslem~ played un essential role in freshening [he upper Tenilfy sediments
Pleohydrologieul modeling using lhese quasi-3D hydmulic grOlllldwaler models is useful for qualiwlive interpretalion and the creation of eoncepwal ideas as described above In the firsl pce there are 100 many unknown hydrogeological paramelers e5ipecially in lhe offshore zone for a realistic simulation In lhe second place the applied code is not suitable 10 study the actual process of freshening as it does not lake inw accoum solu(e transport and variable-densilY nov it would be inleresling (0 use vmiablc~densily Om codes like l1e one presented in the last chapter to study the dynamics of freshening on large temporal and spashylial scales
37
~ brackish Topography- driven Refreshening during regression
now
bull 00
Fi~un -17 Frcshclling or the lumaal md onshore der(Jsi(~ during llrunsgrcssiol by primary and -Clondary now sy~ILmiddotmj
Chapter 5
Salinization of the coastal and offshore sediments during the Holocene transgression a stud) of diffusive solute transport
51 Introduction
in the coastal and onshore Tcrtiary gtcdilllcl1tgt or Suriname a large stagnam body of fresh to moderately nrackish groundmer is prcscnI (Chapter 3 Figure 35) It was motivashyled in ChaplCf that Ihis groundwater was formcd hy extinct now systemgt that were aLtimiddotc during tbe Wisconsinln regression Thigt meteoric groundwater is therefore denoled as pltllcshyogroundwatcr according 10 Ihe delinition propogted in Section 24 Pristine groundwalcr (secshytion 21) with chlorinilies less Ihan 50 mgll occurs only in the present recharge areas of the savtnmlh helt Ind the Lelydorp sands (Figure 35 Sections 362 and 363) The remaining and major [JUri of meteoric groundwater in the Terliary formalions the aClUal paleogroundshywater is more mincralised with chlorinitic~ up to 2000 mgll (Figures 35 and 38) though origimdly the chloride content of this groundwater must have been Iqwer md comparable to present pristinc groundwater It is mosl likely Ihm salinization of the paleogroundwater stan~
ed after the marine suhmersion of the shelf during the Holqcene In lhis chapter we will have a closer look al the salinization process which is related (0 horizontal adveclion or vcrmiddot lical transpqrt from the qverlying and underlying saline sediments (Figure 35 and 38)
Horiwntal advection lakes place when the shoreline advances landward during a transshygressiqn and the freshsltlline interface mqves along with it driven hy density differences in groundwater Mei~ler el a (984) sludied the dynamics of a freshsaline interfltlce in a conshyfined aquifer 90 km offshqre fmOl New Jersey (Hmhaway et aL 1979) where conditions are comparable ((l those in Suriname Using a numerical groundwater model lhey found out that the imerface there is mqving landward wilh a speed of 003 mla under innuencc of the Hqlqeenc Imnltigressioll Essaid ( 1990) carried OUI a ltiimilar study in Momerey Bay CaJifqrnia and repqrlcd value~ of 00510 02 ma On the other hand shorelines migrated landwJrd wilh a speed arying between 3 and [80 mla during this time based on rates of sea level rise of 10 to 30 mmla (Cronin 1983) and shelf slopes of 16000 to 11300 CqmpJri~on of thesc figures shows thatlhe freshsaline interface in groundwater lag behind th~ advancing Holqcene shorelines and that salinization of fonner meleoric groundwater is mainly the result of vertical transport This applie~ to Suriname but is probably of more g~neral significance as will be discussed in chapter 10
Salinization by vertical salt transport may take place as convective density-driven no Under certain crilical conditions density currents in the fonn of downward protruding finmiddot gers of saline water arise in groundwater with an inverse density stratifieaLion (Wooding el al 1997a 1997b) In this case the reverse strntification relates to saline groundwater deposhysited by the encroaching sea on top of fresh groundwater Van der Molen (1958 1989) and Gieske (1991) believe Lhm convective density flows may have been responsible for the rapid salinization of the mainly sandy formations in the eoastal plain of the Netherlands They calshyeulated the approximate velocity of downward moving fingers of saline water and concluded that in a period of less than 200 years more than 200 m of sandy sediments could have been
38 39
become brackish or saline The fael lhat paleogroundwmer i~ still well preserved in the Suriname case i~ an indication that lhis process htl- not played an important role This will he -ubSliIlHiatcd further in Section 53
In the lbence of convective density Lurrenb slow downward diffusion of salts after the Holocene trangression become the dominanl salinization process of the paleogroundwaters in Lhe upper QuHernary and Teniary fomlations Below a rertain point brackish groundwashyter rllay contain salts from a mULh earlier marine transgression Thi zone is part of the disshypcnivc lransition layer existing before the Holmcne transgression Upward diffusion from lhi rone i llot cOI1idered here as it proceeds much slower tban downward dirrusion conshy~middotenlrillioll gladicills in the deep dispersive transition layer are a 1m smaller lhltln those in the Illrp trltlnition layer ahove the paleogroundwuLer created lifter the tfillsgression
A new diITusilln-~edimcnta[ioll model is developed for Lhigt case subequently Lhloride cOIlLCnlfILon alJd igtotopc fltltios simulaLtd with lhe model ltIre eompared with observashyti-tlllS
This lhilpler~s based 011 an eartier published arlcle by Groen eL al (2000a)
i
Fm t~i~ silld) numerougt chloride analyse- of groundwater samples rrom existing wells gcodcetrical oundin~ and geophysiLallogs of oil welb were availahle (Vclstra 1966) These fl)llncd the hasis or the chlorinity pauerns displayed in Figures 35 and 38 Chlorine~ iSOlOPC [~Hi~ were determined for 16 salllplc~ from existing wells
Al tlo s-ites on ille coastal plain clay samples have been recovered from Holocene ltlnd 1IIldcrlyimiddotli~PleisLoLene clI)S in order 10 study shallow salinity gradienls The sites al Koewarasin and Tourtonnc are located near Paramariho about W and 3 km from the coastshyline rcspcdively (Figure 31 Annex 11) Drilling was carried out according Lo the Ackerman llethod bt)re)lOlcs were drilled will normal cllble tool technique while at certain depths lOfC were remiddotlQered by pushing a st_lll1less caing inlo Ute borehole bo[om (45 em length and 65 cm diameler) The drilling logs arc shown in Figure 51 Some shells and peat pltlnishycles were dated with IJC analyses (Figure 51) The upper 55 mat Koewarasltln consist of grey plastic clay and is or Holocene age The underlying Pleistocene clays are very stiff and sIH)~ dislinelltd yellow ltlnd olive-green mouling AeLording 1O Veen (1970) the Pleistolene clays havc been deposited during the Sangamonian transgre~sion ( 130 b 10 115 ka BPl AL the final depth of 19 III fine sand was found AI Tounonne only very plastic grey-blue Holocene clay was encountered down to the final deplh of 25 m In bOlh drillings shell layers were found between 4 and 5 m
Pore waler was squeezed from 11 cltI) samples (9 from Koewamsan and 13 from Tounonne) and was analysed on chloride and all major ions (Velstra 1997) Chlorine-isotoshype ratios were measured on 9 pore water sltlmples (3 from Koewarasan and 6 from Tourtonne) Isotope mcasuremenls were carried out according 0 ltlnalytical procedures desshycribed by Eggenkltlmp (1994) The chlorine isotopic mtios J1R (rmio of rare isolope J7CI to abundam i~otope J5CI) are reponed ltIS dirferences in c from Srandltlrd Meltlll Ocean Chloride (SMOC) shy
)1 R _ J7R 001lt llfOC 1000 (51 )
RSJoc
All water sltlmplesfrom core driHing- and welb wer analysed twice The ltlverage dHfe rence between each pillr of omiddotl7CI-analyse~ (n= 24) wagt 007 Ifr wilh standard dcviation 007 Wr
Tourtonne KoewaraSltln
depth In Firm hrown clay wllh some m belOW small Iron concretions
Very poorly drained half ripe clay wilh root remnat1ls
depth In
m below SlIlf grey day With root
sunace surface Firm IIghl grey day Withremnants
redbrown mottling and SOfl grey clay Wllh some tool remnants brown mOUllng and line sand
Soft dark grey clay nch In
organiC mailer and Some gree moiling Shelllldge Wllh coarsemiddot rne sand ampOBPHoloshy
cene 5 Shell rrdge WIth whOle shell malenal
2950B
6 6 Sllff grey-blue clay With ohvegreen moUllngSoft dark grey Clay rich In
orgamc maller Clay pebbles rich n Iroo
bull Bed of Shellltagmensbull - gt 40000 9P
9 Clay pebbles9
10 Firm red and yellow moliledHoloshygrey-blue clay With fine SJnd cene and shell fragments
SIlcky dark grey clay nch In
organiC maUer wllh some
11
shetllragemenls12 - Red-brown Iron coocreLlons wllh brown coarse sand 13 4970BP 19
Pleisto- Very sllft grey-blue clay With 15 cene some brown mollllOg5
16 Stltcky dark grey clay With fine sand
Stiff grey-blue clay With some 18 brown mottling and whlleshy
brown fine sand19
19 Strff dark grey clay rich In organic matter and20 Whilebrown medium fine sand
Legend7400-810022 BP ~ Shells With sand Root remnants
2J MOlllingsect Shells Iron conClellonS
~ Clay OrganiC malenal
Q Sand 29508P25 C_14 age
Figure 51 Drilling logs at Koewarasan and Tounonne (Iocalions shown ill Figure 31 and Annex II)
4 40
53 Solute lransport and fractionation
531 DOII11IIH comiciImiddotc SOIIIC I IlInsp01
The critical conditions under which convective density eurrents arise in groundwater wilh a reverse and linear density strmillcation are anained when the Raleigh number Ra eceed- -l12 (Paschke and Hoopes 198-l Schincuriol and Schwartz 1990) Wilh
(52)R
whereJp is the densil) difference hetween top and hOllom of the sediment layer (kgmll ~
the acceleration due to grtvity (ms 2)1J Ihe dynamic viscosily CPamiddots) K the intrinsic penneashybilil or the -edil1lelH (111 2) H Ihe thickne-s of the ocdimem layer (Ill) and D the erreclive dilT~-illn codlicienl (m 2-) Permcahility den-ity difference and thickness are the delermishyning factors in the Rayleigh numher A-IJ (d(P) g (gt10) and D (gt10 10 ) do not vary much and f the hydraulic conductivity in mday is equal to KpgllJ (pgIJ = HP) E4 52 can be
-implilied 10
Ra gt 1(( bp JkH
Eq 53 ha- heen applied 10 thc Quaternary clays of Suriname with a hydraulic conductishyit~ 1c--than 10-1 mda) a hickness larger than 20 m and a maximum density difference of ~ km between seawater md fresh water This results in Rayleigh numhers far less lhan Ihe ~riicJ1 alue of 41[2 indicnlillg that diffusion is Ihe dominming process in the
Quaternary days
Diffusion (If molecule~ in ltI lilUid is a llmss transport process due 10 random thermal (Brownian) motion of the molecules Fickmiddots first IDW describes Ihe diffusion process DS
(541
where F is lhe flux of molecules (mollsm2) C the concentration of molecules (mollm) and D the diffusion coefficient in waleI (m2Is) Combining Ficks firsl law with the law of conshy
seralion of milSS yields Ficks second law
(551
The equation can be solved for various boundary conditions The most appropriate case is a semi-infinite porous medium filled with waleI with concemnllion Co which at the finite end is suddenly exposed to a solution with u constant concentration Cs With boundary conshy
ditions C= Cf for gt 0 und f = 0 c = CI for = co and f ~ 0 and c =C for = 0 and T ~ O lhe following unulylicul expr~ssion can be derived ltCurSDW and Jaeger 1959)
(561C =c+(c-C)ef~ 2fo] Note thut D i- replaced hy D the effective diffusion coefficient in a porou- medium
(see below) If advective groundwatcr now abo contributc~ 10 mass transport Equation (55) is expanded with it llow term to
(57)
~ i Il7 3Jwherc i~ the llow vdodlY of water h_oSwe
tlJSz ~
For the case of a fluid with sail concentration C entering a semi-infinite porous n - j 8J-8~ um with waler of sail concentralion Com a now velocity Eq 57 can be solved wi e] sect 4i shysame houndary condilions a for Eq 55 Ogata and Banksmiddot ( 1961 ) found the followi lIlilg g sect t
l IV 0 0I)lical expressionmiddot QuQtv_~~J(
e ~ iti ~ C 0+ (C-C)[J~-lJ~ +ex II ( J~~secttJ--C J~+J]shyell ~
2 LJD D 2JD1 E ~ ~ ~Jj ~~
t 5 gj i 533 DWil~i(m cOlfficiellTJ Omiddot$~~
E3 ~~1 Diffusion coefficiems of solutes in water are a function of temperature an ~lecuor
ltnomic mass Based on Ihe Stokes-Einstein equation Woreh (1993) (in Gmtw ~ 99R6 Jf derived the following rclalionship for uncharged molecules like gases ~
(591
Where T = tempermure (K)IJ = dynamic viscosity (Pas [1002 x 10middot) and III = molecular mass (gmol) for a certain ~olute
Aceording 10 Grntwohl (1998) this equalion works also well for non-dissocimed organic ~ubstances However for charged ions his relation does nO( apply because the ions cannot diffuse in isolalion electroslutic forces mutually influence the mobility of the ions The result of this complicaled coupled diffusion process is that differences in diffusion coeffishycients are much smaller lhan expected from their molecular weight Experiments show thal diffusion eoefficiems of Ihe major ions in Waler vary from I x 109 to 2 x 10⁹ m2s at 25 ltC Robinson and Stokes (1965) and Li and Gre~ory (1974) repon a value of 12 x 109 m2s for seawater diffusing into distilled water the self-diffusion coefficient of water molecules is 27 x 109 m2s (Wang el aL 1953)
Diffusion in pore Water of saturated sediments is slowed down by obstruction of the grains and by the tonUosily of the pOle channels Various empirical relations have been defshy
43 42
ined between the effective dilTusion LoelTicient (Dc) and lexwral properties such as tile effectiv transport-lrough porosily Ipan or porosity acting as transport channel~) lortuosity of tbe pore channeb and pore con~lriclivjl~ (Grathwohl 1998) In practice these paramelers arc unknown and onl~ the bull porosily llpl 01 ~edimenl~ i~ delermined Most authors lise lh empirical relation
[5101
field md laboratory ~ludic yield a wide variation or alue~ 01 m which also seem 10
he il rllllcion ill p()r(lil~ In hle md compacted days 11 i~ relatively high Remenda el II ( 191)(]) ille~ligmcd dilfll~ion of Ol~() in a day-rich till and found a value of about 01 for the raliu D DltI which l~JITCPOllds In aboul 11 = 2 with day porosiie~ varying between 03 and (U5 Lernmll (11)71)) ill Ranganathan and HanoI (1987) found vallle~ of 25 (0 SA for ~hlk For yuungel ks~ consolidated day~ and ~ands IJ1 i closcr to I (Appelo and Postma ])Yi)
Studie hy )esaulniers et al (19811 Bedman (1991) Volker and Van del Molen ( IYY II and Eggcnkamp tl a1 ( 1994) resulted in valueo for D varying from 5 x JOIO to 13 x I() III 1ll~ A thc conditions of these studies arc comparable to tbose reported here diffushy~i(111 c(Jl~llilicnt an expecled 10 fall ill the same range
3J FnllilJlIlI1l11 f(chorille-is((JCI hy d(lIsil( 1(I~lOll
Chloride iOlls ar~ ch~lnically inert in underground environments and are therefore the 1I1l1S appropriatl ion~ for studying diffusioll processes Measuring chlorine-isotopes middot~CI and 7CI g1middotC alliahle extra information as diffusive transport creales fractionation of concenshytration Till dillennlc in atomie mass of the isotopes brings about differences in mobility am] dilll1~i)n loelrkienLs (Eq 59) The heavier isotope i slower and therefore the solUlion heClIllK rllativcly depkted in heavy isotopes at the diffusion front and relatively enriched tlar Ilk ourcc Th~ r~ltio of cllcetive diffusion coefficients for both isotopes is equal to the fralmiddottitlnalitlll faclor 0
D middot0 tto--- (511 )
v 0
Thi~ factor cannot be dcrived thcorc1ically as for gases because hydration of chluride iL1n~ in Ihe solution moderates the effect of the mas difference belween Ihe two chloride i~owpe Fraetiotlltllion factors derived from isolOpe measurements in comparable environshymenh - shallow sediments affected by recenl transgressions and regressions - vary from 10012 to 10030 (Desaulniers et al 1981 Beekmall 1991 Eggenkamp et a1 1994)
Fractionation of chlorine-isotopes as a result of diffusion can be simulated by separalely calculating the 3~CI and 37Cl concentrations using Eq 58 or 513 Initial concentrations are - based on the chloride concentrations and the chlorine-isotope ratios (J7R) of seawater and
fresh groundwater For the present study the l7R of these waters were eonsidered 10 be equal to a 37RsMOC of 031978 (Eggenkamp 1994)
r
------------- shy
535 D(flfSrJ1l-sedilllll1lali(II IIlruil sillluaring mmsgreHr)ll follmnd by regrlssioN
The downward diffusion process in the Suriname coastal plain is more complicated than the simple analytical model of Eq 58 Firslly exposure to the sea was temporary and secondly marine sedimentation took plale during the transgressive phasc Eggenkamp (1994) found a solution for the sedimentation problem by letting lhc origin ( = 0) move along with thc rising sea noor during sedimentation and regarding Ihe salinization process a~
a downward now of salt waleI in lhe underlying sediments with diffusion at the salt front If edimentaLion is constant Eq 58 is valid with I equal 10 Ihe sedimemalion rate However lhe lrans~ressive phase and Ihe sedimentation are of finile duration and are followed by a regressive phase and Ixposurt to fresh wattr at the lOp Beekman (19Y I) used a finitc diffeshyrence scheme lo simulall lhtse condition Here another solution i~ proposed analogous (0
thaI for the hcat-no problem described by Cars law and Jaeger (1959 p 58) In order to apply this solution the semi-infinite concentration profile at the start of the regression is madc infinite using
(S12)C_~I = 2C rtfl - C J
where f is Ihe lime elJpsed between Holocene transgression and regression C1f is the chloshyride concentralion aceording to Eq 58 and CTltI is the chloride concentration of fresh groundvmiddotater at the surface C t i~ tbe imaginary chloride profilc eXlending infinitely upward from the surface The cvolution of the ltubsurface pan (- 0) of this infinite profile according to the diffusion equation is exactly the same as the evolulion of thc semimiddot infinite profile with boundary condition C(I = CiI After the regression (I I) the evolution of the chloride conlenl until presenl can be determined by convolulion of the initial profile (at the SUln of the regression) with Greens function The convolution inlegral ha the following fonn
(5131
where II is elapsed lime between the Holocene regression and the present
A straiglllfonvard analytical expression does not exist for this equation The function has to bc made discrele by calculating a large number (N) of concentration at certain depths with spacing 6 beforc the convolution is applied Because the integration has to be carried between certain limits along Nt mus be large enough to include the area of influence of lhe diffusion process The calculations were perfonned using tbe mathematical MATLAB computation program (The Math Works Inc Natich USA) accuracy was tesled by varying the spacing and N Results indicated that the final eoncentration values did not change for 6 lt 025 m nor for N gt 600
Applying Eq 58 and 5l3 in the actual field situation is only valid if the aquifers and the Pleistocene clays contained prisline meteoric water (C= Co for gt 0 and 1=0) al the onset of the Holocene transgression The Pleistocene clays from the Sangamonian transgre5~
sion contained seawater However it can be readily shown with a simple diffusion model that during 100 ka of the Wisconsinan regression all salls from the Sangamonian transgresshy
44 45
sion hae dillu~ed OUI of the clay~ to the phreatic surface and to Ihe fresh underlying aquishyfers Further evidelHe i~ given by Levell and Quakernaat (1(68) who reponed dilute pore walCr in Ihe Pleistocenc clay~ in the ~ouhern pan of the coa~ilal plain Fre~heting of the cJy during Ihe Wisconsinnn rcgrc~sion Wl probably enhanced by downward ~eeragc
induced hy the deeply illci ed river~ and creeb (Chapler 3)
5~ Rcsulls
(jliiemon dan In tile ah-clIce of cOllective densiL) How discu~sed in Section 5J I the di lfusiol1-scdishymelllltiOIl model can he applied to the Quaternary clay~ Figun i2 display~ depth prorile~
or chloride cOllCenlrLion and the 07CI alues for pore water from the clay con~s al
oewaraan lI1d TOllrlonne Maximum cOllcelllralion~ an ahout JOOO mgtl (or H5 Illmoll) 1( KoewanNlll and IXOOO mgtl (or SOD lllllloltl) at Tounonne Toward~ the top and hottom (If the chI) ronnaliOlh watel become~ fresher The high salinil) al Tounonne marks a rccell nnat of the ~ea II lhj~ ~ite Koc ara~an hJS experienced a longer period of frehening 67el middotIlles deviate fTlm the SMOC value W(kd indicaLing a diffusion elreet in the proshyCl~ of rre hening The oliCI vdue at Tounonne decrca~e down profile from positive to negalic Thi~ indicate downward dilTusion Wilh iSOlOpic enrichmenL at the pcak COlleentrashyli(lll~ and depletion elo~er 10 the dilTu~ion front The onCl llues aI Koewlrasan where only three analyse~ have h~cn clrried Out are distinctly more posilive Apparently a longer period of dilu~ion la resulled in a relatively large enrichment throughout the entire clay layer
It wmdd hc impn~sihlc to calibrale all paramecr- of the diffusioll model (Eq 58 and 5131 with the anuly-cs of chloride eoments and chlorine-isotope ralios Howevcr for some pamlllcleh reliabk assuillptiom can he made The time of tTltlIlsgression can be derived from 1)(lt11 ~Cltl lccl cune 1Brinkrnan and Pons tX Roeleveld and Van Llon 1979) TrIl~~re~~ion at Kocwlwsan and Tourtonnc is estimated at 6 ka BP and 10 ka BP re~pectishy
nI) TIllS lil11~ i~ equal Lo the sum of and I in Eq 513 Holocene sedilllentmion ra[e~ 1middot)
al KoeWilntSan and Tourwnne have been deried from l~C dates of shells and orgnnic mateshyriltll in Ihe clay (Figurc 51) the rate~ ar~ 29 and 26 mmyear respectively The chloride
~ cOl1ccntra(iOIl~ of fresh llleicoric groulldwler before the transgression (Co and C P
r) and at
the surface aflcr the transgression (Crr) are 25 mgl orO7 mmol1 This value is the aerlshyge concemration of groundwater in the Tertiary fonnaLions below the recharge area of the Ldydorp ~amb Seawater chloride concentration is assumed to be 20000 mgl or 566 m1ll0ltl (Appclo and Postma 1993) The isotopic rmio of seawater chloride (7Rs~IOC) is equal 10 03 1978 (Eggenkamp 1994) We may assume that in coaslal arens like Suriname ehlorid~ ill rainfall and in fresh meteoric groundwmcr is of marine origin (Appelo and Postlna 1993 Drever 1997) Evaporitic rocks which may release chloride do not occur in this area Moreover Krook (979) states that only the most stable siliemes in the Tertiary sediments of Suriname have survived intensive weathering Consequently fresh meteoric groundwater must have lhe same isotopic chlorine ratio as seawater which is expressed as amp7C is equal to 0 9Cc With the assumptions on concentrations and isotopic ralios the initial concentrllions of 35CI and 37CI are known
I I 0
L __~o~_=~~
o Chlorido lmgll 0000Cnlgnde (gll Cnlde (mgll)m 00
0 0 -------- _ 0 I --~)~)II~~I - bull 10 I 0
i rJI i I I ~
~ I TononneTononnei Tononne ~--~=~
~31CI 11001 ~]7CI (1001 ~]7CI 1100)
0 10 middot171
0
lti I I bull J I r
Tonorne I Tononne I30 Tonolll1e i 30 KoewarUJn Torlol1l1e
8 3700 Effective ChlOllee b = 3900b= 10022b 510 ~ JRegreSSiondiffUSion lTacttollshy
C 400 c = 500 date In yrs J ooJC 710 coeffoents c= 10027 allonlacshyd= 700 BPd 4300d = 910middotmiddot t (De) In mls d = 10031 tors (u)
e 4500 e = 900e = loo]~e 1110 0
Analyse~
-
Figure 52 Measured and simulated chloride concemrations and 0-7C1 vn~ues or ~re water fr~m Ille Qualemnry c1nys al Koewarasan and Tourtonne Curve fitling resulted 111 nn optimum ef~ectiVe diffusion coefficient nnd cllionne-isolope fractionation of7 x 10middot0 m~s and 10027 respecllvely Witll curve fining regression al Koewarasan and Tourtonne was dated nI 41 ka BP ~nd 05 kn BP respectively leading to sedimentation rates of 29 mmyear and ~6 mmyear respectlvely Tile assumed lransgression al both sites at 6 ka and 10 ka BP respecltvely was previously based on 1C-analyses
47 46
Thr~e unknown parameter~ r~ Icn in the dirrultiion modeL 1 = pcriod bctween regresshy~ion and present (1 + is known) D = effeclive diffu-ion eoertlcicm of the abundant middotmiddotiCI isoltlpe a = fracliomnion faClOr hetwcen the middotCI and IC iSOIopes Thc model parametergt n and a were optimised by trial and errur ulHilthe calculated prolie~ of the chloride COI1shylemlation and 61Cl ril~d the luhoralory meauremenb (Figure 52) As an cxtra comaraim w thi- procedure values for 1J and a for both siles were set equal to cnsur~ the reproducibishylity of the a~-ul1led diffu-ion process For D a llue of 7 X I0- 10 m~s la~ found which lics within the rlI1ge of value- reported abomiddote The same holds (rue for the value of 10027 fuund for a The n~ ultillg regression dale- arc 41 ka BP and 05 ka BP for Koewarasln and Tourtollilc respectively
Figure )2 di-plays tile sellsitiity of thc modcl for variations in parameters value- PMltlmder c in each subllgure represents the optimised vulue It is interesting to note- that the modelled 07CI at KO~ilrsall is nm verv scnsitive In variation of the regression date This is hecause Ihe rmio of the IraL1sgn~ssive period to tile regressive period does nOl differ much within thl ranc 01 rcre-ssion dales At Tourtonn~ regression lOok place only a few hundred years ago Threfore ~arying thc regression dale with the same order of magnitude has more erfect at this sileo It goes withoul saying that variation of the fraetionJlion factor has no visishyhie effect on the total thloridc concentration
Gimiddoten the maximum values for the density difference or pore water in the cll)s (5 kgIll Ii lhe hydraulic conductivilics (4 x 10middot~ mday) and the thickness (30 m) of the Qualernary clay lhe Rayleigh oumher calculated with Eq )2 appears to be smaller than I Thi~ i- well hllow the stahililY cri1erion of 41[~ and therefore we may conclude thai conshyvcclhe dcnsit nows will 001 occur
7ClfI(IIT 10moliOIS
Fi~lrc 53 showgt the simulation results for ehloride concentrmions and 5~7Cl values of Jround~watcr over a Jreater dcpth range in the Tertiary formations aI Koewarasan and Tourtonne Model parameters are equal 10 those described ahove Implicitly it is assumed that also in these formations diffusion controls salt transport which may not be true for the sand 11ers There are no vertical series of analyses in the Tertiary formations ltII the Koewa~asall and Tourtonne siles Therefore chloride concenlrations from nearhy wells Ire shown in Figurc 53 The chlorine-isolope rmios in Figure 53 are from various wells from all parts of thc coastal plain and cannot be compared with the simulations Figure 53 shows thaI the simulaled chloride concentrations at hath sites decrease rapidly downward which is in agreemenl with the analyses from nearhy wells (see also Figures 35 38 and 54) At Tourtonne concentrations in nearb wells are lower Ihan predicted by the model Unlike lhe Tourtonne borehole these wells ae probably locmed outside the paleochannel of the Surinamc River where lransgression and salinization started relatively early
Aicording 10 Ihe model~the diffusion front has not penetrated deeper than 60 and 90 m ill Koewarasan and Tourtonne respectively The diffusion front is arbitrarily defined as the wne where chloride concenlralions have inereased to twice lhe average background concenshytration of 25 mgt The mus defined value of 50 mgfl is approximately the concentration at which groundwiller is delectably affected by salinizalion Sensitivity analyses using me parameter varimion above demonstrate mal the depth of me diffusion fronl varies with 30 m
Conspicuous are the modelled negative peals in 53CI at 50 and 80 m at Koewarasan and Tourtonne respectively just above the diffusion fronts The fractionation effect normalshyly increases along me diffusion pam but deereltlses again near the diffusion front Near the
CI contonllmglj
10000 15000 20000 - -10 -8
0
bull Kegtew3asan
-so
-100
I poundmiddot150 n ~
-200 - dlHuslon models
6
a
5000
-20
pore waler Tourtonne - diHuSlcn models
groufldw (mlerp ) Tourtonne pore waler Koewarasan bull pore water Koewarasan 6 pore waler Tounonne middot250
middot140 o groundwaler Tertiary lormallons o groundw (mlerp 1Koewarasan
-160 L _ middot300 ~-----------~
Fi~urc 53 MeJsured chillride comcntralioll and 017CI valuc~ of groundwater from Tertiar) fomamiddot tions and valuc~ simulncd with the diffusion-scdimenlation model for Kocwarasan and Tourtonnc
front chloride concentrations are low and the isotopic composilioll is dominated by the compOSition of the inililtll fresh groundwater Sensitivity analyses show that the magnitude of the peaks varies betwecn -5 and -12 ~r and depends mainly on the fractionation factor The depth of Ihe peaks depends on the diffusion coefficient and varies within a range of 30 m around the depths staled above Also the initial chloride conceillralion is of innuence ifhe initial chloride concentration is increased tenfold thc peak reduces to half its value The 537CI analyses in Figure 53 are from wells located far from each olher and with different diffusion histories which does not ltllIow a meaningful comparison with modelled 8~7CI
values Yet the pattern of negalive values ranging between -4 and 0 above a depth of -125 m and values between -13 and +13 below that depth rna) renecllhe simulated 5~7CI peaks
We expect that if water samples from Ihe Tertiary sediments at Ihe two sites were obtaishyned and analysed it would be difficult to reproduce the analyses with the diffusion simulashytions for several reasons First of all the model does not account for upward salt transport from deep saline groundwlter which may be of innuence in the fresh and moderately bracshyIish zone below a depth of -40 m Secondly the assumption of negligible advective transshyport which seems appropria(e for the Quaternary clays may not hold for the Tertiary sands Advection may be related to regional compaction and densily-driven now as discussed in section 3 or now caused by pumping More important is the advection caused by free conshyveclive density nows (mixing) which may arise in the Pliocene aquifer if the stability crileshyrion of 41t~ for the Rayleigh number is exceeded (Eq 5_2 Wilh estimates ror densily diffeshyrence ~p (09 - 36 kgm3) hydraulic conductivity k (10 - 30 mlday) and aquifer thickness H (15 - 30 m) the Rayleigh number varies between 1350 and 32400 This suggests mal free convection is an effeclive mixing process in the upper Pliocene aquifer which will reduce me modelled concenualion gradient and the peak of me chlorine-isoLOpe ralio (Figure 53) In the aquifers deeper man 70 m below [he surface density differences are probably 100
small to creale density flows
o 0 o 0
o
49 48
5J2 UI(mlI(Il-lJOrl (~rl(llill( (llId )mckimiddoth glOllulI(Ipound1
The saline groundwltller in the Cretaceous sedime11l~ i nO connalc Comacl with fresh meteoric groundwater during long regressive period in the Late Cretaceougt and Oligocene would have drawn much o( the original salt from the sedimcnts by diffugtion The high conshycentration found in the lower parl of Cretaceous deposits may be the resull of salinization during later Iransgressions As the ediments are nOL very permeable salini7ation by down~
ward diffusive Lransport requires a prolonged period of marine submersion suggesting a Miocene age for this deep saline water Another explanation is that saline groundwater from the deep and seuward Pltlrt of lhe Guiana basin hltl migmtcd upslope and landward Noonworn vm del Kruijff (1970) proposed this mechanislll 01 compltlction-driven llow iO
c~plain the presence of oil in the Lower Tcniary west of Pawmuriho The chlorinity prolilcs in Figure 54 indicate an upward nux or salts from the
Cretaceous sediments The nux that persisted during a lnng time in the Neogene is controlmiddot kd hy dilTusivc transport and lateral dispersion related to meteoric groundwater 110w in the Tertiary sediments during regression phases (Meinardi 1991) This transport process has heen going on for it long time during the Neogene and is nOl only controlled by diffusion During pcriods of low sea level groundwaler 110w in the permeahle Tertiary formation enhanced upward transport hy lalcral dispersion These meleoric 110w -ystems have been arrested and reaclivated severaltimcs during Ihe Neogene Unceflainty un these boundary conditions makes simulltllions of upward sail Iranspofl from the Cretaceous sedimems less Il1canin~rullhan Ihose of downward transport described earlier Nevertheless chloride (onshyLentration~ in Figure 54 and the 8middot7Cl vltllues in Figure 53 in the deeper part of the Tertiary formiltions slill permiL somc qualitalivc conclusions Geophysjcallog~ from the eastern
~
Chloride content (mgll)
1000 10000 100000
----------~------_____-----=---i
100
i Teruai
200
I I ~ 300 D I Crelaceous ~ i
I _00 i
I
I __0_middotmiddot
bull
JbullOD I
J____p_a__ma_n_b_O_W___ -~-~-_
Figure 54 Chloride profiles in oil exploration wells based on geophysical borehole logs
50
wells near Paramaribo show a gradual increase in chlorinily from a minimum of 600-800 mgtl at depths between 100 und 200 m to almost seawater quality below 500 m In the Tambaredjo wells minimum chloride concentrations attain relatively low alues of aboUl 200 mgl1 at depths between OO and 50 m Below this depth a sharp increa~e in chloride concentration is observed This seems to be related to the clay layer above the basal Tertiary sand layer thaI also forms the host rock for the oil of the Tambaredjo field The presence of oil implies that the clay must be very impenneable and has protecled the lower deposits against l1ushing by meteoric groundwaler flow during regressions Otherwise the oil would have been dispersed and microbiologically degraded as a result of mixing vilh meteoric waler We believe lhat the steep chlorinity gradient below the clay seal renects upward diffushysive transport of salts in stagnant formalion waler East of the Tambaredjo oil field the clay is absent or less conlinuous which enabled groundwater flow systemgt 10 extend to Ihe top of the Cretaceous sediments during regressions Meinardi (1991) points out lhat in such a situashytion lateral dispersion along the inlerface of fresh and brackish groundwater enhances the upward solute transport As a result larger and more gradual transition zones arc found in the eastern wells compared to those in the western Tambaredjo wells (Figure 54)
II is concluded from the simulations of downward diffusion thal groundwaler below a depth of 100 to 125 m could not have been influenced by Holocene salinization Nevertheless groundwater from the Paleogene formations is marked by chlorinemiddotisotope fractionation 8~7Cl values vary from -13 r 10 +13 7r below a depth of ahout -15 m (Figure 53) It is believed that the oJ7CI variations are indicalive of diffusive processes However il mOre profound interprelation of vertical solute transpqrt in deep groundwater based on the availuble oJ7Cl data is impossible as the values are frqm different wells (Figure 53) Moreover borehole logs of these wells were not available
55 Discussion and conclusions
Salinization of sediments with fresh groundwaler following a lransgression can take place Ihrough several processes as depicted in Figure 55 In Ihe case of Suriname diffusive transshyport is the dominant process
A diffusion-sedimentlIion model has been set up that simulates chloride diffusion and chlorinemiddotisOlope fractionation in sedimenls that have been exposed 10 marine inundation and sedimentation during a finile period The simulated chloride concentrations and 8)7CImiddotvalues were in good agreement wilh analyses of pore waler from two siles in the coastal plain Values found for the effective groundwater diffusion coefficient or chloride and the fraclioshynation factor for Ihe Chlorine-isotopes are 7 x 10¹⁰ ms and JOO7 respectively These values are supponed by previous studies (Desaulniers et al 1981 Beekman 1991 Volker and Van der Molen 1991 Eggenkamp et al 1994)
Chloride concentralions and chlorinemiddotisotope ratios as well as the diffusion model show that salts from the Holocene transgression have penetrated to a maximum depth of 100 to 15 m in the underlying Tertiary sediments (Figure 53 and 54)
The model could even be used agt a marker for the marine transgression and regression during the Holocene at the two siles Transgression al Tourtonne and Koewarasan located more inland took place al 10 ka and 6 ka BP respectively Regression occurred al 05 ka BP and 41 ka BP respectively These dates are in line with results from earlier studies in the Suriname coastal plain based on I-lC-dating (Brinkman and Pons 1968 Roeleveld and Van Loon 1979)
51
Salinizatlon and formation of paleoshygroundwater after transgression
saline
brackiSh
bullsail diffusion
convecllve denslly now 000 t
Figure 55 Salinizmil1l1 in offshore and ltoaslal sedimcnt~ after a transgression
SailS belovmiddot depths of lbout 125 m belong to the pre-exiting dispersive freshsaline lranshysilion zone ltlnd originate from the Cretaceous The thickness of this zone depends on the pn~scncc of impermeable clays at lhe base of the Teniary (Figure 38) In the clay layer seashyling the Tamharedjo oil reservoir diffusive transport dominates whereas groundwater above the clay is cominually nushed by meleoric now systems during regressions In the Paramuriho arel the day is lackIng which allowed more lateral dispersive mixing al the TcniaryCretaceous boundary resulting in more gradational salinity profiles (Figure 38) In fc1 the chloride profile in lhe upper 250 m may be used as a proxy to detect lhc presence uf clay seals and pcrhltlp~ shallow oil reservoirs in Ihe Guiana Basin
Reconstruction of the upward transpon of sahi from the Creiaceous sediments was not possible due to lack of data In addition modelling i~ meaningless as boundary conditions rclated to lhe various transgreisions and regressioni are Ufknown
Thi~ study and earlier itudies (Beekman 1991 Eggenkamp et al 1994) show lhat the approach of combining chloride and Sl7CI analyses and salt IranspOr1 modelling is successshyful in reconslructing paleohydrological events in coastal areas These techniques may also be applied 10 study diffusion in low-penneabilily environments around deep disposal sites of nuclear waste ltlod landfills
Funher work focuses on combination of chlorine-isotope analyses with 2- and 3-dimenshysional modelling of waler and solute transpOr1 of variable densities
Chapter 6
Hydrogeochemical signals of the hydrology and paleohydroloshygy in the coastal plain of Suriname
61 Introduction
Thi~ chapter dcal~ with lhe hydrochemical composilion 01 groundwater vith the objecshylive to provide new evidence on the hydrology ltlnd paleohydrology of the coastal plain or Suriname and W ubstamiaLc re~ulls derived at in carlier chlpters Attention is given in parmiddot ticular to proceses of cation-exchange This process accompanied freshening during the lasl glacial when the body of stagnam meleoric groundwater in lhe coastal and offshore Tertiary sediments was formed (Chapter 4) It also occurred in a reverse order during the subse~
quent sillinization after the Holocene tramgression Calion-exchange belween soluble ilnd adsorbed phases is of panicular imeres1 as il provides a signal with a long memof)middot Calionshyexchange occurs when groundwater with a hydrochemical composition differem from lhe residing groundwater penelrate~ a formalion (Appelo ilnd Postma 1993) The exchange promiddot cess for saline waleI (dominated by Na+) flowing in a formerly fresh aquifer (with exchanshygers dominaLed by Ca~) can be described by
No - + 11 (Co X ~) ~ (No X)+ I~ Ca~- 161)
In which X reprcsent the cxchange sites Oil charged surfaces like clays Thc equilibrium condition according to the Gines Thomas convention (Appelo and Postma 1993) is cx pressed as
[No - XJlCa ] 162)
[Co-xJmiddot[Na ] The coefficienl Kuc is not a true constant but depends on thc ialinity of the poreshy
water The ieJecLivity of an exchanger differs for various species but decreasei in the folloshywing order Ca Mg K NH 10 Na Because exchange reaclions are fast with respect to advective and diffusive transpor1 continuous chemical equilibrium may bc assumed between dissolved and adsorbed phasei Because of the cominuous release of cations from a relativeshyly arge pool of adsorbed ions on lhc exchangers lhe carion composition in pore-warer at a particular point requires some time (several nushings) before il assumes lhe composilion al the source In the front zone of a water type moving or diffusing into anolher waler type exchange effect can bc noticed in the cation composition This has been reported in many studies dealing with freshening of coastal aquifers (Appelo and Postma 1993) Due lO exchange processes the front zone of fresh groundwa1er flushing a saline aquifer is often enriched in sodium or magnesium with respecllo conservative mixing (based on conservashylive traeers like chloride) Calcium the prineipal cation in fresh water is then exehanged for sodium and magnesium which dominaled the exchange complex during the fanner marine conditions Sometimes even a chromatographic panem of groundwater facies with Na~CI
Na-HCO Mg-HCO to Ca-HCOJ water1ypes is observed (Edmunds and Walton 1983
52 53
Walraevemllnu Lehbe 1989 Stuyfzand 1993 Appelo 1994) Freshening and the accompashynying ciltion-echange may take place in young fiow systems developed below dunes and beach bilrrjer~ in aggrading Holocene plains It can also bc observed in much older and often deep 110 sySlem thaI have been active during thc last glacial or even earlier bUI have not entirely l1u~hed the formations becausc of low fiow velocities Salinization of formations Ie-ulting from a marinc tran~gresion cvokes the reverse exchange process and leads to a relative urplus or calcium or magnesium However this process is hard to recognize in lhe fidd a- the large odium concentrations in the passing Saline groundwater resull in rapid quilibration hetween the dissolved and ah~orbed phases (Appelo and POSll1lltl 1993) Ca-Cl and Mg-Cl water lypes are only obscrved near relatively rccenL aline groundwater intrushy-iom n~ar wdb (Stuyfzand 1993) and polders (Geirnaert 1lt)69)
6~ Dahl
For the present study hydrochemical analyse have been used from previous sludies (UNDPfVHO 1972 IWACO 1983 Ho Len Fal 1986 Poels 1987 Planning and Research CorpNation Iq88 Menlc 1990a I990b IWACOIFRHarris 1991) and unpublished analyshy-c of water supply companies In add ilion analyses were earried out on 95 samples collecshylld hy the author inllle period from 1995 to 1998 Most water samples were tapped from running production welb or were pumped from observation wells with cenlrifugal suetion PUIllP~ or small diallltcr suhmersible pumps (Annex II and 111) A special group are lhc water ample~ squeelcd from clay samples retrieved for this study from two percussion drillings (Vebtra 1997 in the Holocene coastal plain at Tounonne and at Koewarasan (Figure 31) The pereussion drillings have been discussed in more dcrail in Chapter 4
Most wmer sample originate from the Quaternary and Teniaf) formations in the coastal plain around Paramariho Two groups of analyses from oUlside the study area (Annex II and Figure 31) have been analysed as well these are groundwater analyses from the Paleocene oil hcarin~ and layer of the Tambaredjo oil field 40 km west of ParJmUlibo (Ho Len Fa 1986) and illlalysegt of shallow phreatic groundwater fram the savannah belt near Kabo 60 km southshywet of Zanderij airpon (Poel~ 1987) The sample~ from the study area are not evenly distrishyhtlled Oer the various formatiom Because most sample were laken from pumping wells and ohser31ions well of water-supply agencil~ the sample density is relatively high in the zones containing fresh groundwater with chloride contents less than ~50 mgll
The sampling and laboratof) procedures of the archived samples are unknown The amples taken for this study were analysed in the laboratory of the Vrije Universiteil in Am~lcrdam Sample were filtered in the field and stored in aeidified and non-acidified boushyles In the field pH electrical conductivity lemperature and ill some cases alkalinity were measured The soil samples were retrieved from the borehole in stainless sleellUbes which were sealed and cooled during transpon 10 the Netherlands Pore-waler was squeezed from the clay samples in the lltlboralory of the Eanh Sciences Faculty of the Universily of Utrecht
Stigler (1996) compiled lhe initial hydrochemical dataset The final datasel for this sludy consists of 221 analyses of all prineipal chemical components with an electro-neulfalishyIy imbalance of less than 10 Ie (Annex III) The chosen eleclro-neutrality imbalance is higshyher than the usual 5 Ck in order to include analyses from zones with a low sample density For this data also dissolved total inorganic carbon (TIC) has been calculated with the PHREEQC code Annex III also includes incomplete analyses (59) and analyses (47) with
an electro-neutrality imbalance higher than 10 1L In some qualilative interpretations of hydrochemical and isompic pallerns also incomplete analyses have been used
Information on the mineralogy and geochemistry of the Quaternary and Teniaf) fonnashylions has been found in studies of DAudretsch (1953) Brinkman and Pons (968) Levelt and Quakernaat (1968) Hartman (1969) Veen (1970) Eisma and Van der Marel (1971) UNDPIWHO (1972) Krook ( 979) Wong (1983 1989) and Poelo (1987) For this study the composition of elements on all Quaternaf) clays oamples from Ihe percussion drilling wa~
studied hy X-ray fiuorescence (XRF) For this study also cillion-exchange capacilies (CEC) have been delermined on 22 bulk
soil samples from the two percussion drillings (7 on PleislOcene clays and 15 on Holocene clays) In this procedure exchangers were saturated first with ammonium by rinsing wilh an ammonium-acetate solution subsequcntly the absorhed ammonium was displaced by sodishyum by fiushing with a sodium-chloride Solulion CEC equals the total amount of liberated ammonium (Velslra 1997)
Existing CEC analyses of Pleistocene clays (51) and Pliocene sand~ (17) were availashyble from other studies (Levelt and Quakernaill 1968 Veen 1970 Poels 1987) These analyshyses were carried OUl on the clay fraction only laquo 211m)
63 Hydrogeochemical cvolution of meteoric groundwater in the eoastal plain
631 RainIa and (apUfrUllspimrioll
Analyses of rainwater al Kabo by Poels (1987) demonstrale the dominanl innuence of marine aerosols though calcium and potassium are significantly enriched (Figure 61) This enrichment is probably the result of dissolUlion of pyrogenic organic aero~ols (Crutzen and Andreae 1990) advected from the African continenl (Prospera el aL 1981) On its way lhrough lhe canopy and the upper soil zone rainwater becomes more concentrated by evapomiddot transpiration Chloride contents in groundwaler at Kabo (Poels 1987) indicate that rainwater has been concentraled hy a factor of 64 (Figure 61) Coneenlration faclors for calcium and pOlassium are much lower because they are largely filtered out in the root mal (BruijnzeeJ 1990 Foni and Neal 199~ Grimaldi 1988) As discussed above the reactivity of lhe Pliocene and Pleistoeene sediments is quile low Therefore groundwater below the presenl recharge area~ of the savannah belt and the Lelydorp sands has remined the marine hydroshychemical signature of the aerosols (Figure 61) This groundwater is denoted here as pristine meteoric groundwater marked by chloride concentrations of less lhan 50 mgL This distincshytion is necessaf) as groundwater with higher chloride contents has a marine signature caused by salt intrusion (Chapter 3 and 4) The average chloride concentration of pristine groundshywater in the Pliocene aquifer in the savannah belt ranges from 2 to 16 mgll This groundwashyler is very young as il contains high trilium concentrations (Chapter 7 UNDPIWHO 1972) Pristine groundwater in the Pliocene aquifer below the Lelydorp sands contains more chlorishyde (IS to 45 mgll) which may be due to the proximily of the ocean at the time of infiltration (2 to 8 ka BP Chapter 7) higher evapotranspiration or leaching of salts from the overlying Pleislocene clays
54 55
020
----------- 160 A~erage 9ounOwaler In Zand~1 Formation 11
Savann2h Ionpound
tl Kabo(n=S2 l0 Poel5 lft87)
o Zanoenj n 61
~ o~
E E
l Q~I LLJ1LL-L-Ll-LtlJJ~ CI tliJ Ca ~q so 50)
00 Average rain at Kabo (n )19 Poels 9B7 f shy
~ ~
0
0
- groundwater In Aelage
ZanderiJ Form at Lelydorp (n 17)
~ r C Na K C Mg so so
0 Average seawashyter (Appelo 11shyPostma 993)
~
f shy
~ r shy 5 E ~
h-r0 CI N~ K c~ lAp SO $0 CI Na I en Ig so 50
Filun (11 Hyuroch~mi(al cornposiljo)l of rain [1rj_~lill meleoric groundwater anu cawalcr in
Suriname
63] OilwllllioN (( C(lrholl ill till wil oc
Acid Londilion lpH lt 5) prelail in Ihe soil and shallow phreatic groundwater in Ihe c[)astul plain (Brinkman and Pons 1968 Levell and Quakemaat 1968 Vcell 1970 Poets 19R7 They resull from dissolution ill the soil zone of carbon-dioxide gas and organic acids The taller give the strongcsl acid reactions McKnight et aL (1985) repon lhal these acids a lolllplcx of humic and fulvic acid~ Iypically buffer solutions around a pH of 45 as is also tht case in Ihe study area The prelience of organic acids is also apparent ill lhe numerous middotblack waLer creeb in Ihe savannah belt and the Pleistocene coastal plain
In ord~r to understand other hydrogeochemical and isotopic processes (Chapler 7) il is importanl to estimate the inilial contenl of dissolved carbon in the recharging groundwater According to a compilltltioll by Brook et al (1983) and to a study by Davidson and Trumbore (1995) in Brazil soil carbon-dioxide pressures in Iropical soils may vary between 10middot~ 10 10- - atm (10000 to -loOOOO ppmV) Given Ihis pressure range speciation calculashytions wilh PHREEQC showed that the initial inorganic carbon content of groundwater varies between 084 and 167 mmoill According to analyses by Poels (1987) organic carbon conshytents in savannah groundwater vary from 0 10 09 mmoVi (average of 017 mmolll) Therefore [he total amount of initial carbon of groundwater is expecled 10 be in lhe range of I 102 mmolll
56
Shallo middot phreatic groundwaler analyses from the present study and earlier investigashylions (Poels 1987 UNDPIWHO 1972) represent mainly the savannah bell and hardly the coaswl plain with its more dense and different vegetation The early hydrochemical developshyment of groundwater described above may therefore be biased However conditions in the savannah bell arc of panicular interest most of the deeper groundwater has been recharged during the LGM and Early Holocene (Chapters ~ and 6) when the emire coastal plain was loered by grass and shrub savannahs comparable to Lhat of he presem savannah belt (Chapterl Vall der Hammen 1974)
633 MiHemisolIfiol
Low feldspar contents ulld the absence of calcite and arugonlle in the Tertiary sedishyment- are signs of prolonged leaching by groundwater now (Krook 1979) Krook aIm believes thaL the mosily kaolinilje Teniary clays (of marine origin) origillaly had a higher comen of smeclites and illites and thallhey were later transformed as il result of weathering and leaching Despite lhe low reactivity of the sediments wealhering of detrital silicales bas led to enrichment in cations as can be observed in the pristine groundwater of the recharge areas (Fig 61) Cationchloride ralios are higher chan lhose of rain which is characterized mainly by dissolved marine aerosols Outside the prisline groundwuter the innuence of weashyIhering on [he groundwater chemimy is masked by salt imrusion StabililY diugrams in Figure 62 show Ihal kuolinile is the stable silicate phase in nlO~t circumslJnCes which agree~ wilh the hypOlhesis of Krook (1979) thai most kaolinite in the Teniary sediments consists of transformed marinc illites or smectites In saline environmens like Iho~ in which Holocene clays were deposited smectites form the stable silicate phase Carbonate dissolution hardly lakes place in Ihe Teniuf) sediments Mosl groundwater samples inclushy
Ca-sihcate stability diagram 16 -------~----=-C-M------- 12
~gc~~8 - ~ 6
4 co1~~- ac~~~~__~r__o____ ~ middot5 -3 middot2
Legend
ZandenJ fomahon In Savannah
ZandenJ fOlTTlatlon at Republlek wellfield
6 Zanderij and CoesewlJne Fm in Pleistocene coastal plain
Namiddotsilicale stability diagram 8 -----------+-----Nmml
)~ bull
2
o 91bbsl1e -5 -3 -2
Zanderij and Coesewijne Fm in Holocene coastal plain
bull Bumside and Saramacca Fm in Holocene coastal plain
bull Qualemary Clays in Tourtonne and Koewarasan boreholes
Figure 62 Siability diagrams of silicate minerals wim respeci 10 me groundwaler analyses from Ute eoasla plain of Suriname
57
2
0 q
0 ~ Sam les middotbull
-2
6~ ~alclte I sjenle
-ltl o pore waler cbullQUill cia sOi tifP~ 0bull I bull -6 glounClwillerbull cTertii a ulf bull
Silluril1l0n ndeo
groundwater In nvannah
4 5 6 7 8 9 pH
Figur~ 63 Saturation inuitc~ ror cltllcile llld lgtidcrilC for groundshyWaler III the coastal plain oj Suriname
07140
07130
07120
HOlOtene Clays
10 Pleistocene clays
bull aqlIteis
10 011 sands (S Fm)
bull
bull 0710 ~bull ~ 000
O7090~ ~
bull
bull
07080 07090jo
07070 o7DB8
o 2t 40 60
0 500 1000 1500 2000 2500 3000
Sr (mmol)
Figure 64 Strontium isotopes rlItm ilainSI strontium contcnshymllions in groundwller from the toasl~ plain of SUrinllTIC
12 x
10
XXbull8
is c 6E ~t bull bull bullbull S 4 Ic zanderiJ I bull bull0 0 u o 8 pi=
0 bullbull bull2 fSumalde bull bullbull11ee-J~1 go 0x Saramacea 00 -2 - 0 2
excess 504 Immoll1)
Figure 6S Exec55 sulphale against lotal inorganic carbon (TIC) for groundwater In the coaslal plain of Suriname TiC has been calculated with PHREEQC
S8
ding Ihose innuenced by salinization are under-salurated wilh respect to calcite and have pH alues lower Ihan 65 (Figure 63) Suontium-isolOpe ralios provide information on the
provenance of dissolved calcium as the chemically familiar element occurs concomitantly with calcium in most minemls (Faure 1986 Bierman et aL 1998) ~7SrJ86Sr isotopes ralios in groundwater samples Figure 64 l measured a the VU iSOlope laboralory proved to be much higher than the ralios for strontium in seawater and marine carbonates (Burke et al 1982) These relalively high 117S rJ8oSr ratios are ypical for strontium in the plmonic crystalline rocks of the Guiaml shield (Priem et al 1980 Vonhof el al 1998) Therefore dissolved slrontium and calcium 1I10S1 probably originmed form delrital silicales in the Tenia) sediments
6]4 Redox flJ(lCpoundsses
Calculated TIC contents of groundwater in the Teniary formations mnge from 2 to 8 mmollL However the estimated initial amount of carbon which is dissolved in groundwaler in the savannah bell at presenl varies between I and 2 mmol1 1l is assumed that at the time of recharge during the LGM and Early Holocene the initial TIC content of groundwater did not much differ from these values It follows that in absence of camonme dissolution oxidation of sediment organic maHer (SOM) must have led La the enrichment in dissolved carhon In the Pliocene and Miocene formations SOM oxidation is probably coupled ith iron reduction as groundwater contains relalively high contents of ferric iron but also sulphale II is likely that the liberated ferric iron has precipitated as siderite as many samples indicate saturation with respect to siderite (Figure 63) This corresponds with the observations by Krook (1979) who reponed thal these formations in panicular contain amorphous iron hydroxides and authigenic siderite while in the lower formations the more stable hematite and goethite dominate High TIC and low sulphate contents (Figure 65) and enriched BDCTlC values (Chapter 6) in groundwater of the deeper Paleogene (Oligocene Eocene and Paleocene) formalions give evishydence of sulphate reduction and methanogenesis The saline reactive Holocene clays form a completely different hydrogeochemical environment groundwater is generally satumted with respect Lo calcite which is present as allogenic and authigenic minemls in the sediments pyrishyte and TIC contents are high because of sulphate reduction and methanogenesis (Figures 66
and 67 Groen unpublished data) The same holds for the Cretaceous the source rock of the oil that is found in several place in the coastal plain This can be derived from groundwater samples from the oil-bearing sands at the bottom of the Teniary at Saramacca
64 Cation-exchange and freshening in the Pleistocene clays during the Wisconsinan regression
641 1mroductioTl
During the 100 ka of the Wisconsinan regression meteoric now systems in lhe coastal plain have nushed all saline groundwater formed during the preceding Sangamonian transshy
gression 1I is expected thai calion exchange has long reached equilibrium If there were any cation-exchange signals left they would be expected in the clays because of the high eationshyexchange capacities (see next section) This applies in particular to Pleistocene clays (Coropina Formation) in the southern part of the coastal plain which have not been affected by the Holocene transgression The following sections are mainly based on data from Leveh and
59
Total Total II tlcns CI HCO ~IanjnslE
I 1 11mB]8 0 lt ~
t l Cl ~
200 00 fmc g ~ ~5middotlI(e 0 4Q 600Jll 20 mmol~ mmaln mmltllil malr
I ~ 1 I~=g 0 1~
L
L__b_l_-l=JLll_---l_-l-__ deg l(l D 0 080-1[ 0 00 0 1Omiddot0~ 0
mmolr mmoln mmoVI malll
Fi~urc 66 Chcrnl~lry of pnrC-Ultr squcetl fnJm HO]OItnc clay sal1lple~ relrictu m ToUrtonnc CIshy~Iltl HCO-COnlcnt- arc nwl cOI(cntrlIiol1 Na- K- Ca- Mg- NH~- ltJill SO~-COnCnIS arc cxpnsscu 01- ClCSCllt will1 nspcl 11 conscfvalllC lI1iJing tIt seawater anrJ fresh gmunuwlcr I(kllion~)shy~(ani(lll~) irnballllc j given in mlllolll UllJ ltJ1~(l us plrccnlages
o
~ 1 ~ L ---
2 I g f___------I-----l--6 0 1- ---- ~f___-----Jdeg - -L --J l_LL-__--
1)O D 0 1(1 middot20 0 lO JO 0 0 _
m~m n1moln mmoln mmaln
E
l
1r
euro 1
~ ~o 0 bull0 0 ~ 0m_ 0 0
m~ m_ ~
Figure 67 Chemistry of pore-water squeezed from Holocene and PleislOcene clay samples retrieved at Koewarasan CI- and HCO-conlents are total concentrations Na- K- Ca- Mg- NHr and SO~-conshylCnts arc Cilprcssetl as eltsses with respect to conselValve mixing of seawater nnd fresh groundwater Eltkationsl-1(anions) imbalance is given in mmoll am] also as percentages
60
Quakemaal (19681 and Veen (1970) who carned out physical and chemical analyses on clays in this area
642 Obserlariols
Calion-exchange effecls in the Pleis(oeene clays are expected to be large beeause of the high CEC CECs of 7 samples from the Koewamsan borchole vary from 161029 meqlOO g of dry 50il with an average of 24 mellllOO g The CECs of 5 samples from the studies in the southern pan of the coastal plain (Levelt and Quakernaal 1968 Veen 1970) are consishyderably lower (average of 12 meqllOO g) This may be due LO the higher silt fraction in lhal pan of the coastal plain Also these CEC were calculultd on lht basis of analyses of clay fraetions only whieh may introduce errors Average base saturation for the samples from lhe boreholes is abOUl 34 C The low base saturation is normal for Ihe present day acid condishylions but in more mineralised and less acid groundwater base salUralion would probably be higher
A typical depth profile of the calion composilion on the exchange sites of the Coropina clays is shown in Figure 68 Magnesium appeared to be the dominlOl cation adsorbed to the exchange sites followed by calcium In the first inslanee one is tempted to attribule the high magnesium content of lhc exchange sites to the marine origin of the clays which would imply thm the calion-exchange process has not been compleled This would he in accorshydance with lhe suggestion made in Seclion 541 thaL the higher chloride col1lents of pristi~
nc groundwaler below the clays may be the result of leaching of residual salts from the 35
SangamOlJiiln clays On the 30 other hand the currently infilshytrating water is nOl very minerashylised and has a low calcium concentration (Section 63) Also Levell and Quakemaal (1968) repan very dilule pore~ 10
waters This raises the question of whether the observed cation composition of the exchange o 5 10 20sites is in equilibrium with the depth (m) infiltrating waleI These Figure 68 ExchangeJble cations and cxchJngc capacity of questions will be addressed by PleiMocene clays in the sOUlhcm part of the coastal plain of cation-exchange modelling in Suriname (unpublished dala from Levelt and Quakemam 1968) the nexl secllon
643 CarioJ-excltJllge simulariolls
Model sel-up
Cation-exchange occurring along with freshening of the Pleistocene clays has been simulated with the PHREEQC code for hydrogeochemical modelling (Parkhurst and Appelo 1999) Simulations are restricted to processes of one-dimensional advective and diffusive solute transpon and cation-exchange The results are compared with observed cation composhy
61
Silions of lhe exchange site of the clays in the southem part of the coastal plain (Levell and QuakemaaL 1968lshy
In the reference model a venical column of J2 cells with lenglhs of 1 m each represhyent~ lhe clayey Pleistocene Formation This corresponds to an average thickness of the forshymation varying from 2 to 20 m In the model an effeclive CEC of 600 mmolll was applied (ba~ed on the average CEC of25 mgiiOO g of dry soil bulk density of 18 grcmJ porosity of (U and an estimated bae SUluralion of 40 K l For the diffusion coefficient a value of 7 x 1(J-II m~~ was used hased on the chlorine isotopc study (Chapter 4) The exchange coeffishy
lint~ AuC and Kf~ (Equmion 52) of 04 and 05 are average values based on a compishyhllion hy Appelo and Postml (1973) Other hydrogeochemical processes like oxidalion of ryrilc~ and -elliment organic maHer and calcitc dis~olulion have not been accounted for hClau~ (i) the lower pan of the Pleistocene days had alrcady heen imenli]vely oxidized during an early rcgrcs~ion phase in Ihe Sangamonian or even during the Illinoian (Saalien rl~nsion (Vccn 1970) II1d (ii) it is assumed that during the prolonged Wisconsinan regresshyion the day quickly lOst their reactivity and cation-exchmge became the dominam proshyl~ The simulmion- cover a period of 105 ka from the end of the Sangamonian (around 115 ka BPl ransgression 0 the Holocene transgression (around 10 ka BP) In each simulashytion exchange sites arc irst equilibrmed with seawater reprelienting the situation during the Sangamonian transgression As a result exchange siLes become filled mainly by sodium and magnesium Freshening hy diffusive transpon during the Wisconsinan is controlled by fiKed ion concentralion~ of fresh groundwater at the lOP and the bOllom of [he column With re~~
reel () the laller houndary condilion it is assumed that during the Wisconsinan the underlyshying Plimene formation was rapidly flushed by meteoric groundwater For the fresh groundshywaler It the bottom the composition of average Lelydorp groundwater was chosen At lhe lOp fresh water wilh a theoreical composition was imposed chloride concentration was set equal III the average of groundwmcr helow Lelydorp and calions concentrations were proshyportionallo thaI of chloride as in seawater (Figure 69) For simulations of freshening by adeclive Iransport the laller water type wn~ used lo nush the column The now rJte through the column was based on a recharge of 30 mmla and an effective porosity of 30 Estlmilted dispersiviy for adveClive trmsport a~ set at 01 rl1
The sensitivily of the diffusive and adveclive freshening models has been ested by varying model parameters between reasonable end member values In Table 61 the parameshyten used for the various simulations are lisled Simulations 1 and II are the reference
models for diffusive and advective salt transport respectively Aso the chemical composishytion of water at lhe top boundary condition was varied instead of the theoretical fresh water composition with a marine signature (dilute marine) also runs were made with average Lelydorp groundwater althe top (100 if Lelydorpl and a water type fomling a mixture of average Lelydorp groundwater and the diluted marine water (50 9 Lelydorp)
Resull~
The most interesting results of the simulations are shown in Figure 69 The concentrJshylions of dissolved and exchangeable cations are plaued against depLh Simulation I demonshystrates that diffusion alone is nOI able Lo drive out all sodium from the exchange sites (Figure 69lt1) This also applies to other simulations under conditions that enhance the exchange like small layer thickness (simulation 2) maximum and minimum selectivity for magnesium and calcium respectively (in simulalion 4) small effective CEC (300 mmolll in simulHion 5) and high diffusivity (10 x 10middot10 ms in simulation 10) Figure 69a shows that
dffuslonfwalerlypes 1 and 3
20 r-r-----=e- 400
s ~ 15 300 ~ E E 10 200 ~ bull
~~ ltII 05 100 -5
~
a o 2 4 6 8 10 12
deplh in m
advechonJ waterlype l recharge 5 mmfa
0 ~J~~O~l400
08 f 300 i~ 06 I~~~~~
Sim20s s 200 ~
~ 100 -5
~
a o 2 4 6 8 10 12
deplh in m
advectiON walertype 1 r~harge 30 mmfa 10 400
08
~ 06
ls 04
02
a
~ LIi~~l=sect~te
Sim11
o 2 4 6 8 10 12 depth in m
advectionl walerlype 11 recharge 55 mmla
10 400
if08 300 ES sE06 s Sim21 200 ~
c 04 ~ S lt ltII
100 ~02 bull
a a o 2 4 6 8 10 12
depth In m
adveclionl watertype 2J recharge 30 mmla advectionl watertype 2J recharge 30 mmla high Mg seleclIlJlly
10 e 400 10
08 Sim18 08 Sim19300 i
~ s ~ I c---~+E 06 EO61- I bullbullbullbullbull 11 s 200 g s
04 ~ 04~ bull bull I bull bull bull I
oeeeeeeeeeeo Ai 1= ~ Samp Ail amplt
100 ~ lt1 02 ltII 02 bull 11L
a a aa 2 4 6 10 a 2 4 6 8 10 12 depth in m depth in m
300 ~ s
200 sect ~
100 -5 ~
a
advectlonl waler1ype 2J recharge 5 mmfa Legend high Mg selectivity Salutes
-a- N
-a- ~ 5 300 ~ __ CO
20 ~J--=~iiiil400
-a- 1 5E Sim22s 5 s~O 200~
c - 10
Exd1 callon5 ___ NaX
05 100-5 0~~GJ~
~ ---+- MX2
i a a -- CaX2 a 2 4 6 8 10 12
depth in m
Walerlypes
bull 1) dutll mllnne wale (CDIlUrIItraled rain)
II 2) 50 k mil o llltydal graurKlwllllf lind dilute ITiInnu_llJf
0 3) 100 10 Lelydorp 9~undw3ler
Figure 69 Simulated concentrations of dissolved and exchangeable cations and chloride in Pleistocene clays after 105 ka of freshening during me Wisconsinan regression PHREEQC models simulate fresheshyning by vertical diffusive and advective solute transpon (recharge) and cation-exchange (see Table 61)
63
400
62
the release or sodium wkes place more quickly at the bouom of the Pleistocene clays This is caused hy the relatively high calion concentrmions of the bouom boundary condilion (100 If( Lelydorp groundwater) Simulltltion 7 with 100 9( Lelydorp groundwater ltI Op boundary condilion results in ltI faster equilibration ltIt the Op ran but sodium is still not driven out Though diffusion mltlY not hltlc led to complelc cltltion-exchange the process itself i~ ltlst enough to dric out the chloride ltlnd other conservalive solutes from the original saline poreshywater il appears Ihal after 35 ka (one-third of simulation period) thc lotal concentration (mcql) in pore-water has ltII most reaehed the total mncenlrmion of the solutions at the bounshydaries
Freshening hy ltldvectie lransport with the reference model (simulation II) is also not sufficient (l reach equilibrium between the solute infiltrating at the top ltlnd the exehange sites (Figure 69b) Varying pltlramelers such as the recharge rates (5 II1ma in simulltltion 20 and 55 mmltl in ~ilnulalion 21) has some elTeet though the exchange equilibrium franl does not reach the bOlom or the days (Figures 69c and 69d) Raising the cation concentra~
lion in Ihe infiltrating groundwater 11ltIS a much larger effeet as the quantities exchanged hetween dissolved and adsorbed cations are larger If 100 9 Lelydorp groundwater is alloshywed to inrihrale (~imulalion 17) the entire clay column reaches equilibrium Wilh the infihrashyling water If SO h Lelyuorp groundwaler is used (simulalion 18) Ihe bo[om part is not completely equilibrated with he inriltrating water (Figure 6ge) The equilibrium MgXJCuX ratio is about 13 which is slilllower lhan the observed rmio of 4 (Levelt and Quakernaat 18) In simulation 19 the same mixcd watcr Iype was lised together with a maximum
sdcctiit~ for magnesium (Kxoc = 06 and KIM~= OAl Equilibrium is reached everywheshyre with this model With a MgXCaX ratio of aboui 6 (Figure 690 In simulation 22 which comhincs simulation model 19 with a low recharge rate of 5 mma the exchange front did no reach the bOllom (Figure 69g) This indicates thal relatively high reeharge rates (gt 30 lllllla) during thc Wisconsinan are likely as was concluded in Chapter 4 based on the paleshyohydrologicalmodel Willi the incised paleovalleys
65 Cation-exchange and salinization in the Quaternar~ and Tertiar) formations during the HiJlocene transgression
65 lJ1frodllcriOl
Whcn the sea inundated the present coastal plain during Ihe Early Holocene fresh groundwater in the Tertiary aquifers Slopped nowing and became subjected to salinizalion from above and below muinly by diffusive solute transport (Chapler 3 and 5) It was demonlrated in Chapler 5 that downward diffusive transport in the coaslal plain reachcd a maximum depth of -125 m Deeper salts have been rransported from below by diffusion and Imeral dispersion during regression periods with deep groundwater flo In the neXI sections cation-exchange is tudied occurring during the downward diffusive salt transport This study is mainly based on analyses of pore-water recovered from clay samples from twO boreholes m Koewarasan and Tourtonne and analyses of water from existing wells
6520bsenQrions
Because of lhe high smectite contents of the Holocene clays CECs of 15 samples from
the Koewarasan and Tourtonnc boreholes are relatively high arying between 18 and 3~
meqllOO g with an aerage of 25 meqlOO g CEC values for the Pliocene sands vary from 01 to I meqll 00 g dry soil with an average or 06 n)cqlOO g Base sltluration of the ltlcid savannah salld~ is lesgt than 20 7c
Holocene clays lCoronie Fm1 The pore-water analyses from the Tourtonne and Koewarasan boreholes ltIre displayed
in Figures 66 and 67 In these ligures cation and SUlphate concemfations arc expressed alt excesses and delicits with repect to mixing of fresh water and seawater based on chloride content At Tourtonne ltI 25 m thIck succession of Holocene clays is found covering a period of about 10 ka In the rCJctive Holocene sedil1len~ the original seaWaier compositIon Ims been transformed by sulphme reduclion Ilhich produced large quanitie~ of bicarbonate lind consequently by precipitation of ealcile and pyrite Velma 19(7) Because the ~ea
withdrew from this arca only 500 years ago the chloride concentrations tire still close to lhose in seawmer (Section SA I) The loss of dissolved ealeium j partly compensated hy desorplion of caleium from the exchange sites coupled with admrption of sodium and ammonium The net result of lhese proeesses is a delieit for dissolved sodium as well as calshycium These processes are best illustrated by samrle T21 (Figure 66) The Olher samples have a relatively large imbalance in ion electro neutrality mainly causcd hy inaccuracies in the sodium ltlnalyses
At Koewarasan where marine innuencc lasted from ahoulolO 4 ka BP only the upper 6 m consist of Holocene sediments Pore-waler salinities are much lower than at Tourtonne (Chapter 4) Here the reverse process becomes apparent (Figure 67) pyrites formed during and shortly after deposition have already been oxidized leading 10 acid soils high sulphatl eOlllents in pore-waler and dissolution of carbonates Veltra 1997)
Pleistocene clays (Cororina Fm) Pleistocene clay have lost most of their reaetivity due to prolonged weathering during
the last glacial (Veen 1970 Levell and Quakemaat 1968 Section 16 tn Annex I) A a resull salinization by diffusion from lhe overlying Holocene sediments results only in calionshyexchange as ean be observed by the calcium excess and sodium deficil of pore-water in Figure 67 The magnesium excesses or deficits diplay a more erratic patlern
Neogene fonnations Cation-exchange pauerns in the Neogene formations should be tudied along the verlishy
cal diffusion path just as in the Quaternary elays However thi was not possible since samples were taken from different wells far apart Therefore instead the chloride concenrashytion was used to mark the advancement of the diffusion process (Chapter 5) In Figure 610 excess cation concentrations of all wells in the coastal plain have been ploued against chloshyride concenlrations in mmol1 Ion excesses (and deficits) have been delermined with respeet 10 mixing of seawaler and fresh pristine groundwater below the Lelydorp sands (Figure 61) The latter is supposed to be the dominant groundwater type in the formations before the Holocene transgression Samples affecled by salinization (Cl gt 50 mgI or 14 mmolll) have sodium deficits balanced in milliequivalents by calcium and magnesium excesses This is a sign of cation-exchange in this ease related to diffusive salinization Figure 610 further shows thai cation dericits and excesses increase linearly with chloride contents This is nOl expected because of the non-linear relation between selectivity coefficients and concentrashy
64 65
Zanderij and Coesewijne Formations
cr (mmoUIJ
Figure (1111 Ecc~~ ion~ nll1tcnts in the Plilllenc and Mioccne romlalions (Zandcrij and CoesclOijnc hll ) agauN chlliride cOllleru~ E)ccs~ ion~ concelllraliom are cxprcssed a~ cxccsscs relmive to the ellCClcd nlllcemrmioll from ClI1~erlive miing or frcsh groundlOalcr (groundwalcr in Plioccnc romlashylillll~ rcchargcd oelo the Lelydorp sltlnd j and seaWacr MLdng nuios arc bascd on chloride cnlllcms
tion (E4uati01 5~) and IIc chromatographic order of cation release from the exchangers Thi~ sug~est~ that in the Tertiary formations which have low CECs cation-exchange is ncgle~ihle Therefore the observed cation-exchange signature of groundwater in the Neogene formltltiolls has probltlbly hcen formcd in lhe overlying PleislOcene clays
Sligter ( 1(96) plotted the calion eCCSSCS of some samples against the distancc to the cOilstline Th~ givc~ essentially the same result since chloride concentrations generally illclcae toward- the north where diffusion started carlier on the sloping Pleistocene surface
Groundwltlter also displays sulphate excesses with respect to mixing which cannot be explained easil~ Pyrile oxidation has probably taken place but the deeper pan of the Holocene c1ltly the source of the salt i strongly reduced and has low sulphate contents
Paleo(lene formations Figures 611 and 61~ show the dala for the Oligocene (Burnside) and
EoeenefPaleocene (Saramacca) fornullions Here a complelely different patlern emerges Sodium concenlrations are in exces~ while calcium and magnesium do not exhibit clear excesses or defIcits This pattern is most outspoken for the samples of the Paleocene fonnashytion (T-sandsl from the Tambaredjo oil field Most of the sulphate is reduced The low conshylcms of dissolved iron whieh has precipitated as pyrite_ are probably related to this As h~s
been discussed in Chapter 5 the solutes al these deplhs most likely originale from the saline Creraceous (Figure 35) Due to lack of sufficient infonnation on hydraulic and hydrogeoshychemical processes at lhese depths no attempt has been made to analyse these observations in more detail
653 Carioll-excIlge simulations
Model SeHIP In lhi~ section the hypotheses
regarding the salinization of the Pleistocene and Neogene formalions (Section 45 and Chapter 4) are verifishyed by PHREEQC modelling Simulations in lhi- case are restricled to diffusive solute transpon (Chapter -1-) and calion-exchmge The resuhs are compared with the groundwater chemistry of the Neogene formations
The reference model consists of a column with 12 cells at the lOp rcpreseming the Pleistocene clays folshylowed by 113 cells for the Tertiary -ediment~ All cells have lengths of I m The effeclive CEC of the Terliary is quite low 144 mmolll and is based on the average CEC from swdies hy Poets (1987) ltlnd Level and Quakernaat (1968) of sands of the Pliocene Zanderij formation Diffusion and exchange coefficients lind CEC for the clay are equal to thosc of the previous freshening model (Table 61 ) For lhe CEC of the Tertiary sedimems in lhe reference model a value of 14 meql is uscd The downward diffusion process was allowed to continue for a period of 10 ka which corresponds 10 Ihe length of time afler the sea had reached the presenl coastal plain in the Early Holocene
In all simulalions pore-waler in lhe cells has the composition of averashyge Lelydorp groundwmer prior to the Holoeene inundalion The inilial cation composition of lhe exchange sites of the Pleistocene clays was derived from the fmdings of Levelt and Quakernaal (1968) and Veen
(1970) The initial cation composishytions of the exchange sites of the Tertiary formations were detennined
lt E 0
~ 9
~ -1
middot2
middot3
Burnside Fonnation
= = 0
C0 =
A
bull
~ - bull~~D ~ =bull A
C
i8Na I
c_c i GJ =-$0
0 8 12 Ct (mmoln)
Fi~ure 611 Excess ions cOnlcnts in thc Oligocenc Fomlalinn (Burnside Fro) againsl chloride comem~ Excesshyions concentfilliom arc expressed u- exccsses relalivc 10 lhc cxpectcd concentnlliun from elnscrvltlllve mixing or fresh groundwatcr (groundwaler in Plioccne f(lmllt1tion~ recharged below the Lclydorp sandsl und scawaler Mixing r-uim ltIre bascd on ehloridc contcnts
12
shy~ a
4~
~ ~ 0
~
~
Oil sands in Saramacca Formation
D D
Dco i g DC
0 cr 1 0
-en
D
shygt0
bull
x~middot~o~ _ o 20 40 50 80 0
Cf (mmollll
Figure 612 Excess ions contents in lhc oils sands at lhe basc of lhc Palcocene (Saramacca Fm) against chloride conshyIcms Excess ions concemrmions are expresscd as exccssCS relative 10 lhe expected conccntration from consenllic mixing of fresh groundwaler (groundwater in Pliocene forshymations recharged below lhe Lelydorp sands) and seawatcr Mixing ratios are bascd on chloride contents
67 66
bv PHREEQC ilsruming equilibrium with porc-waler For the diffusion fixed concentrashyli~m~ of ~aline waler arc impo~ed at the top of the column These concentralions are derived rom pore-water malyses of Ihe Holocene clays at Ihe botlom of Tourtonne borehole (samshyple T~ J) The regre~gtioll and the ~ubleql1enl upward diffusion arc not taken into aeeoum agt in chapter -I The sensitivily of the model Wlgt tesled for the range of paramelers lisled in Tahle 6~ For hc chemiell boundary condition a the 1ltJp also pure seawater WlS ugted and llle c()ll1p()~itioll of pore-waler gtarnple K) from the Holocene day in Ihe Koewarasan boreshy1101middot Tlli sample has a relatively low salinlt~ and IS inJ1uenced by pyrite oxidation
fc ulb --Ill Figurcs 61 )t and 6I)b the total coneentrHlon- ne shown for solutes and lhe
exthangeabk taliolls respecllvely againsl depth according to the reference model (simulashylion 11 ln Fi~urcs 6I)c and 61-11 excess concentrations of catiom have been plotled ~aimt depth and chloride concentration respectively Excess concentration is defmed as lhe L~ce~~ (or deficit) with respect to mixing hetween seawater and average Lelydorp groundshywlter Plouing excesses againsl chloride allows comparison with the analyses shown in r-i~ure 61 O Fi~urc 613a shows how lhe simulltHed chloride concenlralions decrease rapidly dwnward app-roaching the background value of Lelydorp groundwater at 75 m below lhe lOp or lhe Pleistocene Coropina Formation This is in agreement with lhe measurements and lnalvliLltl1 simulations of Cblpter 4 It should be noted however that the PHREEQC model doe~ nOI Iilke into accounl the effecl~ of Holocene sedimentation and regression Figures 61~c and 6 14a show lbat diffusion of salts igt accompanied by Calion-exchange This proshyc~s~ leadgt (l sodiulll deficits and calcium and magnesium exce~ses with respecltO conservashytive mixing Clearly eXlhange ha~ not reached equilibrium The exchange takes place mainshyIv in the Pleisloc~ne elay with its large pool of exchangeable caLions - 111 the Tcrtiarv formations there is little exchangels can be seen in Figure 614a
which -huw- the ((ulsilinear relationship between chloride and cation excesses The simulashyli~111 results compare favorably with lhe chemical analyses shown in Figure 610 though the
Me~~jCa~~wratio of 2 in the Tertiary formalions is lower than lhe ratios derived from the lnollse~ t3 to 6) Nevcrtheless the results suggesl lhal the hydrochemistry of the Tertiary fornalions is largely defined by conservative mixing of old Pleistocene water and downward diffusing salts which has acquired its composition by Calion-exchange in lhe Pleistocene clay~ The high Mg excess is explained by the dominance of Mg on lhe exchange sites in Ihese clays prior to lhe transgression as measured by Levelt and Quakernaat (1968) and Veen (1970) Most of the sensillvity tests show more or less lhe same results
The maximum scleetivity for magnesium used in simulation 4 is nm likely as it leads to almost equal magnesium and calcium eXcesses (Figure 614b) In this simulation less ma~nesiulll and more calcium is released from the clays inilially Simulation 13 with maximiddot mu~ effeclive CEC (1200 meqll) for the Pleistocene clays and minimum effeclive CEC for
the Tertiary fomlations (2 Illeqfl) resuhed in Mg~cCaCwgt ralio of 35 and provided the best malch wilh lhe analyses (Figure 614c)
66 Discussion and conclusions
Most groundwaler in the coastal formations is mineralised because of salt inuusion (Figure 35) Pristine groundwater is only found in the savannah belt and below the Lelydorp sands
bull
This water even the relatively old pristine water aI Lelydorp (gt I ka BPl has retained a rainshywaler composition because of the low reaclivity of the sedlment~ The Pleistoeene and Tertiary formations contain hardly any calcite and weatherablc silicmes (Krook 1979 Selttion~ lA 15 16 in Annex I) which is a sign lhat the coastal formJtions experienced intensive nushing by mcteoric water during protraeted regreisions (Chapter 4) The present swgnam flow conditions in the coastal plain (Chapter J) are the exeepllon rather than the rule considered 011 a geological time scale
Most groundwater is acid (pH less than 65) and undersaturaled wilh respect to calcite
1000 C-- = bull
5 100
~ sect 10 Sim 1
bull~ g
25 50 75 100 125 10 20 30 deplh (m)
1000 rn---------b 10 b----------shy
9~ 100 ~
Sim 1
~ ~ -20 -h~9h~M~9~~I~~~~y---_---__=
25 50 75 100 125 a 10 20 3 depth (m)
CImmolll)
cr (mmolll)
o
c
Sim
5025
N
depth (m)
Figure 613 Simulled concentralions of dissolved and exchan2eable cations and chloride in the Pleisto~ene and Neogene fonnations arler S ka of salinization durin the Holocene lransgression PHREEQC shymodels simulille venica diffusive solute transpon and cation-exchange Saline source is pore-water from Holocene clays (SimuJalion I in Table 62)
10
~ E
0 6 ~10 ~
lJ
~ 20 -I~-C~E~C~T~-m-- ~___
a 10 20 3C
Cl(mmOlIlJ
Figure 614 Simulaled concenlrations of dissolshyved and exchangeable calions in the Pleistocene and Neogene fonnations after 8 ka of salinizashytion ploned against chloride concentrallon PHREEQC models simul03te venical diffusive solute transpon and cation-exchange Saline source is pore-water from Holocene clays (see Table 62) Three different simulations are shown (Simulalion I 4 and 13 in Table 62)
C
Sim13 high Mg selel11vl1y high CEC Plels clays
c
N
69 68
-----
In the deeper formmions below a depth of 150 m and in the Holocene claygt_ sulphate reductishyon und rntthanogellesi~ ha~ wken place
The Pleislocene day~ in the ~oulhem pUrl of the cmmal plain contain fresh pore-waler now while Ihe exchange ~ites of llle cluy~ are mainlgt occupied by mngnesium ions Silllulatiom with Ihe PHREEQC hydrageochemicnl code ha IhH (hi~ cunnOl be explained (I~ dirru~ic ~olute lranSp0rl during the Wisconimm regresion Advectie trolnspon correshysponding 10 a recharge of morl thun 5 mma i required 10 accounl for thi effect This is in agreenllH wilh the rlJ1ding~ of the nUlllericul pilleohydralogitmiddotulmodel which showed Ihm a rdalilly high and widespread recharge IllllL havc persblcd during Ihe Wisconsinul1
GroundWltller in the Plei toccnc ilntl Ncogene (Zallderij und Coescwijne) formations in Ilk nonhcrn lnd Holocene pan of llie comal plain i affected by tliffusive downward salinimiddot Ialion (Chilplcr Sl Catiunmiddotc~change uSOCiUlcd wilh Ihe salinl_ltlliol1 i rccognied hy the ~ollillll1 dericil~ ~l1d ll1ugncsiul11 and calcium ece~se with respect 1(1 lonservative mixing of frlsh wI1Ir and scawater DilluSltlll and caliol-exchunge simulations with Ihe PHREEQC code lorHur WJlh this showing a good corre~p()ndence between ohserved and calculated Imiddotalion deficit and excesse~ The cUlion-exlhange appears to have taken place mainly in lhe Pkis1lccne c1lyS CEC in lhe Teniary formalions are very low and alts from the overlying Quullrnary day hamiddote mixed conservltIlively wilh the fresh paleogroundwaer This explains Ihl uniform mtiu or cation deficils ami exces-es in the Neogene larmations
In the Plcogene rBurnside and Saramacca Formalions) groundwater generally has sotlishy1lI11 cxccsc Salinization and ca(lol-cxchange processes in these deep formations cannot be rll(ll1strulletl
- _-----shy
Sil11 ChCI1Ct1Illp ChlllL tnmp Clllumn CEC K-lI(~ DilTuion Recharge Longit Ilr Top ~ol(lm Ilnglh coeffk ralC uipers
(Inl (mmolIl (Illcs) (mma) (m)
K~~l~
uilulIJ marine mor Lclyulrp 6() 0-1 U5 7 101(1
dillileu iIlarinc 100r- Ldyuorp ( 000 0-1 05 7 x 10 111
Jiluled marine ]jOt- Ldyuorp 600 0-1 05 IOmiddotllI 4 11iluled In-Irinc I(lOK Ldyump 600 06 0-1 7 x 10 III
dilulcll1larinc ](JflCk Lclydnrp 3()1 04 Oi 7 10 111
I dillilcu Inarim 1UOCk LelyJorp 120[) 04 Oi 7 10 111
100ii- Lcl~dnrp IOOIfi Lclyuorp 6()) j-I 05 7 10 11
dilIlCU marine uilllteJ marin 600 0-1 05 7) 10 10
II uiluleJ Illlrine I()()lt Lclyunrp 600 04 05 4 I (11I
III uilulCd marine I()lr LelyJ(lrp 600 0-1 Oi 10 x 10 II ~
II Jilulltd mlrine 600 04 05 10 10 0 01
dillllCtl marine 6 hOO 04 05 7 10- 10 0 01 I~ UillllCU marine 4 (i00 04 05 7 10middot(1 0 01 14 JilulCU marine 11 000 06 04 7gt IO IU 0 01
uilulcJ marine 300 0 05 7w 10 111 0 0116 uilulCd marine 1200 04 05 7 10 111 0 01 17 ](lOr Ldydl1rp 000 04 05 7 x Wmiddotw 0 01 IS 50r Lelyoofll 600 04 05 7x 10¹⁰ 0 0 IY 50i( Lclyuorp 600 06 0 7 x 10¹⁰ 0 0
20 uiluled marine 600 04 05 7 x 10⁻¹⁰ 5 01 (~~r
diluled marine 600 0 05 7 x 10- 10 55 01 2 50-- Lclydorp 600 06 0 7 x 10¹⁰ 5 0
y~
Table 61 Simulation parameters for modeling calion-exchange in a column of ori~inally saline Pleistocene clays in Suriname as a result of freshening during lhe Wisconsinan
70
----------
Sirn Cherncomp Chem compo Column lenglh (ml CECtmmol K~gtiC KJM~ Diffu~ion
N- lOp hotom c~nic
Plei~t Tertiun PleisL Tertiarv m~~l
saline T21 IDO7( Lelydorp 113 600 04 05 7 ~ 10 1
saline T21 100S Lelydorp 6 II ~ 14 600 0 05 7xlO 1II
sal inc T21 1007pound Lelydorp 4 113 14 600 0-1 U5 7 ~ 10 111
4 saline T21 1007r Lelyuorp IlJ 14 600 06 0-1 7 x 10-IH
5 saline T I 1007( Lclyuorp 113 14 3()1 0 05 7 X 10-)1gt
6 saline T21 100ck Lelydorp 113 14 1OO 0 05 7 ]) III
7 hrakish K3 1007lt Lelydorp 113 14 600 04 05 7 Illmiddot II
X saline T21 100il- Lelyuorp 113 600 0-1 05 7 I(I-lil
9 ~ulinc T21 IOOlk Lclyuorp JI1 24 600 O- 05
7( 10 111
10 ~eUWUlcr 1001l- Lclyuorp 113 14 O)) 04 05 7 x 10 III
II saline 121 I)(Jlif Lclydorp 113 14 600 04 05 4 III saline T21 10(llr Lclyuorp 113 14 (iOO 0 05 10 x 101 7) 10 111j) saline T21 mOCk Lclyuorp l~ 1200 01 05
Table 62 SimulJlion paranlelerS for nlouellint ltation-exchangc in a lolunln of Pleistoccne and Ncoglnc rormation~ in Suriname a a result of salinizalinn uuring the Holocene transgreslon
71
Chapter 7
Isotopic signals of the hydrology and paleohydrology in the coastal plain of Suriname
71 Introduction
In lhi chapler the isotopic puameler- (~H middotH IC I~C and 101 in gmundwler ar -audicd They may add new information on the paleohydrological conditions in the coaslal
plltlin or SUrinOlnle_ There io ahundanl literature on the applicalion of these iiotopes to detershymine vurious aspects of groundwater like origin mixing now system age tinct recharge but also of (palco)tcmperaUrc~ vegetllion and rainfall patterns (Clark and Fritz [997 Kendall and McDonnell 1998 Cook and Herczeg 2000 Mook 2000a)
In Chtlptcr 4 u reconstruction was presented of the LGM landscape based mainly on earlier studies the nll Pleistocene surface of the coastal plain and the cominental shelf had heen dissected by Ouvial erosion during the Wisconsinan low stand rainrltlll was about half the present-day value and more concentraLed in the long rainy season while temperatures were ahout 4 to5 oC lower [han IOday the eleated interllllves were covered by gras~ and shruh savannahs while the incised alley~ were hordered by g~l1lcry ronst~ The Sammacca and Surinnme rivers running through deep (gt 10 Ill) vnlley~ were probahly perennial while [he [rihutaric~ had an ephemeral chamcter In this chapter I will use isotopic informntion mltlillly to define groundwater ages and no patterns and to obtain more insight in vegetashytion and rainfall pauerns
72 Data
72 J Nell (IIwyIlt
~C~i~rJ_~_
For this study 30 groundwaler samples were gathered They were analyzed on I-IC isotshyopes by the laboratory of the Center for Isotope Research IC10) of the Groningen Unirersity (the Netherlandsl For these analyses groundwltlter samples of 30 liters were collected in plltlstic containers In Suriname all CO~ gas was expelled from the eonlainers by adding acid and injecting air The gas was led through a lUbe and released in boule with a NaOH solushytion where the gas dissolved as carbonltlte and bicarbonate The [-IC isotope radioactivity was detemlined hy measuring ~ decay events in a low baekground proportional counter filshyled with thc purified sample CO~
The [-IC content is expressed as a percentage of the measured activity (11) to lhe activishyty of oxalic acid from 1950 (ao) the standard for modern atmospherie carbon The accuracy of I-lC analyses of this slUdy is about I (standard deviation) The accuracy is dependem on counting time and counter volume For groundwater samples an accuracy of 1 (stanshydard deviation) is normally sufficienl
72 73
Groundwiller samples have become slightly depleted in ~e isotopes by CO2 los~
during transpon hee next ~eclionl bUl the effecl on I~e content expressed as a percentage of nlockrn carbon is negligible
I C-iMll~ I C12C isolOpic ralios were analyzed by CIO on w groundwaler samples To aVOId
hilllo~ical reacLi()n~ and fractionaLion all I~-KI solution was added to the sample~ The ral1o~
arc n~easured on eo~ gas expelled from Lhe Wltler ny orthophosphoric acid Rat~os ar cxprescd as ope middotullles These arc dcilion~ in per millofthe musured DCI_C nlt~o 01 thc sample with thUL or the internmional VPDB culibratlon matenal ~c~uracy of 01 ~
nlealIremcms is (Jl rtl It appeared thaL many meusured OlC values 01 dissolved tolalmor il11ic carhon ITICl were inlluenced hy loss of CO~ gas in the period between sampll11g ~nd
~nalsis Lo~_ or C02 vhich is isotopically light with respect (0 hicarhonatc leuds 10 higher 81lelIl vallles and higher pH The latter was ohserved in the differencc helween lahoratory
pH and field pH of most samples For mmt samples CO~ loss could he e~t~maed hy sub- tfltlclin the amount of TIC measured a1 the CIO Iltlboratory from the ongmal TIC The onshytinal TIC was calculated Wilh the PHREEQC code (Parkhursl and Appelo 1999) on lhe hais of field pH and hydrochemical composition Subsequently the e~ect [ CO I~ss o~ i)1Cnc was calculutcd with a Raleigh distillmion model usmg the eqUllibnum ~ractlO~allOn
faclors reponed by Mook C()OOh) In the calculations i was assu~ed ~ha~ alkalll1Ity ~I not chant1 durin CO escap~ md thai dissolved carbon species remamed In IsotOpIC equl1lbnshylIlll Calculations showed thaI the analyses needed negative corrections of I 0 -4 tkr
iH-iOLOpe~ - - -7 G~oundwaler samples were analY7ed on ~H content (tritium) by pradimion counting
in the CIO laboratory Prior 10 measuring H~ wa extracled from ~aler in a mg-oven an~
combined wilh Irilium-free ethcne gas 0 form ethane gas The lfltlUm eontent IS determmed h rdaling 111~ meltlsured aClivily 10 the activily of a labormory referenee of kn~wn TU ~~ IS tl~e Iriiiulll unit and equal 10 one H aiOm per loui hydrogen alO~ls Samples With Iw mllum (01lCnl i lt 20 TUl like thosc rrom Suriname me anificially ennched by electrolySIS before Illca~UrCm~nL M~asurcmcnt accuracy of enriched wmer of the new analyses is 02 TU
Iso-ilI1~~JtjillLemes ~ I I~ t7 Sample were analyzed at the CIO labormory on ISOlhO and -HI H rallOs The 0shy
ratios are determined by isotope ratio mass speetrometry (lRMS) on CO~ gas whIch IS
equilibrated with the water sample ~HlIH ratios are measured with a mass speclrometer on H gas formed from waler by directing Water apor over hot uranIUm Rallos are expressed in-o~IlO and iPH as differences with the inlemmional calibration material Vienna Slandard Mean Ocean Waler (VSMOW) Accuracy of the 0180 and o~H measurements is 01 and 1 lr( respeclively
722 Allalyses from exisrillg isotope Sridies
In earlier hydrooeolo1ical studies isotope analyses have been carried on groundwaler samples from the coa~lal plain of Suriname (UNDPIWHO 1972 Verleur 1991) These anashylyses on I-IC (23) 3H (39) 180 (64) 2H (II) and 13C (19) are combined with those camed out for lhe present slUdy These analyses have been carried out by CIO III Gronmgen The
Nelherland~ and the International Atomic Energy Agency (fAEA) in Vienna Accuracies of exisling analyses are comparable to thme mentioned above for the new analyses carricd out for lhis study
In order to relate the isotopic characterisljc~ of groundwater with those of rainfall data were used from the meleorological slations of Cayenne (French Guiana) and Belem ltBrazill These slmions are located 350 km easl and I IOU km southeasL from the study area respecli ~middotely T~e lIa~a were retrieved from lhc IAEA GNIP dmabase (Global Network for 1s00opes m PreclpitallOn) (htlplisohisiaeaorg) The dalubase contains OIXO en o~H analyse of monthly precipilalion tmab The Cayenne dalaSet comprises 79 record~ (31 records lack deulerium analyses) from lhe 1962 to 1976 period The Belem dalubaM~ cover~ the 1965 to 1988 period and cllmains 233 recorll (32 record without deulerium analyses)
Apart from the GNIP datu also precipilalion analyses from other sLUdies were u~ed Negrel at al ( 1997 J studied isotopk and hyllrochemical compoilion of monthly rainfall samples from Cayenne in 1995 Important for the present stud were also the dala from Matsui et al (1983) who curried OUI OIXO analyses on more than 400 daily samples from Belern in the J978 to 1980 period
~an Vliel (1998) gathered all exisling and new i~olopic lIata Her repon also present ISOlOPIC data of pore waler squeezed from samples of the KoeVarasan and TOurtonne core drilling (Velstra 1997) These will be discussed in future pUblicalions
73 Identification or hydrogeoehemieal processes and paleovegetalion with oBc or dissolved inorganic earbon
73 Il11rodtcrirm
olC iSDlope ratios of dissolved Iota I inorganic carbon (TIC) can provide valuable inforshymalion regarding the carbon sources and sinks along the groundwater pathway As soon as
~roundwmer entef the soil carbon-dioxide gas is taken up because of Ihe relatively high parshytial pressure caused by root respiration and oxidmion or soil organic maUer The OIC value of Ihis gas (ODCCO(PII) depends on the pholosynthetie process orthe vegelation (OLeary 1988) Most plams have a Calvin or C3 photosynthelie pathway and produce carbon with olC If r bull h
a ues a --- lO --~~ Ire WIt an average of -27 c (Vogel 1993) ThiS figure IS also representative for soil organic maner produced by forests in Brazil (Martinelli et al 1996) Carbon from plants with a Hmch-Slack or C4 photosynthetie pathway is characterized by OI~CCO~IP values varying between from -10 [0 -16 ( with an average of -13 7r( (Vogel 1993) Plams operating according lo the CAM palhway have intennedime ouC values Most
C--I planls are found ilmong the family of monocotyledonous grasses and sedges C4 plants thrive particularly well in semi arid and hot climates and low atmospheric CO~ contem (Ehlennger et al 1997) This is why C4 plants were much more abundanl during the LGM when the atmospheric CO~ content Was 180 ppmV (Cole and Monger 1994) During the Holocene mmospherie C01 content increased to a preindustial value of 275 ppmV and curshyrently to 370 ppmV as a result of fossil-fuel combustion during the last century
Because of diffusion and miXing with atmospheric carbon-dioxide gas (oI3Cco~ al present i~ -8 e- and in preindustrial Holocene -65 0) the actual isotopic compositi~~~f carbon-dioxide gas (0I3CC02(SO) is higher than ODCC02PI) Cerling (1984) and Ceding et al (199]) showed lhat a minimal enrichmem of 44 0 could be expecled below the root zone
74
75
in ~()il- 1111 a high paniu carbon-Jimide pre ur~ Igt 10- atml like we fmd in $urinnme (5eelion 612) Curbon-diQlide ga- dis~olYed in the percolating groundwaler (ODCCO~IjI) i~
d~pkd hy I~L with res-pen to OlCCO lt11 the averagc soillcmperature of 27 C in Surinamc It i thereforc u~-umcd lhal in Ih~ tropical ~olb of Surinallle oL1C(nI~1J will be thou _ILi under (--1- vegelation and -235 under C] vegetmion At presenl lhe natur1 ege~
Iillion of the lUd) area ltomist~ mainl) of dry-land foreSis and marshland fore~b in tne lower clay~) pam of the toastal pluin (Lindeman and Moolennar 1959 Teunissen 1978l Thl~C cgclllioll type~ cotl1pri~e Illo~lly C~ plam-
Further alon~ the Ihm pmh lroon nlly ne added 10 the groundwaler by dissolution of lliinrll~ and -cdllcnt nrgmic maHer (SOM) Thec rc(tton- do 11m take place in the deshyrly WLllhcllt_d Mlil~ of the rechnrgc arens in SUlinillllc hut ill Inrger depth in thc siHurllcd OI1C (Scclioll ()J--1-) umkr c1tl cd (ndition~ (Ilo illlcnLtion with ~oil gasesi In Ihnl GISC
the Ol1CTIC 01 total illlllganic cmhtm in groulldwater i~ a mixture of the original dliC(o~Iltj1
and thc i~OI(pic clImposilion of the added carhon unlc~~ fraclionalion occur- due 10 precipishytation or l1lethlI)o~cnc~i- (Clark and fritz 1997)
Carhonale d~~(JILJlion does nOl occur in lhc Teniar) sedil11enl- of the coaslal plain which a~ inditaled hv he undcr-salfilinn wilh repeCl to lalcile and by the non-carbonate ~ource of di~sohcd stronlium (Seclion 633) Prelipitation of ~ideritc mny take place in ~()mc parts (Sectiml 6J--1-1 which is alcltHnranicd by sOllie fmctiollation However this ciTcL will nol he lil~en into aCLount in this slutl)
Carhon i oilly addcd to the groundwater hy liberalization of SOM which i~ found frcshyquently lt1- ligllitc in the lower Plimclll und Mioecne sediments m Audretseh 195J) Pi1)nologiLill dat (WymSlril I96lJ) show this SOM eon~ist mainly ofC3 plant material l Rhiopnm 1I1d PalmaL-1 rnalysc- of HoI(lLCne peat wih tbe ~ame plant material show hal dliC (l~l middotnlue- ltlry from -5 to -~ I ~1r (Roclevcld and Van Loon 1979 Van Vliet 1998) Teniwy SOM will rrohnbly he enriLhcd relative to Ihcse nlues beeausc of hreakdown of Ihe IllI)rC reaoive organi c()l1lpound~ Maninclli et a1 (1996) found an enriehmcm of about 2 fi for orglniL rnmlcr of Pleistocene ilgC in Brazilian soib Therefore nn average of -25 ~h
i a~sumcd for SOM in Ihe Teniary lormallons Broaldowll or SUM 1kes place mainly by iron and sulphlle rcduetion in thc Plioccne
Mmcnc and Olgolene flltmaions and results in inorganic clrhon with OllC equal (1 its source In the morc slline decpcr forrnmions and in the Holocenc days methanogencsis takcs place lnd produccs highly enrichcd inorganic carbon (gt 5 ~r) As thi~ signal ubscures he other procesls the sa11lple- with salinities higher than 1000 mgll have bcen left oul
732 RlIIIrS
The mnge of ol(m--- value- of gmundwlttcr in he Tertiary formations is shown in Figure 71 The annl~scs hac been suhdiYided in age categories expressed in I-IC actiVities - hough the samples over ltl wide range of middotalues between -26 and +2 c almost h31r of the sample (l7 l7c) f111 in the range of -17 to -20 ltr ( Note thm no samples have been found in the IJC activity class between 30 and 45 q
All samples arc enriched wilh respect to the initial soil carbon-dioxide formed under C3 vegetation presently covering mOSI of the study area Dissolution of marine carbonates with oue values betwecn -3 to +3 ~(Clark and Fritz 1997) is usually the cause for the enrichment bUI is absent in this case (Section 633) Methanogenesis as a possible cause of enrichment is nOllikely either becnuse samples from the saline and mostly methanogenic
35 ------- ~_ ___zones have been left ou In il fC
samples the me thanagenic cause Age dasses30for high ot~C values (gt -II If(r) ciln In 0 pm c
be inferred from the anomalously bull 25high TIC cOntents Thi-gt leads to 15-30
II 3045thc hypolhe~is Ihat the dl~CTlC ~
~ 20 045_600value of soil carbon-dioxide may bull
have been higher han aI present ~ 15
Two mcchnnism~ may lend to the Etypical ODCTlC values of -17 to o 10 -20lfk I Dissolution or carbon-dioxide 5
gltl~ inl soil under a vcgetashylion with a mixture of C3 ( o
1 -2 -5 -8 -11 -14 -17 -20 -23 -26n5 lit) and C4 (middot95 c)
plnms it is noted thnt C3 and C4 plants do not necessarily hnve 10 be mixed within n Figure 71 Frequency of OllCr] amlly~c for diITercnt single vegetation type mixing rildiocarbon aClivil) c1as~cs exrr~~cd a~ Ii- of Inodcrn IJC
aCljil) (pine)in the uquifer~ of groundwillcr formed under different vegeshytation~ has the same effect
2 Dissolution of carhon-dioxide in lhe soil undcr1 C4 vegelation (-95 rd followcd hy dissolution of carbon from SOM (~25 cr(j undcr tnnlJenee of iron and sulphme rcduc~i-on 1ixing leads to the observed rangc hetween -17 to -20 ito(
The lirst Illcchanim implies that the contrihution of C3 nnd C4 plants to soil carbon-dioxide is ahout equal and thnt no carbon from SOM is added funher along thc groundwater now pnths This not likely as TIC of most groundwater samples ranges from 2 to Rmmoll which exceeds the initial TlC of 1 lO 2 mmol] estimated in Section 6l2 The second mechanism is more realistic but requires a vegetmion dominated by C4 plants
In Chaplcr 4 it was conjectured on hydraulic ground thaI Ihe major pan of the groundwClIer wns formed during thc LGM and Early Holocene At that time extensive grass savannahs covered the slUdy area (V3n der Hammen 1974 Markgraf 1989 Van der Hammen and Absy 1994) Relics of these grass sav3nnahs are the present pntches of open savannahs in lhe savannah ZOne and some isolated well-drnined places in the Pleistocene cO1stal p1Llin (Jansma 1994) (Ill the study area open grass and shrub snvannahs occupy only 30 k of tile savannah zone) These grass sav3nn3h patches persist on the leached sandy 3nd silty soib hecausc of lhe low relent ion capacity for moisture and nutrients Because the modem saltlt1l1Jhs are believed to contain the same plant species 3S the old savannahs their C3C4 plants ratio was determined based on floristic studies of the modem savannahs (Heyligers 1963 Van Donselaar 1965 Jansma 1994) For species with a dominance factor higher than I (surface coverage of more than 5 1c-) lhe photosynthclic palhways were detennined by eonsulting plant dalabases (Dallwitz 1980 Dallwitz et aI J993 and onwards Ehleringer et aI 1997) The results are presented in Annex IV It appeared that 83 eTc of the dominant plant species mostly grasses and sedges from the open gnss savannahs belong to the C4 group By contrast in the savannah bushes and foresls less than 7 70 of the dominant species have C4 poolOsymheuc pathways For verification plant tissue of the most
77 76
-----~-- --
place under closed conditiongt (see above) Witham admixture from other sources groundshywater age can be determined according 10
II~ -867 In ( (7] )u
where 1jJ = Lime since groundwater recharge (I-lC age) and a and (10 are the activilies of the measured I-IC and Ulmospheric t-lC during recharge exprcssed a- pmc (percentages 10
modem carbon in 1950) A- shown in Sections 633 and 634 organic material SOM frnnl the Tertiary formaLions i- dissolved along the groundwater pathway and carbonme dissolushytion is neg legible Since SOM is very old compared 10 lhe half life of I~C only dead carshyhon i- added which dilutes the I~C coment of the initial carbon from the soil zone Under these conditions the corrccted age J helomes (Clark and Frilz 1997)
- -867 o TIC Jrl~ - _ 1 --- (72) au TIC
where TIC is the measured TIC content of the sample and TIC i- the initial TIC conlent after recharge TIC values of groundwater from the Teniary formations were calculated with the PHREEQC code from mea~ured pH and bicarbollltlte coments of the samples and ranged from 0510 12 mmoll (Annex III) Estimates for TIC in the recharge area based on soil CO~ pres-ure range from I lOt 2 mllloil (Section 6J2) Interpretation of Ihe OUCT1C values of groundwater learned That TlCtt was probably close to 18 mmolli
Outsid~ the present recharge areas (savannah zone and Ihe Lelydorp sands) groundshywater is influenced 10 some degree by mixing with saline ground waters from the Holocene formations above or the Early Tertiary and CreLaceous formations below Because TIC and I-IC contcnt of these saline sources arc not well known all samples with chloride concentrashytions higher than 1000 mgll (more than 5 7( seawater cOnlribution) were again left out
Apan from geochemical reactions corrections rna) also be required for diffusive los~
of l~C (Sanford 1997) or dispersion ltJohnson and Depaolo 1996) However these correctishyons cannot be applied unless presenl and previous now paths can be reconstructed in some detail
The iniLial atnlospheric aClivity (IO in (I) and (1) has nol been a constant in time AlnlOspheric I~C conlem has decreased steadily from 150 pmc at 20 ka BP to 100 pmc in 1950 AD This effect has been Olccounled for by correcting l-lC ages by means of an empishyrical relation based on calibralion data from Stuiveret al (1998)
(73)
~
~ -20 u
u 30
dominant ra~~ (PtllliCIIIII micrmlJIIIIII) and shrub (ClIISitlodttllltI) from the gra~s saannah -outh or Z~lnderij wa- analyzed in Ille CIO labormory of the Groningen University The asurned C3 and C-I character of the~e plams was confirmed by the alC alue~ of -2995 and -1395 9t lespeetiely The general condu-ion i- lhal all grasse and sedge- in lhe opell avannah area belong 10 the C-I gfllUp whik all dicOlyledonou planL belong to Lhe C3 group Therefore groundater recharged in gra saannah- i e~pected to have relativeshyI~ high Ol5CT1C middotalues alCT1C values or ~hallow groundwater sample- confirm lhis though thev arc few in llumber alCw value- of -I sample are lower than -23lfi (fully C3 vegeshytJli~l11) while one sample on Ihe border of all open gras- savannah has a a 1middotCT1( of -12 9ir (more thall SO 9 C-IlOJlIributiolJ L
The hypOlhcsis i- vcrilicd hy dehnnining the 1(rlC mass balallle Knoving the aDC tlues of dissolved soil carhon dioxide ta- (-lJ5 711) and mincraJied SOM (-25 itr) and Lhe
~ total TIC lOlllcnt and alC value of il samshyo ------------- ple Ihe initial TIC content an he calculashy
ted The oUILome is 1 wide range of TIC middotallle- averaging around a value of 18 mmolli FigurC 72 shows the reuhs of a reerse alculalion where measured and calculated aDCTlC for groundwater are shown for an initial TIC of 18 mmolli Espedally the large group with value- betshywcen -17 and -20 r seems LO lit well The amoum of 18 mmoll for initial TIC i- dose to upper limit of the range of I to 2
L- ---J mmolll estimated in Section 632
middot30 -20 middot10 o The idea thai C4 specie- dominalCd
measured il13cIC~ the LGM savannahs is corroborated hy
Fi~urc 72 MeilsUled and callulaled a11 c TI( or al~C shifts in organic material in Brazilian soils (tvtaninelli et al 1996) Shifts in ODC
gWlIllJwller hil~cJ nn mixing or Inilial TIC ( 11 of soil carbonates in New Mexico were al~o111111(111) fnlll1 Ji~~llluti(n or ~oil Glrbon-dio~id
a~ in redlare re under C-I veQcullion (-10 rj related to change of C4 to C3 vcgetalion middotith ~cl(I1Jry TIC rrom (lxid)(i~lIl of sedimenl belween 7 and 9 ka (radiocarbon) BP (Cole organimiddot mltltlcr t-S Ql and Monger 199-1-)
74 Groundwater dating with 14C of dissolved inorganic carbon and JH of ground wamiddot ttr
7-1 J Iwmducrioll
Groundwater dating based on the exponential decay of radiogenic I~C in dissolved inorganic carhon (TlCl may be eomplicated by admixture of other carhon sources as discusshysed ahove In the studv area the situation is relatively simple In the soiL groundwater takes up gaseous earbon-di~xide and therefore has an inilial I~C activity equal 10 atmospheric l~C activity The fractionation by gas diffusion and dissolution as discussed above has a neglishygible effect on the l4C activity expressed as a percentage ratio 10 modem atmospheric carshybon Apart from soil carbon-dioxide dissolution all other processes are assumed to take
78 79
bull bull bull
7-12 Hellil1
In Figure i~ the uncorrected
rltJdiocarhon uge~ 11 (Equalion 71 ) ar~ ploned ltJgUJnSI the age~ corrected
lor d~ltJd-carbon di~solulion r J
IEljUalillll 72) and ulnlOspheric ~C
aCliit) I (Equation 71) Most
-lpl- -ho a -ilabk redlLlion in agc after dead-carhon wrrection The comuion for aunospherlc I~C aCliviL)
(Eljuutlon 7~) re~uhs in an increa~e in
age 101 agc- higher thlll I () ka BP Thc radiocarbon age~ ltIre
checked hy plolling OI~O of gHiundshy
lIer against IhL correclld rldiocarshyhon age (Figure 74) The shift in OI~O
CU1llent marking the climatic change
al tile hegillning orlhe Holoeene is lllund around a rauiocurhon age or JO b HP which correspond~ with other groul1d a~r dining siudie- in Ine lroshypic~ ilnd suhtropic (Kimmelman el
d lq~y StUle tt al t995 Healon ~
ltII 19H6 SllHl lI1d Talmltl 1(98) Although this does nm prove that
he applied corrections are corrccL il
docs indica Ie Ihtll lhere i~ given the untenaintie~ no point to pursue furshy
lhcr correctiol1s The frrors introduced hy fIeld lahonllory and correclion procedures creale a large un(enaimy ill the IInnl grollndwller ages
Epeciltllly thc errors related to the ~lsumplions for thtgt dead-carbon corshyrection ltIre very crilical These errors
an mlSi probubly sysltnmtic and theshyrelore relative groundwater agcs and
iochrone~ pattcrns are more signifishy
ltjnl rather than absolute ages Deadmiddotcarhon dissolution
during p~ssage through lignite layers
in the Late Teniar) formations is accompanied by rapid decrease of IJC content and expla1s the lack of
samples with IJC activities between 30 and 45 7c as was noted above This is
40-shy ~
o t lC correcled for oxydallon of SQM
o LCd ~orreCled tor almO$ph~nc l~C
20
deg 0
(0
O~O 0 000
~B
~ 0 10 20 30 40
uncorrected ralflocarbon age 114C (ka BP)
Figure 73 Raoiocarbon ~ge for grounowalcr nlrrcClctl for scawJlcr mioing o~idalion or seoishylllel1lorganic mailer (SOM) ilno atmospheric I~C
aClivity
-22-------- ----
-3_~ -36 -I----~--_J___~--~_~
c 00 lOOOO 15000 20000 25000
rallllxarbgtn age yailllS BP)
FigufC 74 Relation of 0110 and radiocarbon age of groundwater Values have been corrected for dead-carbon dissolution by oxidation of organic malter Figure 76 North-South geological seclion in the coastal plain of Suriname with groundwater ages
and salinitics
consiSlelH with Figure 75 which shows that sample~ low in I~C activity generally
have higher TIC contents Figure 76 shows the groundwater
agel in l Nonh-SoUlh transecl in the coamiddot
swi plain The correcled and calibnJled groundmiddotler age in lhe Young Coasal
Plain range from 20 to 7 ka BP These
agegt dcmonStmle that groundater ha~
becn rarmed in u period he fore the sea
imacle he presem cOltl~tal plain wben
there wa- still groundwater now in the Teniicy lormaiom Cllip~cr 4 Groundwater in the Holocene coaswl
plain therefore can be denoted a~ paleo gmunuwuler (tlelinilion in Section 24)
A~ would be expeeted younger groundshywater is only found below (he present rechargc areas of lhe savannah zone and the LeJydorp sands where groundwater has not
been affected by saliniwtion (Seclions 362 and 561)
Although there are not many data the subhorizontal isoehrones in lhe Holocene eoamiddot ~lal pluill indicale lhal during the Late Wiseon$inan recharge to the TeniaI) aquifers was
more wide-pread as a~ derived from the paleohydrological model discussed in Chapter 4
jf paleorecharge woulltl hae been confined to the present rechltlrgc areas lhe isochrones in the Holocenc wastal plain would shov a more oblique panem
o
1 ~ 100
i 200
g ~ C
581~nnah
~
bull DOO ~~~ ~ ~ ~~ ~~ ~j~~ ChlOiidc eonI8~i ~
o ltso o SOmiddot 250mgn
o 250middot l000mg1
100Qsoormgll
bull gt IlOOO mg~
--------------=----
o
()gtiOpmc
O-ISpme
_5
I lt15-60 pmc
bull bull
c D
ligurc 75 Talal inorganilt carbon lttJl11enL ~nd
OUCTlC of groundwmcT for different radiocarblln activity duscs exprcscu u~ u pencnillge or nlOutrIl r~C aCliily (pmc)
80 81
o--------------------r--r Preclpilahon at Belem
c Precipitation al
20 l
Cayenne
Groundwater near bull Paramaribo
o--~-~--~--
~ -20
-40
bullbull LMWLCayenne I2H=S111160 ot 49(R2 =O87)
LMWL Paramaribo groundwater b2H 62 b 180 of- 45 (R2 = 060)
LMWL Belem 1gt2 H = 71 ll1BO + 67 (R2 = 091)
shy80 L--G~M~W~LC2cH--6-17~1~6~O~11~27~(R~o~z~a~~ke~~a~I-993)~__~---J -10 -8 -6 -4 -2 0 2
160 lObo
Fi~urc 77 Wlighhd m(lnlhl~ aeragc~ of slat-ok-isClltlPC l1l111positiol1 in rainlall al Caylnnc Frcllch Glli~lna 0 IQ7S1 IOU Hdcm BWIit (1965 - 19l5) and in groundwalcr arounJ Parunariho SUrlnalll Rainfall Uall Olre dcricJ fromlhc IAEAfWMO GNIP datahase
figure 78 cSllI() pilllcm of average yearly rainfall over Nanh and South America Afric~ and Europe (After RozanslJ Cl al 1993)
75 Reconstruction the paleoclimate with slable 6180 and oH isotopes in rainfall and
groundwater
75 [llmdllCliml
The smble iUiO and o~H isotopes of groundwater may contain paleoclimuic infonnashytion as they reneet the isotopic signature of precipilation allhc time of recharge First we will havej closet look at spatial and temporal stable-isOlope patterns of tropical rlinfall uoshythey are somcwhal differem from those al middle lalitude-
The rehuion between OJIlO and PH of tropical rainfall deviates slighlly frolll the Global Meteoric Waler Line rGMWL) shown in Figure 77 IH07anski e til 19(3)
(7 Al8~H = 81781~O+ J 127
The slope of local-metcoric water lics (LMWLJ til Ine lropics is often smuller because of the amount effect (Dunsguurd 19(4) Relmively lighl ruins appear 10 he enriched in dlSO and dH in comparison to heavy rains The ovefjll effect is Ihat the slope of the LMWL through the dmu poims is smaller than 8 According to Dansgaurd (1964) the main cause is evapormion and hence enrichment of raindrops of light mins Other explanation-o for the difference belween light and heavy rains proposed by him are (i) exchan~c with heavier atmospheric moisture helow the clouds which lendo- to hltle more effect on light showero- and Oi) gradual depletion of the condensate during rain development resulting in low isotopshyic content in prolonged ruin showers
The average weighted oUOmiddotvalues of precipitalion 01 various meteorologiLal sllltions displays a worldwide spatiltll pattern (Figure 78) called the latitude effect (Dansgaard 19(4) Superposed on this pattern are continenlal effecs and mountain effectlt (Dansgaard 1964) These patterns result from Rayleigh distil1alion taking place during (011shy
tinuouS condensation and rainoUl from water-vapor masses which are moving from warm 10 colder regions (Merlivat and JouzeJ 1983 Van der Slraaten and Mook 1983) Consequently average weighled SIHO of precipitation is linearly relatcd to tllc average yearly lempermure al the meteorogical station (Jouzel et a1 1994) The relation of spatial patterns with tempeshyrature does nOl exisl in (subltropicul regions with avera telllpcralUrcs above 20 c Relevant for Surimlme is the study by SaJali et al (1979) who al1ributed the small easHe~t
gradients in stable-isotopes of rainfall over Amazonia to recirculation of water by evapOlranshyspiration from Ihc rainforesl
Seasonal 10 secular lime variations in the stable-imtope composition of precipitation are also related 10 lemperalUre variations in middle and high latitudes (R07anslil e al 1992 1998) A bOI 801bT value of 06 is generally used to calculate the difference between the LGM and present temperatures This vaue includes the correction of about 11 for the higher 180 content of ocean water during the LGM (Shackleton 1987 Jouzel et al 1994l Just as he spatial relationShip the large-scale temporal relationship is absem in the lropics and sublropics according to Rozanski et al (1992 1998) and Stute et al (1995) The reason is that distance and temperature difference between the tropical landmasse and the oceans (vapor source) are small also during the LGM Therefore isotopic depletion of water vapor by Rayleigh distillation during rainout is limited and not much effected by global cooling
Nevenheless tropical and subrropical America and Africa were aboUl4 106 OC colshyder during the LGM (Heaton et a1 1986 Stute et al 1992 1995 Plummer 1993 Dunon
83 82
bull bull bull bull
lLJ-)) SlUW and Bonani 1995 Clark el ai 1947 1998 SlUte and Talmu lY9Sl Some re~eshyarher Iill relale 010 dcplClilll1 Ill old grounJwaler ill lhe IfOpies 0 a lower LGM lempemiddot ralure like SanfnnJ and Bulpcng (1996 for groundaler al Bangkok and HeHon el al l 1YX6) Illr iround Her al UillJ1hag~ Soulh Africa In mOSl other ltlren~ deplclcd and even enriched O[~O middotalt1C~ or pilkngruundOIler arc cgtpllined difflrenll~ III Windhoek ltlnd Sallhlod ill ~l1lihia Vogel ami Van Urh (1975) dlcOmiddotercd Lale Pleistocene groullllwatcr wILl Ol~() middotalue deplCled by 2A r with rc~pecl III recell groundwaler which lhey anribushyhd (I rcellarc in diwnl and more elevaled urea durin~ Ihat period Slute and Tallllltl (19981 rcpl)lled lI)I~)picdly ellrichcd ( 11 If ) grounuwHer of LGM age illlhe S~ampri~t aqu~fer lhll irr Nllllihia Th) uggestcd lhal thi as caused hy the advecllon 01 AtlanllC mOIsture onru d1rI11g he L(jM AI-o lhe Floridan i1LJuifcr lsoutheaslern USA) contaIns PleistoLcne lollJd[ICl ~llriehed in nmiddoto i~(l(ope~ (23 XI) Plummer Il(91) ltHlrihuled hi~ III an inLensishyimiddotllmiddotIillJ III U1l111lel lwpiel lOrm during Ihe LGM Clark ~t oIl (1997) fOUlld groundwater ill 11lL alHl I~gioll which 1ltllhr correcting for lhl enriched glacial ocelIl was slipoundhtly llLpklld ilh 06 I They uggcsled halltJi wa~ due to the larger dislamc 0 the coastline dllrin~ Ih LGtvl (C()Jllinlllal dfeCl) Earlier Love el al (1994) proposed Ihe Sltlme mechashynismo plain the lttrying degree uf I~O depletion in Pleislocene groundvJlers in the Olwav Ba-in in AUlJltlliu Around Jukana in Indonesia groundwater does not show any ChHl~Cll 11 in o~() lhroughoul the LGM and Holocene (Geyh and S6fner 1989) In the ljlla~ ArLc-iall l3a-in In AUstralia JrtJundwatel with ages ranging from recent 10 300 ka BP hl~ lillie varialion in sliIhle-isohlpes (Aircy et al 1979) Though Stute et al (1995) do lol I[lorl 61~O dILltI ill lh~ir paleotemperalure ludy of northeastern Brazil they state that ~llhle-i~olopC ltIf [loL 11latd to paloclelllperulLlre Anolher study in the south of Brazil 1111middot- PllIIIlLClll ~nlUlldwaLcr dcpletcd in 01~0 by 25lk r (Kimmelman eL al 1989)
(lre I1ltHlld~hlmiddot laken in using groundwater as In ltlrchive for the isotopic composition or pa prLLipiwliull The i~otopic composition of grollndwller may no be equal to the wcillILd OILra~L COll[lIsition of precipitation if recharge is conllned 10 a certain season likl-Brillklllanil cl al 11961) and Vogel and Van Urk (1975) inferred for the Rhinc valley and ~I111ihia fCplYlI middotely The stahlc-isolope composition of groundwater may also be atkclcl1 11) lmiddotap0nlliul nr Isotopic exehange with the rock matrix bUI these effects may be iCCU~lliCd 1 iI dcpalllllc from Ihe GMWL or LMWL provided onc analyses both ClliO anu
l~middotH
- 5~ 1~1middotllIlls
III Fiture 77 ~lbk-isolope unalyses of rainfall (monthly weighted average) at Belem HId Cv[lle and groundwater from study area around Paramaribo are presenled (i1l1l1H1lLer and Cayenne rainfall analyses plot along a similar LMWL
isfi=(J 1401~O+487 (R~=087) (75)
AhhollQh thc correlation coefficient for the groundwater samples is low (060) compashyred to tl111 C~venne rainfall (087) there is statistically no difference between the two popushylations Theremiddotrore 11 is reasonable to assume thal the weather system at Cayenne is represenshytative for the Paramaribo area The LMWL of Belem rainfall differs slightly from the CayennePammaribo LMWL because of some etreme values but the majority of the Belem
dnla fall in the Sltlme domain as Cayenne and Paramaribo data (Figure 771 Thc middotmiddotlmountmiddot effect di~Lu~sed above can be recngnized in Ihe relmively low slope and In imercep lt1- compared lO the GMWL Thi effect ~eem~ abo apparent in Figure 79 showing the ncgltltimiddote eorrelation betshyween average mOnlhly 010 values and average monlhly rainfall amounts for Cayenne and Aelem (A discussed ahove the paltern doe- nm correlaLe with lll(l[ll1ly lemperature which hardly varicgt anyway in thi~ re~ioll) The supposed corshyrelaion with amounL is much weaker if lhL i~olOpit (omposilion of daily rainfall is lIJwlysed fllr data from Belem (Matsui et lt11 1983) In Figure 710 the daily records are shown for thc wet season (January to June) and the dry season Rain~ in hOlh SCltlsom display a small llllount effecL However Ihe setlsonll difshyference is much sironger ll wet scason and dry season rains of the same amoum differ hr ahout ~ 7rr Therefore the
monLhly average~ of OI~O in Figure 79 are nO( so mueh relmcuLO middot-amount hUI ralher to ~easonal diffcrences in vapour origin eondensation process or amhient air humidity Dansgaaru (1964) studied daily rainfall data from Binza in Congo and concluded that air humidity hl an important effeci of the stable isOopie composition lower air humidiLy causshycs stronger evaporation and fractionation of (he raindrops
10Fi~ure 7JO Duil rainmiddot rail imltlUrn~ am ()l~O uluc- of 400 daily rainmiddot
5fall ~all1plcs al Belem frow 1978 to 1980 IDilla from Malsui el a1
01910 l Rain from the relHively weI season -J(JmlUar to Julv) and reialively dr season -5
July IOl December) are c depleted separately 20middot poim moving averag~s
-10
of OI~O are calculated ~ for daily rains in order
-15
arid )0
-bull
20 pis mOVIng B~erage of preClpAiIton
0 0_c of increasing magnilude lt-~ ~- 20 40 60
-20 01 1 10 100
daily precipitation (mm)
amp5
0 wet season dry seasonbull bull
bull --d_8__~~igt
bull0
8 goo 00deg0 bull if
0
0 0 dry season 0
00
00 0 0 0
wet season
600 r---------- o
-1 500
-2
2002 -3
o 100E -E 50~ rc----------- tioS _ Ii
shymiddot2
-3
200 -4
100 - 1- -5
r -6
0------~__L=--7 -7j f m a m j j
Figure 79 Average mumhty minfall and wcighlcd momhly iJcrage of OI~O in nlinr ll al Cayenne French Guiana mtl Selent Brazil Ba~ic tlata for Cavcnn~~ cover Ihe years 196-1975 (IAEAWMO GNIP uliilhasc) and 1995 CNcgrel el a1 19971 For Belem dala arc frolll lhlt years 1965-1985 (IAEAlWMOGNlpuLllllhasc)
0
A~ climalic mndilinm in Ihe Guiana~ and northeastern Brazil are not essentially dirfeshyrLn abo thc ~ea~onal i~otoric behaiour of rain at Ca~enne and Paramaribo is related 10
caollal ~lthcr condilion rather than amount Rainfall at Cayenne and Paramaribo is marked h lWO rdalicly wet and IWO relatiely dry sea~on~ relaled to the passage of the ITCZ or lhi~ region twice a year Figure 79 shows that in particular the rain~ from the Jon~ rain~ ea~on from Aprilw July have depleted alue~ bela -2 ilL
Rainrall t1uring Ihe long rainy gtcason in Cayenne i~ higher than in the study area around Paramarioo (compare Figurc 79 and 32) Therefore the weighled yearly average of lahk-ioLOpc~ in rainfall al Paramariho will be diffcrent [rom that al Cayenne Thc former ha bccncalLulalcd a~~ullling Ihal the monthly i~otopic composilion at Cayenne and PJfalllaribu lrL IhL ~ame Thi~ a~~u11lption i~ based on the ohservalion that the isotopic comshyluiliol1 in thi~ region i~ related to ~(a~)n rather than amoum Calculalion~ shoymiddot that aVefltlshyLmiddot rHnrall al Pllltlmariho is sligluly enriched wIlh respect (0 thaI of Cayenne (Figure 711) M~l grollntlwatCr samr1es arc depleled with respect to the averagc rainfall signature i Figurc 711 ThL most probaolc cxrlanation is Ihat recharge mainly occurs during Ihe monlh or thl shurl anti long rainy season whcn rain are relaLively depleted This wa- alreshyady condudctl in Section 351 on the oa-igt of monlhly rainfall and potential evaporalion lll~kctllhl wciglHcd avcmgc of modern recharge water calculated from stablc-isotopes of prcciriwtion during Ihe ~ weltesl mOn1h~ is elose 10 the compoilion of average Holocene ~flltll1t1walcr (Figure 711 )
Groundwater of the LGM and Early Holocene i- depleled in comparisDn to younger ~1(]L1ndwaler ilCraC 810 or LGM and Holoeene ~rountlwiller arc -29 9( and -25 lc( middotLmiddot pLctlely The at~utl t1irrerence is larger if the effec of lhe enriched glacial ocean (11 1 i Included The review in the introduction above made clear thal the LGMHolocene inlor1Lmiddot shift is not relatetltu the temperature shifl Hypotheses related to different walershy apm ourccs and ~calhcr ~ys(ems arc not likely a- these have not essentially changed in
a Figult 711 Yearly weighted averages of Sldshy
0 blc-isOlope eomposilinn of rainfllI m Clycnnc und
middot5
0
Panlmaribo and sUlblemiddot isOiope compnsilion of00
~roulldwJIer around 0
Plfunwribo 0 o ~o
0o llJ 014 0 0 DO amp (]gtrP
b8 DO DO 0
g Aa 0 bullmiddot15 bullbull0
a A
bull lall Par3tn11nbO 1ltaIDJlilledj o I1cgtOC gOU_1N la-- mID)
A modem red8rge wale 1IDJliIled)bull PloolSlOC 9flJUfCl_aler (BYege D) Ol Illnlall C~JeM~ (meaoureodl A ~~==~a=lodlo
-35 -3 middot15
86
Ihis area Larger distance lO the LGM shoreline (about 100 km) does not explain lhe shih either as OIHO gradients in present rainfall over northern Amazonia are only 0_75 Cc( per 1000 km or less (Salati et aI 1979) In lhe present study the more seasonal rainfall pattern during the LGM is proposed as a possible cause According 10 palynological studies (Van der Hammen 1974) and global climate models (Kutzbach el al 1998) rainfall during the LGM was about half of the present amOUnL of 2200 mma and resricted Lo a sinole rain season coinciding wilh the present long rainy season during April through July Ground~a(er recharge during the LGM took place only during this rainy season with a ~table-isotope composition comparable 10 Ihal of presenL-day rainfall The OIIiO of this paleorecharge water has been determined by calcUlating he weighted average from the four wellest month~ (sceshynario aJ and lhe two weltest months (scenario b) of pre-cnl-day rainfall Figure 711 demonshymates that tile paleorecharge Water according to -cenurio a) is close 10 lhe average iSOIOpic compo-ition of PleislOcene groundwater However if Ihe correction for the enriched ocean during he LGM (II ltd i- upplied paleorecharge according to ~eenario bl i~ more likely
76 Discussion and conclusions
ODC analyses in combinalion wilh hydrogeochemical information show that the dissolshyved Inorganie earbon (TIC) resuhs from dissolution of carbon-dioxide ga in the soil zone and minerali-l1ion of sedimem organic mailer (SOM) The dUC mass balance demonstrates thai in most samples in thc coastal plain -oil carbon-t1ioxide gus has been produced under a vegetation dominated by plants with a Hateh-Slack (C4) symhetic pathway (OLeary 1988) However today C4 plams are not common in the natural vegetal ion types of the study area consisting mainly of dicOlyledonous plants (Lindeman and Moolenaar 1959 Teunissen 1978) Data from floristic studies revealed thaL C4 plants (grasses and edges) arc currently dominant only in Ihe open grass savannahs found in some isolated pans of the study area (Heyligers 1963 Van Donselaar 1965 Jansma 1994) Since most groundwater t1ales from lhe LGM and Early Holocene open grass yuvannahs must have c(vercd the major pan of the coaslal plain during Ihis interval This was also concluded by Van der Hammen (1974) on the basis of palynological data The presenl open grass savannahs in the savannah belt are supposed 10 be relics Df these vast grass savannahs during the LGM (Teunissen personal communication)
The ODCTlC values appear to be innuenced by loss of CO~ during sampling and tfimsshypan For these acid Walers it is recDmmended to carry out pH and alkalinity tess bOlb in the field and prior 10 processing in the laboratory in order to check and if necessary to correCl measured OI1CTtC
Groundwater ages in Ihe Tel1iary formal Ions of the coastal plain of Suriname vary from recent to 30 ka BP The outcropping Pliocene sands in lhe savannah zone in the south conbull tain recenigWijndwater tbe high tritium canteills (UNDP 1972) indicate lhat the major pan of lhe groundwater has been recharged after 1950 In the coastal plain nonhward of R~publiek groundwater aees are gendally higiier than 1000 years and more~ineralised ~locene groundwater (J to 5 ka BPJ is found in the upper part of the Pliocene formashytion The recharge zone of the Lelydorp sands is marked by a downward protrusion of this relatively young groundwater Groundwater in the major part of the coastal fonnatians is of Early Holocene to LGM age This supports the conclusion from Chapler 4 thatlhe large body of slagnant groundwater in the coastal plain is paleogroundwater fonned before the
87
marine inundution In thul period the lower and the more northward position or the coastline and the eWgtle relkf of the (oaslal plain led 10 small bUl more widerread recharge in the Part II entire coastal pllin Despite LIJ~ low accurlcy of the agegt [he subhnrilomnl POsilion of the i~ochrone~ sugges~ thaI ground~aler recharge vmiddota~ not confined (0 the present recharge lrea~
The lIllOUIlL effecl can tw observed in the weighted monthly aerage~ of stable-isotope LI)1llpo-ilioll (81i0 and o~H) in rainl~lll at Bel~m and CayenneltllaleJ ~S() kill eaSi and 1100 Generic investigations ill() the origin of ojlhorc meteoric 1-111 lJuthCISI ()f the S[IIJ~ are1 However lhe amount effect largely disappears in lhe ltlllalyshy grollluwaler c- 0[ t1tih rainfall lt11 Belem (MI[~lli et al l)HJl It i- thererore concluded that Lhe seasonal
I1
gtlahlemiddot i-lllgtpC plliern i mOle real~d 10 ~pecit IC w~a(hcr sYStems relaled 10 Ihe posilion of lllC IUler-Tropical C(lnvltmiddotrg~nce Zone (ITCZl The Ulllll1tr 1110n~(lon rain Ialling dunng lhe northward ra~~lgL of lhc [TeZ from April 10 Augut (long rainy season) ha~ the nlOSIiLplcled lllIe~
I Aera~e Holocene groundwltcr in the Suriname loltJ~lal pllin i~ deplcled ~ith reS[Jccl Illgt 11clagc rainfall 11 Cayenne and Paramaribo The depletion with re~pelttto rainfall i~ auri hLllld lolhe fael Ihal neharge take plUlc mumly during Ihe wei rnolllh~ of Ihe shorl and
IOllf rainy ea-ons which lJh Jl1on depleted rain~ (see tl~o Seelion 351 l Average Pkiloccnc rmllHlwatcr i~ even more depleted than Holocene ~roundwater which in the
11lopic i~ nt)~ rdaleulo the colur climale The low amp~O amI amp~H values probably indicate 1
111 1 [Jakolcchilrgc a~ reslricled III a rainy ~eaSOll dLlrin~ borel llllllller similar to the pre~IlI1Hb~ long rainy oCltlmn v-Ilich i~ lhe WC[C~I period with the most depleled rains Thi~ is Ill) ~ICell1lnt with )1cr ~mi6 san h1 rainfall durin Ihe LGM wao lower unL more 11la~-lIllllhall (Od rVall der l-Iltlmll1e~ 197 Mark~rltlf 1989 IYY3 Van Jer Hammen and b~ 19lJ-I KlIIbalth Cl al 199(-) The diflere-111 dlll1Jltlc p(lllern 1~ probably relaled () the Ill lied po~iiOl or Ihc ITel dunng Ile LGM
89
0
Chapter 8
Worldwide observations of offshore meteoric groundwater
81 Introduction
The preeeding chapler dealL with the paleohydrologica procesles that have led to the ruther specilie groundwUler eondilions of the Suriname coastal plain nOlahly the vast body of meteoric groundwater (dclined in Section 21) extending 10 more thun 90 km offshore the Suriname coast The question now mies how abnormal is the Suriname case compared 10
other cDustal plains worldwide And can we state somelhing in general about the origin of offshore groundwater This is an impol1unt question as in many classical concepls of coamiddot stal hydrology the meteoric groundwaler domain is slill supposed to end somewhere near the coaslline
Although systematic surveys of offshore groundwater arc rare an attempt is made here to revicw a number of ohservations of offshore meteoric groundwater In this case offshoshyrc means a distance of more than a few hundreds of meters from the coast since the preshy-ence of meteoric groundwater in the very ncar-coastal wne would be considered normal The observations are divided jnlO two groups ohsenalion- of -ubmarine groundwater disshycharge and ohservations of groundwater in wells and boreholes
82 Submarine groundwater discharge
Meteoric groundwater lllay discharge directly 10 the sea via submarine sprinpounds and as diffuse seepage through aquitards This form of discharge of meteoric groundwaters a suhshystantial part of the world hydrological balance Zektser and Loaiciga ( 1993) estimate that Iota I groundwater discharge is ahout 6 lJr of the river discharge to the oceans while the disshysolved solid dislharge by ~roundwater is even 52 9(- of the discharge hy rivers
82 J 511)1II0-ill JprillSJ
Submarine springs are well known all over the world Their occurrence and functioshyning is described by several authors (Kohou 1966 Slringlield and LeGrand 1969 1971 Zektzer et al 1973 Custodio 1987) The coasts of the Mediterranean Black Sea Persian Gulf Florida Yucatan (Mexico) and the Caribbean are well known for this phenomenon Suhmarine springs are also reported from Hawaii Samoa Auslralia Japan Nonvay and Chile Strabo and Plinius the elder writers from the classical world already described this phenomenon (KohoUl 1966) The lalter repons how groundwater from such a spring near Anmiddotad an island 4 km off the Syrian coast was diverted by a lead bowl placed on the sea floor over the spring the pressure buill up under the funnel forced the water through a long leather hose to the sea surface (Figure 81) Spectacular is also the account by Williams (1946) of submarine springs around Bahrein in the Arabian Gulf Until recently these springs were used by local water vendors who dived down to the springs and filled deflated
91
I
r
i
Romln captation of a submarine Water recovery of a submarine spring near Arvad (Syria) spring near Bahrein
I
I
I ~-
I raquo goatskin bags Iille 7 by aneslan pressure
I
Filurc It Caplalioll 01 suhll1aril1l sprillgs al Syria ltlnd Bahreill
g(lah~ill bag~ (Figure XI j Springs can be oh~erved cither hy the cyc m the sea surface as hllil dilfcrcnl eoluring bull1 thc walcr or ~Iie~ and Ilo)(h ~ca surface~ or by measuring salinshyil~ Ckllricll (l1dultiviy and tempefatun or SeWltllCC Dicharges can be quile high based Oil all mamiddothalalHx Glkulatiom KohoUl (19661 Cs[ill1~llcd lt1 discharge ofl2 mmiddotlls for a pringl kill ()n~lnrc from Crc ecnt Belch Florida
CircUlllstantial Ividcnct ror lhe prescncc or pling- is provided by geomorphological fcaturc- at the SI1 hOllom like brstic cavilie- (blue hole~) slumps resuhing from groundwashytcr -apping in Sleep Uhlllilrinc cHlyon ltlnd pockmarks (circular depressions on the seafshylOUr) (1ohrhon IlJ3LJa 1934b Hirringlon 198 Robb 1990) Indicative arc also deposils of 1](111- lIld manganc-e-oxidc prellpiwId on the -ea noor from reduced groundwater entering Ihl oxic Oleall (Manheim 1967)
G(lIerally the spring~ arc rdatLd to discharge poinl~ of ~arslified aquifers of carbonJle rnd or baslll- liJe the MeditLmmcan coast~ (Zeksler el 11 1973) Springs rna) also be
rLlalcd to Iratigmphic structural or erosive illdow~ in aquicludes where meteoric water emerge from undlrlying confined aquifers (Kohout 19661 Most reported spring- occur Oil Her dcpth~ less lhal1 lO m (Custodio ISIS I and within S km from the coaslline Custodio (19g71 reason~ [hll the submarine springs in carbonate terrain hae been formed by karSlic dJ~oltllion during lo sea Icmiddotmiddotd~ Milnheim and Horn (1968) repon the ei~tence of springs II Illllch larger depth- on Ihe conlillelHal slopes though their discharge lllay not be meleoric groundmiddotatel
middot~1 DiftiHI sflbIllOrll( diqllIrgl
Submarine discharge by diffuse seepage is more difficult to ascertain than by springs though according O Zekster et al (1973) it accounts for the major pan of groundwater disshycharge to the sea Submarine seepage may be observed and quantified by means of salinity and hydraulic head panerns beneath the sea floor (Kohoul 1964) seepage meters (Lee 1977 Simmons el aL 1991) or analyses of chemical and isotopic tracers in seawater like
salinity (Guglielmi ilnd Prieur 1997) radon (Cable ela 1996a 1996b) radium (Moore 1996 Cable el al 1997) methane (Cable et al I996a) and barium (Shaw el ul 1998) BelHhie bioindicators lile dialomes may also reveal seepage zones (Pie~arck-Jalkoska
1996) Sometimes very high ~eepage rates are found with these mcthods ( 10 70 mmJday The widlll~ of thc area over which (hese -ee[lage rates have been ealeuillted ary from 2 to 20 km which Implies thaI the aquifers rnUs1 tran~mit large quamilielgt of groundwater ranging rrom 20 to IlOO m day per meter width of the lOJstline These nows would require aquishyfers wilh extremely high transmissivities and also very large recharge areas It is questiona hk whether Ibese methods actually quantify the -eepagc of melcorie groundwUler from the underlying aquifcrs lracer- nwy not he representative for meteoric groundwatcr or therc is ~eepage or -eltlWiter eirculming lhrough the upper ~eanoor ~edimenb
Promising i- Ihe study of groundwatcr seepage bastd on concentration proli1e- of conshy-ervative tracers in [lore watcr- of sealloor sediments_ II seepage rate- are low the concenshylration renew the competition of advelLivc and diffusive solute transport Post el al (20001 used chloride eonccnlrations ISO and 7Cl isotope ratios for a site 50 km of( the Dutch mast They concluded that there was no upward seepage but only downward sail diffusion Piekarek-JJnkowska (1996) dctermined chloride concentration IHO and ~H isotope analyses ill [lorc wmer from sediments in the Puck Bay near Gdansk Poland Groundwater scepage was noL qU~ll1tificd with these dma but seepage rates of 04 mmday are reponed based on regional groundwaler now calculillions
~13 Meteoric groundwater in offshore boreholes
Well log data (rom oil exploration and production wells could provide a wealth or illformmioll on offshore groundwater However dala are often classified and in most cases the first fcw hundreds of meter) are not logged Nevertheless some interesting publication- are reviewed below indicating the presence of offshore meteoric groundwater The locations arc shown on Ihe world map in Figures 82a Lo 82c
831 NUIlliCkel ifatul (USA) ~ Atlallic Demit
Kohout et al (1977) describe a borehole al Nantue~el Island 70 km ofr the Atlantic coasl al Cap Cod (USA) traversing a 457 m succession of Quaternary Olnd Tenia) clastic sedimems on basement rock Fresh groundwater laquo 1000 mgll TOS) was found until a depth of 158 m below sea level followed by a zone with alternating layers of brackish and saline waler lIntil 350 m The basal sands layers below 350 m contained water of a relatively low salinity laquo 1000 mgI TDS) As the piezometric head in the upper fresh water is 36 III abow l11sl it is concluded that this groundwater j- a lens of recently fonned fresh WOller fioshyJling on saline waler In the basal sands however a groundwater head of +7 m with respccl to sea level exists while the head has a landward gradient as inferred from measurements in a well on a nearby island Kohout et al (1977) assume thal groundwater in the basal sands was fonned during the last glacial and is now being forced landward by the encroaching wedge of seawater on the continental shelf They funher state that the landward drive may be panicularly strong because the aquifer il in direcl hydraulic eontacl with the sea through outcrops on the shelf slope (Rona (969)
02 03
bullbull bull bull
6IJOW
AIJ8nl~8n
NewJersey
Far offshore meteoric groundwater in wells
o Sea depthgt 200 m
IilIJ 100 lt Sea deplh lt 200 mj (conlinenlat shelT)
0lt Sea depth lt 100 m
0lt land elevation 20 m (- coaslat plains)
Figure 818 Coastel plains and cominenlal shelves or Nonh 3m South America
15011 Rgt _
~R ~_bull bull _-rlt Port HarrotJrt
Colombo
L_ t
r) J -shy
Far offshore meteoric groundwaler In wells
Sea depthgt 200 m
Illll 100 lt Sea depth lt 200 mj 1 h I
o (contlnenla s e
0lt Sea depth lt 100 m
0lt land elevation 20 m (- coastal plains)
Figure 82b Coalel plains and conl~renlal shelves of Europe Middle Easl and Africa
95
i
94
D
Far oNshore meleolic groundwater in wells
o Sea deplh gt 200 m
JIII 100 lt Sea depth ltc 200 ml
(continental shelf) 0lt Sea depth lt 100 m bull
bull 0 Land elevaUon 20 m (- coastal plains)
Figure 82e Coastc[ plaillS and comincnlal shelves of sia and Australia
832 Nell Jer( (md Maryand (USA) - Arlt11l1ic OClal
In 1976 a serje~ of boreholes were drilled for the (AMCOR) Atlantic Margin Coring Program (HathawilY e al 197 fj) In this scientific program also pore water squeezed from edirncill samples wm studied A mlfiseCI of) horcho1e~ perpendicular 0 the Atlantic COl1 01 New Jersey tUSA) show~d Ihat groundwller wilh ltaliniLies less thm 5000 mgll TDS eXlench 100 km offshore (Figure 83) This meleorit groundwater is found belween 100 and ~OO m he 10 ms in the Miocene (Kirkwood Formation) md in Pliocene rormation~ hee Figure lL3J In mother AMCOR well fUflher south some 20 km offshorc of Maryland evel fresh pOlable groundwater was encountered Along the eastern and hoHom fringes of the meteOriC wller vcry wide lmnsilion zones are found while lhere is a sharp transition 1 Lhe top
The New Jerey transett WIS the hasis for the paleohydrologicalll1odcling slUdy by Meisler et a (1984j The model showed lhat the offshore interface igt now very slowly moving Inndward They concluded lhat the high frequency of the Qualernnry sea-level oscilshyIntions caused only small movements of the interface and thm its position largely reneets the average sea level during the Quaternary Meisler et al (1984) concluded lhat the wide transishylion zone around the interface is tbe result of lhe Inrger periodicity of sea-level movemenl~
during the Miocene and Pliocene A reneellon of the to and fro movement is the hydrocheshymistry of the offshore groundwater The more dihne meleoric groundwater shows a sodium surplus with respect 10 mixing of meteoric and marine walers while more brackish and sali~
ne willers show a calcium surplus Assuming that Ihis pattern is caused by cation exchange it suggests that closer to the coaltt freshening dominates while in the transilion zone satinishyzllion is tltlking place Before groundwaer development started in the last ccnlury groundmiddot water heads were artesian (Kohout et a 1988J whieh indicates that close to the shore the meLcoriL groundwater body may belong to ltI lopograplly-driven now domain
833 Georgia (USA) - Affal1lic Oceal
A transect of JOIDES wells and two cxplormion well- offshore southeast Georgia (Figure 83) revealed n body of meteoric groundwmer (C concenlrmion lt 2000 mgll) in the Eocene Ocala limestones extending 120 km offshore nnd almo-t reaching to the shelf ltlope (Manheim 1967) Analyses were carried ouL on pore Waters squeezed from sediment sampshyles Later a drill -tem tesl on an oil exploration well S5 km offshore and nearby lhe JOIDES Iransect produced groundwater with a concentration less than 700 mgl (Kohoul 1966) Also the resistiVity log of an oil exploration well at the shelf edge showed the presence of braekish water in the upper 900 m (Manheim and Pnull 1981) The top of the meleoric water hody slopes from -50 m (with respecllo sea-level) to middot200 m at 120 km offshore The bnse of the meteoric groundwater body ranges from 1000 III al the cos to at least 600 m at the JOIDES well at 120 km offshore During drilling a hydraulic hend of 9 m above msl was measured in the JOIDES well at 40 km offshore (Manheim 1967) Stringfield (1966) reports onshore artesian heads in the prepumping period of + 18 m with respect lO sea level He ealculmed malmis head would be sufficient to force meleoric groundwmer through me highly penneable Ocala aquifer 10 a submarine outlel m some 100 km offshore Kohout el aJ (1988) and Manheim (1967) assume therefore mal until recently me offshore meteoric groundwater body was part of an active flow system wilh onshore recharge and submarine discharge on the shelf slope
97 96
Eas
WeSl 20 ~ ~so bull
New Jersey bull ~ 0
E
l ] i blY
0
~~ (ilh~rHflJilyell 1979)
West GeorgiaIUSA)
oSouth
IS-r
V )
- ~o~
Nonh
Jakarta - Java Pa 0_5bull
~
r
bull~
- V 7
(Aher Al8I1ftHns e181 1996)
Figure 83 Seclions of offshore meteoric groundwater m New Jersey (USA) Georgia (USA) and Java (Indonesia)
83-1 Georgia (USA) - Allallic OnlIlI
MaHhuis et al (1996) report the presence of meteoric water in well- in the coastal plain near Jakarta and tVo coral-reef island~ Palau Kapal ami Palau Damar at 5 and 15 km onshore (Figure 83) Groundwaler with chloride coments Iegtgt lhan 1000 mgll i~ found betmiddot ween depthgt of 50 lO 300 m Hydraulic head~ in the island well- are close to sel level Therefore deep fresh groundater in the island wells CllnllOl be part 01 a recently fomled len~ recharged on the island il~e1r It must have been formed by another now system In the Jakal1J coastal plain the hydraulic heads of deep meteoric groundator ll1ea~ured befon large-scale groundwater pumping SlaTted rmge from 5 1010 m abovc ms I-Ie data of thi~
groundwaler indicate Pleistocene ages exceeding 30 ka BP (Geyh and Sbfner 1989) This suggesls lhat Ihe ofrshore meteoric groundwater i~ formed by an old iOpogruphy-drivcn now yslem rccharged in thc hills south of the coa~lal plain Thi- now system remained aClive during the Holocene though gradienls mUSI Ia-= been reduced after the rise of the sea level (Geyh and SOfner ]1)89)
835 Porr HarcOllrl (Ni~lria) - AtlaJlic Oceal
The resistivity log~ of 12 oil wells IS 10 40 km offshore POri Harcourt in Nigeria indishycltlIe the presence of groundwater with concentrations or le~s thm 1000 mgl chloride b~tshy
ween depth- of 12010450 m below sea-level (Shell unpuhlished dala)
836 lJllIfidel (Nelhuands) - North Sea
A shallow well drilled in the Norlh Seu 60 km offshore from lJmuiden Oil the Dutch coasl revealed the presence of brackish groundwater (POSI el al 20(0) The well IS drilshyled only 55 m into a clay layer (Brown Bank Formatioll) exposed at the sean(lor Poremiddotwaler samples squeezed from sediment samples showed lhat chloride concemTation decrcased from 20000 mgtl at the sea noor to 9000 mgJl a 55 m depth POSl el al (2000) showcd thaI Ihe vertical decrease or chloride eoncenlmllons could be explained by salt diffusion from Ihe sea into fresh groundwater starting 8500 years BP when tbc sea submerged the ~oulhern
North Sea
CU7 Slumglwi (Chila) - Chinese Seo
Meteoric groundwater was found in a well bel ween deplhs of 150 to 320 m on one of the Holocene Shengsi islands 50 km offshore in the Chinese Sca ncar Shunghai (Wang 1991) Groundwmer deeper Ihan 229 m appeared even to be potable II i- unlikely thaI this groundwater has been rormed during recem times Moreover groundwaler onshore al the same depths is or LGM age (Hua Aibing 1998)
84 Discussion and conclusions
The observations show that meLeoric groundwater observed in wells 10 [0 100 km offshore is not restricted to Suriname but occurs all over the world AccounLlt of submarine disehar~~ are even more numerous though generally the discharge is located closer to the
99 98
horc either ltJ~ pring- or a diffuse ~ecpage De~pite the sC~n1Y and ill-documenled obsershymiddotaliOIh Iconclude Ihal lhe onhore mCleoric groundwater cJn no longer he con~idered a~ In excepllOnltl1 phenomenon
~10 Ohsefali~ns do nO Ilmke clear whelher Ihl meteoric groundwaler belong~ 10 ltIn Idic lopogmphy-dnven nO ~ys[em with onshore reeharge or to jlLlleogroundwater forshymed b~ exti~ct now system The Nev Jersey coast i~ the only case in which the dislal offsshyh(lre meteonc groundw~ler can he d~ignlled a~ paleogroundwaler (Meisler et al 1984 l SUblllltlrine di~chargc will genenilly he il sign of an ltlctive now syslem but it rnav also be di~dlarge of a very large pi1eogrouldwltlter hody IhLl( i~ s[ovly squeezed oUI hv dcnsitvshydriven f)rce~ after the Holocene lran gre~sion Age is not Jlways a diagnostic ~larker ilher ~Ince lI~ old groundwaler may slill belong to an active lopography-driven lhm svstem with I vcr) long residence time The same applie~ 10 salinity in COltlstal and ofrsh~re disshydwrge area~ very wide di~perie Imnslion zone exisl (Sousa and Vogt~ 19i57) where bmcshykish groundwatcr igt slill parl of Ihe adivc now domain The next chapters will address thi tLlesion in more dctail
Thb slud) and that of Meikr el al t 19~4) show that a nat and shallow eontinental ~hell a~d a thick cominuou fortl1ltltion of [ow permeahi[ity below the sea noor together l1h chmille and secondary topography are the most important conditions for thc formation of llffshore paleogroundwater A worldwide inventory of these conditions would be useful 10
predicI tl~e pn~cnt~ of offshore pill~ogroundwat~r which may become an exploiwbe rCUllnC In fuwre The world map in Figuregt 82tlto 82 shows extensive continem~l shelshymiddot~and man) inland ~ea~ wilh depths less than 100 m These orfshore areas were exposed
~dUllllg tile lGM and tavored paleogroundwater [ormation
L
Chapter 9
Prediction of the offshore continuation of coastal groundwater flow systems
91 Introduction
There are nlltln) obgtervaliom of ofrshore metc()ric groundwater a~ discl1ssed in Chapler is Hoccr in many ca the (lhscfltltion cannOI conclusively indicale whether lhigt groundwater i () paleogrouJldwalcr formcd hy )1111( now ~yslcm~ or (ii) glOundwashytel in a l1lodan llow syStl1ll wilh onshorc recharge Thigt can only be eSlablishcd with a dcnse oflhorc ohervation nelwork 01 bead or pre~~ure- which b quile costly Kohoul (1(64) carried out such a delailed sllrvey of offshore groundwater close to the shoreline in Bigtcilyne Bay Florida In lhigt chapter Ihe question about Ihe origin of offshore meteoric groundwater is addressed indirecI[y given the presenl condilions how far could fresh and meteoric groundwater penetrate inlo lhe olTshorcl Reilly and Goodman (19iS5) Cuslodio (1l)~7) ltlnd Kooi and Groen (20011 rcviewed Ll numshyher of modelgt and concepls defining the submarine exten~ion of fresh groundwater
Through time the complexity of Ihe models increased Figure 91 schematically illustrale~ a nllmber of da~-ical sludies that employed miougt levels of approximltlliol1 in model calculltltions and variou- suhsurr~lee conditions First analytical solUlions wcre foulld rur sharp-inlcrface models in phrcatic aquifers (Badon Ghijhen 1888 Glo er 1(59) md cmi-confined aquifers (Edclnwl1 1972 Mualem and Bear 1974) Later numerical codes were dcvcloped for sharp-interface models to Illow incorporation of spatial geological beterogencity ~lnd non-slationary modelling (E~~aid 1986 1990 Meisler et al 1984) DilTusion and dispersion rroce-~es along the freshsaline interface were studied analytically hy Henry (19M) and lalcr illcorpOfltLled in numerical codes (Huyacorn et al [987 Voss ami Sousa 1987 Dude Essink [91 However none of Ihc above models accounted for the pOlenlial imanbi1ity or ~Jl inverse sa[inily and density stratification in the top of the offshore meteoric grollndwJler hody Such instability leads 10 the development of convective densily CUITenls (when a cri[ical Raleigh [Ulllber is exceeded) Kooi and Groen (200[) de ised an ltlpproximate morJel lAM) thaI determines the distance from the shore to the place wherc the inverse stratification in an aquifer becomes unstable and where salinization by eonvective mixing takes place Thi~ chaptcr which is largely hased on this aniclc discusses the result~
of a modified version of AM the Ne Approximme Model (NAM1
92 The Ne Approximale Model
The approximate analytical model (NAM) presented here combines two competing processes of solme transpon in the offshore zone (Figure 92) The first process is the advecshytion of salt by groundwater noV through the aquifer ill combination with Lhe upward seepashyge through an aquitard to the sea noor The adveetion is based on the model of Edelmln
100
-- ----- -c
(197~) r~r r~e-h ~roundwalcr now in an orfshore semi-confined aquifer with a sharp treh-allllc Interlace The second proce-- is the downward diffusion from the sea awards the underlying rrcsh groundwater through the aquitard which is de-cribed bv a one-dimenshy~i(Jnal dillu-ion-advection model
Badon Ghijben sail (1888)
b
Glover (1959)
~ semimiddotpermeable layer
+-- Edelman (1972)
_i~~~s~-~--~-b ---------------Mualem amp Bear (1974)
e ~age~~ +-shy
Henry (1964) groundwater WIth vanable +shysalinity and denSity __~-_-- _
figure 91 Conceplual models of coastal groundwaler flow syslems with fresh and saline groundwater ac~ordlng to same classical studies (from Kooi and Groen 2001)
coastlin~
x=o L
s~a l~ve
+-shy
1 1--- -----------~---------IT---------- W
iH
~ H
figure 92 Schematic ~ection showing groumlwUlcr Ilow aClurding to the orrshor~
~harp-inlcrrale model (SIMl and uownwtlrd ~a1t lrmsfl0rl by diffusion und lonvcClion
The NAM defines lhe distance from the coast where the upward seepage become so smalllhm downward diffusie IranspOri reaches into lhe aquifer and creales inslability and convective densily currcms II is assumed lhat lhis distance is a good measure for the offshoshyre limil of the fresh groundwuter tongue
Slwrp-imelface lIIudei The geomelry of Ihe Sharp-Interface Model (SIM) based on the model of Edelman
(1972) for offshore fresh groundwater now i shown in Figure 93 The salt water is assumiddot
Fresh groundwater tongue (approximate model)
bull Fresh groundwater tongue (sharp-intertace model)
---- shyUpward flow according to modified Downward diffusion t Edelman solution
I Density currents where critical Steady-state salinity profile cY Rayleigh number is exceeded according to diffusionshy (only in aquifer)advection equation rE
Figure 93 Schematic diagram of the sharp-interface model used to calculalc the length L of a sleadyshystate offshore freshmiddotwaler longue (from Kooi and Groen 2001)
103 102
med to be ~tlIit except for the waler within the confining layer because upward seepage Ihrough thl~ layer into (he Oerlying ~ea ~hould be allowed The Dupuit assumption are applied ie within the aquifer fresh-water head~ are assumed 10 be uniform with depth and wilhin the confining layer aboe the fresh-watcr tonguc salt-water helds are as-umed unishyform in th~ horizontal In cantriL l to Edelman (1971l the aqullard abol the fresh-waLer len i- a-sunled fully saline to avoid having a finite fresh-wmer seepage raIl at x = U (the ~cawlrd-most edge of the tongue where its thicknei- hecomes nil) Independent uriable of
the syslem are lhe rre-h-walcr discharge at lht Loas Qw the horizontal hydraulic conducshytiviL~ and thicknc-- of the aquifer k and H the venical hydraulic conductivity and thkk Iles- 01 the Lonrining (day) layer k and H and the local depth of the sea IV ConduLLivili~- and thidne~se- an not lumped illlO re-istilllces 1Ild Lranslllissivitie becausc ill Lhis as well IS in the following -cction somc or the dcpcndelll ariables an funttions of the scpmate parameters The unkowm which arc to he solved lrc measures or the offshoshy
fl fnh-wltHcr ICllgth L and Ihl fresh-watcr piclOmetric head al the shoreline H The analylilti1 soluLion for SIM described in nore detail in Kooi and Grocn CWO I l is scr~lratcly
dlfled tor the plf( Where fresh groundwater completely fills the aquifer and for the part ~hcle th~ lbicknes or thL frc~h water i~ smaller than thc ilquifer thickness (Figure 9Jl
lJ(llilsilm-lIdlC(Ti(lII((ll
The downwlf(J dirru-lon or salt through the aquilard with a countcracting upwilrd scshypage can he wrillcll by the ildvectilln-dispersion lquation as
d~w dw tJ-- -q _=()
(9 I) dgt d
where fI i~ the vertical Dlrey veloclt) w is the salt mas- fraction and D i~ the vcnical LOInponcnt of thc ditluslon tenor (inclUding effects or porosity and (()n~osity) Eq 91 implicitly assumcs thll D is constant The Boussinesq approXimation has heen ilpplied which assumes that ~pillial density variations can be neglect cd ill the mass balance These lssurnplions arc reasonltlhle for the level of accuracy required in the present ltll1alysis lorcOmiddoter the difference in density hetween seilWater ilnd fresh water is about 259( onlv
II effecls of hnrizoJHal advection witbin thc aquifer at the hase of the confining layer arc ignored the oluLion to Eq 9 I i- givcn by
(92)
where (I) is the salt mas~ tnlction or sea water and 0 i~ the characteristic thickness of the qationary exponcntial houndary layer Ihm forms a transition zone between sea water and (reh water In(92) is taken posilive downward from thc seatloor The upward seepage rate can he estimated from SIM by
r k q = ---=-~1J bull r H (93)
where r and yare the specific weights of seawater and fresh water respectively and 11_ is the salt-water head at the base of the aquila rd
Convective break-up and fmgering of this boundary layer will take place when Lhe boundary-layer Rayleigh number Ra~ wbich is defined as
)04
6pko (9A)Ra =-nP
cxceeds the critical due of about IU (Wooding eL al 1997a) In practice houndary layers in clayey sediments (aquitards) will be -tablc because of their low penneab~litics The pershymeabilities of ~ands and sills are several order~ of magnitudc higher Therelore Rj 01 the boundlry layer in sandy and silty aquifers lend~ 10 be above thc critical value evcn for small densitmiddot contrast~ and limited thickneseo The onsel of illsLability is defined III occur here ltH the l~cation where the critiLal Raleigh number or Ihe boundary layer within lhl aqUifer is exceedcd This criterion is physically more realistic than the crilerion in lite AM model of Kooi and Groen COOl where onset of instability was as~umed when thc thIckmiddot nLS or Ihe houlldary layer a~ a whole exceeded Ihe Ihickness of lhe clay
93 ResulLlt
In the ljr~q series of calculali()n~ (Figure 94) the length of the fresh groundwater wedne was calculated with threc different models SIM AM and NAM The lengths were calc~lated for varying alues of aquiwrd thickness H (I 10 100 nt x-axis) aquitard hydraushylic conductivity k (IOmiddotImh IltP Ill~ and HP ms) and coastal hcads h1 (+2 and +IU m abovc Illsi in left and right paneI- respcctively) The lOngue Icngths L predicted by SIM arl largcr than thc lengths of Ihe aPrroximalc models L for Ihe lower hydraulic conductivities k 10middot) ms and k = 10x ms This is lhe result of lhe predicted elTeLI or instability when Ihe diffusive houndary layer reaches the aquifcr This is particularly truc for the lowest aquishylard permeahility (k = 10-lt) I11S) maximum tongue lengths of 5 km and more than 100 km
are predicled hy NAM and SIM respeclively for 111 +10 m ab~ve msl for 111 ~ +2 m abovc msl the tonue ICnlhs are 0 III and more Ihm 30 km respecl1vely For the relallvely high hydraulic eo~ductivity k = 107 ms the difference in lOngue lengths i~ not veT) large hetween all models Comparison of the lWO approximale models AM and NAM shows thaI NAM (Figure 9Ac) leads to smaller tongue lengths than AM (Figure 9Ah) Again the discreshyraney is largest for the low hydraulic conductivity
For high hydraulic heads at thc coastline (111 = + I() m above msl) the longue length inercltlses with the tbickncss of the aquitard (Figure 94a 10 94c right panels) However for low hydraulic hcads (lin = +2 III ahove msl) the length initially increases hUl decrea~es at thickncss or over 40 m (Figure 9+a 10 94c left panels) This effect is primarily due to the flt that the increasing hydraUlic resis-tance of the clay (Hike) cvemually reduces the tOlal outnow under this low hvdraulic driving force The maximum lengtbs for AM and NAM (Figures 94b en 94e left panels) arc found at smaller He than lhal for SIM (Figure 94a left pltlnel) This is duc to the earlier onset of instability
In the next series of ealeulalions the influenee of aquifer parameters was tested Fjure 95a shows the results of NAM calculations with an aquifer transmissivity Hk of 45 x 10- m~s (- 400 m~day) and a coastaJ head ((oos) of +2 m above msL In the lefl panel
aquifer thickness H and hydraulic eonduetivity k ~re 10 m and 45 x I~-I~s ~speel1velt
and in the nDhl panel 30 m and 15 x 10-1 mlsIn Figure 95b the transmlsslvuy IS 15 x 10middotmiddot ms (- 1300 mday) where in the left panel aquifer thickness and hydraulic conductivity are 100 m and 15 10-1 mis respeclively and in the right panel 0 and 15 x 10- mls The
transmissivity in Figure 95b is 3 times as high as that of Figure 95a bUI the lengths of the
105
bull bull
bull bullbull
20 o
[ 80
bullbull 20 40 60 60 100 20 40 60 60 100
He(m) Hc(m)
(b) AM model (Groen amp Kooi 2001) 10
hcoast = +2 m 100 hcoasl - +10 m 6 bullbullbull aD
o
E 6 bull ~ 60
-jOOo bull o 0~
00J 40 po bull1 4 bull 2 20 (_ bullbull
666
0 o 66
0 20 40 60 80 100 o 20 40 60 60 100
0
He(m) Hc(m)
hcoasl = +2 m 4 40
3 rfIImiddot bullbull
E 30 [ 6 6 66 bullshy bull
~ 201 2 ~ bullbull ~
bullbull bull bull bull
bull
10 8 t
0 0
0
40 60 60 100 0 20 4U 60 60 100
He(m) He(m)
010-9 10-6 6 10-7 I
Ii~urc I)bullbull-I S I 1l1ll10iruiC CXhIlSioll llr flI~tllI11C modd (SIfll tb rl~h broulldwlller uconlill I dlllg to K bull ) lpplowllalc mlldd (AM) e (1 thr thlkrCl1L modI001 ltl11l (ImCI1 (IK)I) I wllh dowl1nrd d c s tal slmrr-I IHe kness () ol 100m- d t l on11 md Clll011LIOrshy I) h n W bullbull arrrmlll111e mod I (NAil tlvcllying day laycr (f ) I ~n a ly~lrlIIltc cllndulivily (J) of ~ - I Ie sClliHonlined lL-Iuiicr 1 tk nlh 101 Th I k) 11 111 I I w I 100 for I I d n of h +2 +10 h t I h elm 10 nl 10 I I) I d) of h
bull Illgt ( C t and righl pallds) SCl j~ph 0IuI)~ Ill10 ms Coa-tal helds (IJ)
3 2 s (a) aquifer transmissivity 45 x 10- m
7 H = 10 m
7 6 k = 45 10-4 mis H ~JO m k = 15 10-4 mis6 5
5 E 4
~ ~ 3 -IA A 6-
2 bull oo o--ltgt_~--ltgt----l 8040 6020o
80 DO40 60 Hc(m)20o Hc(m)
3 2 (b) aquifer transmissivity = 15 x 10- m s
7 --------- shy
7 6 H 100 m 6 k = 15 10-4 mis
I45
5 6
E 4 1 J~ - H= 10m ~ 3 ( l6 A 6- bull k=15 10bull3
2 fI bull bull o - bull 40 6020
60 60 Hc(m) o0 100
4020 Helm)
7
0
-----------_deg----deg-9--10-8k A 10- ][ (mls)c
figure 95 Submarine cIngtioll of fresh grounuWaler for different values of the aqu
ami uau-lllis-ivity and a coa-lal head (ln~I) of +2 III above ins Cakulaion- have beelllarred oul with lhe new approimale model (NAM) (a) in tt panelgt r _cond a4I wlI a la) (HkJ of 45 x 0) ms (- 40 in Ihe kh paud aquik Ihidnes~ (H) lnd hydrulic conducliviy (k) are 10 m and 4 rin Ihe righl panel 30 alld 5) 10-- ms respectivdY (b) in Ihe lower panelS the trar J(J 1ll~(s (_ 300 1ll~ldyl wherc lllllle left pand aquifcr thickness an and hydraul v~rc 0011 and 15 llmiddot~ ms and lllille righl panel 10 lnd 15) 10) mJS respectiDr he overlying dl) llyer H) hls been varied belween I lnd 100 m For (he hydn1
or Ihe day (1) Ihree dilTercnl vlue hae heen ~hosen IO ms 10middot1t Ills and 0
(V) i~ 0 m
bull bull bull bull bull bull bull bull bull bull
bull bull
bull bull bull bull
28
24
I1620
J12
bull bull bull ~
8 8 bull bull bull
bull bull bull 4 6~ ~ 4bull 0 0deg0 00 0
0 20 40 60 80 100 0 20 40 60 80 He (m) rlc(m)
(b) aquifer transmissivity =15 x 10-3 m21s
28 28bull24 24bull bullbullbull20 20bull H= 100m bullbull16E bull bull k 15 x 104 mrs E 16
lt0shy ~ 12 ~ 12 bull
bull bull bull
~ ~ bullbull8 8 bull bull bull bull
lt0shy
H =10 m fJ6 00
bull
4 4 k = 15 x 103 mls0 0
00
0 00
0 20 40 60 80 100 0 20 40 60 80 He(m) Hc(m)
(a) aquifer transmissivity =45 x 10-3 m2s
28 H 1U mH = 30 m
24 k = 45 x 10-4 mfsk 15 x 10-4 mrs
20
E 16 lt0shybull bull~ 12 bull
100
100
k (mls) o 10-9 10-8 6 107 [
Figure 96 Submarine cXlension of frc~h groundwllicr for different vlluc- (If Ihe aquifer Ihicl1C~
and transmissivity and a oustal hcud (h) of In In ltmvc msl Calculations have been carried (lut with the new approximate mode (NAM) (a) in the upper (wo panels for OJ semi-confined aquifer with a transmissivity (Hk) of 45 x 10- m~h (- 400 l11~day) where in the left panel aquirer thickneJs (If) and hydraulic LOndlictivhy (k) are 10 OJ ltlnd 45 x l()-J ml~ lInl in the right panel 30 and 15 lt 10 ms respectively (b) in the lower panels the transmissivity i~ 15 lt 003 mlls (- 1300 m~day) vhere in the left panel aquifer thickne~~ (H) and hydraulic conductivity (k)
are 100 m and 15lt 10-1 ms and in the right panel 10 and 15 lt 10middot~ ms re~pectively The thickl1ess of lhe overlying clay layer (Hr ) has been varied between I and 100 Ill Fnr the hydraulic conductivity of the clay (k ) three dirrerenl values have been chosen 10middotlt) ms 10-~ ms and 10) mhbull Sea depth r(W) is a m
)8
hecasl =2 m above sea level 7 7
sea depth =0 n set depth 10 m6 6 5 5
4 4E Elt0shy lt0shy~ 3 ~ 3 ~ bullbull bull ~ bullbull 61lll 6 62 2bull bullbull bull
bull0 0 0 20 40 60 80 100 0 20 40 60 80 100
He (m) Hc(m)
hC08St = 10m above sea level 28 28
sea depth = 0 m sea depth - 10 m 24 bull bull 24 bull
20 bullbull 20 bull E 16
bullbull bullE 16 bulllt0shy lt0shy
~ 12 bull ~ 12
bull bull~ bull
8 ~ bullbull 8 ~ lIo0 0 0~
bull
bull
bull bull
bull
116 0 04 00 4 0 0
0 0
00
0 20 40 60 80 100 0 20 40 60 80 100 Hc(m) Hc(m)
k (ms) o 10-9 10-8 6 10-7
Fi~un 97 Slbnwrl1e CICIljllll 11 fresh wul1dwlIlr Im diffcrcnt sca dcplhs clkulatcd with the ncw appnnimac l1lodcl (NA~ll (I) ill tile uppcr panels 1i1r a llilslal head () If +2 III a(1l IIIsl and(b) illthc h1middot panel rllr a olsml head (II) of 10 III all1-e Illsl Ille sClllilmliIlCd aquifer hIS
athlckncss (J 01 100 m ami hydraulic CI1llhlltivity (I) of 15 x 1114ms sea ltkpth (11) inlhl kfl and ngh p1I1c1s IS () and I() 1JI respectivcly The thkness of tile lwcrlying day laycr (If ) has becl1 varied betwcen I md 100111 Ff the hydraulic conductivity llf the clay (k J lhrec differellt values hHe hecn chosen 1()middotI11~ IO-~ Ills and III ~ Ills
10
fresh wll~r longll~s an onl~ 5 10 50 cc bigh~r Vmiuinn or ~Iqllir~r (hidlll~s fI unci aquifer hydnlLllll ~OIHJlIl(IVIlY k with the same lfallsmissivity (lompare left and rinlll panels) does bull l~n~ I)il~ much lnl1uClllC Only cahullion with the highcM vlue for the hydrnulil conducshytivIty 01 Ihl Hlllllml leads 10 lonsidcrably longer longue lengths NOie thil for Ihe lowest
hydraulic conuueliviy 01 the aqlliwrd here is no submarine cxlcn~ion of fresh gmumlwoncr a- was ohscrvlt1 alrLOIdy ill the disussion of Figure 9-J In rigurc 96 similar n~sllILS are shown for a loastal head (h) or + I0 III above illS Again the effecls of varying aquifer parameters arc less important than that of the aquiLard
111 fi~llrc 97 the rCSull-i ilrc ol1lplr~d for allulllions witl1 ltl sea dcpth of () and 10 n1
(lell and nghl pands lc-ipcctivcly) Varying -iea oeplhs appear to lwve only a minor effect
UI~ tbe (lnglle ~ength This i-i not surprising as it can be reasoncd lhat eXlra seawater luaoing 01 10 III IS cqulvltllclll 10 iI nulIclion or the toilst1hellO witb only 025 Ill
Note thatlhe markers in Figures 9-1 95 96 ano 97 sometimcs do not follow smooth curvcs The rcason is that lhl loastal hLuh ror th~se data arc nOl exactly +2 ur + I0 111 above
111sl in lhe cakulations Qhr is all independent variable ilnd is caldulated by the mOlIe Tlerdorc i Imge IIHhLr of ciknlaions wih var)in Q have heen gtanmiddotmiddot Ut e- 1 u 110111 Wbldl the 1 closcst to +2 and +10 above Illsl have heen chosen
94 Disclission and conclusions
Orfshore extension or fresh groundwuer in a semi-confined oastal aquifer with steashydYmiddotSlUC now is smalh=r than calculaled With il simple SIHUp-lllterfille model (SIM) Tbe sllhmarine discha~ge detTeses in an offshore direction uilliithe diffusive boundary lltlyer in
Ihe overlYing aqultard eVLntually reilches the lltlllircr anti creates imaability and convective (Iensity LU1Tcnls
Thc New Appmxill~ Moud (NAM) presemLd ahoye resuhs in an ~arlier onset of
instability and ShOIlCf fresh water tongues Lhan th~ old Approximate Model of Kooi and Groen (200 I ) uid In gcllclal hmh mt1uds leu to similar cotclusinns
SCllsitivilY tests with NAM which combines upward seepage and downward ditTushy
ion sllow tlwt increasing the hydraulic resi~tance I-Ik or the ilquilard iniliully results in IOllger fresh waleI tongues Howevcr II very high resist lIlCes the Icn~ths decrease in duc to a comhillatioll of lWO effects (i) tntal submarine gmundwlIcr lUI110W dimish~s and (ii) the declining upward slepage (though becoming spreatlout over a larger distance) leads 10 instlhilit) closer to the coasl
The scnsitivity tests Wilh NAM rUriher show lliallhc fresh glOundwalLr tongllcs UO nO( extcnd more Ilwn 6 to 2X kill offshore ror colstal groundwller hlads (Ii) of +2 III and
+0 III ltmve msl Jlspccivcy Leaving oUllhe eXlreme cases tl-l gt 50 h gt +2 III ahove I11sl) nile Illay ilSSUl1le thaI fresh groundwater generally docs nm eXlcnd more than 5 kill
tllfshtltc Brackish groundwiltLr within a topography-dri en now domaill may cXl~nd further
olfsbore In this Irmsitioll ZOlle tile salinity will grildually rise as Ihe SClwartl tlOWlll meleshymic groundwater mixes with downward IfUnsponed saIl Thl OllieI limils uf he triIIlSiion
IO~le ilcconling to SIM vary rrulll-Jo to 1-10 kill ror h1 == +~ 11110 +10 111 respcclively Alter hillIlg oul th~ extrCllle CtLS agaill IIlL outer limit in most Lases will nol c Lecd 50 kill
The Ntt lllmlLl is compared Willi two nr the hcS(-doclIllKnlcd LlL Ihe New Jersey
coast of the USA and Ihe coast of Suriname (Chapter 8) The model input values
New Jersey coast derived from the study by Meisler et al (1984) were He == 50 X IO-b mIs 1] = 350 m k ~ fx O~ rrJs W== SO m anJ Ilmfm ==+6 m ahove msl
responding lengths of the fresh groundwater calculated with SIM (L) and NAM ( ilnd 0 km respectvely For the Suriname coast the inpul values are He ~ 25 m k J mIs H == 250 m k == I X 0-1 mIs W == 50 In and 11(1H +35 m above ~sl The an L of 9 km and a L of 0 km This makes clear that the offshore meteonc groun
these lWO sites has been fanned by different flow syslems and can therefore deno
ogroundwater The situation offshore Ihe coast of Florida where very high hydraulic heads
above msl) prevailed until cxtensive pumping started in the lasl century is differ meteoric groundwaler beyono 100 km offshore may be fed by ac~ive flow sysle
hore recharge It can be inferred frolll the sensitivity analysis ilnd the cornpanson of mode
with observations Ihat occurrences of moderalely brackish meleoric groundwater the offshore ilre nm in equilibrium wilh presenl-day onshore hydrological condit
independent measurements of sub-sea pressure head and gr~undwaterage are n ~her asccnain Iha~ Ihese waters are indeed rdics from changmg condHlons al a g
time scale and to provide data for more detailed modelling (Ch~pler 10) Flow aI1d solutc Iransport in the brackish lransition zone Will also be S[Udle
10 ilh a model that incorporates variable density now ano transport including
ment of conv~ctive oensily currents
Chapter 10
Flow and salt transport in sulJlnaline mcteolic gronndwater in steady-state and trgtlIIsient systems
101 In(rndllclioll
III Ill( prcclding cha[lllr- tlo ltHId solute transport processes IlJt hCL1l Olllllietl hased ~m singk- or Jouhk-dcllsilY density groundwater now Illmlcls (Chaplers -l ami 9) Jlld lhlshymica and isotopic rarmlclcrs (Chapl~r~ 5 6 ltlmI7) HOLt~r 111ll1tlslalillillg lll nnw and sltllllte lranspon in the coastal ltlntl orfhofl zone requires integratioll or [upograplly-dril1l tlo dCll~ily-l1ricl1 lIo diffusion Jispcrsinn ltlIKj free COIvCltlUIl ill ullstahly slruificd grouIHJalcrs Especially the lauer process is scluolll mcOlllllcll for ill grnundwlIcr modeb tm it is very imponalll in elllStl] I1It suhllwrinc groundwater where inverse salinity slratilishy
calions often arise Thcse prOlcs~es arc relevant ill situatiolls where OIl flelth groul1uwltltCI recharged onshore nows into the olTshore r~lrl or all lquirer h) a cnustallandscape hCCOllllS ~lIhmergell uuring a falls1-lessioll The suhmarinc Olltnow situalion (a) forms a steady-Slate cOlHlitioll ~Itld has hCCll invcstigahd with lhc appnxlnmtc model in the prcct2uing chapter The lrall~~ressioll silliatioll (h) Lreales ullstcauy-statc conuitiul1s which hac heen uiscusseu in Chapter 5 111 the rrcscllt chapter the dynamics of these situatiolls arc ~tllllieltl in nUlllerical experill1ents llsing models that cOlllbine all relevant proccsses Mouel I silllull1es the submarine tltllllow gtitUltiOl Mmlels 2 anu 3 rerresel1t transgression situations over a flat continental shelr anu a sbelf witb all erosive topography respectively Mntlel3 is relevant as imestigatiol1s (ChaplCf 4) demonshystrated thaI ullling the lagtt glacial the exposeu sl1elr was suhjecleu to strong fluvial erosion h1 such a landscape salinization (ar[s in valleys which arc intnlued hy the se1 ill all early slage while topography-drmiddotIen sy~lel1ls continue [0 rUllction on the llllcrnlives The COlllellts or this chapter arc partly ha~ed on article published carlier (Kuoi et al 2000 Kooi and Groen 2001)
102 Explrimenlnl setup
fO2f NUIlerical code
The 1ll1lHeric11 experimcnts reportell here were conducted wilh the tillite-elell1clIt vari~
ahle~uensily now and tran~rorl code METROPOL-3 Fort uctailcd ue~criplioll or the code Ibe reader is rcferreu to the ork~ hy Leijllse (1992) Sauter et al (1993) Leijllse 1Ild Oo~trolll (1994) and Oostrom el al (1994) The code slllves twn couplet partial difrlrclltial equations in salt mass rraction (0 and nuiu pressure p The equations are nonlinear because Ibe nuid density p dynalllk vi~cositYIl depend on (0 The eqtHllillilS are coupled lrltlugh q and p Here we use a con~tallt value for p because or the low salt mass fractions L(msidered For nuid lIensily p = p(Jerrmiddotl i u-ed where PIl b the rre~h-waler density alld r 069 The latter vallie gives nuid densities deviatillg less th1I1 0 1 from experimental val lies for salt
11 2
ass fn~ctiolls viLfying from (0 = 0 (frcsh water) to Co = 026 (satunllcd brinc) (Leijnse
J~2~ Flllld Iml pO~c c()[npressibililics are neglected ~orrcspolldillg to uro sp~cific sLorage IllS IS rCls)nah~ given thilL lh~ changcs ill pressure boundary condiions OCCUr ollly vcry olwly
~hc IlLllllcrical schcme lIses thc Galcrkin weighLcd ~sidual tiniLe-elemcllL method fully lpl~Clt backward Inlc stepping Wilh automatiC Lime ~lep cOlllrol based un convcq~encc
1 ulIcmenls ~ conslsLent vclociy forlllulalion is uscd to represent Darcy vdocilie~ (Voss III Souza Iqn) METROPOL-3 has been compared with other codes for a number of
lIchmark prohlcms in the HYDROCOIN projecL (Leijnse and Hasslnisadeh 1981Ja IX9h) and was fnlltlll to givc cmuparable resulLs
122 [)inIliIIIiOl
TilL spatial 1I1d tClllporal sCltllcs that cm he Iwndled by variilble-densily tlow simulators ~ lilllitcd bClluse of strict nquiremems ul grilUmcsh resolution This applies ill parlicular Ihe SIllIuli1Litlll of diffusiun in the boundary layer helow the SCI nODr and density-driven
middotnvccLlon 1I1 unstably sLfiltified J1uids
Inmodel 2 I lid 3 a tiJllc~depell~C1t Dirichlct boundary com1itioll is used for lhe lOp
1II1dlly w~lcre w~uddellly Jumps lrum 0 to (0 alterhe lransgrCs~ion Striclly speaking IS mCtlOd I~ phyilcillly lUlL very rei1istic tiS ovcr time ial is introducetl in the top elcshyllts 01 the ltlllLe-clcmct lllCsh (becausc (I) varies linearly withinlII dement) which IS not
mullcd Ior hy houndary luxes However as long as the vcrticallHcsh siLe tl is small llWSS-hi1mllc enor is lisn Slllall (morLover its causC is known l
In ()n1l~ 10 achieve convcrgencc in lhe caculalions Ihc conditioJl J lt S shoultl be l whcrel5a denotes the thickness of tht saline houndary layer ill tllc lOp of Ihe domain at
Illstant It beL~ol~les 1InsLlhle lId lingers start to dcvelop which OCClIrs when the boundilfy er reaches allll1te thickness This implies Ihatlhe Raylcigh number for a bountlary layer 111lcngth (thlckncss) scale 1 has 0 hc slllilller lhiln the criLical boundary layer Rayleigh IIlhe llr
APt [ 6pr 8 1--- lt Ru = ----- (1 nl )11J) - pD
ILre Jp = p - Po g and arc lbs)Jllte values of gravitllionallctcleration and (iSOlroshy) intrinsic penneability f) is the scalar valuc of an lSSllIllCd isolropic dispersiOI Icnsor
IlClS uf porosity II Hid tortuosity r arc acculInled for ill Ihe way D is delncd in the
delas [) = I[)r wilh [) as the diffusivity in water (mcchanical disperloion i~llorcd) [I
gt ( Ihe boundafy layer hat is creilleL nUllIerically just below lhe seal100r iS~llways tahle (ils Rayleigh nUll1ber is hlrgef than criticall Ilene untlLr these Cir~t1111Slitncs finshying Slarts Iml carly in the model More crucial howcver is Ihat upward scepage of rre-h leI IIlto the ca lend 10 crClle 1 boundry layer or flllite thidn~ss () = Dlq which is re cl1IJpres~eLl if tile upl10w is lotronglr (Wouding el al 1997111 II the upllow is strong
ltlgh tile houndary layer is cOlllpressetl to sueh an extenl tlmt il remain stable at all shyIlS llence under Illese llmditiollS illSlltlicicllt ~pltinl L1istretitatioll -1 gt 0 will creatl 1I11 tahle hOllndary layer and fingering in the modd L111jll~tly Wootling ct al (191)7a)
Ind Nu 10 frulll hutll perlurbiltion analy-es llld numerical anti Hde-Sba cell cxperico
Ills
Similarly 1x has to be choscn such lhalthc criLical wavelength of boundary-layer instabilitics A whch conLrols the dimensions of finger instabilities)5 resolved Bccause
lT
A = 15S_ (Wootling cl aI 1997a) the following is appropriate a
(102)
The validity of lhe above condiLions was corroborated for the long-heater Elder probler (Elder 1968) (sea-Waler conditions along enLire width of the top of the domain) with and wilhout upOow That is numerical experimenls were performetl to tcst (I) gridmesh con gellce and (2) Rll 10 Wilhout upOow progressive refinemenL of Ihe mesh both in the
rr
horizontal anti venical direclion and retluclion of lime stepping indeed resulted in conver solutions where the locaion of individual lingers varied but their characteristic wavelenl and growlh rale became constant Too coarse discretization led to a different timing of in bilily development and linger dimensions that were too large Insuflicient horizontal disc tization was found to have a stabilizing effect causing tinger developmem to be delayed fmger widLhs equal LO lhe element size Convergence was also achieved when upflow w imposed for lhe above problem Stable boundary layers occurred tor boundary layer
Rayleigh numbers of 1 and smaller consistenL with the results of Wooding et at (1991a) Too coarse vertical discrelization here led unjustly to fingering and salinisation The gri(
convergence shows lhat the dynamiCS of lhe numerical ~yslem is governed by physics at
nOI by the particular realizalion of noise (in our case truncation errors in the code) w
seeds boundary-layer instabilily This contrasts with recent findings of Simmons et al (1999) who suggest lhat in applying the SUTRA code to Wooding el as (I991a) salt-I problem it is inappropriale to rey on round-off errors The cause for this difference is
unclear Rccently Kolditz et al (1998) showed grid convergence for the shortmiddotheater Elder problem applrently also relying on rountl-off errors The grid size for which the)
obtain i converged solution agrees wilh Eq 101 and 102 For the experiments in model I and 2 thc mesh size was chosen to satisfy Eq lC
and 102 Wilh tlispersion dominaled by molecular diffusion (substilULion of the paramel
lisled in Table 101 102 and 103 in Eq 101 and 102 and using RlIrr = 7 yields L1z lt III and 1x lt 056 m respectively) This should ensure proper discretizution with respec
Peclel anti Courant conditions n model 3 hydrodynamic dispersion has been intlOtluced 10ngilUdinai and trans
dispersion IengLhs are u f = 1 m und aT =01 m respeclively Under these condilions t maximum mesh size can bc enlarged to Llz = I III and L1x2 m LO fulfill Peclel and 0 conditiuns The maximum mesh for the simulltJtion of density currents will also be larg Ihlll in lutlel I and] ahhough [q 101 lnd 102 cannot be applied Nevertheless Lhl sen dimenoiuns are hclievetlto ensure 1 proper reprtsentation of the density currents
1023 Model WIl hOlldwy nmdiliollmiddot
Mmd I 11imUly mmlll rilllt gmwlm(el lII1 sotile 1111SP011
BeCllISC of sritt requiremellts or gridmesh resoh1ilm accuratc simulation of fr
Water longucs lhal extend over a hmg dislanCl into the offshore is nOl feasible The c menls presenlcd here were conducled OIl a SOD III long slction anti a 10 m thick aquil overlain hYl I m thick wnlning laycr (Figure 101) For Ihe gtallw reaons the aquifc
Model 1 h = 0 m (r) =m sea
sea level c
coas
no flow no dilt
E 0
20 elms) aquifer
h = +1 m (I) =0
bull no flow no diff
500 m (1500 elms) bull
Model 2 final sea level
iiiiiiiiriiiiil~aiin~ljii=1O3bullbully~~~afteri2O~O-2000 yr
r ~ initial sea level
hydroslati SOmE(27 elms)w=o hydrostatic aquifer
(I) =(11 sea
no flow no diff
400 m (800 elms)
permeable zone Model 3 in experiment 3y
900 m (18 elms) 150m 400m(30el s) l40etms)
no flow no diff
final sea aHer 2000 - 8000 years t no flow no diff
E o
no diffno flow 50 m (50 elms) 50 m (50 elms)
Figure 101 Sehematic structures (If three numerical models (elms = elements)
I1Kahility ha~ [0 hl a~~iJlIed a fcalinly low luc 0= ID x 10 11 11l~ ur k (hydraulic COlishydUCIjly) = 01 Illdl) Fixld Plllll1C(l1 Vlll~- arc listed ill Tahk 101 Ollly Ihe illllinsil
permeahility of thc ltlql1itanl I was varied in slILTcssic LXpLrilllLllb ThL finilL-eklllL1l1 mesh clll1sia~ of ~7()O qlllurilaleral dLmCllts 1~O) illihe horiiolltal and 2 inthL vertical direction The horillllt1l (klllent size i~ ul1ifoflll with d 05 Ill The erliLal clement sill
in tilL lOp I III of Ihe ~lllion is1~ 02 Ill hdow this layer L~ = )J~ Ill Inilially the edishyOil rilled WIth SCltlWatef Subseql1ently each experilllent was fUll 1lI1lii ~1 stLady-sHi slshyinity ditrihulion was ohtained Mosl simulations (lnly showed a quasi-steady solulioll heCtlllSl t01letliL lllller instahilities caused slllllity values lllt tll low ridd 1(1 llllttl1ltllL
round a tOllSlal1( Illean Till dimellslllllS 11ld Jtluifcr pll111Lahililics did not CUIlLspond wilh the actual ca-c- where lIleleoric ~rulllluwlIcr is fOllnd Illllly kilometers olTshore and (1
depth or -e lral hllndreds of meters (Clwpter Rl Til plirpOSl of Ihese lXpcrilllellts is to erify the a-U1llptioIlS and thL rlull lt1f the Ne AppmxilllJte Model (NArll Ill Chapte 9
Hrltfl 2 Ihllllrilll grol(lnllll (lml SOlllff nllspo dlril1g f(Ilgnslmiddotjlli 0(1 11 7f1 IItImiddot
lanopilltI hlld s(((
Mpdcl experimenls nr the transgressing sea have heL1l carried oul on two-dimcnsioshynal enicalcross-Setlioll with a length Dr -lUll III llU an al[uifer thicknLss or 10 Ill (iel)melry llld houlldary ClmdilillllS arc depicted in Figure It)l TllC nmdili(m at Ille (lP
and ril111 hOlllluary arc limc dependent depending tln sea level The right hllUllllary is assigshylIcd hydroslalic prcssun cOlluitions anu collstanl seawater salinity The pressure part or [he lop-houl1dary condition is givcn by
f)~ = () hi 1lt 0 f 1113)
where 1 is (he houl1uary Iluid pressllle and 11(1) is [he 1IKai sea dcplh lnllllcnce of lidal ll11ctUiliollS is nol lakL1l inlo account The sectioll is assumed fully saturatcd such thai the topographic grauienl cOlllnlls the llll-hme hydraulit pressure gradient The gradielll of Ihe
opographie sllrrace in the experimenls is (3 =1 x 10 whidl is a typcallllean vahl( ror conshytinental shelves ( 100 III waler depth at I the edge or a 1Of) krn wide shein A tillie-dcpendent
Dirichlet bOlilluary cOluilion i lI~ed for (I) a[ the OP houndary
w~ = (I) m I h( I ) () w~ () I h( ) lt 0 Fixeu parallleter alllcs arc showll in Tahle 102 while plllllelerS valnes varied illihe varishyau experiments Ire prescnted in Tlhle 103
The finite-element mesh WrlstSIS of 29600 tjHadrilateraleklllllls HOO ill the horilo11shytal ami 37 in he vertical diHclion The horizontal element sile is lilliIm-ill with Llx =05 Ill The Y(nital elemelt sie in the top I 111 01 the sectioll is k 01 Ill below this laYlr1~ = 033 m Thc maximulll lime step eillployeu is 1 x 1()7 s which keeps Couranl 11l1lllber ~1l1shyler than I a Jllllimcs EI(11 experill1LlH starleu with he steady-stalL salinity dislrihlllioll and 110w field for a sca level or +005 m which torresptlilds 10 a coastlinc 10cltio11 ) Il1 from
Ihe righL boundary or the Illcsh Model experiment simulatcd lIhsequcnt salinislliOII fur a givell rale of sea-lee1 rise during a period of 200 to U)()() year
Again he dimensions of thee experiments slllTer rrol11 the same nUlllericallimitaliolls as in model I Howeycr the hilsic styles of seawater ilHrusioll thaI canllevclop arc well illustrated even at these rcullceu scales Moreover from the experiments and the discussion
below il cun he underslood how sahnisllion at rger space and time scales occms In Ihese experimen[ atlelllion is gien to the speed of the encroKhillg sca rehl1ive to
mcction of the fresh-saline inlerface Earlier modelling stlldies hy Meisler It al (19H4l and
116
t
water lable amp land surface
II llr
- - - - - -- - - -- -- -- -- - -- --_ -_ -t 5
fresh water
sail water
-
x
c=
I-igur~ 1112 D~l1sj[ydri~n oree olllhe r~jhl~aill~ illlcrfilce Juring Irallsgrcssioll mltonlillg to model 2
EsmitJ (t)l)OJ ~hmVLd lInt II I I bull Ic IlIlcr Ice reacts very slowly I I III Ill Idvlctioll orlhc illl r _ () t 1C mnvlOg shoreline The
tr ICc IS plllllanly dClermmed by II I on lite shelf depicted in FilIrc 10 IK 11 we ge ot heavy seaWater
- 001 llld Groen ~OOO)
A 11 -p gmiddotl(llJ
IItl ~oJ 1104)
Where fJ is Ihc lalldwmJ ltlip of llle shelf Th sca Icvcl rise hy L IC[Ut1l lallsgresslOll speed Ir- is rela[ed LO Lhe
1= ftltlnfJ
Till transgression speed call he expressed in (f 110n- J1nen~IUIl( lerl11s by
r = I l~l = ~___ KPg middot(III~ J ( 105)
Where the crilical vallie is expec[clJ IL fl-r - I E I0 ~ I would rlvor lhe lain behind II I~ I - q ) S lllWS Ihat high ilIIlCS or r which
re r (It 1 l-Wilter wed C t I shyIow pClllleahilily (0) and illl1ani I I e- en to OCCur IOl larg~ values of l fll Ir ow-gradlenr land sUrrafC5 (Wn 1J ~
Mocld 3 Ilfhllllri( ~(IIclll(lltil(l wllr( flWl) IWltllIII((( 0 ( elm f)]~ IIWI greSllIIl 01(1 (I diutCed
ThL Llll 1 I L S () I nSlIlg SLj Icvl1 ellClOadlin Il
lopo~laflhy hIS b~ll s[lldi u [I e ponl (ontinellial shell wuh alley t I 1 d t WO-dllllCllslOnal model gt
el lltlll lmm a valky [0middot1 Vmiddotltmiddot I I rep[t~ellllllg a vCrlllallross_ lr ul[l C ltI~ mtlcuLd ill F 10 I
(lOll IS 1500 Ill The i1quilcr Ihickll --10 l-llll - Th~ length of the scc-tjS IS Ill whefea-o the Ihicknc~s or the clay layLf OJ] lOp
varies from 10 m in the valley to 40 m at the waler divide Bottom left and right b are no-now and no-diffusion boundaries The hydraulic and concentration conditior open lOp boundlry ampIre lime dependent relaled to the rising sea level as in model 2 experimenl slarted with a steadY-Slate situation with only fresh groundwater flow 1 sea penelrmeu lhe valley and rose in 2000 years to its final position submerging l~
landscape The water divide was then eovered by 10 m of seawater Afterwards the mell was continued for another 6000 years This is a realistic stenario reflecting ral Holocene sea level rise (Chapler 4) at 8 ka BP the sea level was still rising tho below the present level but at 6 ka BP it reached its present level
ConSlant parameter values are shown in Table lOA The vertical and horizont abilities of Ihe day layer in exrerimem I are 10-16 and 10-IS m2 respectively (or J(
~ mday in hydrmlic conductivity) In [he second ex~riment the permeability has increased by a factor of 10 with respect to the first experiment In the lhird experin permeabililies were equal to Ihose in experiment I except for a 50 m wide zone n1 water divide where they were increased by a factor of 100 relaLive [0 that of the f rimelli
The finite-element mesh consists of 9660 quadrilateral elements 138 in the 11
lllU 70 in (he vertical direction The horizollial element size varied from L1x = I m ley and gradually increased to tlx = 50 m at Ihe water divide The vertical element the aquifer equaled k = I m while the element size in the clay varied from1z =l Ihe valley to L1 = 133 III at the waLer divide For experiment 3 the horizontal grit the permeable zone was relined to d = I m to allow convective densily currents
103 Results
1031 Model I Ilalimuuymbmarine grmtlllllcaer and solule transport
Figure 103 displays the sleady-state salinity distrihUlion for three expenm which Ihe penneabilily of the aquitard was rrogressively reduced from 74 x 10-1
x 10middotr7 m~ to 15 x 10 17 m2 The corresponding now fields are depicted in Figur Three distinci zones can be dislinguished (i) a proximal Slable zone c10sesL 10 Ih where groundwater in the aquifer is fresh and high seepage rates restrain Ihe diff dar) layer to tbe clay layer (ii) an inlermetliate instahle zone where the diffusive
laycr reaches the aqUifer and creates convection (densiLy currents) and (iii) a dist zone where free convection is absent and slllinilies are high though slillless Ihn seawater
In Ihe firsl experimenl seepage rales were high because of (he relatively hi aquilard A proximal $lable zone of about 50 m developed The length of this zo
aboUt equltil [0 lhe length o he fresh-water lOngue according to the New Appro Model (NAM) from Chapter 9 (indicated by an asterisk) Going further offshore rapidly diminished md the intermediate unstable zone commenced DensilY cu clearly visible in Figure IOAiI Beyond 100 Ill [he distal stable zone is found w very link now and $ulinities are high with very small vertical gradiems The 10
second experiment Icd to a reduction of the upward seepage rJte but also (0 an the seepage zone inLo the offshore zonl In this cllse ltI wid~ inlermediate unstab dearly visible from 10010250 Jll offshore (Figure IO3band IO4b) The trbulll1lsi
proximtIIlble iJJIlC h tlot c1elr[ he 011( up If) lCJfJ 111 (Ilhhqrc hY- lahlt_ hUl it appear
lhat frtJm 11 IiJllI~ drnily ClHfllll drorlIJ1 rdkUIfIl Ih qllJmiddotmiddotImiddotmiddotmiddotl~IlI flallJn 111h~ ~lCI1
The intjjhiliy ljll jl-IJ t)l~ lenvrd fPHlI tl1 la lhlt (II 1 middot_r~h~d llthl II~TlC llun
lO3b) and lhere ilIJIJ uhllllrilll IrtIJ-jTlJIJIld ltl1Cr rHljUC Hl3JrtJllll llJ the ~rl ~odd
(Figure IO3h) Apparently the instahility i not very high a illakc a c)n~J~rahl~l1lTle [0
develop fingers Another possibility is thal the small disrcrsi~m ha lt~ sLablilmg ellecl on the boundary layer Further reduction or 1( in the third experlmel1t dId noL change the geneshy
ral pattern apart from the intermediate zone with frequent density cu~middotelHs which noe~
closer to the shore This is the result of the lower seepage rates allowlllg more salllJltruslOIl
into the aquifer
~
-
JOO x (m) 200 100 0
300 x (111) 200 100 o
300 x (m)
Fi ure 103 Variable-density now and solute tTltmsport in expcrimcnls of mouel I slcldY-SltlIC submashyrin~ outflow of fresh groundwatcr cxperiments 1 10 3 are results fr K equal lo 74 X ](ImiddotI~ 74 X 10-11
and 15 x 1017 m2 respectively Solid lines contours of salt-mass ImCIlOn from ~() = 0005 to ~ = 0035 with contour interval 0005 Shaded arca zonc with OJgt 0020 Heavy dashed lines Ireshsahne hounshydary according to sharp interface model Asterisk above each panel extent of fresh groundwater accorshyding to new approximlte mooel
20
1 exp11 lt I
i 1lmiddotlldd am(
1~lllllllk - 10 111middotx AIl~k 1111 IlPJI(llal = ~5
middot10 shy
b (J lexp21
LmiddotE lt ~ fgt
-10
500 tlXl JOO x (Ill) ~(ItJ too 0 c u lexp31
(~E lt ~ middotn
middot10
iOO middottoO 300 x (Ill) 200 100 0
Fi~llr( 104 Vi~ualillilln Ill lhc Ilow ficlus in expcrimcllls (If l110del I Truc low c1Illilils arl ~IH (Darcy vcl(lLily ulidcu by ptl[(lsilyl The vclocily is Ihl samc ftlr the llllCC panels allli i~ indicalld ill llpper pancl
Also shown for each of lhese experiments is lhe corresponding sharp-inlerface SOIUlil according to lhe Snl Illodel (Chapler 9) for lhe employed bOllndary condition for the coa l
groLlrllthalcl head 11 = I m The corresponding values of the suhmarine groundwater outtlo QI for lhe harp-inlerfacc ohnions arc respectively 263 x 10 7bull R32 x IO-S alllt
371 x IO-s l11~s Valu of Q Infcrred frol1lthe tlow licld 01 lhe Illlllleric~11 simulatitm arc respectively 2(13 x ]()-7 R07 X 10-il and 331 x IOmiddotH m)s The sliglHly lowr values [
the latter IWo numcrical simulations as cOlllpared to the valucs for the sharp-inlerrace
appll1ximations arc caused by the dcnsity effect associateu with lhe presence of more salilll water in the aqui rcr close to lhc coast Comparison of the rcsulls for the two types of mmlt shows that the sharp-intcrface approximations tend to overeslimate the length of lhe freshshy
waler tongue and lhal lhe discrepancy grows signilicantly with dccreasing The numeri cal experiments dcmonstrale that lhc downward salinization hy convective density Cllrrellloshy
hecomcs progressively more dominanl lhat is lhc fresh-water lcngth initially increilscs hlll reaehcs a maximulll valuc and then dccreascs upon furlher rcduction of Por the hydroge ological conditions adopted in lhe cxperiments this oplimum approximately occurs for Ihe
IL)(-I-----ltCIII-I-----IX----(-I1-)-=IX~) -----CIX-~==~O
01- E _ -5 I 20 years
N
-10-- shy
or 5 t=40 years
_10L--~--
--- shy
_10L~~~--
o
l=1OOO years
~C-
X~ 1 CaellaleJ sahnilY
gt( I of moue lute ua1lport in C4pC~mel b_criticilltrlIlsgresSIOll rale
105_ VilriablemiddottlcIlS1Y no~ ~~r substrate in combiallon wlh ~ su frOln 00= 00005 to O~355 lion at hr~~ ~inc ~t~pS ~~r ~~JnJss of shiltling cO~o~r~ S~~o~ob~rn a~tcrisk Details pte glVcfl
gt ffllction increases Wit 1 f ~hc shoreline IS IllunalC
I ih current locillon 0 oml ullervu s lt
ICla -to
sect N
cttHld cxptrilllcnt Finally all inleresting feature of the predilted si1inity pltlHerrlS displayed in Figure 103
tlwt l(lw-~alinity water~ extend fanhest offshore neilr lhe OilSC or the aquifer This lonlrasts Irtlngly with lhe resllhs or sharpmiddotinterftlle models whilh show fresb waler to he progrcssishydy ltllllinclitu the lOp piln of Ihe aquifer when moving in ltl seaward direllion
lJ32 AIldd 2 sufllllClrIU gnJlltfdwlIftl IIl1tlsolHt tnillsWI durilllf 11(I11ign~middotsilg unI1I
Iho (mClnlloli1~ alld SIIj((
The experimellts tbat Vere lOlldllcted wilh the ~el(lrltl lI10del arc sllll1nllricd in Tabk (lt Inlhe experimcnts the following paral1le(crs or lontJitiolls wac varietJ ) strl(igrlphy (I) single sand layer (ilquirer) (b) ~ingle ell) laya (aquilartJj (l) aqllilard Lrlying all ilqllifer
rale of seil-Ievel rise 1
dly lerlllcahility I~ and longitudinal and transversal dispergti vity a j bull and a Parameter vidue that were kcpt eonstllll are given in Tahle 102 The term middotmiddotsmdmiddot is
Ld here and in (he following h) dtllote stdimenls with permeahilities that are high relative
days Thl perllleability value listed in Table 102 correspomls to fine sand or sill Using a ~hcr pcnueahililY wouhl imply a major innease in nUlllerilal co~l as expbintd in section 1~2_ ~1ltIJ1rfanJ rlrdenoc ht non-dimensionltll transgression rate 01 Eq 105 mhstilllling 1 and dly pellllehililY rcspcclivdy
Experilllllls 1-7 lllt~tnill the lriliellrlnS~ression nne rmiddot for a uniform sand subshyI(e and very small hydmdymuuic dispersion (ll1ore thall 40 times smaller than molecular fusion) pr was found to occur for this set of experiments b~tween 558 and 651 (Tlble ]) Figure 105 displays the horizontal style or salini~llion for expelimellt I It shows lhat lransition zone quickly assunls a stteper ltmlnarrower geometry during its laleral Imiddot~ltion in wmpltJrison with the initial steul)y-sllte situation It WilS fOlllld thm this tfretl is l11gef 101 higher rl~s of sea-level rise The observed steepening is probably due to inhihishyouttlowat the landwmll side of the lmnsilion zone and lhercfonmiddot cllhill1lC( input of salt he tup uf the transilion zone This steepening in turn tlnhalccs tht- CkllIWtSt- on-x in now llclu (sstlciued with the density dislrihulion whilh lends to llaucll the transition
IC Apparel1ly the Iwo effel1S (inpU or salt at thc seafloor and thc enhanced clockwise lCOX) work together 10 (I) maintain a conswnt shape of the lmnsition zone and (2) provide Ildlilliism for Iltend migratiun or the transition zone in addition to (hat due to the chanshy pr~~ure houlidary wntJilions ill (he land surfule The Jaller eflecl prohltlbly explains h~ exp~rimclllaly Jelcrmillcli value of Th of aboul 6 is lilfgcllhan Jhl ~allie of I preshy-1I ill S(xlillll IOU
Figure 106 ~hows lhe sulinisHioll history fm experimcllI 7 h this experiment thc ~ilillil zune IJgs hcilind lhe l1ligratill1J cUltlstline und e-wata fjuglrs eman~Hed frol1l a lsive huunuary layer whilh JcvcloJls IS a moving wltlc ill (he top or the aquiferls sea _T overrllJe fresh gmumlwatcr ltllis hOllnrJary layer is seen llort clearly in Figure 107 re it rClllaind stable because of low ~rlleabiJity)Theorelilally lingering unly ~lancu
rc this bOllntlilry layer rcacl1cs illritieal thickness In Figure 108 this ocurred Ilos to Hrn shoreline hClilue the lrililallhitkness was very small Ilsing Eq 101 iUlU ilUOpmiddot RCI 7 yields 8 O1X m SeHIter lIngers lank 0 th- base of the ICjuifer and in CllI rresh wallr CSClplU llpwmls inw the s~a As 1 r~slJh a id~ high-salillity trlllsishy
x(m) 1 Caclilalcd salm1ty ol7ofmouc n
lute uanspOlt III e4pltrlIne u rol-Crltle011 tr01nsgreSSIO
lire 106 alllhk-ucnSY I1lI alu~~r ~ubsuae t11Ionblnauon WIWl ~re from OJ 00005 to
slCpS llIrI J 1 l ContoUrS s Left 100 mUlbtlllOn Illhf-( 1Il( bull lIh darkneo 0 SlauH~ 1I C lieu by all sen~
Sat-lllLS~ tral tlun mClS nl Ill IHOl III he lhorcllllc 1- In 1 I Ihe cune bull
~015S al umhmn ll1ld a 11 l)ctllb ltiT gLCn III the lexl li model UlH11alll I 1101 ~h
-10
bull a 1shy
~ -5 1=40 years
Ol- bull
E 5 ~ t=120 years N I
-10 L--shy
bullo - Z-sectpoundpound M-~
~200Ye~~~ -1gb-----~2ii(r 300 400
X(m)
Figure 107 Variable-density now and solute Iron1ipurl in cx~tTirncnl ~ of model ~Clllculntcd salinshyity distribution at three lime steps for n cluy subslralc iu omnmallon wllh a supra-cnlca lransgresslon rale SaIl-mass frltletion inCrCltIliCli with darkness of shadmg C(mt()~lrS st~owu arc fr~llll (I) = f)OODS 0 00355 at uniform intervals An asterisk indicates the current loeallnn oj the shorehl1c Len 100 Il of model domain is not hown Detail arc given in [he [ex
bullI ----shy-10
E 0 r --- -5 t=140 years
N -10 _
bullo
E ~-5 t=200 yearsN
-1qoo----shyX(m)
F 108 Yanable-densily now and solute transport in experiment 17 of model 2 Calculated sulioi-Igure k I I h ty distribution at three time steps for a sandy aquifer o~erlajn by a 05 ~n thle cay aycr II~ COlli mallon with a supra-crilical transgression rate Salt-mass fraction mcreases ~lt~ darkness 01 shadmg Co~tours shown are from OJ = 00005 to 00355 at uniform intervals A~ astcns~ Ind~cntes the CUITelll locatIOn of lhe shoreline Left 100 III of model domain is not shown Detmls arc gIven In the text
tion 1011e developed hclweLn the fnnilcr ilnd nev coastline Very lillic l10w UlllIITed illtllis 7(lne once the flngcls rCiHhcd thc ha~c of tile aquifer alld eonsequelltly the slIhsrqllelH development of this zone lowards full ~eil-water qUllity was dominated by dilTusinl1 amI therltlore cry ~1(Jw In Figure 106 tile rnllllill fingers were ucl1ected somewhat landward as they ue~nl1rJed deeper into the aquifcr
In experimellts X-12 the role of hydrouynillllic dispc[~iol1 was illvcstigated ExperirmlHs Xlrld () arc the same as exrerillleHI 7 excert for increased dispelsivilies In experill1ent 9 with largest disrersiitics al = 1 III and aT 01 111 nipcctivdy lingers emanated rmlll a thicker slline boumhuy Ilyer and finger dimcnsions were ahoul thrce tillics larger than ill e~pcrilllel1l 7 hUllllc huic style of sea-water intrusion was not altercd Experimcnts 10-12 which wrrcspond with experiments 4-6 showetllhat hydrodynamic disshyperioll sliglHly increases [11 to a alue he tween 651 and 744
Ererilllcllls 13 and 14 inwlttigaled salinisalion of a uniform dltly ltuhstnlte In lhesl experiments vcrtiGli intrusion by diffusion dominnted Figure 107 illuslrates the movingshywave behavior of the diffusive houndary layer tlmt develuped below the sea 11001 for exreshyIiment 13 Due to the lo permeability of the day the boundary layer stayed il11acl Nut surshyrrisingly il ltelwanJ dipping fresh water wedge lIevcloped ill the offshore
The set uf exrerinlents 15-20 were conductell ror a ubstrale in which a 05 III thick day layer uvcrlies a sandy aquifer Figure 108 illustriltes the Iinisation histury ror experishyment 17 which apart from the 05 J1llhiek clay layer WltlS the same as the exreril1lel1l of Figure 106 The clay layer affects Ihe results ill everal ways Firs beclUse of its low pershymeability the high salinity pan uf Ille difrusive boundary layer which developell within the clay layer is stable (see also Figure 107) Inslabilities germinatell bcneath Ihe clHy layer where the diffusive boundary layer within the aquifer bad reached a critical thickness Second tl1is critical thickness was larger than for a uniform sanlly sl1bstrate (ol gt 028 Ill) because (i) the density euntrast across Ihe boundary layer within the aquifer was less than the freshsel-water density contras anll (ii) now illlo the top of the bounllary waS restricted relalive (0 that in the experirnellt of Figure 106 The enhaneell stability of the boundary layer is apparell in Figure 108 from the fact that instabilities arrearell a finite distance frum Ihe currelll coa~tline Third once the instabilirles hnve grown into macroscopic sail finshygers Ihey do not sink as readily as in Figure 106 because of the sll1allllensity contrasl with the ambient grounllwater and because of the greater resistance to lIrawing lIellie flllill frolll the overlying sea reservoir Therefore a wide low-salinity transition 7one rJevelored which is illlerlllellialc in nature relative to the experiments of Figures 106 anll 107 It should be noted that a minimum thickness of the sanlly layer is required fur instabilities to arise
Experiments 15 and 16 constrained tIle nun-dimensional criticaltransgressiol1 rae t(l OClur between 11 = 093 anll rIl1 =186 which is approximately 5 times lowcr Ihan for a pure sand substrate A greater thickilCss of Ihe clay layer will probably further rellllce the crishytleill transgression rate and result Jlower salinity pore waters in the ullllerlying aquifer However this was not tested within the preselll set of experiments
The effect uf hydrodYIlJll1ie lIispersion was investigated 11 experimenls 19 and 20 It WJS found thaI similar to a uniform sanll substrate hydrodynamic lIispersion increased the thickness of the boundary layer and the willih of the fingers but Old not alter the molle of intrusion in a significJnt way
124 125
I
1lJ33 Mudd 3 wlw(Iilt gmwbllllll will mllllt I1l11lsIwrt durillg rrlllugreuiOlI [lIa a
dimiddotHllld Ilind ~IIflln
Figure 109 shuws the salinily tlistrihuliun at four uiIT~r~nt stltlg~s ilr(~r Ihc sea has inundltltcd lhe disSCllcd lantlslape Afl~r I oon y~ar s~a levd has risen to 20 m ahov~ th~
vallcy hOUOI11 bUllhc inhrl111vcs have not been subm~rg~d y~L At this slage a ria-type lOilstlinc has been formeu as call still he obs~rved along many loas[s Despite the inundashylion of he valley salt-waler intrusion does not mlur The reason ror this b~haior is that Ihe groundwater systcm is still r~chilrg~d 011 lhe int~rl1uv~s and strong upward seepllge helow (he vdky is l1lililllain~t1 pr~ven(ing u()wnwartl tlilTusion into (he aquifer Only il thin stable
diffusivc bOllntlary Illyer has tleveloped in Ihe top of the aquitartl This is shown by the vecshytor lidtl ill Figurc 109 Whcn ancr 1500 ycars the enlin~ lamlslape becomes submerged
the now field tlramatically changes The meteoric low systcm loses its drive and the fresh groundwater bccomes subjecled (0 diffusion and densily-tlriven l1ow The salt-water wctlge
in the drowned vllley makcs the fresh WOller nOW in the reverse direclion antl drives it from the aquifer by upwmd Seepilge thmugh (he aquitartl al the w ller divitle Below the valley
salls ellter the aquifer by diffusive antl atlvective transpofl and creale instabili(y antl tlensily currents The expulsion and salinizalion of lhe meteoric groundwater body is a slow process
after 2000 yeltlrs whcn Ihe sea has level reached ils linal position l111lSl of the aquifer is slill
fresh Salinization takes place mainly by downward diffusion through Ihe aquitard and denshysity drivcnllow along the bOllOlll of the aquifer After 8000 years (representing the presentshyday sillmlion) groundwater in the aquifer is no longer rresh though w is still hclllW OJll llllUlrneath the inhrllllves (chloritle concenlration lt 6000 mgt)
Figl1le 1010 displays the results of lhc second experiment where the hydraulic COIlshy
ductivily of the aquilard has been incrcased by a faclor of 10 with respect to experimenl I Only Ihe situalioll after 2()O() and 8O[)O yenrs is shown It is clear th H the higher conducli shyvity of the aqulhlrd has led to a larger nux of saIl water inl(J the alluifcr below the valley
Also the upward scepilge of rresh water fllnher away from Ihe villley has increased Thcrefore Ihe dilTusivc houndary layer in this pari is smaller (han in the lir~1 experiment
Bccause of tile larger Ilow ratcs salinization proceeds more rapidly afler SOOO years almost Ihe cntire syslem has hecnme saline
In Ihe lilst expcrimetllthe effec( of a relalively permeahle zone in the aquililrd has heen ~tUllied Paramelers ilre equal 10 experimcnt I IXCCpl ror the 50 III wide zone where
hydraulic condwtiviLies have been inlfcased hy faclor of 100 The salinities in (his zone after 2000 YCilfS ill Figure 1011 dearly show that a prcrerelltiaillow pilth has developed here for the expUlsion of Ihe meleoric groundwaler lhe high outllow velmiLies compress Ihe dirfusive hnulldmy layer to a thin zone Howewr ariel 3000 amISOOO years saline intrushy
sion hy c[)lvectin densily cllrrelllS eilIl be observed ill the pcrmeahlc zone Comparing the rcsults after loUlO) yenrs in experiments I and J shows Ihal the uqllirer in experimenl 3 has a lower salinity Apparently lllc two entrance zones resuhetl in lower groundwater low Clocishy
lieS or cvcn slagllilnt wiles whidl retardetl the salinization process
clay
-80k~-~~---~---~-----To-O-_-_-_-_-_-_-_-_-_-_--rn~i------~---------Joo
1500 0 [----=~~~~~~1~~~777771 years -20 _~_~~~~~~-~~-~~~~-~ ~
---------_ ~ -40 ~lI~~g~~======
-60 ~~---------__ 80 bullbullbull_~- ~~_~~ -~ ~ r r r
2000 0 [----=======~ years -20
g -40 N
-60
-60 L ~ ~----~
8000 years
Figure 109 Variable-dcll~ilY now and solute trltlllSprt ill cxperi~cnl I of m~del 3Calcul~tec disuibutiilll 011 100U 1500 lOOO 1Ild amp000 years aller 1rll~gressloll started In ~~e valley VaUf dcd in day IOJyer overlying a sOJndy aquifer Vertical and borizontal day pc~mca~llItlesilre 1( = 1 = 10 15 m~ respectively Sail-mass fraction inereasc~ with darkness ot shadmg Contours sf rr~lIn (V = 00005 10 00355 al unilorm illlcrOJls For lime Slep of ltiO) and 1500 years now
given
2000 0 sea eve years
-20
I -40 N
-60
-60
3000 0 years
-20
I -40 N
-so
-80
8000 years
~ N
-so
-80
Figure 1010 Vnrinblc-dcnlity now and lolule lra1lpmt in experiment ~ of lllmld 3 CnlctI~lcd ~(llini~y distribulion at 2000 3000 and 8000 years after transgression stuned In the valley Valley IS eroded In
clay layer overlying a snIldy aquifer Vcrtknl Dlld horizontal clay pcnnca~i1ities arc K = 1Omiddot1~ and K~ = 10- m2 respectiely Salt~mass fraction increases with darknCss of -ihaJmg Con(Qurs shown arc rrom CJ) 00005 to 00355 at uliform imcrvals
128
2000 yr sea eve_bull__====~= = ==
3000 yr
8000 yr
Figure 1011 Vlriattlc-dcmiIY flow and solule transport in experiment of l11odcl3 Caltulllcd sllinishyty disribullOll II 2000 3000 and RO)O YCllTS aflcr transgression slarlet in the valley VlIey is cnld~d in elay layer ()vcrlyin~ a sallltJy aquifcr VeniC11 and h(lriZ~1l1Ial day peflllcilhilitic lIrC = 10 It lIllIJ = 1O-1~ lll~ respectively as in cxperiment I Penlleaoi1ilie~ in (he pcnllehle zOl1e arc 1l() tinlcS high~r
Snlt-l1lltISS fraction incrcases Wilh darkness of shadil1c Conlours shown are from (I) = 00005 [0 0055 nl uniform interval ~
129
bull
bull
IO~_ I)isclission and conclusions
10-1 Modell
The eXp~rillCllS show thaI Lh~ steady-stme onshore outtlow )r coaslal iroundwarer scmi-cOillincd Iquifers can result in extcllsive transitioli zones of low- 10 high-salinilY _ grollHlwlllCr (illt~rmcdilc unslltlhk and distal slIhlc zone) In th~se zones relatively freshl
pmc wtt~r extends rarth~s( illlo the olYshorc Ilear tllc hlse 01 (he Iuiler These lransitioo ltllleS rcsult from ronveclive mixing in the form of density currents Fresh unmilted off rc grolilidwilter is found in Ihe ncar-shore zone only when the upward seepage is high cl(m~h Itl restrict the diffusive boundtry layer to Ihe day Illyer and prevent instabilily (proxlllHlI Slahk Ione) N)te that frcsh groundwater ~i1n abo OCClII in the bonom of the aqllirer ill the illtcnnedilte llllstahle zone where densily tUrren(S arise infrequcmly
~lthmlgh Ihc prciellt work was lomerned with steady-stale ialinily distributionslbe analySIS docs tkmonslratc tlul major modifications in offshore salinity paHerns can occur a nsuli of relalively minor changes in coaswi hydrological regime As ~ulh changes are likely to hlVe (llCllllcd ill many COliwI areas1t lime scales of thousands of years the clated landward alld seaward shifts of the fresh-water domain would have cOlHributed to me devcdeglllllclll of wide trallsition zones The inverted salinity distribution occurrin wilhin me _ bull 0
lOnlllll11g layer and Lo a lesser extent in Lhe tquifer ai predicted hy the variable-density l10w mmldling has hecn documented for instltlcc for the Norlh Sea (Post et al 2000) anci~ thc Baltic Sea (Pickilrck-Jankowska IlJlJ6) and may have impmtallt implications for sedi- ~ IIllnl diagcllcsis in surh offshore cnvironments It may Iherefore he an interestillo feature lO e lOllilder 111 gcochcmil11 Illotkb of early diagenetic proClSilS Werner 1980)
10-12 Modell
Ibsed 011 lhe Iindings or the second model sillllll~ling transgression 011 i nm sloping continental shelf our modes of ielWlcr ilHrusioli Ife distinuished
Mode I Qulsi-stcady horizontal seOlwi1er intrusion i~l the form of landward migrn iOll or I narrow tmllsilion wne closely following shoreline migration (Figure 105) This 1lI0dc occurs for a slilliriemly slow_ sub-critkal rate uf transgression An eSlimale or the crilical trangression mle at whilh the transition to modes 1 or 3 occurs for unishyforlll suhslratc conditions is given by Ell 10-1 Experiments showed that Eq 10-1 is allllflle to olle mder of magnillidc and tends to lIndereSlimlle fl r Referring 10 the recent Iiolocene trallsgreisioll lhis intrusion mode was Ilot thc dOl1linant process in most ur lhe olfshOle i1qllikrs The transgression speeds during thc Early Holocene for lIlallY contincntal margins away from the major cOlHlnelllill IlC shcets of the last ire age were flr higher (gt 100 ma) than critical lran-gression speed- Mode 2 Vertical selwaler intrusion by lingers of selwater Fi1ure I061 Thi~ ll1(hle orrurs for supra-crilklI (rlnsgression mtes and a relatimiddotely hiih-pcnneahility ~ubstra(e (sandsilt) A wide high-salinity lnmiition zone develops This rapid intrusion moLe can kccp up even Wilh rapidly advancing shorelincs It explains as an example the presenshyce or higb-sdinity groundwller in the exposcd sandy aquifers in the western pari of the Netherlands wbich were illl1l1dlled during the Early Holocene Mode 3 Vcnical seawalcr intrusion by diffusion (Figure 107) This mode orCllrs for supra-crilical lransgre~~ion nltes whilh call he very small and for l()wpermeability
subslrate sediments (siltclay) up lo greal depth An extensive seaward dipping freshshywaleI wedge develops below a thick mainly vertically layered transition zone Salinization is mainly COlli rolled by downward diffusion This intrusion mode is restricled to shelf sediments with very thick clayey sediments beloW the sea floor Mode 4 Vertical seawater inlrusion by low-salinity tlngers (Figure 108) This mode occurs for supra-critical transgression rates and a layer of low-permeability sea-floor sediments (siltclay) overlaying a relatively high-permeability aquifer A wide low-s inity transition zone develops in the aqUifer resulting from convective density currenl while in Ihe overluying low-permeability layer a relatively sharp diffusive boundary layer is present This intrusion mode explains just as the Ihird mode the temporary preservation of olYshore meleoric groundwaler Allhough the dimensions of the rnode are small lhe same process explains the presence of vasl bodies of meteoric ground ter far offshore dong the coast of Suriname the Netherlands Indonesia (Java Sea) a
lhe eastern USA (Chapter 8)
The experimenls are carried Ollt for simple one- and two-layer systems MOSl elastic cOlllinemal shelves comprise a succcssion of alternllting sand lind clay layers Therefore s ne intru~i)n may take place by superposilion of various modes For inslance rapid salini lion in a top sand lltlyer lakes place by convection in accordance to mode 2 The resulling high salinity in the sand aquifer 1lluy invoke diffusive salinization of a thick underlying c layer according 10 mode 3 in Ihe subsequent sand layer salinizltllion may proceed as mn via lonvective density currelllS conlrolled by diffusion through the overlying cluy
1043 Modell
The lfilllsgression experimellls with model 3 on a hilly landscape show that salinizi below valleys starts only after sea level has risen 10 a sufllciently high level Intrusion Sl
in when the uischarge in Ihc valley related 10 Ihe fonner meteoric now system declines disappears ahogeher NOie that in this case a wet climate is assumed wilh high groundv levels in a landscape underlain hy a clay layer Under more arid condilions (lower seep rales) anL more permeable sediments under the valleys salinization will start earlier Tt experiments show that arler suhmersion of Ihe landscape the llow system reve~ses Fres and low-salinity groundwater is slowly expelled from the upland areilS where It was ret oed before either as diffuse discharge or via permeable pathways The sludied cases wi relatively low but otherwise Iypical pcrmeabilities show lhat meleonc submarme grour tCl call bl preserved for thousands of years after the submersion of the landscape Thes paleow~tters may form very large bodies which slowly disuppear either by expulsion 0
fusion Some obscrvnions of groundwater discharge eilher as diffuse discharge submari
springs or based on geomoq)hological fealUres may be rcllted Lo the eltpulsion of pale ters This applies especially for observations far offshore which cannol be related to a dyslatc groundwater llow syslem with onshore relharge The NAM model (Chapter 9 demonstliuc~ that these systems under nOrlnal circulTIstanles extend only several kilon imo lhc offshore In the experimenls only I few parameters have been varied The pUr] WilS not to show lhe various modes or salinization as in the experiments of model 2 b mercly to show the possibility 01 preservation of otlshore paleogroundwuter
---
1044 Additiollal remarks
Incorporation of diurnal crfccls stich as tides might affect details of thc predicled salshyinity patterns This would apply in parlleular to the relatively small spatial scale or lhe expeshyriments presenled here However it seems reasonable tu assume that the results prescnted here provide insight into processes for mllch larger spatial scalcs (tens to hundrcds of kiloshymeters) and geological time scales for which Ille magnitude or sea-lcvcl change uverwhelms
thn of diurnal processes Perhaps more important shorlcomings of thc modeling with rcspect tu its applicability
to natural systems are its 2-dimensional character and (he absence of hetcrogcneity in submiddot
surface conditions
h_ +1 m n 03
m 00357
P 10 kgm-1
K 10-13 m (aquifer) I 10-1 Pamiddots
G = 10 ms-2
D 10 m2 middots-1
a 02 m
aT 002 m
Table 101 Congtlant parameter values for [nodd I
N 03 00357
P 10
K(sand) 10-0
I 10-3
G 10 10-9D
Table 102 Constant parameter valuegt for model 2
IExperiment ILilholog l 11 fad fda I(cr a a inlrusil)
Ii) (mOlOIl (111) 1m) (m) n
I sand 01 093 - 10 10-) hor
2 I 02 186 - 10- 10-1 lur
3 05 465 - 0-) 10-1 hor
4 06 558 - 10-1 10-) hor
5 07 651 - 10 to-] vert
6 08 744 10-) 10-1 vert
7 10 930 10- IO-J vert
8 10 930 - ro- 10-1 vert
9 10 930 - 10 to-I vert
10 06 558 - 10 W-l hor
II 07 651 - 10 10-1 hOT
12 08 744 10 10- 1 vert
13 clay 10 93middot10 10-17 10-) 10-) vert
14 10 93103 1O-1~ 10-3 10-) vcrt
15 ~andJclay 01 093 93101 10-11 IO-~ 10-3 hor
16 02 186 19 middot10 1017 10-) 10-1 ven
17
10 930 93middot10 1011 10-3 10-) vcrt
18 10 930 93101 1O-1~ 10-] 10-1 vert
19 10 930 93middot10 10-11 ro- l 10- vert
20
10 930 93 middotIO~ 10~17 10 10-1 vert
Tahle 1lIt Vlriuble parall1ehr allll~ for experimellts or l1lodel 2
N
CLlsra
Po K
(aquifer) I G D
lIt a
Tallie iliA
03 00357
10 kgmiddot m 1O-1J m
IO-J Pamiddots
10 m middots-~
IO-Q m2 s- 1
02 m 0D2 m
(01101111 parametcr alul~ lilr l110del ~
132
bull
Chapter 11
Summary and conclusions
Imrodu(lioll
The objective of Ihe work presemed in Ihis thesis is 10 shed more light on salinizati( and freshening of cous(ol groumJwuler fit geological time scales and on the origin of onsl re and offshore paleogroundwater An essential approach to meet this objective is the reCI
slruclioll of paleogeogmphy wd a~sociUled paleohydrology of coaslal plains The scope ( the study ellcompasses groundWiller in coastal plains lind offshore
In lllany cases lhe salinity distribution in groundwater in coastal plains and offshore aquifers is complex and does not comply with lhe c1ussic concepts on coastal hydrogeolc The main reason for this incongruence is thut these concepts do not account for geologic evenls like regressions lransgressions seiJimenlalion uniJ landscupe changes These even have triggereiJ processes that may nol have reacheiJ steaiJy slate with respect to the salini concentrations of specilic chemical components and even groundw31er heads This applic in partilular to groundwuter salinizalion resulting from the Early Holocene transgressior and the subsequem freshening afler coastal aggradation set in during the Late Holocene Because now systems change rnpidly in the dynamic coaswl am offshore zone bodies () fresh 10 moderately brackish groundwater (Clmiddot lt 7000 mgtl) occur lhat do not belong to present-day now syslems These meteoric groundwaters have been formed by extinct systems and are designated as paleogroundwaLers (Chapter 21)
Part I of Ihis thesis eomprises lhe results of a case sluiJy of the coastal plain around Paramaribo the capital of Suriname in South America where peculiar salinity patterns J
paleogroundwaters were known to exist Many researchers of various earth-scienLific di~
pliliCS as well as conslIlling hydrogeologis(s have inve-igaced Ihe area Existing infonn~
from these sluiJies new hyiJrogeochemical aniJ isotopic iJata and malhematical simulati were used to explain the salinity patterns in the coastal plain aniJ the offshore area
Purt 11 contains the results of gelleral sludies imo the phenumenon of offshore met groundwaler as found in Suriname Observations of olher coasts were reviewed and eXI ments wilh generic molles were cltlrried OUI 10 lIndersland lhe genesis of offshore metec groundwmer
Plrt I Case sludy of lhe Suriname coast
I-frdrology (~rrhl coasal phill (Umple 3)
The loastal s~dimentary zone in Suriname has a width of 70 km near the capital 0
Paramariho (Figure 31) In the Soulh Pliocene sands arc exposed forming a rolling la pc cal1eu the savannah helt because of the saYannah-lype vegelillion The low-lying m coastal plain stretches nonhward of the savannah bell and is underlain by Pleistocene ltSouth allu HoIOllfle days (Nonh) Housillg and agricullural activities are concelltral
the slightly elevaled sand barriers in thc loLslltll rlain The straligraphy eompriscs II wcdg~ of Illainly dastic forlllati()n~ of Lal~ CretilleOUS (0
Holocene age (Figure 35 and 36) Rcgional groundwater flow lltlke~ mainly place in Ihe Teniary scdiments fanning an illtcrmllltlg slllcession of stlnd alld day laycrs The Teniary aquifers contain frcsh to rnoderlltely brackish (meteoric) groundwater (Figures 35 and 38) Pristine meteoric groundwater (Cl-lt 50 mgl) is only found helow he recharge zolles of Ihe savannah belt and the Lelydorp sands in the Pleistocene coaslal plain (Figure 31) -hteorie groundwater is sandwiched between saline groundater in lhe Holocene clays and deep salishyne groundwater in Ihe Cretaceous formiltions and extellds abol1tl)() km illto lhe orfshore
deposits Rainfall (2200 mmlI) llIl1y occur all year ronml hut is most ahlllllhlllt during the short
(Dec-Jan) and long (Apr-Jul) rlliny season (Figure 32) Groundwaler recharge rate in the sandy soils of the savannah belt sue high hut this groundwater is discharged locally bypoundreshyks and does I the aquifers in the coastal plain Diree[ recharge of the Tertiary aquifers is restncted in the coastal plain to t 1e e y orp sands where phrealic groundwater levels are relatively high ~~_he reamptof-tlE plain the large hydraulic resistance and small vertical head gradient in the Quaternary elaY11rohibit recharge In the period before blrge-seale groundshywater pumping (before 958) gr9lndwater in Ihe aql1ifers was almasl stagnant (r-igures 39 and 310) Nowadqys grbundw~er now in completely controlled hy thc extracliolls in and around Paramarlb (Figu(~ 31 O)~ -
Interesting af~ the artesj~l11 f~t1s in the Oligocene aquifer in the prepumping period (Figure 39) The~~he~dsmiddotmiddot~a~~oiiJ~ related to an elevated recharge area hut are attributed to
the rapid Holocerie)edim~_middotntalio Most probably the sediment loading caused an excess hydraulic pressur~hi_~h)la~~orfllilydissipued in this case This effect may he more comshymon than we think [Ho~g oihefeois( with high sedimentalion rates However it may be weakly developedj~the absence or confining layers or ohseured by regional coastal now systems with submrlt-lne discharge
~
Freshelling dllrillg ih~ WiscrJiinoll egr(~itm (ChapTer 4) - shy
Onshore and orJsho~e meteoric groundwater in Suriname must have been formed by extinct flow systemsmiddot-atting underclim~lte landscape and sea level conditions different from today During the Wi~consinan (Weiehs~lian) glacial sea level stood mueh lower with a minimum of 130 m beiow present sea level during the last glacial maximum (LGM) from 25 ka to 15 ka BP(Figur~middotlttl) The Pleistocene surface was eroded and resuhed in a topograshyphy of clay plateaus disseeted by gullielt and rivers Climate during the LGM was colder and dryer The large eoaslal plain of that lime was covered by grass and shruh savnnltlh- ~jmilar
to those in the present savannah Recharge in Ihe Pliocene sand outcrop (prc-ent savannah belt) is estimated at 200 mma (at present SOO mma) Paleohydrologic1I conditions were much different In the coastal plain the incised SaramltlccltImd Slifiname rivers (about 10 m incision near Paramaribo) lowered groundwater hcads in the Pliocene aquifer inducing widespread recharge from the overlying clay plaleaus (Figure 4 1)
The lalter assumption was conflmled by simulating the paleohydrology wilh a groundwashyter model The model shows that the secondary topography of Ihe eroded river vallcys created secondary flow systems superimposed on a regional primary now syslem (Figure t7) Despite the large hydraulic resistanee of the Pleistoeenc elays in the cOllstal plain (gt I x IO~ days) recharge rates reached values of 40 to 60 mma The paleohydrologicalmodel showed Ihltu
groundltIter e~idelllx til1le~ ill Ihe regional primary nIW ySlllll was not sllltidllltltl nush bracki~h or saline water (rolll the lql1ifer~ ngure 461 II appears tht till more dYIIllllil Sllshyondary ~ystell1s wi1l1 Ihe mallcr residence times rdated III the lrosiOIl hpography arc esscntishyal for cxplaining thc pre~cnt-day occurrence of lllChorIC lJOUlltWtICI Im o1T~hore
S(lliialfiol dlrillg rhe -lolInI( fnlllHrc~middotilJl1 (ChOPf 5)
Dl1rin~ Ihe I-Iolocene tnlllsgre~sioll in Surinlllle the se1 lncroached the Pleistocene coashystal plain with a speed or 3 [0 ISO Illa Thl sllbvcnical freshsaline grllllllllwtll intlrfacc nelr the Pleislocenc coastline l o 1ll00ed hl11dward Howecr carlier inestigatiolls shoed lhat the density-drilll Ilnriolltal disrllcelllclll or thl interface cOllltillot keep llP Wilh such a rapidly 111ignuing iosllil1l WhCll ill such a situatioll like in Sllrinallle saline ~rollndwatel
overlie rrcsh groumlater dlI1 ani alinilation lakes place hy convcctive dlnsity curshyrellls lnd diffusioll (Figurc 5i l Ikcause lile former is a very rlpid prl1ces and not in areshymllH Wilh the prescllee of Ille lllshore lllcteoric groundwater hody dilTllsive solute IlanSport is assumed 10 he Ihe main salinilIioll proclss in the SUrini111le coastal plain This hypotheis has hlcn veri tied lly sl1dying chloride COlltllltratiolls and chlorine-isolope ratios (8 11 (1) in groundwater Irom elb and ill pore ater ffOllllhc Quaternary clays sampled atlwo sitls in the coaslal plaintKl1ewarlsall and TOllrlonnl) Thc analyses were compared with simulashylion wilh i1lllodelthat incorporatcd crtical difrusive sol me trallport related hy the Early Holoclne Irallsgreillil and Late Holoccl1l regrcssion and Holoclne edimentalion (Figure )2 and iJl Tran~rcssiotl~ a 6 ka alld 10 ka BP for Koewarasan and TOllrLOllne respectishyvely IS well i1~ sedil1llntation ratc- of 2Y alld 26 1I1111a were cSlltlblished on tllc hasis of radioearhllll dating Simulated verticl profiles ltIre in good agreement with the analyses when all effective chloride difrusion LollTiciellt 71O- 111 l11~s and a fractionalioll factor for the chlorine isotopes of 1J027 Wlre applicd Thegte values arc within the ranges reported in difshyfusion studies and stlppmt lhc hypothesis The regrcssion dales established by the diffusion model are also quite rcnlistic ct I ka BP at Kocwarasan and 05 ka BP at Tourtonlle
Sillltllltions and analyses indicate that dirfusive salinlliltion has penetraled to a maxishymum depth or IDf) to ISO nl (Figure 531 Below 125 m conccnlrlIions of cl110ridc illcrelse gradually with depth (Figure ~5 38 and 541 These salts have riseJlupwmd from the Cretaceous sedimcnts by diffusion and transversal dispersion activHed hy deep regional now systems during regression CIltlY seals hove oil reservoir sands in Slirillallll in the lower pan of the Tertiary ohsln1cted transverse di-per-ion of meteoric groundwater lo The anomalously low salinities abl)c these dly seals and the steep slIinily gradients in the clays (Figure 5A) suggest thaI the salinity profiles may he uscd ltIS proxies for the prlscnee of day seallt which Illay possihly art ltI stratigraphic traps for oil r(servoil~
Hydlogc(chellli((f signals (ChaIJer (j)
The hydrochemistry of groundwater in the coastal plain of Surinamc is mainly dctermshyined hy the degree or diffll~ive lIlixing with salts or advective miing with saline gnlllllLlwamiddot IeI Pristine meteoric groundwlIer in the Tertiary sediments (CI contellt lt 50 mgI) is only found in thc savannah hell and below the Lelydorp sand (Figl1le 15) Becausc of the low reactivity of the Tertiary formations pristine groundwaler hasically has retained a rainwat~r
composition transformed mainly hy evapotranspiration and uptake of earhonmiddotdioxide in the soil zone (Figure 61) Consequently 1110S1 groundwater dso mixed types is acid (pH lt 65)
136
illld uld~r-hlrat~d with r~sp~~t to ~allite Oxidalion of sedimenl organit maier (SOM) hltlS raiscd lhc initial dissolved innrgallit carbon contcnt (TIC)
The Plehaocene days in th~ southern pltlfl or lhe couslal plain which remained oUlside Lhe inllucllle of the Holocene transgression have very dilllle pore walers and exchangeubk cations which are dmninaled hy magnesium (Figure 6H) This is an indication for cation exchangc since sodium was the dominant exchangeahlc cation at the timc of deposition during thc Slillgamonian transgression Simulations of vcrtical solute tmnsport and cation exchangc in these days during 105 ka of the Wisconsinan regrcssion showed thai diffusive solU1C lransport could nol have driven uut III sodium from the exchange ites (Figure 69) Only dowllwilrd mlvcctive transport related to a rechmgc of at Icast 5 mma could have had this ellcrt This supports thc rondusion from paleohydrologiralmodeling (Chapter 4) thaL widcspreld rcrharge must have orrurred during the Wisronsinan despitc the hydraulic resistance uf the days Th~ high ronlent of exrhangeahle magnesiulll is the result of the equilihnHinll bctwccn cxrhl1lgc siles and very dilme infihration watcr with relatively high lllagllcsiulll rontcnt (rainwillcr signature)
Groundwater in the PleislOcelle and Neogene sediments which are inlluenced hy salinshyiwtion (CI gt 50 lllgl) is characterizcd hy a sodium delidl balanced by ckium and magneshysium exccsscs (Figure 610) This is dearly the result of ralion exchange accompanying [he diffusive salillilation Simulations of downward diffusive solute transport (salinizalion) and calion exchlIlgc frum the saline Holocene reproduced thc ohserved cation compositions (Figures 61) amI614l Cation exchange is [iking place mainly in the Pleistocene clays where rllioll exrhangc clparitics are two ordcrs or magnitude higher than in Ihe Teniary formations In Ihe Tertiary formations mixing only occurs between the pre-existing groundshywater (palcogroundwater) and dmvnward diffusing sllts The Paleogene sedimeuts at deplhs greater llwn -125 III rontain grouudwater wilh a sodium cxcess (Figure 611 and 611) which is it sign that the salls in Ihese sediments have not heen lransponed by ditTusion from ahow bUI tbat lhey prohahly originate from the deepcr saline Crctareous sedimcllis This supports Ihe cOllclusion from rhloride and chlmine-isOlope modeling (Chapter 5)
[llto[lie sigllals (Cla[Jlaquo1 7
High tritiulll contcns indirate thlt groundwater in the Pliocene sands of Ihe savannah helt is of rcrent age (after 1950) and cirrlIlucs in syslems with shorl residcnce times Rmliorarhotl dating of grollndwalcr - rorrected for deld carhon dissolution (SOM) and ICIllshy
pond rhangcs in atmospheric I~C lrlivity - shows that groundwiHcr in the coastal plain i~
generally older thiln I ka BP (Figl1le 76) In the Pkistorene eOilslal plain Late Holoccne groundwater (I to 5 ka BP) is found in the upper part of lhe Pliocene formal ion Dceper groundwatcr dates from Early Holocene to Late Wisronsillilll The suhhorizolllal position of the isochrones suggesls tllt pulcorecharge was nol ronlined to the present recharge areas of the savannah belt and he Ldydorp sands The groundwuter ages corresJlond well with the groundwater now systems descrihed in Chapter 3 and 4
Thc OIC valucs Ill dissolved total inorganic carbon (TIC) ill grollndwUlcr in the coastal plain 1~111 in thc range hetween -17 0 -20 Simple mass-balanre caulmiolls based on the hyllrogrorhcmic1l proresses dcscribed ill C1mptCf 5 lead to the conrlnsiOI that ODC of dissolshyved rarh(lll diJxide in inliltfating grllllndwatcr lllUSI have becn relatively high (around -10 7c) during Latc Pleistocene ami Early Holocene (Figure 71) This is allrihut~d to a pakovegetashytion ronsistillg mainly of plants with II C-l- photosYlllh~tir pullay (mostly grasses ilnd sedshy
ges) though C3 plants dominate the present natural vegetation in the coastal plain The cone sion that grasses dominatcd the coaslal plain during the LGM amI Early Holocene is consiStl with the results of palynological studies Relics of these old grass savannahs in the coastal plain have survived in the savannah bclt An inventory of all major plants species in the pres ent savannahs leamelllhat almost all species indeed belong to the C4 group (Annex IV)
Monthly weighted averages of stable iSOlopes (61amp0 and o2H) in rainfall in the nearb stations of Cayenne French Guiana and Belem Brazil are negatively correlated with mQ[ Iy rainfall (Figure 79) This relation is commonly known in the tropics as the amount effect However il seems 10 be all artifact in this case as lhe relation largely disappears h analyses of daily rainfall al Belem (Figure 710) Isotopic variations are associated with Sl
sonally changing weathcr systems and source regions of water vapor Average slable-isOlope composition of Holocene groundwater in the coastal plain 01
Suriname is depleted with respect to the average composition of rainfall at Paramaribo (Figure 711) The depletion is attributed to groundwater recharge in wet months with rel vely low iSOlopic ratios GrOlmdwater of Pleistocene age is even ore ep resp to Holocene groundwater and rainfall (Figure 711) The LGM w (ioC c~er t Loda this region but does not explain lhe isotopic depletion in paleopr ~itaLiol ThQ atial temporal relationship betwcen stable iSOlopes of water and temp Jrur~ c~mo mld( latitutles is absenl in lhe (sub)tropics according [0 many other s ~s~tamp ~r~ ely t rccharge lhcll was restrictcd to the boreal summer monsoon (M ~ JtilgWgtIgt8w~ h ha~ most depletcd wins ~ased on the present egime (Figures 79 anp3~~~ ~s~~ ologtlt studies and global c111natc modehng studIes report that ramfall l~tnSejorewSs ower I
more seasonal at the end of the last glacial 3~-EI~ amp g 8 c-~Io)~
ttl C) Q ~ Q1-J~ cn~cshyCJ ClI gt C ~IParl II Generic investigations ~ ~ I ~
1 Q ~ ~i ClI = - IOjTlOre meteoric RIOIIIUWtef (Gllplel 8) em omiddotcE~ ~ shyThere are worldwide numerous accounls of fresh to m dWate4yLiracki~ ubmarin
0fOundwaler Thcse observaLious may be related to 0) large Jimariti spri~ ohen fOl ~ear coasts with karstk limestones Oi) diffuse submarine aargereg c1as~J coasts (d~ ted by trarers) or (iii) offshore boreholes whcre pore-water analyses or res~ ity loggil
have been carri~d out (Figure 83) Generally the observations do not conclusively answer the queslion whether offs
meteoric groundwatcr belongs to an active Lopography-driven flow syslem with onshor recharge or to paleogroundwater formed by extinct now systemgt Occurrence far offsh (gt 50 km) may be a sign of paleogroundwater whereas meteoric groundwater dose to shore especially observed as submmine discharge is probably related to an active coa
low system The geological conditions or the coast and continental shelf in Suriname are by n
means unique This in combination with the fact that Olher occurrences are found all c the world strongly suggests that offshore meteorir groundwater is a very common phe
menon lhat may well he rule rather than exception
The offshore extensiol of meteoric grOllluhlllter (Chaprer 9)
The question whether offshore meteoric groundwater is part 01 an activc topographyshydriven flow system or paleogroundwater has been addressed with an analytical model The Sharp Interface Model (SIM) determines the length of the offshore extension of fresh groundwaler in a semimiddotconfined aquifer with onshore recharge and submarine groundwater seepage The New Approximate Model (NAM) u-es the SIM model but takes into account the downward diffusive salt transport through the aquitard which counteracts the upward seepage The approximate offshore extension of fresh water is according to the NAM model equal to the distance offshore wherc the diffusive transition layer becomes large enough to creale convective density eurrents in the aquifer (Figure 91) The coaswl now domain may extend somewhat beyond this poi Ill but groundwater is brackish The SIM model approximates the outer limit of this zonc
Sensitivity analyses with the NAM model demonstrated that fresh groumwaler geneshyrally does not extend more than 5 km offshore except whcn cxtreme values for model parameters are adopted Sensitivity analyses with the SIM model indicated thH the offshoshyre extension of the brackish groundwater tongue will not exceed 50 km Applying the chashyracteristics of the coasts of Suriname and New Jersey to these models learns that meteoric groundwater found offshore must be paleogroundwaler
Flow and sat tronsport ill submarine groul1dul(rer (Chapter 10)
In coastal and offshore sediments inverse groundwatcr densily stratifications may arise where (i) there is offshore outnow of fresh groundwater in steady state coaslill now systems or (ii) where fresh sediments become inundated by the sea during a transgression which creates an unsteady-state situation The dynamics of these situations have hcen stushydied in three numerical models simulltlting variable density Ilow ltmd solute transport by advection dispersion and diffusion
Modell served to investigate the offshore salinity pallerns for the situation of steadyshystate offshore outflow On the basis of model experiments three zones can be distinguished (Figure 103)
a proximal stable zone of fresh groundwater where high upward seepage ratcs prevent downward salinization by diffusion and convective density currents an intermediate zone with moderately brackish to brackish groundwater where convecshytive density currents arise continuously although groundwater is brackish there is still a net seaward topography-driven flow of groundwater in the landward part of the intershymediate zone fresh groundwater can s(ill be found at the bottom of he aquifer a distal stable zone with brackish water where density differences are too small to trigshyger convective density currents here topography driven now and upward seepage have become very small
The length of the proximal stable zone corresponds with the length of the fresh groundwater tongue calculated by the New Approximale Model in Chapler 8
The changing salinity patterns following a marine transgression have been investigated with two different models Experiments with Model 2 simulating the effects of a sea encroshyaching on a slightly inclined continental shelf showed four differenl modcs of salinization
Modc I middotmiddotHorizontal scawaler Intrusion in thc 1)fIn of the slow landward migration ulthe freshsaline transition zone or middotmiddotinterfacemiddotmiddot (Figure 105) Rclcrring to the reccnt IlolocCllC transgrcssionthis intrusion mode was not (he dominant process in most oltl1e
offshorc aquifcrs The transgr~ssioll speeds during the Early Holocene for many contishynentall11argins wcre far higher (gt 100 Illa) lhan the critical transgr~ssi(ln speed at which the interfacc could kcep pace Mode 2 Vertical scawater illtll1~ion by convcctivc dcnsity currents Wigure 106) This mode occurs for ~llp]Icriticaltransgression ratcs and relativcly high-permcability SllhshySlrlle sediments (sandsilL) A widc high-salinity transition zonc develops This rapid intrusion modc can keep Lip een with rapidly advilncing shorelill~s
Mode 3 Vertical scawalcr Intrusion by diffusion (Figure 107) This Illode occurs for supra-criticaltransgressiun rates and low-pcrmeability substrate scdiments (siltclay) up to greal depth An cxtcnsive seaward dipping fresh-water wedge develops hclow a thick almost venically layered transition ZOIlC Salinization is mainly controlled by downshyward diffusion This intrusion mode is restricted to shelf sedimcnts with vcry thick clayshyey sediments below the sca noot Mode 4 Vertical seawater intrusion by convcctivc density currcnts of low-salinity rinshygcrs (Figure 108) This mode occurs for suprtHriticaltransgrcssion rales and a layer of low-permeability sea-floor sedimenls (sillclay) overlying a relatively high-pcrmeability aquifer A wide low-salinity transition zone develops in the aquifcr resulting from COIlshy
vcctive density currents whilc a relatively sharp diffusive boundary layer is present in thc ovcrlying low-permelttbilily lilyer
Thc second intrusion mode explains the presence of high-salinity groundwater in thc exposed sandy aquifers in the wcstcrn pan of the Netherlands which was inundated during lhe Early Holocene Mode- 3 and 4 cxplain thc tcmporary preservation of offshore meteoric groundwater Although the dimensions of the modcl arc small lhe same process explains the presence of vast hodies of mcteoric groundwater far offshore along the coast of Surinamc thc Nctherlands Indoncsia (Jaa Sca) and the easlern USA (Chaplcr H)
Experiments with Model 3 simulat~d the lransgression of the sca over a hilly tcrrain with a substratc of all aquifer covered by a clay layer This lerrain reprcsents lhc dissectcd landscape of thc cxposcd continental shelf off Surinamc during thc lasl glacial (Chaptcr 0 During lhe transgression the valleys become submersed alld form cstuarics Salinization only starts when sea level in a alley has riscn 10 certain level and fresh groundwater secpagc in he alley has diminished (Figurcs 109 and 1010) As soon as the entire landscape becomes sllhmcrged the now ystem reverses The rcmaining fresh and moderately hrackish glOundshywater is slowly expelled via seepage from (he former hills or platell1s either as L1ilTuse scshypagc or seepage through a pcrmcable mne (101)
The cxpcriments wilh Model 2 and 3 show thatmetcoric sublllilrine groundwatcr call be preserved as palcogroundwmer for lhousands of years after the suhmcrsion or thc landsshycapc The waning of the paleogroundwaters is an ongoing process Some nhservatiOlls of groundwater dischargc far offshore may he relatcd to this process
C(mdlldillg III(k~
The overallmcthodology of this study is a typical example of an associltive approach where data and methodologics from varlous earth sciences needed to he combined in order
140 141
Ul umlerstaml mort abmn c()astal nd offshore groundwattr This associ at ve approlch is
essential to the science of hydrology as the characteristics of waler are continuously chanshy
ging while it circulatcs through - and inleracls with - all compartlllCllIs of the atmosphere
lithosphere and biosphere
During the hlst years this stUlJy has triggered new idtltls ror research in related subshy
jelts In this hcsis variahle density l10w and transport modelling focus on salinization proshy
cesses HowcVlr much still needs 10 be learned frmn modelling of freshening processes Oil
geologicaltime scales Also s~linization mechanisms in more complex layered sedimentary
ellvimnmeills require fllllher rcsearch hOlh hy lidd studies using chemical anJ isotopic Irashylers and lllodelling experimcllts
As for the exploration nl nffshore meteoric groundwater ilpplicalion of nlpiJ geophysishycal surveying tecllniques blsed on Tnll1sient Donlain Eltltromagnelics ltTDEM) Ind
Shallow High Resolutioll Seismics (SHRS) is under investigation
More insight into the suhmarine disharge of offshore meteoric grOlmJwlttr lllay hewshy
me relevant in unJerstanding proctsscs relateJ 10 gas hyJralcs unJerneath the sea 110m
marine ecology and thermo-hal inc cirulation in Iht seas
One of the reasons for choming the coastal pllin of Suriname as a case slUdy was the
occurrencc of meteoric grounJwater extenJing 90 kill inlo Ihe offshore sedilllerus The work
in this thesis shows thaI this phenomenon can no longer he consiJered ltIll otldity but may he
lbe rule rather rule tlwn eXleption on a glohal slllle This offshore Illtt~oril groundwater
Illay hecolllc iI valuable walt~rmiddotsupply source for dcnsely populated coaslal areas where
waler reS(lunes arc heing overexploited or polluteJ Treatment of lllcteoric groundwater may
involve Jesalination hut is still 111l1ch cheaper than desalination or seawater This idel is curshy
rently heing markcted at the 1110l11cnt by a consortiull1 of commercial tOmpanies anti (he
Vrije Universitdt One wuld mguc th( this resource is nOll-renewable and tlut its exploilashy
lion is ul1-lswinahle But in III opinion this principle is not valid here as these bodies of
llffshon palcogrollntlwater are so large that they could sustain coastul POPlllltioJls for hundshy
reJs to thollsanJs of ye lrS In adJition Ihese Illttemic waters wOllld graJuully disappear anyway hy llatlful salinization processes
References
Airey P L Calf G E Campbell B L Hartley P E Roman D and Habermehl M Abull 1979 AspelLS of lhe isolOpe hydrology of lhe Great Allesian Basin Australia In ISOIOpe
Hydrology 1978 IAEAlUNESCD Vienna 205middot219 Appelo C A J and Postma D 1993 Geochemislry groulldwater and pollution Buikema
ROllerdam 536 pp Appelo C A J 1994 Calion und proton exthangc pH variatiolls and carbonate reaclions in a frc
ning aquifer Wmer Resources Research 30 2793-2805
~rad A 1983 A summary of the arlesian coastal ~asin of ~uyana Journul ~f Hy~~olo~y 63 299shyegt Augu~inlls P G E E 1978 The changing shoreline of Sunnum PhD IhcslS RIJksuOlversllelt
Ulreeht 232 pp eYuguslinus P G E F Hazelhorr L and Kroon A 1989 The chenier eO~1 of Suriname mod~n
and geological developmcnl In P G E F Augustinus (Ed) Chemers and cheOicr plalm
Marine Geology 90 269-281 Badon Ghijben W 1888 Nola in verband met de voorgenomcil putboring nabij Amsterdam
Tijdsehrifl Koninklijk [nslituUl voor Ingenieurs Verh 888-18898-22
Bcar J and Dagan G 19M Some exaCI solulions or inlerfaee problems by means of the hydro
melhod Journal of Geophysical Research 69 1563-1572 Beekman HE 1991 lOll ehromalOgraphy of rresh- and seawU(er intrusion mullieomponenl disp
ve anrJ diffultive transpor in groundwater PhD thesis Vrije Univenliteil Amsterdam
pp Berger AL CI al (Eds) Milankovitch and Climate Parl 1269middot305 Remer R A 1980 Early Diagemsis A Theorclical Approach Princeton University Press 241
Belhke C M Harrison W Jbull UpSOIl C and Allaner S P 1988 Supercomputer analysis of SCI
menlary basins SeienLC 239 261-267 Bierman P R Albrecht A BOlhner M H Brown E T Bullen T D Gray L B and Turpin
199~l Erosion weulhenng and sedimelltatioll In C Kendall and J McDonnell (Eds)
Isotope Iracers in Gltclmlt1l1 hydrology Elsevier Amsterdam 647-678 AoslIla W Kroonenberg S B Maas K and De Roever E W E 1983 Igneous and metam01
e complexes 01 the Guiana Shield in Suriname Geoogie en Mijnbouw 62 241-254
e Brinkman R al~ Pons L J 968 A pedol1mrpho~ogieal da-sil~eali~n ~nd map of I~~ Holoee l1Ie11S III the coaslal plalll oj lhc three GUlanas Netherlands SOli Survey InsIUlc
Wagcllingen The NeLherlllllUS Soil Survey Papers No4 40 pp Brinkmanl1 R Eichler R Ehhal D anrJ Miinnich K D 1963 Uber den [)cueriumgehalt vc
Niedcrschlal- und Grundwasser Nalurwissenschanen 50 611-612 BrooK GA Folkoff~ME lIld Rox ED 1983 A world model of soil carbon dioxide Eallh S
Procegtses 8 79-8M Brouwer L C 1996 Nlltriell f)c1ing in prisline anrJ logged rain rOreSl A study in Guyana P~
G lhegtb UnivcrsilY or ULfCdu 2-l pp Bruijl1cel LA 1990 Hydrology Ilf mui-I lropical foresls IIlld clrcclS of lonversion a Slate 01
1cu~c review UNESCDIIAHS Nelhcrlanu- lHP CUlllmiuec 224 pp
Burke WH Denison RE Hetherington LA KIJpl1lck RB Nelson Nr alld Olin JB I()X~ Vnriaion or scawJtcr -ISrfuSr lhroughmll Phancrnolc lime Cieology 10 i 16-51 tJ
Cable J E Bugna G C RUnlen W C ltIud ChlI1lon J P IlJl)6a Applkation of ~~Rll and CH J for
assessment of grmllKlwltcr dilcl1lt1r~c tllhc cOltls[d ocean IjrllllOlogy and OcclI1lgrlt1phy~
1347-1353 Cable J E Burnctl W C Chanlol1 J P lind Weatherly G L 1996h E-til1laLing grnlllldwulcrdisshy
charge into northeastern Gulf of Mexico using radon-222 filnh and Planetary Science
Letters 144591-604 Cable J Ebull Burnett W C ilnrJ Chanton J P 1997 Magnitude and varimions of groundwater oCCP
ge along a Florida marine shoreline Bioctlchcmislry JR IR9-205
Carslaw HS and Jaeger JC 1959 Cunduttion of heat in solids Oxfonl Ul11vcrslty Press London
m~ T E 1984 The smble iSOlope composition of modern soil CiJrbOnlle ami lis relutlOnhlp to CerImiddotmg
climate Earth and Planetary Science Leiters 71 229-140
Cerling T E Solomon D K Quade J and Bowillan J R 1991 Oilibe isotopic composltloll of
carbon in soil carbon dmiddotloxide Geoehimica et CosmochimiciJ ACla 55 3403middot3405
C M 1993 Nature of environmental changes In Somb America at Ihe lasl glacilll maxi-o CIappenon mum Palaeogeography Palaeoclimatology Palaeoecology 101 1R9-20R
Clark 1 D and Fritz P 1997 Environmental isotopes in hydrogeology Lewis Puhlishers New York
m~ Clark J F Stute M Schlmser P und Drenkard S 1997 A trucer study of the Florllhn aquiler In
southeastern Georgia implications for groundwater now and paleoclimale Water Resources
Research 33281-289 Clark J E Davisson M L Hudson G B and Macfarlane PI 1998 Noble gaes stable isotope
and radiocarbon as tracers of now in the Dakotu aquifer Colorado and Kansas Journal of
Hydrology 211 151-167 e Cohen A and Van der Eyk J 1953 Klassillcatie ell ontstaan an stvallnen in Suriname GeologiC en
Mijnbouw 15202-214 Cole D R and Monger H c 1994 InOuencc of atmospheric CO~ on the decline of C4 rlants dUring
the last deglaciation Nature 36R 533-536 Cook P and Herczeg AL (Eds) 2000 Environmenml Tracers in Subsurface Hydrology Kluwer
Academic Publishers 529 pp Cooper H H bull 1964 A hypothesis concerning Ihe dynOlmic balmce of freroh aml salt water in iJ coastal
aquifer In Sea water in coastal aquifers US Geological Survey WOller Surply Parer 1613shy
C I-II Cronin T M 1983 Rapid sea level and eli male change evidence from continental and island marshy
gins Quaternary Science Reviews I 177-214 Crutzen P J and Andreae M 0 199U Biomass Burning in lhe Trorics Impact on Atnmsphenc
Chemistry and Biogeochemical Cyeres Science 2501669-1678
Custodio E 1987 Groundwater problems in eoastlll areas Studies in hydrology Nr 45 IHP-UNESshy
Co 645 pp DallwilZ M J 1980 A general system Cor coding taxonomic descrirtiolls Taxon 29 41-46
Dallwitz M J Paine T A and Zurcher E J 1993 and onwards Users Guide to the DELTA
System a General System for Processing Taxonomic Descrirtions (4th cd) CSIRO DIVISIon
of Entomology Canberra httpbiodiversityunoedudeltaJ
Dansgaard W 1964 Stable isotores in precipitation Tellus 16436-468
DAudretsch F C bull 1953 Recentc Waterboringen in Suriname Mededeltng Geologlschc
144
1Ilijllh()llkllll(LgC Diln t Silrinallll No 10 I-I~
Ihjlj(lrJ 1 and Tnllnbtlrc S_ E ItJ)5 Ga~ dirrusIilY and pmdllclion (lr(o~ in dlell stlih of lhl
cl~llm Amlon Tetlll~ ~7B 1middot16
Dl~altlnilmiddotr~ D E Cherry J A alld frill P 19-11 Origill age and 1l1llemCIll Ofr1lrl watcrs ill argilshy
Iannll QUHCn1ary dep(~ih al four ~ite~ III S(llllhc~lern Ontario JotlnJal lr lIydrolngy 50
2~ 1middot27
D01llcnico PA and Rohbins (jA 19-5 The dis[lkln1111111 o(connate ater~ from aqllikrs (ilol
SOl Irner Bull 9( 32~-3 ~5
Dc J(l~~elill dc Jong G and Van [)lIijlJ C1 191laquo1 Transcloc disrersiun from an originally sharp
fresh-salt irHcrfacc GlllSIl h~ sh(r low Journ1I of I-Iyurtllo~y R~ 55-79
Dc Vleller D R ]Cmiddot1 G 1 J md Krlllllknhlrg S J1 IlJl)R Researlh intn the IrecalllbriUIll of
Suriname In~ T E Jilg D R De Vktltr L Krollk_ J 1 S ZOllllevcld and 1 VlIllooll J
(Ed~) The hi~tnry or larth sdellc ill Sllrinulle Royal Nethcrlallds Academy If Arts lnd
Sciences Netherllllds lnslitllll Ilf Aprlied GClseielllC middotrNO 15-6~
Dc Vric~ J1 197~ Groundwater nnw ~ystems and strealll nlts in IIle NClhcr[llIds PhD lhcis Vrije
Ulliersilcit Amslerdam
Diodato Drl 1997 Soflwltlre SP(lllighl GroUlluwatcr 35 912-92l
Dixon V R 197 J Some Jspecl~ of lhc cmlstal artesian basin ncar Paralllaribn Mctlcdding
Geologi~che Mljnbouwkundige Diell~t Suriname 11 167-175
Dutton A R I (95 Grmllldwller iSOlOpic evidence for raleorechlrge in U S Hi~h Phlins l(luifcrs
QlIalcmary Research ~J 211-211
ElIcmm J H 197~ Groundwaler hydraulics of etensive aquifer~ I nlcmJti(mal Illslilute for Land
RcelulHJlion JIld DrJinage Bulletin Vageningen 216 rr
Edmullds WM Uld Wlloll NRG 19X1 The Lincolnshire limestone - HydrogeolhcmiLal cmlUliOll
l er a len-year rerjlld Journal of Hydrology 61 201middot211
Eggenkamr HGM 1994 The geochemistry of chlorine isotopes PhD thesis Geologica
Ultrilicctina Uniersitcit vall Utrecht Mededclingen viln de Faculteit Aardwetell~lllprcn
No 116 150 rr
Eggenbmp H G M Middelburg J J and Kreulen R 199~ Preferential diffusion of middotl~C] relalivc
to lICl in sediments of Kau l3Jy Halmaher Illdonesia Chelllilal Geology 1161 17-125
Ehleringer J R Cerling T E ilnd Hclliker R R 19(7 C4 rhowsYlllhesis l1l1lOsrheric CO and
dimate Oecologiltl 112 1R5-Q9
EislllL D and vall der Marc H W 1971 Marine muds llong Ihe GUYl1l COISI lIld their origin from
the Al11ltlWll ha~in COllr MinerlIngy and Pelfl]ngy1 I 21-04
Elder JW 1968 The unstable ltcrmll interrace Journal of Fluid Mechll1ks n 6lt)-96
Engclen GB lI1d Kloosterman F H 1996 Hydrological syslell1s lllaly~is Kluwer [)onlrecllt 151
rpmiddot Essaid H J 19R6 f cOlnrarisoll of the lnlpled fresh water-salt water now llllllle Ghijllen-Hcriherg
sharp inlerface approaches to modelillg of transient behavior ill co~~I1 aquifcr systems
Journal of Hydrology R6 164-193
Essaid H I 1990 A multilayered sharp inlerfl(e lllodel of coupled fre-hwllter ami sltwalcr now in
coast11 sySlems model devclopment and lrrlication Willer Resources Researeh 2Cl ImiddotU 1shy
1454
Fairhanks R G 19R9 A 170()(l-year glaciHU~latk sea level record inlluence of glaciallllelling
rates on the Younger Dryls eltf1l and deer-ocean circulltion Nature 3-12 637-6~2
Faure G 19R6 Stahle ISJIOpe Geology (211d cd) Srrillger Vertag Berlin 5R9 rp
Forti M C alld Neal C 1992 Hydrochemical cye1c~ ill trorical ruillf(lresls an overview wilh
clIlphmiis on CllIlml Alllcritt Journal of Hydrology 13-1 lO)-IIS
Gs Fmppil M ilild Pujus Mbull IWooL Laic Quaternary evolution of the French Guiana cnillinciltal shdf Evidence from 35 IH data Marine Gelllngy 121 231-2-15
Gdrnacrt W ItJ6lJ Pnlimilllly rcpDlt ntl hydrOlhcmical investigations in the Westen] Netherlands Geologic ell MijuhollW -H 2-19-25-1
Gyh M A and SMller B I tJHlJ GroundwOllcr analysis of Cllvirnlll1lCntal carhon and Olher isot()pe~
froPl 11Il Jakma basin ilquifer Indonesia Rmlimroorl J I 919925
Gihhs IJ l1J67 Tile GClchcmislry (If tllc AI11ltltlll rilr sylclll pn I The faC(lfS thill CUrlIn)] the
Ialinity tIIl the cUlllpnsilion ltllld the Cllllcclltrltnillll or lilc sllspended solids Geo Soc Am
Bull 7H 1203-1232
(Jilskt J M J 991 Dt nurspnlllg van hel hmkke gmndwaler inllel IJsselmeergebied diffusie disshy
ptri of dihtheidsslmlnillg H~O 2-1 I HH-19J
(Jlmr RE 1959 The l1luerll of rrcshWltllcr now in ltl coaslul lquifcr Joumal or (Jllphyical
Rescarch (H middotLW--+75
Grathwl1hl P 199H Diffusioll in nalJral pt1nlus media conlaminalll transporl sorptiDnJdesorplitl1l anu
dissolulion killetics Kluwlr Dmurldu 22-+ pp
GrimOlldi c 19HH Origine de la cOlllptlsitinll chimillue des eaux suplrlicielles en miliLutmpical
humide eXllIplt ue UCliX pelils bassins versants sous forel ell Guyane FrancaisI Sci GeoL
Bull -+ 12-+7-2(12
amp Gmen L 199M Ilyumgeulogical invesligalions in SUliname III T E Wong D R De Vlellcr L Krook J I S Zonllcvcld anu A J Vl1l LOOll tEdsl Thc histmy or eilnh sciences in
Surillill1l Roy1 Nelhcrlanus AlltldeIllY of Ans anu ScicJllcs Nelhcrlands Inslitme of
Allplild GllIsliCllcc TNO 129-17-+
jGrocn1 VLmiddotsla 1 llIJ Mecslers AGCA bull 2000a SaliniJalioll prolessc in palcowalcrs in coaslal
sCllilllLnls nf Suriname evidclUc from dmiddotlJe lIlalyi~ anu uiffusillll llloueling Journill of
Ilydrtllngy 23-11-20
JGroen L Pma V E A Knlli 1-1 and Hcmker CJ 2000h Palaeohydrogeolngy of Ihc ~euil1llnlary plainllf Suriname In Pn11lcdings Trarlmiddot21100 Conferencc 011 Tracer and MmJclling in
Ilydmgelllogy Liege IklgiuJIl IAHS Puhlilmiddotillion No 6 -+ 17- -+2-t
bull Guglielmi Y and Prieur L 1997 Locating and cstimating suhmarine freshwater uj~chMgL frnm an
illler~titiallllnfined lOOlSIOiI alluifer hy llllasurcments at sea eIampk fWlll lhc 111er Val alshy
ley Irancc JOlll1wl of Hyurohlgy ll)[) I [I-I
1111011 tl J 19HI GClllllgic illlli pLlnleulIllnOilysls tlfille Suriname colgttal regitlll Slaalsnlic
t-1aahlhappij SUIinlI11e N V PmltLlllariho Suriname
llarrillgltill P K 19H5 Illllilatitlll til podJllltlrh hy ptlre-waler escapc Mlrinc Lcllers 5 193-197
IIl1Tisllll Y J l1ld SUlllllIL I L 199 I Paleohydrology of IhL Gulf llr Mlxilll Basin Alllerica
Jllurnal l1f SCicllll 9 I I(l9-176
lIartmanI 19h1) The 11ly I1linerab ffllllllhc boring AlIialle-2H Surinam Geologic en Mijnhouw
-+H 121-1-I
lInlly Jr Pllag CW Valenline Pc Miller)ltE Sdltllll DM Mlllhcim fT Kohoul EA
Bnlhnl( MH and Smgrcy DA 1979 US Gcolngical Survey Core urilling un lhe
Allanlit shelf Sciellcc 206 515-527
1kOl1l11 T II E Talma A Sbull1lld Vogcl J C 19H6 Dissolved gls pleohlIpCmlmcs and dl~O variashy
liun derivld Irum groundwaler IIcar Uilllhage South Africa Quaternary Re~erch 5 79shy
SH
1kllry II IL 1-1- Elkc or di persioll nil salt cntroalhme1l1 In waslal aqullcs In Sea waleI in
colslal aquilers US Geolllgical SurLY Water-Supply Paper 16tl-C 70-H-+
Herlberg B 190 I Die Waserverzorgung einiger Noordseebader Zcitschrirt Gasbcleuchlung und
Wasserverzorgung 44 815-819 und 842middot844
Hcyligers PC 1963 Vegetalion and soil of u white-sand savanne in Suriname The Vegelution of
Suriname Ill PhD Ihesis Vcrhandelingcn Koninldijke Nederlandse Akademie van
Welenschappen Serie 1 deel 54 148 pp
eI 110 Len Fm A G bull 1986 Waler innuence on h~avy crude oil production A qualilalive assessment t 0863) Stamsolie Maalslhuppij SurinamI NV
Hua Aihing 19 The impact of hislorilal sea level changes to groundwltJtcr in Shungbai China
Geological Review 44 220-224 (Chinese)
Hubben M K 19-+0 The theory of ground-waler mOlion Joumul of Geology 48 Part I 785-94
Hutchinson C B 1990 Analysis of grouudwater now in the A-sand aquifer at Paramaribo Surina
Soulh-America US Geological Survey Waler-Resourles Investigation Report 90-4036
pp jiuyacorn PS Anderson PE Merlmiddoter 1w and While Jr HO 1987 Saltwater intrusion in aquif
Y developmenl and testing of a three-dimen ional linile elemenl model WaleI Resources
Researdl 23 293-312
IAEA 1 I Slable isotope hydrology deuterium and oxygell-IS in the waleI cycle Technical repl
scrics no 210 Internmional Alolllk Energy Agency Vienna 337 pp
IAEA 19H3 Paleoclimates anu paleowalcrs a collection of ellvironmenwl iSOlOpe studies Panel I
ceedings series International Alomilmiddot Energy Agency Vienna 207 pp
Imbric Jbull Hays J D bull Martinson DG Melnlyre Abull Mixbull AC Morley JJ Pisias NG Prell
WL and Shadle ton NJ_ J 9K-I The orhilallheory of Plcis(()cene climate support for a
rcvised chronology of the marine oxygen isotope recoru In
) IWACO 19B Winplaalsonderloek en uitbreiding van het drinkwalervoorLieningsysleem van
Panunaribo Surinaunsche Wmerlciding Maatschappij ParalHltlribo
~ IWACO 19l57 Projcl hydrauliquc villagcoise Volta-Noire Programme des forages Rapport final
lravaux de foragcs Ministere de leau Oflice national des puits el foruges Burkina Faso
ljIWACOER Harris 1991 Expansion of the water supply system of Ihe city of Parumaribo and il
mClmpolilan area final report Surinllmsche Wmerleiding Maatslhappij Paramaribo
vansma R 199-+ Ecology or somc Nonhern Suriname savannas Koehz Koenigstein 199 pp
Jollmson D w 1939b Origin or submarine cUl1yons Juurnal of Geomorphology II 213-236
Johnson D W I939a Origin or suhmarine canyons Journal of Geomorphology II 133-158
JOhllStllL T M and Depaolo D 1 1996 Reactiun-lranspon models for radiocarbon in groundwal
the dfect~ of longitudinal dillpersion and lhe usc of Sr-isotope ratios 10 correct for walel
interallion Water Resources Researlh 32 2103-2212
Jlltllcl J KOSier R D Suoao R 1 and Russell G 1 994 Siuble water isolope behavior dUJ
Ihe lallt gladul maximum A general drlulalion model analysis Journal of Geophysical
Research 99(DI2) 25791middot25801
Jouzel J Frodllich K mu SchouerlJ U 1997 Deutcrium and oxygell-I 8 in present day preci~
lion uala and 1110Uelling Hyurological Sciences Journal 42 747-763
Kendall C anu Md)OI111el1 1 J (EJ~) 199H Isotope tracers in catdllllenl hyurology Elsevier
AnhlerdmJl lS39 pp
Kimmelman A A Da Cunha Reholllall S A and Freilas Santiago M Mbull 1989 I-lC analyses a groundwaler rrnm Ihe Bolulalu aquilcr system in Brazil In A Long R S Kra and D
(Eus) Pruleedings or Ihc 13th internalional rauiocarhon conferenle Radiocarbon 3 9
935
Kohout E A 196-+ The now or fresh water and slll waler in thc Biscayne aquifer of lhe Miami
FloriLla In Sei waler in llilslill lquikrs US GCIllngieal Survcy Washingliln I~-J2
KohoUI F A 1966 Submarinc springs lncglectcd phclo11cnon of cnltl~lal hydrology In
ProceeLlings HyLlrology mtl Walcr Rcstlurces Dcvclop111tnt Symposium Ankara 391-413
KohoUI F A Hath~way J C Folger D w BCJthncr M H Walkcr E H Dclancy D_ F r-rimptcr
M H WeeLl E GA and Rhodehamel E C 1977 r-rcsh groundwalcr stored in aquifcrs
unLler the continentrll shelf implicatiolls fmm a deep lest Nltllllucket Islmd MasuhuclI_
Water Resources Bulletin 13 73-3H6
Kohout F A Meisler H Meyer F W Johnslon R H Leve G V and Wait R L IlJH~
HyLlrogeology of the Atlantic conlineltal margin In R E Sheridan anLl J A Gm (ELIl
The Atlantic continental margin Geoh)gical Society of America 463-4S0
KoldilZ D Rntke R Diersch H-J G and Zielke W 19lJS Coupled groundwatcr now and tranltshy
port I Veril1crllion of variahle den~ilY now and trmsport models Advances in Waler
Resources 2 I 27-46
Kooi H 1999 Competition between lopography- and compacllon-drivcn Ilow in a conlillcd Iquifcr
some anrllytical results HyLlrogeology Journal 7 245-250
KooL H Groen J and Leijnse A 2000 Model or seaWlter intrusion timing tmmgressions Waler
Resources Resellrch 36 3581-3589
Kooi H and Groen J 2001 Offshore conlinualion of coastal groundwaler systems predictions using
sharp interface opproximotion~nd voriable-dcn~il) now modelling JOllfnul of Hydrology
246 19-35
~Krook L 1979 Sediment petrographical -tudies in northern Suriname PhD thesis Vrije Uniycrsiteit
Amsterdam Also published in Krook L 1984 Medcde1ing Geologische en
Mijnbouwkundige Dienst Suriname No 28 143 pp
yKrook L 1994 De geologische en geomorfologische ontwikkeling von Noord Suriname In LJ Van
der Steen (Ed) Reeenle geologische en mijnhouwkundige ontwikkelingen in Surinlme
Publication Found Sci Res Corrihean Rcgion Amsterdam 21-40
V Kutzboch J Gallimore R Harrison S Behling P Selin R and LannI F IlJ98 Clilllate ltJnd
biome simulations for the pasl21000 ycars Qualcrnary Science Reviews 17471-506
ifLaeyendeckerRoosenburg DM 1966 A palynological investigation of some archaeologically inlershy
esting sections in northwest Surinam Leidse Geologische Mededelingell 3H 31-16
Lee DR 1977 A device for measuring seepage nux in lakes and estuarie Limnology and
Oeeonogrophy 22 155-163
Leijnsc A 1992 Three-dimensional modeling of coupled now and transport in porous media PhD
thesis NOIre Dame University Indiona 251 pp
Leijnse A and Hossanisadeh SM 19890 Verification of the METROPOL code for density dependshy
ent flow in porow media Hydrocoin project level 2 case 2 RIVM Report 72852ROO2
Bilthoven The Netherlands
Leijnse A ond Hassanisodeh SM 198 Verincolion of the METROPOL codc for density dependshy
em flow in porous media Hydrocoin projcct level I cose 5 and levcl J case 4 RIVM Report
728528004 Bilthoven
Leijnse A ond Oostrom M 1994 The onset of instabilities in the numerical simlilation of densitymiddot
driven flow in porous medio In A Peters et a1(Eds) Computational methods in Water resources X 1011-1018
Lerman A 1979 Geochemical processes Wiley New York 4HO pro Levelt TWM and Quakemaat 1 1968 Some results of profile drilling along the railroad betwecn
Onverwacht and Zanderij Surinam Geologic ell Mijnbouw 47 140-345
L1 YH and Gregory S bull 1974 Diffusion of ions in seltlwltuer ltlnd in deep-sea sediments Geochimica
el C(lllHlChimica Cla 1X 7(1middot 71-1
JLilldemlIl 1 C and r-middotlolllellJm S P IY59 TIll c~ltalilll Ill SurinamL In LA ilL IlulslLr and J
La1lioU~ (Edsl A series (If paper (lil plant C01Jllllllnilics ltllllllheir tJli~in Ilislrihnilll and
relation to Llil11atc and hahitat Voluille I Part ~ Van Eltll-Ilflillds s LlIlds BIlhchccr Surinamc -15 pr
Linley B_ K 1996 (h~gcn isoppe recnrd III sea lecl and clilllale arilli(lll~ il1lhe SUItI Sla 1l1LI
the pas 15011(J() years Nl1ure 3XO 23-1-237
LtleA J HenJlmiddotg L Leltlney E 1 Stadler M E Dightoll J C and ArillSl1Ong D It)l)-I
Groulldwater Ieidcncc tillle allli palleohydmlllgy in the Olly Bl~ill Smllh AUSlri1ia ~H
I~O and I~C dill Jltlurnll or Hydmlog) 151 157-IX7
LusnmiddotYll~ki N S and SwauensJi W V I96() Slll water clllloaChillLnl in Stll1thlfI1 Na~sall alltl Oltllllshy
Ihellern Quecll~ cownie Long Island New )Ilrk US GLlIlo~icl1 SliLY Walcl Sl1pply Paper 1613-F
Maathuis 11 Yllilg R N Idi S and Prawiradi-astrl S It)l)(l DlclIlPlllLlll or ~llllll1dallr 111lt111
agcl1lClit -tralegic- ill the coaslal rcgion of Jakarta Intlonc~ia r-inal report No SRC Pub Rshy
1250-I-E-Y6) IIlILflllt1lioll11 Devclopmenl RCelrch Centrc (I DRC) Elliml1lllClltll1ld
Natural Re-ollrccs DiI~i(111 OUawa ClIl1dl (ll pp
Manheim E 1 alld Horn M K 196X CIllllp(Jsititll1 Ill decper sllhsurfacc Wllcrs alltlllg the Allanlic
cOlHinelHal marin SOllhca-lcrn (COlllgy 9 ~ 15-~36
Manheim F T and Panl C K _ 19X I Plllltrns of glOlllldwltller gtllillity changcs in a dccp c(Jl1tincntalshy
(leemil Inll1-eel 011 till 111hcI~lerl1 Allantic C(la~l or lhc US Jllurilalol Ilydmlo) 5-1 95-10
Manhcim r- T IlJ67 Eidel1lc lilT uhlllalil1e dischltlrge or water 011 thc A(lallliL ContincllUl1 slope of
Ihc ~ollthcrn Uniled Slates alld -llggc-tioIlS fur furthcr rescareh Transacliolls or thc New
York 1ladenw of Scieme Serics II 29 RJ9-H54
W Mlrkgraf v IlJi9 PalletKlimalcs in CClllral and South America sincc IX()OO)r BP based 011 pollcn
and lake lelcl records Quatemary Sciellce Reviews H 1-2
VMarkgrlf v 1993 C1i1l1atic histmy or Celltral and South America sincc I XOOll yr 131 COlllplriSllll
11 pollen rccords and rnodc simulatiolls In H E Wright (Ed) Glohal c1imalcs illCC the
l1~t gllciall1laximulli Ullicrsity of tImiddotlinncsota Press 357-1H5
Martinelli L A Pesscl1da L C R Espinoza E Camargo P B Telles E C Victoria RI
Arltmiddotel1a R Ridlcy J and Trul11bnre S 1996 Carboll-l1 variatioll wilh ltIepth in sHils or Armil and clilllate ChUl~C durill the QlIaternary Occnlogil 106 176-1HI
Malsui E Salati E Ribeiro M N G Rei~ eM TanlrediA C S N and (at J R 19H1
Precipilatioll ill thc cClltr1Amatlll1 hasin Ihe isotopic cOllipnsilion of rain allli ltLlll1llsphcrk
moislurell Btlelll and tllal1all~ ICI1 AI11mlllic 13307-169
McKnighll) M Thllnnall E t1 Wershaw R L and HcmondI 19X5 Bi(lgeochclllislry nfaelillashy
liL hlltllit llh_~tance~ in Thoreaus Jog COllcnrd MassachllscllS EClllogy 66 1139-135~
Meinarlli C R IlJ91 The tJrigin of hradisll grOlll1dwater in thc ltlwcr pariS (If the Nctllcrll1lds In
De Rreud V tEd) Hyllrogeology nfsah walcr intrllsion selection olSWIM ppers
IntcrnltionaIA~sneilti(lnllf Hydmgelilogists Heise Itanl1ltlver 2712HIJ
Meisler H Leahy P P md Knohcl L L 19H- Elkct of ell static sea-level ehmges on slltwaler
freshwater relalions in the northern AthllHic coastal plain US Geological Survey Waler
Supply Paper 2255
Mente A 19lJOa Mission report Hil hydrogcolngicallielll inCstigltioll OIl Rijsdijk _ Suriname
SurinalIl1sehe Waterleiding Maalschappij Organilniol1 of Amcrican Sales
Mente A 1990h Mis-inll rcpnrl un hyltlrogenlogical invesligatinl ror Wlter supply expansinll at
148 1-19
Mecrlllrg ar~l - Surinamc Guvrnmcnl of Surina1lJ~ Orgallialinll of Amerian Sllles
Merlivll l lnd Joui-d J llJ83 Dlllcrium and _I~O in pr~cipillIil)n a global mud1 frolll (lCilllS 10
k laps In Pilllcodimals and pilllenwaters a colkllinn of envirullm~nlOiI iSUlope slUdis lnlnliltion Alomic Enrgy Agency Viclllla Auslria 65-66
MOllK wG lEd) 2000a EllirUllmclllal isotures in Ihc hydmlngical cyd~ Principles ami arpicashy
linns Illlematiulwl Hydrology Progrmnllle UNESCOIAEA T~chllical ()OCUl11elllS ill Ilydmlogy No 1I) 2liO pp
rlonk WCi 2000h Ilillmluuitlll lhenry Illclhods rei~w (Volulllc I) 11 WG MouK (Ed)
Ellvinllllllcliial iSOlllpS in Ihe hydrolugilal cycle Princirl~s nu arrlicalions Inlernilliollal
Ilydrollgy Pmgrilllllllc LJNESCOIlAEA Technical DllCUIllCIliS in Hydmlogy No N 2HO rr
Moore W S llJ9lJ Largc grolllldwiUer inputs III CllISlal wat~rs nvcilkd by 226-Ra curicllments NHlllrc JHO 612-61-1
~lllalel1l Y and Hcal J 197-1 The shape or Ih~ inl~rfacc ill steldy Ilow ill a -lralified aquifer Val~r IksllLllces R~seanh 1n 1207-1215
Negrel P lachassagne P lld Larmlc P IlJlJ7 Caractcrislion chimique el iso(()rique des pluies de
Ca)~nnc (GuylIle rrancitiscl ACldemic d~s Scienc~ 32-1(~elie 111) 379-316
NOllrlhlltlrn van dcr KruijlL J F 11)70 Surinamc onshorc exploratiun IlJh~1969 Petmkumel1tincshy
ring and g~ulogy Inl~rtlal r~porl Shell Suriname Exploralic and PJtlullcli~lIIalIsdllppij 37 11(1middot
Alolu D J G 195M Scdimenls of thc W~Slcrn GlIilIa shelf Rcr0rls un the Orinoco shdf expcdition
VnlUIll~ n Mcdedding~n van de Lllldbnuwhngschuul te Wag~nillg~n 5H l-tJ~ rNota D J Ci 19(1) Gctllllurpholugy and s~dilllCllts ofwcStCfll Surinilm -hdf a pr~lill1illar) nllle
C1colllgi~ ell Mijnhtluw -1M IH5-1 ~H
VNtllltl D J G 11)71 Mtllphology 1I1d cdilll~lll off Ihe Mlrllwijne Riv r Clstern SUrin1I11 shelf In
SLiclllific illvcsligalitJIIs 1111 the shelf of Surinam HM ~I S Luylltes 1901J Royal
N lherlands Navy HydmgOlphil N~wslc((er SrCLmiddot Puh No h 31-16
Ogala A t1Id Bl1lkl RU 1961 A solUlinll of the dilTerential cqulIiOli of lungiludirlill di~persion in
pnnms lIl~dia USGeological Survey Prnlmiddot-ssiunal Par~r -III-A
OmiddotLcI1) M II 19~H CarlHlll isnlOr~s in rholOsynlhesis BioscienL~ 3M J2M-3J5
(hlslnllll tv1 Llijllsc A and Roh~rson KR 199-1 Sitllliialioll of two- and thre~-di1llensiunal dense
solul~ plulll~ hchavior wilh the METROPOL-J code Ill A Peter- el al (Eds)
Cllillpulalional m~IIUJds in wller r~SllllrL~S X Kluwer Academic Pub Nethcrlands 975shy9H2
Oud Essink GIIP 19lJ6 Impa l or s~r kvd ris~ on grollndwilla llow regimes a sen-ilivil) lllalyshy
si- fur lh Ndh~rhlllds PhD lhesis Tedmisehc Ullivcrsitcil Ddft -12M pro
Parkhur-1 D Land Appelu C A Jbull 191)1) Uscrs gui~te 10 PHREEQC (versinn 2) -l com pUler proshy
gram Im sjl~cia(i(Jn hllclJ r~attillil nnc-dilllcllsillTlltl1 tran-rOll and invtr-e cllchelllical calshy
culalions Wllef-ReSIll1rte- Ine~ligalilllls Repnrl t)l)--I259 US (jcolngical Suncy
PltlSLM~ N W il1ld Hoopes J A 19M-I Bunyanl cUlIlllnillltlllllt1l~s ill UfllUlldwalcr Waler Resources Re-~anh 20 II MJ-II tJ2 ~
Picklrtk-Jankuwskl IL It)lJ6 Hydrnche1Jlical effect of -llbmarill~ urmllJdwllcl dischame 10 thl Puck
Bil) (Smllhefll Baltic S~a Poillnul GCtlgraphia Polonica 67 101-119 ~ Plannillg il~1 Rc-clch Corpnration II)MX F~asihility study illld rrdimillilry design for Ih~ improve
llIenls md cxransinll of the pnllhk wal~r ~t1pply Im Parallllriho Iud its melroroliulIl ltlrtu Surirwillll dlc Win~rl~iding Maalschappij Paramaribo
Pllll1ll11~r I N Il)t) Stlhk iSOlllpc ~l1ridllllelll in palcowilIcr-middot Ill 11K snlHhelsl Atlllllie Coa--tal Plilill 1I1liled Stalls SCiCllLC 2(12 2(Jlh-20~()
I
~lels R L H 1987 Soils waler and nUlrienls in a foresl ecosyslelll in Suriname PhD thesis
Agricultural Universily Wag~llillgen 253 pp
Vost V E A 1996 Mod~~ling ~f th~ r~leohydrological situalion in Ihe coaslal plain of Surinam
MSc lhesis VnJe UlllVersuell Amslerdam 35 pp
Pos VEA Hooljhoer AEJ Groen J Gieske JMJ and Kooi H 2000 Pore water chemistry c ~ clay layers in the southern Nonh Sea clues 10 the hydrogeologiLal evolulion of coastal arc
Proceedings 16lh SWIM Conference Miedzydroje-Wollin Island 127-132
Pricm H N A De Roever EWF and Bosma W 1980 A nolc Oll Ihe age of the Pammaka metav
canks in nonheaslern Surimune Geologie en Mijnhouw 59171-173
PfUspenl J M Glacculll R A and Nccs R T 1981 AlmosrheriL lransport of soil dust from Afri
10 SOlllh Amcrica NalUn 289 510-572
Ralllsahnye L E 1959 The groundwalcr rnlenlial of the coaslal arcas of Brilish Guiana In Fifth
V liner-Guiana Geolo~ical COllferencc GeurgclUwn Geolugical Survey Depanment Brilist
Giliana 03-309
Ramsahuye L E 1959 The groundwater rOlential of Ihc couslal areas of British Guiana Proceedi
Fiflh luter-Guiana Geological Conference Geurgetown Gcological Survey Department
British Guiana 303-309
Rungallathan V and Hanor J S 1987 A numerical model fur Ihe formation of saline walers due t
diffusion or dissolved NaCI ill suhsidillg sedimenlary basins with cvaporites Journal of
Hydrology 92 97-120
Reilly 1 E and Goodman A S bull 1985 QuantitUlive analysis of saltwalermiddotfreshwaler relationships
groundwater syslems - a hislUrical per~pec(ivc Jourtlal of Hydrology 80 125-160
Remenda V H Van del Kalllp G and Cherry J A 1996 u~ of verlical profiles of Jl80 10 con
Slrain eSlimales of hydraulic cunduclivily in a Ihick unfraclUred aquilard Waler Resoure
Research 32 2979middot2987
Robb J M 1990 Groulldwal~r rro(cs~es in the submarille environmenlln C G Higgins and D
COales (Eds) Groundwater geomorphology 111e role of subsurface water in earth-surfa
proccs-es and lalldforms Geological SocielY uf America Boulder Colorado 267-281shy
Robinson RA alld StoKes RH 1965 Elcclrolyle solutions Bunerwonh London
Roeleveld W and Van Loon A J 1979 The Hulocelle develupment of the young coastal pain (
Surinamc Geologie en Mijnbouw 58 21-28
Rona P A llJ69 Middle Atlantic continental slope of United StltlIes derosilion and erOsion AA
Bl1llelin 53 1453-1465
RUZltl1l-ki K Araguas-Araguas Land Gonl1anlini R 1992 Relalion between long-term Irends
oxygen-18 isulope comrosilion of prccipitalion alld climalc Science 258 98 I-985
Rozanski K Aracuas-Afaguas L and GUllliantini R_ 1993 ISOloric pauerns in modem global
rilltiltlI1Yln P K Swart K C Lohmann J McKenzie and S Savill (Eds) Climate ch~ in contillcntal isotopic records Am~rican Gcnrhysical Union 1-36
Rnzall-ki K J)lm-cn S 1 Schollcrcr U and Thomrsun L G 199M R~comaruction of pasl e
lcs fnml stable iotor~ r~cords of palaeo-precipitalioll prescrved in COntinental archivc
Hydrological Scienccs Journal middotn 725-744
Sali E DatlOlio A Matsui E alld Gal J R 1971J Recycling of WatCf in the Amazon Basi
IsolOpic Study Water Resources RcgtearLh 15 1250-1258
Sanford W E 1997 Correclillg rllr dillusion in carbon-14 daling of ground water Ground Wal
357-161
Sanford W E and Bulpeng S 1996 ASS~SSl1lenl of a groundwaler now mudel of Ihe Bangkol
hasin Thailand lIsinl carbon-I-l-hascd ag~s and paleohydrology Hydrogeology journ
26-40 Sauter FJ Leljnse A and Bellscn AHW 199 Mctropnls users guide National Instinnc of
Public Health and Environmental ProIC(lion RIVM Billhovcn Schincariol R A and SChwUrl7 F w 1990 An cxpcril11cllwl investigation ofvjriablc density now
anu mixing in homugeneous and heterogeneous media Water Resources Rcscanh 26 2317shy
2329
ShOlcklclon N J 1987 Oxygen iSOIOPCS icc volume lUll sea level QUalCnlltlfY Science Reviews 6 183-190
Shaw T Jbull Moore W S Kloepfer J and Suc1mski M A 199H The l1u uf Dirium to the cnasll waters of lhe southeastern USA The in1p0rlnmc of sllhmarinc groundwater disdulrgc
Gcochimica ct CosmuchimicltI Acta 62 047-1054
Simmons CT Narayan KA and Wooding RA 1999 On a test case for densily-dcpndclll groundshy
water now and solule transporl modcls Thc salt lakc problcm Watcr Rcsourccs Research
353607-3620 Simmons GMJ 1992 Importance of submarinc groundwater disclmrge (SGWD) lfld swcatcr
cycling 10 material nux across scdiment watcr intcrrilCcs il11l1arinc cllviwlllllcnts Marinc
Ecology Progress Scries 84 17-184
Souza WR and Voss ci 1987 Analysis of lin anbotropic cOilswl aquifer systcm using varianlc-denmiddot
sity now and solutc transport simulation Jounml of Hydrology 92 17-41
Stigler T Y 1996 Analysing the hydrochcmislry or groundwalcr in Surinam MSc Ih~sis Vrijc
Univcrsilcit Amsterdam 43 pp
Stringfield VT 1966 Artcsian water in Tcrtilttry limestonc ill thc Southeltlstcrn States U S
Geological Survey Professional Paper 226 pp
Stringfield V T and leGrand H Ebull 1969 Rclation of sca water to frcsh water in carbonatc rocks in
coastal areas with special refercnee (() Floridltl USA and Cephaloniil (Kerhallinia) Grcece
Joum411 of Hydrology 9 387-404
Stringfield V T and leGrand H Ebull 1971 Effccts of knrsl features of circulation of wller in carbonashy
te rocks in coastal arCJls Journal of Hydrology 14 139-157
Stuiver M Reimer PJ Bard E Beck JW Burr GS Hughen KA Kromer B McCormilL G
Van der Plicht J and Spurk M 1998 INTCAL98 Radiocarbon age calibration 24000 - 0
cal BP Radiocarbon 401041-1083
Stule Mbullmd Bonanl G bull 1995 A 30000 yr contincntal paleotemperature record derivcd fnllll noblc
gas dissolved in groundwater from the San Juan Basin New Mexico Qllatcrnltlry Rescarch
43 209middot220 Stule M and Ta1ma A S 1998 Glacial tcmpcralures Hnd moislllfc trnnspurl regimes reconstructed
from noble gases al1d 0-18 Stamprict aquifer Namihia 111 Isotupc tcchl1iqucs In thc Hld)
of environmental change IAEA Vicuna 107-1 I H
Stute M Schlosser Pbull Clark J F and Bruecker WS 1992 PalcnlempcrOlwres in the sOllthshy
we~tem Uniled Statcs derived from nuhle gas measurcmCHS in grollndwalcr Sciencc 25()
1000-1003
Stute M Forster M Frischk011l H Serejo A Clark J F Schlosscr P Broeckcr W S and
Bonani G 1995 Cooling of Tropical BTilzil (5C) during the Last Glacial MlXillltllll
Science 269 379-383
Stuyfzand PJ 1993 Hydrochemi~try and hydrology of thc coaslat dnne arca of the wcstern
Nctherlands PhD thcsis Vrije Universiteit Amslcrdam
JTerracon Anguilla Ltd 1994 Hydrogeology and dewatering iludy for Lclydorp Ill final rcport
Client N V Billilon Mining Company Surinamc
J TlUI1ltltCI1 P A IL)7~C IhTOlll1liltlnll mlp Ill Surinam LllwllIld EcmylcllIS I~UlU)UU ST1NSlI
Par111arihll Surillamlmiddot
Thoma tv F l1ltl Thorp 711 B 1l)tJ(I The response of gcomorphic sy~Iel11s to di11lltttic l1ld hydmloshy
giC11 change during Ihe LaIc Ghllill lI1d carly 1-01lCenC in thc IUI111id and sllh-hul11id tmpie
Ill J E A Br1I1soll (Ed) Glt1balch1ngcs thc conlexl ofpalilLohytlrnlogy Geologkal
Stlckly fuhllc1110n I YJ-15J
1olh J 9C11 A lhclllelical anal~sis or ~nllllllwatcr Ilnw ill ~alllil drainagc hISills JOllrJIal (II flel)physiLal Reslarch 6~ j7l)i-H~12
Tmh Jbull 1995 Hydraulic cl1nlilluity ill largc sedimentary hasins 11ydnlgeology J(lllrnal 1 t-I h
yTlicll1 T 19H5 Eidcnce of t Irrcr Plcisloccne dry climalc in l10nhcrn Soulh Alllcrka Ill l Dougla and T Srcllccr (Ed~l EIlirolllllclllal challgc and tropkal gOll1Olphology Allen
~nd Unwin London 197-217
~ UNDPWHO 1972 Puhlic walcr ~lIprlie and s(wragc projecl Volul11c III WaleI Resollrces
(Hydm~eollgilal and Ilydnlllgkal Silidies) Unilcd Nalilllls I)Lchlplllenllnlgnlnlnll allli
World HClhh OrganiOllion 12H pp
VlclHill H 19~-L Die KII~ICIl dcl Erdc BeilragclUl illlgclllcincn L111d regiollalcll
Kwaellll1orphologk ErglIllullgshcft Ilt Pctermallns liel-raphischell Mitteilullgen Nr 2(1
Golha Haad
tJVan dCl Ey~ J L 19~t Dc landsdwppeu all Surinilme CClllraal BUleau Ll(hll~lt(lkartcrillg
Paramaribo Suriname Publlealie 111 1522 PI Van der Evk J 1 1957 Ree()llnlis~ance soil sun( ill Northern Surinill11 PhD lhcsis
I Lalldblluwl1ogcSl110ol IC Wagcllillgcll 99 pp
~V1I1 dCl Hal11ll1cn T 11 ral) l10lngical study Oil Ihe Qualernary of British Guiana Lcitbe
Geolopischc lledelklingn No 29 125-1 HO
Van dCl Hammell T 1974 Thc Plcistllccne change of vcgctation lI1d climate in tropical SOIlIh
Amcrica Journal or Biogeo~raphy I -26
JVan tin HlIWllen T alld Ansy M L 199-1 Amazollia durillg the last glacial Palacogeography
Palaenclimltltology Pahleoeentlgy 109247-261
Vall dcr Molen V H 1l)~H Ocr dc wuthllishlluding in de Noonluostroldcr Tjcenk Willink Zwolle
70 pp
Vall der Molcn W H II)~I) Het lOlllC grondwatcr in Wcst NederllIld CCIl gcvolg vall dkhtheid~-lllshy
l11ingen 1 H20 221() -311 llld Jt(l
Vall dcr Straatcn C M ilild Mllll W G 19Ht Stahle isotopic cllmpll-ilillll Ill rrccipiialillll and llimiddot
malic variabililY In Plllcodillll~middotS and palactlwilters a cllllcclion of Cl1irol1ll1~lllal iolllplmiddot
sludils Internalioll Alollic El1cr~y Aglncy ViCllna 51-6-1
o Van D(ln~llalr 1 [965 11 C~lIl(lical and phytngeographic sludy of llorthern Surinam sa1I1Ilas Thc
V~elati(ll Ill Surinamc IV r-kdedclingen Un tI(ls Ilcrh llllcdll Wenlia 1-1 16 PImiddot VaH Vlict K 199~ Is(ltlpi~- -urey Ill the Tcniary and Qllllmary aquifcrs or the cols1 plain til
Surinam t1Sc Ihe-is Vrijc Ul1iersitcit Amsterdam (j() pp
egt Van VOllfllHlylcn J H 191tJ tltroductioll and sumlllary of Ihe Slllligraphical and sldimelll1l1gica
rcsults oj boring lli1l1Clmiddotmiddot2~ in Ih coastal plain or Surinam (Dutch Ciuimll) GClllugic ell
rvlijnbollwtH 11-116
G Vcell 1 Y L 1970 On gcogcncsis alld pedll~cncsi~ in thc Old Coaslal Plain lit Surinill11 (South
Amcrica PhD Ihesis Unicrsilcil van Amstcrdam 17(l pp
a Velstra J 19 The ~llinity tlistrihutlnn and hydrogCllogy in Ihc coastal plain of Surimlll1 MSr thcshy
si- Vrije Ullicrsilcit Amstcrdam ~9 pp
CraquoVelslfilr 1997 Sludy and I11l1dlling or the porc waler chcmistry illlhc QUillcrnary days or Surinam
152
MSc thcsis Vrijl Ullivcrsilcit Al11sl~rdalll S3 pp
t Vcrkllr II 19l) I HydnlgeL)ltgic~1 survey ur the CtHlstal plain Ill Surillillll MSc Ih~sis Vrij~
Ulliversit~it Amslerdilm 69 pp
Verruijt A 1971 SluIy dispersion ltlems iln illterfac~ in a pumll mclliulll Journal of Hydrology I~
B7-3middotn Vogel Je I t)l)l VariahililY of lilrlwll isotope rraclillrlltiull during photosynthesis In JR Ehl~riJlger
AE Iiall and GD Fmluhar (Eds) Swhlc iSOlOpeS and phUlllarholl - waLer relation~
Academic Prss SiHl Digu 29-3g
Vogll J C illId Van Urk H 1975 ISIJlOpic lumpositillJl of groullllwlcr in Slmi-lrid rcgions HI Smllhlr11 Africil JI~llrnal or HyrJrology 25 23-J6
Volker Abull1Ilt V1Il dcr Mullll WH bull 1991 The inluellee or groundwaLer lin diffusion proc~sses in a
lake hmtmn 11 old rlpn][ nviewld Jmlrlill of Hydrology 126 159-ltW
VOJlhof II 13 Wlssclillgh r P llld Ganssen G M It)t)g RCCtlllstrLlclion of the Minlene Western
Al11azuniall aquatk systelll using Illolluseln isoltlpic sigllanlr~s Pal~ogengruphy
Pllcuolimattllogy and Plkoccology 1-11 H5-93
Voss (1 )Ild Smla WR 19H7 Variank dlllsity low and sol lite lrmspO(t simulation or regional
aquiflrs cOlHailling a narrow frlshwatcr-sltwltlter transition Inll~ Waler Rcsourc~s Reseurch
23 IH51-IKM
Wllrlcv~ns K It)t)() Natlral-isuIOPC rcseanh on gmundwater from the stmi-conrmed Ledoshy
P1I1isclilll aquilcr in Oelgium application of I~C-tllrrcttion melhods
NiltLJUrwetellschapp~lijkTijdsthrift 72 79-8tJ
Walraevcns K and L~hhe L 1989 Groundwater quality in the T~niary Ledo-Pllliselian aquifer ill Bdginm as a r~sull of rrtsh-VIl~r inlrusion into s~dimenls in chel11ioal equilibrium with th~
sca Ill W Dc Brcuck ll1d L WalsdlOt Eds) IOlh Salt Water ll1lrwlol1 Meeting (SWIM)
COllference Ghcllt Naluurwctclschapp~lijkTijdschrift 70 30--1-1
Wmg JH Rohinson CV and EddmanIS 195J Self diffusion and structure of liqllid watcr with
~H 11middot1 lIld 1MO as lraeers Journal or Ihc AIlltrit1ll Cht=mical Socicty 75 -I6l-~7)
Wang R 199-1 Survey ora rrcsh wal~r aquitcr in Sht=ngsi st=a artil Hydrogt=ology and Enginccring
(i~olugy 3 5-10
Wcycnnan JWJ ltJJO Twce rapportcn IWer J~n aanleg t=ner waterltiding Ie PMillllariho tlitgebracht
mll dell GI~llVCllCtlr Villi Surinamc It)tJ pp
lt3gt Wijmstra T A lilt Van der HUlllllCll T 1t)6l Palynnlogkal data on Ihe hilmy of tropical slannas
in lHlrthcrn Stlulh AlllcritI Lcidse G~ologisdlC MLlIcdclingell 3H 71-9()
Williams M 0 19-1l Bilhrtill Port Ill pearls and petmkulll Ntilm11 Geographic H9 19-1-210
egt WUllg Th E 1976 TClliary straligraphy ll1d lllicmpal~nnlOlogy of lh~ Guiana hilsin PhD the~is
llniversitcit vall lItrethl Also puhlished ill tVkdcdeling Geoh)gische tvlijllhmlkundige
Diensl Stlllm111e No 2513-107
0Wtlng Th I~ 19H-I SlraligXilphy aud sedill1~nlary history nf thc Guiana Btsin r-ktblding
Gcologisdlc ~n MijllhlluWhUlldig~Dknst SUrilllIllt No 27 H3-9(l
eVong Th E 19H6 OUllinc of tht sraligraphy and geological hislOry of the Surinamc ooastal plain
Gcultlgic cn Mijnhouw 65 22J-2-11 e Wong Th E 19H9 Rcvisioll of thc stlltigritpll) uf the coaSlU1 phtin of Sllrinarne Mtdedcling
Nilltlllrwetell-Lhppehjke Sllldi~kring Imr Suriname ell d~ Nederlamlsc Antillen No 1236-1
pp
Wmlg Th E 199H I-lydntarhull eploratioll and ~xploili1lillll in Suriname III Th Wlng DR dc
Vl~uer 1 Kmok J1S Z1l1llcdJ and AJ VIIl LntllllEdsl The hi~lory or eanh ~tiences in
SminlIl1e Nctherl1I111s Inslilllt 111 Applicd GemdlnLt TNO Royal NelhcrllI1d~ Alademy of
Arts and Scicnces 377-1969 Wong Th E De Vlcller D R Kronk L Zonneveld J I S lind Van Loon A J (Eds) 1998a1l
hislory of earth sliences in Suriname Nelherlands Instltule of Applied Geoscience TNO
Royal Nctherlands Aeademy of Arts and Sciences Amsterdam 479 pp
eWOllg Th E Kmok L and Zonncveld JIS 1998blnvestigations in the coastal plain and offshc
arca of Suriname In ThW Wong DR tle Vletter L Krook JtS Zonneve1d and AJ
Loon (Eds) The history or earlh sciences in Suriname Nethcrlands Institute of Applied
G~)science TNO Royal NClherlands Academy of Arts and Scicnces 73-100 Wooding R A Tyler S W and White I 1997 Conveclion in groundwater below un evaporatin
saL lake 1 Onset of instabililY Water Resources Rcscarch 33 1199-1217
Woodin~ R Abull Tylcr S Wbull WhiLe I and Andcrson P A bull 1997b Convection in groundwater be - an evaporang salt lake 2 Evolution of fingers or plumes Waler Resources Research 3
1219-1228 Worch E 1993 Eine neue Gleichung wr Berechnung von Diffusionskoeflizienten geloschter Sto
Vom Wasser 81 289middot297 Wymma T A 1969 Pllynology or the Alliance Well Geologie en Mijnbouw 48 125-134
Zektscr 1 S and Loticiga H Abull 1993 Groundwater lluxes in the global hydrologic cycle past
ent and future Journal of Hydrology 144405-427
Zckt7er I S Ivanov V A illld Meskheleli A V 1973 The problem of direct groundwater disch
to the seas Journal of Hydrology 201-36
G Zonneve1d JIS bull 1955 Over de geologische ell paleogeogralische olltwikkeling van de Surinaarr
kustvllkIC Leidse Geologisehe Medcdclingen No 20 214-224
Annex 1
Sediments and aquifers in the Suriname coastal plain
11 The Guinnn shilld
The ProlclOzoic crystalline basement of Suriname is pari oj the Guiana shield (Figure 33) and consists mainly nf granitoid rOLks wilh 11l1111Crous elongated dolerite intrusions (Dl Vlelter e( al 1998) In the nonheaslcrn part of Suriname a regioll of metamorphic rocks OCCUI consisting or metaJl1orphosed volcano-sedimentary rocks (Marowijnc GrOllpl anti gneisses and amphiblJlile~ (Coeroeni Group) Metamorphic rocks (metabasalts and greenstoshynes) underlie the Ilorthern part of the Ciuchmcnts of the Sammltlcca and Suriname rivers (Figure l3)anrJ afC also encountered in boreholes in the coastal sedimentary wile lFigurc 35) The lOp is strongly weathered which could be detected in vertical electrical soundings (Ve1tra 199() the Cillben~d layer appeared to have a very low resistivity of around 10 Wm vhieh WtlS also ohserverJ in similar vlIlcano-serJimentary deposits in West Africa (IWACO 19Rh
12 The sedimentar) coastal plain
The clastic Mesozoic anrJ Cenozoic serJiments in the coastal zone form the southern pari of the Guiana Basin whith extends roughly from the Waini River In Guyana to Caycnne in Frcnch GUiana (Figurc 33) The rollowing rJeslfiptions or Ihe serJimentary histoshyry nnd or the stratigraphy or Ihe coaslal plain arc rJeriverJ mainly rrom Wong (19H4 1(89) Krook ( 1979) Hallou ( 1981) Veen ( 1970) anrJ Brinkman anrJ Pons ( 19(8)
The depositional ccnler is located at the mouth or the Corantiin River where the forshymations allain their maximum thickness SerJimentalion in the Guiana Basin started in Late Jurassic to Early Cretateolls limes when the Arrican aJlrJ South Ameritan shielrJs hegan to drift away (Wong 1976) The coaslal plain is unrJeriain with various rormations intreasing ill thickness and rJcplh lowards the North ilnrJ onlnpping olrJer serJilllents or the hl~elllellt
rocks (Figurcs J4 nnd JS) The thidness or the serJimenl werJge incrclscs froIH a fcw mctcrs ill the savannah hcll 10 7S0 III along the coastline atlrJ linOllly W S(lInc 10000 III ahmlt ISO km ofrshore (Wong et al 1998h) The Suriname coma is ImllerJ 011 the hingc hetween the suhsirJing Guiana Basin mlrJ the rising Guimltl Shield (Kronk 1994 l SllhsidcllCC WOIS
aeeompanierJ by faulting and resuhed in seveml hona HnrJ grOlhen structures Structuwlly the slultJy area arounrJ Paramariho is IOCJtcd on the lower block on thc eastcrn lll1lk of the Bakhui horst The fault remainerJ activc until Early Tertiary time (Wong 1994 HmlOu 1981) The material for the uhsiltJing bmin wa dcriverJ from the continuously rising crystalshyline basement ltJirectly south of the bJsin After the Early Miocene the Amazon River hecashyme ltl more imponant oune of supply (Krook 1979) Earlier when the AnrJes Mountains were not yet formed rJrainage on the South American contincnt was rJirecterJ tmvarrJs the west (Krook 1979)
156 157
13 Crctaccuus
The Laic Cretalcow sediments in IhL loaslal zon~ lonsist or terrestrial lllllonsolidated md consnlidalLd fine sands and kilolinitil dayslones dassiled as lhe Nickerie FOJlltIlioll
Ihe Crelltlleolis contain iI high pLnel1tage or feldspar whkh implies that lhe wearhered top lias heen eroded (Krook 1979) Apparently during lhe Cenoloil Ihe impermeahle middotn~talCOliS material imj1elkd nushing hy aggrLssive metLoril grouIllJwlttLr which leached 1110St or non-qualls minLwls from thc overlying Tertiary sedilllcllls Ncar Paramariho the Vidtlie fOnJlllfiol is round al a deplh of around -300 m (hdow SLil leel) The lOp of lhe middotn~lilleOliS dips to ahlllll-3OOO m mtllL shelf slnpe 150 km offshore (Figure 3tl) The lOp If lllL ClctlcCOUS is rccogniled hy a conspicuous density shift in geophysilal well logs and cismic sl1lveys l~)r oil explomtioll
lA Paleogcne
During thL PalLocene and EtJlene mainly shallow marine sedimenlS were deposited luring several (rilnsgrLssive phases Three l~)rmalions are dislinguished with different facies Wong 19Htl 19H9) the lOmillLlllal Olllnlacht Formation is charncterized by loarse kaolishylitlL sands lIld kaolinitic days deposited In alluvial hillS and braided rivers in the Paleocene Illd l10mlplains and loilstal swamps in thL more humid tropilal Eocene The 101040 m hick formation is IOlally round as buried hills lupped with bauxite and laterite in a 10 kill ide small zone lnllmd OnvLrdadlt and further easlward The top of lhe forlllation is found -lose 10 the surfalL lrounJ Onverdalht until dcpths of 30 m below the surrale near dydorp Bauxite is tbe result or intensive weathering and leachinn durinll the Ion (I
lligolcne regression The original sands were probahly arkoses alorJin to Krook (1979) lmOSI all hauxite in the study ltlrea has been excavaled in open mines
The Olllnladlf Forllation pa~ses nonhward imo the marine SctrClllIcca FOlllwtic)
hough lh~ transilion is not llear due In faulting (UNDPWHO 1972) In the study area the IHllluioll is found belween the line Grollingen-Lelydorp and the loastlinc (i-Ianol 1981) Ihe formation lOnSiSls of alLernaling quartz sands and kaolinitic clays rorming series of lLpnsitionallydes beginning with shallowmiddotlllarine deposit~ gmding into beadl and dcltuil lcpnsits ami finally cnding with Iluvial (poiIltbar and lhmnclldeposits The formation conmiddot tins thick ami contilluou~ smd lInits whkh enabled deep groundwaler lirculation Oil in he TambarLdjo oil tCd is rClovcred from OIlL of the lower sand uniLs (T-sands) which i~
onflncd hy Ill impcnneahle chly layer The sounc rods of the oil are the offshore Lower rLUIleOUS nmrine shalLs (Wong 1998)
The top of the formation is found II a depth of about -140 m (helow se1 level) just lorth or Lclydorp and slopes to - no m along (he loastline west of Parullllribo
FUrlhcr North the SarwllacCCl Forlcuioll lhanges into the AlliaJct Formation which llJlsiss of silly marls days lakltlreOllS sands and lignites deposited in i shallow-marine Ilvironl1lctlt and in loastallagoons Sand layers are nm as massive as in the SCICIIIICCCCI
orlllCltion and therdore the formation as a whole is mlllh Icss permeable During the OligolcnL the seu withdrew (10 million yeur~) while dimate changed from 1
lImidlropil1I to scmi-Irid Weuhcrillg during this long period led to bauxile formalion on teogclle sedimcnts and lrystallinc h~lsemLnt rOlks Eroion prolUlLS were deposited il~
midLd-river llld illiuvial-Iilndcposils forming the BUrJlside FOIIIICIIIlJl In the Hololene
coastal plain the formation is restrilled to several northeast-southwest oriented tectonic basins along the conSI (Hunou 1981) The sLUdy area is located on one of the basins betw Groningell and Paramaribo Easl of the Suriname River lhe formation is absent The BUrIIsicle Forilatioll has been encountered just North of Lelydorp at - 130 m North of Paramaribo near lhe coastline lhe top of the formation is found at -180 m The lhickness varies from 5 m to 80 III in the depoitional cenLer west of Paramaribo
Low feldspar contents and the absence of calcite and aragonite in the Paleogene sec menlS are signs of prolonged lealhing by groundwater now (Krook 1979) Krook also believes thai the moslly kaolinitic Tertiary clays (of marine origin) originally had a highf content of smectites and illiles and thallhey were Ialer iransformed as a result of weathe and leaching Magnelile and hematite appear to be the dominam iron(hydr)oxide minera
Thin aquifers with rresh water are found in the OllverdCH11t Formatioll below the blUxile caps though lhey are discontinuous and of little imporlance to the regional grou warer now The massive sand units in lhe SarcullClcca FOTl1lCllioll form aquifers of regio extent Around Paramaribo the aquifers of this formation are moderaLely brackish and n suitable for water supply Well known is the T-sand unil at the base of lhe formation wr hOSiS the oil of the Tambaredjo oil field 35 km wesl of Paramaribo Though groundwatc this oil-bearing layer is highly bracklsh fresh groundwaler is found just above the clay sealing the T-sands UNDPIWHO (1972) rep0rls hydraulic conduetivilies varying from 40 Illday derived from slem tests The lota1 thickness of the sand units is aboul 50 to 7
The coarse sands of the BUrilsicle FOfl11C1lion vary in thickness from 10 to 60 m an form a good aquifer also called A-wlIlcl ClCJuifer Around Paramaribo hydraulic conduct ties and transmissivilies vary from 30 to 80 m1day and 900 to 3200 m2day respectively (UNDPIWHO 1972) The high trunsmissivity for the Leysweg well field is related to tl relatively large thickness and gravely nature of lhe aquifer near the depositional center 81rJ1icle FormCltioli West of Paramaribo In the southern pan of the Holocene coastal the aquifer contains fresh groundwaler A tongue of fresh water protrudes to the city of Paramaribo (Figure 37) where the aquifer is heavily exploited for the drinking water ~
ply Clays below the BIIJlsiclt FOlllICliOI probably have a high hydraulic resistance a
as the salinity of pumped water in the well fields only slowly increases due to lateral a (ion rather lhnn by upwarJ tlow from lhe more saline deeper slrala
15 Neogene
During the Early Miocene transgression clays sandy clays and sands with glauc and lignite layers were deposited as b~ach sands and swamp clays with mangrove veg (CoestlIijlle FOJmatioll) Compared to Ihe older formutions the deposits of lhis form~
contain much more clay (40 to 80 ) originating from the proto-Amazon catchment continentul sbelf the f~eies of the CoestlIijne FomlClticn changes into a shallow-man bonate plalform (Figure 36) After a regression lasling 2 lo 3 million years sedimentlt resumed during the mid Early Miocene More sands (beach and fluvial deposits) were deposited In the study area tbe lower more clayey part 01 the Coesewijlle FormatiOl
only found in the Hololene coaslal plain at u depth of around -95 m The upper more pUrl extends as far sOUlh as lhe Rijsdijk Road in lhe Pleistocene coastul plain lhougb absent on the buried bauxile hills arollml Ollverdadll fhe depth of the top of the
I
Coesewljlleformarol varies rrom -65 11) to -75 m along thc coastline Arter a long regreltsion or about 5 million years during lhc lone Miocene the Pliocene
started with a transgression reaching as rar as Republiek (Krook I ()79) The ransgrcssive deposits have been removed largely during the subsequem Plioccne regression Mainly coarshyse white and brown kaolinitic sands with interbedded kaolinite clays were then deposited in braided streams and on alluvial rans under semi-arid conditions (Krook 1979 Van Voorthuysen 1969) These deposits comprising the ZWlllerij Formatioll crop out in the savannah belt Intensive weathering and leaching gave the savannah sands their charltlctcshyristic bright-white appearance In the coastal plain the ZOllclerij Forlllariol dips below Quaternary sediments At the coastline the formation is round at a depth or -35 Ill
JUSt as the Paleogene sediments the Neogene sediments eontain hardly any weatherashyble minerals like calcite and the more unstable silicales (Krook 1979) Unpuhlished minerashylogieal analyses by Krook (related to Krook 1979) show lhatlimonite (amorphou~ iron hydroxide) is the most abundant iron(hydr)oxide in he Pliocene and Miocene formations He also found authigenic siderite in the top or the Pliocene rormation Pyrile appeared to be present in aU Tertiary rormations The mostly kaolinitie clays in the marine Coesewijne Formation may have been lransrormed rrom clays with a higher smectite and iIlile content through weathering as Krook (1979) suggested ror the Paleogene clays
Despite the large clay percentage or the Coesewijne r()fl(aOfl the individual sand layshyers are permeable and are generally grouped into two aquirers (lWACOFR Harris 1991) Sand units below a depth or -110 m comprise the Lower Coesellijne aquifer ami are only present in the Holocene coastal plain The Upper Coesewijlle Formatioll contains thicker sand units and forms a better aquirer than the Lower Coesewijne aquifer The top is found at a depth of -65 m near Lelydorp to -75 m along the coasl The total thickness of the stlnd units in both aquifers varies between 5 and 15 m while hydraulie conductivities vary betshyween 40 and 70 m1day (UNDPIWHO 1972) South of Lelydorp the aquifer is hydraulically conneeted with the Zanderij aquifer Though the Upper Coesewijlle aquifer extends almost to Republiek in the South it is absent on the bauxite hills around Onverdachl North or the main coastal East-West road and along the Suriname and Saramacca rivers groundwater in the Coesewijne aquifers is brackish (Figure 37) There are several pumping stations the Holocene coastal plain which recover water form these aquirers (Table 32 and Figure 31) The clays and lignite layers in the lower part of the Coesewijlle FormnfiOl form an errective aquitard as indicated by the originally artesian groundwater heads in the Bfflllside aqllifer (Section 363)
The Zaflderij Forllaroll rorms a continuous aquifer with a thickness of several meters in the savannah belt to 40 m along the coast The Zanderij aquifer is absent on some of the more elevated bauxite hills Various pumping tests carried out in the Pleistocene coastal plain report transmissivities varying from 300 m2day at Republiek to 1400 m2day at Lelydorp (IWACOIFR Harris 1991 Terracon Anguilla Ltd 1994 Mente 1990a) The aveshyrage hydraulie eonductivity of the sands is 50 mday In the Holoeene and part of the Pleistocene coastal plain the aquifer contains brackish groundwater (Figure 37) Fresh groundwater is present in the area around Lelydorp (below the Lelydorp sands) and rurther South in the savannah belt and the adjacent eoastal plain The aquirer is exploited for the drinking-water supply of Paramaribo (Table 32 and Figure 31) and also for the SURALCO bauxite refinery at Paranam
t60
16 Pleilttocene
In thc Pleistocene coastal plain between Rcpubliek and Lclydorp marine deposits are lound relatcd lo one or more Pleistocene transgrcssinns The depusits dassil1ed as the Compilla Formariol consist mainly or clays (mudnats) intersperscd with sand barriers At the base of the formation also nuvial sands are round in some pllccs marking a cunlinental sed~l11entary environmem during the Early Pleistocene Two lllemhers are distinguished (Brmkman and POllS 1968 Vcen 1970) Thc Pam Mlm1(r dates rrom the Early Eelllian or YarlllOlnhian (Holsteinian) interglacial and cOl1sistmainly or marine days Thc lOp of the Para Member is eharucleri7cd by strong mouling (paleosol) The Lelydorp Membcr which conlains more sandy deposits than the Para Member is prohably rormed during the Lite Eelllian interglacial The Lelydoll Member is round in the northern part of the Pleisl(lcne coastal plain Characleristics is the eleVltlled complex (up to 11+ msl) or sand harriers around Lelydorp T~lese Lelydorl ~I(1s rorlll a more or less continuous shallow aquifer According to Van d~r Eyk (1957) Eerl11an sca level reached a maximum of 8 III above present ea level Brmkman and Pons (1968) distinguish two phases ror the Lelydorp Memher the Onoribo phase haracterized by deposition or clays rich in organic material and pyrite during a ~isillg sea level and the Santigron phase during which clays with less pyrite and sand barner~ were deposited after sea level had reached a stahle level
Weathering during the Wisconsinan arreeted the Pleistoeene sediments consisting ~nalllly or clays Carbonates have largely disappearcd laquo 03 ) Also organic mattcr contenl IS generally low laquo 04 9() though Veen (1970) and Levell and Quakernau ( 9(8) occasio nally round high organic carbon tOntents in the lower part (up to 12 ) Oxidation can be recognized by the intense yellow and red moUling or iron oxides rormed after breakdown of siderite and pyrite XRF analyses or a few Koewarasan samples showed lhal sulfur has almost ~nlirely disappeared Aecording to Veen (1970) and Levell and Quakernaat (1968) weathermg also transrormed the clay minerals Dala of Levell and Quakernaal (1968) show lhat kaolinite eontents have increased at the expense of illite conlents in comparison with the composition of Holocene clays The content or smeetite is comparable to that of the Holoeene clays (0 - 20 ) Finally it is worth noting that the Pleistocene elays in the South contain acid and very dilute pore Water and have a low base snturation (Levelt and Quakernaa 1968 Veen 1970)
The LelydOll sWld act as a local aquifer with a thickness of 2108 m and contain rresh groundwater This groundwater is recovered in open dug wells in remote places not cOllnec ted 10 lhe public water-supply system Long-duration tests with several piczomecrs carried out only in the Pliocene Z((erij lIqll(el (IWACOFR Harris 1991 Temuon Anguilln Ltd 1994 ~ente 1990a) sho~ved thaI the clays of the Coropilla Forllatioll Imve n very high hydraullc resistance varymg rrom 5 x 101 to more thcn 2 x 10~ days Given the thickness of the clays the vertical hydraulic conductivity IS about 0 mday
17 Holocene
During the Early Holocene (12 ka to 6 ka DP)ltea level rose rr011l a depth of 100 III 10 liS present level (Roelcveld and Van Loon 1979 Fairbanks 1989) In the course or the seashylevel rise the large sediment load of the Amazon River could 110 longer be dischtrged inlhe deep sea rar offshore The sedimem was taken northward with Ihe Guiana Current and deposhy
itcll along the lOlsL The Holocene sellimems obliterated 1110st or the Pleistocene erosion lopogrilphy Because the HolOlene lmnsgression did not reach the level of the previolls iltlllgamoniall transgression the PleislOlene coaswl plain in the south was sparell though (he ~ullics were tilled with the peiHY clays or Ihe Mara Fomlllticm and lan still be recognized as Vamps After sea-level rise slowed lIown between 7 and 6 ka SP coastal aggradation began Inll extensive lillal-l1al clays ahernming with beach barriers with sanlls am] shells were lieposited in the Holmcnc coastal plain (Ommie Formation) Brinkman anti Pons (1968) discerned three distillltiw phases in the coastal aggrallalion the Wanica phase from 6 10 3 ka SP the Mokson phase from 25 to 13 ka BP ulHIthe Commewijne phuse from I ka BP to present The main pan of the Holocene coaslill plltlin in the stully area lIates from the Wanica phase Only Nonh of the Paramaribo-Groningen roall and the Commewijne River nxent deposits or the Comlllcwijne phase are found In the littoral zone sedimenHHion and oastal lggradation lontinues (Augustinlls 1978 Augustinus et al 1989) A series or mud hanks where suspended load from the Guiana lUfrent precipitates is lontinuollsly moving weslwilfd while hetween the Illud banks energy-ridl environments lreate elongated beach hIITicrs Oceanographil surveys show that thesc mull deposits are present 011 the sea 11001 to distance or 30 km offshore and have a maximum thickness of 20 III (Nota 1958 1969) Further North sandy deposits l1re found on the sea 110or Just as in the coastal plain the Holocene deposits have obliteratellthe Pleistocene topography apan from Pleistocene paleoshychannels of the major rivers like the Marowijne (Nota 1971) Other submarine morphologishycal features are old coastlines anll coral reefs which inllicale imerruptions of the Holocene lransgression A coastline al a depth of 21 to 25 III was found dating from 8 to 9 ka BP I Nota 1958Van del Hammen 1963) A coral reef at 80 10 90 III lIepth has an age of 12 to
17 ka BP(Nola 1958 1971) The days or thc COOIIe Formlltioll have high smectite and illite 00 to 60 90) and low
kaolinite laquo 30 fr) lonLents (Eisma and Van tier Marcl 1971) The smcltites and illites origishynate from the Andean moulllains and were transported to the Suriname loast hy the Amazon River and its trihutaries anll subsequently the Guyana current (Gibbs 1967) According to ll1alyses by Eisma and Van der Marel ( 197 ) anll samples from the Koewanlsan and rOllftonne boreholes (Chapter 5) carhonate anll organic maHer eontcnt arc ahout 2 - 6 Illll 1-2 respellivcly The days are also rich in pyrite formed afler lIcpositioll (Brinkman lIld Pons 196H) as can be derivell from the XRF analyses or Kocwilrasan and TOllrlonne ampks (sulfur lontents from n to 08 ) However after regression ill the Late Holocene tafter 4 ka BP) soil Iorming pnKcsses in the uppcr few mctcrs of thc Hololcnc lli1ys led to pyrite oxillation and acidililmioll (BrinknuIl and POllS 1968)
The sillds and shells laycrs in the Holocene beadl-barricr lieposits form local aquifers rrom whilh groundwatcr was rccovcrell by open dug wells heron the OmsLfllltion of the middotity water-supply systcm in 19J3
Annex II
Map of the Suriname coastal plain around Paramaribo with san pled wells
~
SOW ~ ----------r--shy4 -=-u
_~~ 1middotI~
NI
~
j I~ C A= ~ =1 r
SlNI-GR SlNIImiddotG
J7 S Om
MOrlOO
gt1 J lillI
~IC
1~
_ SON
TA~~-GR
TA~ImiddotGP
~o
2-
bull IN 1m
-39m
~middot-imiddotdlM ~HP 16 1 I11III 61
4Sl~ H~J~
~----=~n~~~
TamDl~JlI_II~
51 1111(13
0
Coesewllne River
Allantic Ocean
~
~
~
~)
J~ ~
~
-
go
0ltiI_
V1ap of the Suriname CDaSlal plain around Paralnuibo wilh sampled wells
Annex III j
Chemical and isotopic analysis of groundwater in the Suriname coastal plain (for locations see Annex II)
g Chemical and isotopic analysis of groundwater in the Suriname coastal plain (for locations see Annex II)
screen Fcwmatlon DepChW m
Sa wM analyses of all macroiom BOO BItXtJO-MUtnJllty error lt 10
0l200O 0l200O or2OOW 012800 00 K
Kobo 0I400W
OItOOW
~OOO
Kbo onQOO K onQOO onoow Kobo onoow OOW K MOOW Van Hallemweg172 W Meerzorg
m2 Haariem
HeariemH2
A11dllk
10(70 68
Leiding 9a on MOI1co JI 10(7 MOlkxIII
Mudlke SUAALCO 1(73
MeerzOlg Mudlake SUAAlCO
72 Mon PlalsllWeg
Mudake SURAlCO 13 AIISdI(lt Sou1h
14 72
Mudlalce SURAlCQ 4(72 Rllsdllk
2 -7S 2 -75 2 middot75 2 middot75 2 75 2 middot75 2 -75
1 2 75 2 middot75 2 -75 2 -75 2 -75 2 -75 2 -75 2 -402 5 -1511 -7602 -7602 2 ~2 5 middot18J5 middot623 middot623 2 middot344 5 -1511 2 -251 bull -1250 2 -290 2 -303 2 middot290
2 middot345I
- SOlt No KHCOOmiddot NOshy PQH-Bie- crEcveld 1= I-pHmiddotLob pHmiddotAdDale mmmiddotc 51= 51= -
0 17-oa-83
010703570032aon2] 012001)015 0-0090121246260-00-83 01140133 OOltl5 0002013300 00100149613
25
01410067 0004 0124246- 000901230Ol50004 0015013027-06-83 535 035000040465525 57 02]2 00010001 0023-17-08-83 OJ
OODJ009700110051 00982417-06-83 5 0204 00110Q15 0025005201943527
0006018900]8 0010 0022012265217 01120044 009lt1 0016 001024593 0003OltW7000502SO17-06-83 5
001803570024002111029 0421607 6301-06-83 010212171700 0104045111()9middot72 7bull 02)037401344 0166338500005-12-80 7 01252827 1015 1721 0468 0001 005231-12middot82 66
14middot07middot95 2173 18107 US7 14D4f 02602506 0006727 7 SO 3H2-90
33 0004 1652 00651100 0032169229243 605
9656 021219000049939329-01-71 7 59S9 01022200 05514936 004921-05-71 0212965619000049939329-01-70 7
6394 01301349 4615-OJ-9 266 5 4219 023001663949 442716 6005-12-60 043917633493915)3middot95 66 2610 16645267 010254801200 171013820-05middot72 6 09674393237179 2161905-lt15-95 673 57SO266 0040OOOS 10431100 119 008331-12-90 569 160
05-05-95 22
050620SJO617217827268 631 006900042721 1297 OOJ4 086931-12-90 273 772
analyses of o(h~r parJlntCrs art tominucu on page 179 to 189
KNoHCOOmiddot NOJ 04-orthSOlCOJcr 8EemiddotVeld7_ pHmiddotFJd ECmiddotl8bpHmiddotLab mmo
Formallon 010W Dhlocation Sa~ mmommommommo mmommomiddotc 51= 51= mmom ~ 0639321671079027447 2 3970645-290 05-lt15-95 26MUdlake SUAALCO15 0179576 1000 014S541607-07-71 5 51116m Meel7org 02947872 1216
17m 050017235-388 04middot08middot712Pad ven Walllea 0053291400010260 0220031middot1290 605-5962 Allsdiik OlSJ43930900 39n 0349 0468 02-06-71I 4 -126226 01432474
I
1573 12494172 7
282 676 599 6450](17middot95middot6040Koew81asan 0104 18701207500076122-02middot72
2S22 middot68721n WamplgedacN 8 008500021080 07524052 2 623 254 62131-12middot90-300Land5OQord(Javaweg)21n3 0409157980100029951622670 27middot07middot71 5Cltlmrnowljne km24 22m
01020762 16040049 036601middot08-72middot16922112 Allsdljk 005119130545101S 00002-09-71 7-6371 004015220900 0156 2
1128-598 27middot08-71 6M_genlaWellledachl C 2517 013624921934 0014 0001 185330532 S -1727 08-08middot95 28 3325172 Gamll0ampMP3d 010222181700 2256 5 middot1727 20Q9-72G~OIInspad25172 OOSI10430080 0322112831-06-71002 72171 OlSJ15960800 0726152315-09middot71271
2 middot525HlllampnI ChnUnaweg 7
006317390149 0800 013513547208-04middot71J7 middot5232 2Aijsdl~ 00740007 10001327 0031 00010811l14531-12-7J7 -2902Aljsclijk 5 0IS85785 0199 1100 10823413
1 -761 09-03-71 J7
1513 0059 0836 0093 0004
2 642
665 266 51791 00826 116-3 2 0006
2~9 0000560104middot08-95 269middot300 0S23523204-ltgt6-95 6270 60
1030 1(199 0002 0003 3239 0163
61 1629
3392 279
S IJolO 63ltl12middot12middot96 288 56 50Helena CMstIna1leg n 01571322 0)01
1595675 50S 229 5 J3oCO 07-07middot95 295 576 5Helem Ovlstlnaweg 3592 00482737 23111187 -740 16-07-9 297 605 093264LeIOng 019124351974 078031(71 31-01middot7 000 Helena CMstInaweg
~72 7
4579 027110206 0004 OOOS1213 642057~72 12-1296 81931m Helena CMstIoaweg 272 4764 0220524 140S 002007-07middot95 56~72 277 56531n1 _CMoN 13 016026571468 00245669 501l0 07-07middot95
271 618 0366n 0207520 0006 26495440 1609 0001 1021
13-12-96 271 5611 0230J31
2 -377 JO-09-71 6 13737 0= 060-
010215221100 0520gt059I 2 -430 8-10-71 65171 shy 01791400 6265 5 -1568 15-10-713amp7 Zorg en Hoop (Corsu) = 0593 1435 0104~2 09-11-69 7 -5Skod 1ll Ill171
~
~
w
61aw 7OW
0 m
2
ISconl 41n1
2 682
682
68 ow 614000
614000
61400W
61400W
ow OW
6f72
682
68 6CENT
NT 6A
7f72 7f7
Muttake SURALCO
Lilting 9 Cornnelane Kreek
AiJsdlJk South Rljsdij Sou4h RI~Sou4h
RijoO
Rijgtd~
Zorg en Hoop (POSloll)
Zorg ell Hoop (SWCC9
Carolina
Mudlake SURALCO
Rljsdljk
AljsdlJk
Aijsdijk
Gronlngen
Kbo
Kbo Kbo
Kbo
Kbo
Kbo
Kbo La V1gllanlla
RiJsdiJk
RIJsdIJk
Kbo
Kobo
Mudlake SURALCO
Tljgerlueek
Helena Chrls~naweo
Ksolt NN03HC03cr BEC-UO Ec-V ICODepCh Dale T pH pH-Ad F_ SianmiddotC Sianm shy 15280 022521780 1536531818063-327I 6 gtltXgt 000101090078011730middot75I 2 53 003000069 007-4 0000middot752 bull 019117491100 un7~ ~middotn63 0 bull 358961203lt 2SOO7785 530g76 0amp-00middot712bull D17947840001 000501970 761681011middot12-8 28middot3832 2 583 89160001 0003 271213973267 1100
67
31middot12-8 282bull 01633lt36000100113 65 31middot12-82 28-1533 1217 0046 00042 00213162 303-2722 32~ 29570002103 02 355 m31-12-82 595 275I 2 016815000471005-11-71I 5 middot1573 3871 01461400392111middot11-71I 5 -15lt17
01020195253 0400~7 23middot11-70 6I 2 23019O41ol36498 50 7029615-03-95-148 7I I 6 020lt1585020000010754180531-12-82-162 53 2 01532783000700170852290061-572 31middot12-82I 2 01173697000309751319US52057631middot12-82middot939I 3 22 02171624 0=2039759 5 00026-07-95 652 685middot1360I
0543 00lt450012 00500120 13amp4776middot75 5I 2 01 00290077002100190t18 00223161317-D8-8JI 2 middot75 001800900000020125 003925-75I 2 2701
0172 000500180153 0085647-75I 2 0017602310002 0006 36
0062I 2 -75 01 00170219
0198 0080 0002 0041 0222 0013 0210 00230024I 2 -75 17-08-8J 603
2 -75 01-D6-8J 661 15796 2200 0197 15963 02I 2 -ZU 01-OH2 6 42190007 00114 00067616 01298002 31middot12-82 26 71 00001 865510126 0719 06532 middot369 31middot12-90 561 0160 00010126 0-149 0020middot75 691 392 272 1256
0127 0147 00060117middot75 302 01-06-83 688 1432 73945337210871middot39 15-03-9 amp7 1009
bull 016111570480028n 2915middot1300 1507-72 7 3736 01840721 1239 00124400-515 20-07middot95 797 698272 653 63lt
N KHCOOB( co3 s N03 Po+orttcrpHmiddotAd Ee-llb Ec-VeidDale T pHmiddotLAbFOImalion DepthLocallon Saeo mmolJlW mmmSian mSianmiddotC mm 01843871000500010218 m m
0662976031middot12-82 28 52 -2242Rljsdl(ic 019142197m 00050001009303117616bull 5831-12-822 -3247m2 RISdllk 1483109612263713376528 62
lI20
00015-03-952 -395I7A Mucllake SURALCO 205811309200082578611249613570 I 715-0395middot172 7Mudlake SUAALCO 01488 626302700800bull 8603674 -1140 11middot04middot726f72 Adh 0171300100020011Oln0573493663 5731-12-82 2B 2 middot210RIJsdijk082 031210874000106222655I6n 14753 1975713315 816-0795I 5 -1742BI Bani Park 10265 0000601702918001501375695 88 50627-D695 5 -1772BL1A191 B1auwgrond 020421901041196 440 47856883050$-12-80 5 -1575CIO Zorg en Hoop 01504158000905113163928n61360769529630middot06middot955 middott698ID31V72 lMgtmo 03067520052344070106-12-80 315 middot1575I 22EO Zors en Hoop 001601910000000600001049136 2277 572 middot50IZander1]BS 18432957 4598 0 0800 1301 2Q-(l7-71 54 -1265GMD22 Koewarasan 0434103080199 660055577711-05-71 middot1035IGMD28 Allillnce 01945176 0145110051906723-07middot715 middot1445IGM07 MN 02535230049 100027084 -1265 22-03middot71 5 22IKarnpong BartleGMODl 00072955 031middot12-90 2712 middot143IHighway (5 of Parent HI1B7 0010034700820112 0= 258331middot12middot90 2382 2 -143alrp)f1 Z8nderllHI-2I9O 00040157 00070087 00830182355425t918middot12-96 2972 ~5HoyKreelltHOY 046515963 33229 2147 2436 3818 3530623 760 26-07-95KwallawegHO bull 0051286000036bull 36289355011 176002 721 81I 2002~7KWI Koewarasan
bull _68600 10800324 02450 6557650076-112 20-02middot9 72KWl1 Koewa~~ 096100023_ 0026 800233lO 719 8320 ~OOOmiddot122 82002middotKWI2 Koewa~ 113000020212 000522987middot162 2002~Kbullbull~KWI6 085645900OOOt 085979000 -
bull
bullbull
716 82 6956 -= -172 2002~KWI7 0003 01130 0039 50081700 93716 -192 2002~7IKoewa~KW19 00020002530_ 50075 68762002~7I 0 ~2 72KW3 070900 0085 500~OO 227338712 lI22 2002-KW9 0315517900050931 0003 260
63 0 17-12middot96 28bull 006LV31 - bull 00511918 0183 2S660874110031middott2~ 24t 6013 -7103 0311D-140 Van Hattonweg wesl
bull 1478 00003O28ll1184 11803 745 31middot12-90
252 5
200Ll2I9O Van Hattonweg wesl 00810 739O~25OS middot505 31-12-90 23~ 3lI3 052LlSOD Van Hallonweg wesl
bull 0 005800740423 ~730931-12-90116-11W Van Hall- wes1 5~
i ~ ~ ~ ~ ~_ _ 000
NO ~
M N _ _ _ _ N _ _ _ _ N - _ _ _ _ _ _ _ _ _ _ _ _ _ _ _ _ _ _ _ _
~ - 0~ - 0
I i
I I
N ~ a ~ ~ 000
~ ~ ~ ~ ~ o 0 0
1
shy
nw 1013 T TOIS
T017
T~TOl9 Tourtonne02 T_T023 Tounonne025 T~TOO TOO Tourtonroe Toul101lne I07 Tool1onneTOO nCI9I Tourtonne Tourtonnen191 W02 Tambarecllo 011 Reld WI Zorg ampn Hoop Wmiddotl0 Paranam ParanamwmiddotaA ParanamWmiddot WWcS TambarecrjO 011 fleld Tarrbaredjo oilfieldWWSM
ZOR-GR 20tg en Hoop I 20rg en HoopZORmiddotGR zVImiddotmo V1erklndefen ZVImiddot290 V1erklndetlln 2 ZV1middotmo V1erklnderen ZVSlS7 Mana
Sempltl$ with Inromplete enalyses and eleclro-neutrarity errorgt 10 K8bo0500 gtltaboOW 014000 gtltabo Stolkslusl16 Stolkslusl 216 S10rkslusl16
_ SOlt N03 No KHC03Be I_orpH Ec-VekpH-Fk1 ECgtUbDo~ ~ middotcm 51= 51= 70003550000101 00520461199304730000 middot132 13m-97 25 700 53060000097 003105681821013-lt12-97 00lt0 middot152 725
6370(1058 3180000116920 05500013-02-97 70 middot172 25 32 32-4000 500500131 0056D151601(725 75 0500013-02-970 192
5760299000OCJ4512760 053nOOO75 29980 7791)-02middot970 middot212 25 90 rosOOO0625 0026 011 7145703-4700072513-02-97 28000 23 445032314000370550 002914so3041000725IH12-97 70 middot252 2 3070138000016017120 4379 0079~ 143000B213-02-97 7310
8439 0026 1360000 99052 13600013-CZ-97
0 80 57103350000106 008918390 037942UlOO335303-02-97 7 74203490000067 007518510 1019498000729 7713-02-970 middot82 5380 021882790003272(1 0009 00097029329 7075 -1amp45 17middot12-96 82 OS 0187 80460058 637 0007555 middot1845 138 23631 026600020083 7008920 5600755 858 143703-01-976 middot2990 gt0 5359 1442 0166 5283 023031 7113 05 middot1575 06-12altl 0018050000090149049327720-03middot952 300 0020 middot300 20-0395 69 5 0699 023 0843 001820-03middot95 bullbullbull 0753 0178 0674282middot300 12
10265 0416037371674 1610 4541bull middot1070 24-07middot95 305 697 85 n9 6437 0248 1822 016140657435 middot1555 24-07middot95 301 698 8010 3523 0179070823135 05 15-02middot72 82 600 6785 0281l262lt0 015 003775035 05 31-12-82 31 82
01130011 7916013471652 middot3-43 31-12middot90 236 2008 720 0004 0170 0017000380 0136 00003 0 001middot123 25-08-95 323 6-03 80
0235OOOS 0022 681971 1019 1017 6420 00119 2880 003625-08middot95 321 705 2 middot140 14-04-87 8 130 040025
002B 00292 middot75 OH)6-83 0040 0009 02989 01 00090022 0Dl5 0021 00372 middot75 6 18 0032 01 0021 0005 0087 00042 middot75 0103 0023595 24 370middot872 61111971 0100 20192318 838
20612 625 6111197 5190
2 -437 61111971 17884 1
KSOlt NoN03HC03Be C03crpHmiddotLab pHmiddotFJcI Ec-Ub EcmiddotVeldDale T_Oop4hFormadonw Locallon Sa~ mmom m
51= 51= = mcm 386430()6middot715 -1439Toullul Faul 03322218300070187 00013278If 0705 28 82 50031middot12-82bull middotlflOHaartem 01092914162 0055000100101803250 Oso 872831middot12-822 -470Hear1em162 0169 5528middot02middot32 middot116RepJblIek000 N 0169 519-03middot302 ~6 0104OOOS 1609R_ 0200 82 middot165 2-MalrwoaOlCoropina Cr1172 4915 05370_26555amp41780 73109-12-80 -194MoricoWesl3171 166511005amp4 -79bull 28-07middot711MorkoWest 0102317 065200240451 500 802-08middot722RIJsdlk ~no 0083OBOO0789 09(17middot712 middot199Aljsdljk5 0143 503-02-302 middot157Republleilt600W 070835937 02-Q6712 middot27126
023050890049 6002228 20-07middot71 84 -1329Gronlngen270 -shy88020-07-712Gnnlngn270 01040160 0200 18-D2-r2 159PIamplJe Kondre272 00200739000012105801bull0 ~ 12560527331-12middot902AIISdJjl2185 0155220056 2295200231-12-9C 8 5 50SpoR lVea228 01pound1203471499 22)Bmiddot72 82 middot1002n2 CoIllU 0102 0270 52209001071572 -lt3 26-06middot712817 Do C D13G495~16 67132810 gbull 15-03middot9 5Mudllke SURALCQ 14362bull0052 -237 03-08-71no Tamanrecfto 010 0585soo 005200998 019-04middot712 middot290Rljsdljlo 0076~8961bull09 10138238 85231-12middot90Ri)sdIjII -683168
028 0820 gt00 0270 5807 2 27-09-71Caroline 01014780691600076108-10-712 -490 8DeCran~217 010201300100 0104 01122 22middot10071 53171 Carolina 1700 01048Q511-71 8p 2 0
0~71 0016 00050766 01502 middot75 OS41670W 0127 0593 0479852 7 30-12-71-shy 01G4028 0100016929middot12-71 52Powakra Wesl 00010120 0192483H2middot9C 52 8 PowokkoW 394920-11)70 LllIdlng 9a 1915 -~
_71 3921m1n-7n 8_--
~
__------- --__
----------_
LoogtJJon _don m
Nofth 01 CaIqjna cr 2 2 ~2
Rok I 2 middot133
I 6 2269
landeI1 Malla 2 ~
1~M8llll 2 s bull
Magentll-WampIgedachl C 5 middot1251
I 5 -1251
bullbullIOS2
no 2 -6
BIIllIOfl I 2 middot~s
BerflIn (bronJ 2 -oS
_I I 2 -os
Ca 6 -1975
Republlek 2 -106
I -1335
HlghWlIf ($ 01 Pariill I 2 143
A1rporl~1 2 -243
Tamanredlo I 6 -2760
Highway (S or ParanaJ 2 65
Highway (S 01 P81lln81 2 middot128
Highway (S 01 P81l1na I 2 middot128
Highway (5 01 P818na I 2 middot88
HighWay (5 01 Parana 2 -400
HlghWBy (5 01 Parampfl8 I 2 -273
HIghWay (5 01 Parana 2 2 23
Highway (5 01 ParBn8 bull 2 -60
HIghwaV (5 01 P81arull I 2 -160
Highway (S 01 Paranlll I 2 -178
I 0 -62
Van Hallomweg W~I -1050
Van HslletTlYfeg W8S1 2 3 middot910
Van HallemwuQ West bull 2 -580
Van Hall West S 2 -340
OallJ _ pH-lab FHfkI Ee- o-Veld E
SIan cr
Bf I
COO
HCOOmiddot SOlt
JO-laquot
K
w
MI2
SOOSW 6170
gt71 7m 870
8707 70
m BlL-GR
BVB Bve
C6 CEtmlE
Gl40l1
Hlm7
H1-2I9O
H17 H2I87
H3I87
H3I87
H M7
H4-Sf90
H45I9O
HSn
H HP1187
KW8
Ll001410
Ll0014JO
L10014JO
L1G-4O
10--12-8 ~O
09-10-70
02-08-71
02-D1l-71
31-12-70
01-o7middot9~ 31middot12-70
11middot12-90 08-10-71
15-01middot7 13_10_11
29-lt18-10
ol-07-1J7
31-12middot90
C
29
25
261 287
285
S7
SS
7
S 37
bullbullbullbullbull
502
bull53 7
5 bullbullbullbull s
s
451
7
1011
3S
ISO
SIan
19
23
3290
1= 0lt09
11283 0211
0930
2905
6375
5782
D3O
OS
0138
0096
2905
0169
1974
0600 0141
26300
0401
0592
0600
0959
3404
0
0225
0400
040
040
5140
087
095
08-4
059
0
0
0
4
9
5
2
0199
0199
0199
00459
0400
0390 ~
3196
3900
0550 0390
sooo 0100
0280
7880
0890
1655
0419
0760
0300
39sa
3180
2639
2524
1803
0333
0031
0218
0017
1239
0009
0053
0031
0156
0728
Ol32
0385
0706
0106
0259
15599
0265 0372
0306
0
0003
0006
0035
0008
000l
0040
0027
0001
0000
0000
0037
0002
0007
0001
0001
0001
0004
0069
0003
0366
29 0054
139
0130
39
0521
0061
0080
1 78
0260
1652
24300
2218
204
1000
0542
62800
4175
400 3392
0719
0179
0102
0lot7
0102
0001
0006
0191
0102
0012
0371
0033
0089
0369
L470
0081
0076
007
0025
~g
15-GHI1
31middot12middot90
15-04-87
31middot12middot90
12-05middot87
31middot12-90
31middot12middot91
12(15-87
15-G4middotIP
13-G4-17
20)2-97
3H2-90
3H2middot9(
31middot12middot90
31middot12-90
345
26amp
249
264
263
256
248
246
252
242
751
bull 659
3
bullbullbullbull 455
514
bullbullbull 7
662
65lt
33 618
7
6
3337 00
213
220
272
20 80
100
as
53 8 471
26S
LocallonWO
L16-I9JO
lZ23IO
L24middot251O
12amp-270
L26-27O
shyL7_
e21
R RI9 R2I87 R3187 R7 REP-GA
API187
SllJ87
SU87 Sl3I87
Sl3I87
SOM07 SW3 SWM
SWM
Tolt ZV1l87
ZV1J87
ZVl-2J90
ZV2Ilt1 lI3I87 lI3I87
lt187 ZV6I87 ZVP1187
Vall Hallemweg WfJSl
SBlltlgroo
VallHall~
loollT Ghancl w8ll
loolhls Ghandl w8ll
Van Hanemweg
Van Hallernweo West
Ttumaredjo 011 neld
Aepubllek
Rapubliell
R RllSdlk
R Aepvbllek
R_ Alimalt eN tJI A~I
AaimacI (N of AepuIIll
RaBtoad (N 01 Aeputil
Rair08Cl (N 01 Aetlltil
T8JTampt~ oillielcl Van Haaemweg
L_
-p~
no
- --
sa
2
2
2 I
2 I I
I
bull I I I
3 2 2 I I
I
I
Formalion
J
2
2
2
2
2
2 6
2
2 2 2
2 2
2
2
2
2
2 6
I
2
2
2
2
2 2
2 2
2 2
2 2
Ooplt m middot780
-440
middot390
middot360
middot590
middot617
middot363
-3005
-220
middot220
-365
middot325
-225
OS -325
-130
middot160
middot240
middot240
-2920
~
-29
-180
middot180 -190
middot180
-180
130
-300
-183
Dale Tomp middotC
pHmiddotLab pHmiddotF1dEC-Lab
SIan Ec-Velcl SIan
Cf
m Bf
m~
C03
m~
Heor
mmo S shymmoIIl
N03
m~
04-orth
mmo Nmiddot
m K
m~
31-12-90
031middot12middot90
31-12middot90
248
249
259
56
bullbullbull 619
7 000
37S
3
0169
0959
1156
0557
23n
1704
0142
1436
0397
0218
0004
1000
2000
1000
0200
31-12middot90
31middot12middot90
31-12middot90
231
228
257
639
607
602
163
305
1410
1692
118-4
007
0070
1560
2519
397 0020
0005
000
0001
0001
0004 2044 0056
31-12-90
03-01middot97
249
271
632
72
505
S lt161
266
3903
5lt
ltlUO
0874
31900
0146
0839
8140
003-4
0185
0 0049 0003
0025
0002
0001
28100
0167
0435
0013
2T1 611 S3 03 0138 004lt1 0005 0001 00310 0016
1Il-o~17 6 157 13018
I 1 165 0400
18-12middot96
31-12-82
267
851
S
S3 26 0198
0112
0241
0144
0057
0052
0007 0145
0287 0030
0 26 641 0400 0095 0001 0006 0556 OOSE
13-05-87 6 00 1001
13-05-87 2B03
31-12-90 252 646 29S -7 1nO 0032 0010 1913 0061
13-05-6
19-11-84
31middot12middot90
middot29
2229
20-03~
Zl
bull S
bullbull S
S
0
10
1401
2l6 0338
0220 0818
0163
0390
0513
0105
0124
0301 0001
2101-44
2392
0100
0071
7 6 as 0400
Jlmiddot12-91 26 S 0= 1737
31middot12middot91 31-12middot91
0amplt17-8
I
I
26
29
Sshy
bull 541
bullbullbull
60
66
9S
70
0338 0400
0536
0amp00
0400 0lt00
0=
0380
0=
0213
391 0024
0001
0595
03lt7
0
0017
00Zl
006
obull
H wmiddot
E~ ~~~~~~~~~~~~ij~~~i~~~~ci~~~j N IN N - N N - N N ~ N N N N ~ - _ ~ ~ N N N N N_
-l-------------------------shyl---I-lt----------------1
i
ij o
o
~~ ~~~~~~~~~~~~~~~~~~~~~~~~ w
8~ ~~~ m ~ ~ cIn i--~----~middot-----~-~-------~~-~i-~middotd---------middot~--~-j
ii ~---------------sect--~ --sect----sect---1
bull ~Oi____=___CN___-__O~ -O_-Olli~~~~~~~~~~~~~~~ ~~ ~ ~ ~~ ~ ~ 11]~~~~~~~~~~~~~~~~~~~~~~~ ~
~u LS ~-llmiddotcuE5No0-ogmiddot-~o~oC~~o-gOoo~ middot-~middot~Clt~~~o~~-~middotli~gt ~~ -middoto-c~middot--middot~~c middot~o~o1I~~iccic 0 oooo~ci-_oo_oo~_ci~o
~~~~~~~~~~~~~~~~3~~~~~~~~~~~~o E oS 0
-~---------~~-~~~~--~~___1
inuuun
-
~1~~~~sect~9~~~~~~~~~~~~~~~~~sect~~S~
81
p ~ - 1
~ o
sect
8
llUiHiH888 coo 0 ci 0 ci ci ci ci
IRO
bulliii I ~ 0 0 D
M
~ ~ M ~ - 0
~
-~ bull~
~
~ ~ ~ ~ ~ ~ ~ ~ ~
~m m m - 0 ~ ~ bull D~ ~ ~ ~ ~ M ~ ~bullo
0 ~ ~ ~bull il middot ~ ~ ~ ~ M ~ ~ M ~ ~ ~ M ~ ~ ~ ~ ~
0 N N 0 ~ ~ ~ ~ ~ bull bullM ~ ~ =0 N 0 ~ ~ M bull N ~ ~ ~ ~ 5 ~ ~ ~ M bull ~ ~bull M 0 M
~ ~ ~ ~ re ~ ~ ~ ~ M ~ 3 M ~ ~ ~ ~ bull ~ ~ ~ bull ~ ~ ~ ~ bull ~ ~ ~ bull ~ ~ ~ ~ ~ ~
g ~~ N N
~ ~ ~ ~ ~ ~ ~ ~ ~ ~ ~ 1l ~ ~ 5~ ~ middot ci g~ ~ ~ bull ~ ~ ~ ~ ~ ~ ~
k~
U oJ
Iu ~p 1-
oJbull
~oJ
~ oJbull
~ ~ Sigt ~ ~ M
~
en~ ~
W
~ 1bull~ ~ re ~ ~~ bull bull bull bull
~
1 bull l ~ ~ ~U ~ S~~
~ ~ ~ ~H - bull
M
~ - -~
~
81~ ~ ~ m 0 0
~ ~tH ~ D ~
Q ci0
1~ ~ bull sect ~ ~
z 0 0
~ 1 ~ gQlt
~ 1N 8 ~~ ~ M
~ ~bull 0 0 0 D 0 ~
bull1re e ~ ~I 0 0 ~ Dbull 0 D -
~l
~l m-~ ~ ~ ~ 0 ~
~D 0
~l ~
~ ~ ~
~ ~B0 - D 0
bullbull N N N
~ ~ ~ ~ ~
bull ~ ~ bull ~ lt ~ ~ sect ~ ~ i ~ ~ ~ ~ ~ 0 ~ ~ ~ ~ ~ ~ 0 M M ~ ~bull - - N -0 bull bull N shy~ ~ ~ 5sect0 0
N N ~~ ~ ~ M 0 ~ 0
g ~ 5 ~ ~
0 0 ~
0 ~
0 ~
00
0 ~ ~
0 MO
bull N sect ~~
~
~ g ~
~
Q 0 0 ~ ~ ~ 0 0 ~ ~ Q ~ ~ ~ 0
M sect 8 ~ ~ ~ ~ ~ ~ ~ ~ ~ 0 0 ~ 0 0 0 ~ D D 0 ~ ~ 0
M ~ M ~ N 0 0
0~ sect ~ bull 8 0 ~ ~ ~ sect M~ 0 0 0 ~ D ~ 0 0 ~ ~ 0 0 0 0 ~
g~ ~ bull ~ igt ~ ~ ~ ~ ~ ~11 ~ ~ ~ ~ middot~ ~ ~ 0 0 0 0 ~ 0 ~ 0 0 0 ~ 0 ~ ~ ~ 0 0 ci ~ ~ ~
~~ ~ ~ ~ 0 0 D ~ ~ 0 0
~ M 8 ~ 0 8~~ ~ ~ ~ ~ ~ ~ m ~ bull ~ ~ N 0 D ~ 0 0 ~ ~ ~ ~ ~ ~ ~ ~ -- 0 ~ ~
N g ~ S 8 g bull bull ~ ~ ~ ~ M ~ ~ i ~ middot Bsect ~ middot B M ~ ~ 0 0 D 0 ci middot 0 D ~ D 0 0 0 bull m - ~ ~- =N
N ~ re N ~ 0 c c c c ~ gt ~
bull~ e0 ~ ~ ~ ~ ~ 0iii 0 U 0
M W w ~ ~ ~ ~ i i ~ ~ ~ ~ ~ ~ ~ ~
~ M
~ g
~ ~
middot ~
N ~ M
N N ~ ~ M
~ bull~ ~- M~ ~ ~ M
~ ~ re N
~ Em ~- bull ~ N Me bull 0
~ ~ ~ ~ ~ - ~ ~ M
middot ~ ~ ~ - ~0 N M
sect N
shy0 Nbull ~ ~ ~ ~-
~ ~ ~ M ~ ~ ~
0 D 0 0 ~
lt e ~ ~ ~ D ~ 0 ~ ~
~ ~ 0 0
N ~bullmiddot S ~ ~ middot~ ~ ~ D 0 0 0
~ s~ 0 0 ~ ~ 0 ~ D 0 0 0
~ ~ ~ 0
~ ~ bull8 ~ bull D ~ ~ ~ ~
bullmiddot ~ ~ ~ ~ ~5 0 D 0 0 D
~ ~ ~ ~ ~ ~ ~
i
W
5
cr
029
Mgbull
0651
fOlt~
0
Mnmiddotlo
0001
01 0002
NH4
0033
SlO2 0260
CO2
TIC-CoJ
5687
DAnlons
11536
E-Ka
~ 10amp49
E_
251
0 middot292
-14o
0 middotc -1284 0
H
TU
SftCl Sr~r
SINI-GR 1097 0209 0030 0136 ~763 3047 3139 -149
SlNlI-GR 1172 0 0019 0113 2749 3047 3437 -601
SOMOl SOMOI
SOMOI
1amp48 1212
1020
893 00 1130 0022
Cl002
0003 0002
0001
0D18
0099
0292
0325
9405
11507
129
60144
49106
44478
60414
45D~
38915
~22
26
006
middot~90
-263
-126
-130
-019
061 0 1317
SCM02 1322 -23lt 10128 098 46086 335
SCM 222 0905 9595 30524 33511 0175
SOMl)4 SC_
0823 1247
1769
1563
0001 9508 12260
44289
46696
51119
42592
-716
460
5005 0149 1399 8561 42853 352llJ 969
SOMOS 1746 2181 0001 10287 58808 62227 -282
SOMOS 0873 2057 9557 56- 58056 -158
SCMOO 0199 2016 6161 18691 16652 5n
5010410 aU9 135El 9934 41393 34375 02 SOMll 022 1563 10532 48078 41199 771
5010412 1422 1152 9amp42 35096 40467 -711
501413 1347 1316 0001 un 42970 46345 -378
501418 0748 1028 7635 16936 17166 -087
501416 0623 0823 10032 18695 15375 974
SOMI8 1197 1563 9835 40029 44188 ~ 50M22 0249 1975 8535 23361 20193 727
SOMmiddotWl 0773 2345 8149 18135 17371 215
SWM 0399 0617 0266 2604 117
flA 0299 0823 0059 2090 1792 10574 10697 058
T2C9 0653 2810 0553 0029 0001 0053 0908 2207 5170 14979 0 middot271 middot153 -1863 1t8 -1255 070964
T31 0324 0699 0075 0181 0389 9927 8850 574
TAOS 2669 3209 13531 919ZJ 265 435 TAM1-GA 1447 037 0010 015 03 4164 4897 809
TAMU-GA 222 090 0005 0136 2510 4074 467B -691
TLE5
TOI
TOil
0988
1739
0743
2230
22400
49300
0031
0045
1187
0063
0021
0016
0063
0005
0001
0071
0063
0072
0379
6019
0232
0 0425
0339
20644
19787
16591
187388
478511
17382
185067
481407
233
0 -030
middot298
-198
11 5
-12B
-142
~3
middot2042
-2254
207
070929
070918
W
T013
T015
T017
T019
TOO
TO T025 TOO
T05
TO TOO TI4191
TT W02
ctshym~
06n
0690
0654
1269
1129
1489
1209 1589
1519
0B71
1139
0267
0279
0131
Mlt m -t7600
41800
39900
37-200 36100
35700
31600
15300
13300
40Boo
46000
0496
0440
0526
Fe-tO
- -shy00-t9 00laquo
0063 0072
0049 0044
0053 0073
0042 0049
0048 0081
0426 0357
0025 0032
0024 0061
OMB 035
0051 0055
000lt 0001
0007 0001
Mnmiddotlo
m~
0005
OOO-t
0005
0036
000lt
0006
0005
0008
0001
Nmiddotlol
m~
0054
0067
0079
0047
0070
0046
0173
0D48
042
0068
0064
0004 0001
0010
NH4
m~
6300
4779
6739
6539
7879
8939
2109
2250
51~9
6059
006
0054 0104
5102
m~
0725
1040
0472
0273
OAI20
4390
0339
0291
0556
0653
0233
0
Co2-- TICmiddotCaI
m
20248
18438
18105
15543
12745
14886
14054
16241
18608
as3 5 5392
20lt
tmiddotAnO1s m~_
493953
462443
468179
422269
393363
36284
356609
168957
152926
445254
518615
9936
10675
14amp46
tmiddotKalJons
m
-tamp4952
401891
412)15
413073
387195
391259
402933
177(l~
172136
429471
456883
10092
9725
133130
E=I
302
701
613
10
079
middot377
middot610
middot233
middot591
IBO 633
-018
466
449
0 middot092
middot102
middot102
096
-103
middot133
-114
-125
middot127
-131
-228
middot271
middot)01
middot252
H ~
middot76
-76
middot35
middot63
middot97 ~
-80
_114
middot66
-127
-157
middot159
-152
c c Yo(pmcJ
middot660 $26
middot271 435
-ZO25 916
-259 665
1474 528
middot1752 39
963
H TU
sCI 00685
0101
0192
0196
-0163
035
-1131
SrSr
070917
070919
070916
070915
070922
070921
070925
070920
0109201
070919
0709371
WI 0174 0576 0057 0250 1695 7133 7107 018
W-10 0012 0045 0003 0003 0192 1736 0651 0038 LOI
W3A W-ltA
WWCS
0011
001
0341
0049
0039
2231
000lt 0006
0021 0015
0003
0003
0001 0 5
0231 0253
0908
4319
5151
5868
0936
0931
18440
0791
0802
16252
840
631 middot30t -137 1866 bullbull 0
wws 0351 05gt0 0103 0002 0001 0063 0694 -858 9n6 8725 5 middot284 -118 1729 5
ZOR-GR 0249 0 0035 0007 3403 5= 6012 -697
ZOR-GA ZVl2J90
ZV1-2J90
0324
023 0272
0854
0266
0011
0175
0023
0033
0009 0012
0007
0002
0031
000lt
0164
0817
0173
1613
0909
2739
2095
1791
9092 0B15
9612
-200
0833
-381
oJHI
middot109 -324 180 middot1116 1043
ZVl-2J90
ZV 0610 -00 0098
0214
0021 0076 0658 3251 9380 0400
9JH 0428
018
middot338
-279 145 -1299 467 035
~ willi IncompIeIIll ana)ys8S and e1ecl1O-OOUlJailtl enor gt 10 shy
011500 0006 0014 0057 0001 0055 0026 0356 0267 1427
W 0017 0012 0007 0001 0015 0001 0104 0133 -1224
01laquo100 0006 000 0002 0002 0089 0174 0125 10
~ 0 2757 0017 0020 8369 13662 middot2-t11 28-0 3
~ 0000
~ 10000
~
bull bull
ltbull
~ e~
~ ~ ~ ~ ~ c C N c
~ e 0
~
1 ~ II ~ ~ ~ ~ ~
~~~~~~~~~~~~~~~~~~~~88gsect~sect~ ~C~sect~~~~I~~~~88
~H~~~~5 ~ ~ l~_ll Hlii~l1H ~~ ~ ~ ~ori~ l1on~NOCOl100
~5~~Uil~ ~ ~ ~~~~ ~~~~n~n o0055 c I Q~ ~~ _IJOlDOlllgCl
~~ ~ H ~sect ~
~
~ n
liC ~o c
~ 1c
~ ~ u H 2~~ f8 ~ ~ c c c ccc c
~~~ ij amp C~--B~ ~~ ~ _ c
~o~oo000 0000 c c c
U~~H e ~ ~ ~~ll~~~ liiJf3 h~8-e1IQ~ OOClClON c OQClClOCJ 00 I) 0 0 oood
~5HU ~ ~
~ 5~i~i ~altamplmiddot ~ ~ ~ ~ -~ ~
cicocia II - (oj qOClOOOO C C OlJOO o 0 0 ci
zw 3 ~
~~~sectsect~~~~~~OC~~~~~ c_~~~~~~~~-oc-----~----- ~~ ~~~ ~~ sect~~
~=~hH~~
B qshy
F pI b ft~
iP~-1
il II ~l ~l ~l
il n II H ~l l ~l
I
1gt il ~
c
~ 0
- -~ d F ~ pi I
p ~ II ~
- ~
ft~ ~ ~ ll bull
~ ~ ~
Ie~ ~8 ~ ~ ~ ~ 1 ~ ~ ~ ~ ~ ~ ~
1rrin ~~ ~ ~ ~ ~ ~ ~ ~ i ~ ~ ~ ~ secti ~ ~= ~ a~ ~ ~~~ ~
11 ~ B ~ ~ ~ h ( ~ ~ ~ ~ ~ s ~Ta n ~ ~ secti H ~ ~ cioo~2 __ cid~ei o_~ei ci O_OOOO~lD~
UIU g~ ~ ~ ~ ~ ~~ ~~ ~ fn ~ ~ ~ ~ _c
n ~l 3 ~ ii ~ H~
~l R ~ ~ -~ ~
~~~~ c c c d d
H ~ ~ ~~ h l 1 c cc c
n ij H l ~ c c c c
It ~ BB ij Hun as_ q q
c ccc
HIB --~H--U~~ pH~n-~~~~-B~~ci~~~~oo~o o~ooooo~~~oo~o~oo
il l ~ c
l ~1 ~ ~ ~~8~~ ~ $ 8 1 ~~~~q
_ c - c c c 000000 oltiooc
~l BI
~ ~ F~H~ ~~ ~ 81 ~5 ~un d~ O~~OCl~ cc c cc 0_ 0 0 c
w~ ii ss~ ~ ~~~sect~~i~~~~~~~i~i~iili ij~~~~1
00 00
W CO nmolo1
__ rrmtI0llmlll1it rmd1 rrmoIt1
NH4
rnt1lOIM
SlO2
ImdII
CO2 TlltgtCoJ IIWllOlo1 ~
rIIIIOI4
rrmoL1
0
lW
C
c (pmC
H TU
C1 lW
L18-1Ml 2A95 21amp4 O1lSC1 O~ D1U 0257 t272 1010 11024 -8321 -254 -10 48
l22- bull bull 1173 U bull 208 51 L24-2SG 0379 OA93 0J)49 0001 004 0121 2068 3654 ~ 11A5
L26-27JQ
13-490
bull 024
0369
009 0128
O2Z
11 0100
0090
~ 0178
OOO
003 0021
0023
1531
0033 3568
52n 2~
1331
3~
5167
middot148
zS 435 -995 283
l7-amp90 D28 0369 009 OOO 0034 0527 27Z1 2083 t$ 461 021 094 O~75 001 ooot 0001 001 D3E O27i 40~ 30511 121 258 _141 13
RU 000 o~ 0D8 0000 000 oon 0133 028 OM middot249C -2391 Rt 001 0040 0016 aDIM 0001 O04e 041 0433 0631 middot1860 RM1 0769 0023 1301 1584 7830
117 28lt 003 bullbull bull 57 middot102lt R7 000l 0024 001 0012 0008 0560 023 405 -262 -136 -2040 U57 28
REP-GR 0034 0041 0033 ~002 0104 G84O 0380 ~~ middot95 PlIO bullbullr bull11 151 St7 0035 0001 l(101 o~n 885E ~ ~la~ ~ ~ ~ SLva7 0239 Oe13 0-09i 001 0019 0282 3131 3917 -1115 middot295 middot129
SL3I87 0112 0003 1401 0230 7180
S0M01 OM 081 0003 1101 24380 middot2871 SW3 0219 0079 0006 0007 0059 1~ 1zJ9 07H 2amp1 -301
SWN 33lt 220 bull or ~ SWN 02 549 32m HI 0181 un 02i4 0006 000 14r -U7 -488t
ZV1187 0021 0400 OQC~ 8100
ZV1187 001 001 0031 0005 f99C 0148 861 ZV1middot2I9O 0029 0088 0031 0027 U78 1712 332C 1~ 524
ll2fI1 0035 000 0070 7021 rri3I87 0029 0029 0019 0014 0n4 0552 167 -311 01
ZVJIe1 0034 0600 0068 79amp4 ri4l87 0069 0400 0178 3UI
ZV6l81 0008 0-400 0018 9231 ZVP187 OM 0012 001 0D04 14T 0413 0284 1851
____~_ i_ _
w
ZVPlf87
15172 ISOOW
cr I So shy M mmolII mmolII shy mmolII mmolII
0013 0018 --shy N
SI02
mmolII
00
CO2 TlC-Coo U- mmolII mmolII mmolII 79lt
shylt
SO
0 ~ -260 ~
~H 0 c
H TU
- 5 11
~Cl ISlt
1B172 middot270 9
~ - middot270 11
21112 middot219 13
3182 middot245 -1302 53
3I81l 3191
~ middot13 53 115
I iOI7l AU-G SIL-GR2 all-GR2 GMD-19
joMo-1ltW7L1 lOMlOP
30
~ ~so ~30 ~ -374 254
~-30
_184
-10~
- middot1270
-111amp -2197
57~
95
2U
bull
os
4A
1
P REP-GR
~20
~20
35 35
REPmiddotTOT REPmiddotTOT SW
~30 10amp
101
3 I
shy
Annex IV
Plant species and photosynthetic pathways in the savannah belt oj Suriname
Species Fuuily Salannah Photos Type pUlhwny
PaSI(flfllll puJclJellum Palkml micralllJwlII ulgelOCarpus tremllills
bull RllyllcllOspora gramillue RIlYIlcJwsp01ll wIlis Pepawl1llls polyridlOiaes Sderia pyramidalis Abolhoda ameriClillo Xyris glfilllltmss TmchypogOlI pllf11l0SIIS Bulhostylis cOlliem Xyris slrillCmenss Lllgenactplfs weigeltii Mesosellllll loliiforme 8ulborrisllSCiculllta Mill(clirplIs di~(olor
Amlloplls pulcher Hypogonilf1l ljrglllwII PlllieUIII Jftllodaides AXOIIOI1llr drsiles LepIOCOI)PlliwlI IllllCllllIII PllIIClIllIllenogtfllII RlrYllduupoll globml Mcmsellll1l (lIelllltll~e
bull
RIlYlldwslmltl blllI)(1lI SllgOIICIIIIIIIU lImellallls Palklllll polymlllllll COllwlill lemCOSll
AXlIIwplIsflahellifol7llis PUicUIII nflt~ei
TlmuWI pelmsll Sp(II(Jlwllmiddot (Ilhellli~
Bulboslylis jlllldfomi~middot
PoaccOie Poaceae Cyperllceae Cypemceae CyperilceOie Eriocaulaceile Cyperaceae Xyridaceae Xyridaceae Poaceae Cypemceae Xyriduceae Cyperaceae POllceae Cypemceae Rubiaceae Poaceae Poaceae POilceile Pouceue PoaceOle POOlceOle CyperOlceOle POOlceue CyperOlceOle EriocltlulceOle Poceae Melstomuuceu Puceae Pouceue Pmleeue Pouceae Cypemceuc
Zan Zan Zan ( Kus) Zun Zan Zun Kils Zan Zun Kus Coe Zan Kas Coe Zun Kus Kas Zan Kas Kas Kas Wei Coe Wei Wei Wei Zan Kas Wei Coe Zun Wei Coo Zan Wei Coe Zan Zun Zun KOlS Coo Coo Coo Coo
C4 C4 C4 C4 non-C4 1 C4 C4 C4 C4 C3 C4 C4 C4 C4 C4 C4 C4 C4 C4 non-C4 C4 non-C4 C4 C4 C4 C4 C4
Bulluwylh ((Ipillli~ vOIr rellilifoli Cyperlceae Coo C4 DtniIIl1 CUpall Dillcnicee Kus non-C4
Table IV1 Species of the open svltlnnhs
Species FUlllily SaVlllllmiddotiIh Phottls typc- patlnvay
Lkana lcana Chrysohilanlcca~ Km Zan Chlsia fockfcmu Clusiaecle Zan I Ka~l
HImiria halwlllicmiddotm var Imlmlllifenl HUllliriltell~ Kas Zm Humiria hafamiJimiddot( arj1oli1mJlda HUllliriltltel~ Kas Ternslmemia plcrata Th~aeeae Kas Zan Swarrzia Jmma Lcgum-CacsalpinioidclIc Kas Dinorphantlra conjllgata Lcgum-Cacgtnlpininidcac Ku Retiniphyllum sdwmlmrRkii Ruhimcac Zan Marayha opma Sapimlllcll Kas MIrcia sylvutica Myrtaccae KH~
Bactris campeHrir J11Inmc 2m Conollorpha maRlwliifolic Myrsinaecac Zan KilS
Ormasia co~lIIlotcl Lcgum-PapililllltlidcilC Zan 1ibollehina Uflfro Mclaslolllataccc WclCoc Imperata hrasiliellsis Ponccae Cae Byrsollma eoccoloblfillia Malpighiaeeae Cue Byrsoltima Imiddoterbmdfolio Malpighimcae CDC-
Scleria pymmhlalis Cypemceac Zan Sclerin braetellta Cypcraccltlc Coe Marliera mOllana Myrlaceac Zan Cfratella americana-----_---- shy Dillcliaeeae Wcl Coe
Table IV2 Specics of savannah buhes
Species Fmnily Photos pnlhw~y
CIIIsn ffJckeana Clusiaceae non-C4 Humirj balsamifera Hurniriaceae Somia ballnia Legum~Cnesalpinioideae C3 llex maJ1inialla Aqllifolimenl~ CJ Oeatea scllombllrgkano LlUraceae Dimorplrandra eOlljtl~acl Lcgurn-Caesalpinioideae non-C4 lsertia aneeps Ruhiaeclle C3 Ueania divaricato ChryS(lMlanuceae PlOtium lIeplaphyUm Burseraceae C3 Tapirora guiallensr Anncardiaceac CJ AspidogtpcrlllCl magraviamm ApoeYllltleeae CJ ltlnd CAM n(Jmbaxj1a~if1orllln Bornhaeaeeae C3 Matayba opaea Sltlpindaccn~ non-C4 lieania illeana Chrysobalamllllt1c Conomarpha muglloliifolio Myrsinneeae non-C4
~~~ierea mo~~~ _ Myrlat~~ ~__ __~~ _
Pdble IV3 Species of dryland forcsl
Legend Zan = Savannahs of Zandcrij type (poorly drained white sand savannnhs) Kas = Savannahs of K3siporn type (extrcrnCly well drained white snnd savmnnhs) Coe = Savannahs of Cocscwijne type (well drained brown loamy sand to sandy loam S8-annahs) Wei = Savnnnahs u( Welgclen type (well draincd clay savannahs) Spe~ies are based on studies of H~yligcrs (1963) Votn DOllsclanr (1965) and JanSllll (1994) Photosynthetic pathways are derived form dalahases of Dallwit7 (1980) Dallwitz et al (1993) and onward and Ehleringcr et al (1997)
Inll-C-~ D o o nnn-C4 CJ o non-C4 (]
111l-C4 (4 llo11-C4 norimiddotC4
192