the effects of sox on firms audited by big-4 versus non ... · pdf filethe effects of sox on...
TRANSCRIPT
The Effects of SOX on Firms Audited by Big-4 versus Non-Big-4 Audit Firms
Robert W. Rutledge
Texas State University
Khondkar E. Karim University of Massachusetts Lowell
Xiaoqin Luo
University of Glasgow
This study examines the effectiveness of the 2002 Sarbanes Oxley Act (SOX). We investigate the earnings management (EM) of companies during the pre-SOX period (i.e., the scandal period), and the post-SOX period (but prior to the enactment of the Dodd-Frank Act). We find that EM of companies audited by the Big-4 peaked during the scandal period, and declined during the post-SOX period. However, the EM of firms audited by Non-Big 4 audit firms did not experience a decline in the post-SOX period. Further tests suggest that SOX had greater reduction in EM for companies audited by Big-4 audit firms as compared to those audited by Non-Big 4. INTRODUCTION
The 2002 Sarbanes-Oxley Act (SOX) was passed by Congress as a response to the large number of
high-profile corporate scandals during 2000 to 2002. Although many studies support the viewpoint that SOX has improved reporting quality, there are also studies that challenge the benefits of SOX. One of the primary purposes of SOX is to improve the quality of reporting through the restriction of earnings management.
Previous research has found a significant increase in earnings management in the years prior to the passage of SOX (e.g., Cohen et al., 2005, 2008). This is followed by a subsequent decline in earnings management in the post-SOX period. Thus, evidence suggests that SOX was successful in reducing earnings management, and improving the quality of financial reporting.
Financial reporting quality and earnings management are associated with audit quality (e.g., Becker et al., 1998; Ebrahim, 2001). Companies audited by smaller auditors are found to have more earnings management that companies audited by the largest auditors. Thus, the largest audit firms allow less earnings management than smaller auditors, and companies audited by the largest audit firms have higher earnings quality.
There are two issues of concern in the current study. One is the issue of whether or not SOX had an impact on earnings management. The second issue is related to differences in reporting quality (i.e., the amount of earnings management) of companies audited by the largest audit firms versus smaller audit
86 Journal of Accounting and Finance vol. 14(1) 2014

firms. The purpose of this study is to combine these two issues by examining how differences between the largest and smaller audits change over the periods surrounding the passage of SOX. Any indication of disparate impact of SOX on these two categories of audit firms will provide new information about the effectiveness of SOX.
The current study examines this topic with extended testing period, which ranging from 1997 to 2008, thus assess the trends of the earnings management difference between firms audited by Big 4 (Deloitte, Ernst & Young, KPMG and PricewaterhouseCoopers) and Non-Big 4 audit firms in the pre-SOX and the post-SOX. The full testing period of 1997 to 2008 is divided into two sub-periods: 1997 to 2001 is defined as the pre-SOX period, and 2002 to 2008 as the post-SOX period. These periods are further subdivided into two testing windows each. The pre-SOX period includes: (1) the period prior to the outbreak of high-profile corporate scandals (1997 to 1999), and (2) the “scandal” period (2000 to 2001). The post-SOX period is divided into: (1) the period after the passage of SOX and prior to the implementation of Section 404 (2002 to 2003); and (2) the period after the implementation of Section 404, but prior to the passage of the Dodd-Frank Act (2004 to 2008).
A modified Jones model (Dechow et al. , 1995) is used to calculate discretionary accruals of the sample firms. This provides a direct observation of the changes in earnings management of the firms over the testing period. Both Big-4 and Non-Big-4 audit firms’ clients are found to experience a decline in discretionary accruals subsequent to the passage of SOX. However, the most interesting finding is that the Non-Big-4 auditor category had a lower level of discretionary accruals than the Big-4 auditors in the pre-scandal period from 1998 to 1999, but this difference reversed after the passage of SOX. That is, the discretionary accruals of the Non-Big 4 auditors surpassed those of the Big-4 auditors after the passage of SOX.
In addition to the direct observation of the discretionary accruals of the samples, we also use two additional models similar to those used by Cohen et al. (2008) and Holder et al. (2013) to more formally test the effect of SOX on the earnings management of the sample firms. These models provide additional support that SOX has enhanced the overall earnings quality of the companies audited by Big-4 audit firms, while companies audited by Non-Big 4 audit firms have experienced a deterioration of earnings quality in the post-SOX period. Thus, SOX has more effect on improving earnings quality of the firms audited by Big-4 audit firms than companies audited by Non-Big 4 audit firms.
This paper contributes to the ongoing debate about the effectiveness of SOX on reducing earnings management and improving earnings quality. Furthermore, this paper also provides evidence on the difference of earnings management between companies audited by Big-4 and Non-Big-4 audit firms by using an extended testing period to compare the two categories of audit firm size.
The remainder of this paper will be organized as follows: Section 2 reviews previous relevant literature and provides the development of testable hypotheses. Section 3 explains the research methodology. This is followed by Section 4 where the results of the data analysis are reported. Lastly, Section 5 concludes the study with a summary of the findings, and provides important implications for regulators, practitioner, and academics. BACKGROUND LITERATURE AND HYPOTHESES DEVELOPMENT High-Profile Corporate Scandals and the 2002 SOX Act
The outbreak of US high-profile corporate scandals started with the exposure of Enron in 2001 (Forbes, 2002). As a former world-leading company, Enron was accused of various activities such as boosting profits and manipulation of the market. This was followed by a large number of other high-profile cases, including WorldCom. Much of the problems surrounding these scandals involved the use earnings management by firms to meet or beat market expectations. The revelation of these scandals caused huge losses, and damaged the US market and investors’ confidence (Jain et al., 2008), and also exposed many existing problems of the governance system, such as audit failures (e.g., Authur Andersen), and corporate governance failures.
Journal of Accounting and Finance vol. 14(1) 2014 87
SOX was passed by Congress in July 2002 as a response to the outbreak of high-profile corporate scandals during 2001 to 2002. Major stock indices had experienced a 40% decline by that time (Coates IV, 2007). It was expected that SOX would improve reporting quality, and regulate the behavior of management and auditors, thereby restoring investors’ confidence in US markets.
Key provisions of SOX include: (1) restricting the use of outside auditors for non-audit services, thereby improving auditor independence and audit quality (Section 201); (2) requiring the quarterly and annual disclosure of internal control information (Section 302); (3) requiring managements’ evaluation and attestation of the effectiveness of internal controls (Section 404); and (4) imposing severe penalties on CFOs and/or CEOs that fail to ensure that the financial reports are complied in accordance with the Exchange Act (Section 906). Section 906 also regulates the behavior of management and reduces their incentive to manage earnings (Bartov, 2009). SOX was passed in 2002, however, the primary provisions became effective in August 2003 (e.g., Section 302 and 906), and in 2004 (e.g., Section 404). Previous Earnings Management Research Earnings Management Research in the Pre-SOX Period
One of the primary issues of concern for SOX is earnings management. Healy and Wahlen (1999, p. 366) state that earnings management occurs when “managers choose reporting methods and estimates that do not accurately reflect their firms’ underlying economics.” Earnings management results from information asymmetry between information users and managers that have the power to make judgments during the preparation of financial information (Richardson, 2000). Many factors provide incentives for managers to practice earnings management. For example, CEOs whose compensation is tied to changes in their firm’s share price have an increased incentive to perform earnings management (Bergstresser and Philippon, 2006).
The SEC made efforts to control earnings management even before the outbreak of high profile scandals (Munter, 1999). However, their efforts were not able to provide sufficient improvements in reporting quality, and did not prevent the outbreak of scandals. Earnings Management Research in the Post-SOX Period
Subsequent to the passage of SOX, much of the earnings management literature focused on the effect of SOX on the overall level of earnings management (e.g. Cohen, 2005; McEnroe, 2007), and how SOX affected the earnings management behavior of different categories of firms. For example, Litvak (2007) studied the differential effect of SOX on non-US firms cross-listed in the US and other firms, and concluded that investors expected a negative effect on firms that adopted SOX. Others studied the differential effect of SOX on accelerated versus non-accelerated filers (e.g., Gao et al., 2009; Iliev, 2010).
Cohen et al. (2005) analyze trends in earnings management in the pre- and post-SOX periods. They find an increase in earnings management during the pre-SOX period, which reaches its peak in 2001 and 2002, and a sudden decrease in earnings management following the passage of SOX. Similarly, Lobo and Zhou (2006) and Depken II and Ouyang (2006) find a significant reduction in discretionary accruals (an indication of earnings management) during the period subsequent to the passage of SOX. Thus, these studies add support to the suggestion that SOX has the effect of reducing earnings management.
Li et al. (2006) examine the market reaction to SOX events by observing firms’ abnormal stock returns. Their analyses indicate that the more firms used earnings management techniques before SOX, then the greater the amount SOX restricts their earnings management and improves reporting quality.
McEnroe (2007) suggests that the rule-based characteristics of US GAAP provide greater flexibility for manipulating earning, but the principle-based characteristics of SOX improves the credibility of information provided by the managers and auditors, and should bring higher quality financial information and the elimination of earnings management. McEnroe’s survey results, however, suggest that the participants (CFOs and audit partners) did not agree that SOX had led to a large decline in earnings management.
Cohen et al. (2008) provide additional evidence of a decrease in earnings management following the passage of SOX. However, they suggest that this cannot be interpreted as a single influence of SOX. They
88 Journal of Accounting and Finance vol. 14(1) 2014
find that the decline of accrual-based earnings management is accompanied by an increase in real earnings management (e.g., increasing discretionary spending on R&D, or maintenance, and/or delaying new projects. Real earnings management is more difficult to identify and is more costly to shareholders. They question SOX’s effect on regulating earnings management behavior. Dechow and Skinner (2000) also suggest that the existence of earnings management may not have changed, but rather it is just in different forms.
One of the most controversial provisions of SOX is Section 404. It requires management to provide an assessment of their firm’s internal controls, and an attestation of the report from the external auditor. This provision became effective in 2004 for accelerated filers, but has never become effective for non-accelerated filers. The intent is to improve internal control of firms so as to regulate theft and fraud by management and reduce earnings management.
Bedard (2006) finds that the requirements of Section 404 reduces earnings management and improves earnings quality. Chan et al. (2008) examined firms with disclosure of internal control weaknesses under Section 404 of SOX. Their results indicate that internal control weaknesses will lead to more earnings management, and thus suggest the implementation of Section 404 brings improved reporting quality.
The improvements in earnings quality from SOX come at a cost. Iliev (2010) examines the cost of Section 404 by comparing small firms that were just above or below the compliance threshold. His results suggest that the costs of Section 404 compliance are greater than the benefits, and it is particularly expensive for small firms.
Gao et al. (2009) discover an unintended consequence of SOX. That is, small firms have an incentive to stay small intentionally due to the high compliance costs of SOX. Nondorf et al. (2012) also study the relation between SOX and company incentives. They study firms that are near the compliance threshold of Section 404.Their results provide further evidence that firms with market values near the threshold temporarily lower their market value to avoid compliance. This objective is achieved through the use of accrual-based earnings management to lower investor’s expectations, thus lowering stock prices. Previous Studies on Audit Quality and Earnings Management
Previous studies provide evidence of a relationship between audit quality and earnings management. Teoh and Wong (1993) examined whether the responses to earnings surprise were different for Big 8 and Non-Big 8 clients, so as to reveal the potential relation between auditor size and audit quality. By comparing the earnings response coefficient of various audit firms, they provide evidence that large audit firms (Big-8) had higher quality of earnings reports than small audit firms. This suggests that auditor size has a positive relation with audit quality.
Subsequently, Becker et al. (1998) examine the relationship between auditor size and audit quality. Discretionary accruals were used to measure earnings management. They find that large audit firms (Big-6) allowed less earnings management behavior than small audit firms. They suggest that this may be due to large audit firms’ superior ability to identify earnings management, and their greater opposition to such behavior in order to maintain their reputation. Reynolds and Francis (2001) find similar results for Big 5 auditors versus non-Big-5 auditors.
Ebrahim (2001) also hypothesizes that higher audit quality leads to less earnings management. The study controls for the tenure of the auditor, and the importance (size) of the audit client. The sample of audit clients is separated into the firms audited by large versus small firms. The results suggest that audit quality is negatively related to earnings management.
Maijoor and Vanstraelen’s (2006) study the differences in audit quality and audit environment in four European countries. They find evidence of a significant negative relationship between audit quality and earnings management. Dang et al. (2011) study a period from 1980 to 2000, and use a cross-sectional modified Jones model to explore the relation between audit quality and earnings management. The study’s results find that firms experiencing audit failures have more earnings management problem than those did not. This provides additional evidence of a connection between audit quality and earnings management.
Journal of Accounting and Finance vol. 14(1) 2014 89
Asthana et al. (2009) examined the impact of the high-profile corporate scandals and passage of SOX on audit fees. They identified significant increase in audit fees from 2000 to 2002 (the year SOX was passed). Additionally, they find that Big-4 audit firms increased their fee premium over non-Big-4 audit firms after the various scandals and the passage of SOX. The results imply a trend towards increasing audit quality by the largest audit firms.
There are many studies of the relation between audit quality and earnings management, but most of these studies were done prior to the passage of SOX, or shortly thereafter. The current study is unique in that it: (a) compares the earnings management of firms in four discrete periods before and after the passage of SOX, and (b)gives consideration for different levels of audit quality within each period. Hypotheses Development
From the literature reviewed above, studies have suggested that there has been a decline in earnings management behavior between the pre-SOX period and the post-SOX period. This suggests a improvement in reporting quality. It is likely that SOX is effective at reducing earnings management, and the direction of effect (from more to less earnings management) should be the same for both firms audited by Big 4 auditors and those audited by non-Big 4 auditors. That is, both should have less earnings management in the post-SOX period as compared to the pre-SOX period. Thus, Hypothesis 1 is stated as follows:
H1: Firms audited by Big 4 auditors and non-Big 4 auditors will have reduced earnings
management in the post-SOX period as compared with that in the pre-SOX period. Previous researcher suggests that firms audited by the largest audit firms have less earnings
management behavior than firms audited by other audit firms. Particularly, prior to the passage of SOX, firms audited by big audit firms usually have higher reporting quality than firms audited by non-big audit firms (e.g., Becker et al., 1998; Ebrahim, 2001). SOX may have a different effect on different types of firms (e.g. accelerated and non-accelerated filers). Thus, we will examine the change in earnings management behavior over various periods surrounding the passage of SOX for firms audited by Big-4 auditors versus non-Big-4 auditors. The following hypothesis stated in the alternative form is suggested:
H2: SOX has a different effect on the change in earnings management behavior for firms
audited by Big-4 auditors as compared to firms audited by non-Big-4 auditors. RESEARCH METHODOLOGY Sample Selection
The population of sample firms used in the study includes all NASDAQ firms listed in the Datastream database. NASDAQ listed firms are chosen because NASDAQ is one of the largest exchanges in the world, and has consistent and available data. Yearly financial data from companies was extracted from Datasteam, and filtered for missing information.
The full testing period is from 1997 to 2008, and it is later separated into the pre-SOX and post-SOX periods. The first pre-SOX period is from 1997 to 1999, and is defined as the pre-scandal period (before the outbreak of high-profile corporate scandals). According to the Forbes Corporate Scandal Sheet, major scandals started in 2000. The second pre-SOX period is from 2000 to 2001, and is termed the scandal period. The first post-SOX period is from 2002 to 2003. Although there were some scandals at the beginning of 2002, it is more significant that SOX passed in that year (Cohen et al., 2008). The second post-SOX period is from 2004 to 2008, and includes the period after the implementation of Section 404 and prior to the passage of the Dodd-Frank Act.
We divide the observations of companies into two categories: those that are audited by Big-4 and those that are audited by Non-Big-4 Auditors. It is assumed that most of the Big-6 or Big-5 clients are included in the Big-4 Auditors category because: (1) most of the reductions of the number of big audit
90 Journal of Accounting and Finance vol. 14(1) 2014

firms occurred due to merger (other than Arthur Andersen) which should not have a significant impact on the distribution of clients between those noted as big audit firms and other audit firms; and (2) most of Arthur Andersen’s clients were absorbed by the remaining Big-4 audit firms (Asthana et al., 2009). Therefore, the distribution of clients between the Big 4 and Non-Big 4 Auditors categories should not be affected by the existence of former Big 6 or Big 5 Auditors across the testing period.
Table 1 summarizes the information of the sample selection. The second column in the table shows the number of NASDAQ firms included in the Datastream database (2502 firms). These observations are filtered, whereby firms are removed that have missing information; or where Total Assets, Revenues or Market Capitalization is 0; or where the audit firm is not disclosed. The number of all firm years included in the study is 12,871.
TABLE 1
SAMPLE SELECTION (1997-2008)
Year Total
Observations
Less Companies with Missing
Data
Companies Audited By
the Big 4
Companies Audited By Non-Big 4
Total Sample Companies
1997 2502 -1879 451 172 623 1998 2502 -1796 512 194 706 1999 2502 -1645 587 270 857 2000 2502 -1548 672 282 954 2001 2502 -1503 707 292 999 2002 2502 -1448 752 302 1054 2003 2502 -1415 777 310 1087 2004 2502 -1336 841 325 1166 2005 2502 -1254 901 347 1248 2006 2502 -1175 962 365 1327 2007 2502 -1105 1021 376 1397 2008 2502 -1049 1051 402 1453 Total 30024 -17153 9234 3637 12871
Note to Table 1: Missing data represents data that is unavailable or unusable The remaining firms are separated into firms audited by Big-4 auditors or Non-Big-4 auditors. The
total firms audited by Big-4 auditors is 9,234 (72%) and Non-Big-4 is 3,638 (28%).This distribution of firms is similar to previous studies (e.g., 75% and 25%, respectively in Ebrahim, 2001) in that most sample firms are audited by big audit firms. Related Models Measuring Earnings Management
The first model used to measure earnings management behavior is the modified Jones model (Dechow, 1995), which is an improved version of the original Jones model (Jones, 1991). It is formulated as follows:
TAit/Ait-1 = α1(1/Ait-1) + α2[(ΔREVit – ΔRECit)/Ait-1] + α3(PPEit/Ait-1) + εit (1)
where
Journal of Accounting and Finance vol. 14(1) 2014 91

TAit = total accruals of firm i in year t, measured by using net income of the firm minus operating cash flow of the firm;
Ait-1 = total assets of firm i in year t-1; ΔREVit = revenues of firm i in year t less revenues of firm i in year t-1; ΔRECit = net receivables of firm i in year t less net receivables in year t-1; PPEit = property, plant and equipment of firm i in year t for company i; εit = the residuals (discretionary accruals) of firm i in year t.
The residuals (i.e., discretionary accruals) of this model are used as proxy for the earnings
management behavior of firms, and the absolute values of discretionary accruals are used to represent the magnitude of earnings management behavior. The positive discretionary accruals and negative discretionary accruals are also included in the analysis.
One deficiency of the original Jones model is that it regards revenues as nondiscretionary, and the model fails to detect earnings management if it is done through revenues (Dechow, 1995). The modified Jones model corrects this deficiency by controlling for the change in receivables, and provides less biased indications of earnings management. This model is one of the most widely used and effective models for the detection of earnings management.
After the discretionary accruals of Big-4 and Non-Big-4 firms are calculated for each year, their absolute value change over the testing period is assessed. The difference is examined and additional tests are run to confirm whether the results have statistical significance. Effectiveness of SOX
Models 2 and 3 are used to test the second hypothesis related to the impact of the passage of SOX. The models previously used by Cohen et al. (2008) and Holder et al. (2013) are used in the current study to assess the effect of SOX on earnings management of certain categories of firms. Model 2 is presented as follows:
Depit = β1 Scandalit + β2 Post-SOXit + β3 Controlsit + εit (2)
where Depit = the dependent variable equal to the absolute value of discretionary accruals as measured in
Model 1. This variable proxies for the magnitude of earnings management in year t for company i. The model is also run for the positive discretionary accruals, and the negative discretionary accruals;
Scandal = a dummy variable to indicate whether the absolute value of discretionary accruals is affected by having the observation come from the scandal years of 2000 and 2001. A value of 1 is assigned if the observation is in the period of 2000 or 2001, and 0 otherwise;
Post-SOXit= a dummy variable to indicate whether the absolute value of discretionary accruals is affected by having the observation come from the post-SOX period. A value of 1 is assigned if the observation is from the period from 2004 to 2008, and 0 otherwise;
Controlsit = includes different controls for time variation and performance of the firms. The following controls are used: (1) Scandal controls for data observed during the scandal period from 2000 to 2001 and takes value 1, and 0 otherwise; (2) MktCap controls for the market capitalization of the firm in the observed year (i.e., share price x shares outstanding); (3) OCF controls for the operating cash flow of the firm in the observed year; (4) ROA controls for the return on assets of the firm (i.e., net income of the current year divided by total assets of the prior year); and (5) Leverage controls for the firm’s total liabilities divided by total assets.
Model 3 tests for the interaction effect of SOX on the change of earnings management. This model is
run for the two categories of audit firms. A positive coefficient between the dummy variable of SOX and EM indicates that SOX has increased earnings management, and a negative coefficient suggests that SOX
92 Journal of Accounting and Finance vol. 14(1) 2014

has restrained earnings management. The more significantly negative the coefficient, the better SOX has been able to reduce earnings management and improve reporting quality.
Consistent with Cohen et al. (2008) and Holder et al. (2013), Model 3 is used to further test the second hypothesis. An additional variable is used to control for audit firm size (Big-4 versus Non-Big-4). It is a dummy variable that takes the value 1 when the firm is in the Big-4 auditor category, and 0 otherwise. Model 3 is presented as follows:
Depit = γ1 Bigit + γ2Scandalit + γ3(Bigit*Scandalit)+ γ4Post-SOXit + γ5(Bigit*Post-SOXit) +
γ6Controlsit + γ7(Bigit*Controlsit)+ εit (3) The coefficient γ3 indicates the effect of Post-SOX on firms audited by Big-4 versus Non-Big-4
auditors. A positive coefficient indicates that firms audited by Big-4 auditors have more earnings management and lower earnings quality in the post-SOX period as compared with firms audited by Non-Big 4 auditors; a negative coefficient indicates that firms audited by Big-4 auditors have less earnings management and higher earnings quality in the post-SOX period compared with firms audited by Non-Big-4 auditors. This test provides additional support for the results provided by the previous models. RESULTS Descriptive Statistics
Descriptive statistics of the sample firms are presented in Table 2. The statistics are divided between the Big-4 auditor category and the Non-Big 4 auditor category. As expected, companies audited by Big-4 auditors are larger than companies audited by Non-Big-4 auditors (total assets of $298.37 mil versus $60.60 mil; market capitalization of $417.33 mil versus $72.03 mil; and revenues of $259.82 mil versus $59.27 mil).
TABLE 2 DESCRIPTIVE STATISTICS (1997-2008 MEDIAN VALUES)
Big 4 Auditees Non-Big 4 Auditees A 298.37 60.60 MktCap 417.33 72.03 Rev 259.82 59.27 RevGrow 0.14 0.09 OC 82.04 98.36 Lev 0.37 0.36 MB 2.35 1.80 TA -0.06 -0.05 DA 0.02 0.02 PosDA 0.06 0.08 NegaDA -0.06 -0.08 AbsDA 0.06 0.08
Notes to Table 2: A = total assets (in millions); MktCap = market capitalizat ion measured by (share price * shares outstanding) (in millions); Rev = revenues for the year (in millions); RevGrow = % change in revenues measured as (revenues – revenues from previous year) / revenues from previous year; OC = operating cycle measured as [((receivables + receivables from previous year) ÷ 2) / (revenues ÷ 360)] + [((inventory + inventory from prev ious year) ÷ 2) / (CGS ÷ 360)] (in days); Lev = leverage measured as total liab ilities /
Journal of Accounting and Finance vol. 14(1) 2014 93
total assets; MB = market-to-book value; TA = total accruals (in millions); DA = discretionary accruals (in millions); PosDA = positive discretionary accruals (in millions); NegDA = negative discretionary accruals (in millions); AbsDA = absolute value of discretionary accruals (in millions).
Revenue growth and market-to-book values over the sample period are also greater for Big-4 auditees versus Non-Big-4 auditees. The operating cycle is somewhat shorter for companies audited by Big-4 auditors compared to Non-Big-4 auditors. Most of the remaining descriptive measures have similar values for both auditor sizes.
The last five rows on Table 2 provide descriptive statistics related to accruals. Accruals appear similar for both of the auditor size categories. The average for discretionary accruals is only $20,000, which is not surprising since positive and negative accruals will generally offset each other in the aggregate. One notable observation is that all measures of accruals for the Non-Big-4 auditors are equal to or larger than those of the Big-4 auditors (even though the size of companies is smaller). Effect of SOX on Earnings Management
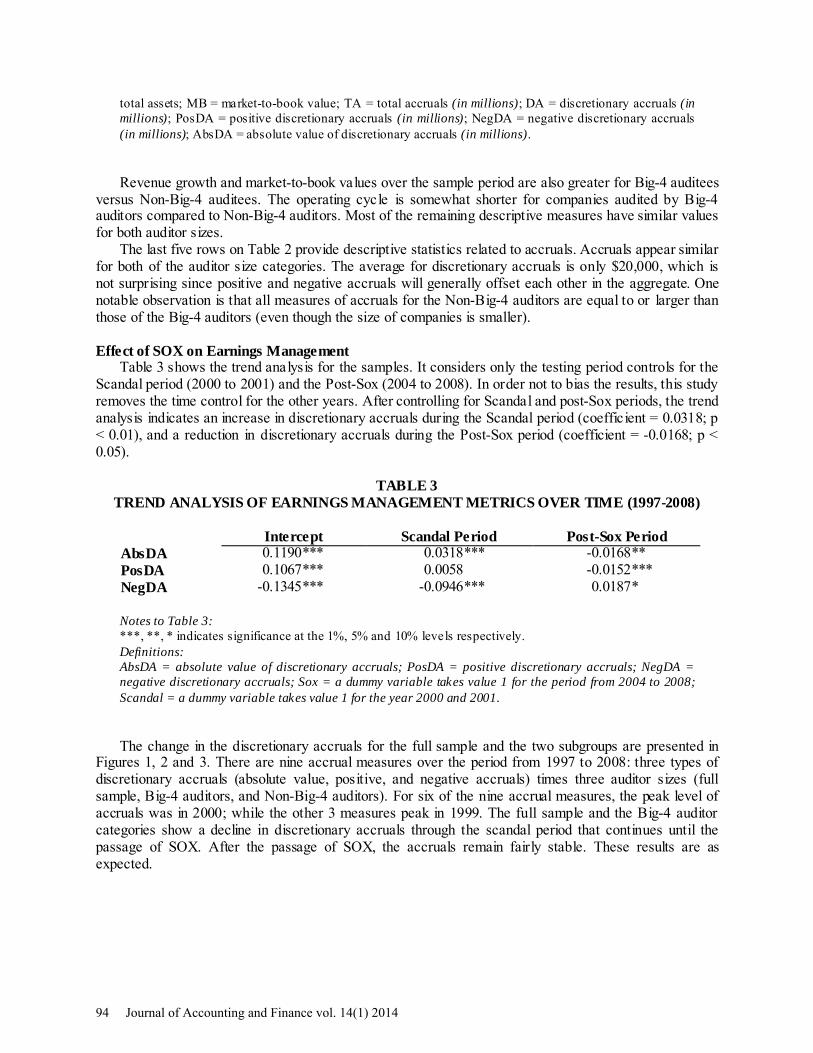
Table 3 shows the trend analysis for the samples. It considers only the testing period controls for the Scandal period (2000 to 2001) and the Post-Sox (2004 to 2008). In order not to bias the results, this study removes the time control for the other years. After controlling for Scandal and post-Sox periods, the trend analysis indicates an increase in discretionary accruals during the Scandal period (coefficient = 0.0318; p < 0.01), and a reduction in discretionary accruals during the Post-Sox period (coefficient = -0.0168; p < 0.05).
TABLE 3
TREND ANALYSIS OF EARNINGS MANAGEMENT METRICS OVER TIME (1997-2008)
Intercept Scandal Period Post-Sox Period AbsDA 0.1190*** 0.0318*** -0.0168** PosDA 0.1067*** 0.0058 -0.0152*** NegDA -0.1345*** -0.0946*** 0.0187*
Notes to Table 3: ***, **, * indicates significance at the 1%, 5% and 10% levels respectively. Definitions: AbsDA = absolute value of discretionary accruals; PosDA = positive discretionary accruals; NegDA = negative discretionary accruals; Sox = a dummy variable takes value 1 for the period from 2004 to 2008; Scandal = a dummy variable takes value 1 for the year 2000 and 2001.
The change in the discretionary accruals for the full sample and the two subgroups are presented in Figures 1, 2 and 3. There are nine accrual measures over the period from 1997 to 2008: three types of discretionary accruals (absolute value, positive, and negative accruals) times three auditor sizes (full sample, Big-4 auditors, and Non-Big-4 auditors). For six of the nine accrual measures, the peak level of accruals was in 2000; while the other 3 measures peak in 1999. The full sample and the Big-4 auditor categories show a decline in discretionary accruals through the scandal period that continues until the passage of SOX. After the passage of SOX, the accruals remain fairly stable. These results are as expected.
94 Journal of Accounting and Finance vol. 14(1) 2014

FIGURE 1 ABSOLUTE VALUE OF DISCRETIONARY ACCRUALS OVER TIME (1997-2008)
FIGURE 2 POSITIVE DISCRETIONARY ACCRUALS OVER TIME (1997-2008)
Journal of Accounting and Finance vol. 14(1) 2014 95
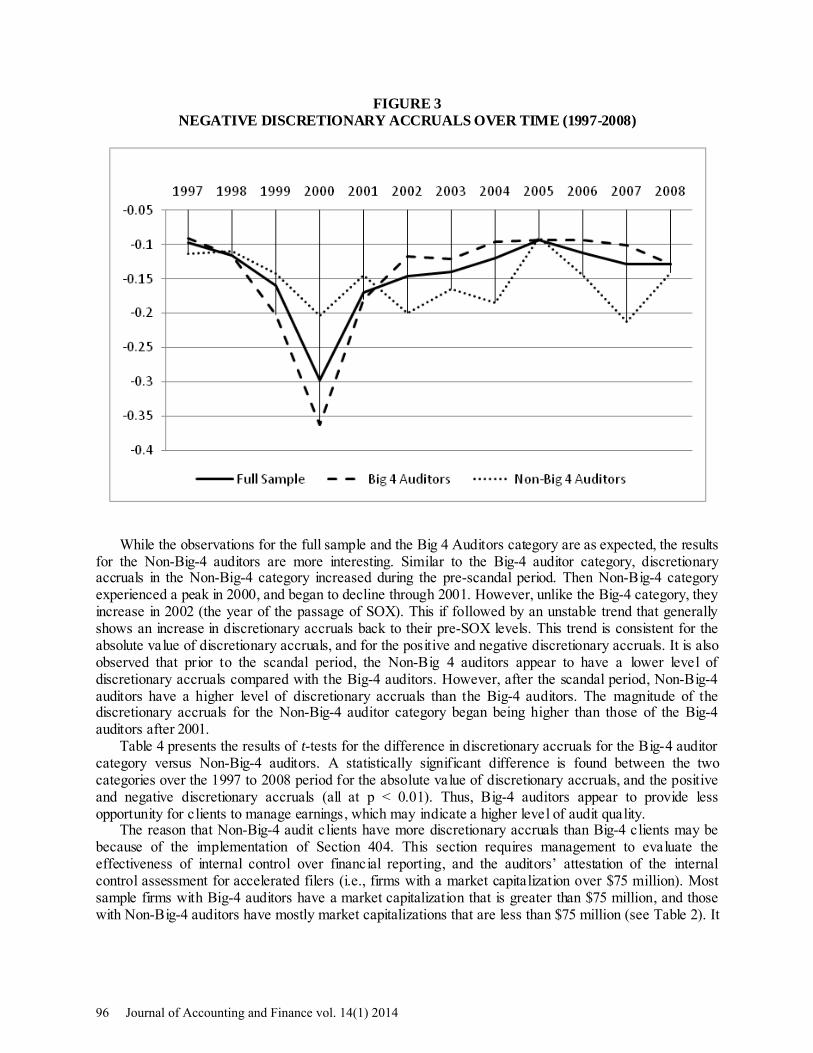
FIGURE 3 NEGATIVE DISCRETIONARY ACCRUALS OVER TIME (1997-2008)
While the observations for the full sample and the Big 4 Auditors category are as expected, the results for the Non-Big-4 auditors are more interesting. Similar to the Big-4 auditor category, discretionary accruals in the Non-Big-4 category increased during the pre-scandal period. Then Non-Big-4 category experienced a peak in 2000, and began to decline through 2001. However, unlike the Big-4 category, they increase in 2002 (the year of the passage of SOX). This if followed by an unstable trend that generally shows an increase in discretionary accruals back to their pre-SOX levels. This trend is consistent for the absolute value of discretionary accruals, and for the positive and negative discretionary accruals. It is also observed that prior to the scandal period, the Non-Big 4 auditors appear to have a lower level of discretionary accruals compared with the Big-4 auditors. However, after the scandal period, Non-Big-4 auditors have a higher level of discretionary accruals than the Big-4 auditors. The magnitude of the discretionary accruals for the Non-Big-4 auditor category began being higher than those of the Big-4 auditors after 2001.
Table 4 presents the results of t-tests for the difference in discretionary accruals for the Big-4 auditor category versus Non-Big-4 auditors. A statistically significant difference is found between the two categories over the 1997 to 2008 period for the absolute value of discretionary accruals, and the positive and negative discretionary accruals (all at p < 0.01). Thus, Big-4 auditors appear to provide less opportunity for clients to manage earnings, which may indicate a higher level of audit quality.
The reason that Non-Big-4 audit clients have more discretionary accruals than Big-4 clients may be because of the implementation of Section 404. This section requires management to evaluate the effectiveness of internal control over financial reporting, and the auditors’ attestation of the internal control assessment for accelerated filers (i.e., firms with a market capitalization over $75 million). Most sample firms with Big-4 auditors have a market capitalization that is greater than $75 million, and those with Non-Big-4 auditors have mostly market capitalizations that are less than $75 million (see Table 2). It
96 Journal of Accounting and Finance vol. 14(1) 2014

may be that companies that are subject to the requirements of Section 404 are influenced to have less discretionary accruals, and higher earnings quality.
TABLE 4
t-TEST FOR DISCRETIONARY ACCRUALS (1997-2008)
AbsDA PosDA NegDA Big-4 Non-Big-4 Big-4 Non-Big-4 Big-4 Non-Big-4 Mean 0.110 0.133 0.096 0.118 -0.130 -0.154 Variance 0.071 0.074 0.019 0.039 0.140 0.119 P-value (two-tail) <0.0001 <0.0001 <0.0001
Notes to Table 4: AbsDA = absolute value of discretionary accruals; PosDA = positive discretionary accruals; NegDA = negative discretionary accruals; Big = the Big-4 Auditors category, which consists of firms audited by Big-4 audit firms; Non-Big = the Non-Big-4 Auditors category, which consists of firms audited by Non-Big-4 audit firms.
Further Tests of the Effect of SOX on Earnings Management
Table 5 examines the effect of the scandal years (2000 and 2001), and post-SOX periods (2004 to 2008) on the level of discretionary accruals (absolute value, positive, and negative). Table 5, Panel A examines this relationship for the full sample, while Panels B and C examine the relationship for the Big-4 and Non-Big-4, respectively. The model (Model 2) controls for the period that the samples belong (i.e., the Scandal period, or Post-SOX period), and uses additional control factors that represent the performance, and size of the company.
The overall regression results are significant for each sample tested using Model 2 (full sample, Big-4, and Non-Big-4), and for each category of discretionary accruals (absolute value, positive, and negative) (i.e., F-statistics are significant at p < 0.0001). The variables “Scandal” and “Post-SOX” are of primary interest in this study.
The regression results for the full sample (Table 5, Panel A) indicate a significant positive relationship between the absolute value of discretionary accruals and observations during the scandal period (t = 3.12; p < 0.01). Similar results are found for negative discretionary accruals (t = 2.99; p < 0.01). The relationship is positive for negative accruals, but it is not significant. The relationship between discretionary accruals and observations during the post-SOX period is significantly negative for the both the absolute value and positive value of discretionary accruals (t = -2.41 and -3.66; p < 0.05 and 0.01; respectively). The relationship is negative for positive accruals, but it is not significant. Overall, for sample firms, it appears that SOX was instrumental in reducing discretionary accruals, and controlling earnings management.
We examine the differential effect of having a Big-4 auditor (Table 5, Panel B) versus having a Non-Big-4 auditor (Table 5, Panel C). The regression results for the Big-4 auditor sample indicate similar results as those found for the full sample. That is, a significant positive relationship is found during the scandal period for the absolute and negative values of discretionary accruals (t = 2.87 and 4.07; p < 0.01 and < 0.01; respectively), and the relationship for negative accruals is not significant. The relationship between discretionary accruals and observations during the post-SOX period is significantly negative for all discretionary accrual measures (absolute value, positive, and negative; t = -5.49, -8.59, and -2.75; p < 0.01, < 0.01, and < 0.01; respectively). Companies audited by the Big-4 have similar discretionary accrual behavior as the full sample, implying that SOX was able to reduce discretionary accruals for these companies, and control their earnings management.
Table 5, Panel C indicates a different behavior by companies audited by Non-Big-4 auditors. No significant relationship is found between observations coming from the scandal period and the level of discretionary accruals for any accrual category (absolute value, positive, or negative). Further, the relationship between discretionary accruals and observations during the post-SOX period is significantly
Journal of Accounting and Finance vol. 14(1) 2014 97
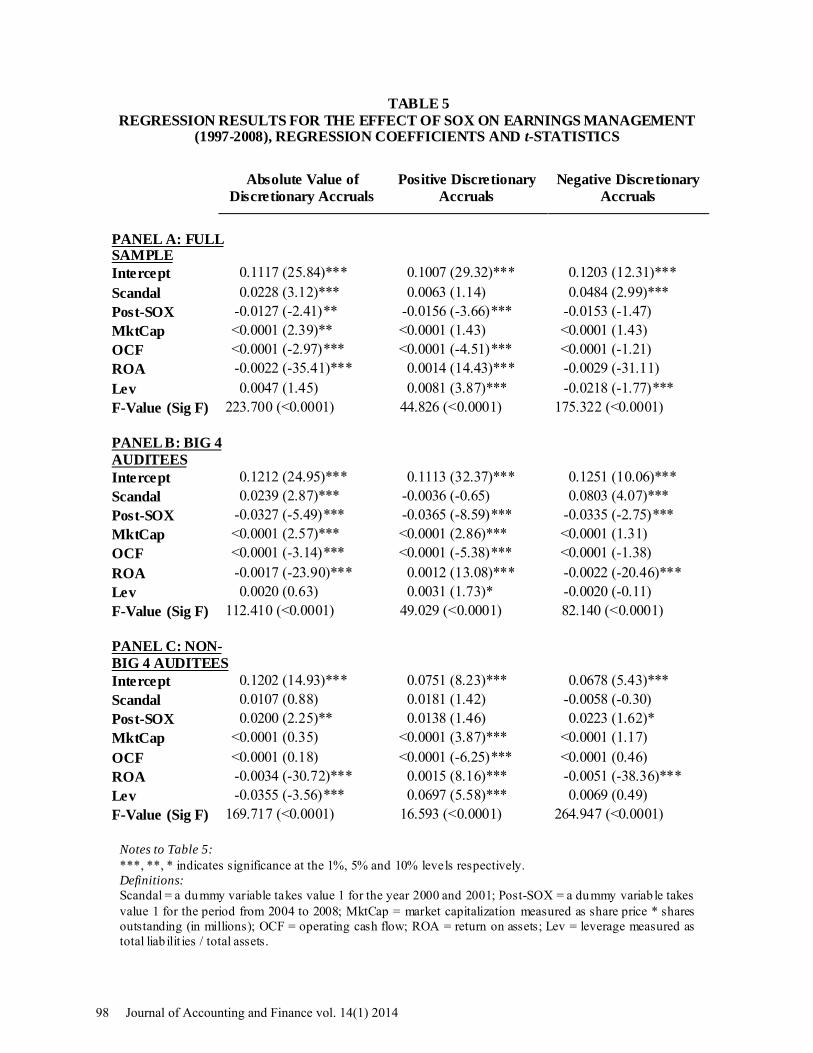
TABLE 5 REGRESSION RESULTS FOR THE EFFECT OF SOX ON EARNINGS MANAGEMENT
(1997-2008), REGRESSION COEFFICIENTS AND t-STATISTICS
Absolute Value of Discretionary Accruals
Positive Discretionary Accruals
Negative Discretionary Accruals
PANEL A: FULL SAMPLE Intercept 0.1117 (25.84)*** 0.1007 (29.32)*** 0.1203 (12.31)*** Scandal 0.0228 (3.12)*** 0.0063 (1.14) 0.0484 (2.99)*** Post-SOX -0.0127 (-2.41)** -0.0156 (-3.66)*** -0.0153 (-1.47) MktCap <0.0001 (2.39)** <0.0001 (1.43) <0.0001 (1.43) OCF <0.0001 (-2.97)*** <0.0001 (-4.51)*** <0.0001 (-1.21) ROA -0.0022 (-35.41)*** 0.0014 (14.43)*** -0.0029 (-31.11) Lev 0.0047 (1.45) 0.0081 (3.87)*** -0.0218 (-1.77)*** F-Value (Sig F) 223.700 (<0.0001) 44.826 (<0.0001) 175.322 (<0.0001) PANEL B: BIG 4 AUDITEES Intercept 0.1212 (24.95)*** 0.1113 (32.37)*** 0.1251 (10.06)*** Scandal 0.0239 (2.87)*** -0.0036 (-0.65) 0.0803 (4.07)*** Post-SOX -0.0327 (-5.49)*** -0.0365 (-8.59)*** -0.0335 (-2.75)*** MktCap <0.0001 (2.57)*** <0.0001 (2.86)*** <0.0001 (1.31) OCF <0.0001 (-3.14)*** <0.0001 (-5.38)*** <0.0001 (-1.38) ROA -0.0017 (-23.90)*** 0.0012 (13.08)*** -0.0022 (-20.46)*** Lev 0.0020 (0.63) 0.0031 (1.73)* -0.0020 (-0.11) F-Value (Sig F) 112.410 (<0.0001) 49.029 (<0.0001) 82.140 (<0.0001) PANEL C: NON- BIG 4 AUDITEES Intercept 0.1202 (14.93)*** 0.0751 (8.23)*** 0.0678 (5.43)*** Scandal 0.0107 (0.88) 0.0181 (1.42) -0.0058 (-0.30) Post-SOX 0.0200 (2.25)** 0.0138 (1.46) 0.0223 (1.62)* MktCap <0.0001 (0.35) <0.0001 (3.87)*** <0.0001 (1.17) OCF <0.0001 (0.18) <0.0001 (-6.25)*** <0.0001 (0.46) ROA -0.0034 (-30.72)*** 0.0015 (8.16)*** -0.0051 (-38.36)*** Lev -0.0355 (-3.56)*** 0.0697 (5.58)*** 0.0069 (0.49) F-Value (Sig F) 169.717 (<0.0001) 16.593 (<0.0001) 264.947 (<0.0001)
Notes to Table 5: ***, **, * indicates significance at the 1%, 5% and 10% levels respectively. Definitions: Scandal = a dummy variable takes value 1 for the year 2000 and 2001; Post-SOX = a dummy variab le takes value 1 for the period from 2004 to 2008; MktCap = market capitalization measured as share price * shares outstanding (in millions); OCF = operating cash flow; ROA = return on assets; Lev = leverage measured as total liab ilit ies / total assets.
98 Journal of Accounting and Finance vol. 14(1) 2014

positive for the both the absolute value and negative value of discretionary accruals (t = 2.25 and 1.62; p < 0.05 and 0.10; respectively). The relationship for positive discretionary accruals is not significant. This suggests that companies audited by Non-Big-4 firms did not reduce discretionary accruals in response to SOX, and may have increased such accruals. This is opposite to the results for the Big-4 companies, and to the intent of the SOX legislation. In summary, Table suggests that the earnings quality of the firms audited by Big 4 audit firms improved in the post-SOX period and the earnings quality of the firms audited by Non-Big 4 audit firms deteriorated in the post-SOX period.
Table 6 presents a direct comparison of the effects of audit firm size on discretionary accruals during the periods surrounding the passage of SOX. In addition to examining the effects during the scandal and post-SOX periods, model 3 includes measurement of the coefficients for the interactions of these periods with audit firm size (i.e., Scandal*Big, and Post-SOX*Big).
TABLE 6 REGRESSION RESULTS FOR THE DIFFERENTIAL EFFECT OF SOX ON BIG 4 AND NON-
BIG 4 CLIENTS (1997-2008), REGRESSION COEFFICIENTS (t-STATISTICS)
Absolute Value of Discretionary Accruals
Positive Discretionary Accruals
Negative Discretionary Accruals
Intercept 0.1360 (15.27)*** 0.1085 (13.68)*** 0.1189 (6.96)*** Big -0.0295 (-2.88)*** -0.0167 (-1.88)* 0.0002 (0.01) Post-Sox 0.0036 (0.37) -0.0050 (-0.64) 0.0113 (0.56) Big*Post-Sox -0.0219 (-1.89)* -0.0151 (-1.63)* -0.0347 (-1.48) Scandal -0.0004 (-0.03) 0.0052 (0.51) -0.0180 (-0.60) Big*Scandal 0.0333 (2.08)** 0.0012 (0.10) 0.0966 (2.72)*** MktCap <0.0000 (0.14) <0.0000 (-0.52) <0.0000 (0.62) Big*MktCap <0.0000 (-0.02) <0.0000 (0.61) <0.0000 (-0.56) OCF <0.0000 (-0.01) <0.0000 (-2.57)*** <0.0000 (0.37) Big*OCF <0.0000 (-0.69) <0.0000 (1.90)* <0.0000 (-0.74) ROA -0.0034 (-27.27)*** 0.0016 (9.00)*** -0.0048 (-25.38)*** Big*ROA 0.0016 (10.90)*** -0.0002 (-1.04)*** 0.0025 (11.36)*** Lev -0.0379 (-3.43)*** 0.0449 (3.59)*** -0.0959 (-5.56)*** Big*Lev 0.0437 (3.78)*** -0.0376 (-2.97)*** 0.0899 (3.56)*** F-Value 115.928 (<0.0001) 28.942 (<0.0001) 93.559 (<0.0001)
Notes to Table 6: ***, **, * indicates significance at the 1%, 5% and 10% levels respectively. Definitions: Post-Sox = a dummy variable takes value 1 for the period from 2004 to 2008; Scandal = a dummy variable takes value 1 for the year 2000 and 2001; MktCap = market capitalization measured as share price * shares outstanding (in millions); OCF = operating cash flow; ROA = return on assets; Lev = leverage measured as total liab ility / total assets.
Interestingly, when interactions are included in the model, the relationship between the discretionary accruals and observations during the scandal period are not significant for any category of accruals. None of the results for the main effect of the post-SOX period are significant, as well. The main effect of audit firm size is significant and negative for the absolute value of discretionary accruals (t = -2.88; p < 0.01), and for positive discretionary accruals (t = -1.88; p < 0.10), but no significance is noted for negative
Journal of Accounting and Finance vol. 14(1) 2014 99

discretionary accruals. This suggests that companies audited by Big-4 firms have overall less earnings management.
Of particular importance in the current study is the effect on discretionary accruals of the interaction of audit firm size with the post-SOX period. All three regression coefficients are negative for this interaction relationship (Big*Post-SOX). The interaction of firm size with the post-SOX period on the absolute value of discretionary accruals is significantly negative (t = -1.89; p < 0.10), and on positive accruals is also significantly negative (t = -1.63; p < 0.10). This suggests that, during the post-SOX period, companies audited by Big-4 audit firms had a greater reduction in their use of discretionary accruals as compared to companies audited by non-Big-4 firms. This suggests that companies audited by Big-4 audit firms have higher earnings quality than those audited by Non-Big 4 audit firms in the post-SOX period. SOX may have been effective in reducing earnings management, but only significantly for Big-4 clients. SUMMARY AND CONCLUSIONS
This study is motivated by the prevalent discussion about the benefits of SOX. Many previous studies have examined the effectiveness of SOX on the quality of financial reporting, including its effect on earnings management. Studies prior to the passage of SOX have connected audit quality with earnings management, and suggest that firms audited by Big-4 audit firms have less earnings management and higher reporting quality. Several studies in the post-SOX period assess the change in earnings management behavior by comparing the overall earnings management level between the pre-SOX period and the post-SOX period, or by comparing the difference in earnings management of the accelerated filers versus non-accelerated filers. However, previous research does not examine the difference in earnings management between companies audited by Big-4 versus Non-Big 4 firms in the pre-SOX period versus the post-SOX period. The current study fills this gap in the body of audit research.
We use a modified Jones model (Dechow, 1995) to calculate the discretionary accruals for the firms as a proxy for the degree of earnings management. By examining discretionary accruals across the testing period, the following observations are found: (1) The overall level of earnings management peaked prior to the passage of SOX, and then dropped in the post-SOX period; (2) Although earnings management of companies audited by Non-Big 4 auditors declined after the passage of SOX, it increased to pre-SOX levels after 2005. This may be a side effect of the implementation of Section 404 of SOX; (3) For the period from 1998 to 2001, the level of earnings management of the Big-4 auditors category exceeded that of the Non-Big 4 auditors category. This is contrary to Becker’s (1998) results that firms audited by Big-6 audit firms had less earnings management compared with firms audited by Non-Big 6 audit firms. However, the period under consideration is different; (4) Earnings quality of firms audited by Big-4 audit firms improved after the passage of SOX, while the earnings quality of the firms audited by Non-Big-4 audit firms deteriorated in the post-SOX period; and (5) During the post-SOX period, companies audited by Big-4 audit firms have higher earnings quality than the firms audited by Non-Big 4 audit firms in the post-SOX period.
These results only partially support Hypothesis 1. That is, firms audited by Big-4 auditors were found to have reduced earnings management in the post-SOX period as compared to the pre-SOX period. However, non-Big-4 auditors’ clients did not exhibit such a reduction in earnings management.
The study’s results fully support Hypothesis 2. That is, SOX was found to have a different effect on the change in earnings management behavior for firms audited by Big-4 auditors as compared to firms audited by non-Big-4 auditors. Big-4 audit clients reduced their earnings management behavior in the post-SOX period while Non-Big-4 did not, and Big-4 audit clients had less earnings management as compared to non-Big-4 audit clients in the post-SOX period.
These results point out the differential effect that SOX has had on companies audited by Big-4 audit firms versus Non-Big-4 auditors. Big 4 audit firms did better in the post-SOX period and their earnings management dropped to a relative low level compared with the scandal period. Alternatively, the firms audited by Non-Big 4 audit firms did not have their earnings quality improved in the post-SOX period.
100 Journal of Accounting and Finance vol. 14(1) 2014

These findings suggest that Big-4 auditors recover better from the pre-SOX scandals, and regained their audit quality as they outperform the Non-Big-4 auditors (in and audit quality sense) again after their poor performance around the scandal period. These results should be useful for companies in their decisions as to which size of audit firm to engage, and for regulators and other involved in making decisions regarding any future amendments to SOX. REFERENCES Asthana, S., Balsam, S. and Kim, S. (2009). The Effect of Enron, Andersen, and Sarbanes-Oxley on the
US Market for Audit Services, Accounting Research Journal, 22 (1), 4 – 26. Bartov, E. and Cohen, D. A. (2009). The ‘Numbers Game’ in the Pre- and Post-Sarbanes-Oxley Eras,
Journal of Accounting, Auditing and Finance, 24 (4), 505-534. Bédard, J. (2006). Sarbanes Oxley Internal Control Requirements and Earnings Quality, available at
SSRN: http://ssrn.com/abstract=926271 (accessed 21 April 2013). Becker, C. L., Defond, M. L. and Subramanyam, K. R. (1998). The Effect of Audit Quality on Earnings
Management, Contemporary Accounting Research, 15 (1), 1-24. Bergstresser, D. and Philippon, T. (2006). CEO Incentives and Earnings Management, Journal of
Financial Economics, 80, 511-529. Chan, K. C., Farrell, B. R. and Lee, P. (2008). Earnings Management of Firms Reporting Material
Internal Control Weaknesses under Section 404 of the Sarbanes-Oxley Act, Auditing: A Journal of Practice and Theory, 27 (2), 161-179.
Coates IV, J.C. (2007). Reviewed the Goals and Promise of the Sarbanes-Oxley Act, The Journal of Economic Perspectives, 21 (1), 91-116.
Cohen, D.A., Dey, A. and Lys, T.Z. (2005). Trends in Earnings Management and Informativeness of Earnings Announcements in the Pre- and Post-Sarbanes Oxley Periods, available at SSRN: http://ssrn.com/abstract=1280708 (accessed 21 April 2013).
Cohen, D.A., Dey, A. and Lys, T.Z. (2008). Real and Accrual-Based Earnings Management in the Pre- and Post-Sarbanes-Oxley periods, The Accounting Review, 83 (3), 757-786.
Dang, L., Brown, K. F. and McCullough, B. B. (2011). Apparent Audit Failures and Value Relevance of Earnings and Book Value, Review of Accounting & Finance, 10 (2), 134-154.
Dechow, P. M., Sloan, R. G. and Sweeney, A. P. (1995). Detecting Earnings Management, The Accounting Review, 70 (2), 193-225.
Dechow, P. M. and Skinner, D. J. (2000). Earnings Management: Reconciling the Views of Accounting Academics, Practitioners, and Regulators, Accounting Horizons, 14 (2), 235-250.
Depken II, C. A. and Ouyang, B. (2006). The Impact of the Sarbanes-Oxley Act: Early Evidence from Earnings Management, Applied Financial Economics Letters, 2 (6), 347-351.
Ebrahim, A. (2001). Auditing Quality, Auditor Tenure, Client Importance, and Earnings Management: Additional Evidence, working paper, Rutgers University.
Forbes. (2002). The Corporate Scandal Sheet, http://www.forbes.com/home/2002/07/25/accountingtracker.html. (accessed 21 April 2013).
Gao, F., Wu, J. S. and Zimmerman, J. (2009). Unintended Consequences of Granting Small Firms Exemptions from Securities Regulation: Evidence from the Sarbanes-Oxley Act, Journal of Accounting Research, 47 (2), 459-506.
Healy, P. M. and Wahlen, J. M. (1999). A Review of the Earnings Management Literature and its Implications for Standard Setting, Accounting Horizons, 13 (4), 365-383.
Holder, A. D., Robin, A. and Karim, K. E. (2013). Was Dodd-Frank Justified in Exempting Small Firms from Section 404b Compliance? Accounting Horizons, In press.
Iliev, P. (2010). The Effect of SOX Section 404: Costs, Earnings Quality, and Stock Prices, The Journal of Finance, 65 (3), 1163-1196.
Jain, P.K., Kim, J. and Rezaee, Z. (2008). The Sarbanes-Oxley Act of 2002 and Market Liquidity. The Financial Review, 43, 361-382.
Journal of Accounting and Finance vol. 14(1) 2014 101

Jones, J. (1991). Earnings Management during Import Relief Investigations, Journal of Accounting Research, 29, 193-228.
Li, H., Pincus, M. and Rego, S. O. (2006). Market reaction to Events Surrounding the Sarbanes-Oxley Act of 2002 and Earnings Management, available at SSRN: http://ssrn.com/abstract=475163 (accessed 21 April 2013)
Litvak, K. (2007). Sarbanes-Oxley and the Cross-Listing Premium, Michigan Law Review, 105 (8), 1857-1898.
Lobo, G. J. and Zhou, J. (2006). Did Conservatism in Financial Reporting Increase after the Sarbanes-Oxley Act? Initial evidence, Accounting Horizons, 20 (1), 1, 57–73.
Maijoor, S. J. and Vanstraelen, A. (2006). Earnings Management within Europe: The Effects of Member State Audit Environment, Audit Firm Quality and International Capital Markets, Accounting and Business Research,36 (1), 33-52.
McEnroe, J. E. (2007). Perceptions of the Effect of Sarbanes-Oxley on Earnings Management Practices, Research in Accounting Regulation, 19, 137–157.
Munter, P. (1999). SEC Sharply Criticizes ‘Earnings Management’ Accounting, The Journal of Corporate Accounting and Finance/Winter, 10 (2), 11-20.
Nondorf, M. E., Singer, Z. and You, H. (2012). A Study of Firms Surrounding the Threshold of Sarbanes–Oxley Section 404 Compliance, Advances in Accounting, 28 (1), 96–110.
Reynolds, J. K. and Francis, J. R. (2001). Does Size Matter? The Influence of Large Clients on Office-Level Auditor Reporting Decisions, Journal of Accounting and Economics, 20, 375-400.
Richardson, V. J. (2000). Information Asymmetry and Earnings Management: Some Evidence, Review of Quantitative Finance and Accounting, 15, 325-347.
Teoh, S. H. and Wong, T. J. (1993). Perceived Auditor Quality and the Earnings Response Coefficient, The Accounting Review, 68 (2), 346-366.
102 Journal of Accounting and Finance vol. 14(1) 2014