the effects of session frequency on psychotherapy outcome
TRANSCRIPT

Scheduled Healing: The Relationship Between Session Frequency
and Psychotherapy Outcome in a Naturalistic Setting
David McConkie Erekson
A dissertation submitted to the faculty of Brigham Young University
in partial fulfillment of the requirements for the degree of
Doctor of Philosophy
Michael J. Lambert, Chair Bruce N. Carpenter Stevan L. Nielsen Dennis L. Eggett
Jared Warren
Department of Psychology
Brigham Young University
May 2013
Copyright © 2013 David M. Erekson
All Rights Reserved
ABSTRACT
Scheduled Healing: The Relationship Between Session Frequency and Psychotherapy Outcome in a Naturalistic Setting
David McConkie Erekson
Department of Psychology, BYU Doctor of Philosophy
The dose-effect relationship in psychotherapy has been examined extensively, but few studies have included session frequency as a component of psychotherapy “dose.” Those studies that have examined the effects of session frequency have indicated that it may affect both the total amount of recovery and the speed of recovery. No studies were found examining the clinical significance of this construct in a naturalistic setting. The change trajectories of 16,003 clients were examined using multi-level modeling and including session frequency as a fixed effect. Of these clients, subgroups were identified that were scheduled approximately once a week or approximately once every two weeks. These groups were compared to each other for differences in speed of recovery and clinically significant change. Results indicated that more frequent therapy was associated with steeper recovery curves. When comparing groups scheduled once a week to those scheduled once every two weeks, more clinically significant gains were identified in those attending once a week, and more significant deterioration was identified in those attending once every two weeks. These findings are discussed in light of the existing literature and the implications for future psychotherapy research and clinical practice.
Keywords: frequency, psychotherapy, outcome, dose-response, dose-effect

ACKNOWLEDGMENTS
I would like to thank Mike Lambert for his encouragement throughout this project. He
has taught me that academia can be practical, that psychotherapy should be researched, and that
the most comfortable sitting position while seeing clients is cross-legged. I cannot imagine a
better mentor. I also want to thank Bruce Carpenter for his methodical approach and careful
questions, Lars Nielsen for his unending enthusiasm for learning, Dennis Eggett for first
introducing me to SAS and opening a world of statistics, and Jared Warren for his humor and
dedication to practice-based evidence. Each of these individuals invested time and energy in
helping me develop as a student and a colleague.
I would also like to thank Erica Erekson for listening to me as I told her of the daily
challenges of structuring data, writing statistical code, and creating graphs and tables. She has
traveled this road with me, and although we are both a little relieved to see the exit ramp, it’s
been fun making the journey together.

iv
Table of Contents
Introduction ..................................................................................................................................... 1
Literature Review............................................................................................................................ 2
Number of Sessions Needed: The Dose-Effect Investigation..................................................... 2
Session Frequency ...................................................................................................................... 5
Session Frequency and the Generic Model of Psychotherapy .................................................. 10
Current Study ............................................................................................................................ 11
Method .......................................................................................................................................... 13
Participants ................................................................................................................................ 13
Selection and Grouping Procedures .......................................................................................... 13
Measures and Procedure ........................................................................................................... 17
Data Analysis ............................................................................................................................ 21
Results ........................................................................................................................................... 24
Descriptive Statistics ................................................................................................................. 24
Question 1: Amount of Recovery ............................................................................................. 25
Question 2: Speed of Recovery................................................................................................. 34
Question 3: Overall Effects ....................................................................................................... 39
Discussion ..................................................................................................................................... 48
References ..................................................................................................................................... 56

vi
List of Tables
1 Summary of Selection and Grouping Procedures .............................................................16
2 Demographics for 1WK and 2WK Groups ........................................................................26
3 Demographics for Matched 1WK and 2WK Groups .........................................................28
4 Independent Sample t-tests Detecting Differences in Total Change .................................30
5 χ2 Statistics Examining Clinically Significant Differences in Total Recovery ..................31
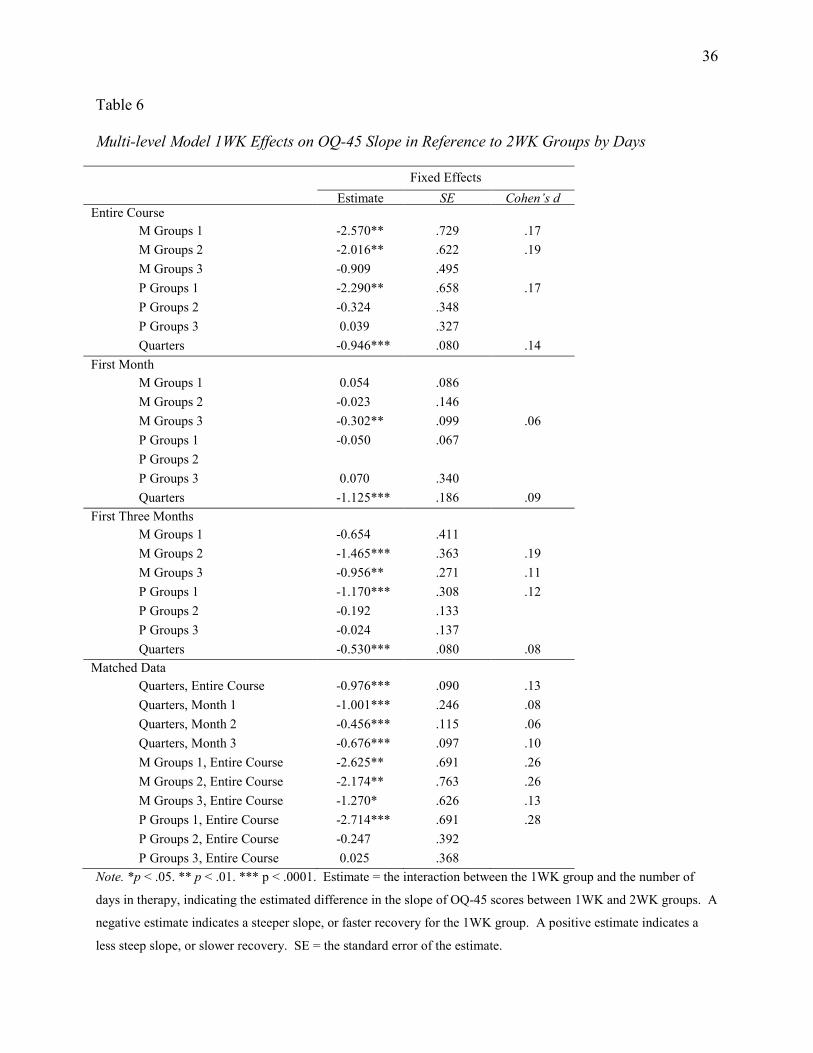
6 Multi-level Model 1WK Effects on OQ-45 Slope by Days ...............................................36
7 Survival Analyses Examining Differences in Speed to Recovery .....................................37
8 Multi-level Model by Days ................................................................................................42
9 Multi-level Model by Sessions ..........................................................................................45

vii
List of Figures
1 Illustration of Selection and Grouping Procedures for 1WK and 2WK Comparisons .....18
2 Illustration of Analyses Using Continuous Session Frequency Data ................................23
3 Survival Analyses Predicting Clinically Significant Change ............................................40
4 Interaction Effects of Session Frequency on Recovery Trajectories by Weeks ................43
5 Interaction Effects of Session Frequency on Recovery Trajectories by Sessions .............46
6 Illustration of All Significant Results, Entire Course of Therapy and Month 1 ................49
7 Illustration of All Significant Results, Month 2 and Month 3 ...........................................50
8 Illustration of All Significant Results, Matched Datasets ..................................................51

1
Scheduled Healing: The Relationship Between Session Frequency
and Psychotherapy Outcome in a Naturalistic Setting
There is not an agreed upon method for delivering psychotherapy. Despite years of
discussion regarding the pragmatics of practice (e.g., the number of sessions given, how
frequently sessions are given, how long each session should be), these practices have historically
rested on a foundation of tradition rather than evidence (e.g., 50-minute session delivered
weekly). As second-party payers and managed care have become more prominent in managing
mental health care, more emphasis has been placed on not only maximizing the effectiveness of
treatment, but also minimizing treatment intrusiveness and cost (Austad & Berman, 1991). In
psychotherapy, this has led to research attempting to identify an optimal range of the amount of
therapy; in other words, a specific amount of time or number of sessions that is generally found
to be helpful across a broad population. Studies to date have focused primarily on the number of
sessions required for positive change in psychotherapy, with some, but limited attention given to
the frequency of psychotherapy.
This dearth of research may be particularly problematic as scheduling practices in
naturalistic settings may be shifting. Traditionally, psychotherapy sessions have been scheduled
once a week. Practitioners may be influenced to attenuate this frequency by practical and
economic constraints, however, allowing more clients to be in active, albeit less than weekly,
therapy simultaneously. Although increasing the number of individuals receiving therapy is
economically desirable, the effects of decreasing session frequency on the efficacy of
psychotherapy are relatively unknown. The following review will examine the available
literature on the effect of number of sessions attended and frequency of sessions on
psychotherapy outcome, with particular emphasis on session frequency. A theoretical model will

2
then be presented, placing session frequency in the context of the structure of psychotherapy and
the mechanisms of psychotherapeutic change.
Literature Review
Number of Sessions Needed: The Dose-Effect Investigation
The number of sessions necessary for psychotherapeutic change has been of interest since
the 1950s (Hansen & Lambert, 2003). Early studies examined therapy duration as a function of
the number of sessions attended by the client, and measured outcome through clinician judgment
(Cartwright, 1955; Seeman, 1954; Standal & van der Veen, 1957; Strassberg, Anchor,
Cunningham, & Elkins 1977), client self-report (Weitz et al., 1975), or criterion measures (e.g.,
university student graduation; Johnson, 1965). Consistent correlations were observed between
the number of sessions received and positive outcome, though this finding was dependent on the
type of outcome measured. Number of sessions was differentially correlated with the different
outcome measures; specifically, improvement in “personal integration” and “emotional
problems” were more strongly correlated with the number of psychotherapy sessions attended
than other measures of outcome (Johnson, 1965; Standal & van der Veen, 1957). Researchers
also observed an attenuation of positive outcome as the number of sessions exceeded 20
(Strassberg et al., 1977). Although this early research relied on small sample sizes and measures
of outcome that are less valid and reliable than methods used today, it provided the groundwork
for more recent research on the number of sessions needed for positive outcome, or the dose-
effect relationship.
The dose-effect relationship. The dose-effect relationship is a research method and
terminology adopted from clinical drug trials by Howard, Kopta, Krause, and Orlinsky (1986).
In drug trials, dose indicates the amount of the drug administered, and effect is the measured

3
response to the drug; in psychotherapy research then, a “dose” could be conceptualized as a
session of therapy, and an effect, a measure of symptom relief or recovery. In their seminal
study, Howard et al. (1986) performed a meta-analysis of 15 studies (including several listed
above) where researchers had collected and reported psychological improvement as it varied
with the number of psychotherapy sessions received. Using data gathered from 2,400 patients,
the researchers found that recovery rates could be represented by a negatively accelerating curve,
where approximately 53% of patients would be expected to have measurably improved in 8
sessions, 75% at 26 sessions, and 85% at 52 sessions.
This conceptualization of dose-effect in psychotherapy and the estimated parameters for
the number of sessions needed for significant change spurred replications, elaborations, and
specifications in the literature. Several studies improved upon the original meta-analysis by
using more standard and reliable measures of change in a naturalistic setting, and by specifying
parameters for clinically significant change. These studies have found a similar positive
relationship between the number of sessions and the total proportion of those achieving
significant change; they also found a similar negatively accelerating curve, indicating that each
incremental increase in the number of sessions yields a decreasing proportion of clients
achieving significant change (Barkham et al., 2006; Stiles, Barkham, Connell, & Mellor-Clark,
2008).
The original dose-effect study and its replications listed above relied on a single change
index over an entire course of therapy to evaluate change. Because significant change could
potentially occur before the final session of therapy, other studies have evaluated the dose-effect
response using session-by-session outcome measures (Callahan & Hynan, 2005; Hansen &
Lambert, 2003; Kadera, Lambert, & Andrews, 1996). These studies have found general support

4
for the dose-effect model as well, and estimate that 13 to 18 sessions are sufficient for 50% of
clients to recover, where recovery was indicated by clinically significant change on the OQ-45
(calculated as 14 points) in conjunction with ending below the clinical cutoff score (Hansen,
Lambert, & Foreman, 2002).
Some have suggested that the negatively accelerating dose-effect curve is not
representative of individual clients, but is a relic of differential morbidity, where individuals who
respond more quickly to therapy drop out earlier and leave only those who do not respond
quickly in the analyses of the effects of greater numbers of sessions. It has been hypothesized,
therefore, that the number of sessions attended is contingent upon how quickly a client responds
to therapy rather than vice versa (i.e., number of sessions predicting recovery; Barkham et al.,
2006; Stiles, Barkham, Connell, & Mellor-Clark, 2008). This hypothesis has garnered some
support with a recent study examining a university-based counseling center. While an analysis
of the entire sample demonstrated the negatively accelerating curve found in Howard et al.’s
original study, stratifying the sample by the number of sessions was a better fit statistically, and
indicated different rates of change according to the number of sessions attended (Baldwin,
Berkeljon, Atkins, Olsen, & Nielsen, 2009). Instead of diminishing returns as the number of
sessions increase, then, findings may indicate simply that individuals respond to psychotherapy
at different rates and attend the number of sessions needed to recover. This is referred to as the
Good Enough Level (GEL).
In all of the investigations of the dose-effect relationship described above, dose has been
operationalized as a single session of therapy, without time between sessions being accounted
for. For example, two clients may have received four sessions, or the same “dose”; the first
client, however, may have received four sessions within four weeks, while the second client may

5
have received four sessions within two months. It would be difficult to assume, in this
hypothetical case, that both clients received an identical dose of therapy. It seems possible that
the nature of a “dose” may be affected by its temporal relationship to other doses, and that time,
therefore, may be an important variable to consider when operationalizing “dose” in
psychotherapy.
Session Frequency
The nature of the relationship between session frequency and the dose-effect relationship
in psychotherapy has remained relatively unstudied in general psychotherapy practice. Studies
that have explored this relationship, however, can be grouped into three categories: session
frequency in psychoanalytic therapy, session frequency in behavioral or cognitive behavioral
therapy, and session frequency in naturalistic settings.
Psychoanalytic therapy. The discussion of session frequency has been prominent in the
psychoanalytic literature, and consists primarily of theoretical expostulations on the implications
of decreasing session frequency from the traditional practice of up to six sessions a week, to two
or three times a week or less. It has been argued that decreased session frequency may lead to
decreased session efficiency and decreased therapy effectiveness (Gedo & Cohler, 1992).
Session frequency has also been identified by psychoanalysts as a differentiating factor between
psychoanalysis and other psychotherapies, where seeing a patient less than three times a week
may not qualify as a psychoanalytic intervention (Carrere, 2010; Richards, 1997; Schwartz,
2003).
Two studies attempted to observe the effects of session frequency in routine practice of
psychoanalytic psychotherapy. Both relied on retrospective evaluations by patients after
completing therapy, and on naturalistic data regarding session frequency and dose. Each was

6
asked to rate his or her recovery in therapy, including decrease in symptom distress and increase
in morale. Both studies indicated a relationship between the frequency of sessions and patients’
perceptions of recovery, where patients being seen only once a week had less positive
perceptions of their experience than patients being seen two times a week or more. In fact,
positive perceptions of recovery were incrementally related with the frequency of sessions, with
once a week indicating the least amount of recovery, twice a week somewhat more, and three
times a week the most recovery in therapy (Freedman, Hoffenber, Vorus, & Frosch, 1999;
Sandell et al., 2000). This provides some evidence that patients’ perceptions of their own
recovery may be affected positively by increased session frequency. A follow-up study to
Sandell et al. (2000) found an interaction effect in long-term follow-up (i.e., 3 years, with
measures taken each year) between duration and frequency, where outcome was better among
the low frequency/low duration group and among the high frequency/high duration group
(Sandell, Blomberg, & Lazar, 2002). These findings illustrate the potentially complex
relationship between session frequency and other parameters, including the number of sessions
and duration of the course of treatment; ultimately, they indicate that session frequency seems to
be related not only to immediate perception of therapy, but to long-term outcome.
Behavioral and cognitive behavioral therapies. Session frequency has also been
examined empirically in conjunction with behavioral interventions and, more specifically,
exposure. Many studies have demonstrated a difference between massed and spaced exposure-
based sessions when treating fear symptoms. The specific parameters of massed or spaced
exposure vary from study to study; in general, however, massed exposure indicates an intensive
approach to exposure (e.g., several hours in a single day), and spaced exposure indicates
exposure sessions that are distributed over a greater period of time (e.g., exposure sessions every

7
five days). Massed exposure tends to show better immediate reductions in fear and avoidance
behaviors, and spaced exposure tends to show better retention of learning and lower relapse rates
(Abramowitz, Foa, & Franklin, 2003; Bohni, Spindler, Arendt, Hougaard, & Rosenberg, 2009;
Chambless, 1990; Foa, Jameson, Turner, & Payne, 1980; Rowe & Craske, 1998; Tsao & Craske,
2000). Though these findings are attenuated by small sample sizes (all less than or equal to 40
participants), if applied broadly, they suggest that frequency may affect the amount of recovery
in a patient, and may differentially affect short- and long-term outcomes in psychotherapy.
Cognitive-behavioral therapy researchers have similarly examined the effect of frequency
on outcome, and have found that in addition to affecting the amount of recovery, frequency may
affect the speed of recovery. In a comparison of obsessive-compulsive disorder treatment
administered either daily (for 14 days) or weekly (for 14 weeks), therapeutic effects seemed to be
equally effective, even at a three month follow-up (Storch, et al., 2007; Storch, et al., 2008; see
also Emmelkamp, Van Linden, Rüphan, & Sanderman, 1989). If these two approaches are
indeed equivalent in effect, the more frequent treatment appears to have the advantage of a faster
recovery. Though these studies have used a specific treatment for a specific disorder, they
suggest that increased frequency may decrease the amount of time a patient suffers; this is a
suggestion that warrants examination in a naturalistic setting, where patients may at times be
receiving therapy at protracted frequencies (i.e., once every two weeks) that have thus far
remained unstudied.
Naturalistic settings. Three studies were identified that have attempted to better
understand the effects of session frequency in a naturalistic setting, where data were gathered
from a working clinic rather than a controlled trial. The first study examined session frequency
as the average number of sessions attended each week, and included dose (or number of

8
sessions) and duration (or total length of the treatment) as variables in the analysis. The
researchers found that neither absolute dose nor duration was a significant predictor of outcome,
but that fewer sessions and more months of therapy were associated with worse outcomes.
Further, they found that higher session frequency for those in therapy less than five months was
associated with better outcomes, and higher session frequency for those in therapy more than
five months was associated with worse outcomes (Reardon, Cukrowicz, Reeves, & Joiner, 2002).
These findings would seem to suggest that more frequent sessions are associated with better final
outcomes for subjects who received a shorter course of therapy, but with worse final outcomes
for subjects who received a longer course of therapy.
There are several issues, however, that hamper clear interpretation of these results. Initial
symptom severity was not included and could reasonably explain the findings, independent of
session frequency. The study also utilized a small sample size (N = 74, split in half to compare
groups) that may not be representative of a larger population; for example, of their total sample,
42 deteriorated and 25 experienced no change, indicating a disproportionately large number of
individuals getting worse over the course of therapy compared to other naturalistic outcome
studies. Finally, outcome was operationalized as post-hoc ratings of functioning, using case
notes and available measures as indicators of total change over the course of therapy. How well
these change ratings reflect actual change across therapy is unknown.
The second study examined how the number and frequency of sessions within the first
three months of therapy were associated with final outcome in 256 clients. This association was
compared across three theoretical orientations: psychodynamic psychotherapy, cognitive
behavioral therapy, and psychoanalytic psychotherapy. No association was found between initial
frequency and outcome for psychodynamic and cognitive behavioral therapies; psychoanalytic

9
therapy, however, tended to have better outcomes when it was initially less frequent, but regular
(Kraft, Puschner, & Kordy, 2006). This conclusion is incongruent with previous findings for
psychoanalytic psychotherapy, discussed above, that showed a linear relationship between
increased frequency and better outcomes (see Freedman et al., 2009, and Sandell et al., 2000),
but congruent with Sandell, Blomberg, and Lazar’s (2002) longitudinal follow-up that suggested
low frequency and a shorter duration were associated with better outcomes. This could perhaps
be explained by the restriction of the analysis of session frequency in Kraft, Puschner, and
Kordy’s study to the first three months of therapy. As with the first study presented (Reardon et
al., 2002), there are limitations that prevent extrapolation of these results to the effects of
scheduled frequency—most notably, an operationalization of frequency as total number of
sessions attended within the first three months of therapy, and lack of inclusion of relevant
covariates (e.g., initial symptom severity).
The third study utilized the Outcome Questionnaire-45 (OQ-45) at every third session to
track the change trajectories of 1,207 students seeking counseling at a university counseling
center (Reese, Toland, & Hopkins, 2011). In light of the recent research regarding faster
recoveries for individuals who attended fewer sessions of therapy, or the GEL model (discussed
above; see Baldwin et al., 2009), the researchers explored whether or not session frequency
improved that model of therapy recovery, and if so, the nature of frequency effects. Session
frequency was defined by subtracting the total number of sessions attended by one and dividing
that number by the number of weeks in therapy (yielding a single session frequency average for
each individual). They found that session frequency significantly contributed to the GEL model,
and that it functioned independent of the number of sessions attended. It was also found that
higher session frequency (i.e., more sessions in fewer days) was related to faster recovery.

10
Limitations to this study include the OQ-45 being given once every third session rather than
every session and the operationalization of frequency as a fixed variable for each individual
(where session frequency in fact varies over time, depending on scheduling practices).
Additionally, none of these three studies examined the clinical significance of their findings.
Overall, the existing literature suggests that session frequency may be associated with
psychotherapy outcome. Specifically, frequency has been implicated as an important factor in
(a) the total amount of change in psychotherapy, where increased frequency may lead to better
outcomes; and (b) the speed of recovery in psychotherapy, where more frequent therapy may
lead to faster response.
Session Frequency and the Generic Model of Psychotherapy
In addition to some accumulation of empirical evidence for the importance of session
frequency in psychotherapy outcome, session frequency can be conceptualized as an integral part
of the theorized structure and mechanisms of psychotherapy. While different theoretical models
provide different explanations of how therapy functions to benefit clients, several factors remain
consistent across therapies; these commonalities have been outlined by Orlinsky (2009) using
available empirical evidence in a “generic” model of psychotherapy. This model incorporates
the external structure of psychotherapy (or therapeutic operations), direct therapeutic
interventions, and the therapeutic bond as integral elements to all psychotherapies.
When considering scheduling specifically, session frequency is theorized to have an
effect on the therapeutic operations as well as the therapeutic bond. The interaction between
time between sessions and the effectiveness of therapeutic operations remains unknown, though
it stands to reason that gains may be less likely to add upon each other as the length between
sessions increases. Infrequent scheduling may also attenuate the development and stability of the

11
therapeutic alliance, as a client and therapist may feel less connected and less actively involved
with each other and the therapy. Additionally, a client may attach meanings to infrequent
scheduling that are harmful to the alliance, such as “My therapist is too busy for me,” “I must not
be important enough,” or even, “My therapist must not like me.” If both therapeutic operations
and the therapeutic bond are impaired, it follows that the psychotherapy would be less
efficacious, either decreasing the total amount of change experienced or increasing the amount of
time needed in therapy to produce change equivalent to one scheduled more frequently.
Current Study
As reviewed above, a large body of research has demonstrated the importance of
considering the “dose” of psychotherapy and its relation to outcome. Most of these studies have
ignored session frequency when defining dose. Some implications regarding frequency can
nevertheless be drawn from the literature: first, that it may affect the overall amount of change
experienced in therapy; second, that it might affect the speed of recovery; and third, that there
may be interactions between variables that change the relationship between frequency and
outcome. These implications are theoretically supported by a general model of psychotherapy
(Orlinsky, 2009). There is also some evidence for the association of scheduling frequency and
psychotherapy outcome in a naturalistic setting. There are no studies that have yet incorporated
measurement of outcome at each session, session frequency as a time varying parameter, and
examination of the clinical significance of session frequency. The current study is intended to
address these limitations and replicate current findings by comparing differences in
psychotherapy outcome between those scheduled regularly once a week and those scheduled
regularly once every two weeks as well as examining the overall effect of session frequency as a
continuous, time varying variable.

12
In conjunction with the scientific and theoretical literature, pragmatic concerns have
inspired the current research design. Because most randomized-controlled trials examining the
efficacy of psychotherapy have relied on weekly psychotherapy sessions (Hansen, Lambert, and
Forman, 2002), there is specific evidence to support the efficacy of this traditional scheduling
practice. In an informal examination of the list of research supported treatments provided by
Division 12 of the APA (APA Presidential Task Force on Evidence-Based Practice, 2006), 47 of
the 56 treatments that specified session frequency were given weekly or more frequently for the
majority of each intervention. Evidence-based treatments that are intended to be transported
from randomized clinical trials to routine care are based on weekly sessions of psychotherapy.
As mentioned earlier, however, practical and economic constraints have led therapists in
naturalistic settings to lessen session frequency to once every two weeks. Indeed, the proportion
of clients scheduled regularly once every two weeks to clients scheduled regularly once a week,
in the counseling center examined in the current study, has increased from approximately 5% in
1996, to 24% in 2010. This practice lacks a known consequence or an evidence base. Because
of this lack of research, the important theoretical implications of session frequency, and the
incongruence between research supported scheduling practices and actual scheduling practices in
naturalistic therapy, this study was designed to address the following questions:
1. Is the amount of recovery in psychotherapy associated with therapy scheduled once a
week versus once every two weeks?
2. Is speed of recovery in psychotherapy associated with therapy scheduled once a week
versus once every two weeks?
3. What is the overall effect of session frequency on psychotherapy recovery curves?

13
Method
Participants
Archival outcome and appointment data were drawn from the counseling center database
of a large western university. Those included in the database (N = 24,448) were university
students who received individual psychotherapy between 1996 and 2011. Therapy at the
counseling center is offered free of charge and without session limits to full-time students of the
university. Clients are referred or self-referred for a wide range of problems, the majority of
which are adjustment, anxiety or depression related. Individual therapy generally consisted of
the traditional 50 minute hour. Therapists at the counseling center are psychologists or
supervised psychologists in training (doctoral students in counseling or clinical psychology) who
provide treatment according to their theoretical preference, including cognitive-behavioral,
psychodynamic, client-centered, existential, systems, and integrative modalities.
Consideration for inclusion in this study was restricted to individuals who had only
attended individual therapy (i.e., no group treatment), attended at least two sessions of therapy
and completed at least two measures of outcome (N = 16,003), allowing for clients to be exposed
to a scheduling effect.
Selection and Grouping Procedures
Scheduling practices. An informal survey of 17 therapists at the counseling center was
used to better understand and generate hypotheses about current scheduling practices at the
counseling center. Therapists estimated the percentage of clients they see once a week (M =
34%), once every two weeks (M = 54%), and less frequently (M = 11%). They also reported
their ideal proportions of session frequency, with a mean of 66% for once a week, 27% for once
every two weeks, and 8% for less frequently. When asked about these scheduling practices, 12

14
therapists indicated that they were not able to see clients more frequently due to a full schedule, 3
therapists indicated that it was according to client severity, and 2 therapists were unsure. Most
therapists expressed that they would like to see clients once a week and that they often begin
therapy with higher frequencies and taper to lower frequencies later in therapy.
As traditional scheduling generally considers weekly units, individuals scheduled
regularly once a week (1WK) or regularly once every two weeks (2WK) were identified. Three
selection procedures were employed in order to identify these groups and isolate the effects of
scheduling on recovery trajectories.
Mean Selection Procedure. A mean and standard deviation were calculated for the
number of weeks between each scheduled session for each client. For example, a client who had
attended three sessions one week apart and three sessions two weeks apart would receive a mean
of 1.5 and a standard deviation of 0.5. Three increasingly broad parameters were used to define
1WK and 2WK groups. The narrowest parameters identified individuals who had a mean of
either 1 or 2 and a standard deviation of 0. The next, broader set of parameters identified
individuals with a mean within .125 of 1 or 2 and a standard deviation equal to or less than .125.
The broadest set of parameters identified individuals with a mean within .25 of 1 or 2 and a
standard deviation equal to or less than .25. For ease in discussing results, this selection method
will be referred to as the Mean selection procedure; groups defined by the narrowest parameters
will be referred to as M Groups 1, groups defined by the intermediate parameters as M Groups 2,
and groups defined by the broadest parameters as M Groups 3. These broadening parameters
were non-overlapping, where individuals who were grouped by narrower parameters were not
included within the groups identified by broader parameters. Wider parameters than those listed
were considered (i.e., M = within 0.5 weeks, SD = 0.5), but were ruled out as identified cases did

15
not seem representative of the construct of interest (i.e., regularly scheduled therapy at either
once a week or once every two weeks).
Proportion Selection Procedure. The second selection procedure calculated the
proportion of sessions scheduled within one day of one- or two-week periods. Using the same
example discussed in the Mean procedure, the client would receive a proportion of .50 for
sessions scheduled once a week and .50 for sessions scheduled once every two weeks. Three
increasingly broad parameters were also used with this procedure. The narrowest parameters
identified individuals who received 100% of sessions within 1 week for the 1WK group, and
individuals who received 100% of sessions within 2 weeks for the 2WK group. The next,
broader parameters included individuals who received at least 75% of their sessions within 1 or 2
week periods; the broadest parameters included individuals who received at least 66% of their
sessions within 1 or 2 week periods. This selection method will be referred to as the Proportion
selection procedure; groups defined by the narrowest parameters will be referred to as P Groups
1, groups defined by the intermediate parameters as P Groups 2, and groups defined by the
broadest parameters as P Groups 3. As with the Mean procedure, groups identified by these
broadening parameters were non-overlapping.
Quarters Selection Procedure. The simplest and most inclusive selection procedure
simply calculated the mean frequency of sessions for each individual and included those within
.25 of 1 week or 2 week means. This selection method will be referred to as the Quarters
procedure. Table 1 presents a summary of each of the above selection and grouping procedures.
Time Period Selection. Session frequency was calculated for each individual over the
first month of therapy (Month 1), the first two months of therapy (Month 2), the first three
months of therapy (Month 3), and over the entire course of therapy. Each of the above

16
Table 1 Summary of Selection and Grouping Procedures for Comparisons of Therapy Once a Week (1WK) versus Therapy Once Every Two Weeks (2WK)
Procedure Description Advantages of Procedure
1WK 2WK Mean Procedure
Accounts for average frequency (M) and the frequency regularity (SD), restricting selection to individuals who regularly attended once a week or once every two weeks.
M Group 1 M = 1 week SD = 0
M = 2 weeks SD = 0
M Group 2 M = within .125 weeks of 1 SD = .125
M = within .125 weeks of 2 SD = .125
M Group 3 M = within .25 weeks of 1 SD = .25
M = within .25 weeks of 2 SD = .25
Proportion Procedure
Less affected by frequency outliers (e.g., a single session scheduled 2 months after the last) than the mean procedure.
P Group 1 100% of sessions scheduled at 1WK intervals
100% of sessions scheduled at 2WK intervals
P Group 2 75% of sessions scheduled at 1WK intervals
75% of sessions scheduled at 2WK intervals
P Group 3 66% of sessions scheduled at 1WK intervals
66% of sessions scheduled at 2WK intervals
Quarters Procedure M = within .25 of 1 week
M = within .25 of 2 weeks
Less restrictive than either of the above procedures, capturing a broader section of the population.

17
parameters was applied to these time periods. For example, individuals who were regularly
scheduled either once a week or once every two weeks within the first month of their course of
therapy were identified and grouped; this procedure was followed for all time periods,
considering session frequency during the first two months, first three months, and entire course
of therapy. Each selection procedure listed above, therefore, has four different time iterations,
allowing for examination of the effects of session frequency early in therapy as well as over an
entire course. These procedures and time iterations are illustrated in Figure 1.
Measures and Procedure
Outcome Questionnaire-45 (OQ-45). Psychological outcome was assessed during
treatment using the OQ-45 (Lambert, Gregersen, & Burlingame, 2004), a 45-item self-report
instrument designed to measure client distress and functioning over the last week and typically
administered prior to each therapy session to track progress in therapy. Items are rated on a 5-
point Likert scale: 0 = never, 1 = rarely, 2 = sometimes, 3 = frequently, 4 = almost always. They
cover three broad domains: a) symptom distress, b) interpersonal relations, and c) social role
performance. Total scores range from 0 to 180, with higher scores reflecting more severe
distress and lower scores reflecting less distress. Accordingly, decreasing scores from week to
week indicate improved mental health functioning.
Previous research has provided evidence for the utility of the OQ-45 as a measure of
treatment progress and outcome. According to the test manual, the OQ-45 demonstrates an
excellent level of internal consistency (α = .93) and exhibits concurrent validity with symptom
distress measures such as the Symptom Checklist-90-R, Beck Depression Inventory, State-Trait
Anxiety Inventory, Zung Self-Rating Depression Scale, Zung Self-Rating Anxiety Scale, Taylor
Manifest Anxiety Scale, Inventory of Interpersonal Problems, and Social Adjustment Scale-Self

18
Figure 1. Illustration of Selection and Grouping Procedures for Comparisons of Therapy Once a Week (1WK) versus Therapy Once Every Two Weeks (2WK).
Group 1 = most stringent selection methods; Group 2 = intermediate selection methods; Group 3 = broadest selection methods; Month 1 = frequency in just the
first month of therapy considered; Month 2 = frequency in just the first two months considered; Month 3 = frequency in the first three months considered; Full =
session frequency over the full course of therapy considered; Weeks = weeks as time in multi-level models; Sessions = sessions as time in multi-level models;
Matched = 1WK and 2WK groups matched on initial symptom severity as measured by the OQ-45.
Mean Procedure Proportion Procedure Quarters Procedure Group 1 Group 2 Group 3 Group 1 Group 2 Group 3
Month 1
Month 1
Month 1
Weeks Sessions
Weeks Sessions
Weeks Sessions
Weeks Sessions
Weeks Sessions
Weeks Sessions
Weeks Sessions
Matched
Month 2
Month 2
Month 2
Weeks Sessions
Weeks Sessions
Weeks Sessions
Weeks Sessions
Weeks Sessions
Weeks Sessions
Weeks Sessions
Matched
Month 3
Month 3
Month 3
Weeks Sessions
Weeks Sessions
Weeks Sessions
Weeks Sessions
Weeks Sessions
Weeks Sessions
Weeks Sessions
Matched
Full
Full
Full
Weeks Sessions
Weeks Sessions
Weeks Sessions
Weeks Sessions
Weeks Sessions
Weeks Sessions
Weeks Sessions
Matched
Matched
Matched
Matched
Matched
Matched
Matched
1WK vs. 2WK Groupings

19
Report. Test-retest reliability was reported as .84 over a 3-week period. The OQ-45 is also
reported, however, as sensitive to change, improving an average of 17.47 points in a sample of
40 patients receiving psychotherapy. Norms have been established for individuals between the
ages of 18 and 80 within university, private practice, community mental health, outpatient, and
inpatient settings; normative data has been accumulated both nationally and internationally
(Lambert, et al., 2011).
The OQ-45 was administered in the current study either by paper or personal digital
assistant (i.e., PDA) to patients at the beginning of each therapy session, providing a measure of
functioning for each session attended. Client and therapist were both aware that outcome scores
were stored for research purposes, and informed consent was obtained at intake.
OQ-45 scores will primarily be explored as a continuous variable; the OQ-45, however,
also offers cut-offs for reliable change (RC) and clinically significant change (CS), derived from
the model of statistically operationalized clinically significant change proposed by Jacobson and
Truax (1991). RC is defined as change in observed scores that exceed the amount of variation
expected within the standard error of measurement using a 95% confidence interval. In the case
of the OQ-45, this equals at least 14 points. CS is distinguished by two criteria: a) the change
observed is equal to or exceeds the RC index, and b) the score leaves the clinical range of
functioning (in the case of the OQ-45, scores > 63) and enters the normal range of functioning
(OQ-45 ≤ 63). This cutoff is calculated by deriving the midpoint between the means of a clinical
normative group and a normal population, and indicates that if a score falls on either side of the
cutoff point, it is more likely to belong to the population to whose mean it is closest (Lambert et
al., 2004). Both RC and CS were used to help interpret results beyond statistically significant
change in groups of individuals. Additionally, a change of 14 points in a negative direction

20
(where the client is worse than when they began) defines reliable deterioration, another category
explored for significant differences between groups. It is important to note that these categories
are non-overlapping, and that a significant portion of each group experienced neither reliable
change nor reliable deterioration.
Variables of interest. Several important variables were calculated for each case. The
variable used to examine session frequency as a continuous variable for all subjects was
calculated as a cumulative mean frequency at each session. For example, a person scheduled one
week out would receive a 1 for their cumulative mean at the second session. If this person were
then scheduled two weeks out, they would receive a 1.5 mean at the third session, and if
scheduled two weeks out again, they would receive a cumulative mean of 1.67 at the fourth
session, and so on. A cumulative standard deviation for session frequency was also calculated
for each participant to examine the effects of session regularity. These variables were calculated
over the entire course of therapy, and also calculated for just the first month of scheduling, the
first two months of scheduling, and the first three months of scheduling. This was achieved by
freezing the cumulative mean and the cumulative standard deviation at the one, two, or three
month mark for each individual (with the mean and standard deviation at this mark being carried
forward for all remaining sessions), and allowed for investigation of the effects of session
frequency during these time periods on overall recovery curves.
Other important covariates were calculated, including: (a) dose, or the number of sessions
attended, (b) duration, or the total number of weeks attended during a single course of therapy,
(c) initial symptom severity, defined by the first OQ-45 measure recorded, (d) the ratio of
attended appointments to scheduled appointments (i.e., attended/scheduled, a ratio between 0 and
1), and (e) the total number of weeks between each session, from session to session (to examine
21
the simple effects of time between sessions, independent of overall session frequency).
Diagnosis of client was made by the treating clinician without the aid of formal research quality
criteria. As diagnoses were not reliably recorded in the dataset, they were not included in the
analysis.
Data Analysis
Using the multiple sampling procedures indicated above, differences between groups in
the amount of change over the entire course of therapy were compared using analyses in SPSS.
Mean differences in total change across therapy between 1WK and 2WK groups were analyzed
without covariates using independent sample t-tests, as well as with covariates, using ANCOVA
and including total number of sessions and initial severity. Proportions of individuals meeting
criteria for RC, CS, and deterioration in 1WK and 2WK groups were also compared using χ2
analyses. RC, CS, and deterioration represent independent, non-overlapping groups, where a
substantial number of each sample do not meet any of the three criteria. These criteria are
therefore independently useful in understanding recovery and deterioration patterns in each of
the groups.
Multi-level modeling (Singer & Willet, 2003; also referred to as hierarchical linear
modeling) was used to detect differences between 1WK and 2WK speed of recovery, using
initial severity, attended/scheduled ratio, and number of attended sessions as covariates, and
controlling for therapist effects by including primary therapist as a random variable. This
statistical method is particularly suited to the data in that it accounts for multiple OQ-45 scores
nested within individuals, which are in turn nested within groups (i.e., 1WK or 2WK).
Accounting for this relationship, individual and group estimates of mean and slope were
calculated and compared. The PROC HPMIXED procedure in SAS, a procedure designed for

22
efficient analysis of large numbers of observations and similar to the PROC MIXED procedure
in SAS, was used to estimate group and individual differences. The PROC HPMIXED
procedure relies on sparse matrix techniques and estimates covariance parameters using
restricted maximum likelihood. Separate analyses were run for groups identified by each
selection procedure and each time period (i.e., session frequency during the first month, first two
months, first three months, or the entire course of therapy). Covariates listed above that were
hypothesized to affect OQ-45 score trajectories were also included, and to facilitate
interpretation the initial severity and total number of sessions were centered on their grand
means. Thus, model estimates for intercept and slope corresponded to clients with average initial
severity (M = 69.8) and total number of sessions attended (M = 6.8).
The Kaplan-Meier Survival Analysis in SPSS was used to assess clinically significant
differences between 1WK and 2WK groups, where time to RC and CS were examined. This
procedure predicts the proportion of subjects who will reach a specified criterion (i.e., RC or CS)
by a certain time, and censors (or eliminates from the predictive model) subjects who either
reached the criterion or who finished therapy without reaching the criteria at any given time
point. Multi-level modeling and survival analyses were run using two time variables: (a) days in
therapy (allowing for a comparison between groups over time), and (b) number of sessions
attended (allowing for a session-by-session comparison).
Additionally, each of the above analyses was used to examine datasets matched on initial
symptom severity (or the first OQ-45 score). Matched datasets were constructed for all selection
procedures over the entire course of therapy and for the Quarters procedure at Month 1, Month 2,
and Month 3 (see Figure 1).
23
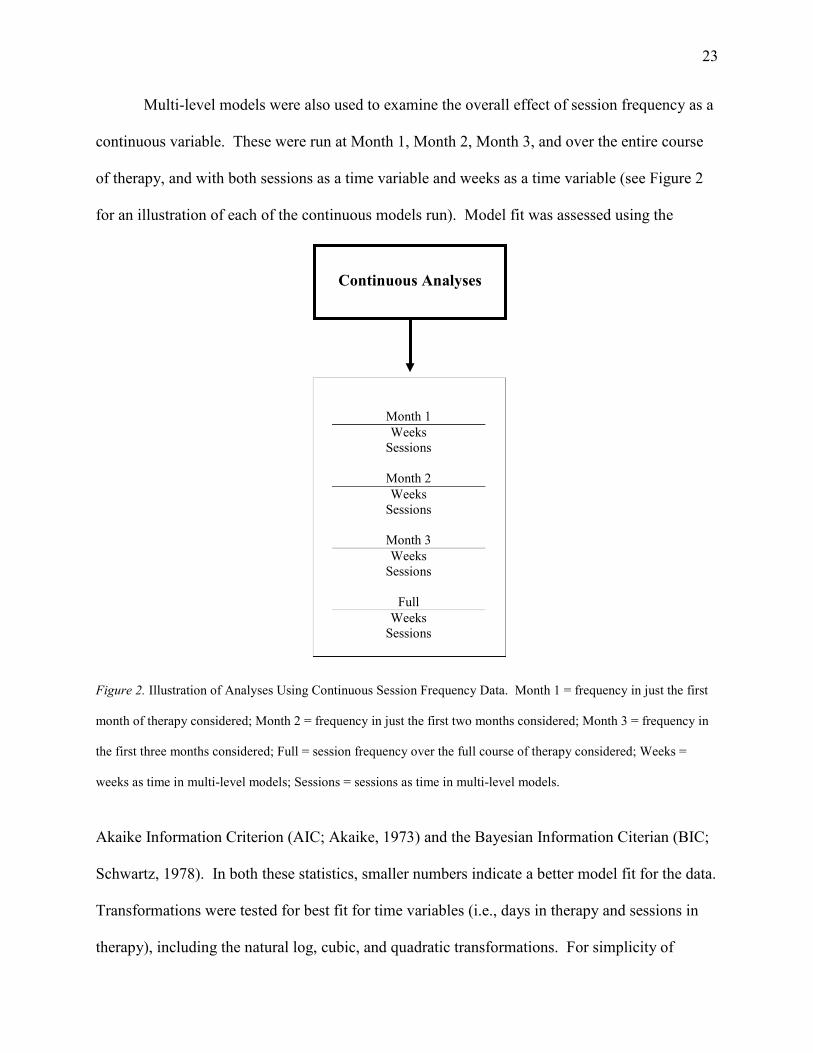
Multi-level models were also used to examine the overall effect of session frequency as a
continuous variable. These were run at Month 1, Month 2, Month 3, and over the entire course
of therapy, and with both sessions as a time variable and weeks as a time variable (see Figure 2
for an illustration of each of the continuous models run). Model fit was assessed using the
Figure 2. Illustration of Analyses Using Continuous Session Frequency Data. Month 1 = frequency in just the first
month of therapy considered; Month 2 = frequency in just the first two months considered; Month 3 = frequency in
the first three months considered; Full = session frequency over the full course of therapy considered; Weeks =
weeks as time in multi-level models; Sessions = sessions as time in multi-level models.
Akaike Information Criterion (AIC; Akaike, 1973) and the Bayesian Information Citerian (BIC;
Schwartz, 1978). In both these statistics, smaller numbers indicate a better model fit for the data.
Transformations were tested for best fit for time variables (i.e., days in therapy and sessions in
therapy), including the natural log, cubic, and quadratic transformations. For simplicity of
Continuous Analyses
Month 1
Weeks Sessions
Month 2
Weeks Sessions
Month 3
Weeks Sessions
Full
Weeks Sessions

24
interpretation, a single time transformation that best fit the model was used. For analyses of
session frequency as a continuous variable, the natural log of days and sessions was used; for
analyses comparing 1WK and 2WK groups, linear time was used.
Results
Descriptive Statistics
Of the total sample, 61.5% of participants were female and 36.4% male, with 2.1%
unspecified. Their mean age was 22.8, with 85.0% reporting White as their primary ethnicity,
6.0% Hispanic, 2.5% Asian, 1.2% Pacific Islander, 0.9% American Indian, 0.7% Black, and
3.7% other. Additionally, 15.2% of participants sought multiple courses of treatment at different
time periods included in the dataset. These courses were identified as a break of three months or
more in therapy attendance. The average number of sessions attended per course of therapy was
6.8, and the average number of weeks per course of therapy was 11.3.
Demographics and descriptive statistics for each group selection method (i.e., mean and
standard deviation, proportion, or quarters), at each timeframe (i.e., scheduling patterns during
the first month, first two months, first three months, or entire course of therapy), as well as
demographics for groups matched on initial severity, can be seen in Tables 2 and 3. Generally,
1WK and 2WK groups did not differ significantly in age, gender, and ethnicity composition.
The 1WK groups tended to have higher initial severity and attend more sessions than the 2WK
groups. Month 1 and Month 2 groups did not differ between 1WK and 2WK in the total number
of days in therapy, while Month 3 groups and groups based on the entire course of therapy
showed fewer days in therapy for 1WK groups. Narrower parameters for group selection (i.e., M
Groups 1 and P Groups 1) tended to yield groups that had shorter courses of therapy and fewer
sessions than broader selection parameters.

25
Similarly, groups matched on initial severity were equivalent in age, gender, and
ethnicity composition. Although the total number of sessions attended was still generally greater
for 1WK groups, these differences narrowed; matched groups based on the Quarters procedure
yielded nearly identical total sessions attended. As would be expected, the total number of days
in therapy was significantly lower for 1WK groups.
Question 1: Amount of Recovery
For each question, an overall summary of the analyses will be given followed by a
detailed report of each analysis according to the different time frames being considered. In order
to assess differences between groups in the amount of recovery experienced over the entire
course of therapy, two methods were used. First, independent samples t-tests were used to
determine differences between 1WK groups and 2WK groups on the total amount of change over
the course of therapy. Twenty-four of 28 comparisons showed significant differences favoring
the 1WK groups. In order to statistically control for relevant covariates, univariate ANCOVAs
were used, including initial severity and number of sessions attended in the analyses. It should
be noted that this method of statistical control has been criticized as difficult to interpret when
groups differ significantly on the variables that are being controlled (Lord, 1967). As these
groups are significantly different in both covariates that were included, ANCOVA results should
be interpreted with caution. These analyses generally indicated greater means for change in
therapy in the 1WK groups compared to the 2WK groups and were statistically significant for 14
of the 28.

26
Table 2 Demographics for Therapy Once a Week (1WK) and Therapy Once Every Two Weeks (2WK) Groups n Age Initial OQ Total Sessions
Total Days
% Female
% Ethnic
Minority 1WK 2WK 1WK 2WK 1WK 2WK 1WK 2WK 1WK 2WK 1WK 2WK 1WK 2WK
Entire Course
M Groups 1 803 292 22.4* 22.9* 69.4*† 64.0*† 2.8*† 2.4*† 12.7*†† 19.7*†† 61.9 58.0 6.7 4.6
M Groups 2 365 64 22.6 22.6 69.3 64.4 4.2*†† 3.5*†† 22.6*†† 34.7*†† 63.4*† 45.2*† 5.8 0.0
M Groups 3 877 229 22.3 22.3 69.9*† 64.9*† 3.9*†† 2.8*†† 20.1*† 23.9*† 64.5 64.9 5.3 5.9
P Groups 1 727 254 22.3*† 22.9*† 67.2*† 61.2*† 3.1*†† 2.5*†† 14.7*†† 21.2*†† 61.6 54.9 5.5* 2.4*
P Groups 2 554 50 22.4 22.4 70.0*†† 59.9*†† 8.0*†† 5.4*†† 56.3 62.6 66.7 58.0 5.6 0.0
P Groups 3 797 122 22.5 22.4 69.1*† 63.9*† 6.8*†† 4.3*†† 52.2 45.5 65.0 56.4 4.2 0.9
Quarters 3,781 2,766 22.3* 22.9* 70.9* 69.1* 5.5*† 7.9*† 33.8*†† 94.7*†† 64.2 63.0 5.5 5.3
First Month
M Groups 1 1,673 674 22.7 23.0 69.7*† 65.0*† 6.2*† 4.9*† 65.6 66.7 62.4 60.9 6.3 4.7
M Groups 2 914 148 22.7 23.0 69.7 69.6 8.3*† 6.6*† 83.7 82.8 63.4 58.3 5.9 4.2
M Groups 3 1,950 490 22.7 22.6 71.1*† 66.1*† 7.3*†† 5.1*†† 74.3 69.2 63.9 61.3 4.6 5.3
P Groups 1 3,045 1,064 22.6* 22.9* 69.8*† 66.2*† 6.4*† 4.9*† 66.6 68.3 62.7 59.6 5.9 4.8
P Groups 2 738 22.7 70.7 11.1 104.8 65.7 4.1
P Groups 3 1,795 31 22.8 22.6 70.5 69.7 8.4 10.0 89.6 105.1 64.3 70.0 5.0 0.0
Quarters 6,691 2332 23.2 23.2 70.4*† 65.0*† 7.1 6.2 81.5 82.4 64.0 62.6 5.6 5.2
(continued)

27
Table 2 (continued). n Age Initial OQ Total Sessions
Total Days
% Female
% Ethnic
Minority 1WK 2WK 1WK 2WK 1WK 2WK 1WK 2WK 1WK 2WK 1WK 2WK 1WK 2WK
First Two Months
M Groups 1 1,014 373 22.5* 23.1* 69.7*† 64.4*† 3.8*† 3.1*† 31.9 36.3 61.2 60.8 6.5 5.0
M Groups 2 509 92 22.8 22.8 69.7 66.2 6.8*† 4.7*† 61.1 60.9 63.9*† 48.9*† 6.0* 0.0*
M Groups 3 1,190 316 22.5 22.7 70.6*† 64.5*† 5.7*†† 3.8*†† 49.1 48.6 64.6 64.2 5.1 5.2
P Groups 1 1,821 593 22.5* 22.9* 69.8*† 64.9*† 4.1*† 3.2*† 34.0 39.6 62.4 58.0 6.3 4.5
P Groups 2 1,250 126 22.8 22.9 69.6 66.5 10.7*†† 7.7*†† 105.6 106.2 65.1 60.2 4.8 2.3
P Groups 3 1,416 267 22.8 23.2 71.0*† 66.6*† 8.5*†† 5.8*†† 88.1 82.1 65.4 63.6 4.5 4.7
Quarters 5,366 2,738 23.2 23.3 70.6 69.0 7.1*† 5.9*† 73.1 82.7 63.8 62.1 5.3 5.9
First Three Months
M Groups 1 915 339 22.5 22.9 69.6*† 64.2*† 3.1*† 2.6*† 19.1*† 25.2*† 61.9 60.2 6.5 4.2
M Groups 2 423 73 22.7 22.5 70.0 65.9 5.1*†† 3.8*†† 37.6 43.3 62.9*† 48.6*† 6.5* 0.0*
M Groups 3 1,015 269 22.3 22.5 70.0*† 64.3*† 4.7*† 3.2*† 33.6 37.3 64.7 65.8 5.1 5.3
P Groups 1 1,626 519 22.4 22.7 69.6*† 64.7*† 3.3*† 2.6*† 20.2*† 26.7*† 62.6 58.4 6.2 4.2
P Groups 2 1,129 115 22.7 23.2 70.3*† 65.1*† 10.5*†† 6.6*†† 100.2 93.3 65.0 57.1 5.0 2.7
P Groups 3 1,270 244 22.9 23.0 70.8*† 67.6*† 8.4*†† 5.3*†† 86.1*† 70.4*† 64.1 64.7 4.7 5.1
Quarters 4,633 2,893 23.1 23.1 70.6 69.4 6.9 6.4 65.7*† 89.9*† 64.4 62.5 5.6 5.6
Note. * p < .05, indicating significant differences between means or proportions, as indicated by independent t-tests and tests of χ2, respectively. Cohen’s d
statistics were calculated for statistically significant results, and are indicated in the table by † d > .2 and †† d > .5. Values for Age, Initial OQ, Total Sessions, and
Total Days are means. When considering only the first month of therapy, P Groups 2 did not have any subjects that met criteria for the 2WK group.

28
Table 3 Demographics for Matched 1WK and 2WK Groups
n Age Initial OQ Total Sessions
Total Days
% Female % Ethnic
Minority 1WK 2WK 1WK 2WK 1WK 2WK 1WK 2WK 1WK 2WK 1WK 2WK 1WK 2WK
Entire Course
M Groups 1 285 285 22.7 22.9 64.3 64.3 2.8*† 2.4*† 12.8*†† 19.7*†† 54.9 58.4 8.2 4.3
M Groups 2 352 352 22.9 22.7 63.9 63.9 4.2*†† 3.5*†† 22.7*†† 34.7*†† 57.9 45.2 6.6*† 0.0*†
M Groups 3 581 581 21.9 22.3 64.1 64.1 3.9*†† 2.8*†† 20.2*† 23.9*† 68.2 64.4 2.7 5.9
P Groups 1 239 239 22.3*† 23.0*† 61.3 61.3 3.0*†† 2.5*†† 14.4*†† 21.3*†† 56.6 54.9 6.0 2.6
P Groups 2 299 299 22.4 22.4 62.8 62.8 8.0*†† 5.4*†† 45.1 45.5 68.2 58.0 3.9 0.0
P Groups 3 422 422 22.2 22.3 62.4 62.4 6.1*†† 4.3*†† 45.1 45.5 62.3 56.9 3.8 0.9
Quarters 2,717 2,717 22.5* 22.8* 69.1 69.1 5.4*† 7.9*† 33.6*†† 95.0*†† 63.1 62.9 5.5 5.2
Quarters, Month 1 2,327 2,327 22.7 22.8 67.0 67.0 5.2* 5.7* 31.2*†† 64.6*†† 64.8 62.1 5.0 4.4
Quarters, Month 2 2,721 2,721 22.4* 22.8* 68.0 68.0 5.2* 5.8* 31.2*†† 65.9*†† 63.5 62.6 4.9 5.5
Quarters, Month 3 2,872 2,872 22.4* 22.8* 69.0 69.0 5.3* 5.8* 31.9*†† 66.5*†† 64.2 62.3 5.2 5.5
Note. * p < .05, indicating significant differences between means or proportions, as indicated by independent t-tests and tests of χ2, respectively. Cohen’s d
statistics were calculated for statistically significant results, and indicated in the table as † d > .2 and †† d > .5. Values for Age, Initial OQ, Total Sessions, and
Total Days are means. When considering only the first month of therapy, P Groups 2 did not have any subjects that met criteria for the 2WK group.

29
To better assess clinically significant differences in the amount of recovery achieved in
therapy, χ2 analyses were used to compare differences in the proportion of CS, RC, and
deterioration (i.e., 14 points of change on the OQ-45 in a negative direction) between groups. It
is important to note that these analyses did not control for the total number of sessions attended,
and only in the case of matched datasets did they control for initial severity. Results were
congruent with those above, where 1WK groups tended to have greater proportions of
participants attaining CS and RC, and smaller proportions of subjects deteriorating. These
differences were statistically significant between groups in 8 of 21 tests of CS, 12 of 21 tests of
RC, and 9 of 21 tests of deterioration.
Effects of Month 1 scheduling. Groups selected by considering only the first month of
scheduling patterns showed significantly more OQ-45 change for 1WK groups in independent
groups t-tests in M Groups 1, M Groups 3, P Groups 1, and Quarters with Cohen’s d ranging
from .11 to .18 (see Table 4). ANCOVA results indicated showed significant differences in M
Groups 3, F(1, 2440) = 7.65, p = .006, d = .14 and Quarters, F(1, 9023) = 19.97, p < .001, d =
.12. No other ANCOVA results were significant at the Month 1 period.
Similarly, significant differences were found in a limited number of χ2 analyses, indicated
significantly higher CS for the 1WK group in M Groups 3 and Quarters and higher RC for the
1WK group in M Groups 1, M Groups 3, P Groups 1, and Quarters; odds ratios indicate that
those in the 1WK group are between 1.21 and 1.78 times more likely to achieve these gains.
Significantly higher proportions of deterioration were found for the 2WK group in Quarters, with
an odds ratio indicating that those in the 2WK group were 1.32 times more likely to deteriorate
(see Table 5).

30
Table 4 Independent Sample t-tests Detecting Differences in Total Change in OQ-45 Scores Between 1WK and 2WK Groups
Mean Total Change (Standard
Deviation)
1WK 2WK t df Cohen’s d Entire Course
M Groups 1 9.83 (14.93) 5.63 (16.14) 4.03** 1093 0.24
M Groups 2 12.07 (16.96) 5.53 (13.39) 2.93** 427 0.28
M Groups 3 10.49 (16.72) 7.51 (16.54) 2.41* 1104 0.14
P Groups 1 11.41 (15.7) 6.63 (16.73) 4.11** 979 0.26
P Groups 2 13.80 (20.53) 6.82 (17.14) 2.33* 593 0.19
P Groups 3 12.40 (18.07) 10.45 (16.87) 1.12 917
Quarters 11.63 (17.76) 10.72 (19.77) 1.95 6545
First Month
M Groups 1 9.82 (18.13) 7.53 (17.61) 2.80** 2345 0.12
M Groups 2 12.24 (19.84) 11.06 (18.77) 0.68 1060
M Groups 3 11.88 (19.08) 7.75 (16.48) 4.40** 2438 0.18
P Groups 1 10.49 (18.47) 8.21 (17.6) 3.51** 4107 0.11
P Groups 2 12.16 (19.69) 14.13 (21.4) -0.55 1824
P Groups 3 9.82 (18.13) 7.53 (17.61) 2.80 2345
Quarters 11.99 (19.33) 8.84 (17.75) 6.90** 9021 0.12
First Three Months
M Groups 1 9.42 (15.23) 5.54 (16.29) 3.94** 1252 0.22
M Groups 2 11.88 (17.35) 6.32 (14.55) 2.59** 494 0.23
M Groups 3 10.45 (17.15) 6.46 (16.34) 3.42** 1282 0.19
P Groups 1 9.80 (15.89) 6.07 (15.96) 4.65** 2143 0.20
P Groups 2 12.70 (20.12) 9.55 (21.71) 1.59 1242
P Groups 3 12.65 (20.29) 9.76 (17.07) 2.09* 1512 0.11
Quarters 11.77 (18.55) 9.76 (19.06) 4.52** 7524 0.10
Matched Data
Quarters, Entire Course 11.37 (17.26) 10.63 (19.71) 1.49 5432
Quarters, Month 1 10.58 (18.28) 8.88 (17.75) 3.22** 4652 0.09
Quarters, Month 2 11.39 (18.37) 9.23 (18.44) 4.34** 5440 0.12
Quarters, Month 3 11.35 (18.29) 9.79 (19.07) 3.16** 5742 0.08
Note. *p < .05. ** p < .01. Matched Quarters Data were matched on initial symptom severity (i.e., initial OQ-45
scores).

31
Table 5 χ2 Statistics Examining Clinically Significant Differences in Total Recovery
% CS OR % RC OR % Deterioration OR
1WK 2WK 1WK 1WK 2WK 1WK 1WK 2WK 2WK
Entire Course
M Groups 1 17.6* 12.3* 1.52 34.0* 25.0* 1.55 2.1* 7.5* 3.78 M Groups 2 23.3 12.5 41.1 29.7 4.4 3.1 M Groups 3 17.3 13.1 36.7 31.4 4.8* 8.7* 1.89 P Groups 1 19.8* 13.8* 1.54 37.3* 28.7* 1.48 1.9* 7.5* 4.19 P Groups 2 25.3 16.0 46.4* 30.0* 2.02 7.2 6.0 P Groups 3 22.5 18.9 43.7 41.0 4.5 4.1
Quarters 20.6 21.1 40.7 39.8 5.1* 8.1* 1.64
First Month
M Groups 1 19.2 16.5 36.6* 32.3* 1.21 6.3 7.7 M Groups 2 23.3 25.0 42.6 40.5 7.1 5.4 M Groups 3 21.7* 13.5* 1.78 42.7* 33.5* 1.48 6.4 8.4 P Groups 1 19.4 16.8 37.8* 33.4* 1.21 6.5 7.6 P Groups 2 29.5 50.1 6.8 P Groups 3 22.7 25.8 43.7 41.9 7.0 9.7
Quarters 22.2* 17.9* 1.31 42.5* 36.2* 1.30 6.5* 8.4* 1.32
First Three Months
M Groups 1 17.3* 11.8* 1.56 34.0* 25.4* 1.51 2.7* 7.4* 2.88 M Groups 2 25.5 15.1 40.7 31.5 4.7 2.4 M Groups 3 17.1* 11.5* 1.59 37.0* 28.6* 1.47 5.5* 9.7* 1.85 P Groups 1 17.3* 12.5* 1.46 34.3* 26.8* 1.43 3.8* 7.3* 1.99 P Groups 2 23.9 22.6 44.2 43.5 7.6 9.6 P Groups 3 23.1 17.6 46.3* 38.1* 1.40 7.2 7.0
Quarters 21.2* 19.2* 1.13 41.5* 38.0* 1.16 5.7* 8.6* 1.56
Matched Quarters Data
Entire Course 20.2 21.2 39.9 39.5 4.9* 8.2* 1.73
First Month 20.7* 17.9* 1.20 40.2* 36.3* 1.18 6.8 8.3
First Two Months 20.9* 18.3* 1.18 40.1* 37.4* 1.12 6.1* 8.9* 1.50
First Three Months 20.2 19.4 40.5 38.1 5.6* 8.6* 1.59
Note. *p < .05; CS = Clinically Significant Change; RC = Reliable Change; OR = Odds ratio, where the odds of CS and RC are based on receiving therapy once a week, and the odds of deterioration are based on receiving therapy once every two weeks. Matched Quarters Data were matched on initial symptom severity (i.e., initial OQ-45 scores).

32
Effects of Month 2 scheduling. Groups selected by considering only the first two
months of scheduling showed more robust differences between 1WK and 2WK groups in t-test,
ANCOVA, and χ2 analyses. Independent groups t-tests indicating more recovery, on average, for
the 1WK group include M Groups 1 (t(1385) = 3.33, p = .001, d = .18), M Groups 2 (t(599) =
2.06, p = .04, d = .17), M Groups 3 (t(1504) = 3.80, p = .001, d = .20), P Groups 1 (t(2412) =
4.26, p < .001, d = .17), P Groups 2 (t(1374) = 2.77, p = .006, d = .15), and Quarters (t(8102) =
6.28, p < .001, d = .14). Significant ANCOVA results include M Groups 1, F(1, 1387) = 4.48, p
= .034, d = .13, P Groups 1, F(1, 2414) = 6.81, p = .009, d = .12, P Groups 2, F(1, 1376) = 5.86,
p = .016 d = .23, and Quarters, F(1, 8104) = 17.67, p < .001, d = .10.
The χ2 analyses showed significant advantages for the 1WK group in CS for M Groups 1,
M Groups 3, and Quarters; in RC for M Groups 1, M Groups 3, P Groups 1, P Groups 2, P
Groups 3, and Quarters; and significantly more deterioration in the 2WK group for M Groups 1,
M Groups 3, P Groups 1, and Quarters.
Effects of Month 3 scheduling. Groups selected by considering only the first three
months of scheduling continued to show similar differences to those found in Month 2.
Specifically, t-tests yielded results indicating more change over the course of therapy for the
1WK group for M Groups 1, M Groups 2, M Groups 3, P Groups 1, P Groups 3, and Quarters,
with effect sizes ranging from .10 to .23 (see Table 4). ANCOVA results were significant for M
Groups 1, F(1, 1254) = 6.65, p = .01, d = .16, M Groups 2, F(1, 496) = 4.23, p = .04, d = .26, M
Groups 3, F(1, 1284) = 4.18, p = .04, d = .14, P Groups 1, F(1, 2145) = 9.55, p = .002, d = .16,
and Quarters, F(1, 7526) = 10.12, p = .001, d = .08.
The χ2 analyses showed significant advantages for the 1WK group in CS for M Groups 1,
M Groups 3, P Groups 1, and Quarters and in RC for M Groups 1, M Groups 3, P Groups 1, P
33
Groups 3, and Quarters; odds ratios indicated that 1WK groups were between 1.13 and 1.59
more likely to achieve these gains. Significantly more deterioration was seen in the 2WK group
for M Groups 1, M Groups 3, P Groups 1, and Quarters, with odds ratios ranging between 1.56
and 2.88 (see Table 5).
Effects of scheduling over the entire course of therapy. Groups selected by
considering scheduling over the entire course of therapy showed significant differences favoring
1WK groups in M Groups 1, M Groups 2, M Groups 3, P Groups 1, and P Groups 2, with effect
sizes ranging from .14 to .28 (see Table 4). Fewer differences were found ANCOVA analyses,
indicating more change in the 1WK group include M Groups 1, F(1, 1095) = 4.18, p = .04, d =
.14 and M Groups 2, F(1, 429) = 4.27, p = .04, d = .28.
Significant χ2 analyses indicating higher CS for the 1WK group in M Groups 1 and P
Groups 1, the two narrowest selection procedures. RC was higher for the 1WK group in M
Groups 1, P Groups 1, and P Groups 2. Odds ratios ranged from 1.48 and 2.02. Deterioration
was significantly elevated in the 2WK group for M Groups 1, M Groups 3, P Groups 1, and
Quarters, with odds ratios ranging from 1.64 to 4.19 (see Table 5).
Matched data. Datasets matched on initial severity were run for all of the Quarters
groups and significant differences between 1WK and 2WK groups were found using t-tests for
Month 1, Month 2, and Month 3, with effect sizes ranging from .08 to .12 (see Table 4).
ANCOVA analyses showed differences over all time periods (Entire course of therapy, F(1,
2717) = 5.87, p = .02, d = .07; Month 1, F(1, 2327) = 8.87, p = .003, d = .09; Month 2, F(1,
2721) = 15.89, p < .001, d = .11; Month 3, F(1, 2872) = 9.82, p = .002, d = .08).
The χ2 analyses of CS, RC, and deterioration were examined using the Quarters selection
method, and differences between 1WK and 2WK groups narrowed but remained significant for

34
proportions of CS and RC in Month 1 and Month 2, with odds ratios ranging from 1.12 and 1.20.
Differences in proportions of deterioration were also significant between 1WK and 2WK groups
in Month 2, Month 3, and over the entire course of therapy, with odds ratios ranging from 1.50 to
1.73 (see Table 5).
Question 2: Speed of Recovery
Multi-level models were used to identify significant differences between the recovery
slopes of 1WK and 2WK groups. Models were run both with the number of days in therapy as
the time variable (in order to assess differences in slope over days in therapy) and with the
number of sessions attended in therapy as the time variable (in order to detect differences in
slope over sessions in therapy, i.e., are there differences between slopes when controlling for the
number of sessions attended). Sessions as a time variable was used to detect the possible
dilution or concentration of session impact when scheduled more or less frequently. Initial
severity and the running ratio of appointments attended to appointments scheduled were also
included in the models. Initial severity was centered on the grand mean. Multiple OQ-45 scores
were nested within individuals who were nested within therapists. In each model, the 2WK
group was used as a reference group and the 1WK group was included as a variable. A
significant interaction between the 1WK variable and the time variable would indicate a
significant difference between the recovery slope of the 1WK and 2WK groups.
By days in therapy. When comparing recovery curves of 1WK and 2WK groups over
days in therapy, the 1WK group tended to recover more quickly. This was particularly true in
the models using session frequency during the first three months and over the entire course of
therapy. P Groups 1, M Groups 1, M Groups 2, M Groups 3, and Quarters all showed
significantly steeper recovery curves for those being seen once a week. P Groups 2 and P

35
Groups 3 did not show significant differences between groups, perhaps suggesting that these
selection procedures identified more heterogeneous groups than the Mean selection method.
When datasets matched on initial severity were used, significant differences remained in
each of the groups listed above over the entire course of therapy, as well as in Quarters at Month
1, Month 2, and Month 3. Effect sizes for these differences in slope range from d = .06
(Matched Quarters, Month 2) to d = .28 (Matched P Groups 1, entire course), meeting, in some
cases, Cohen’s (1988) criteria for a small effect size (where d is greater than or equal to .2).
Examining a table assigning percentages of nonoverlap between groups by effect size (Cohen,
1988), the slopes of 1WK and 2WK groups largely overlap, but range from 7.7% (when d equals
.1) to 21.3% (when d equals .3) of the sample not overlapping. Estimates of the differences
between slopes as well as effect sizes can be found in Table 6.
In order to assess clinically significant differences in speed of recovery, survival analyses
comparing the predicted time to RC and CS in 1WK and 2WK groups were calculated.
Differences between time to RC between groups were significant at at least the p < .05 level,
favoring the 1WK group, in all analyses but P Groups 2 and P Groups 3. This pattern was
similar for analyses of CS, but with M Groups 2 not yielding significant differences at Month 1.
Matched datasets indicated similar results, where the 1WK group reached RC and CS
significantly faster than the 2WK groups for Quarters across all time periods (see Table 7). For
example, matched Quarters at Month 3 predicted that 50% of participants in the 1WK group
would reach RC at week 13.7 and CS at week 57.4, compared to participants in the 2WK group
who were predicted to reach RC at week 26.3 and CS at week 67.6. When analyzed by number
of sessions, the differences were eliminated, indicating 50% RC at session 11 (1WK) and 12
(2WK) and CS at session 29 (1WK) and 28 (2WK).
36
Table 6 Multi-level Model 1WK Effects on OQ-45 Slope in Reference to 2WK Groups by Days
Fixed Effects Estimate SE Cohen’s d Entire Course M Groups 1 -2.570** .729 .17 M Groups 2 -2.016** .622 .19 M Groups 3 -0.909 .495 P Groups 1 -2.290** .658 .17 P Groups 2 -0.324 .348 P Groups 3 0.039 .327 Quarters -0.946*** .080 .14 First Month M Groups 1 0.054 .086 M Groups 2 -0.023 .146 M Groups 3 -0.302** .099 .06 P Groups 1 -0.050 .067 P Groups 2 P Groups 3 0.070 .340 Quarters -1.125*** .186 .09 First Three Months M Groups 1 -0.654 .411 M Groups 2 -1.465*** .363 .19 M Groups 3 -0.956** .271 .11 P Groups 1 -1.170*** .308 .12 P Groups 2 -0.192 .133 P Groups 3 -0.024 .137 Quarters -0.530*** .080 .08 Matched Data Quarters, Entire Course -0.976*** .090 .13 Quarters, Month 1 -1.001*** .246 .08 Quarters, Month 2 -0.456*** .115 .06 Quarters, Month 3 -0.676*** .097 .10 M Groups 1, Entire Course -2.625** .691 .26 M Groups 2, Entire Course -2.174** .763 .26 M Groups 3, Entire Course -1.270* .626 .13 P Groups 1, Entire Course -2.714*** .691 .28 P Groups 2, Entire Course -0.247 .392 P Groups 3, Entire Course 0.025 .368 Note. *p < .05. ** p < .01. *** p < .0001. Estimate = the interaction between the 1WK group and the number of
days in therapy, indicating the estimated difference in the slope of OQ-45 scores between 1WK and 2WK groups. A
negative estimate indicates a steeper slope, or faster recovery for the 1WK group. A positive estimate indicates a
less steep slope, or slower recovery. SE = the standard error of the estimate.

37
Table 7 Kaplan-Meier Survival Analyses Examining Clinically Significant Differences in Speed to Recovery
Log Rank χ2
By Weeks By Sessions
CS RC CS RC
Entire Course M Groups 1 25.59** 46.41** 0.68 0.86 M Groups 2 10.30** 10.86** 1.29 0.12 M Groups 3 5.38* 9.33** 1.30 3.99†* P Groups 1 22.35** 37.14** 0.54 0.04 P Groups 2 2.17 4.34* 0.08 0.14 P Groups 3 0.18 0.19 1.93 9.95†** Quarters 242.74** 468.85** 44.99** 104.06**
First Month M Groups 1 6.29* 11.01** 0.04 0.01 M Groups 2 0.84 0.03 5.69†* 4.20†* M Groups 3 9.12** 9.89** 0.11 0.50 P Groups 1 6.25* 14.56** 0.95 1.18 P Groups 2 P Groups 3 .09 0.16 0.27 0.04 Quarters 14.89** 26.59** 1.58 3.45
First Three Months M Groups 1 22.12** 37.81** 1.42 1.23 M Groups 2 4.98* 5.32* 0.23 0.01 M Groups 3 7.85** 12.71** 0.00 0.24 P Groups 1 28.63** 50.63** 0.44 0.09 P Groups 2 0.13 0.00 4.07†* 10.57†** P Groups 3 0.76 1.65 1.64 2.46 Quarters 94.56** 176.85** 5.86* 11.60**
Matched Quarters Data Entire Course 206.15** 419.51** 35.41** 90.78** Month 1 4.91* 10.93** 3.36 6.39†* Month 2 29.59** 41.50** 0.03 1.54 Month 3 70.28** 148.54** 2.49 8.52**
Note. *p < .05, **p < .01; † indicates results that favor the 2WK group for speed of recovery; CS = Clinically Significant Change; RC = Reliable Change; to conserve space, analyses of the first two months of session frequency were not included. These were generally consistent with analyses of the first month and the first three months.

38
Congruent with analyses of the total amount of change, these analyses show fewer
significant results when based on only the first month of session frequency and more significant
results when based on the first three months of session frequency. Groups based on session
frequency over the entire course of therapy also tended to show significant differences in speed
of change.
By sessions in therapy. When comparing recovery curves of 1WK and 2WK groups
using sessions as the time variable, differences between groups were generally eliminated,
indicating that a single “dose” of therapy is roughly equivalent between 1WK and 2WK
scheduling patterns. This pattern emerged in both multi-level models and survival analyses.
The majority of multi-level models indicated no statistically significant differences
between groups, with a few notable exceptions. M Groups 2 and Matched Quarters indicated
small but significant differences between 1WK and 2WK groups (p = .046 and p = .048,
respectively), with a difference of -1.88 and -0.21 points, respectively, on the slope of the OQ-45
recovery curves at each time point (indicating faster recovery for the 1WK groups).
Similarly, survival analyses largely showed no differences between groups when
examined by session, with some exceptions. The Quarters method yielded results indicating
faster recovery (both RC and CS) for the 1WK group at Month 3 and over the entire course of
therapy. When matched datasets were used, results remained significant for both RC and CS
over the entire course of therapy, and for RC at Month 3. Conversely, several analyses showed
small but significant advantages for RC in the 2WK group, including M Groups 3 and P Groups
3 over the entire course of therapy, M Groups 2 at Month 1, and P Groups 2 at Month 3. Only
two analyses found significant advantages in CS for the 2WK group (M Groups 2 at Month 1
and P Groups 2 at Month 3). χ2 results for all survival analyses, including analyses by weeks and

39
by sessions, can be found in Table 7. Figure 3 illustrates typical survival curves for each of the
selection procedures (using the example of matched Quarters at Month 3), where the 1WK group
showed significantly faster recovery when using weeks as the time variable and where
differences disappeared when using sessions as the time variable.
Question 3: Overall Effects
Session frequency as a continuous variable was examined for all subjects (N = 16,003)
over the entire course of therapy. The impact of session frequency in Month 1, Month 2, or
Month 3 on overall change trajectories was also explored. Models controlled for initial symptom
severity and total dose, consistent with the literature reviewed in the introduction and the GEL
model. Cumulative standard deviation, attended/scheduled ratio, and the independent number of
weeks between each session were also included as potential contributors to variance in change
trajectories. An intraclass correlation examining the amount of variance in OQ-45 scores
between subjects and within subjects in a model with no predictors was calculated. The amount
of variance between subjects was .64, indicating that 64% of the variance in OQ-45 scores is
attributable to differences between individuals (and that there is variance to be explained by
between subject predictors). Therapist effects were added to the model and were found to
produce a better fit than the model without therapist effects, indicated by decreases in AIC and
BIC; these were therefore retained in the final model. Models were then created iteratively
through simultaneous entry of all predictor variables and subsequent retention of only those
variables that remained significant.
By days in therapy. Table 8 presents the final model estimating fixed and random
effects based on weeks in therapy. The intercept estimate indicates an average initial OQ-45
score of 72.49 (for clients with average initial severity and average treatment dose).

40
Figure 3. Survival Analyses Predicting Clinically Significant Change (CS) for Matched Quarters at Month 3, by
Weeks and by Sessions. Censored cases indicate where individuals left the predictive model without having
achieved the target criteria (in this case, CS).
Sessions in Therapy
Weeks in Therapy
Perc
ent P
redi
cted
to A
chie
ve C
S Pe
rcen
t Pre
dict
ed to
Ach
ieve
CS
2 4 6 8 10 12 14 16 18 20 22 24 26 28 30
2 4 6 8 10 12 14 16 18 20 22 24 26 28 30
1WK 2WK 1WK Censored 2WK Censored
1WK 2WK 1WK Censored 2WK Censored
0%
2
0%
40%
6
0%
80%
10
0%
0%
2
0%
40%
6
0%
80%
10
0%

41
As was expected, initial severity and total dose yielded significant effects on recovery
curves. Higher initial severity was associated with steeper recovery trajectories. A significant
negative interaction was found between total dose of therapy and days, garnering support for the
GEL model and indicating that individuals who attend more sessions of therapy tended to have a
shallower recovery slope, while those who attended fewer had a steeper slope.
Including session frequency improved the model substantially (a decrease of 83495 in
AIC and of 83497 in BIC). Session frequency had significant effects on recovery curves (as seen
in the slope estimate for session frequency). Interestingly (and counter-intuitively, based on
previous analyses) session frequency showed a negative interaction with days, indicating slightly
higher rates of change for individuals who attend therapy less frequently. Figure 4 illuminates
the nature of this interaction by extrapolating slopes at specific time points in therapy. These
graphs are therefore illustrative in nature and do not represent true trajectories for individuals.
As can be seen, the differences in slope are larger earlier in therapy and become more similar
later in therapy. This may be explained by a practical evaluation of how session frequency
interacts with days in therapy. For example, at week 4, individuals who are scheduled more
frequently than once a week may have several data points contributing to the estimation; those
scheduled once a week would have 5 data points (with the intake session at week 0 and the fifth
session at week 4); those scheduled once every two weeks would have 3 points; and those
scheduled less frequently would have only 2 data points. It follows, then, that estimations of the
even earlier effects of session frequency would necessarily be based on individuals receiving
more frequent treatment than once a week, and not on individuals receiving less frequent
therapy. In other words, there is no slope for someone being seen once every two weeks until
week 2. Examining only slopes (and ignoring differences in intercept) at later points in each

42
Table 8 Multi-level Model Predicting the Effects of Session Frequency on Change Trajectories by Days
Fixed Effects
Intercept Slope (Days)
Est. SE Est. SE
Intercept 72.49** .41 -3.86** .11
Initial Severity 1.10** .01 -.13** .00
Total Dose .39 .30 1.13** .10
Mean Frequency 3.93** .37 -.55** .08
Frequency SD -.12 .33 .17* .01
Weeks From Last .61* .23 -.13* .05
Random Effects
Variance Estimates Covariances
Residual 135.44 Intercept x sessions -44.23
Intercept 134.03
Slope 23.96
Therapist Effects 5.65
Note. * p < .05. ** p < .001. Est. = the model estimate for each parameter. SE = the standard error of the estimate.
Initial Severity is operationalized as the first OQ-45 score recorded; Total Dose is the total number of sessions
attended; Mean Frequency is the cumulative mean of session frequency at any given point in time; Frequency SD is
the cumulative standard deviation of session frequency; Weeks From Last is the independent number of weeks from
one session to the next.
graph reveals similar rates of change across different frequencies and likely better reflect
trajectories for those scheduled less frequently than multiple times a week.
Standard deviation of session frequency and weeks from the last session both showed
significant effects, though they contributed less to the model fit (a change of 71 in both AIC and

43
Figure 4. Illustration of the Interaction Effects of Session Frequency on Recovery Trajectories When Using Weeks
as Time in Multi-level Models. Slopes represented are not predicted trajectories for patients at each week, but rather
represent an extrapolation of the slopes at weeks 4 and weeks 12 over time. These plots demonstrate, primarily, the
weakening of the effect of session frequency by weeks in therapy as therapy progresses. White boxes on each of the
slopes represent a session of therapy.

44
BIC when all variables were added). Standard deviation of session frequency indicated slightly
shallower recovery curves for those who attend therapy less regularly. Weeks from the last
session paralleled session frequency, indicating that longer periods between sessions are related
to faster recovery curves (particularly early in therapy). The attended/Scheduled ratio was not
significant, and was therefore removed from the model.
Results utilizing Month 1, Month 2, and Month 3 session frequency generally paralleled
the frequency effects described in the model above, with the exception of significant effects in all
three models for the attended/scheduled ratio, where higher ratios were associated with faster
recovery. When AIC and BIC were compared for all models, including the model for the entire
course of therapy described above, the Month 1 model appeared to be the best fit for the data.
Effect sizes were calculated for the fixed effect of session frequency in each model (Month 1, d =
.03; Month 2, d = .03; Month 3, d = .06; Entire course of therapy, d = .05), and show
increasingly stronger predictive effects as the period of time used expanded.
By sessions in therapy. Table 9 presents the final model estimating fixed and random
effects based on sessions in therapy. The intercept estimate indicates an average initial OQ-45
score of 78.67. Initial severity and total dose of therapy showed results similar to those found in
the days model.
As with the days model, including session frequency in the model improved the model fit
(a decrease of 82041 in AIC and BIC). Session frequency had significant effects on recovery
curves in the opposite direction of the days model, indicating slower rates of recovery for those
scheduled less frequently. Figure 5 illustrates the isolated effects of this interaction (when all
other variables are equal to 0 or the grand mean). At session 3, slopes for different session
frequencies were similar, with those scheduled more frequently showing faster rates of recovery.

45
Table 9 Multi-level Model Predicting the Effects of Session Frequency on Change Trajectories by Sessions
Fixed Effects
Intercept Slope (Sessions)
Est. SE Est. SE
Intercept 78.67** 1.24 -12.03** .91
Initial Severity .98** .01 -.24** .01
Total Dose .27 .22 3.36** .19
Mean Frequency -1.32** .15 1.73** .14
Frequency SD .36 .14 -.31** .08
Weeks From Last .40* .09 -.28** .04
Attended/Scheduled -3.24* 1.21 1.97* .88
Random Effects
Variance Estimates Covariances
Residual 132.17 Intercept x sessions -46.52
Intercept 80.57
Slope 81.84
Therapist Effects 4.98
Note. * p < .05. ** p < .001. Est. = the model estimate for each parameter. SE = the standard error of the estimate.
Initial Severity is operationalized as the first OQ-45 score recorded; Total Dose is the total number of sessions
attended; Mean Frequency is the cumulative mean of session frequency at any given point in time; Frequency SD is
the cumulative standard deviation of session frequency; Weeks From Last is the independent number of weeks from
one session to the next; Attended/Scheduled is the ratio of attended sessions to scheduled sessions.
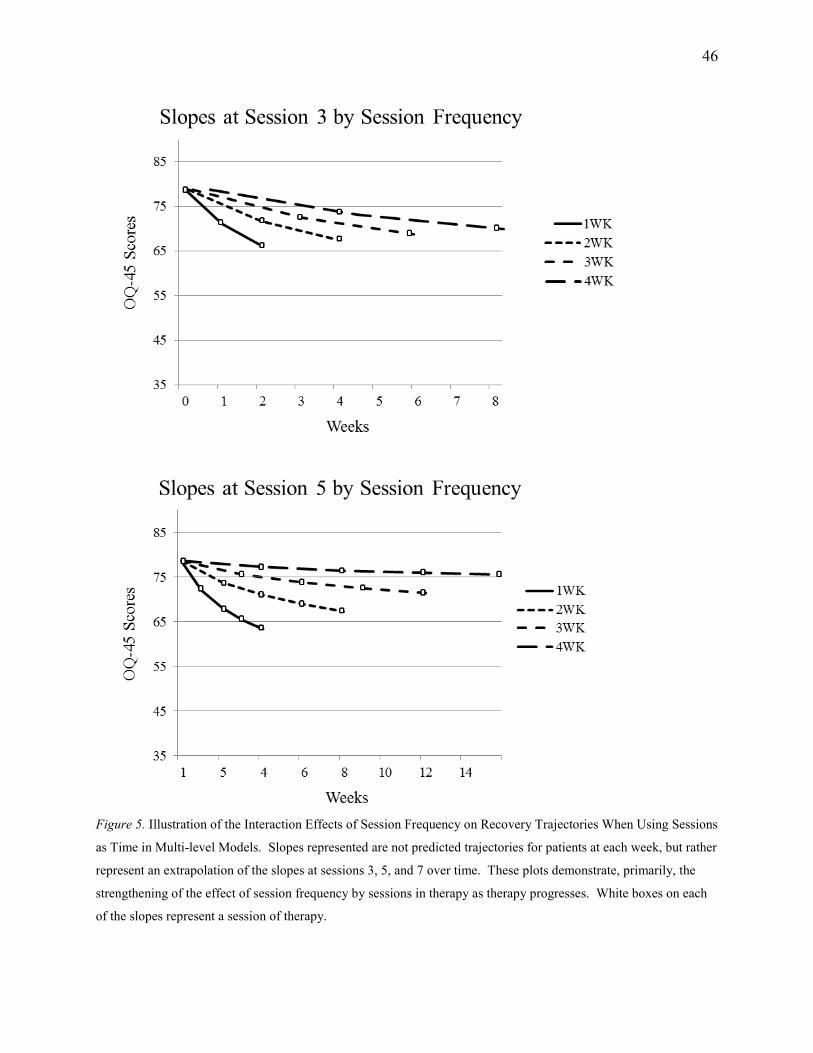
46
Figure 5. Illustration of the Interaction Effects of Session Frequency on Recovery Trajectories When Using Sessions
as Time in Multi-level Models. Slopes represented are not predicted trajectories for patients at each week, but rather
represent an extrapolation of the slopes at sessions 3, 5, and 7 over time. These plots demonstrate, primarily, the
strengthening of the effect of session frequency by sessions in therapy as therapy progresses. White boxes on each
of the slopes represent a session of therapy.

47
Figure 5 (continued). Illustration of the Interaction Effects of Session Frequency on Recovery Trajectories When
Using Sessions as Time in Multi-level Models. Slopes represented are not predicted trajectories for patients at each
week, but rather represent an extrapolation of the slopes at sessions 3, 5, and 7 over time. These plots demonstrate,
primarily, the strengthening of the effect of session frequency by sessions in therapy as therapy progresses. White
boxes on each of the slopes represent a session of therapy.
As the number of sessions increases, the slopes become increasingly different, with those
scheduled less frequently recovering more slowly. This effect continues to escalate over time,
predicting deterioration curves for those scheduled less frequently when the mean number of
sessions (6 to 7) is met.
Standard deviation of session frequency, weeks from the last session, and the
attended/scheduled ratio all showed significant effects, though they again only made minor
contributions to the model fit (a change of 80 in both AIC and BIC when all variables were
added). In contrast to the days model, higher standard deviations of session frequency were
associated with slightly steeper recovery curves. Weeks-between paralleled the weeks model,

48
indicating an association between longer periods between each session and steeper recovery
curves. High attended/scheduled ratio was significantly associated with shallower recovery
curves.
As with the days model, Month 1, Month 2, and Month 3 analyses were similar to the
frequency effects in the above model. The attended/scheduled ratio, however, was not
significant in any of the models. AIC and BIC indicated that the Month 1 model was a better fit
for the data than all other models. Effect sizes were calculated for the fixed effect of session
frequency in each model (Month 1, d = .03; Month 2, d = .05; Month 3, d = .07; Entire course of
therapy, d = .09), and show increasingly stronger predictive effects as the period of time
expanded. An illustrative table of all significant results (including analyses of amount of
recovery and speed of recovery) can be found in Figures 6, 7, and 8.
Discussion
Recent discussions have emphasized the importance of reducing the burden of mental
illness and the implications of better implementing empirically supported treatments (Chorpita et
al., 2011; Kazdin & Blase, 2011). As the bulk of empirically supported treatments have either
explicitly or implicitly employed structured session frequencies (usually once a week or more
frequently), shifting from this practice may affect the efficacy of the treatment. Although
pragmatic shifts in organizations often seem “necessary,” it is important to examine the effects of
new practices on psychotherapy outcome. This study attempted to examine the effects of
different scheduling practices on psychotherapy change trajectories in a routine-care clinic
delivering a variety of evidence-based treatments to a heterogeneous sample of clients.
Concerning the amount of change over the entire course of therapy, a trend was found
favoring the 1WK group. The mean amount of change over the entire course of therapy, when

49
Analyses t-test ANC χ2 MLM SUR CS RC DET
Entire Course Continuous Data † W * S 1WK vs. 2WK Groups
M Group 1 * * * * * * * W S
M Group 2 * * * * W S
M Group 3 * * * W † S
P Group 1 * * * * * * W S
P Group 2 * * W S
P Group 3 W † S
Quarters * * * W * S
Month 1 Continuous Data † W * S 1WK vs. 2WK Groups
M Group 1 * * * W S
M Group 2 * W S
M Group 3 * * * * * * W S
P Group 1 * * * W S
P Group 2 W S
P Group 3 W S
Quarters * * * * * * * W S
Figure 6. Illustrative Summary of All Significant Results, Entire course and Month 1. * = significant results
favoring 1WK groups or more frequent therapy. When considering deterioration (DET), an asterisk indicates
significantly less deterioration in the 1WK group. † = significant results favoring 2WK groups or less frequent
therapy. ANC = ANCOVA, CS = clinically significant change, RC = reliable change, DET = reliable deterioration,
MLM = multi-level modeling, SUR = survival analysis, W = weeks used as the time variable, S = sessions used as
the time variable. Each cell indicates an analysis that was run.

50
Analyses t-test ANC χ2 MLM SUR CS RC DET
Month 2 All Data † W * S 1WK vs. 2WK Groups
M Group 1 * * * * * * W S
M Group 2 * * W * † S
M Group 3 * * * * * * W S
P Group 1 * * * * * W S
P Group 2 * * * W S
P Group 3 * W S
Quarters * * * * * * * W S
Month 3 All Data † W * S 1WK vs. 2WK Groups
M Group 1 * * * * * * W S
M Group 2 * * * * W S
M Group 3 * * * * * * * W S
P Group 1 * * * * * * * W S
P Group 2 W † S
P Group 3 * * W S
Quarters * * * * * * * W * S
Figure 7. Illustrative Summary of All Significant Results, Months 2 and 3. * = significant results favoring 1WK
groups or more frequent therapy. When considering deterioration (DET), an asterisk indicates significantly less
deterioration in the 1WK group. † = significant results favoring 2WK groups or less frequent therapy. ANC =
ANCOVA, CS = clinically significant change, RC = reliable change, DET = reliable deterioration, MLM = multi-
level modeling, SUR = survival analysis, W = weeks used as the time variable, S = sessions used as the time
variable. Each cell indicates an analysis that was run.

51
Analyses t-test ANC χ2 MLM SUR CS RC DET
Entire Course 1WK vs. 2WK Groups
M Group 1 * W S
M Group 2 * W S
M Group 3 * W S
P Group 1 * W S
P Group 2 W S
P Group 3 W S
Quarters * * * * W * * S
Month 1 Quarters * * * * * * W † S
Month 2 Quarters * * * * * * * W S
Month 3 Quarters * * * * W * S
Figure 8. Illustrative Summary of All Significant Results for Matched Datasets. * = significant results favoring
1WK groups or more frequent therapy. When considering deterioration (DET), an asterisk indicates significantly
less deterioration in the 1WK group. † = significant results favoring 2WK groups or less frequent therapy. ANC =
ANCOVA, CS = clinically significant change, RC = reliable change, DET = reliable deterioration, MLM = multi-
level modeling, SUR = survival analysis, W = weeks used as the time variable, S = sessions used as the time
variable. Each cell indicates an analysis that was run.
controlling for important covariates, showed slightly more change for the 1WK group. When
using datasets matched on initial severity, where the mean number of sessions attended was
nearly identical, proportions of CS and RC were significantly higher for those scheduled once a
week. For example, looking across the entire course of therapy, 51% of clients who had weekly
psychotherapy were either recovered or improved while those receiving therapy every other
week had 37.3% meeting these criteria. When proportions of clients who deteriorated in therapy
were compared, the 2WK group tended to have significantly higher levels of deterioration (e.g.,

52
7.5 % versus 2.1 %). These findings suggest that those scheduled once a week tend to recover at
higher rates, and deteriorate less, than those scheduled once every two weeks.
Concerning the speed of change over the course of therapy, findings again favored the
1WK group over time. When examining sessions, however, the 1WK and 2WK groups appeared
equivalent, suggesting that the effect of a session may remain the same for both scheduling
practices. These findings were consistent with survival analyses that examined the time to CS
and RC, where clinically significant change was predicted to occur faster for those scheduled
more frequently, but there was generally no significant difference between the session by session
“dose.”
It is important to note that the exploratory nature of this study included several group
selection methods and several critical time periods where patterns emerged. It appears that P
Groups 2 and P Groups 3 generally had results that were consistent with each other, but
divergent from all other selection methods. These samples selected students based on at least
75% or 65% of their sessions being scheduled approximately 1WK or 2WKs (P Groups 2 and P
Groups 3, respectively). It is possible that these selection methods were too broad to detect clear
differences between groups. Differences also emerged when considering time periods. In
general, results were strongest in Month 3 and over the entire course of therapy, intermediate in
Month 2, and weakest in Month 1. This is consistent with what might be expected, where the
first month of therapy may be less representative of an entire course of therapy than broader time
periods.
When considering the effect of session frequency as a continuous, time varying
parameter for all subjects, the inclusion of session frequency in the model significantly improved
model fit. The model based on days indicated a slight advantage for those scheduled less

53
frequently, particularly towards the beginning of therapy. This may be consistent with earlier
research that indicated increased session frequency at the beginning of therapy was associated
with poorer outcomes (Kraft, Puschner, & Kordy, 2006). The model based on sessions,
however, showed a strong effect that increased as the number of sessions increased, and
indicated that those who were scheduled more frequently tended to recover more quickly. The
regularity of sessions, the number of weeks from one session to the next, and the
attended/scheduled ratio were also found to be significant predictors, but did not substantially
improve model fit.
Although effect sizes were small for session frequency, small effects can significantly
impact large populations over extended periods of time. This is true when considering
widespread practices of psychotherapy delivery. It appears that the consideration for session
frequency may be whether a clinic is able to see more patients less frequently (and thus possibly
reduce wait-list length and suffering of untreated individuals) or see fewer patients more
frequently (and thus shorten suffering for those being seen, but leave waitlisted patients
untreated). A cost-benefit analysis of the results of each of these approaches is needed to
adequately answer the question of the financial effects of these practices; there are significant
individual and societal costs, however, associated with prolonging negative mental health states.
Poor mental health has been associated with decreased household income (Kessler et al., 2008;
Sareen, Afifi, McMilan,& Asmundson, 2011), decreased productivity and increased health care
costs (Goetzel, Ozminkowski, Sederer, & Mark, 2002; Trotter, et al., 2010) and increased
mortality (Eaton, et al., 2008). The Global Disability Index, a measure of overall burden of
illness that can be applied across diagnoses, ranked moderate depression as equivalent with
multiple sclerosis or deafness, and severe depression as identical to blindness (Eaton, et al.,

54
2008). If attenuating session frequency decreases amount and speed of recovery, it also
accentuates the burden of illness, including the personal suffering of those seeking
psychotherapy.
There were several limitations to the current study, including a lack of diagnostic
information for patients, which did not allow an investigation of differences in scheduling
patterns for differing problems. It is possible that certain diagnostic categories are associated
with success at different frequencies. The nature of archival data also created difficulties in
isolating the effects of session frequency. Although efforts were made to adequately control
these difficulties through data sampling techniques and statistical controls, an experimental
design would be able to more accurately isolate these effects. Generalizability to populations
outside of university counseling centers may also be of concern, as the majority of students
seeking therapy were young and White. Further research is needed with other populations and in
other settings to confirm these effects.
Despite these limitations, this study replicated the effects found by previous session
frequency studies, as well as contributed several important factors. First, this study used
measurements at each session in order to predict outcome trajectories. Second, session
frequency was defined as a time varying variable (i.e., cumulative average frequency) rather than
a fixed variable (i.e., final average frequency), more accurately representing session frequency
at each point of measurement. Third, this study moved beyond statistical significance and
offered a thorough examination of the clinical significance of session frequency. Fourth, the
study was designed to be clinically accessible by comparing simple scheduling practices of once
a week versus once every two weeks, allowing for a useful heuristic regarding real-world
scheduling practices.

55
Evidence from past literature and the current study indicate that session frequency
appears to affect both the amount of recovery and the speed of recovery in psychological
treatment. It remains unclear, organizationally and communally, if slow recovery for many is
better than faster recovery for fewer. Better outcomes for an individual client, however, appear
to be associated with higher session frequency.

56
References
Abramowitz, J. S., Foa, E. B., & Franklin, M. E. (2003). Exposure and ritual prevention for
obsessive-compulsive disorder: Effects of intensive versus twice-weekly sessions.
Journal of Consulting and Clinical Psychology, 71(2), 394-398. doi:10.1037/0022-
006X.71.2.394
APA Presidential Task Force on Evidence-Based Practice. (2006). Evidence-based practice in
psychology. American Psychologist, 61, 271-285.
Austad, C. S., & Berman, W. H. (1991). Managed health care and the evolution of
psychotherapy. In W. H. Berman (Ed.), Psychotherapy in managed health care: The
optimal use of time & resources (pp. 3-18). Washington, DC US: American
Psychological Association. doi:10.1037/10098-001
Baldwin, S. A., Berkeljon, A., Atkins, D. C., Olsen, J. A., & Nielsen, S. L. (2009). Rates of
change in naturalistic psychotherapy: Contrasting dose–effect and good-enough level
models of change. Journal of Consulting and Clinical Psychology, 77(2), 203-211.
doi:10.1037/a0015235
Barkham, M., Connell, J., Stiles, W. B., Miles, J. N. V., Margison, F., Evans, C., & Mellor-
Clark, J. (2006). Dose-effect relations and responsive regulation of treatment duration:
The good enough level. Journal of Consulting and Clinical Psychology, 74(1), 160-167.
doi:10.1037/0022-006X.74.1.160
Bohni, M. K., Spindler, H., Arendt, M., Hougaard, E., & Rosenberg, N. K. (2009). A randomized
study of massed three-week cognitive behavioural therapy schedule for panic disorder.
Acta Psychiatrica Scandinavica, 120(3), 187-195. doi:10.1111/j.1600-0447.2009.01358.x

57
Callahan, J. L., & Hynan, M. T. (2005). Models of psychotherapy outcome: Are they applicable
in training clinics? Psychological Services, 2(1), 65-69. doi:10.1037/1541-1559.2.1.65
Carrere, R. (2010). Psychoanalysis conducted at reduced frequencies. Psychoanalytic
Psychology, 27(2), 153-163. doi:10.1037/a0019415
Cartwright, D. S. (1955). Success in psychotherapy as a function of certain actuarial variables.
Journal of Consulting Psychology, 19(5), 357-363. doi:10.1037/h0045998
Chambless, D. L. (1990). Spacing of exposure sessions in treatment of agoraphobia and simple
phobia. Behavior Therapy, 21(2), 217-229. doi:10.1016/S0005-7894(05)80278-3
Cohen, J. (1988). Statistical power analysis for the behavioral sciences. Routledge Academic.
Eaton, W. W., Martins, S. S., Nestadt, G., Bienvenu, O. J., Clarke, D., & Alexandre, P. (2008).
The burden of mental disorders. Epidemiologic Reviews, 30(1), 1-14.
Emmelkamp, P. M., Van Linden Van, d. H., Rüphan, M., & Sanderman, R. (1989). Home-based
treatment of obsessive-compulsive patients: Intersession interval and therapist
involvement. Behaviour Research and Therapy, 27(1), 89-93. doi:10.1016/0005-
7967(89)90124-1
Foa, E. B., Jameson, J. S., Turner, R. M., & Payne, L. L. (1980). Massed vs. spaced exposure
sessions in the treatment of agoraphobia. Behaviour Research and Therapy, 18(4), 333-
338. doi:10.1016/0005-7967(80)90092-3
Freedman, N., Hoffenberg, J. D., Vorus, N., & Frosch, A. (1999). The effectiveness of
psychoanalytic psychotherapy: The role of treatment duration, frequency of sessions, and
the therapeutic relationship. Journal of the American Psychoanalytic Association, 47(3),
741-772. doi:10.1177/00030651990470031001
Gallagher, R. P. (2010). National survey of counseling center directors.

58
Gedo, P. M., & Cohler, B. J. (1992). Session frequency, regressive intensity, and the
psychoanalytic process. Psychoanalytic Psychology, 9(2), 245-249.
doi:10.1037/h0079357
Goetzel, R. Z., Ozminkowski, R. J., Sederer, L. I., & Mark, T. L. (2002). The business case for
quality mental health services: why employers should care about the mental health and
well-being of their employees. Journal of Occupational and Environmental
Medicine, 44(4), 320.
Hansen, N. B., & Lambert, M. J. (2003). An evaluation of the dose-response relationship in
naturalistic treatment settings using survival analysis. Mental Health Services Research,
5(1), 1-12. doi:10.1023/A:1021751307358
Hansen, N. B., Lambert, M. J., & Forman, E. M. (2003). The psychotherapy dose effect in
naturalistic settings revisited: Response to Gray. Clinical Psychology: Science and
Practice, 10(4), 507-508. doi:10.1093/clipsy/bpg051
Howard, K. I., Kopta, S. M., Krause, M. S., & Orlinsky, D. E. (1986). The dose–effect
relationship in psychotherapy. American Psychologist, 41(2), 159-164. doi:10.1037/0003-
066X.41.2.159
Johnson, R. W. (1965). Number of interviews, diagnosis and success of counseling. Journal of
Counseling Psychology, 12(3), 248-251. doi:10.1037/h0022592
Kadera, S. W., Lambert, M. J., & Andrews, A. A. (1996). How much therapy is really enough?
A session-by-session analysis of the psychotherapy dose-effect relationship. Journal of
Psychotherapy Practice & Research, 5(2), 132-151.

59
Kraft, S., Puschner, B., & Kordy, H. (2006). Treatment intensity and regularity in early
outpatient psychotherapy and its relation to outcome. Clinical Psychology &
Psychotherapy, 13(6), 397-404. doi:10.1002/cpp.505
Lambert, M. J., Gregersen, A. T., & Burlingame, G. M. (2004). The outcome questionnaire-45.
In M. E. Maruish (Ed.), The use of psychological testing for treatment planning and
outcomes assessment: Volume 3: Instruments for adults (3rd ed., pp. 191-234). Mahwah,
NJ US: Lawrence Erlbaum Associates Publishers.
Lord, F. M. (1967). A paradox in the interpretation of group comparisons. Psychological
Bulletin, 68(5), 304-305.
Orlinsky, D. E. (2009). The “generic model of psychotherapy” after 25 years: Evolution of a
research-based metatheory. Journal of Psychotherapy Integration, 19(4), 319-339.
doi:10.1037/a0017973
Reardon, M. L., Cukrowicz, K. C., Reeves, M. D., & Joiner, T. E., Jr. (2002). Duration and
regularity of therapy attendance as predictors of treatment outcome in an adult outpatient
population. Psychotherapy Research, 12(3), 273-285. doi:10.1093/ptr/12.3.273
Reese, R. J., Toland, M. D., & Hopkins, N. B. (2011). Replicating and extending the good-
enough level model of change: Considering session frequency. Psychotherapy Research,
21(5), 608-619.
Richards, A. K. (1997). The relevance of frequency of sessions to the creation of an analytic
experience. Journal of the American Psychoanalytic Association, 45(4), 1241-1251.
doi:10.1177/00030651970450041201

60
Rowe, M. K., & Craske, M. G. (1998). Effects of an expanding-spaced vs massed exposure
schedule on fear reduction and return of fear. Behaviour Research and Therapy, 36(7-8),
701-717. doi:10.1016/S0005-7967(97)10016-X
Sandell, R., Blomberg, J., & Lazar, A. (2002). Time matters: On temporal interactions in long-
term follow-up of long-term psychotherapies. Psychotherapy Research, 12(1), 39-58.
doi:10.1093/ptr/12.1.39
Sandell, R., Blomberg, J., Lazar, A., Carlsson, J., Broberg, J., & Schubert, J. (2000). Varieties of
long-term outcome among patients in psychoanalysis and long-term psychotherapy: A
review of findings in the Stockholm outcome of psychoanalysis and psychotherapy
project (STOPP). The International Journal of Psychoanalysis, 81(5), 921-942.
doi:10.1516/0020757001600291
Schwartz, C. (2003). A brief discussion on frequency of sessions and its impact upon
psychoanalytic treatment. Psychoanalytic Review, 90(2), 179-191.
doi:10.1521/prev.90.2.179.23550
Seeman, J. (1954). Counselor judgments of therapeutic process and outcome. In R. F. Dymond
(Ed.), Psychotherapy and personality change (pp. 99-108). Chicago, IL US: University of
Chicago Press.
Standal, S. W., & Van, D. V. (1957). Length of therapy in relation to counselor estimates of
personal integration and other case variables. Journal of Consulting Psychology, 21(1), 1-
9. doi:10.1037/h0043038
Stiles, W. B., Barkham, M., Connell, J., & Mellor-Clark, J. (2008). Responsive regulation of
treatment duration in routine practice in united kingdom primary care settings:

61
Replication in a larger sample. Journal of Consulting and Clinical Psychology, 76(2),
298-305. doi:10.1037/0022-006X.76.2.298
Storch, E. A., Geffken, G. R., Merlo, L. J., Mann, G., Duke, D., Munson, M., . . . Goodman, W.
K. (2007). Family-based cognitive-behavioral therapy for pediatric obsessive-compulsive
disorder: Comparison of intensive and weekly approaches. Journal of the American
Academy of Child & Adolescent Psychiatry, 46(4), 469-478.
doi:10.1097/chi.0b013e31803062e7
Storch, E. A., Merlo, L. J., Lehmkuhl, H., Geffken, G. R., Jacob, M., Ricketts, E., . . . Goodman,
W. K. (2008). Cognitive-behavioral therapy for obsessive--compulsive disorder: A non-
randomized comparison of intensive and weekly approaches. Journal of Anxiety
Disorders, 22(7), 1146-1158. doi:10.1016/j.janxdis.2007.12.001
Strassberg, D. S., Anchor, K. N., Cunningham, J., & Elkins, D. (1977). Successful outcome and
number of sessions: When do counselors think enough is enough? Journal of Counseling
Psychology, 24(6), 477-480. doi:10.1037/0022-0167.24.6.477
Tsao, J. C. I., & Craske, M. G. (2000). Timing of treatment and return of fear: Effects of massed,
uniform-, and expanding-spaced exposure schedules. Behavior Therapy, 31(3), 479-497.
doi:10.1016/S0005-7894(00)80026-X
Weitz, L. J., Abramowitz, S. I., Steger, J. A., Calabria, F. M., Conable, M., & Yarus, G. (1975).
Number of sessions and client-judged outcome: The more the better? Psychotherapy:
Theory, Research & Practice, 12(4), 337-340. doi:10.1037/h0086456